1. Introduction
Due to the rapid growth of the global population urban density, there has been a great challenge in many cities to define smarter ways to manage the increasing number of issues generated as a consequence of the growth [
1,
2]. Additionally, the COVID-19 pandemic, since its emergence in late 2019, has given momentum to smart city paradigms exploiting the potential utility of smart city solutions for dealing with the crisis [
3,
4]. Over the last decade, smart city has emphasized ICT infrastructure with a focus given to the use of digital technologies such as the Internet of Things (IoT), artificial intelligence (AI), deep learning, and cloud computing. It mainly deals with the issues resulting from a growing urban population and the need to make cities smarter through the effective management of infrastructure. Currently, the smart city paradigm has changed. The concept of smart cities has been viewed alongside ideas of holistic and sustainable development [
1,
2]. It has focused on collaborative communities in which citizens, businesses, knowledge institutions, and municipal agencies are working together to achieve systems integration and efficiency, citizen engagement, and sustainable improvements in quality of life [
3].
In this context, smart city platforms are evolving into several distributed systems engaged in dynamic environments such as the integration and interaction of huge volumes of data derived from various sources or some existing infrastructures owned by multiple different organizations [
5,
6]. Typically, smart city systems are carried out in a heterogeneous, distributed, isolated, and non-standardized way where data from pervasive sensors are individually processed with their own systems. In the real-world urban space, the integrated infrastructures with common services in several domains of a city such as public safety and security, transportation, healthcare, environment monitoring, energy, and so forth are useful [
1,
7]. For example, daily weather information combined with data from some accident monitoring sensors, deployed along the roads, can provide a glimpse of the real-time traffic state within the city and enable planning ahead, e.g., for public transportation policies and transportation improvements. Hence, smart city platforms need to address important concerns including the integration of data from heterogeneous sources, the interoperability with the dynamicity of multi-domain contexts, and the enhancement of event-based processing for analytics.
Recent work has proposed and considered a set of platforms aiming to support the development of smart city applications. It seems that most of them involved collecting, managing, analyzing, and correlating existing data to extract new information useful to the city, but they do not integrate a diversified set of services and react to events on the fly. Moreover, the application development facilities provided by them seem to be limited and might not help deal with the complexity of handling a range of urban data.
The contributions of this paper are threefold:
- 1.
A proposal of an event-based architecture with components that meet important requirements for smart city platforms, supporting increased demand for scalability, flexibility, and heterogeneity of event processing;
- 2.
Discussions on the implementation of such an architecture and data representation model, handling different data formats, and support for semantic-based data models;
- 3.
Discussions on the effectiveness of a Smart Event-based Middleware (SEMi) and presentation of empirical results regarding a performance evaluation of SEMi.
Our approach presents several advantages, as compared with the state-of-the-art. First, the approach focuses on providing services that remove the burden and complexities of extracting information from heterogeneous data sources. Second, our proposed architecture goes beyond the provision of a tool for smart city management by enabling the development of information services with data interoperability, scalability, real-time processing, spatial functionality, security, and semantic querying. Third, our event-driven processing approach seamlessly integrates complex event processing as well as spatiotemporal analytics into a smart city platform. Lastly, our event-driven processing approach provides a generic workflow for the detection of geographic events at different levels of abstraction.
The remainder of this paper is organized as follows.
Section 2 reviews related work.
Section 3 describes in detail the SEMi architecture of our proposed solution, while
Section 4 presents the design of the event city metadata model.
Section 5 provides details about the implementation of SEMi.
Section 6 presents the results of computational experiments aimed to evaluate the performance and the potential for scalability of SEMi. The concluding remarks are made in
Section 7.
2. Related Works
Even though smart cities have been presented in research and industry for over a decade, there is still no common agreement on the particular models that make cities smarter. Several different projects have addressed smart cities presented in the literature, mostly focusing on infrastructure, data collection, and aggregation, or on specific services [
8,
9]. The development of smart city solutions indeed demands a multidisciplinary perspective, and it often requires the integration of multiple technologies [
10,
11,
12].
Recently, there have been research surveys [
13,
14,
15] discussing software platforms and reference architectures that provide frameworks and tools for designing and implementing applications in smart cities. Santana et al. [
13] reviewed the state of the art regarding a reference architecture for smart city software platforms. They extracted the main requirements, components, and features derived from existing smart city platforms, and then identified the most common functional and non-functional requirements for facilitating the development of smart city applications. Moreover, other works [
14,
15] have mentioned the architectural characteristics of frameworks and identified the extended key requirements in a smart city to guide the design of reference architectures for smart cities such as heterogeneity, distributed sensing and processing, resource discovery, resource constraint, event management, and user involvement. A summary of how some existing proposals in the context of smart city platforms meet those functional and non-functional requirements are shown in
Table 1.
SGeoL [
16] is a middleware framework that provides high-level abstraction related to the development of smart city applications such as heterogeneity, scalability, data management, geolocation information, security, and privacy issues. The platform is composed of several core nodes that integrate other platforms and applications providing relevant services into the city. SGeoL enables correlating geographic information with data from different domains and organizing them into layers according to a semantic data model. ATCLL [
17] is a smart city platform for integrating heterogeneous sources of information including mobility data, environmental data, or even network data. It supports a real-time distributed processing system. The core data platform is able to manage the collected data for internal and third-party access, and process the data through real-time and predicted data. Nonetheless, SGeoL and ATCLL do not provide event-driven applications seamlessly integrating complex event processing, and spatiotemporal analytics.
5G-SCSP [
18] is a platform that gathers data from 5G-based CCTV media and makes it available through different open APIs, allowing the development of different services on top of the platform. Although 5G-SCSP provides the platform supporting situation awareness processing and sharing data over open API, the concept of data integration with semantic support for structuring data does not occur. Another work in [
19] refers to CityAction as the design and development of an integrated platform that combines city data from different sources, producing information for more efficient urban management, contributing to better citizens’ life quality, and a more sustainable environment. In addition, the platform provides data in an open format, to facilitate the creation of services by third parties. Even though CityAction provides monitoring, analysis, and correlation of events from multiple sources, it does not concern data integration or formalization of contextual entities and situation awareness for detecting events from streaming data.
SCDAP [
20] is a framework based on the characteristics of big data analytics frameworks applied in smart cities. This work studied three different aspects that include design principles, enabling technologies, and application domains so as to identify the characteristics of the big data frameworks in smart city platforms. The framework proposed three layers including the platform layer, security layer, and data processing layer. The main feature of this architecture is limited to the Apache Hadoop suite as an underlying data storage and management layer. The separation between SCDAP functionalities and the underlying data storage and management layer will add enhancement to the generality of SCDAP and its ability to deal with many other platforms. However, this work still has limited event discovery and analytical data models from multiple devices/platforms. RASCA [
21] is a generic architecture for smart city applications driven by event-based systems. This framework provides event processing capabilities for detecting geographic events in real-time processing and analysis. RASCA also achieved interoperability between the sensor and service layers by adopting open standards. However, it is noted that this work still has limited event discovery and data analysis on large-scale distributed smart city data streams.
Nowadays, event-driven architecture becomes the core of a data movement and management strategy for any smart city. Because smart city infrastructures are dynamic and rely on real-time data movement, smart city platforms need to be built on event-driven mechanisms to reach their potential. Several works have addressed the event detection problem in smart cities. Most of the approaches focused on the processing time to detect events with geospatial characteristics [
21,
22,
23,
24]. Alvarez et al. and Khazael et al. [
21,
23] utilize a middleware to collect sensor data and apply event processing schemes to analyze the data can achieve real-time processing capabilities and detect geographic events. Moreover, the studies in [
22,
24] have focused on enhancing CEP features such as event definition rules, pattern matching, and stream processing. Their aim is to identify spatial events near real-time by considering CEP engines in their approach.
3. SEMi Architecture
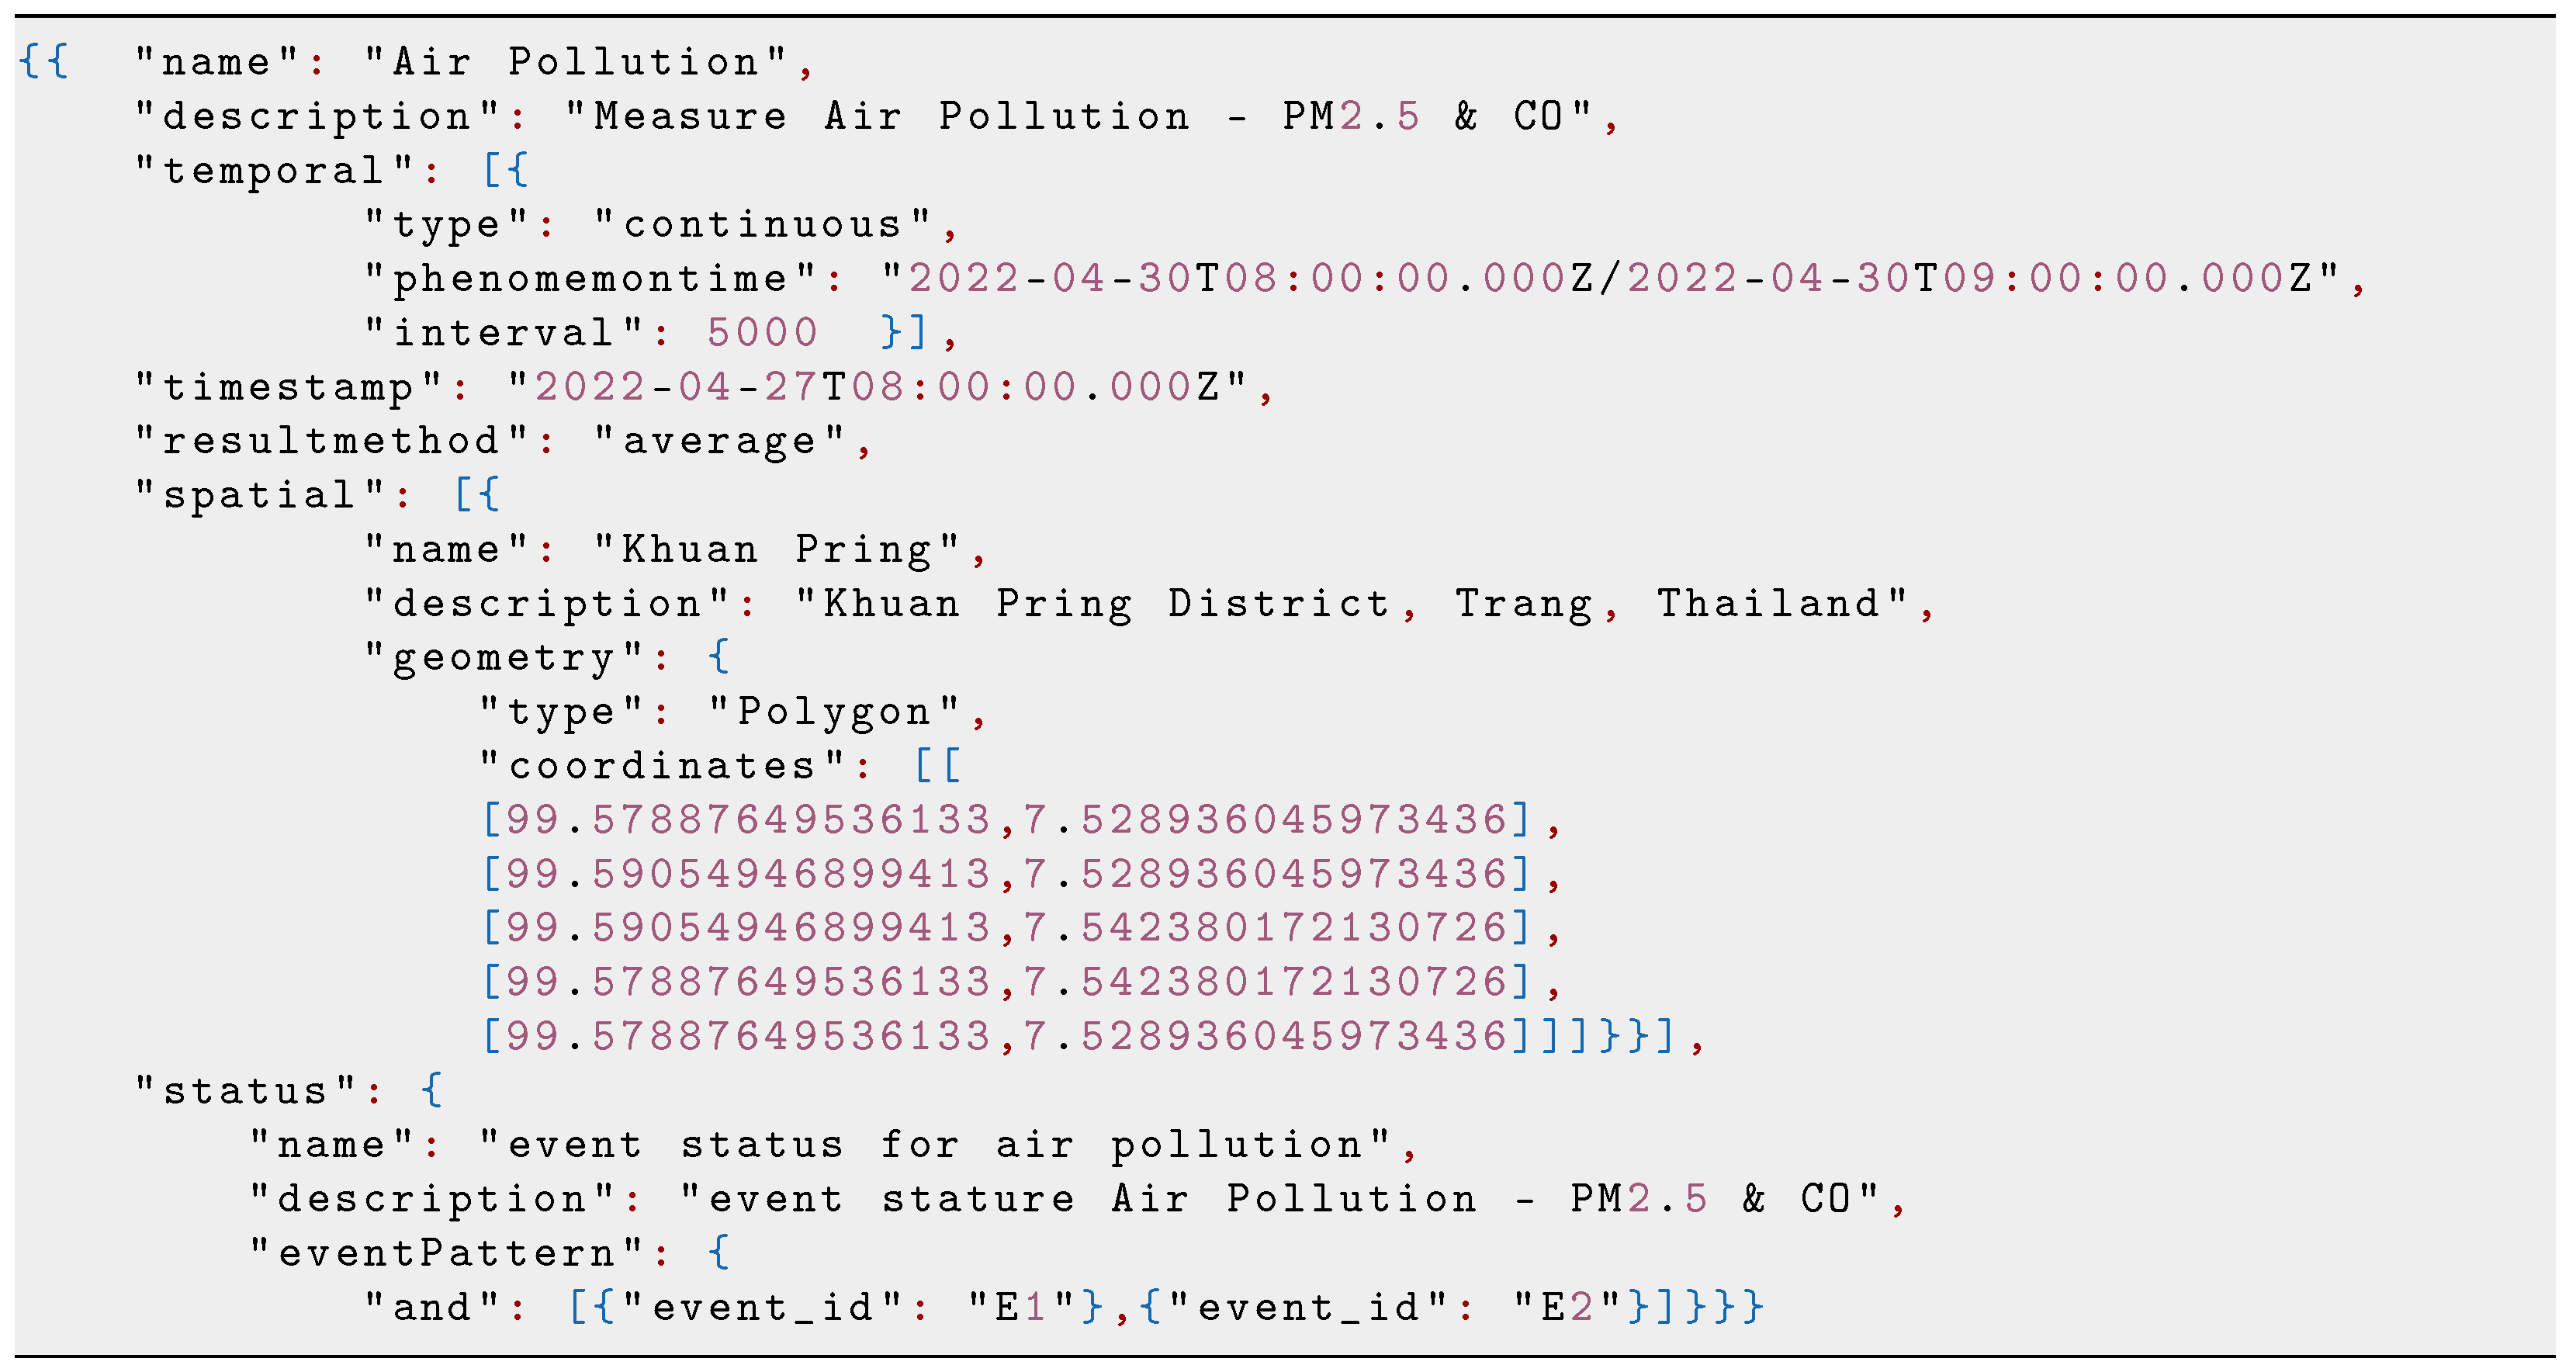
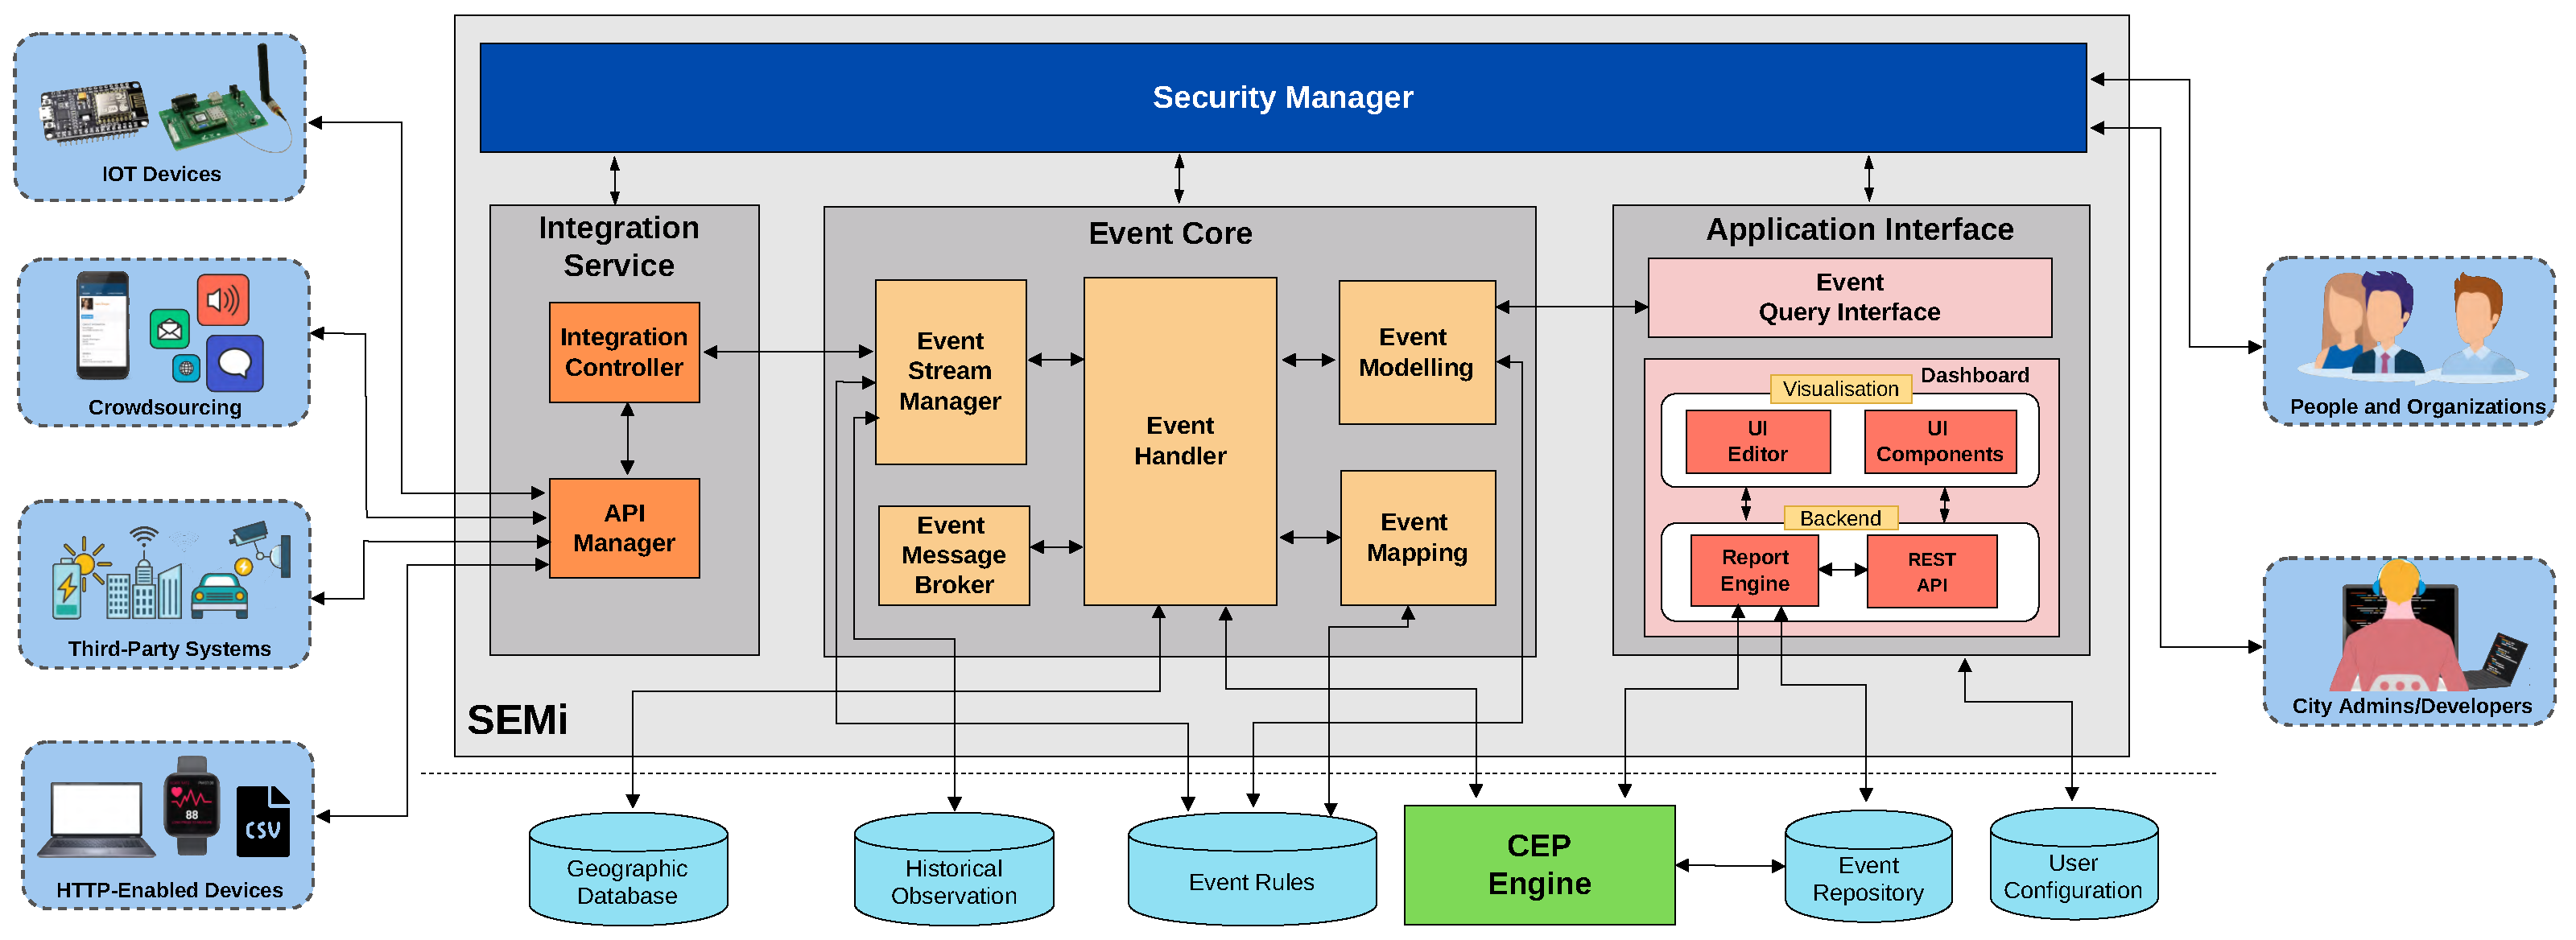
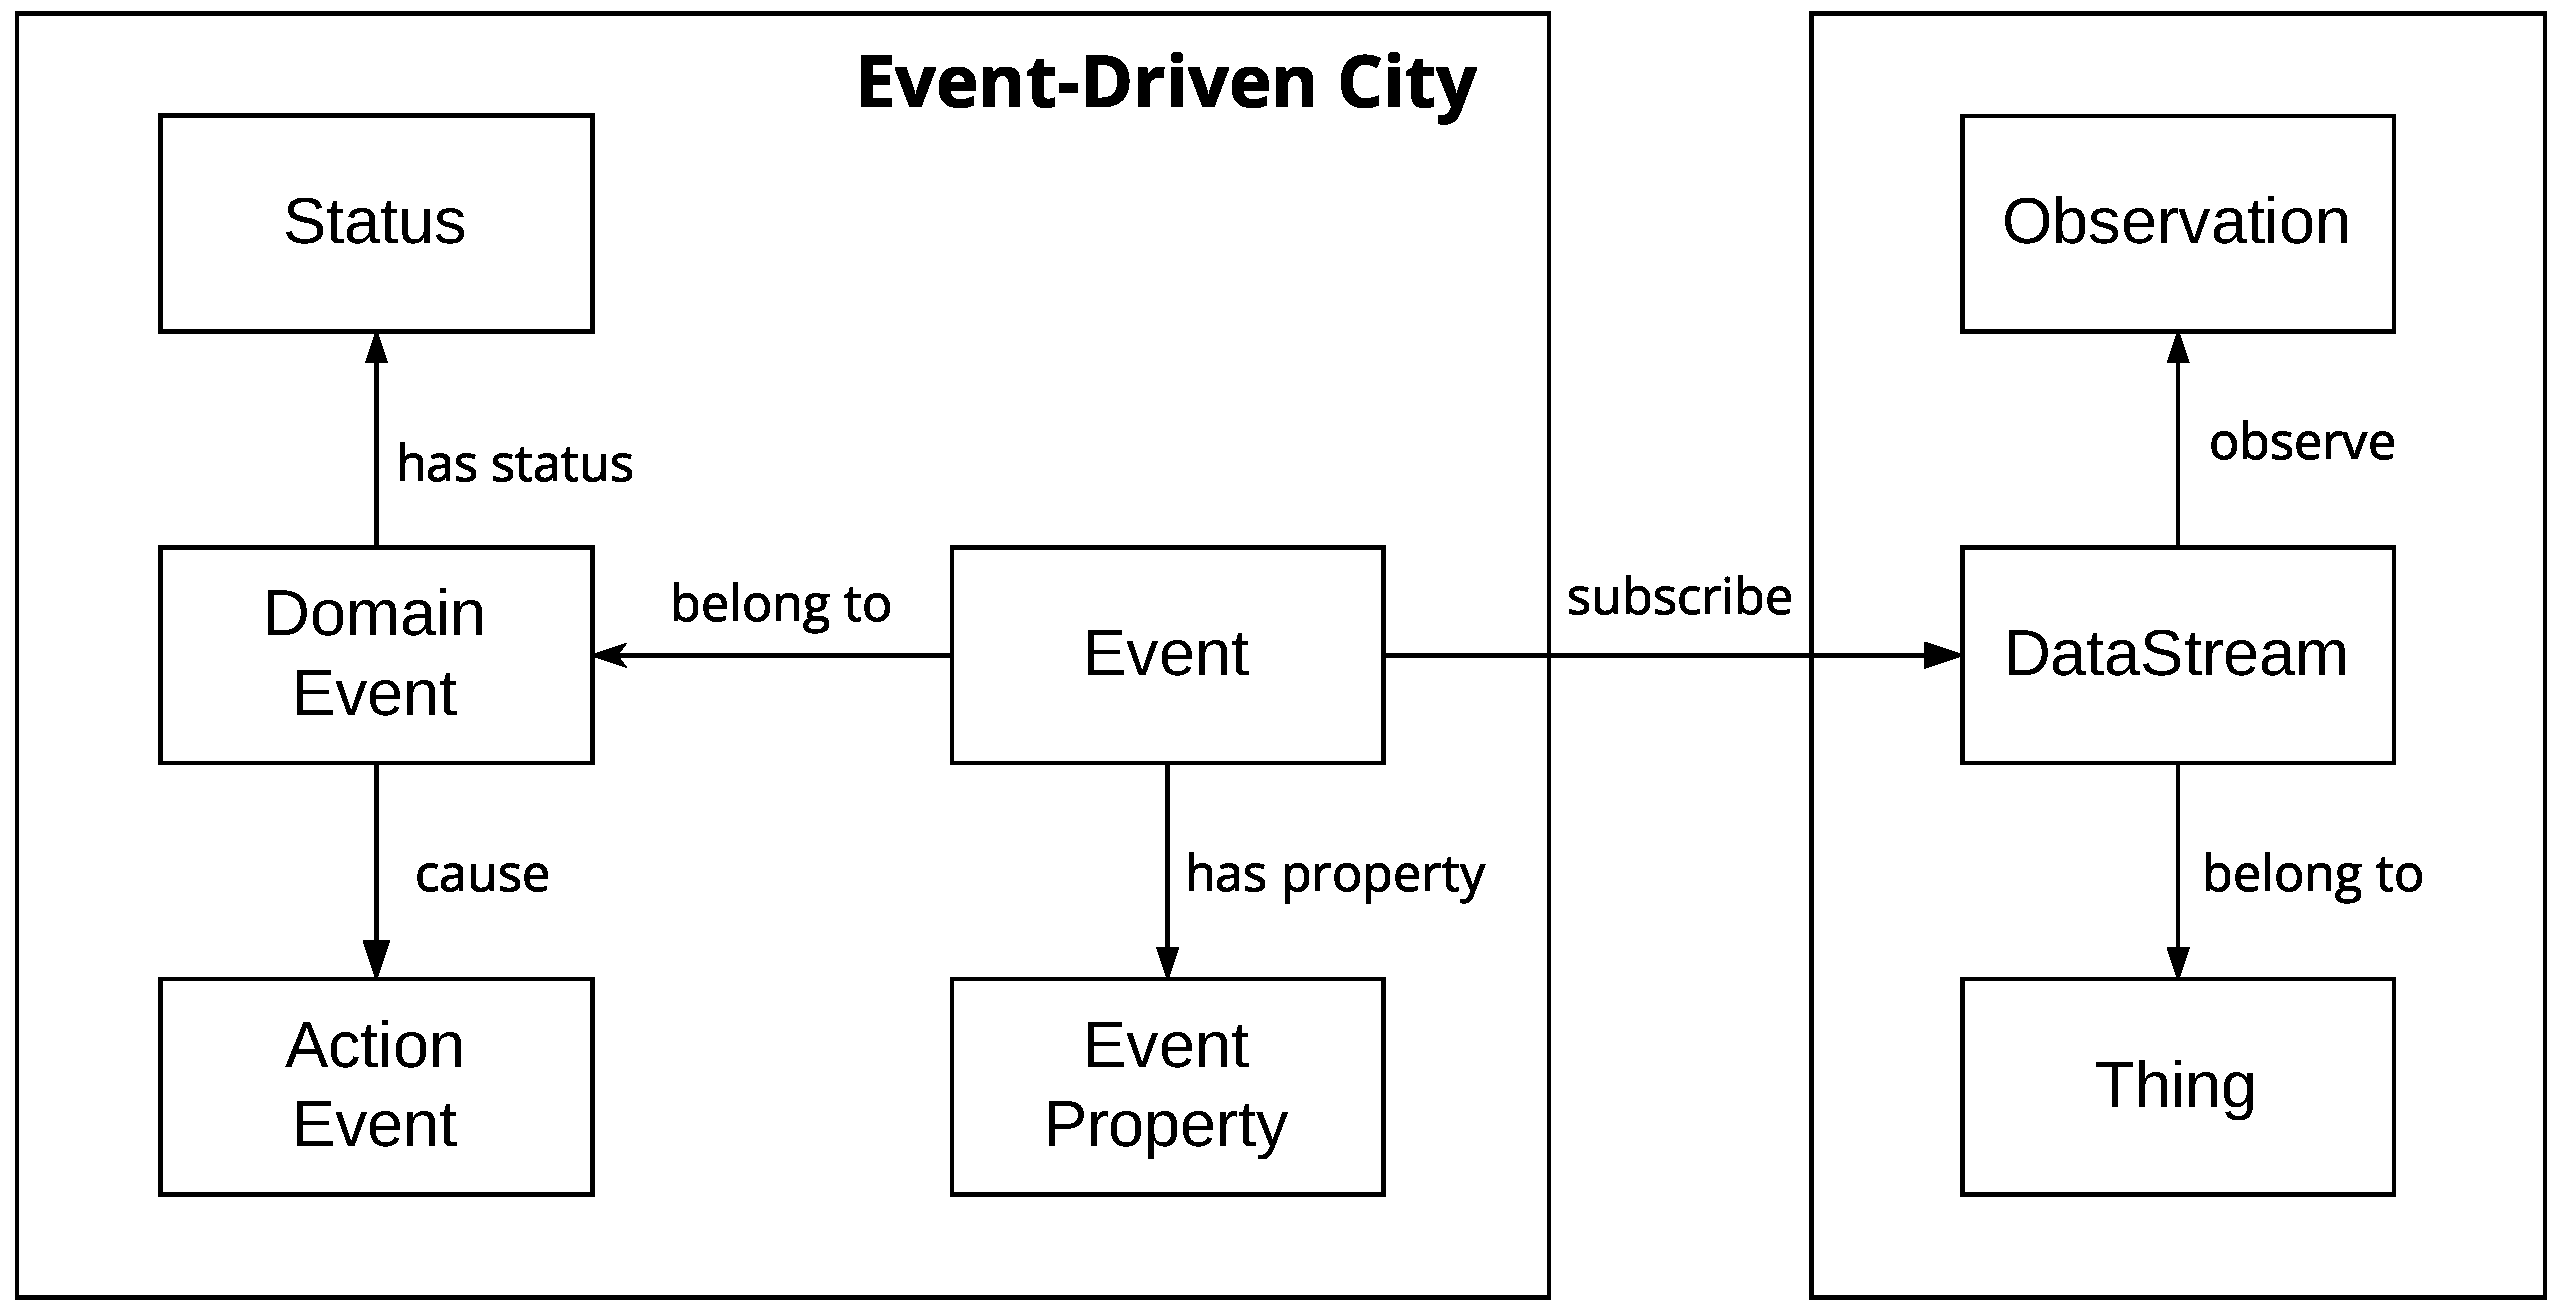
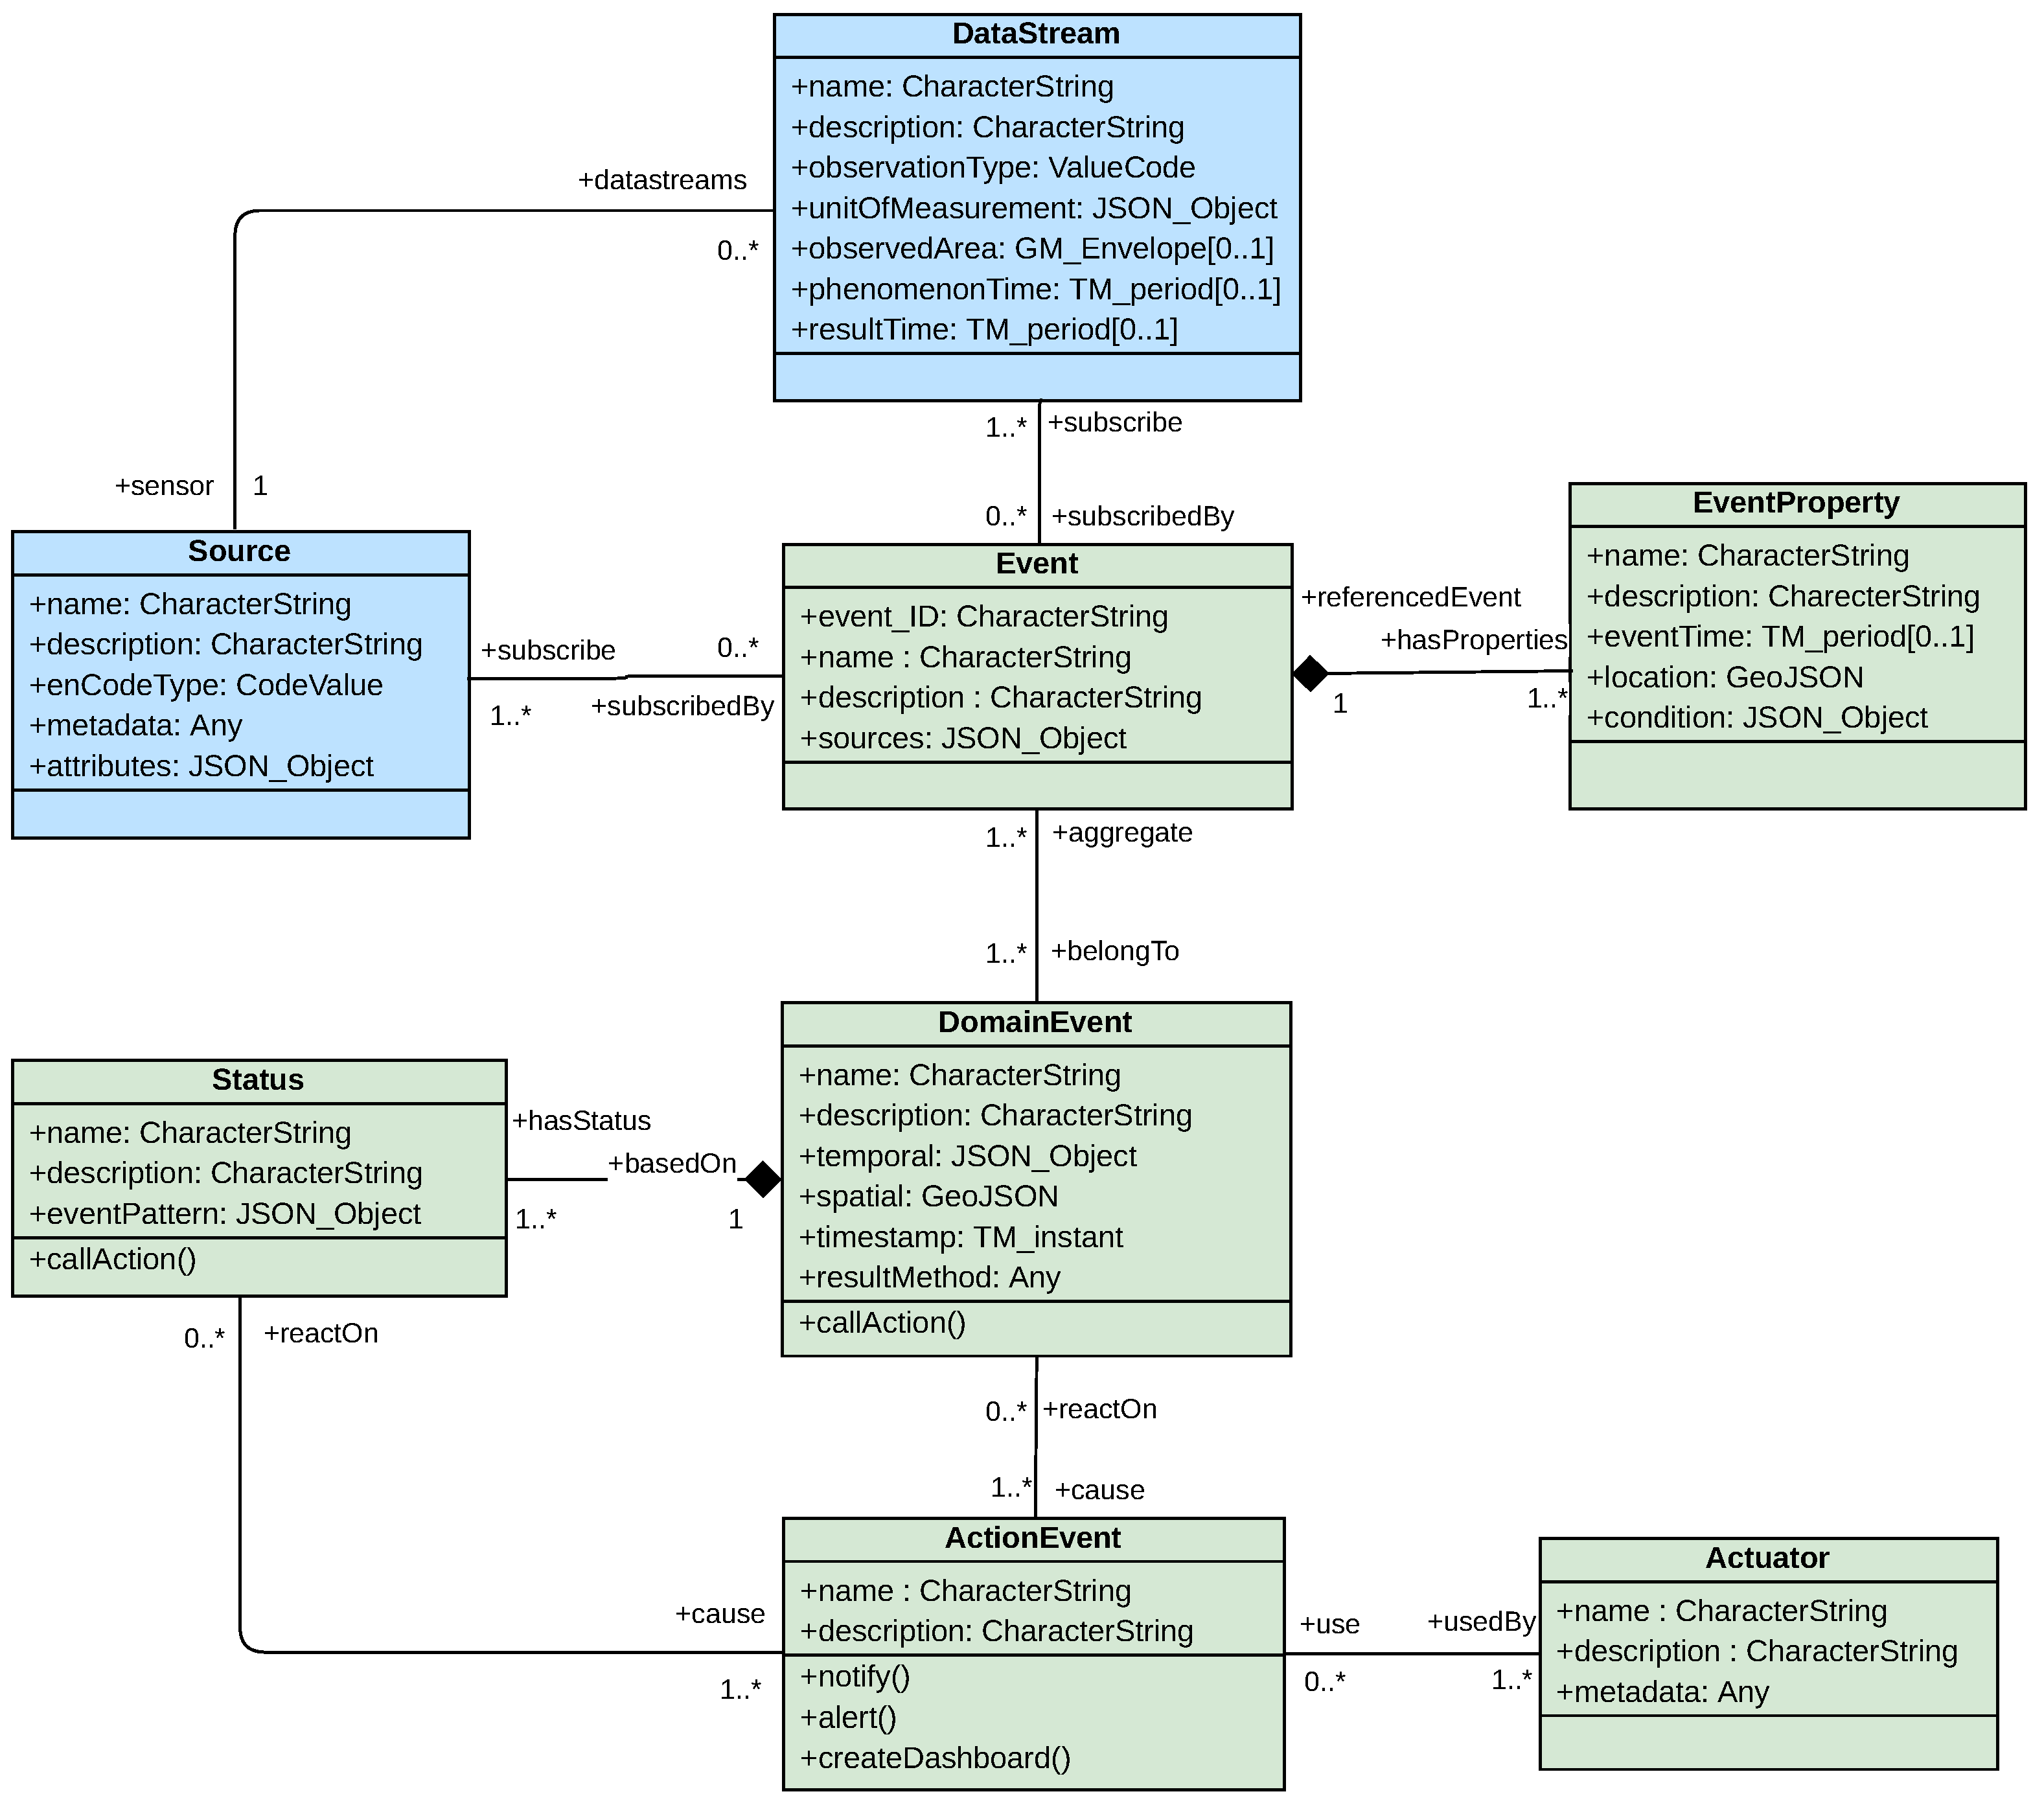
The proposed architectural model, based on middleware for event-driven applications, is called Smart Event-based Middleware (SEMi). To support the increasing demands of scalability, flexibility, and heterogeneity for event processing, the SEMi architecture is composed of several hierarchically interconnected modular components organized in a distributed way. Open protocols including SensorThings, HTTPs, stream API, and OAuth are adopted in its development, for the underlying middleware infrastructure. SEMi is an open, generic platform aimed to support the development of smart city applications for different domains through general-purpose components. For instance, the domain of environment can gather data about environmental parameters such as air/noise pollution and weather conditions from various areas to detect geographic events of environment monitoring, whereas the public safety domain can aggregate street surveillance of registered car accidents. Moreover, the architecture enables users to graphically compose comprehensive event-triggered rules, which can be used to identify situations from monitored devices. For the definition of a rule set, users can independently define event conditions, event patterns, and correlation-related information which can be combined for event modeling in complex situations.
Figure 1 depicts the SEMi architecture. It is composed of several distributed components that collaborate with each other to provide important functionalities to smart city applications. The architecture is basically organized in two layers, namely (i) the SEMi core layer which represents all the essential services of an event-driven scheme in smart city applications, and (ii) the SEMi infrastructure layer, which represents the underlying middleware services used by SEMi core. We provide the functional description of each layer in the following sections.
3.1. SEMi Core Layer
The SEMi core consists of four main components: (i) Integration Service component provides functionality to integrate data from multiple sources/systems with SEMi, with support for importing data provided by RESTful APIs, JSON, and CSV files; (ii) Event Core component provides the main functionalities of SEMi; (iii) Application Interface component is responsible for the SEMi dashboard, which enables users to query data/event and visualize dashboards; (iv) Security Manager component is responsible for protecting data managed by SEMi.
3.1.1. Integration Service
This component involves the integration of data derived from various sources spreading across the cities. It allows (i) importing data from multiple platforms, including IoT devices/sensors related to urban environments (e.g., weather, pollution, traffic, waterways, POI, and so on), other data capturing devices/citizens (e.g., smartphone, vehicles, social media, crowdsourcing, etc.), data from different sources such as Web service, open data portals in several formats (e.g., CSV, JSON, XML, RDF), and data provided by third-party platforms (e.g., governmental, non-profit, or academic sources, etc.); (ii) managing APIs from third-party providers and identifying access tokens of users/applications via the HTTP request connected to SEMi; and (iii) parsing and modeling according to the Event-driven City Data Model (ECDM) format making data available to the Event Core component. The Integration Service component can break into two sub-components: (1) API Manager operates as the API gateway connecting data from external sources through their APIs with the existing identity access or tokens, thereby making data available to other components and (2) Integration Controller is responsible for converting (and modeling various data sources) to the ECDM format available for the Event Core component and providing discovery and access to observations and metadata of devices/platforms registered with the services.
3.1.2. Event Core
The Event Core that is in charge of managing event processing provides the main functionalities of SEMi for connecting users to sources of data. There are several sub-components that include (1) Event Modeling parses an event declared by the user in the ECDM format and then generates an event definition and a detection rule. These event conditions are optionally stored in the event repository and the event rule storage for reuse; (2) Event Handler Event Handler controls the instantiation of resources to detect events and detection rules in the Complex Event Processing (CEP) engine. Event Handler is the core function of Event Core for managing and cooperating with other sub-components including repositories/databases; (3) Event Stream Manager connects to the Integration Service component to request observations that meet the attributive, spatial, and temporal properties required for event definitions. Additionally, it provides communication channels to push data streams to the CEP engine during runtime; (4) Event Message Broker acts as the mediating message exchange between the Integration Service and the CEP Engine, allowing the analysis of large volumes of streaming events; (5) Event Mapping is responsible for transforming the event definitions and incoming stream data to the event format defined in the CEP and used for data processing in the CEP Engine.
3.1.3. Application Interface
The SEMi Application Interface aims to provide end-users with a Web interface for event/graphical querying and visualizing context entities over the city’s urban space. It aggregates two sub-components, namely (i) the Event Query Interface and (ii) the Visualization Dashboard. The Event Query Interface enables users to create event declaration and event queries with a graphical interface. In the interface, the event specification including a set of attributes, devices/sensors, spatial, temporal characteristics, and event rules is declared by the users using a formal specification mechanism, i.e., a well-defined set of properties and values. Those events and domain specifics are transferred and subscribed through the Event Core component. The Visualization Dashboard is a reporting service enabling a push service to manage the results/notifications between the CEP and the report engine sub-component. In this service, a RESTful API provides a standard interface for responding to the notifications of specific events. The notification history includes functionality for archiving and retrieving historical notifications; this functionality is essential for this component as it requires access to historical records of events.
3.1.4. Security Manager
This component is responsible for protecting data and managing user access. The SEMi-implemented security features are based on the user’s roles, access policies, and the OAuth protocol. All requests are sent to the SEMi via the Application Interface component to ensure that only authenticated and authorized users can access them. The access tokens of users/applications are received over HTTP requests and are sent to the Security Manager component for validation. A set of suitable security policies allows SEMi to restrict the notifications only to the users that have subscribed with appropriate credentials. In this regard, the data can be securely protected and only authorized users can access them. Moreover, for the report service, the system also uses data encryption via HTTPS.
3.2. SEMi Infrastructure Layer
This layer represents the underlying middleware services used by the SEMi core layer. There are four key components: (i) the Data Sources involves various sources of data in multiple platforms spread across the city. The Data Sources may include IoT sensors related to urban environments and other data capturing devices/citizens including mobile apps, social media, third-party data, HTTP-enabled devices, etc.; (ii) the Data Manager is responsible for dealing with all requests and streams of data received via the Application Interface, Event Core, and Integration Service, besides providing access to databases and supporting the synchronization of stored data. The SEMi uses a set of databases to store data. Hence, this component functions to manage the persistence of data and event streams. For instance, all observation data is collected in the Historical Observation Database whereas, in the Geographic Database, the geographic information is separately stored and used to query with geographic data processing. The Event Rules Database stores the rules provided by users for detecting the incoming streams of data, besides the Event Repository performing data analysis in the CEP and the visualization dashboard; (iii) the Users, playing a vital role in SEMi, adopt two roles: (1) city administrators/developers who are behind the need for information focusing on monitoring/detecting the current status of a city, performing general/advanced event queries for people or organizations, advanced visualization settings with the SEMi visualization dashboard, configuration data access policies, executing and scheduling data import tasks, etc.; (2) people and organizations who are general-purpose users that are typically transient and respond to the needs and desires of individuals or the public sector; those are able to use SEMi with data edit, event querying and visualization capabilities; and (iv) the CEP Engine component is responsible for real-time event processing received by SEMi to identify the occurrence of complex events.
5. Implementation
In the proposed architectural model, the SEMi components were implemented by integrating several technologies. All these technologies are able to cooperate seamlessly and have been used in many successful cases. The SEMi core, implemented in the Python programming language, acts as a middleware service (an HTTP server) that is responsible for handling incoming service requests and formulating appropriate responses to the application interface. This core component is carried out by several Python modules which automate the processes of instantiating an event for each phenomenon in the system. For example, they can take event declarations from the event query interface as input and generate event definitions and detection rules in order to observe the incoming data streams, and then deploy the configuration of requirement parameters to the CEP engine.
In SEMi core, the Event Message Broker component is capable of controlling the streaming of observations between the Integration Service and the CEP engine through Apache Kafka (
https://kafka.apache.org/ accessed on 31 January 2023), a distributed and scalable message broker. Kafka is able to handle a huge number of data streams in real-time in a fault-tolerant way occurring in a publish-subscribe fashion. The CEP Engine component is, respectively, realized by the WSO2 Complex Event Processor (
https://wso2.com/products/complex-event-processor/ accessed on 31 January 2023) (WSO2 CEP). The WSO2 CEP, built with the Siddhi CEP Engine, contributes to real-time complex event detection for streaming processing. The WSO2 CEP server exploited SiddhiQL, a SQL-like language providing a familiar syntax for writing queries, for specifying detection rules. WSO2 CEP can be easily integrated into Apache Kafka towards enabling the analysis of large volumes of data. The SEMi core interacts with Apache Kafka through TCP/IP-enabled Python libraries. Similarly, Apache Kafka communicates with the WSO2 CEP components through Python modules.
In importing data into the Integration Service component, the implemented middleware allows importing data from various sources such as files, Web services, RESTful API, etc. Then, this component converts data formats and makes them available to smart city platforms. Currently, the Integration Service allows importing data provided by third-party RESTful APIs and CSV files to SEMi. For the Sensors API service, we used the FROST server implementing the SensorThings API standard. The SensorThing API offers built-in spatial and temporal filters and query functions to retrieve data from sensing devices using HTTP requests. In terms of databases of the SEMi infrastructure layer, NoSQL database, Geographic Database, and Event Rules were, respectively, concretized by MongoDB, PostgreSQL with the PostGIS extension, and File Systems to manage data and information whereas MariaDB had been used for Historical Observation, Event Repository, and User Configuration. All of these database management systems are consolidated and widely used in both industry and academia.
The SEMi application interface, shown in
Figure 5, was implemented in a Python module using the Flask web framework as server-side development whereas the SEMi visualization dashboard was implemented in the JavaScript and the Vue.js framework. JavaScript libraries are used to manage and edit geographic points on the map. The SEMi Dashboard provides a user interface that interacts with the SEMi core, thereby enabling users to perform event queries and view graphs and time series of event detection. Eventually, the SEMi implemented Security Manager features between the following components. Between the sensing sources and the Integration Service, we implemented basic access authentication over HTTP, using a user name and password; between the Event Core and the CEP Engine, we implemented SSH over TCP/IP using public keys; and between the CEP Engine and the Application Interface, we used data encryption using HTTPS.
6. Performance Evaluation
In this section, empirical experiments were carried out to assess the performance and the potential for scalability of our SEMi framework subject to a number of data streams and requests. The experiments simulated data streams and requests related to devices producing data through HTTP requests. All the experiments considered only the SEMi Core, the main component of the overall architecture as mentioned in
Section 3. The purpose of the simulation presented in this section is two-fold: (1) to evaluate the performance of the SEMi architecture including throughput, response time, and latency; and (2) to optimize the performance of the SEMi framework, especially in a large-scale data stream processing setting, making it more efficient and effective.
The performed experiments aimed to evaluate the potential for scalability of SEMi considering a smart city scenario with varying workloads. Two main computational experiments were carried out. Experiment 1 explored the detection and data throughput processed by SEMi on the underlying computational infrastructure. Experiment 2 assessed the performance improvement faced by SEMi upon multiple concurrent requests. The following sections describe the operation of these experiments and the obtained results. The scripts used to run the experiments are publicly available at GitLab (
https://gitlab.com/jurairatb/semi-experiments/accessed on 31 January 2023). For statistical significance, all the experiments run 10 times for each explored scenario.
Experiment 1: Data streams detection and throughputs.
Experiment 1 aimed to determine the successful detection of a simple event by monitoring the number of notifications displayed by the SEMi app. We accounted for the response of SEMi to a high data throughput by controlling the number of data streams processed through the system. To perform the experiment, we defined a simple event as an event query to monitor the temperatures above 35 degrees Celsius in the area around the center of Trang city, Thailand. We also used two different types of sources to generate streams of data including IoT sensors (SensorThings) with a given geographic area and HTTP-enabled devices (Plain Text) in JSON format.
Regarding IoT devices, 100,000 temperature sensors were simulated with real-world geographic information representing the urban space of Trang and randomly produced the same number of data streams through HTTP requests. Such data streams were registered and retrieved from the FROST Server which is the server implementation of OGC SensorThings API. FROST Server had been installed on the Azure Virtual Machine Scale Sets as sensing services providing built-in spatial and temporal filters and query functions to retrieve data. On the other hand, the data streams generated by HTTP-enabled devices were ready in a JSON file as a dataset of temperature data containing information about the spatial and temporal patterns of the occurrence of geographic events.
For this experiment, simulated data streams were created by a script that was executed in Apache JMeter, a tool widely used to perform load and stress tests, generating as many data streams as possible to the SEMi core. These streams were related by only one request. The computational environment was set up in Azure virtual machines cloud platform including a total of 4 VMs (Virtual Machines) and 2 VMSS (Virtual Machine Scale Sets) as follows: one VM to deploy the requests/events, one VMSS to deploy the SEMi core (default one VM instance); one VMSS to deploy the FORST server (default five VM instances); one VM to deploy the WSO2 CEP server; one VM to deploy MongoDB with data replication; and one VM to deploy PostGIS. The VMs and VMSS used in Experiment 1 had the following configurations: the VMSS for SEMi core, the VM for users’ requests and WSO2 CEP server using Windows Server 2019 as an operating system with 2 VCPUs, and 8 GB of RAM; the others using Linux Ubuntu Server 20.04 LTS as operating system, 2 VCPUs, and 8 GB of RAM.
To evaluate the performance of SEMi core handling incoming data streams from multiple sources, we had two observations in this experiment including the number of throughputs per second (ds/s) and the execution time of the SEMi core.
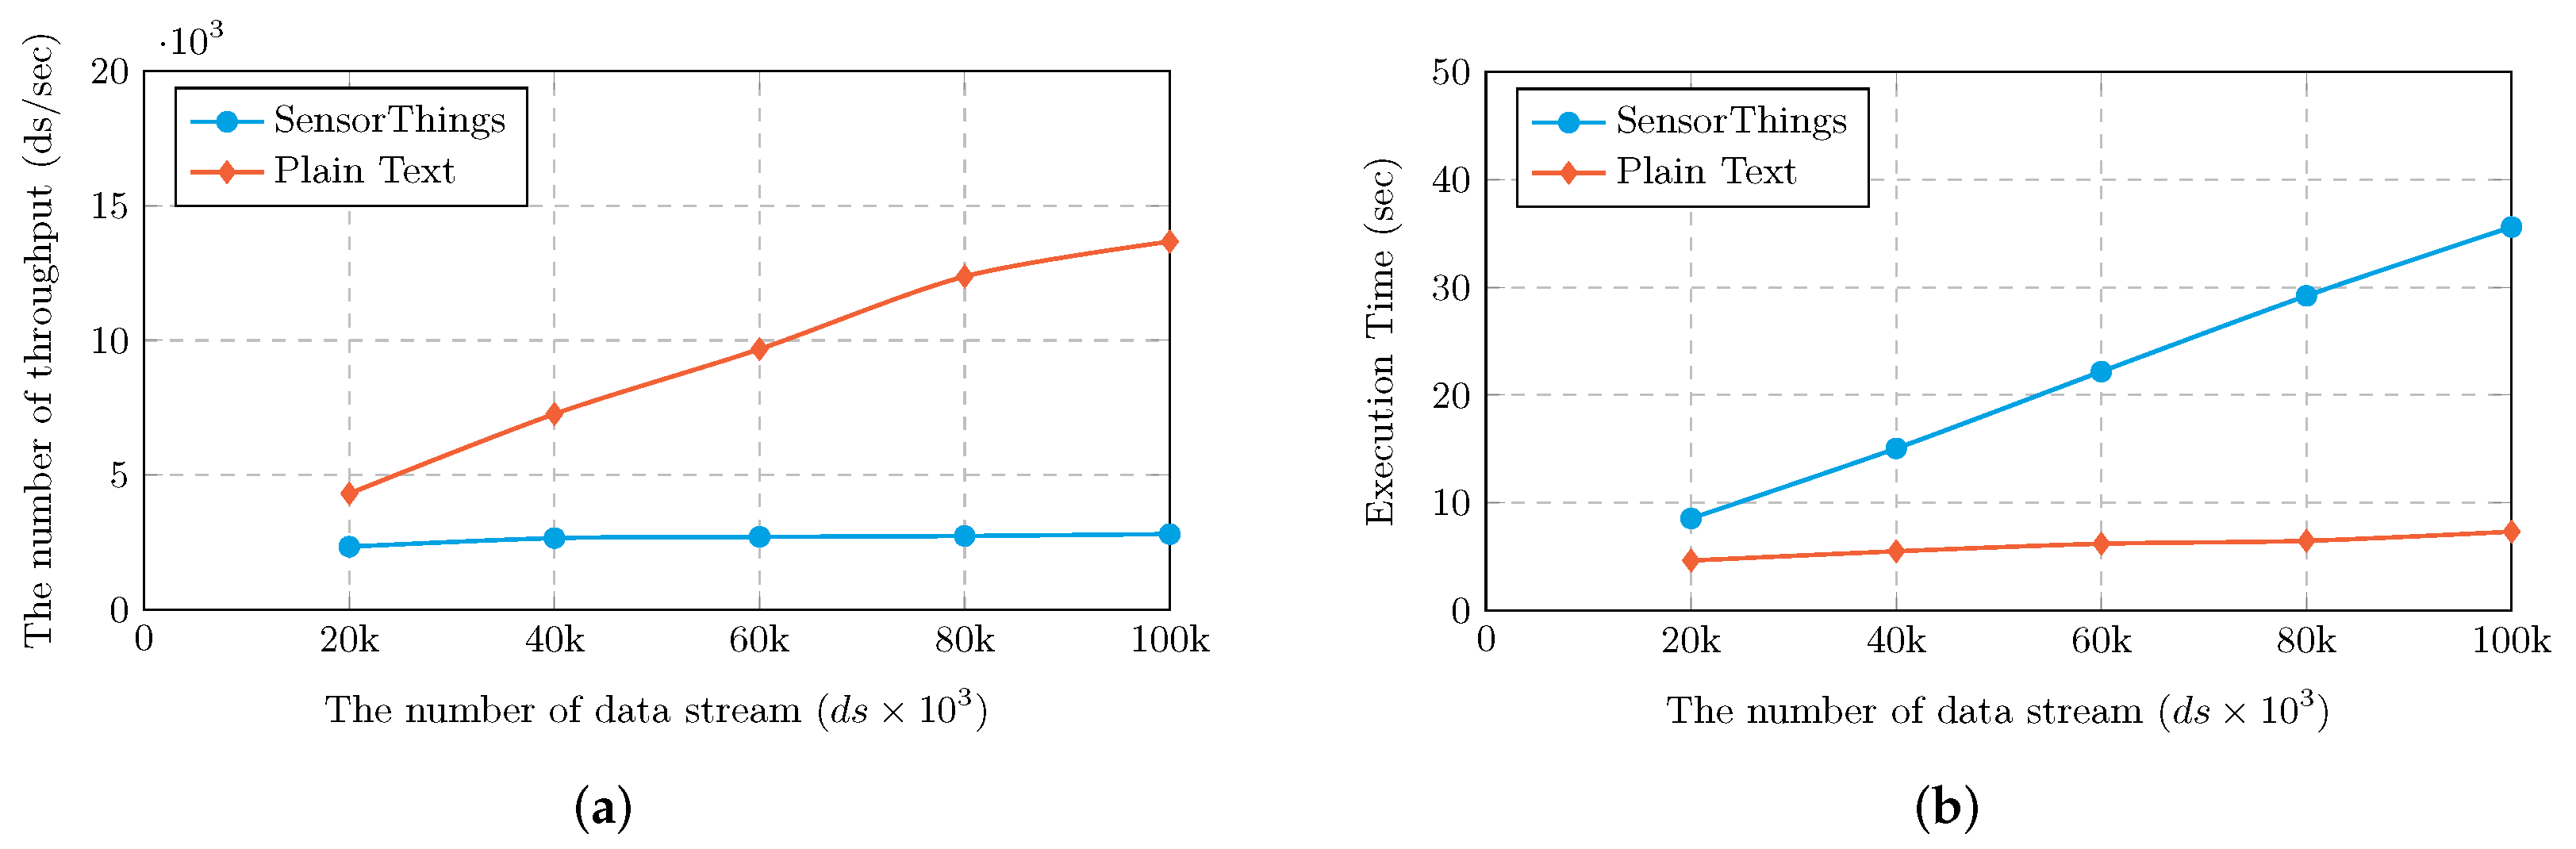
Figure 6 shows the comparison of the two different data sources including (1) data streams queried through the FROST Server called SensorThings, and (2) data streams queried through a dataset in JSON file format called Plain Text. Note that the size of a data stream in our experiment is 313 bytes per second.
Figure 6a presents the number of throughputs per second proceeded by the SEMi core comparing two sources with varying numbers of data streams ranging from 20,000 data streams up to 100,000 data streams. Based on this study, it is apparent that the more the number of data streams queried, the higher the throughput, i.e., data retrieved per second, as we expected. The throughput in Plain Text increased greatly; it increased from 4313 to 13,667 ds/s, while the throughput in SensorThings grew slightly, increasing from 2341 to 2809 ds/s. Indeed, the throughput via Plain Text was, in this sense, considerately higher than the throughput with SensorThings.
In our study, we also measured the time spent by the SEMi core operating incoming data streams from multiple sources. In
Figure 6b, we can see that two sources including SensorThings and Plain Text shared the same trend that the higher the number of data streams queried, the longer the time spent by the SEMi core processing. However, there was a slight increase in the Plain Text when the number of data streams rose from 20K ds to 100K ds. For example, finding the execution time via the source of Plain Text with ds sizes of 20K, 40K, 60K, 80K and 100K was 4.60, 5.50, 6.20, 6.47, and 7.32 s, respectively. Note that at the number of data streams between 20K and 100K ds in SensorThings, the time for proceeding data streams increased greatly between 8.55 and 35.60 s. This also indicates that the source from SensorThings takes a much longer time to execute streams of data compared to the other source.
Moreover, of note is that the increases are linear or sublinear, so our framework is (in this sense) scalable, with respect to the number of data streams.
Experiment 2: Multiple concurrent requests
Experiment 2 assessed the performance improvement faced by SEMi upon multiple concurrent requests. To conduct this experiment, we divided it into three sub-experiments; (2.1) to measure the maximum number of requests/users; (2.2) to measure the response time and the latency when limiting the number of requests; and (2.3) to assess the performance degradation considering the increasing number of concurrent requests processed by SEMi core. This experiment was implemented in the Azure virtual machines cloud platform with the computational environment set up similar to the environment in Experiment 1. However, the source from SensorThings is merely focused on this experiment because sensing devices are the key component of the smart city platform, and this source could make the environmental requests/queries as close as possible to real-world situations.
Experiment 2.1: Maximum number of requests
The maximum number of requests over multiple virtual machines (VMs) in a certain time window of one minute processed by SEMi core was explored in this experiment. To perform Experiment 2.1, a script was created to simulate the requests made by the FROST server (SensorThings) connected to the SEMi core. The script was executed in Apache JMeter generating as many concurrent requests as possible to the SEMi core. Each of the requests carried out only one simple event connecting to SensorThings randomly producing the same number of data streams (1000 ds per event query). In this experiment, the number of deployed instances of the SEMi core was added to the infrastructure, and all requests generated by the script were addressed to balance the workload with such deployed instances. By doing so, it was possible to observe the potential for scalability of SEMi core to handle an increasing number of requests when new computation resources were added to the platform infrastructure.
Table 2 shows the findings of Experiment 2.1 in terms of concurrent requests per minute handled by the number of instances (3 instances) of SEMi core. A single instance was able to handle an average of 462 requests, two instances were able to handle an average of 517 requests, and three instances were able to handle an average of 571 requests. These results indicate that the number of requests processed by the SEMi core has increased with the addition of new instances to the infrastructure of SEMi. In summary, it can be seen that SEMi can deploy new computation resources to support a higher workload which is a vital feature for smart city platforms.
To evaluate the performance improvement obtained by the SEMi core with the addition of new resources to its infrastructure, speedup measures were explored in this experiment. Speedup measures [
25] one of the performance characteristics of a distributed system, related to the relative performance executing a task performed on two similar architectures with different resources. Therefore, the following equation is used to calculate speedup, where
S is defined as the ratio of the number of requests handled by
j instances of SEMi core,
, and the number of requests previously handled by
i deployed instances,
.
In the first scenario, the ratio between two instances (j) and one instance (i), the speedup measurement was 1.12. Note that it obtained a performance improvement of 12% with the addition of a new VM to the underlying infrastructure. While the speedup of the second scenario at three instances (j) with two instances (i) was 1.10 (+11%), the observed speedup ratio was 1.24 (+24%) in comparison between three instances (j) and one instance (i).
Experiment 2.2: the response time and the latency
We explored the time for response and the latency in this experiment in order to assess the performance improvement resulting from adding new computational resources to the infrastructure of SEMi. For this purpose, we conducted the experiment by creating a script executed in Apache JMeter performing a fixed number of concurrent requests to the SEMi core. The number of requests was set at 600 requests, the maximum number of concurrent requests that VMSS is responsible for simulating (the results in Experiment 2.1) could support. Similarly, the number of deployed instances of the SEMi core was added to the infrastructure as in Experiment 2.1.
The response time for responding to the requests is shown in
Table 3. The average response time to requests was 34.797 s with a single instance of the SEMi core, being reduced to 30.852 s with the use of two instances and to 22.748 s with the use of three instances. In this experiment, speedup performance was also measured. The equation of speedup measurement shows in the following; where speedup
S is defined by the ratio of the average response time spent by
i instances of the SEMi core to process a fixed number of requests,
, and the average response time spent by the next
j deployed instances to process the same number of requests,
.
Comparing data obtained in the first scenario with the second scenario, an approximate speedup was achieved at 1.12. This means that the SEMi core obtained 11% of the performance gains with the addition of a new VMSS to the underlying infrastructure. In the third scenario, the observed speedup was approximately 1.36 (+26%) compared to the second scenario, and approximately 1.53 (+35%) compared to the first one.
In addition, we also measured the latency that occurred during sending requests to the SEMi core. The latency refers to the delay generated by transferring the data through a communication network [
26,
27]. The latency is shown in
Table 4. The average latency was 515.63 ms with a single instance of the SEMi core, being reduced to 70.60 ms with the use of two instances and to 30.41 ms with the use of three instances. As a result, the SEMi core obtained 86% of performance gains, comparing data obtained in the first scenario with the second scenario. In the third scenario, the performance improvement was approximately 57%, as compared to the second scenario, and approximately 94%, as compared to the first one. In terms of the scalability of our SEMi, the average latency through the components of SEMi was compared with that of the GEDSys [
21] middleware. The latency of our system is far lower than that of the original GEDsys by approximately almost 50 times. These findings suggest that the response time and the latency with the SEMi core tend to decrease more when new computational resources are added to the platform infrastructure, i.e., it is scalable, and it could support a higher workload and improve its performance, especially for smart city applications.
Experiment 2.3: The performance degradation
The purpose of this experiment is to assess the performance degradation confronted by the SEMi core with multiple concurrent requests. To perform the experiment, the number of instances deployed in the infrastructure of SEMi was fixed. A script generated the number of concurrent requests varied from 100 to 1000 requests executed in Apache JMeter. Moreover, three deployed instances were performed over the infrastructure to support the SEMi core in this experiment. The simple event randomly produced the same number of data streams, set up similarly to Experiment 2.1.
Table 5 presents the results derived from Experiment 2.3. These results show an evident linear increase in the average response time, varying from 5 s in the best case to 53 s in the worst case. Note that SEMi core is not significantly affected in its performance when it is executed on a fixed infrastructure in terms of the number of computational resources used. Therefore, the response time to requests linearly increases in a relatively predictable way according to the workload over the platform.
To summarize, Experiments 2.1 and 2.2 have shown that SEMi core can horizontally scale to improve its performance and handle an increasing number of users making requests, i.e., its distributed architecture enables new computational resources to be added to the platform when needed. Experiment 2.3 has shown that the degradation faced by SEMi linearly increases with the number of concurrent requests, an ordinary, expected behavior in distributed services. It is also worth highlighting that the average response time was less than 53 s in all scenarios explored by the experiments, even when the SEMi platform was subjected to a large number of concurrent requests.
7. Discussion and Conclusions
In this section, we compare the important differences from the proposed architecture represented in
Section 3 with other reference frameworks. In addition, drawing on the detailed results in the previous section, we summarize the main points of observation as follows. We also address some of the limitations of our proposed framework and the test scenarios. Finally, we conclude with future work.
Although SEMi offers some similar functionalities to the mentioned platforms in
Section 2, it comes up with certain important differences that include (i) enabling users to compose their own comprehensive event-triggered rules/queries, (ii) providing an open data model based on the OGC SensorThings data model to integrate data from heterogeneous sources, (iii) allowing interoperability with the dynamicity of multiple domains and enhancing the event-based processing for analytics, (iv) processing vast amounts of streamed data in real-time occurring in a publish-subscribe fashion, and (v) enhancing the decision-making process for users with the personal dashboard.
The empirical experiments from the previous section demonstrated that SEMi is capable of detecting events on the computational infrastructure. The experiments performed evaluate both the performance and the potential scalability of SEMi. The results have shown the throughput of concurrent data streams, average response time, latency, and the capability of horizontally scaling the platform to handle an increasing number of users. The factors that influenced the results presented in
Section 6 include the workload of the system components, the number of computational resources available, and network capacity. The effect of the workload on the performance was evident during the Event Core process because there are many sub-processes involved in this component such as event declaration, validation, configuration parameters and controlling the streaming of observations to the CEP engine during runtime. As a result, the response times for these functions increased with the number of events instantiated in the system. The number of resources available and network capacity influenced the results shown in Experiment 2.2 and it was responsible for the slight decrement in response time when increasing the number of instances. Moreover, SEMi showed more significant latencies; the fewer computational resources used for the platform infrastructure, the more delay generated by transferring the data through a communication network when handling multiple events.
When compared with similar event processing systems [
21,
22] SEMi introduces ECDM that enables event-driven smart city applications to define the relationships of events in a specific domain, especially temporal and spatial attributes in complex event definitions and reasoning rules. Then, we devise the SEMi core that implements geospatial operations that compiles ECDM and processes the spatial data. The integration of SEMi core and CEP engine through microservices communication enables applications to process complex events in real-time with spatial characteristics in their semantics rules in a fault-tolerant way occurring in a publish-subscribe fashion and identify boundaries of the detected complex event. The SEMi platform enables users to specify their domain of interests, create event rules and customize their own dashboard driven by events and situation awareness.
Although the study has successfully demonstrated a workable system, it has certain limitations in terms of computational infrastructure and network structure. Our SEMi implementation relies on centralized approaches, where streamed data are processed in the center. In the centralized model, it can be challenging to scale because the capacity of the server is limited and the traffic can not be infinite. Another limitation is that SEMi provides security only among its internal components and at a basic level. However, the security features in IoT and cloud-based smart city architectures, including sensing, transmission, storage and processing layer, and security between SEMi and external components, have to be considered to protect unauthorized parties from attacks on the system. Lastly, the framework provides a Web interface for graphical querying and visualized context entities. It also enables users to view only graphs and a simple dashboard.
This work has presented an event-based architecture with components that meet important requirements for smart city platforms by enabling the development of information services with data interoperability, scalability, real-time processing, spatial functionality, security, and semantic queries. The proposed approach seamlessly integrates complex event processing, and spatiotemporal analytics into smart city platforms and provides a generic workflow for the detection of geographic events at different levels of abstraction, including semantic modeling.
In future work, we aim to extend SEMi toward a distributed network of computing nodes directly scattered in the urban environment, to evaluate its performance for the detection of composite events and to identify strategies for reducing latencies in its components. We plan to integrate blockchain technology as decentralized protocols creating open data among third-party platforms in order to provide secure communication in a smart city. We also plan to extend the advanced reports/dashboards providing users with a more granular view of the data by assuming a hierarchical relationship between different data levels and allowing access to more detailed data overviews.


