Abstract
Modern constructions are often characterized by the presence of slender and aesthetically fascinating components and assemblies. For pedestrian systems in particular, such constructions are notoriously associated with possible vibration issues, and thus require special calculations. When these slender systems are made of structural glass, additional effects due to transparency may also affect human behaviours and motions. In this paper, based on a single body motion, a microelectromechanical system (MEMS) sensor in the body’s centre of mass (CoM) is introduced, an extended, original experimental investigation is presented, and human-induced effects on slender transparent floors are discussed. Major attention is given to the well-known dynamic load factor (DLF) induced by a single pedestrian’s normal walk; a fixed walking rate is assigned, and different substructures (with major variations in their structural dynamic parameters) are taken into account. A discussion of experimental results is proposed for rigid reinforced concrete (RC), and a laboratory contrast system (SLAB#1), which is used as a reference for the analysis of DLF trends on relatively light and flexible transparent glass flooring systems (SLAB#2 and SLAB#3). It is shown that structural frequency and mass, but also possibly transparency, can affect human motion and result in a quantitative modification of measured DLF values, especially for the first and second harmonics of vertical force components.
1. Introduction
Modern buildings and construction systems are often designed in the form of relatively slender and rather flexible assemblies, which are certainly of technical and aesthetic interest, but which also demand more sophisticated calculation methods.
Uncomfortable vibrations due to human-induced loads are common when pedestrians use slender footbridges or walkways [1,2]. In this regard, a large collection of literature experiments has been dedicated to different constructional typologies, focusing on available methods of analysis [3], numerical procedures [4,5], and extended experimental and analytical research for dynamic loading characterization due to single or multiple pedestrians. Extended discussion and experimental evidence of human-induced forces is reported for example in [6,7,8]. Special attention is required, especially with regard to footbridges, which are more sensitive to human-induced vibrations [9,10,11], and the use of simplified assessment procedures is generally desired [12]. More recently, the use of smartphone devices has also been addressed for efficient analysis of human-induced vibrations on pedestrian systems [13]. New technologies and wireless sensors are particularly useful for similar applications [14]. Overall, the general goal of these research efforts is to establish an efficient, rapid, in-field analysis of induced vibrations and to define a robust, operative protocol for the analysis of records. This will lead toward the reconstruction of human-induced effects and reaction forces on structures [15]. On the other hand, literature efforts are mostly focused on opaque floors and slab solutions.
In this paper, attention is given to slender and transparent substructures, such as structural glass pedestrian systems, in which specific dynamic mechanical features and behaviours are taken into account. For glass walkways, it has, for example, been shown in [16,17] how the motion of different numbers pedestrians and their walks can strongly affect the expected structural parameters (Figure 1a). In [18], as well as [19,20], it was proven with different experimental approaches and protocols that emotional and nervous states can further affect human behaviours and motions in the context of glazed constructed facilities, especially for customers asked to move on glass floors and walkways, or even against balustrades. The experiments in [18,19,20] were in fact partly carried out with artificial intelligence tools in support of microfacial analysis of nervous states, and performed (in the form of a subsequent pilot study) with in-field volunteers moving on different floor types while being equipped with multiple sensors to track both body motion parameters and biometric indicators (Figure 1b).
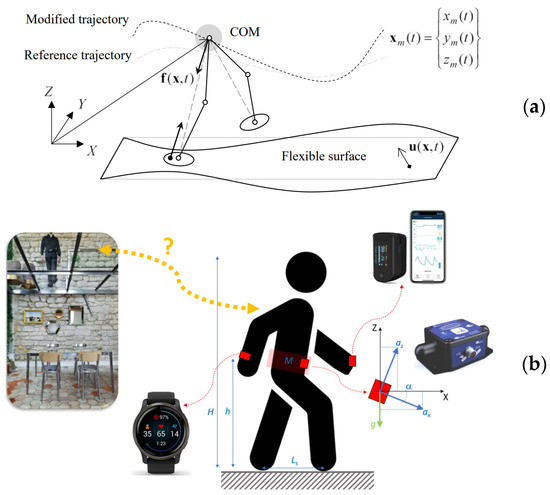
Figure 1.
Example of (a) a mechanical model of walking body motion on a flexible system and (b) a pilot human comfort experimental analysis (figures adapted with permission from [18] under the terms and conditions of CC-BY license agreement).
In the present study, original experimental investigations are hence presented by taking advantage of a single wi-fi body-motion sensor, which is used, with the support of an active adult volunteer, to track the acceleration components during normal walks. Such a procedure is in line with previous experimental investigations, like the assessment of human motion features and/or the quantitative analysis of human-induced loads on various traditional floors [21,22], flexible staircases [23,24,25,26], and many other applications.
Differing from previous literature contributions, the current investigations are characterized by the determination, based on a body-motion sensor, of the dynamic load factor (DLF) corresponding to vertical, longitudinal, and lateral forces during normal walks. To this aim, three different substrates are taken into account, namely consisting of a rigid laboratory contrast system (which is used as an ideal reference), and of two glass walkways systems characterized by different surfaces, structural masses, and fundamental vibration frequencies. Based on extended experimental investigations, the effect of floor systems on DLF trends is presented.
2. Theoretical Background and Experimental Methods
2.1. Deterministic Approach
For engineering applications under ideal walking conditions, it is known that repeatable footfalls of pedestrians can be efficiently described in the form of simplified but realistic mechanical models [1,2,3]. Special care in the analysis of structural behaviours should be in any case spent for pedestrian systems that are particularly vulnerable to vibrations and human-induced loads [4,27]. Structurally speaking, the most relevant action can be represented by deterministic approaches like the Fourier decomposition, in which vertical walking forces on structures can be expressed from Newtonian assumption and equal to [2]
with Mp the pedestrian weight, g the gravitational constant, and av(t) the vertical, human-induced acceleration component. This reaction force can be efficiently quantified by Fourier series as
with Mp expressed in Newton and fi the i-th harmonic frequency in Hertz.
In Equation (2), a key parameter is notoriously represented by the Fourier’s coefficient αi for the i-th harmonic (also known to represent the dynamic load factor, DLF), which describes the ratio of the dynamic force amplitude of each harmonic, to the weight of the pedestrian. The set of DLF values to use to analytically describe the force terms induced by normal walks (or other body motion configurations) usually requires the availability of experimental records in terms of ground reaction force (GRF). However, DLF estimation can take also advantage of records of body centre of mass (CoM) accelerations, as shown in [23] and elsewhere, as well as in the present study.
In any case, longitudinal and lateral reaction forces may be also of technical interest for vibration serviceability analysis, assessment and vibration mitigation. This is especially the case for flexible structures, which are more sensitive to human-induced vibrations (see, for example, [9]). More precisely, it is assumed that longitudinal and lateral force components can be respectively described in Fourier series terms as
2.2. Literature Experiments for DLF Estimation
In recent decades, several research studies have been dedicated to the experimental analysis and quantification of relevant input parameters for human-induced load characterization. These studies represent the primary input for the efficient use of models such as those recalled in Equations (2) and (3).
Among other things, major attention has been focused on the DLF estimation based on experiments [28]. It is in fact recognized that experimental DLF feedback is of paramount importance for the derivation and calibration of analytical models and design procedures [29]. On the other hand, all literature studies on the topic have been proposed for opaque slabs and floor systems.
Gaile and Radinsh [23] experimentally investigated the dynamic loads induced by pedestrians on stairs. Several studies included both random walks and running configurations on floors and/or stairs (see, for example, [7,24]), giving evidence of a substantially different quantitative characterization of reference input parameters, and especially DLF values. The study in [7], more precisely, presented experimental DLF trends for vertical forces only due to three different male pedestrians, asked to separately walk (p = 1 floor occupants) in the range of fp = 1 ÷ 3 Hz. All the past experiments were carried out in laboratory conditions on an instrumented floor strip made of 100-mm-thick precast concrete panels sustained by steel trusses (f1,e = 12 Hz its fundamental vibration frequency), to cover a total span L = 17 m and a width B = 2.13 m (1.74 m the net width). The volunteers were characterized by different ages (48, 41, and 23 years respectively), weights (Mp ≈ 75 kg, 81 kg and 70 kg) and heights (Hp = 1.82 m, 1.78 m and 1.88 m). Most importantly, the investigation reported in [7] confirmed that, for a fixed walking rate fp and flooring system, no marked sensitivity can be expected for DLF trends to pedestrian features (i.e., age, weight, and height). The DLF results for vertical reaction force are shown in Figure 2.
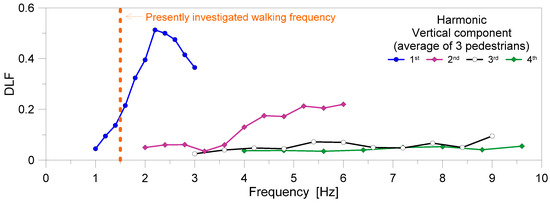
Figure 2.
Experimental derivation of DLF values from comparative data discussed in [7], in the form of average measurements for three pedestrians walking in the range fp = 1 ÷ 3 Hz. In evidence, the presently explored walking frequency (fp = 1.5 Hz).
Experimental results discussed in [7] and recalled in Figure 2 had a minimum of three volunteers and were found to be in rather close correlation with the successive extended experimental investigations reported in [24] for laboratory testing on floor configurations. In [24], up to 40 involved volunteers and a total of 1000 walking traces for DLF derivations were collected on a platform with force plate for walks measurement.
Such an agreement can be noted in Figure 3 for the first harmonic of vertical force component, where the third-order polynomial fit from [24] is also proposed to estimate the average DLF under various walking frequencies. Based on experimental data from [7,24], the average DLF at approximately fp = 1.5 Hz can also be estimated in Figure 3 as a mean value of ≈0.18–0.185.
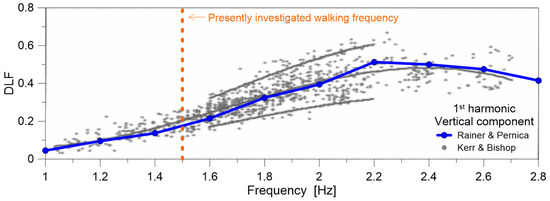
Figure 3.
Experimental derivation of DLF values from comparative data discussed in Rainer & Pernica [7] and Kerr & Bishop [24], for pedestrians walking in the range fp = 1 ÷ 3 Hz. In evidence, the DLF for the first harmonic and the presently explored walking frequency (fp = 1.5 Hz). License agreement 5418101331812 from Elsevier® (October 2022).
On the other hand, experiments from [7,24] in terms of DLF for the second harmonic of vertical reaction force gave evidence of a certain scatter. Most importantly, the DLF from [7] and Figure 2 resulted mostly in a doubling, compared to estimates reported in [24]. The possible justification for such a double DLF given in [24] involved both the different laboratory conditions (instrumented floor strip versus force plate), as well as the different number of involved pedestrians.
Based on a very large number of experimental outcomes in terms of human-induced reaction forces and corresponding DLF trends, Young proposed in [29] an analytical DLF estimation for the first four harmonics of vertical force, for practical use as in Equation (2). The proposed DLF was given as a function of the appropriate harmonic frequency fi, with i = 1, …, 4, accounting for a range of interest for walking frequency fp between 1 Hz and 2.8 Hz. For design considerations, the DLF values can in fact be calculated as [29]
To note that Equations (4)–(7) are representative of the design DLFs for the first to fourth harmonics of vertical force, being expressed as the 75% of the fractile values of statistical distribution.
2.3. Present Study
In this paper, attention is given to the analysis of DLF trends for walking pedestrians, as a function of different substructures. Differing from the extended literature efforts reported in Section 2.2, however, structural glass pedestrian solutions characterized by various dynamic features are explored in place of opaque floors. To this aim, an acquisition system consisting of a wi-fi microelectromechanical system (MEMS) sensor is used during the experimental investigations (Figure 4), in accordance with the previous experimental investigations reported in [30,31].
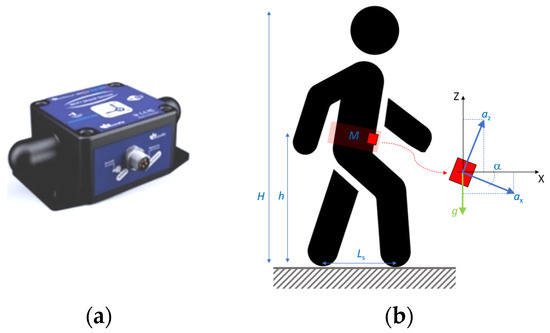
Figure 4.
Present experimental tools. (a) Detail of wi-fi MEMS sensor for the tests. (b) Schematic setup for the measure of body CoM motion records.
We note that the present experimental approach for DLF estimation on different substrates requires that the substructures for collecting walking records is structurally sound and properly characterized in their most important mechanical and dynamic parameters (Section 3.1). More precisely, due to body CoM motion during walks, and thanks to the embedded MEMS inclinometer, each acceleration component was experimentally derived by taking into account the inclination angles from the sensor measurements. As such, the vertical acceleration component av(t) was derived from Figure 4 as
A similar procedure was used in this paper also to express the longitudinal and lateral acceleration components from recorded signals.
Based on collected body CoM experimental records, the human-induced effects on rigid or flexible/low-frequency and transparent substrates were thus quantified. Comparative analyses are hence presented to assess the effect of substructures on motion features. Furthermore, quantitative and qualitative results are commented upon with regard to data in the literature. Table 1 summarizes major experimental assumptions.

Table 1.
Summary of selected experimental configurations for DLF estimations of human-induced reaction forces and comparisons.
3. Experimental Investigation
3.1. Setup
For the current experimental investigation, a single female adult volunteer (p = 1) was invited to walk with assigned frequency (fp ≈ 1.5 Hz) on three different substrates. In this regard, experimental records were acquired both in laboratory conditions and in the field. The first system (SLAB#1) consisted of a rigid floor with very high frequency (f1,e > 80 Hz) and mass, while comparative estimates were collected on two flexible and transparent slab systems (SLAB#2 and SLAB#3). These different configurations can be seen in Figure 5a–c). The main structural features are also summarized in Table 2.
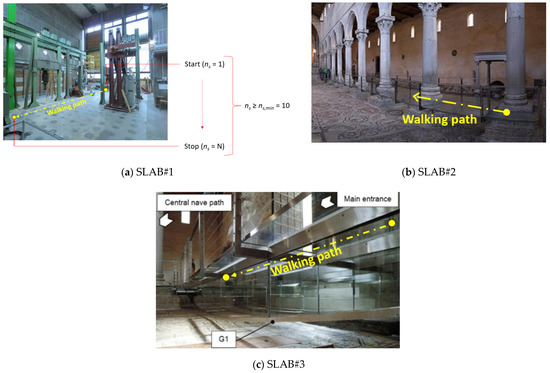
Figure 5.
Experimental analysis on (a) rigid or (b,c) flexible substrates. (Figures (a,c) reproduced with permission from [18] under the terms and conditions of CC-BY license agreement).
Table 2.
Summary of structural features for normal walking experimental measurements.
More precisely, the rigid SLAB#1 setup was characterized by its layout as a massive, 80-cm-thick reinforced concrete (RC) contrast system. The SLAB#1 floor, with 13 m × 8.5 m size, is a standalone floor and is part of the official laboratory for structures and construction materials at the University of Trieste. SLAB#1 is isolated from the rest of laboratory structures and hosts several machines for testing. At the time of experiments, a strip 1.5 m in width as in Figure 5a was used for straight walk measurements.
For configurations in SLAB#2 and #3, portions of the indoor suspension laminated glass (LG) walkway structurally investigated in [16,17,19] were taken into account.
The in-service system consists of a transparent slab in which the laminated glass section layout includes three 12-mm-thick glass panels and interposed PVB® bonding foils (0.76 mm thickness for each). An additional glass layer, 6 mm in thickness, is used to protect the laminated section on the top. For SLAB#2, these glass panels are in a beamlike configuration over a total span of 2.65 m (Figure 5b). For SLAB#3 in Figure 5c, conversely, the glass panels are linearly supported along the edges by a metal grid composed of C-shaped steel members. This steel–glass solution is used to cover a total surface of 14.5 m × 2.8 m. The overall slab system is then sustained by four longitudinal steel–glass girders, spanning the full bending length of 14.5 m.
Most importantly, for structural dynamics considerations, the flexible SLAB#2 system is characterized by a total mass for modular unit in the order of Mstru ≈ 460 kg and a vibration frequency f1,e = 15.1 Hz (experimental measure for the empty structure [16]). In the case of SLAB#3, the reference parameters are Mstru ≈ 10,730 kg for structural mass (with 4020 kg for pedestrian glass panels) and f1,e = 7.28 Hz for the fundamental frequency (experimental measure for the empty structure [16]).
3.2. Instruments and Measured Body CoM Motion Records
For the present investigation, a high-precision, wi-fi triaxial sensor was used to track acceleration and inclination time histories (BeanDevice® Wilow® type [32] based on MEMS technology). The sampling rate was set at 200 Hz, and a lumbar belt was used to keep the sensor in position during body motion. It has to be noted that the presence of the embedded MEMS inclinometer to track the inclination angles for the volunteer in motion represented a key feature for the extrapolation of acceleration components required in Equations (2) and (3) (see also [30,31] and other literature applications).
The volunteer (Mp ≈ 80 kg in weight and Hp = 1.85 m in height, 38 years of age) was asked to walk straight and keep rather constant speed, under an assigned frequency of fp ≈ 1.5 Hz, during each test repetition. For each one of the monitored walking configurations, a minimum of 10 neutral steps (i.e., with the exclusion of initial and final gaits) was taken into account as a reference (see Figure 5a). Similarly, a minimum of five different walks was taken into account for each SLAB#n system. This resulted in a total of more than 150 recorded gaits (that is 5 walks × 10 steps × 3 SLABs) for human-induced vibration and DLF analysis. Table 3, in this regard, presents a summary of reference parameters during experiments, with evidence of occupation density (given in p/m2), structural-to-pedestrian ratio, and structural-to-walk frequency ratio, respectively.
Table 3.
Summary of reference parameters for normal walking experimental measurements (with p = 1, fp ≈ 1.5 Hz and Mp = 80 kg).
An important aspect was represented by operational conditions for in-field experiments, given that all the activities were carried out with the strict requirement of avoiding any kind of disturbance or interruption in functionality of the glass walkway. In this sense, differing from laboratory experimental conditions, the number of records for the present analysis was properly optimized, based on received restrictions.
Possible future extensions and additional measurements will include a different number of volunteers, as well as different walking configurations (especially in terms of walking frequency fp). Moreover, to address more precisely and quantitatively the effect of floor transparency on human-induced loads, additional setup configurations inclusive of carpets will be taken into account to compare similar walking records collected for the same volunteers while moving, at an assigned speed, on the transparent or hidden glazed walkway modules.
Typical experimental acquisitions from selected walking configurations on SLAB#1 or SLAB#3, respectively, can be seen in Figure 6 in terms of vertical force component from body CoM acceleration extrapolated as in Equation (8). At the same time, the longitudinal and lateral body CoM records were separately collected for postprocessing of the comparative results.
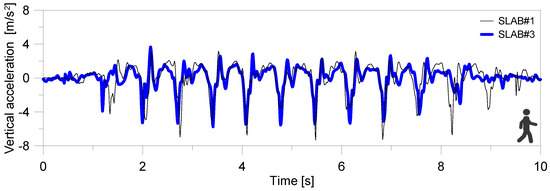
Figure 6.
Example of experimentally derived body CoM accelerations (vertical component) for the volunteer walking on rigid SLAB#1 or flexible, low frequency, SLAB#3 systems.
4. Discussion of Experimental Results
For the analysis of test results, the effective number of useful tracks for quantitative investigations of walking parameters and human-induced loads for the three selected slab configurations was quantified in 8 walks for SLAB#1, 10 for SLAB#2, and 9 for SLAB#3, respectively. For all these walking configurations, separate records were collected for the same (single) pedestrian volunteer involved in the experiments.
For postprocessing purposes, we chose to remove via signal windowing the initial and final gaits of this set of collected records, and thus to elaborate data on human-induced loads and DLFs by accounting for the 10 central gaits only. In this way, the analysis of results was separately carried out on a number of 8 (for SLAB#1), 10 (#2) and 9 (#3) “reduced” walking records (i.e., representative of 10 central gaits only for each one of them), and then elaborated upon the “average ± standard deviation form”. Major elaborations and signal processing analyses were carried out with the support of a Matlab® toolbox [33]. We note that the experimental records of separate acceleration components were also preliminarily elaborated upon, as in Equation (8), to express the vertical, longitudinal, and lateral contributions associated with body CoM motion. Quantitative results are summarized in the following sections.
4.1. Frequency Domain Analysis
Experimental records were first analysed in the frequency domain and fast Fourier transform (FFT) spectrum form, to have a more detailed view of FFT component trends on the substrates SLAB#1, #2, and #3 (Figure 7). Typical FFT peak values (normalized with respect to the weight of pedestrian) can be found in Table 4, with evidence of first and second harmonics for vertical, longitudinal, and lateral force components. Moreover, the ratio of FFT peaks as a function of substrate/floor are further emphasized for SLAB#2 and SLAB#3, compared to the laboratory rigid foundation as in SLAB#1. Spectra examples can be seen in Figure 7, where FFT plots are grouped by component of acceleration and by slab configuration for the experiments. In this regard, it has to be noted that experimental results in Table 4 and Figure 7 for FFT spectra are normalized with respect to the weight of the involved pedestrian.
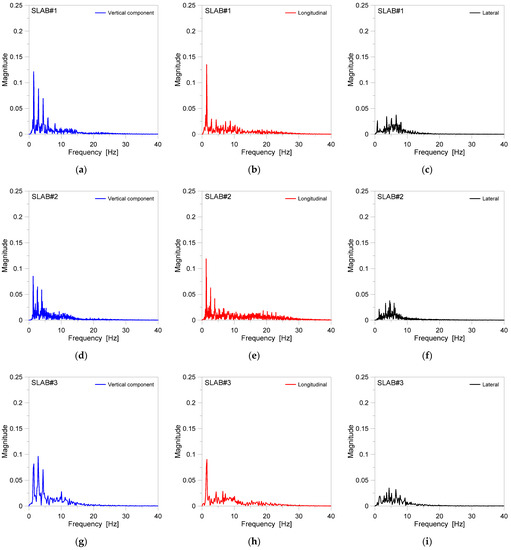
Figure 7.
Examples of experimentally derived FFT spectra (normalized with respect to the weight of the pedestrian) for a single adult pedestrian under normal walks on (a–c) rigid (SLAB#1) or (d–f) flexible SLAB#2 and (g–i) SLAB#3 transparent floors, with evidence of (a,d,g) vertical, (b,e,h) longitudinal, and (c,f,i) lateral force components based on body CoM measurements of the adult volunteer under normal walking gait.
Table 4.
Average trend of FFT peak amplitudes, as obtained from experimental spectra (normalized with respect to the weight of pedestrian) for vertical, longitudinal, and lateral force components on different substructures.
As far as the vertical force components in Table 4 and Figure 7a,d,g are taken into account, it is worth noting a primary effect of substructural systems. This is especially true for the first harmonic amplitudes, but relevant effects can be noted also for the second, as far as the slenderness and flexibility of floors increases. Most importantly, the second harmonic amplitude is greater than the first for experiments on SLAB#3, whereas an opposite trend can be seen for SLAB#1 and SLAB#2. It is also of interest to note that the first amplitude on both SLAB#2 and SLAB#3 is significantly lower than that of SLAB#1, even though no modifications were made to the involved volunteer or to the fixed walking frequency fp.
In terms of longitudinal component of motion, marked modification of selected FFT spectra trends can be also clearly noted in Table 4 and Figure 7b,e,h, with a more pronounced first harmonic for SLAB#1 compared to both SLAB#2 and SLAB#3. For the selected floors, an increase in +10% of the vertical peak can be seen for SLAB#1, whereas the scatter is less than +2% for SLAB#2 and up to +11% for SLAB#3. In terms of the second harmonic peak of longitudinal component, the comparative results give evidence of marked reduction with respect to the first, for all the examined floors, with a general decrease down to −70–78% for SLAB#1 and SLAB#3, and down to −55% for SLAB#2.
In this regard, such an outcome could find justification in both structural dynamic parameters as in Table 2 and Table 3, and also in possible motion modifications of pedestrians when walking on slender and transparent substrates, compared to the SLAB#1 setup.
Finally, for the lateral component in Table 4 and Figure 7c,f,i, rather small magnitudes were typically measured for body CoM accelerations on all the investigated substrates. An average factor of 4 ÷ 5 was measured for the first vertical to lateral components on the same flooring system. A general decrease for the first harmonic peak from SLAB#1 to #3 can be noted in Table 4, and this is in line with vertical force component trends. Furthermore, a general increase of the second harmonic peak was measured for a lateral component on different substructures, compared to the first one, in the order of +30%.
4.2. Average DLF for Vertical, Longitudinal, and Lateral Force Components
Average trends of DLF for the examined walking configurations are the primary input for deterministic approaches like the Fourier series approach in Equation (2), for vertical force component, and Equation (3) for longitudinal and lateral components, respectively. To this aim, single DLF data calculated for each relevant harmonic corresponding to the 8 (for SLAB#1) + 10 (#2) + 9 (#3) “reduced” walking record components, and properly derived from raw experimental data, are given in Appendix A.
For the present study, Matlab® was used for sine curve fit, and thus for the extrapolation of corresponding DLF values for harmonics of vertical, longitudinal, and lateral human-induced loads as in Equations (2) and (3). In this regard, it also has to be noted that average and standard deviation outcomes from present experimental investigation derive from modifications in normal walks of the single involved volunteer, rather than multiple pedestrians asked to walk on the same floors.
Figure 8 reports that the first five harmonics have been experimentally calculated from the present investigations. Results are grouped by force component, as well as by floor type. It is worth noting how, for a given pedestrian and a fixed walking rate fp, the substructures can affect human-induced loading, and specifically the corresponding DLF.
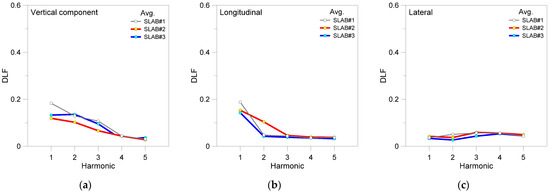
Figure 8.
Experimentally derived DLF trends (average), as a function of harmonic order, for a single adult volunteer under normal walks on rigid floor (SLAB#1) or flexible SLAB#2 and SLAB#3 transparent systems, with evidence of (a) vertical, (b) longitudinal, and (c) lateral force components based on body CoM measurements. Average DLF values calculated based on 8 walking records for SLAB#1, 10 for #2 and 9 for #3.
For the rigid RC floor, SLAB#1, the presently derived DLF trends are characterized by a first harmonic, which typically prevails on the higher harmonics for both the vertical and longitudinal force components based on CoM motion.
The average DLF amplitudes derived for both SLAB#2 and SLAB#3 are relatively smaller than SLAB#1. This can be noted both for the first harmonic but also for the higher harmonics of vertical force component (see Figure 8a). Another relevant aspect in Figure 8a is represented by the second harmonic of vertical force on SLAB#3, which is the most flexible among the examined floor configurations, and is characterized in Figure 8a by higher mean DLF than the first harmonic. Such an additional finding is again rather in line with past discussion from various literature studies (see for example [7,24]), where it has been emphasized from experimental observations that the second harmonic of vertical forces induced by pedestrians is, in general terms, the most sensitive to floor flexibility.
Overall, similar qualitative average trends of DLF can be noted also for the longitudinal and lateral components presented in Figure 8b,c respectively, for all the examined configurations. The exception, in this latter case, is represented again by the DLF corresponding to the second harmonic in Figure 8b, which is more sensitive in terms of lateral force component on SLAB#2, and is found to be significantly higher than SLAB#1 and SLAB#3.
4.3. Average DLF for Vertical Force Component: Present and Literature Outcomes
For design purposes, it is clear that major attention should be given first of all to the DLF of the vertical force component and its first harmonic. In this sense, it is worth noting that for the opaque rigid RC floor, SLAB#1, the presently derived DLF trend was found to be typically in line with several literature efforts. Such a finding is confirmed by quantitative comparisons proposed in Figure 9, where the presently calculated average DLF of the first harmonic is found equal to ≈0.1832. This value has a good match with previous data proposed in [7,24], based on extended experimental analyses in laboratory conditions. Moreover, the present DLF result has minimum scatter with the analytical model recalled in Equation (4) from [29], based on statistical analysis of a very extended database of experimental observations (with ≈0.2255 the expected DLF for the assigned walking frequency fp = 1.5 Hz, with around a −18% scatter for present DLF outcomes on the opaque SLAB#1).
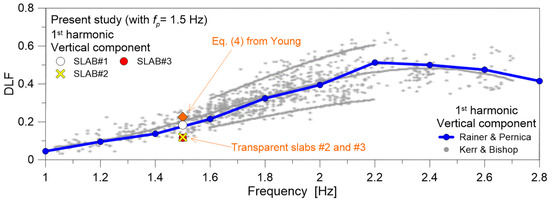
Figure 9.
Present experimental derivation of average DLF values (first harmonic of vertical force component) for a single adult pedestrian volunteer under normal walks (fp = 1.5 Hz), and comparison with selected literature outcomes, such as Rainer & Pernica [7], Kerr & Bishop [24], Young [29]. Present average DLF values calculated for a single adult pedestrian, based on 8 walking records for SLAB#1, 10 for #2 and 9 for #3.
Most importantly, Figure 9 also reports the present DLF results derived from SLAB#2 and #3 test setup configurations, characterized by intrinsic slab transparency and various dynamic parameters as in Table 1 and Table 3. In this case, it can be noted that present experimental derivations for SLAB#2 and #3 (with an average DLF approximately equal to ≈0.11–0.12 for both) are placed at the lower bound of selected literature data from [7,24]. Compared to the opaque SLAB#1 configuration, the calculated DLF has decreased to ≈−37% scatter. Moreover, these DLF results are markedly lower compared to analytical estimates from Equation (4) based on statistical analysis in [29], with a scatter decreasing to −49%. This kind of correlation suggests a major influence of selected transparent floors on human–structure interaction phenomena, and thus requires additional investigations.
4.4. DLF Sensitivity to Floor Characteristics
Although the analysis of average DLF trends as in Section 4.3 allows us to emphasize some general trends and major deviations only, for the present study and for the examined floor systems, the attention was focused on a sensitivity analysis of mean DLF values.
In this regard, Figure 10 gives evidence of the standard deviation and variation range of calculated DLF trends, which are again plotted as a function of harmonic order, for vertical, longitudinal, and lateral force components based on body motion.
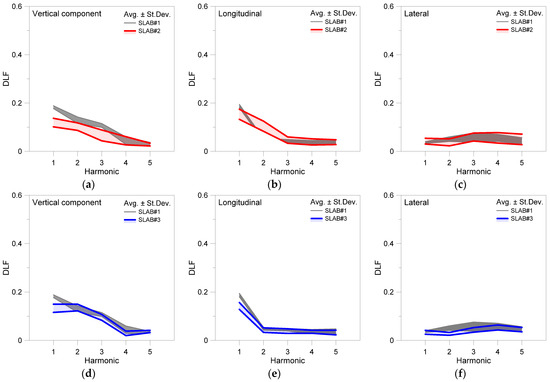
Figure 10.
Experimentally derived DLF trends (average ± standard deviation), as a function of harmonic order, for a single adult volunteer under normal walks on rigid floor (SLAB#1) or flexible SLAB#2 and SLAB#3 transparent systems, with evidence of DLF values corresponding to (a,d) vertical, (b,e) longitudinal and (c,f) lateral force components based on body CoM measurements. DLF value ranges calculated based on 8 walking records for SLAB#1, 10 for #2 and 9 for #3.
To quantify the DLF modification as a function of floor flexibility (and even transparency), results are grouped separately for SLAB#2 and SLAB#3 experiments, with respect to SLAB#1.
It is thus worth noting that the experimental measurements on the rigid floor, SLAB#1, are characterized by relatively small sensitivity for both the vertical and longitudinal forces from the pedestrian. This outcome can be observed in terms of average ± standard deviation contour plots in Figure 10. The lateral force component from body motion and the corresponding DLF values are the most sensitive to possible variations on SLAB#1 (see Figure 10c), but these are in any case characterized by relatively small amplitude, compared to vertical and longitudinal force components.
As far as the experimental trends for SLAB#2 and SLAB#3 are taken into account in Figure 10, it can be noted that the scatter from the average DLF values is more significantly pronounced, compared to SLAB#1 outcomes.
This is especially the case for SLAB#2, which is characterized by a relatively high vibration period but a very low structural mass compared to the involved pedestrian (Table 3). These structural features could possibly result in higher sensitivity of motion features, as well as additional human–structure interaction phenomena. In particular, the limited structural mass of SLAB#2, which is in the order of ≈4 times the occupant, suggests major vibration issues and thus dynamic human–structure interactions, which could manifest in higher sensitivity and modification of reaction forces, and thus further modification of DLF values to account in deterministic models as in Equations (2) and (3).
For the experiments carried out on SLAB#3, which is indeed characterized by low vibration frequency compared to SLAB#2 but relatively high structural mass compared to SLAB#2 and to the pedestrian (Table 3), the results proposed in Figure 10 are still associated with a notable variability and sensitivity of average DLF amplitudes, but the calculated scatter is less pronounced than SLAB#2 and relatively higher than SLAB#1.
In Table 5, Table 6 and Table 7, finally, a summary of average and standard deviation trends from present experimental evidence is proposed for DLF values corresponding to vertical, longitudinal, and lateral force components on the three different slabs.
Table 5.
Average trend and standard deviation of DLF values of normal walk (fp = 1.5 Hz), as obtained from experimental records for vertical force component on different substructures (with 8 walking records for SLAB#1, 10 for #2 and 9 for #3 and a single adult pedestrian volunteer).
Table 6.
Average trend and standard deviation of DLF values of normal walk (fp = 1.5 Hz), as obtained from experimental records for longitudinal force component on different substructures (with 8 walking records for SLAB#1, 10 for #2, and 9 for #3 and a single adult pedestrian volunteer).
Table 7.
Average trend and standard deviation of DLF values of normal walk (fp = 1.5 Hz), as obtained from experimental records for lateral force component on different substructures (with 8 walking records for SLAB#1, 10 for #2, and 9 for #3 and a single adult pedestrian volunteer).
4.5. Empirical DLF Models for Vertical Force Component
The analysis of DLF values as in Table 5, Table 6 and Table 7 was further extended, and a new elaboration was carried out as a function of some slab characteristics as in Table 3, with a more detailed analysis focused on (i) occupation density, (ii) mass ratio, and (iii) frequency ratio for the systems SLAB#1, #2, and #3. The comparative analysis takes into account also selected data from [7,29].
As far as normalized parameters are taken into account to compare the quantitative outcomes on different slabs as in the present study, a linear regression model could be possibly defined to check the modification in the experimentally derived (average) DLF trends, at a given walking frequency fp. Such a procedure could be useful especially for quantitative discussion about the vertical force component, which is of primary interest for the design purposes of pedestrian systems. In Figure 11, typical results from regression analysis can be thus found for present DLF results, with evidence of linear fit equations and corresponding (R-squared) coefficients of determination.
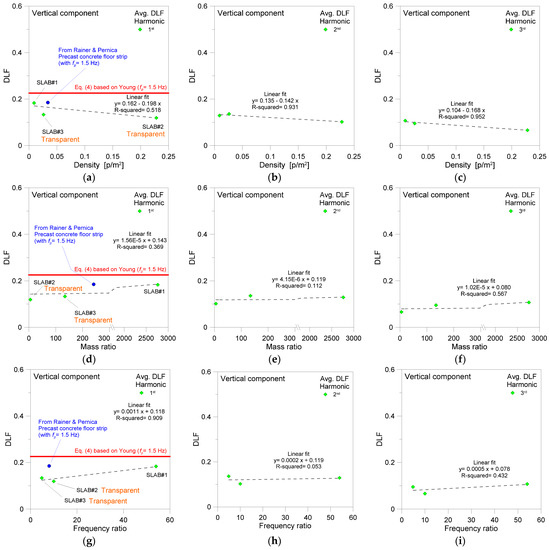
Figure 11.
Correlation by linear regression model of experimentally derived DLF trends (average), as a function of harmonic order, with evidence of results for vertical force components based on body CoM measurements. Comparisons are proposed towards Rainer & Pernica [7] and Young [29]. Linear fits are proposed in terms of (a–c) occupation density of selected slabs #1, #2, #3, (d–f) mass ratio, or (g–i) frequency ratio. Average DLF values calculated for a single adult pedestrian, based on 8 walking records for SLAB#1, 10 for #2 and 9 for #3.
It can be noted for example in Figure 11b,c that both the second and third harmonics for the vertical force component are well described in DLF terms by linear regression model, with R-squared coefficient up to ≈0.93 and ≈0.95, respectively. In addition, the first harmonic DLF fit is rather weak in Figure 11a, and the occupation density itself seems not to be a meaningful parameter for structural dynamics considerations on the examined floors SLAB#1, #2, and #3. It is also shown that the calculated blue dot in Figure 11a—which derives from DLF in Figure 3 (based on [7]) at a walking frequency fp= 1.5 Hz, and an occupation density (in p/m2) based on a pedestrian surface of ≈29 square meters for the laboratory floor strip presented in [7] (a set of precast concrete panels sustained by steel trusses)—has in any case some correlation with the proposed linear fit.
When the mass ratio from Table 3 is taken into account as in Figure 11d–f for DLF trends of the vertical force, it can be noted that the first harmonic and associated DLF is poorly described by linear fit, with R-squared coefficient down to ≈0.37. This is also the case with the second and third harmonics. The blue dot in Figure 11d has indeed a minimum correlation with present outcomes.
Finally, for the frequency ratios given in Table 3, the correlation analysis gives results in Figure 11g–i. In this case, the DLF for the first harmonic only is well fitted by linear regression, with R-squared coefficient ≈0.91. It is worth noting that the additional dot in Figure 11g, as it was calculated from Figure 3 (fp = 1.5 Hz), is based on a ratio equal to ≈8 for the laboratory setup in [7]. Although the experiments on three volunteers involved in [7] confirmed that DLF is only negligibly affected by pedestrian features, the volunteers were asked in [7] to repeatedly walk on the same laboratory floor strip, which was rather rigid (f1,e = 12 Hz, which is intermediate to actual SLAB#2 and #3) but not transparent like #2 and #3. It is thus worth noting in Figure 11g that the blue dot overestimates the present regression outcomes, and hence this suggests further extended investigations to holistically address possible effects of floor characteristics on human-induced reaction forces.
5. Conclusions and Future Developments
In modern constructions, the presence of slender and aesthetically fascinating components and assemblies is rather frequent, for various reasons. From a practical design point of view, this requires dedicated calculation procedures and studies, especially against vibration serviceability issues.
The attention of this paper was given to slender and transparent floors like structural glass pedestrian systems, and more precisely to experimental investigations aimed at assessing and quantifying the human-induced effects on slender transparent floor systems. Major efforts were spent for discussion in terms of dynamic load factor (DLF) due to a single adult pedestrian, asked to repeatedly walk at a fixed walking rate on different substructures. Discussion of experimental parametric results was thus proposed toward an opaque and rigid, reinforced concrete (RC), laboratory foundation system (SLAB#1), which was used as a reference. Two additional, relatively light, flexible, and transparent glass flooring systems belonging to an in-service indoor walkway (SLAB#2 and SLAB#3, respectively) were explored based on original in-field experimental measurements.
From the present experimental investigation, it was found that floor transparency—in addition to other influencing parameters—can be reasonably detected as a possible source of body motion modifications, and thus reaction force modifications under normal walks. For the vertical force component induced by the involved pedestrian, more precisely:
- the DLF corresponding to the first harmonic on the rigid, opaque SLAB#1 system was calculated with a very good match to literature data available for opaque slabs and floors characterized by high or low vibration frequency;
- on the other hand, a marked sensitivity (in terms of standard deviation) and low amplitude (compared to literature expectations) was found for DLF corresponding to the first harmonic for the pedestrian walking on transparent flexible floors. This was noted both for SLAB#2 (with high vibration frequency) and SLAB#3 (low frequency);
- for the transparent floor with low-frequency (as SLAB#3 in the current investigation), moreover, the DLF of second harmonic was found higher than the first one.
In terms of DLF calculated for longitudinal and lateral force components, moreover, a major sensitivity was observed for the second harmonic of longitudinal force on SLAB#2. Moreover, in addition to the limited amplitude, a clear DLF modification was quantified for the lateral force component, both on SLAB#2 and #3, with respect to the rigid RC system (SLAB#1).
In this regard, further experimental studies will be developed to extend the currently explored walking frequency configuration, so as to further explore and possibly confirm the present evidence of floor interaction on human body motions and walking features, thus corresponding reaction forces and DLF amplitudes.
Author Contributions
Conceptualization, C.B.; methodology, C.B.; investigation, C.B., M.F. and S.N.; resources, C.B.; data curation, C.B.; writing—original draft preparation, C.B., M.F. and S.N.; project administration, C.B. All authors have read and agreed to the published version of the manuscript.
Funding
This research received no external funding.
Data Availability Statement
Data will be shared upon request.
Conflicts of Interest
The authors declare no conflict of interest.
List of Symbols
| av(t) | vertical component of human-induced acceleration |
| fi | i-th harmonic frequency, for Fourier decomposition |
| fp | walking frequency |
| f1,e | fundamental vibration frequency of floor/substructure |
| Fl(t) | longitudinal or lateral component of human-induced reaction force |
| Fv(t) | vertical component of human-induced reaction force |
| g | gravitational constant |
| i | order number of the harmonic, for Fourier decomposition |
| Hp | height of pedestrian |
| Mp | weight of pedestrian |
| Mstru | weight of floor/slab |
| n | total number of harmonics, for Fourier decomposition |
| p | number of pedestrians/floor occupants for each walking setup |
| αi | the Fourier’s coefficient for the i-th harmonic (also known to represent the dynamic load factor, DLF) |
| ϕi | the phase shift of the i-th harmonic, for Fourier decomposition |
Appendix A


Figure A1.
Experimentally derived DLF trends (average ± standard deviation, with evidence of raw experimental outcomes), as a function of harmonic order, for a single adult volunteer under normal walks on (a–c) rigid floor (SLAB#1) or (d–f) flexible SLAB#2 and (g–i) SLAB#3 transparent systems, with evidence of DLF values corresponding to (a,d,g) vertical, (b,e,h) longitudinal, and (c,f,i) lateral force components based on body CoM measurements. DLF values calculated based on 8 walking records for SLAB#1, 10 for #2 and 9 for #3.


References
- Bachmann, H.; Ammann, W. Vibrations in structures induced by man and machines. Can. J. Civ. Eng. 1987, 15, 1086–1087. [Google Scholar]
- Sedlacek, G.; Heinemeyer, C.; Butz, C.; Veiling, B.; Waarts, P.; Duin, F.; Hicks, S.; Devine, P.; Demarco, T. Generalisation of Criteria for Floor Vibrations for Industrial, Office, Residential and Public Building and Gymnasium Halls; European Commission: Luxembourg, 2006. [Google Scholar]
- Shahabpoor, E.; Pavic, A.; Racic, V. Interaction between Walking Humans and Structures in Vertical Direction: A Literature Review. Shock Vib. 2016, 2016, 1–22. [Google Scholar] [CrossRef]
- Cai, Y.; Gong, G.; Xia, J.; He, J.; Hao, J. Simulations of human-induced floor vibrations considering walking overlap. SN Appl. Sci. 2019, 2, 19. [Google Scholar] [CrossRef]
- da Silva, J.G.S.; Vellasco, P.D.S.; de Andrade, S.A.L.; de Lima, L.R.; Figueiredo, F.P. Vibration analysis of footbridges due to vertical human loads. Comput. Struct. 2007, 85, 1693–1703. [Google Scholar] [CrossRef]
- Racic, V.; Pavic, A.; Brownjohn, J. Experimental identification and analytical modelling of walking forces: Literature review. J. Sound Vib. 2009, 326, 1–49. [Google Scholar] [CrossRef]
- Rainer, J.H.; Pernica, G. Vertical dynamic forces from footsteps. Can. Acoust. Acoust. Can. 1986, 14, 12–21. [Google Scholar]
- Galbraith, F.W.; Barton, M.V. Ground loading from footsteps. J. Acoust. Soc. Am. 1970, 48, 1288–1292. [Google Scholar] [CrossRef]
- Ingólfsson, E.; Georgakis, C.; Ricciardelli, F.; Jönsson, J. Experimental identification of pedestrian-induced lateral forces on footbridges. J. Sound Vib. 2011, 330, 1265–1284. [Google Scholar] [CrossRef]
- Picozzi, V.; Avossa, A.M.; Ricciardelli, F. Probabilistic assessment of footbridge response to single walkers. Arch. Appl. Mech. 2022, 92, 1913–1927. [Google Scholar] [CrossRef]
- Pavic, A.; Reynolds, P. Vibration serviceability of long-span concrete building floors. Part 2: Review of mathematical modelling approaches. Shock Vib. Dig. 2002, 34, 279–297. [Google Scholar]
- Piccardo, G.; Tubino, F. Simplified procedures for vibration serviceability analysis of footbridges subjected to realistic walking loads. Comput. Struct. 2009, 87, 890–903. [Google Scholar] [CrossRef]
- Martinelli, L.; Racic, V.; Dal Lago, B.A.; Foti, F. Testing Walking-Induced Vibration of Floors Using Smartphones Recordings. Robotics 2020, 9, 37. [Google Scholar] [CrossRef]
- Bocian, M.; Brownjohn, J.M.W.; Racic, V.; Hester, D.; Quattrone, A.; Monnickendam, R. A framework for experimental determination of localised vertical pedestrian forces on full-scale structures using wireless attitude and heading reference systems. J. Sound Vib. 2016, 376, 217–243. [Google Scholar] [CrossRef]
- Van Nimmen, K.; Zhao, G.; Seyfarth, A.; Van den Broeck, P. A Robust Methodology for the Reconstruction of the Vertical Pedestrian-Induced Load from the Registered Body Motion. Vibration 2018, 1, 250–268. [Google Scholar] [CrossRef]
- Bedon, C. Experimental investigation on vibration sensitivity of an indoor glass footbridge to walking conditions. J. Build. Eng. 2020, 29, 101195. [Google Scholar] [CrossRef]
- Bedon, C. Diagnostic analysis and dynamic identification of a glass suspension footbridge via on-site vibration experiments and FE numerical modelling. Compos. Struct. 2019, 216, 366–378. [Google Scholar] [CrossRef]
- Bedon, C. Pilot experiments for multi-criteria human comfort-driven structural glass design assessment. Proc. Challenging Glass Conf. 2022, 8. [Google Scholar] [CrossRef]
- Bedon, C.; Fasan, M. Reliability of field experiments, analytical methods and pedestrian’s perception scales for the vibration serviceability assessment of an in-service glass walkway. Appl. Sci. 2019, 9, 1936. [Google Scholar] [CrossRef]
- Bedon, C.; Mattei, S. Facial Expression-Based Experimental Analysis of Human Reactions and Psychological Comfort on Glass Structures in Buildings. Buildings 2021, 11, 204. [Google Scholar] [CrossRef]
- Simonetti, E.; Bergamini, E.; Vannozzi, G.; Bascou, J.; Pillet, H. Estimation of 3D Body Center of Mass Acceleration and Instantaneous Velocity from a Wearable Inertial Sensor Network in Transfemoral Amputee Gait: A Case Study. Sensors 2021, 21, 3129. [Google Scholar] [CrossRef]
- Blachowski, B.; Holobut, P.; Ortiz, A.R.; Caicedo, J.M. Simple human-structure interaction model of walking on a flexible surface. In Proceedings of the ISMA2016—International Conference on Noise and Vibration, Leuven, Belgium, 19–21 September 2016. [Google Scholar]
- Gaile, L.; Radinsh, I. Human Induced Dynamic Loading on Stairs. Int. J. Civ. Env. Eng. 2012, 6, 530–536. [Google Scholar]
- Kerr, S.C.; Bishop, N.W.M. Human induced loading on flexible staircases. Eng. Struct. 2001, 23, 37–45. [Google Scholar] [CrossRef]
- Bougard, A. Human loading on staircases. Struct. Build. 2002, 152, 371–380. [Google Scholar] [CrossRef]
- Bishop, N.W.M.; Willford, M.; Pumphrey, R. Human induced loading of flexible staircases. Saf. Sci. 1995, 18, 261–276. [Google Scholar] [CrossRef]
- Bedon, C. Time-domain numerical analysis of single pedestrian random walks on laminated glass slabs in pre- or post-breakage regime. Eng. Struct. 2022, 260, 114250. [Google Scholar] [CrossRef]
- Živanović, S.; Pavić, A.; Reynolds, P. Vibration serviceability of footbridges under human-induced excitation: A literature review. J. Sound Vib. 2005, 279, 1–74. [Google Scholar] [CrossRef]
- Young, P. Improved Floor Vibration Prediction Methodologies. In Proceedings of Arup Vibration Seminar on Engineering for Structural Vibration—Current Developments in Research and Practice; Institution of Mechanical Engineers: London, UK, 2001. [Google Scholar]
- Bedon, C. Body CoM Acceleration for Rapid Analysis of Gait Variability and Pedestrian Effects on Structures. Buildings 2022, 12, 251. [Google Scholar] [CrossRef]
- Bedon, C.; Noè, S. Uncoupled Wi-Fi Body CoM Acceleration for the Analysis of Lightweight Glass Slabs under Random Walks. J. Sens. Actuator Netw. 2022, 11, 10. [Google Scholar] [CrossRef]
- BeanDevice® Wilow® User Manual—Wilow® Wireless Sensor, version 2.3.2; BenAir: Berlin, Germany, 2019.
- MATLAB (R2018a); Version 9.4 Natick; The MathWorks Inc.: Natick, MA, USA, 2018.


Publisher’s Note: MDPI stays neutral with regard to jurisdictional claims in published maps and institutional affiliations. |
© 2022 by the authors. Licensee MDPI, Basel, Switzerland. This article is an open access article distributed under the terms and conditions of the Creative Commons Attribution (CC BY) license (https://creativecommons.org/licenses/by/4.0/).