Article

Sentiment Analysis of Social Survey Data for Local City Councils

1
School of Business, Law, and Entrepreneurship, Swinburne University of Technology, Melbourne, VIC 3122, Australia
2
Ryan Watson Consulting Pty Ltd., Melbourne, VIC 3133, Australia
*
Author to whom correspondence should be addressed.
J. Sens. Actuator Netw. 2022, 11(1), 7; https://doi.org/10.3390/jsan11010007
Submission received: 15 November 2021 / Revised: 4 January 2022 / Accepted: 7 January 2022 / Published: 12 January 2022
(This article belongs to the Special Issue Applications of Sensor Networks and Systems in Smart Cities)

Abstract

:
Big data analytics can be used by smart cities to improve their citizens’ liveability, health, and wellbeing. Social surveys and also social media can be employed to engage with their communities, and these can require sophisticated analysis techniques. This research was focused on carrying out a sentiment analysis from social surveys. Data analysis techniques using RStudio and Python were applied to several open-source datasets, which included the 2018 Social Indicators Survey dataset published by the City of Melbourne (CoM) and the Casey Next short survey 2016 dataset published by the City of Casey (CoC). The qualitative nature of the CoC dataset responses could produce rich insights using sentiment analysis, unlike the quantitative CoM dataset. RStudio analysis created word cloud visualizations and bar charts for sentiment values. These were then used to inform social media analysis via the Twitter application programming interface. The R codes were all integrated within a Shiny application to create a set of user-friendly interactive web apps that generate sentiment analysis both from the historic survey data and more immediately from the Twitter feeds. The web apps were embedded within a website that provides a customisable solution to estimate sentiment for key issues. Global sentiment was also compared between the social media approach and the 2016 survey dataset analysis and showed some correlation, although there are caveats on the use of social media for sentiment analysis. Further refinement of the methodology is required to improve the social media app and to calibrate it against analysis of recent survey data.

1. Introduction

Many government agencies are moving towards a data-driven business strategy so that they can exploit the benefits from analysing the masses of big data they have accumulated over time in order to evolve into smart communities [1]. The large volume of big data and the rapid velocity at which it is collected can be challenging for analysts to handle. Public administrators need to consider whether their organisations have the capability to handle vast volumes of structured and unstructured data, perform data analysis to generate actionable insights, and derive meaning from the data to support evidence-based decisions [2].
The term ‘smart city’ can be defined as a ‘place where traditional networks and services are made more flexible, efficient, and sustainable with the use of information, digital, and telecommunication technologies, to improve its operations for the benefit of its inhabitants’ [3]. These authors also state that emerging technologies such as the Internet of Things (IoT) and big data are interrelated and contribute to the progression of smart cities by increasing efficiencies and responsiveness. The application of insights from analysing big data can benefit a government or council wanting to develop into a smart city by improving resource allocation efficiency, enhancing its citizens’ quality of life, and increasing interoperability and transparency of data and resource sharing among entities to promote collaboration and smart city innovations.
The novel approach adopted for this research was focused on carrying out sentiment analysis from historic survey data and comparing this with sentiment analysis from current social media feeds. These historic and near-immediate data can be correlated to produce high-level reports of actionable insights. Social media can be used to obtain regular updates as required by a local council. The project was carried out by a team of students from Swinburne University of Technology for the sponsor Ryan Watson Consulting Pty Ltd. [4] to help them gain valuable skills for future employment in data science and also enhance the sponsor’s technical repertoire.
The rest of the paper is organised as follows: Section 2 describes previous work; Section 3 describes the methodology, data, and analysis tools; Section 4 describes the analysis of datasets from the City of Melbourne (CoM) and the City of Casey (CoC); Section 5 discusses the results; Section 6 provides conclusions.

2. Related Work

Cities and councils use social surveys to engage with their citizens, and these surveys can be voluminous requiring big data analysis techniques. Machine learning is beginning to be applied to such social surveys. Buskirk et al. provided an introduction to the potential of machine learning (ML) techniques for survey research [5]. Ramirez et al. applied ML to public health surveys to explore the use of language for English and non-English responses and showed that there are differences between responses in different languages with heterogeneity among the Asian languages [6].
Another approach is to use sentiment analysis, an application of natural language processing (NLP) that identifies expressions reflecting opinions towards issues [7]. Opinions are generally categorised as polar values of positive, negative, or neutral and sentiment analysis determines their polarity and strength. This automatically extracts useful information from sources such as posts on blogs or social media. Such analysis can be conducted at the phrase, sentence, and document level [8]. This is particularly relevant for text-based surveys such as the Casey Next survey. Algorithms have been developed to extract sentiment from text responses to survey questions [9,10]. Lexicon-based approaches compare words in the text to those in a lexicon that contains positive and negative words and their associated intensities [11]. Sentiment is then determined from the matches between the text and the lexicon.
Social media provide a ready source of big data that can be mined and analysed [12]. It is estimated that there may be over 3 billion active social media users by 2023, a third of the world’s population, with an estimated 800 million from China and 450 million from India [13]. Opinion mining from social media is employed by the media giants for research and marketing purposes using their own tools [14].
Data from social media such as Twitter can also be used to determine more immediate, although less formal, responses [15]. For example, Yigitcanlar et al. used geolocated Twitter analysis to study perceptions about smart city concepts and technologies in Australia [16]. Attitudes towards the COVID-19 pandemic have also been studied using Twitter [17,18]. These authors used word clouds to present key words and phrases indicative of public sentiment on the emerging pandemic. A similar approach was adopted by Kankanamge et al. to assess disaster severity from flooding using Twitter feeds [19]. These authors found that the analysis could track disaster severity fluctuations over time and demarcate highly impacted disaster zones through message geolocation.
Twitter was selected since it is a rapidly expanding social media microblogging service, provides a free API for practitioners, and can be considered as open data compared to other social media such as Facebook and Instagram that are more restrictive [16]. These other social media services use a mix of media formats including text, audio, imagery, and video, whereas Twitter is primarily text-based enabling NLP techniques such as sentiment analysis to be applied. Furthermore, it is also easier to extract keywords from tweets than Facebook comments, most likely because of the use of hashtags, mentions, and emoticons [14].

3. Methodology, Data, and Tools for Analysis of Social Survey Data

3.1. Methodology

The general methodology followed in this paper can be summarised as:
  • Identify data sources that can be used to provide social survey data;
  • Determine and trial analysis tools on several different datasets;
  • Develop a suite of apps to analyse the datasets for sentiment;
  • Further develop an app that can access social media feeds to determine current sentiment using findings from the historic dataset analysis;
  • Host the apps on a website for customer access;
  • Compare historic sentiment results with current sentiment where possible, and thus demonstrate that this approach can provide useful results for a local city council.

3.2. Council Datasets from Social Surveys

Suitable datasets to meet the project objectives were obtained from the Australian Government’s open data portal [20]. There were few such datasets that met the requirements; however, several were identified. These comprised:
  • The CoM social indicators survey that was conducted in 2018 and involved over 1200 residents. The dataset was used to measure outcomes for social indicators such as health, wellbeing, community sense, and connectedness of its citizens. The responses are quantitative in nature and thus not suitable for NLP analysis. The dataset is available online from the CoM data portal [21].
  • The Casey Next short survey that was conducted in 2016 and a contractor report produced [22]. Over 3600 responses were collected as a combination of structured and unstructured data records that are mostly qualitative in nature. The dataset is available online from the Australian open data portal [20].
The CoM refers to the Central Business District of the City of Melbourne in the state of Victoria, Australia, while the CoC is a large, rapidly growing municipality in southern Victoria [23] with population predicted to increase to over 500,000 people by 2041. The CoC has a significant ‘smart city’ program to improve liveability outcomes arising from lack of infrastructure, lack of employment opportunities, and other socio-economic issues. The CoM dataset was analysed first. This dataset has mainly quantitative numerical data however, and it was found that it could not be used to produce a sentiment analysis.
It should be noted that the CoM and CoC datasets are less than 1 MB in size and, thus, not strictly big data. However, the Twitter archive analysed in the later part of the project falls into this category.

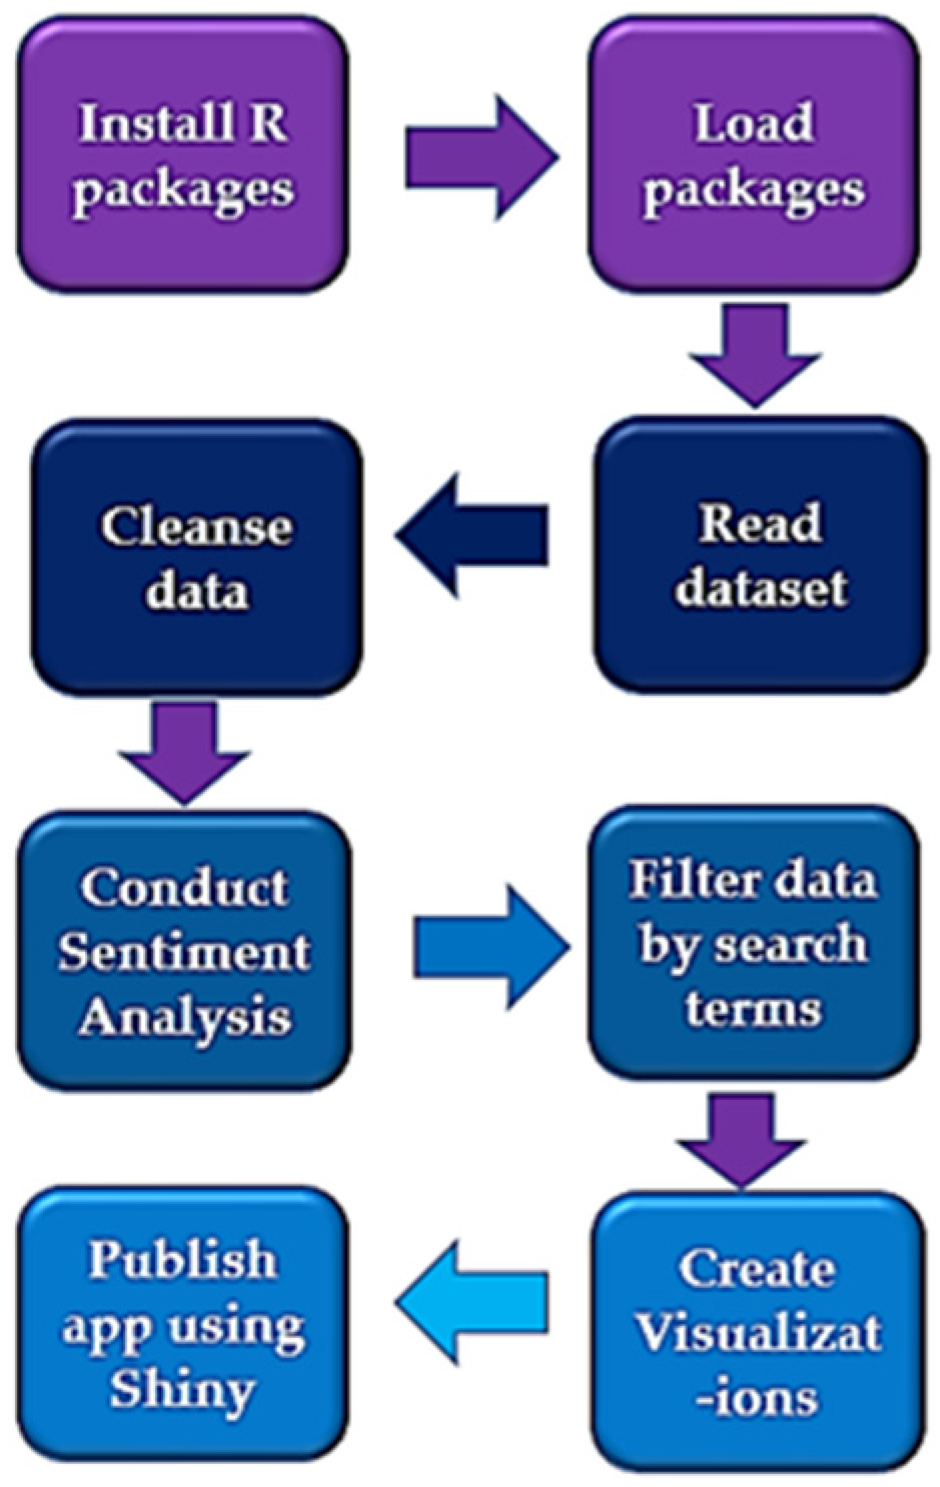
3.3. Analysis and Web Hosting Tools

For the purpose of conducting data analysis for this project, the RStudio integrated development environment (IDE) tool was selected for the following reasons: (1) RStudio is an open-source freeware system [24], which suited the requirement that the project had no allocated budget, (2) the developers assigned to this project had previous extensive experience in its use, and (3) Python scripting is also supported by RStudio. Python libraries were also used in standalone codes for analysis of the CoM dataset including Pandas, NumPy, and Scikit-learn with Matplotlib and Seaborn used for graphical output [25].
A requirement for the Twitter API solution was to obtain access to real-time data from Twitter. The rtweet R library was embedded into R code running within RStudio [26]. This library has multiple functions that can be used to query social media posts based on multiple filters and settings. Findings from the RStudio data analysis on the historic 2016 dataset were used to inform keywords for searches of current Twitter data.
The web apps were developed using R code and integrated within a Shiny package [27], and then hosted on a website using Hostinger [28]. These systems provided free service for the duration of the student project, although with limited access and security. The Shiny free plan only allowed five apps to be hosted on a single account and 25 active hours use per month [29].

4. Analysis of Data

The analysis was conducted in three parts. In the first part, the CoM dataset was analysed. In the second part, the Casey Next survey dataset was analysed using RStudio to extract sentiment values for key issues in 2016. In the third part, these findings were used to inform Twitter analysis for more current sentiment analysis. The latter two parts required the development of web apps to perform this analysis.

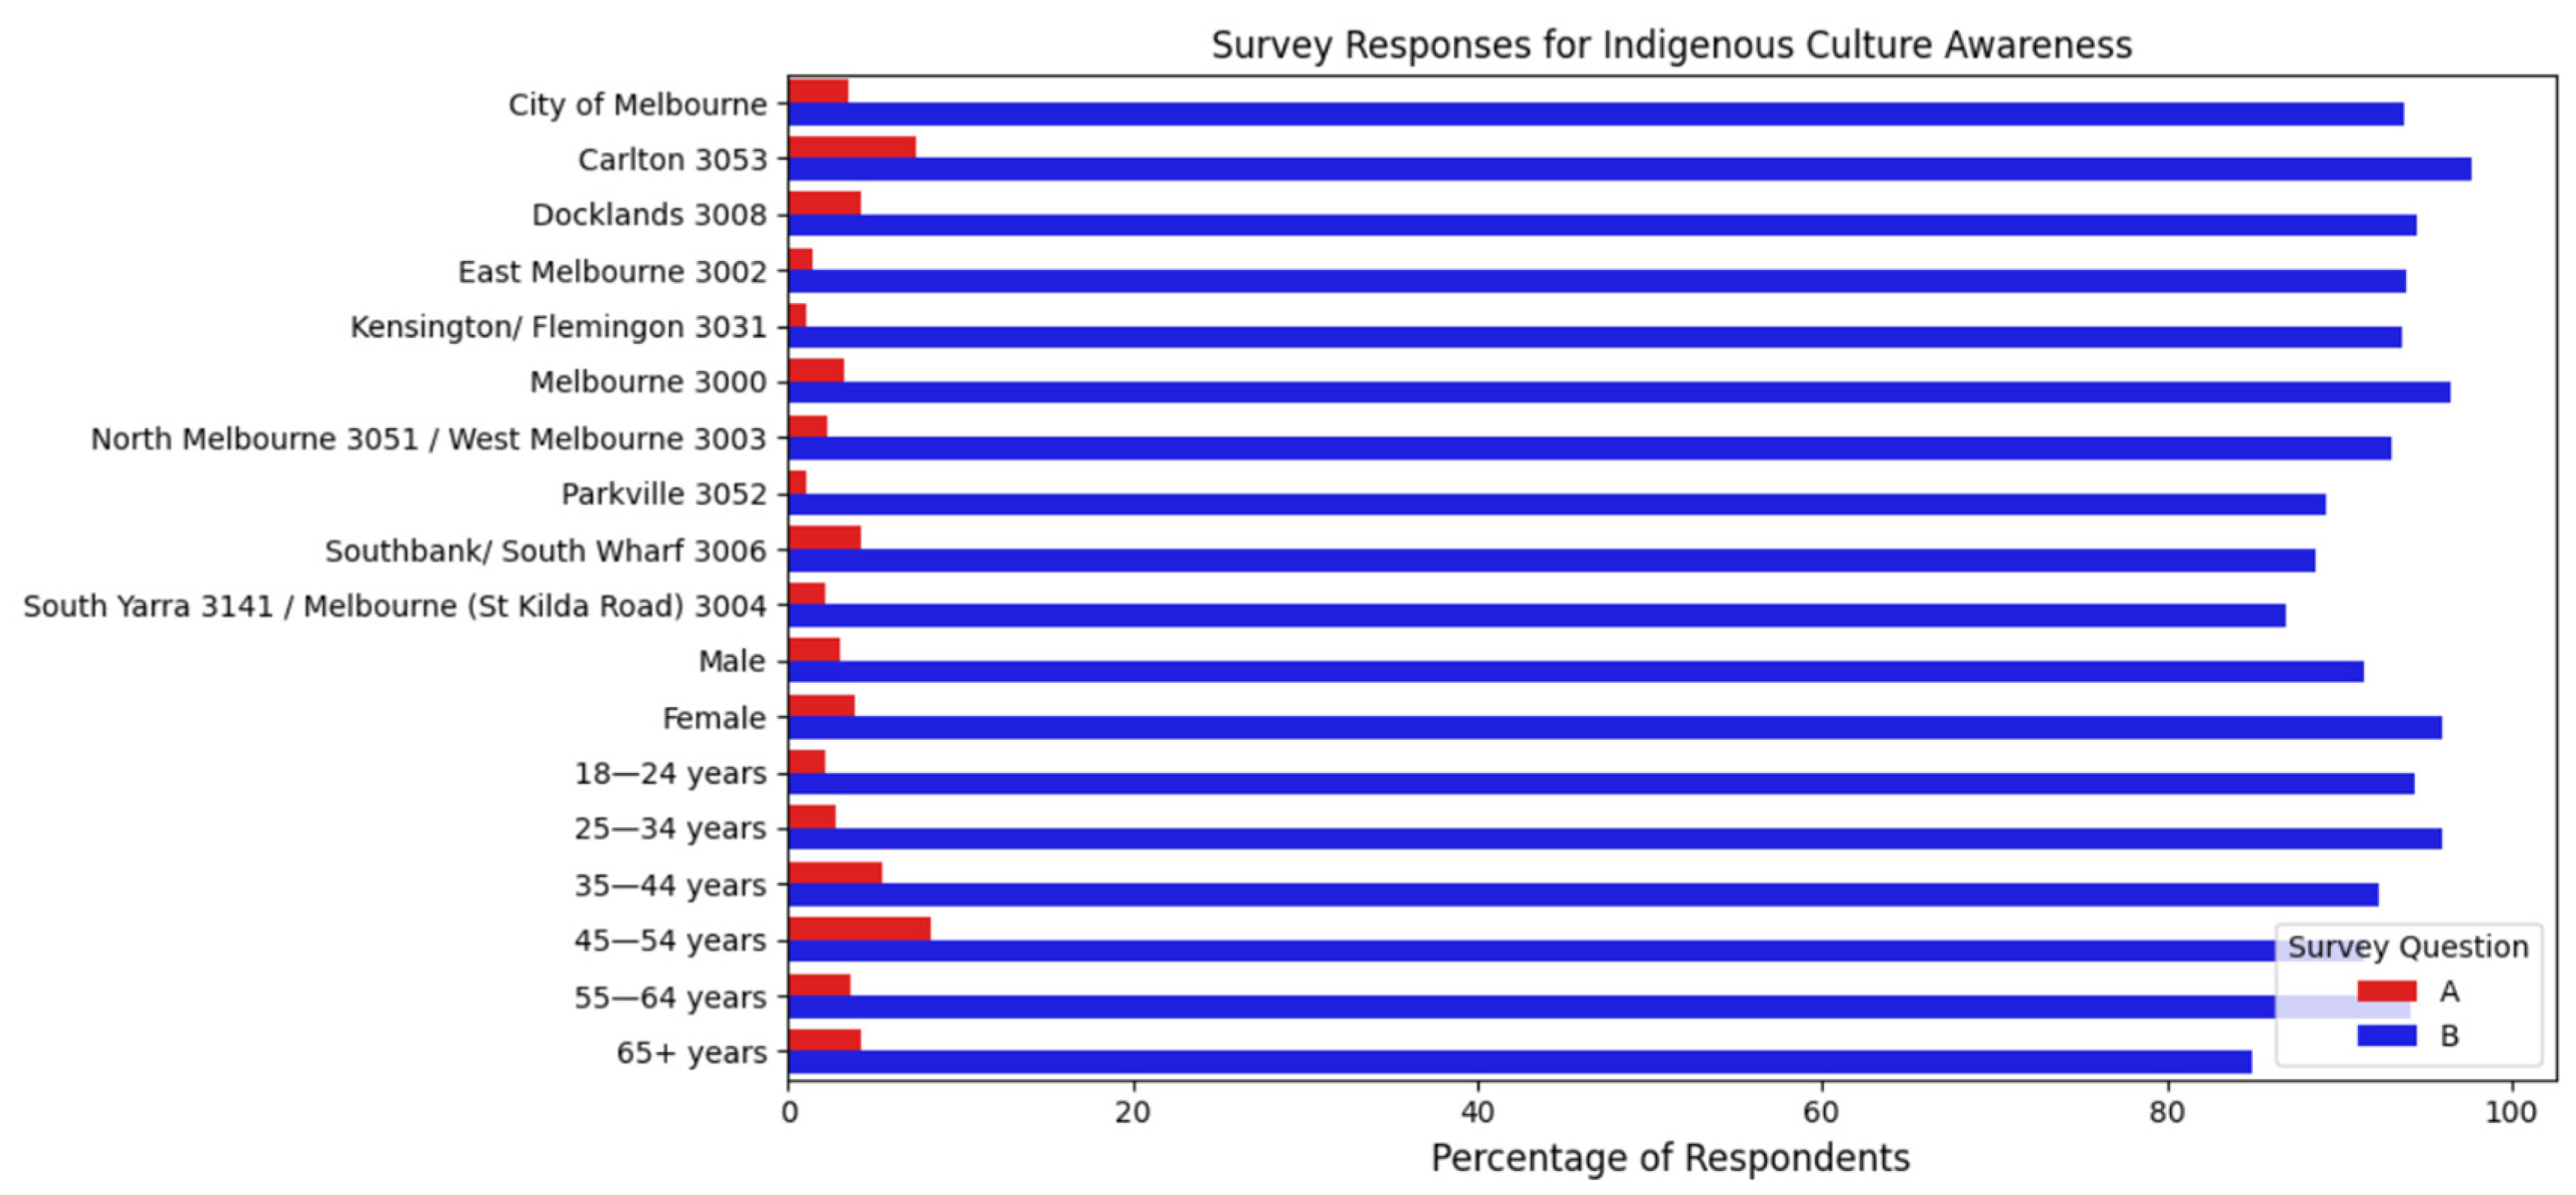
4.1. Preliminary Analysis of City of Melbourne Social Indicators Dataset

The CoM dataset was analysed first. This dataset has mainly quantitative data however, and it was determined that it could not be used to produce a sentiment analysis that needs less structured textual responses. Therefore, the dataset was not used other than for initial analysis to determine the direction of the project. Some sample analysis is shown in Figure 1 and Figure 2 below. Analysis of this dataset was performed using Python libraries that were readily applicable to the quantitative responses.
Figure 1 shows the responses for the physical activity topics. There are 18 different cohorts that include residential area, gender, and age profile. There are six questions for each of the 18 cohorts:
  • Participate in adequate physical activity.
  • Participate in sports and exercise activities.
  • Participate in sports and exercise activities in the CoM.
  • Participate in organised physical activity.
  • Participate in physical activity organised by a fitness, leisure or indoor sports centre.
  • Participate in physical activity organised by a sports club or association.
This analysis shows that CoM residents generally engage in physical activity, although there are wide fluctuations among the cohorts. Not surprisingly, the 18–24 year cohort is the most active, whereas the 65+ year cohort is the least active.
Figure 2 shows the responses to the indigenous cultural awareness question. This indicates that most are unaware of the two indigenous tribes (Wurundjeri and Boonwurrung) or at least cannot name them both. Indeed, the Wurundjeri tribe was historically more populous and has a far higher profile in the modern city than the Boonwurrung.

4.2. Analysis of Casey Next Dataset

An app was created to measure sentiment on the four questions in the Casey Next dataset and to display the results in a dynamic visualization. The app was developed using RStudio with R libraries for sentiment analysis. These questions are:
  • ‘What Kind of Place Would You Like Casey To Be In 2041?’
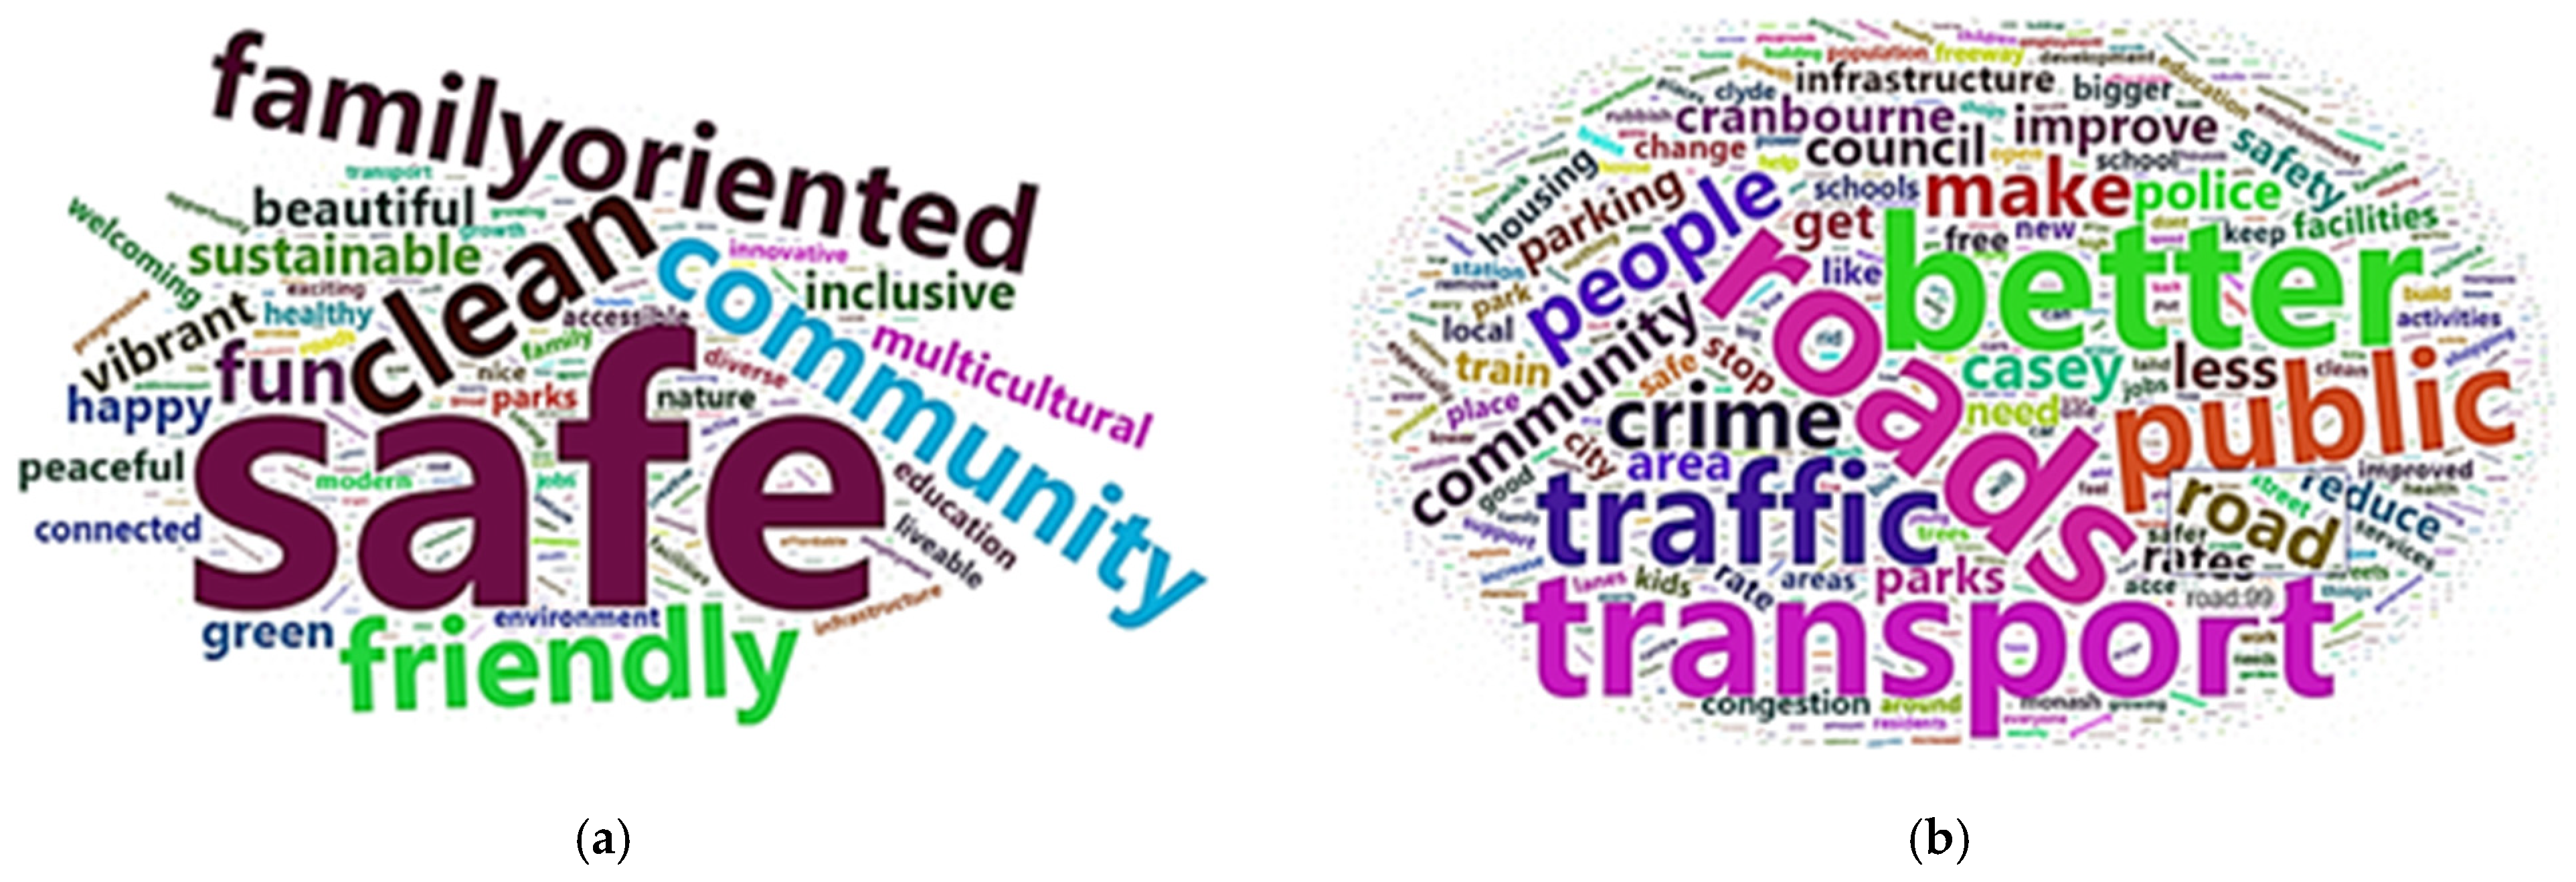
  • ‘If You Could Change One Thing In Casey What Would It Be?’
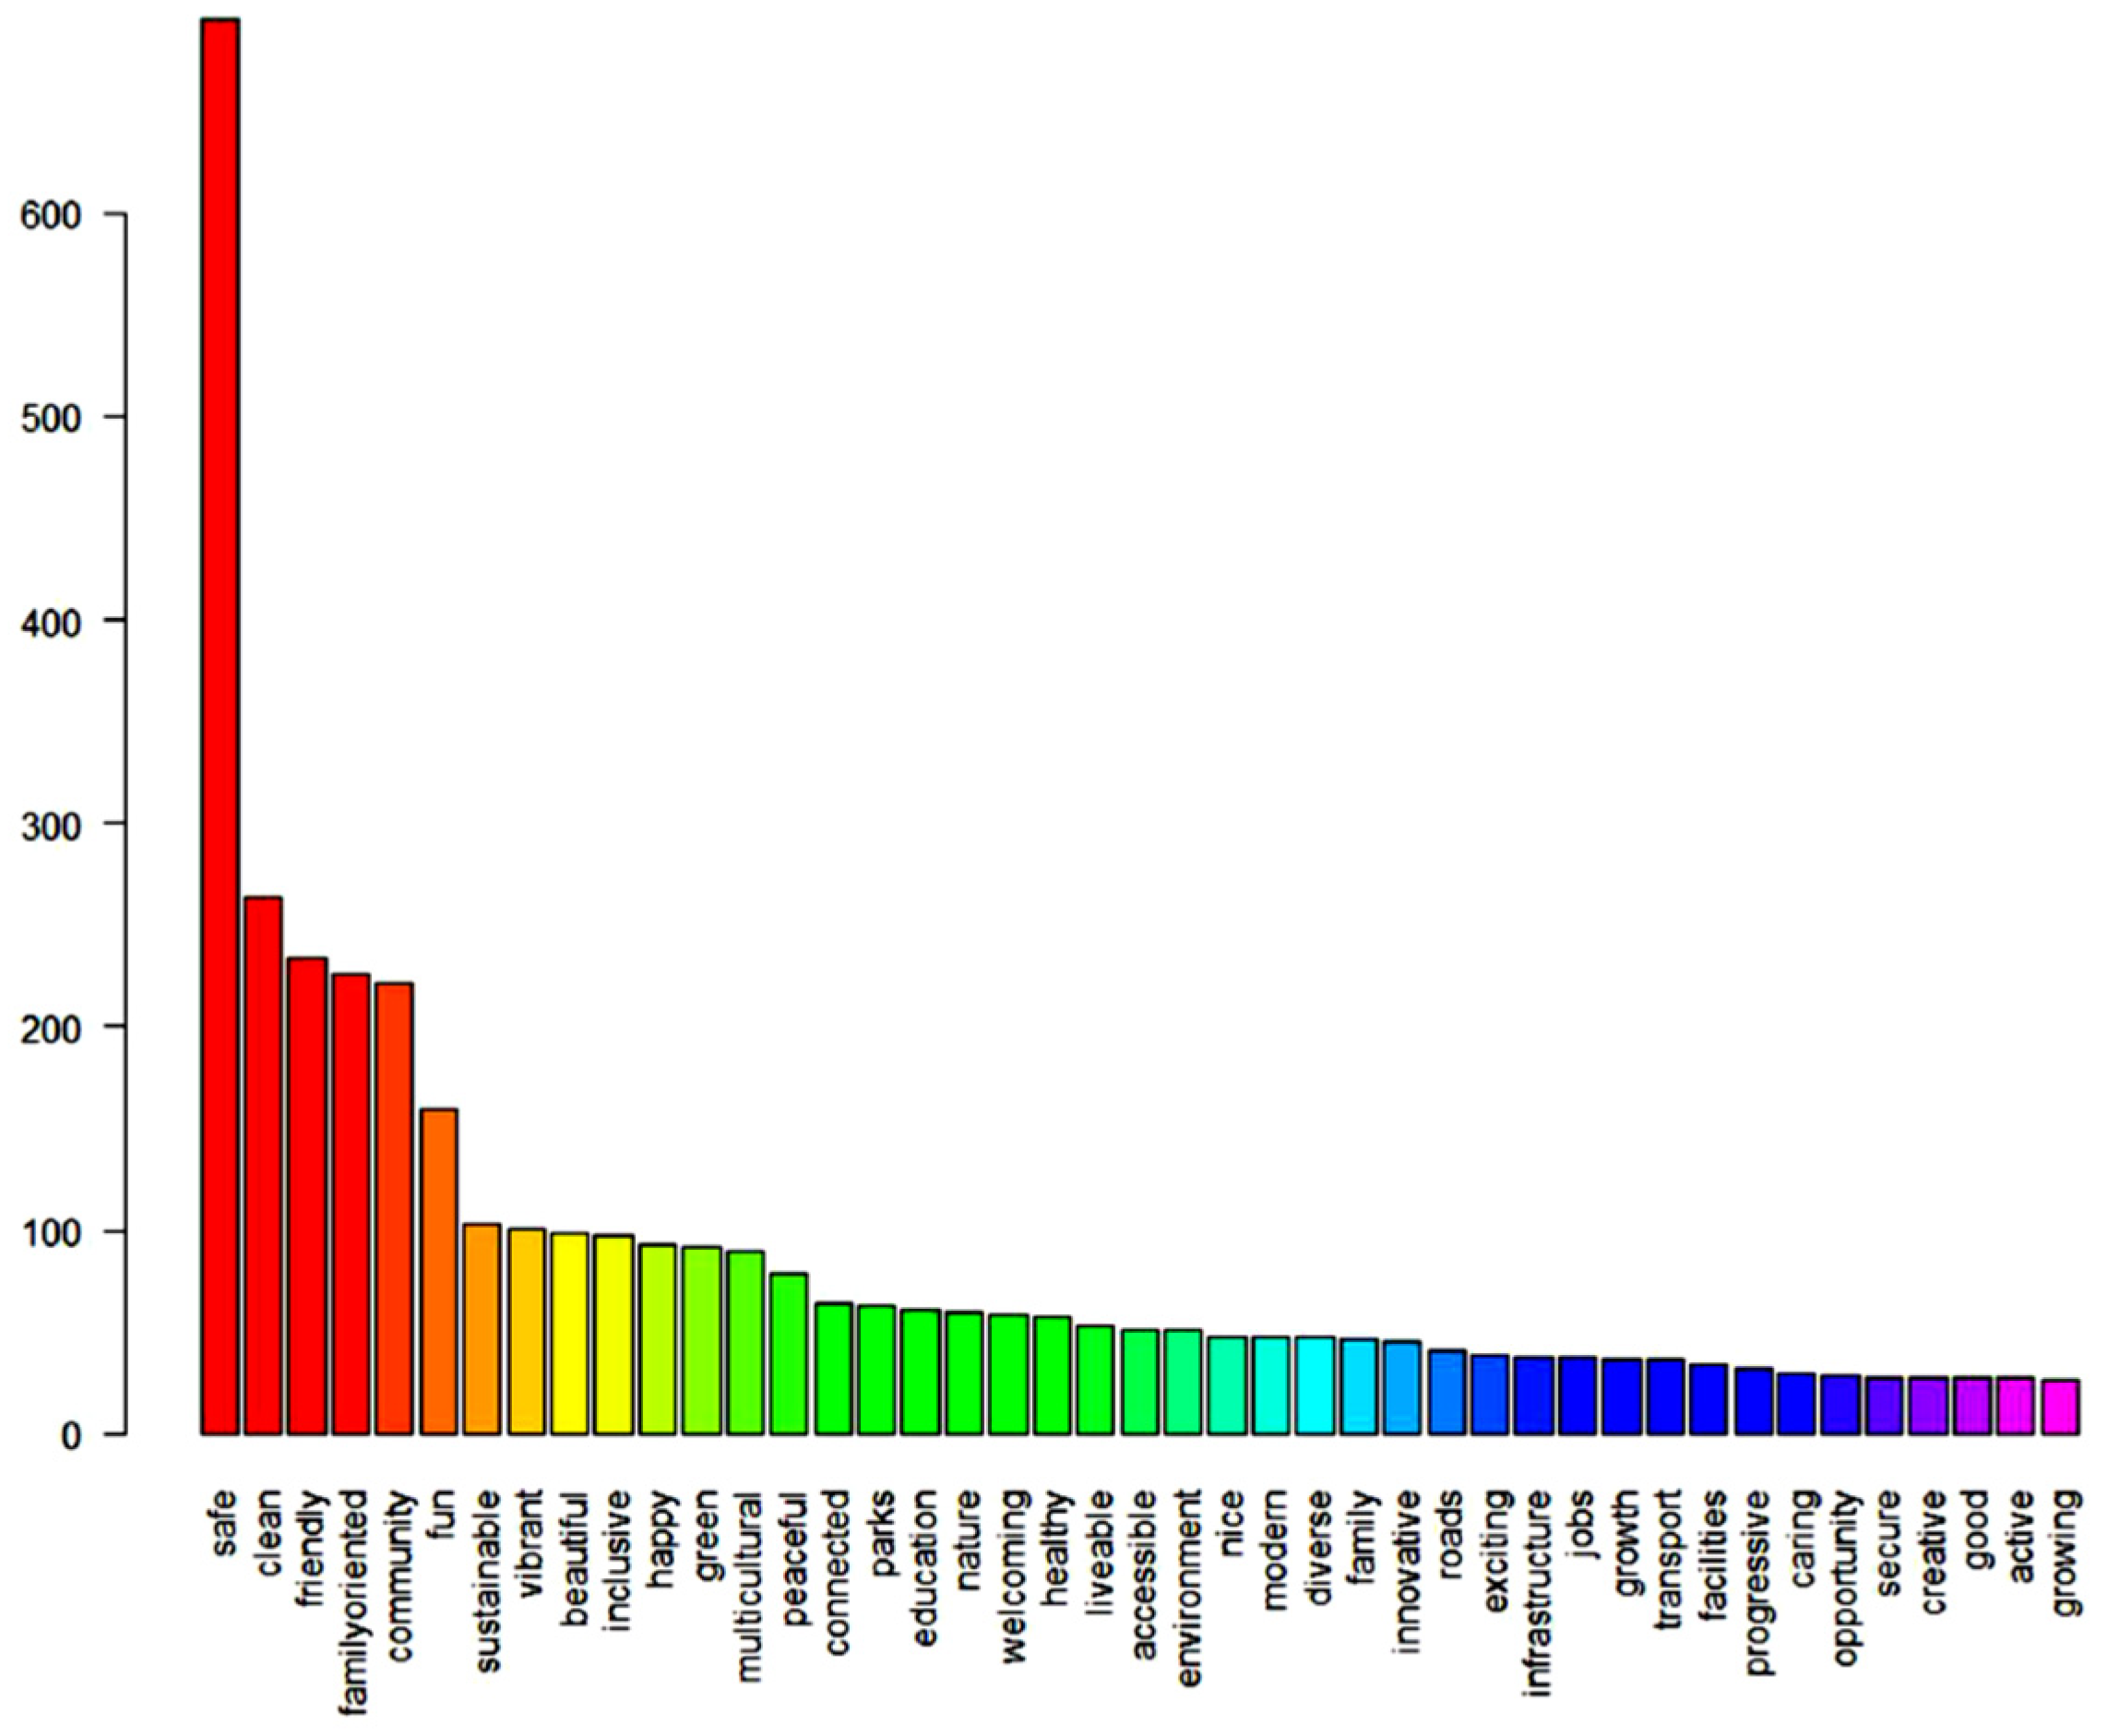
  • ‘Describe Your Vision For Casey In Three Words?’
  • ‘What’s Most Important To You?’
The app allows for sentiment scores of respondents to be graphed against postal code, ward, age, gender, and suburb. Results can also be filtered against specific search words such as ‘environment’, ‘health’, or ‘safety’ so that the user can gauge sentiment against topics such as wellbeing, crime, and affordability.
The high-level process is shown in Figure 3. The data first needed to be cleansed since there were columns with missing data. An analysis of data columns that had over 5% of the values missing satisfied the ‘missing completely at random’ (MCAR) definition. MCAR can be defined as the missing values having no relationship between the intended or observed values [30]. The pairwise approach was then applied to exclude the missing values from the analysis only when specific columns of data were being used for analysis as this method can produce fewer bias results for MCAR data.
Sentiment analysis was conducted using the Syuzhet package [9,31]. The get_sentiment() function in Syuzhet was applied to determine sentiment score for each user response to the examined data fields by finding all the lexicon words contained in each string and calculating the arithmetic sum of the component sentiment values [9]. This enables the cumulative sentiment scores to be plotted against a variety of parameters. The ggplot2 library was used to create the visualizations.
The user interface for the web app is shown as Figure 4. The user can select one of the survey questions, provide a search term and filter, and also modify the colour by selecting from a palette. A bar chart of sentiment values is then produced from the data using these input criteria.
The overall sentiment of Casey residents to the question ‘What Kind of Place Would You Like Casey To Be In 2041?’ is shown in Figure 5 as a percentage. This is overwhelmingly positive with nearly 50% reporting ‘very positive’ and less than 5% reporting negative (3.2%) or very negative responses (0.8%).
The top 25 most common words for the future vision for Casey are shown in Figure 6. This was determined using R code embedded within RStudio. The top five words are ‘safe’, ‘clean’, ‘friendly’, ‘family-oriented’, and ‘community’.
An app for viewing word clouds was also created. A word cloud is defined as ‘a computer visualization technique used in the text mining methods of documentation summarization’ [32]. Here, the R wordcloud2 package was used [33]. Sample word clouds are presented in Figure 7. A word cloud is an attractive visual representation of textual data with the importance of each word indicated by font size or colour. In the word cloud app developed, one can determine the count number of any word in the cloud by hovering a mouse over the text.
The word clouds in Figure 7 show the 25 words most commonly used for responses to the relevant questions. These word clouds can lead to actionable insights for the CoC. Figure 7a indicates that many Casey residents would like their city to be safe (694), clean (264), family-oriented (226), and friendly (234); while Figure 7b shows that the residents consider public transport (236), roads (254), and traffic (184) to be important issues. Here, the count for each keyword is included. Note that the Casey Next survey was conducted in 2016 pre-pandemic so ‘safe’ implies safe from crime or physical harm rather than safe from COVID-19 infection.
In Figure 7b the word ‘better’ is included in large font; this would have been frequently used as a qualifier for other characteristics. To further analyse this, a data dump of the ‘If you had the power to change just one thing,’ responses by the 29–38 and 39–48 age groups, filtered by the word ‘better’, showed that many of the responses containing this word also contain words such as ‘transport’, ‘roads’, ‘traffic’, ‘infrastructure’, and ‘public transport’.
Word clouds were also generated for the other two survey questions. Question 1 (‘What Kind of Place Would You Like Casey To Be In 2041?’) highlighted ‘safe’, ‘place’, ‘community’, and ‘friendly’, while question 4 (‘What’s Most Important To You?’) highlighted ‘people’, ‘environment’, ‘connecting’, ‘transport’, and ‘improving’. These word clouds show that the CoC needs to take action to enhance its residents’ safety and transport options, particularly with better traffic management and improved roads and public transport.
The two web apps described here were integrated within Shiny [27] and hosted on a website using Hostinger [28].

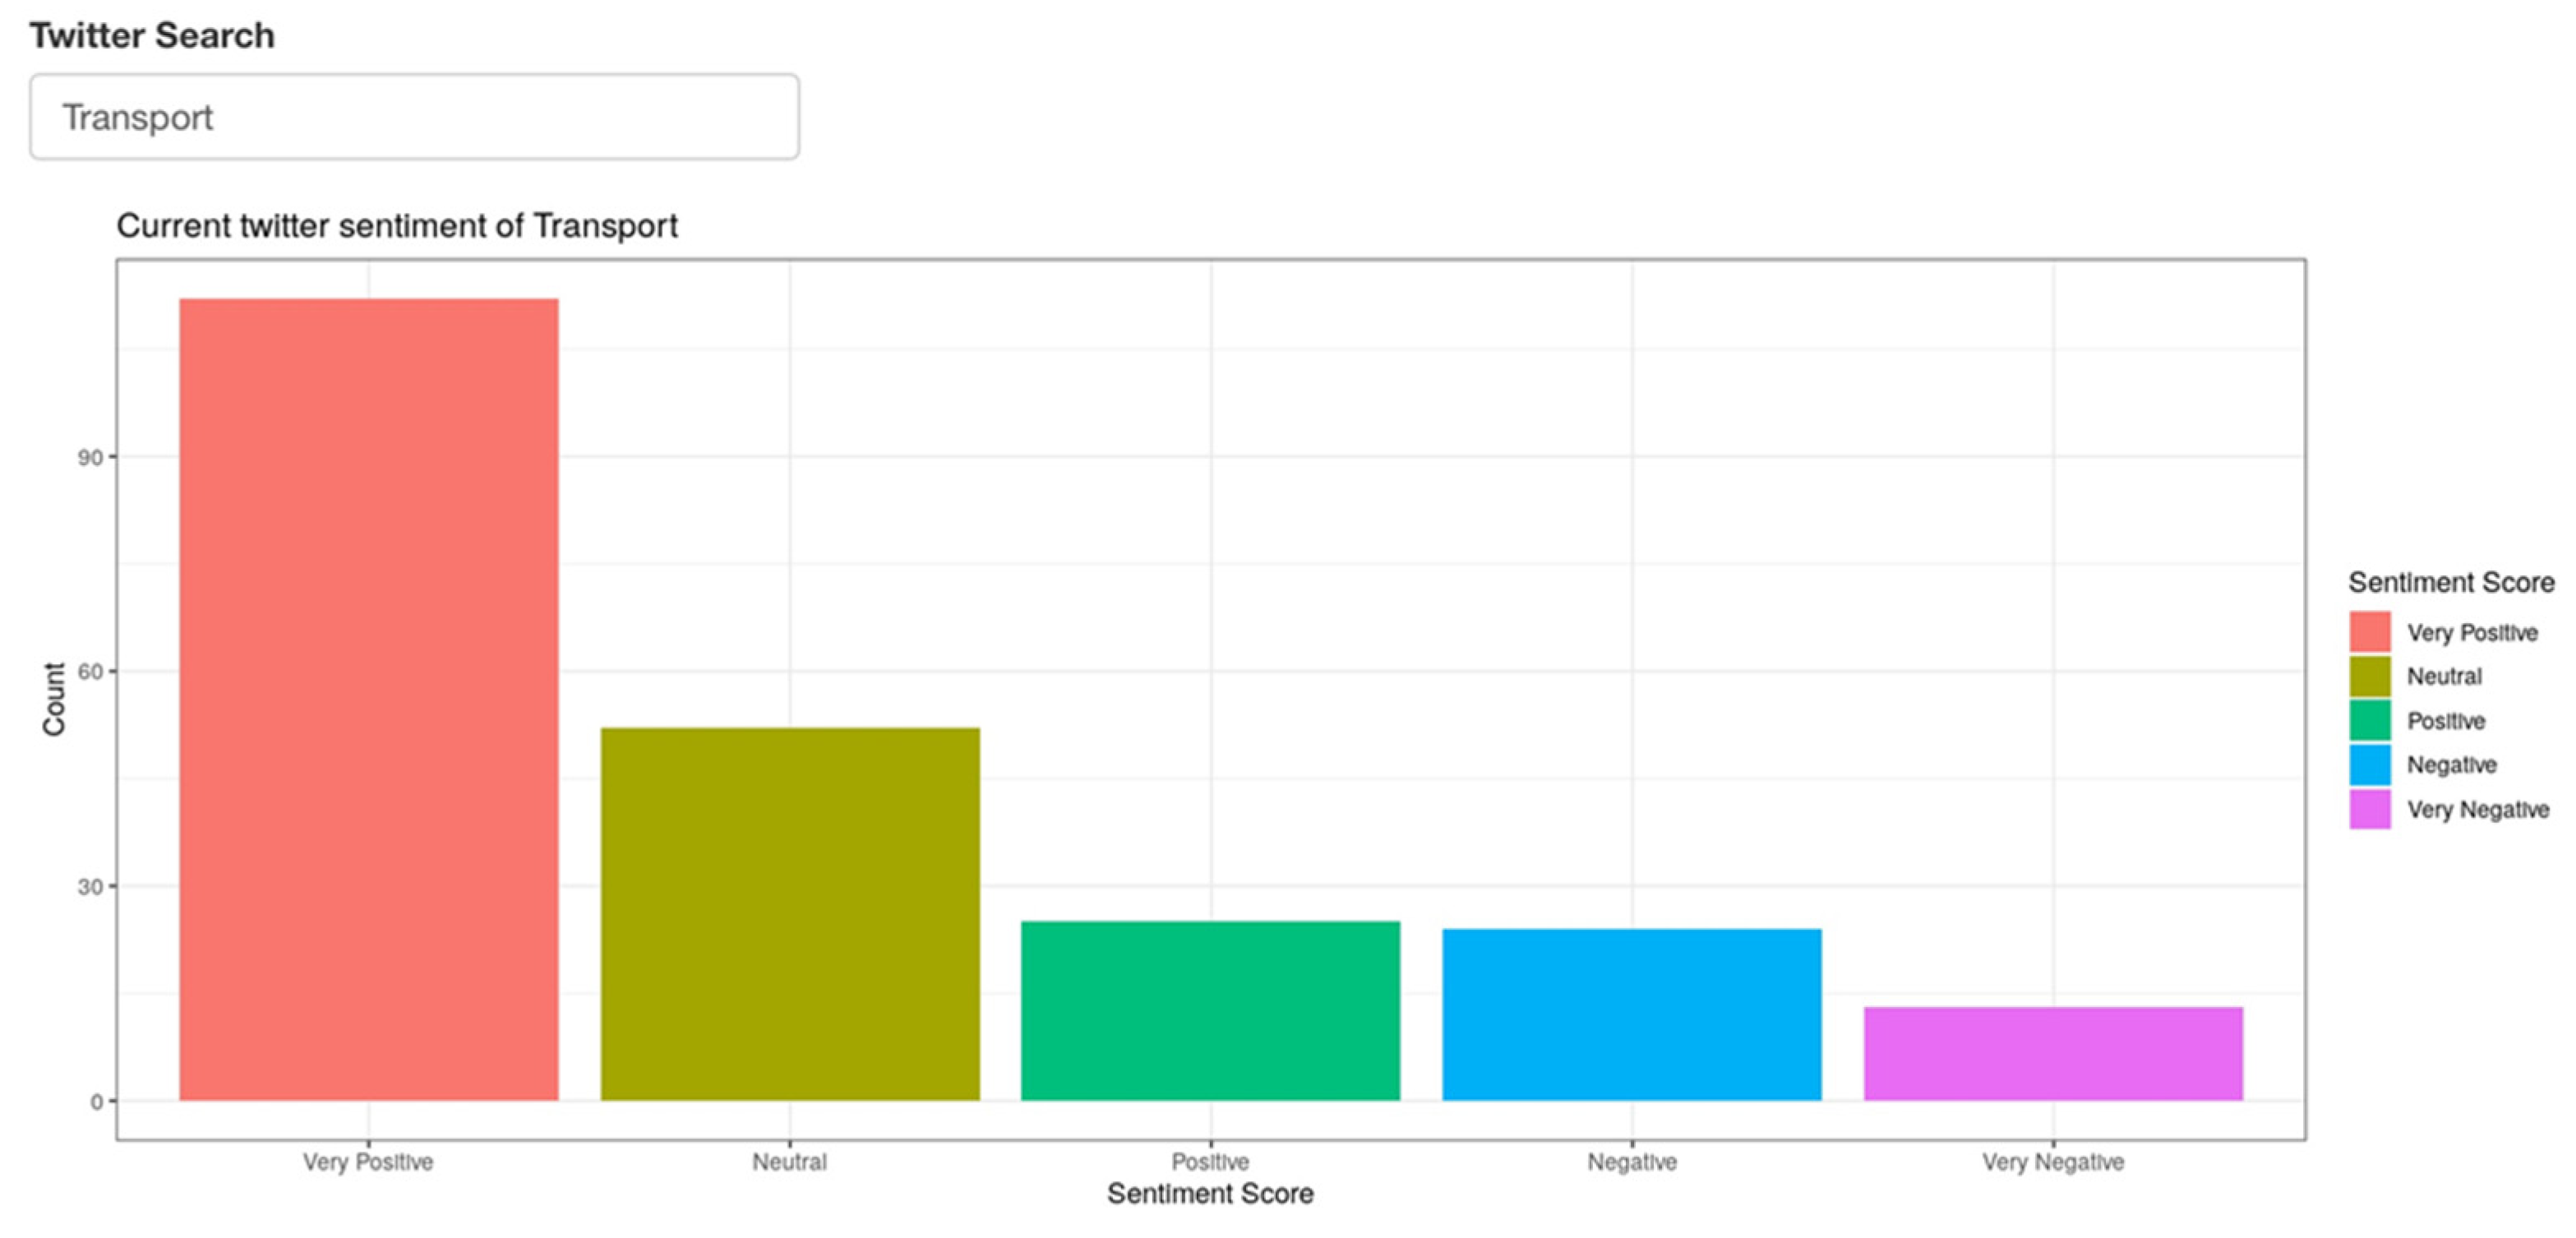
4.3. Analysis Using Social Media

The Casey Next survey analysis provided an initial understanding of the type of information the CoC was interested in. This analysis enabled the identification of keywords common among survey respondents. These keywords formed the basis for the Twitter investigation. A Twitter API was created and embedded within RStudio. Tweets can contain many different types of data, such as information relating to news, media, retweets, or replies to posts, and these can be formatted as text, imagery, video, or audio. Here, much of these data were filtered to target only tweets that did not contain media or news. Tweets were also targeted by geolocation to ensure they originated within the CoC. Tweets that contained links to other web pages were excluded from the analysis.
The RSentiment library was employed for analysis [34]. This has multiple functions that can be applied to determine the sentiment of sentences from Twitter. The tool assigns the data into six categories from very positive (1) to sarcastic (6). The sentiment values are presented as a bar chart.
Once the accuracy was verified and Twitter analysis optimised in RStudio for the CoC tweets, an interactive visualization was developed to enable a user to input search words into a web form. Again, Shiny enabled the translation of plots and other code into HTML format [27]. This allowed publication of the application and hosting online by embedding the code into a web page for clients to use to obtain a pulse check on the city, depending on the topic(s) of interest. Due to restrictions and limitations in terms of publishing findings from the Twitter data, the web app was embedded within a website hosted with Hostinger to secure and restrict access only to the approved audiences of the findings [28].
The Twitter API was customised to collect data from tweets posted within a 25 km radius of the centre of the CoC and for specific phrases containing keywords such as ‘transport’, ‘COVID’, and ‘jobs’. Data from the past 6–9 days were used for the analysis. A high-level overview of the Twitter app development process is shown in Figure 8.
A key requirement is data cleansing. The approach adopted here was to filter out much of the data that were not relevant to the analysis and to target posts that did not contain media or news. Original posts were used since the context could not be understood from replies, retweets, or news. Tweets that contained links to other web pages were also excluded since they could not be contextualised as relating to the city and often contained news or advertisements. This was achieved by filtering tweets that contained the strings ‘news’ or ‘https’. To target tweets that commented on the CoC, the filter for geolocation code was employed to ensure that only tweets from the CoC were examined and analysed.
The RSentiment library was initially used for sentiment analysis. This tool categorises the tweet data into five ranges from Very Positive to Very Negative. The ‘tidytext’ library was used [35] with several other lexicons that are effectively databases of words that can be used to measure sentiment. However, only minor differences were found for sentiment values with the four different lexicons.
The web app interface is shown in Figure 9. The ggplot2 library was used to draw the bar charts.
Note that the graphs below were redrawn from the raw output, such as that shown in Figure 9, so that the sentiment values range from Very Positive to Very Negative and are given as percentages. The web app plots the sentiment values in order of size.
Figure 10 shows the current overall sentiment of CoC (as of October 2021) with a filter that includes transport, safety, community, parks, roads, infrastructure, and health. This is achieved by entering the string ‘transport safety community parks roads infrastructure’ as the search input. This shows that CoC residents are generally optimistic about their city with the majority expressing positive sentiment (very positive 50% and positive 12%), while only about 22% report negative or very negative sentiment. This can be compared with the findings in Figure 5 for expectations of Casey in 2041. The greater negative responses in 2021 compared with 2016 may be attributable to the COVID-19 pandemic.
Figure 11 shows Twitter analysis of sentiment as a percentage for single topics of COVID and jobs, respectively. Figure 11a shows a mixed response to residents’ views of the CoC’s measures to contain the pandemic, while Figure 11b shows that the majority of CoC residents believe that the council is generally addressing the employment issue adequately (62% positive or very positive compared with only 23% negative or very negative). It should be noted that the Twitter app is still in an experimental configuration and needs further refinement.
A further caveat on the use of Twitter is that only a fraction of the population uses it (less than 25% in Australia [36]), and most of those lean strongly to the progressive side of politics [37]. This would help explain the low numbers of relevant tweets for specific topics and would also skew the results of any Twitter analysis.

5. Discussion

Full details of both the methodology applied and the results are provided in the Swinburne University student report [38]. The website could be applied to provide regular monthly ‘pulse check’ updates to councils by using the Twitter API. The pulse check can serve as a useful social indicator tool to measure the immediate sentiment of residents on specific issues that may relate to health and wellbeing or other areas of interest for the council.
The analysis of the 2016 dataset has led to several actionable insights for the CoC. The results suggest that the CoC should:
  • consider safety, cleanliness, and family friendliness as its top priorities;
  • invest further in the environment providing more parks and green spaces;
  • improve transport options for their residents;
  • address health and safety issues.
Extensions for the web apps include:
  • expanding on the Twitter query function, which currently only takes tweets from the last 6–9 days and improving the geolocation of tweets;
  • studying how sentiment changes over time;
  • improving the accuracy of the sentiment analysis performed;
  • building drill-down capabilities into the visualizations to promote better analysis;
  • creating additional visualizations using RStudio to derive clearer insights from Twitter;
  • analysing the upcoming Casey Next survey data due to be released at the end of 2021 to compare against the findings based on the 2016 survey data.
A comparison of sentiment from the survey data with current estimates from the Twitter app showed some correlation. However, the Twitter sentiment estimates should be treated with caution. It is unclear as to whether sentiment changes are due to analysis errors, insufficient statistics, or external influences such as the COVID-19 pandemic. Further refinement of this tool is required to improve the accuracy and reliability of sentiment values from social media.

6. Conclusions

Big data analytics was applied to several local council datasets in Australia. The CoM Social Indicators survey dataset was analysed using quantitative analysis techniques, while sentiment analysis was performed for the Casey Next dataset from the CoC, a local government area in the state of Victoria, Australia. This comprised the analysis of a social survey conducted in 2016 and also the development of a web app able to evaluate sentiment from current social media feeds. While primarily a student project, this investigation has revealed valuable insights that can be exploited by a local city council. The sentiment analysis web APIs serve as a basis for future opportunities with other local councils that are engaged in surveying their citizens for opinions on critical issues. The techniques described here can readily be applied elsewhere.
The use of social media to determine sentiment is in its early stages but shows promise as a means of quickly assessing community opinion on critical or controversial issues. Future work could comprise refinement of the social media app and comparisons of its predictions with recent social surveys.

Author Contributions

Conceptualization, M.R., L.N., K.T., P.J.R. and R.B.W.; data curation, M.L., A.W. and K.T.; formal analysis, M.L., A.W. and K.T.; investigation, M.R., P.J.R. and R.B.W.; methodology, M.L., A.W. and M.R.; project administration, M.R.; software, M.L. and A.W.; supervision, P.J.R. and R.B.W.; validation, L.N.; visualization, M.L., A.W., M.R., L.N. and P.J.R.; writing—original draft, P.J.R.; writing—review and editing, P.J.R. and R.B.W. All authors have read and agreed to the published version of the manuscript.

Funding

This research received no external funding.

Institutional Review Board Statement

Ethical review and approval were not applicable for this study.

Informed Consent Statement

Consent to access Twitter data was provided by registering for a Twitter Developer account and adhering to the developer agreement and policy; https://developer.twitter.com/en/developer-terms/agreement-and-policy (accessed on 10 November 2021).

Data Availability Statement

The datasets analysed were published on the Australian Government Open Data repository: https://data.gov.au (accessed on 10 November 2021).

Acknowledgments

The project was carried out by a team of students from Swinburne University of Technology for the sponsor Ryan Watson Consulting Pty Ltd. The authors wish to acknowledge support from the University of Melbourne research library (RBW). They are grateful to the anonymous JSAN reviewers for their helpful comments on improving the project.

Conflicts of Interest

The authors declare no conflict of interest.

References

  1. Al Nuaimi, E.; Al Neyadi, H.; Mohamed, N.; Al-Jaroodi, J. Applications of big data to smart cities. J. Internet Serv. Appl. 2015, 6, 1–15. [Google Scholar] [CrossRef] [Green Version]
  2. Mergel, I.; Rethemeyer, R.K.; Isett, K. Big data in public affairs. Public Adm. Rev. 2016, 76, 928–937. [Google Scholar] [CrossRef] [Green Version]
  3. Mohanty, S.P.; Choppali Uand Kougianos, E. Everything you wanted to know about smart cities: The Internet of things is the backbone. IEEE Consum. Electron. Mag. 2016, 5, 60–70. [Google Scholar] [CrossRef]
  4. Ryan Watson Consulting Pty Ltd: Consultancy Service for Smart Cities. Available online: https://www.ryanwatsonconsulting.com.au/ (accessed on 10 November 2021).
  5. Buskirk, T.; Kirchner, A.; Eck, A.; Signorino, C. An Introduction to Machine Learning Methods for Survey Researchers. Surv. Pract. 2018, 11, 1–10. [Google Scholar] [CrossRef] [Green Version]
  6. Ramirez, C.M.; Abrajano, M.A.; Alvarez, R.M. Using Machine Learning to Uncover Hidden Heterogeneities in Survey Data. Sci. Rep. 2019, 9, 16061. [Google Scholar] [CrossRef] [PubMed] [Green Version]
  7. Li, J.; Hovy, E. Reflections on sentiment/opinion analysis. In A Practical Guide to Sentiment Analysis; Springer: Berlin/Heidelberg, Germany, 2017; pp. 41–59. [Google Scholar]
  8. Khan, J.; Jeong, B.S.; Lee, Y.K.; Alam, A. Sentiment analysis at sentence level for heterogeneous datasets. In Proceedings of the Sixth International Conference on Emerging Databases: Technologies, Applications, and Theory, Jeju Island, Korea, 17–19 October 2016; Association for Computing Machinery: New York, NY, USA, 2016; pp. 159–163. [Google Scholar]
  9. Naldi, M. A review of sentiment computation methods with R packages. arXiv Prepr. 2019, arXiv:1901.08319 2019. Available online: https://arxiv.org/pdf/1901.08319.pdf (accessed on 2 June 2021).
  10. Mohey El-Din, D. Enhancement Bag-of-Words Model for Solving the Challenges of Sentiment Analysis. Int. J. Adv. Comput. Sci. Appl. 2016, 7, 244–252. [Google Scholar] [CrossRef] [Green Version]
  11. Jurek, A.; Mulvenna, M.D.; Bi, Y. Improved lexicon-based sentiment analysis for social media analytics. Secur. Inform. 2015, 4, 9. [Google Scholar] [CrossRef] [Green Version]
  12. Peng, S.; Yu, S.; Mueller, P. Social networking big data: Opportunities, solutions, and challenges. Future Gener. Comput. Syst. 2018, 86, 1456–1458. [Google Scholar] [CrossRef]
  13. Stastita Research Department. Social Media-Statistics & Facts. 2021. Available online: https://www.statista.com/topics/1164/social-networks/ (accessed on 3 January 2022).
  14. Tsapatsoulis, N.; Djouvas, C. Opinion Mining from Social Media Short Texts: Does Collective Intelligence Beat Deep Learning? Front. Robot. AI 2018, 5, 138. [Google Scholar] [CrossRef] [PubMed] [Green Version]
  15. Shah, S.; Kumar, K.; Sarvananguru, R. Sentimental Analysis of Twitter Data using Classifier Algorithms. Int. J. Electr. Comput. Eng. (IJECE) 2016, 6, 357–366. [Google Scholar] [CrossRef]
  16. Yigitcanlar, T.; Kankanamge, N.; Vella, K. How Are Smart City Concepts and Technologies Perceived and Utilized? A Systematic Geo-Twitter Analysis of Smart Cities in Australia? J. Urban Technol. 2021, 28, 135–154. [Google Scholar] [CrossRef]
  17. Sv, P.; Ittamalla, D.R. An analysis of attitude of general public toward COVID-19 crises–sentimental analysis and a topic modeling study. Inf. Discov. Deliv. 2021; ahead-of-print. [Google Scholar] [CrossRef]
  18. Boon-Itt, S.; Skunkan, Y. Public Perception of the COVID-19 Pandemic on Twitter: Sentiment Analysis and Topic Modeling Study. JMIR Public Health Surveill. 2020, 6, e21978. [Google Scholar] [CrossRef] [PubMed]
  19. Kankanamge, N.; Yigitcanlar, T.; Goonetilleke, A.; Kamruzzaman, M. Determining disaster severity through social media analysis: Testing the methodology with South East Queensland Flood tweets. Int. J. Disaster Risk Reduct. 2019, 42, 101360. [Google Scholar] [CrossRef]
  20. Government of Australia. Australian Government Open Data Portal. Available online: https://data.gov.au/ (accessed on 10 November 2021).
  21. City of Melbourne. Social Indicators for City of Melbourne Residents. 2018. Available online: https://data.melbourne.vic.gov.au/People/Social-Indicators-for-City-of-Melbourne-Residents-/n9ie-cp6t (accessed on 10 November 2021).
  22. Capire. Casey Next. 2017. Available online: https://capire.com.au/projects/public-policy/casey-next/ (accessed on 2 June 2021).
  23. City of Casey. Managing Our Growth. Available online: https://www.casey.vic.gov.au/managing-our-growth (accessed on 4 June 2021).
  24. RStudio: Open Source & Professional Software for Data Science Teams. 2020. Available online: https://rstudio.com (accessed on 10 November 2021).
  25. Brownlee, J. How to Make Predictions with Scikit-Learn. 2018. Available online: https://machinelearningmastery.com/make-predictions-scikit-learn/ (accessed on 10 November 2021).
  26. Kearney, M.W. R: Collecting and Analyzing Twitter Data. 2018. Available online: https://mkearney.github.io/nicar_tworkshop (accessed on 10 November 2021).
  27. Shiny. Available online: https://shiny.rstudio.com/ (accessed on 10 November 2021).
  28. Hostinger. Available online: https://www.hostinger.com/ (accessed on 10 November 2021).
  29. Pylvainen, I. What Are the Limits of the Shinyapps.io Free Plan? 2020. Available online: https://support.rstudio.com/hc/en-us/articles/217592947-What-are-the-limits-of-the-shinyapps-io-Free-plan- (accessed on 4 June 2021).
  30. Kang, H. The prevention and handling of the missing data. Korean J. Anesthesiol. 2013, 64, 402–406. [Google Scholar] [CrossRef] [PubMed]
  31. RDocumentation. Syuzhet. Available online: https://www.rdocumentation.org/packages/syuzhet/versions/1.0.6 (accessed on 5 June 2021).
  32. Rajan, V.M.; Ramanujan, A. Architecture of a Semantic WordCloud Visualization. In Second International Conference on Networks and Advances in Computational Technologies; Springer: Berlin/Heidelberg, Germany, 2021; pp. 95–106. [Google Scholar]
  33. Holtz, Y. The Wordcloud2 Library. 2018. Available online: https://www.r-graph-gallery.com/196-the-wordcloud2-library.html (accessed on 10 November 2021).
  34. Bose, S. RSentiment. 2018. Available online: https://www.rdocumentation.org/packages/RSentiment/versions/2.2.2 (accessed on 21 September 2021).
  35. Silge, J.; Robinson, D. Introduction to Tidytext. 2021. Available online: https://cran.r-project.org/web/packages/tidytext/vignettes/tidytext.html (accessed on 10 November 2021).
  36. Correll, D. Social Media Statistics Australia–September 2021. Available online: https://www.socialmedianews.com.au/social-media-statistics-australia-september-2021/ (accessed on 19 November 2021).
  37. Ferenstein, G. Twitter Is a Mainstream Liberal, but a Conservative Wonk. 2013. Available online: https://techcrunch.com/2013/03/05/pew-twitter-is-a-mainstream-liberal-but-a-conservative-wonk/ (accessed on 21 September 2021).
  38. Wahby, A.; Tibble, K.; Nitikin, L.; Lepelaar, M.; Rossouw, M. City of Casey Sentiment Analysis and Web APIs. In Student Report for Client; Swinburne University of Technology: Melbourne, Australia, 2021. [Google Scholar]
Figure 1. Responses for the 6 different subtopics within ‘Physical Activity’ from each surveyed cohort.
Jsan 11 00007 g001
Figure 2. Fractions of respondents from each surveyed cohort who (1) could identify both traditional indigenous tribes in the City of Melbourne, and (2) rated the relationship between Aboriginal and Torres Strait Islander people and other Australians as very important.
Jsan 11 00007 g002
Figure 3. Sentiment analysis web app creation process flow.
Jsan 11 00007 g003
Figure 4. User interface for sentiment web app.
Jsan 11 00007 g004
Figure 5. Global sentiment analysis based on responses to ‘What kind of place would you like Casey to be in 2041?’.
Jsan 11 00007 g005
Figure 6. Frequency of top 25 words found from the question ‘What three words would you use to describe your Vision for the City of Casey in 2041?’.
Jsan 11 00007 g006
Figure 7. Word clouds for (a) ‘What three words would you use to describe your Vision for the CoC?’ and (b) ‘If you had the power to change just one thing in the CoC what would it be?’.
Jsan 11 00007 g007
Figure 8. Twitter Web API Development Process Flow.
Jsan 11 00007 g008
Figure 9. Twitter web app user interface.
Jsan 11 00007 g009
Figure 10. Global sentiment from Twitter feeds.
Jsan 11 00007 g010
Figure 11. Sentiment analysis for single keywords (a) ‘COVID’ and (b) ‘Jobs’.
Jsan 11 00007 g011
Publisher’s Note: MDPI stays neutral with regard to jurisdictional claims in published maps and institutional affiliations.

