
Uncoupled Wi-Fi Body CoM Acceleration for the Analysis of Lightweight Glass Slabs under Random Walks


Abstract
:1. Introduction
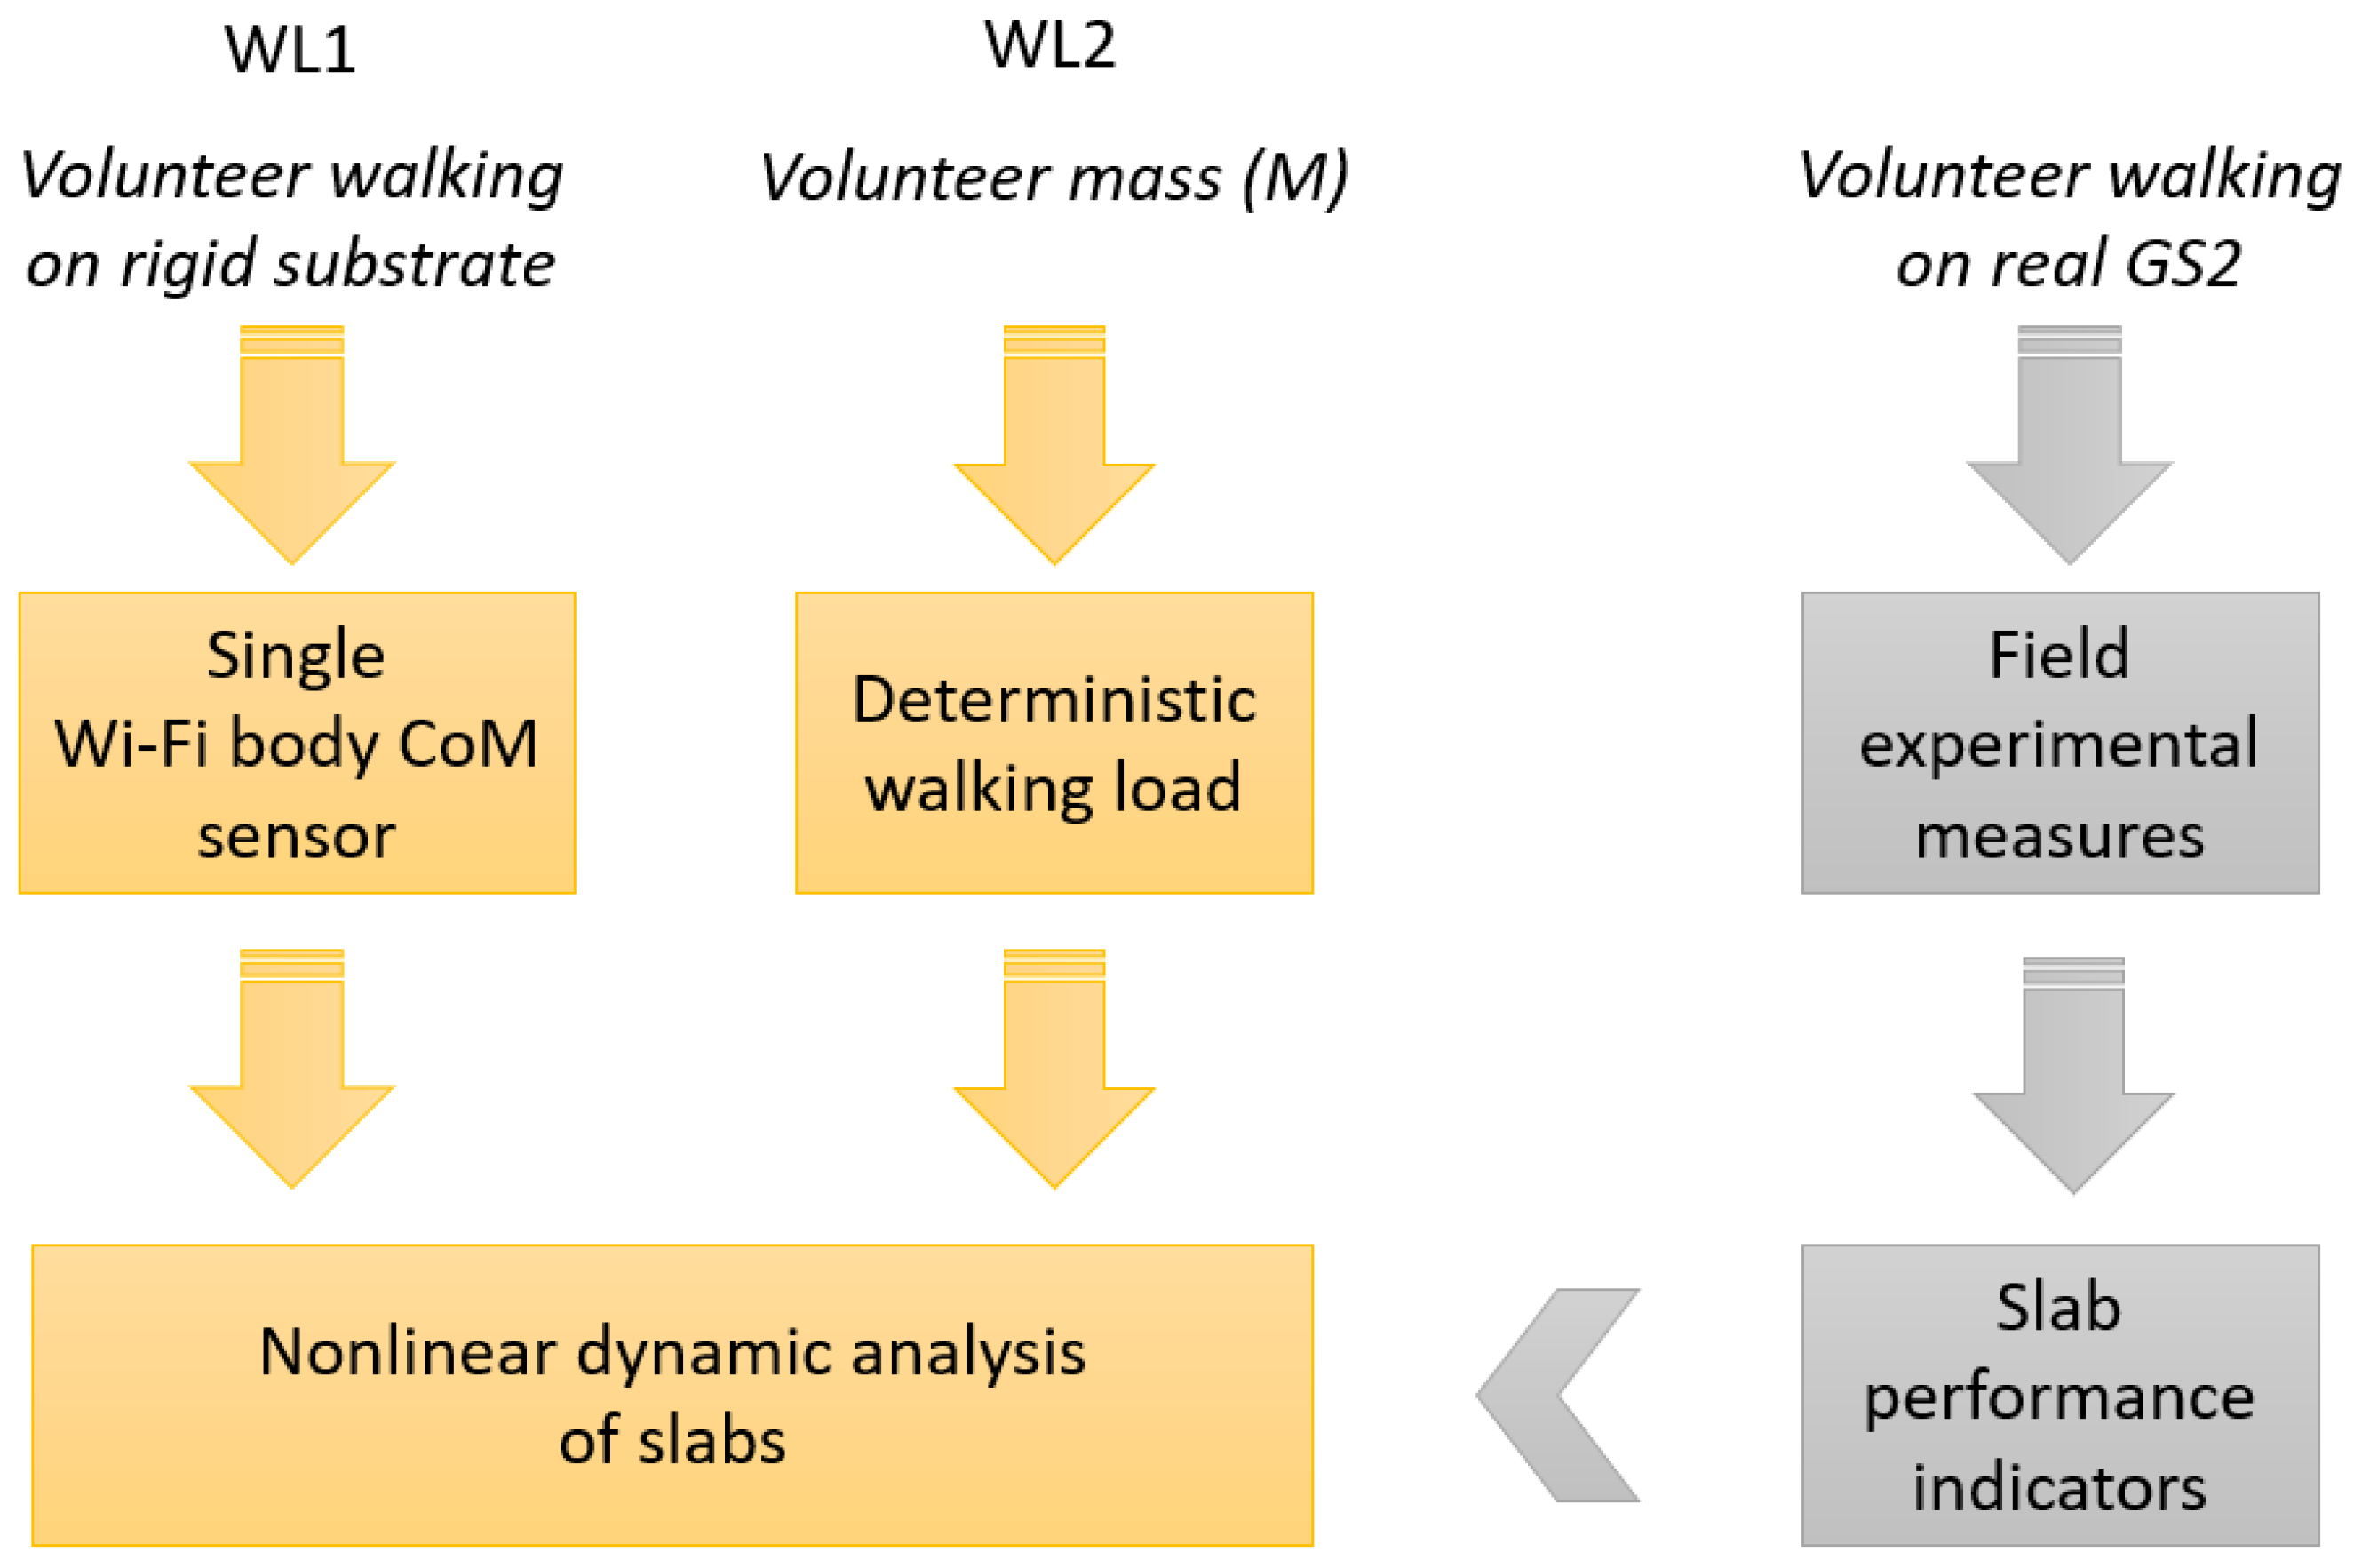
2. Research Methods
3. Description of Walk-Induced Effects
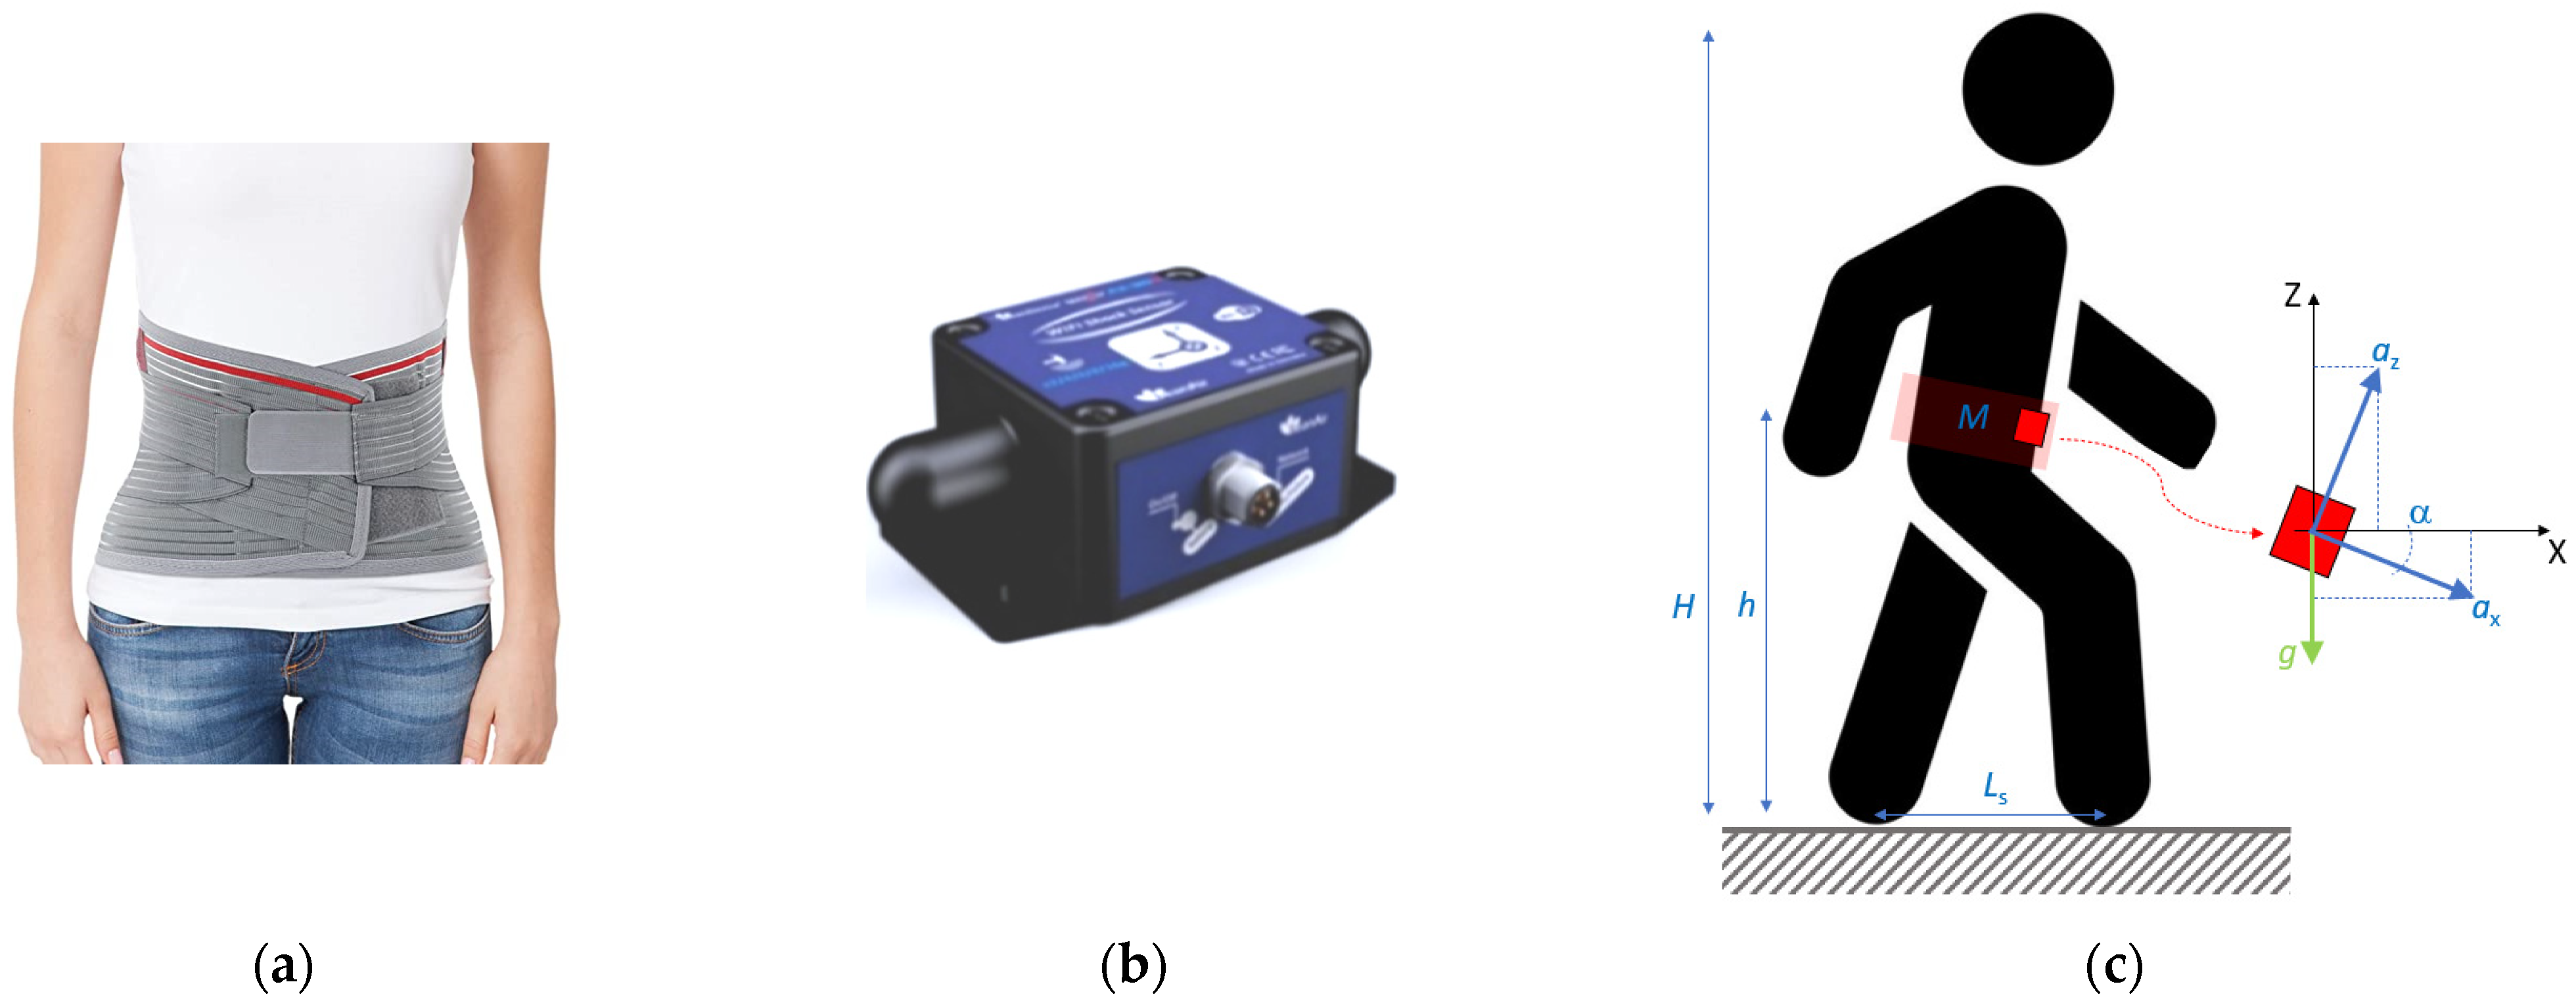
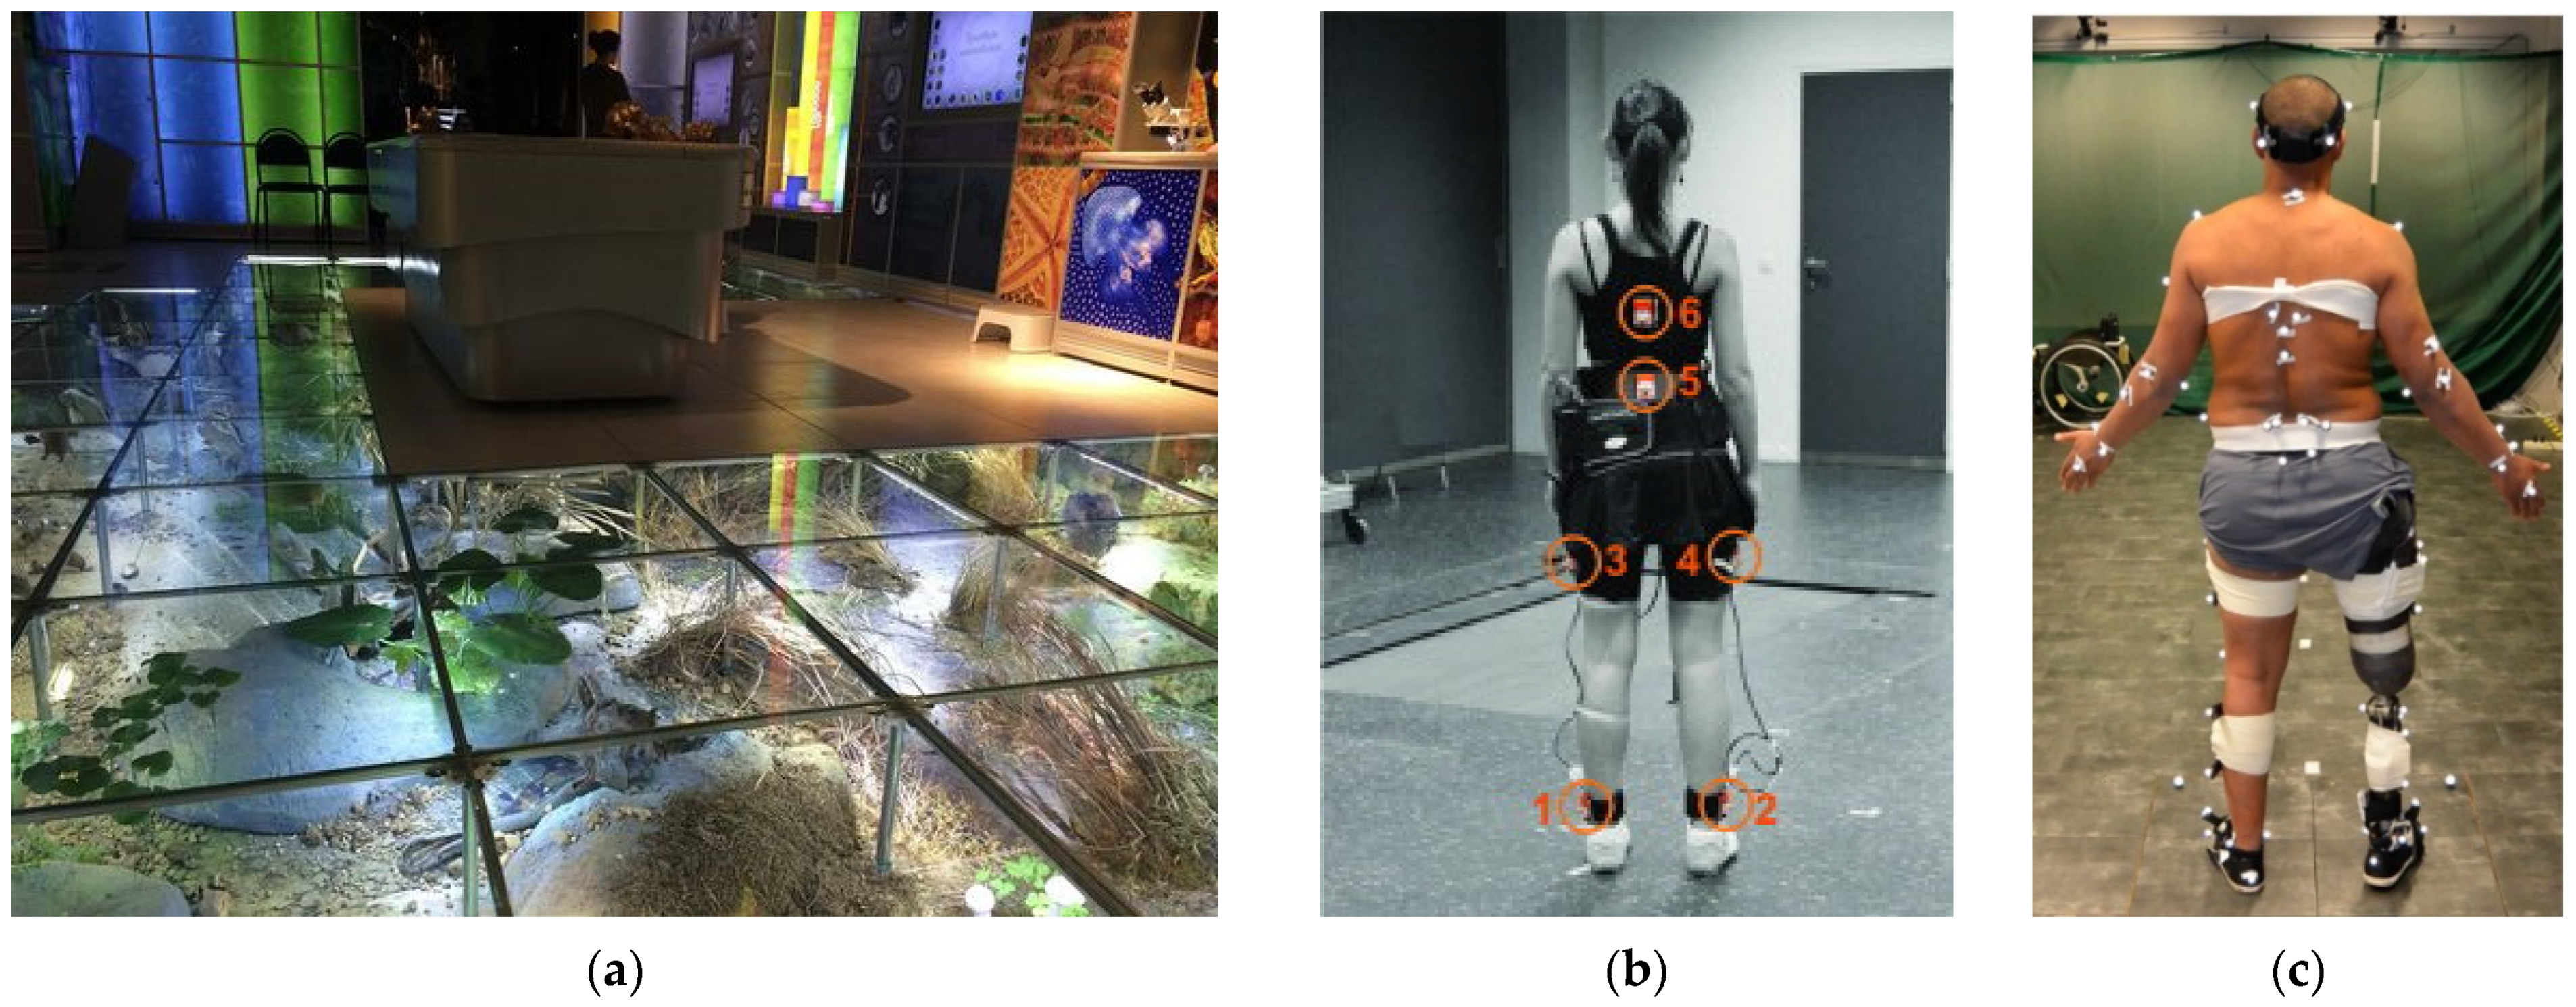
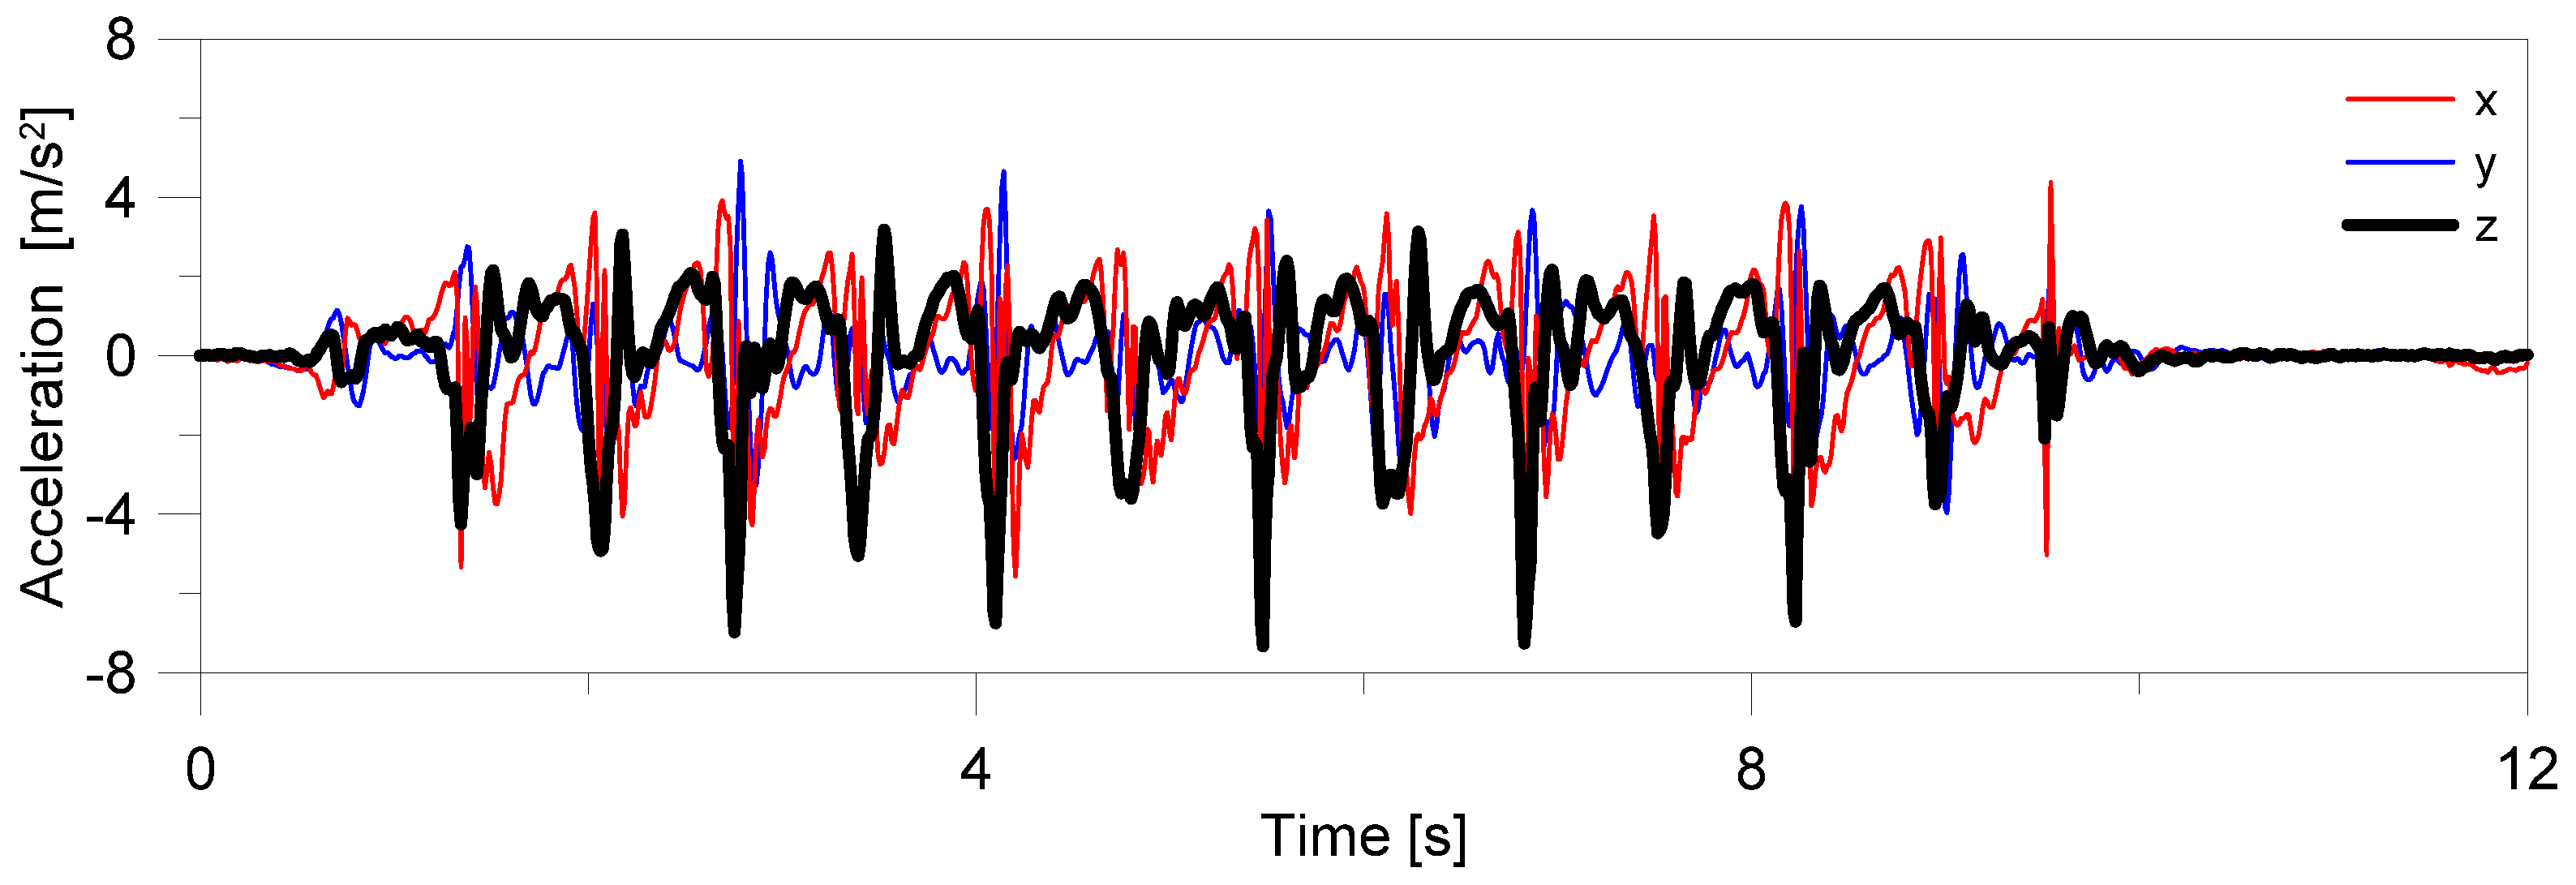
3.1. Experimental Setup and Record Acquisitions (WL1)
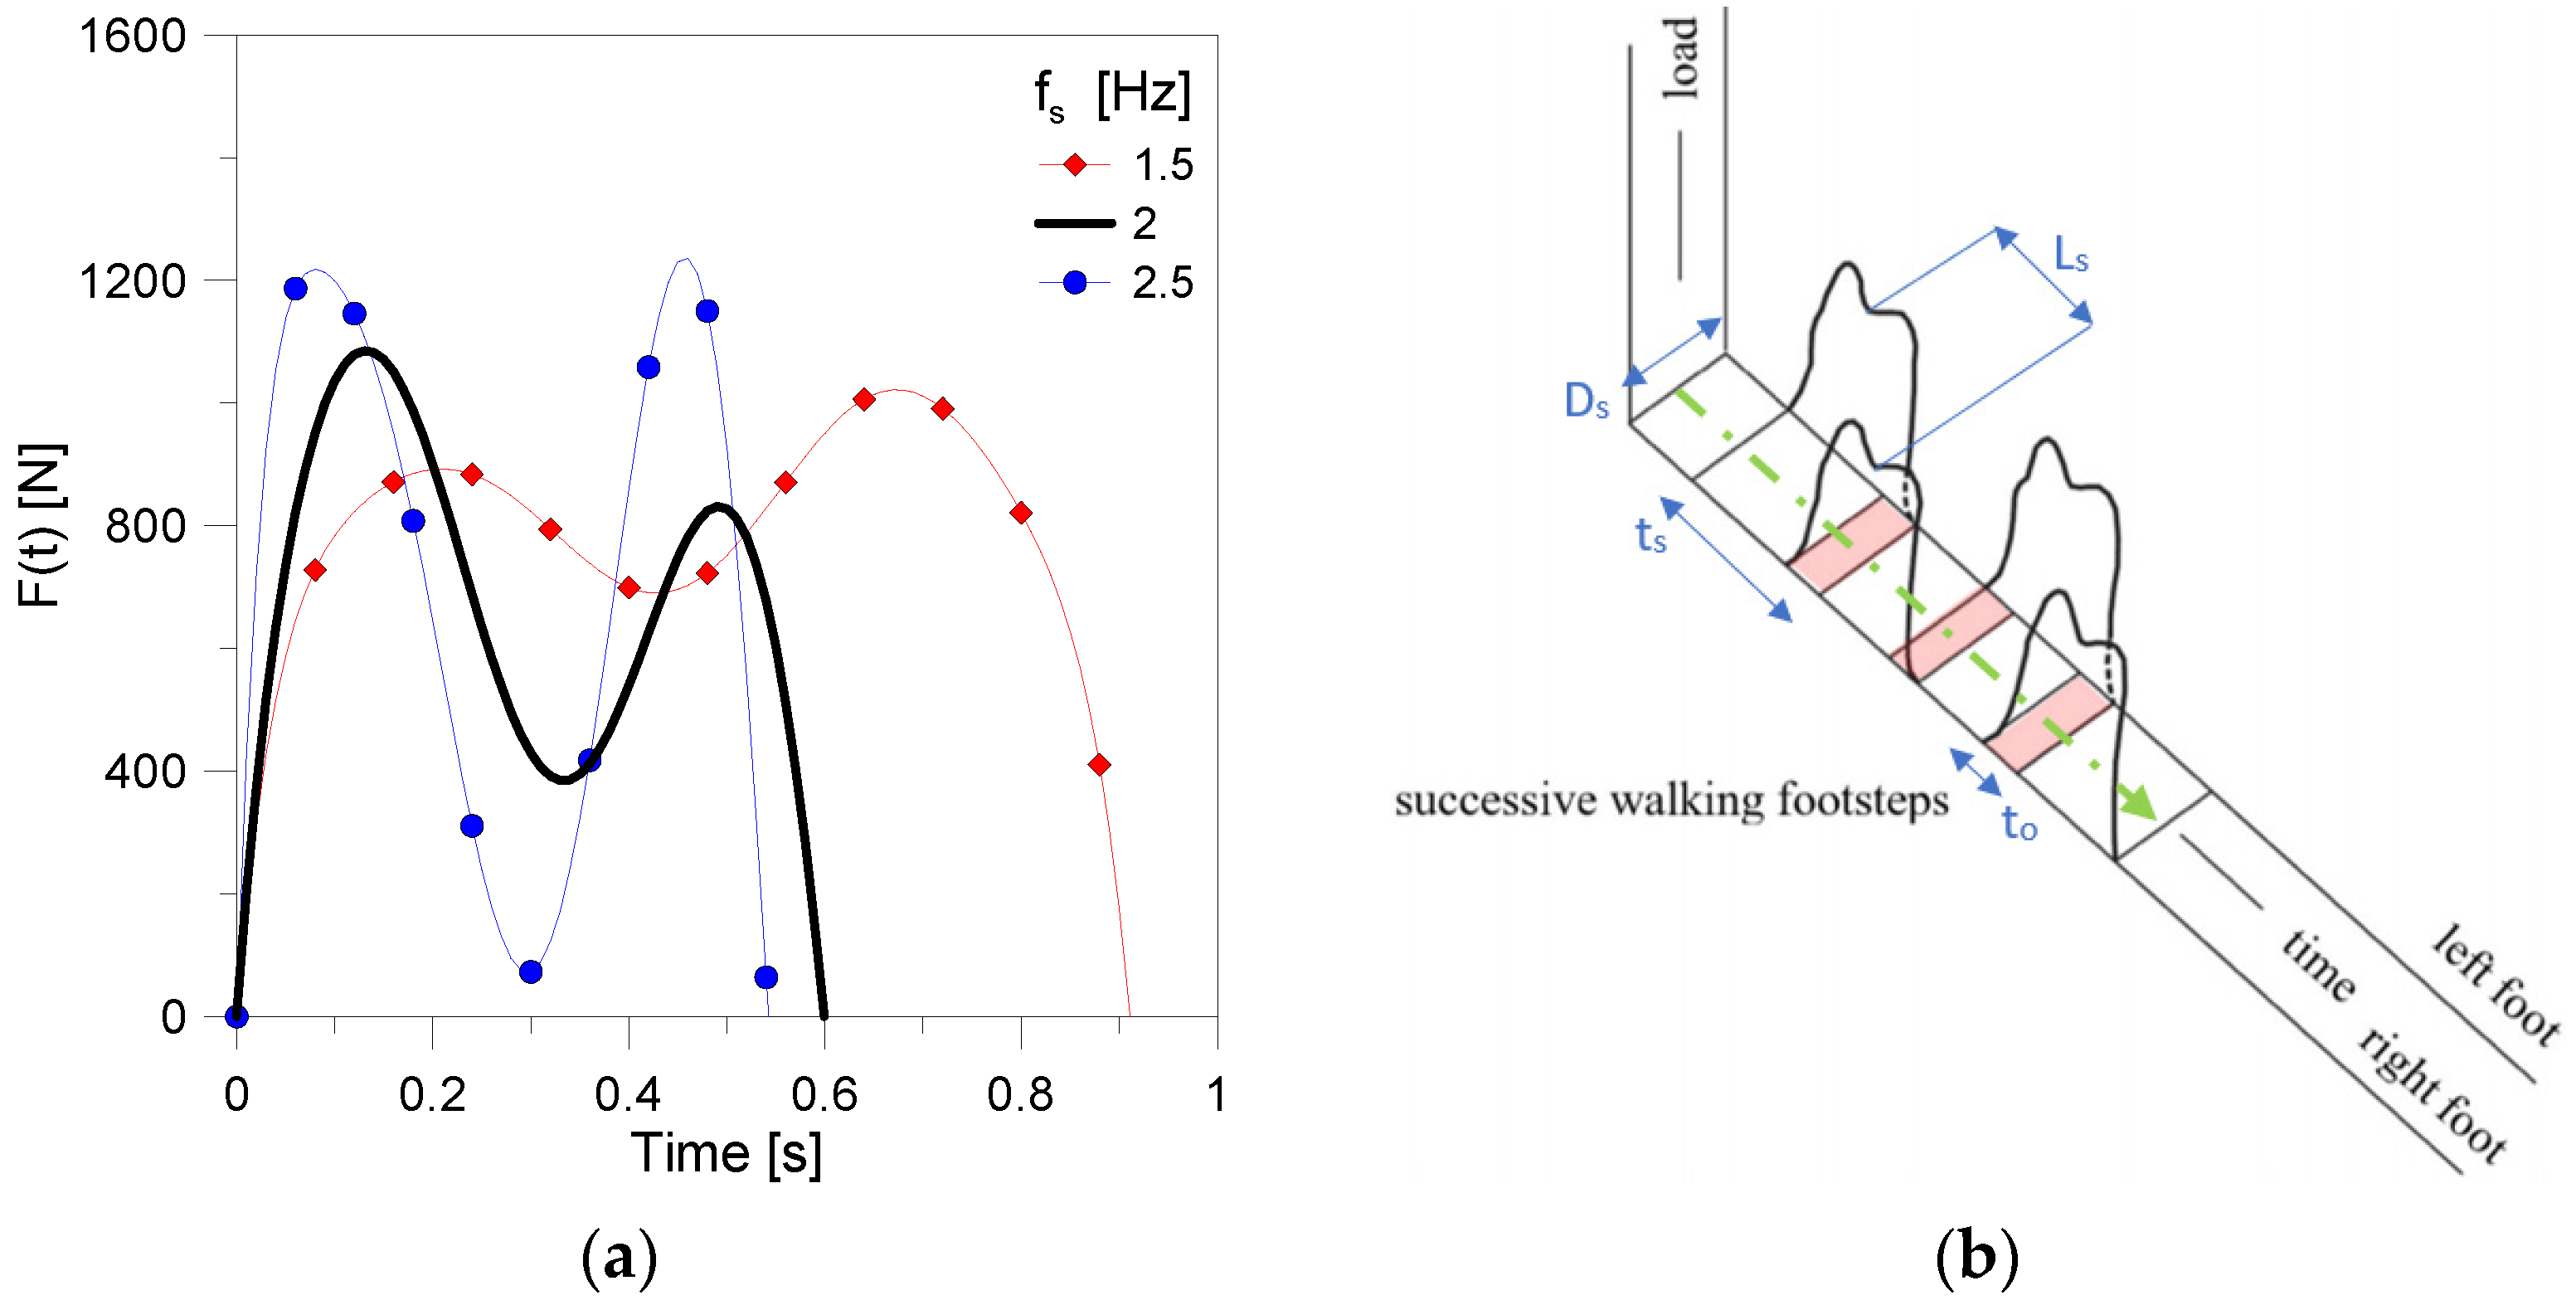
3.2. Deterministic Numerical Model (WL2)
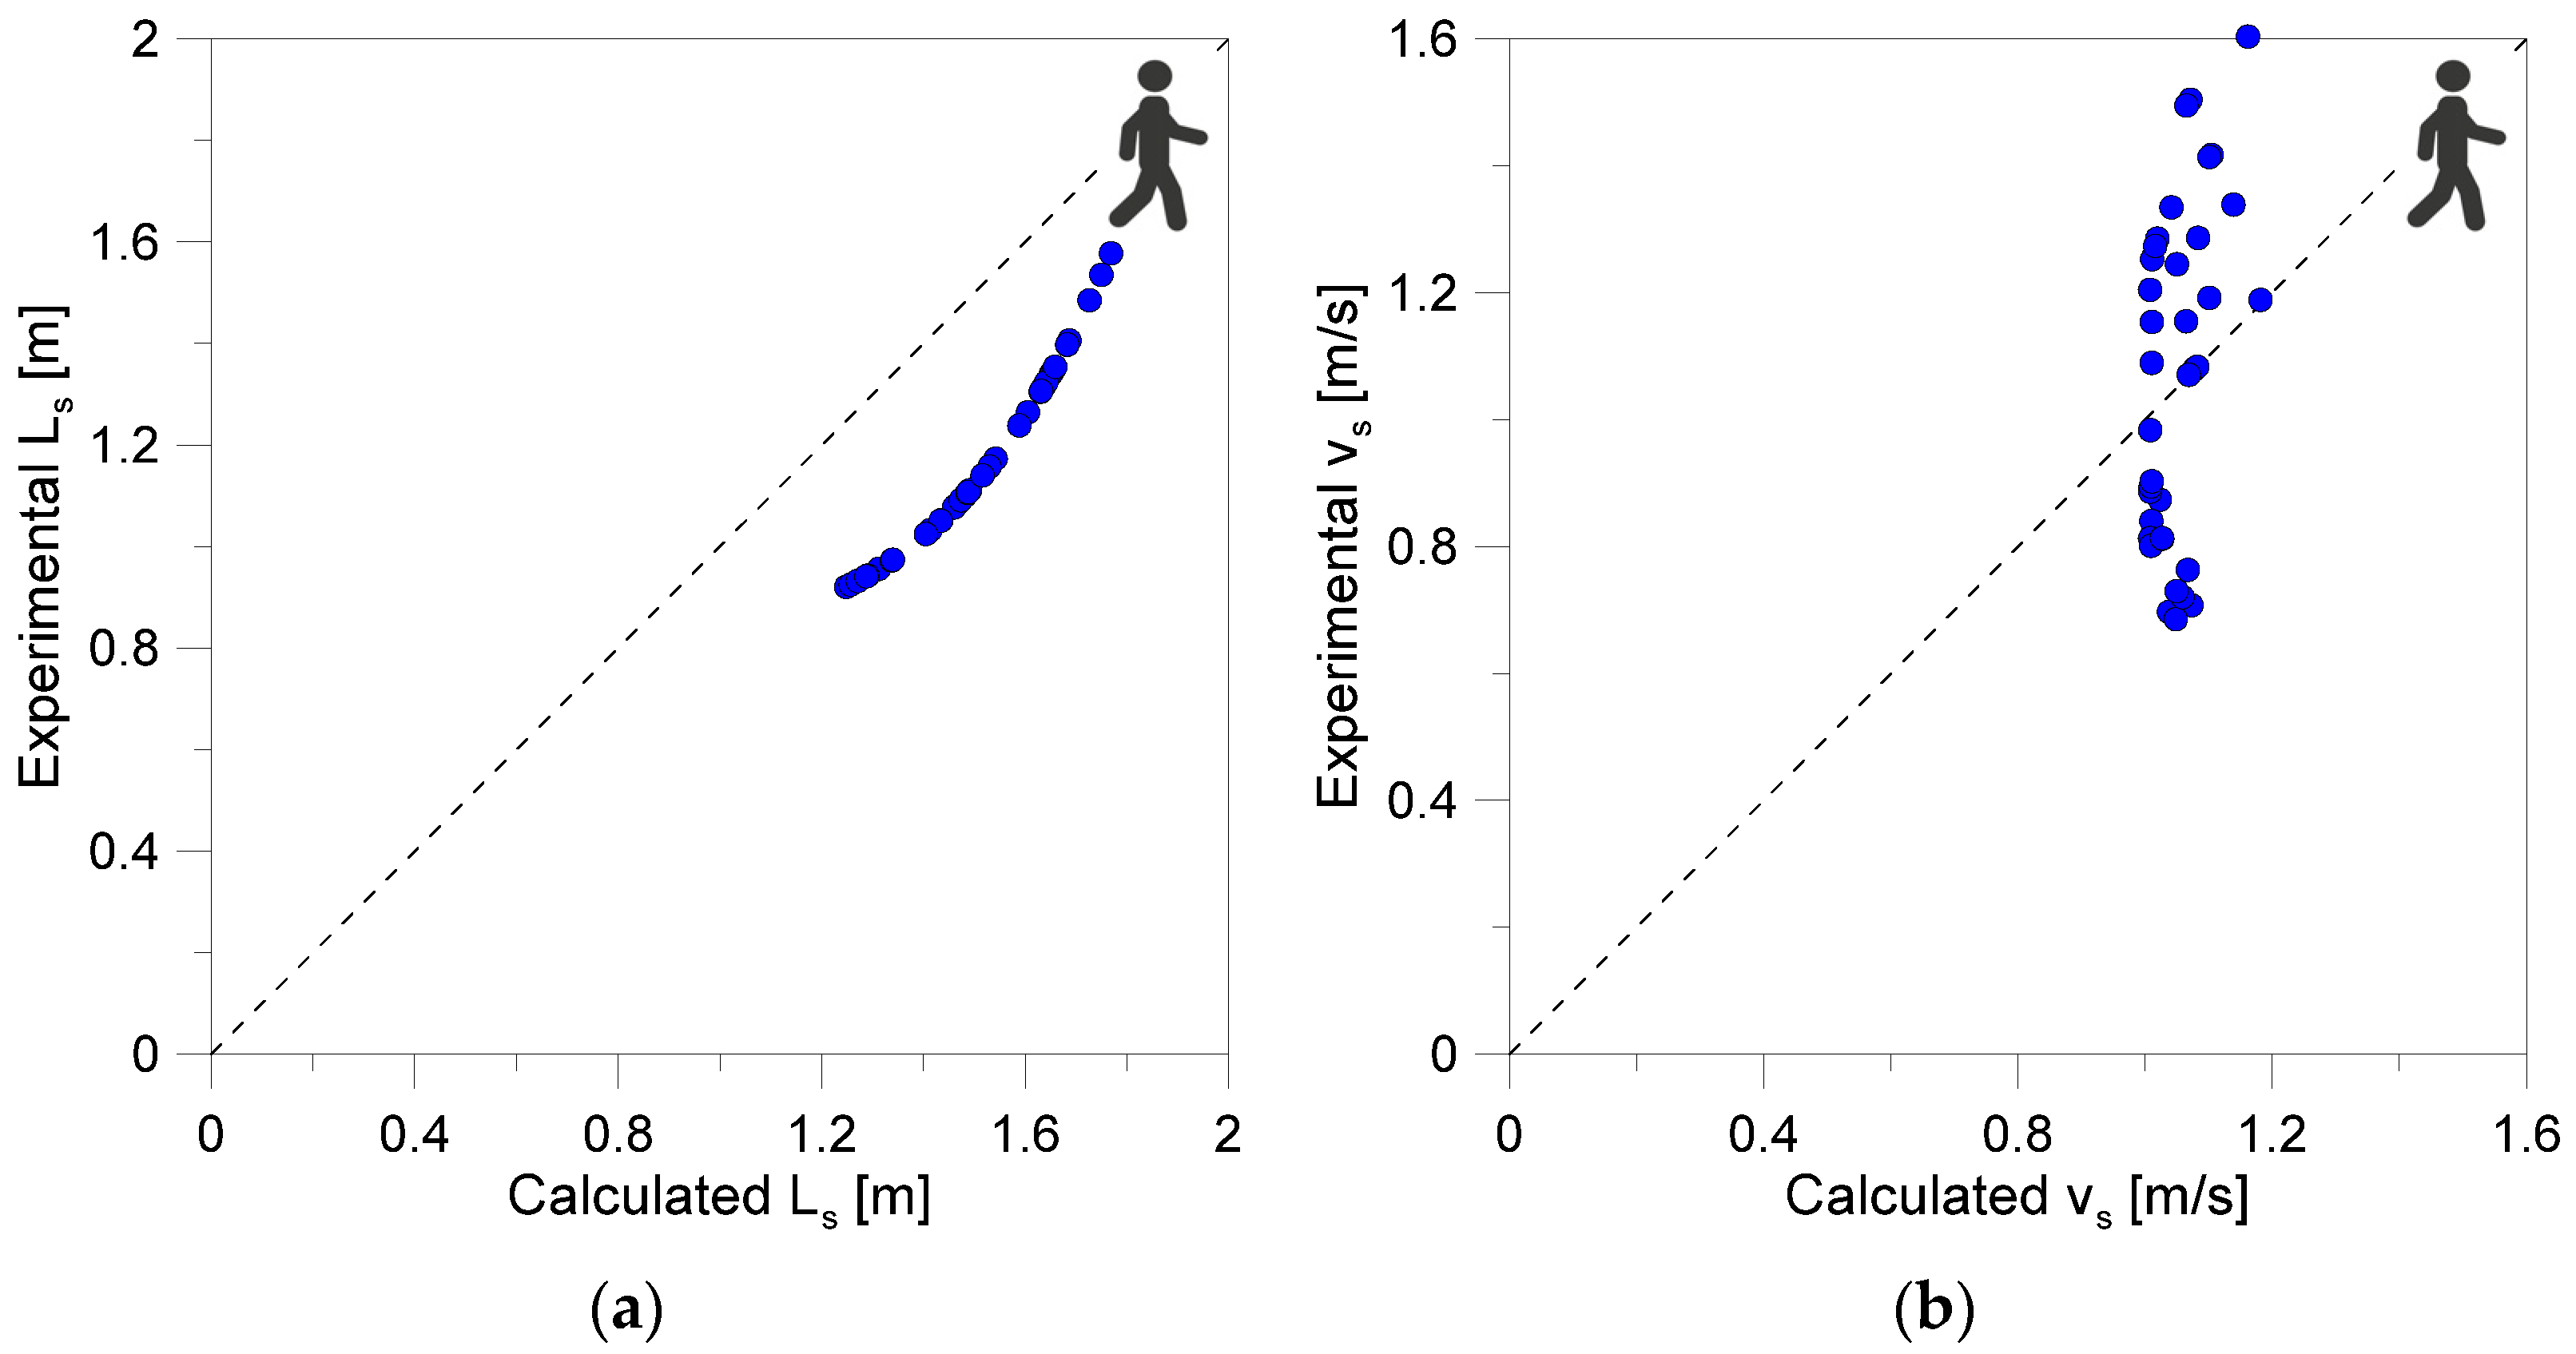
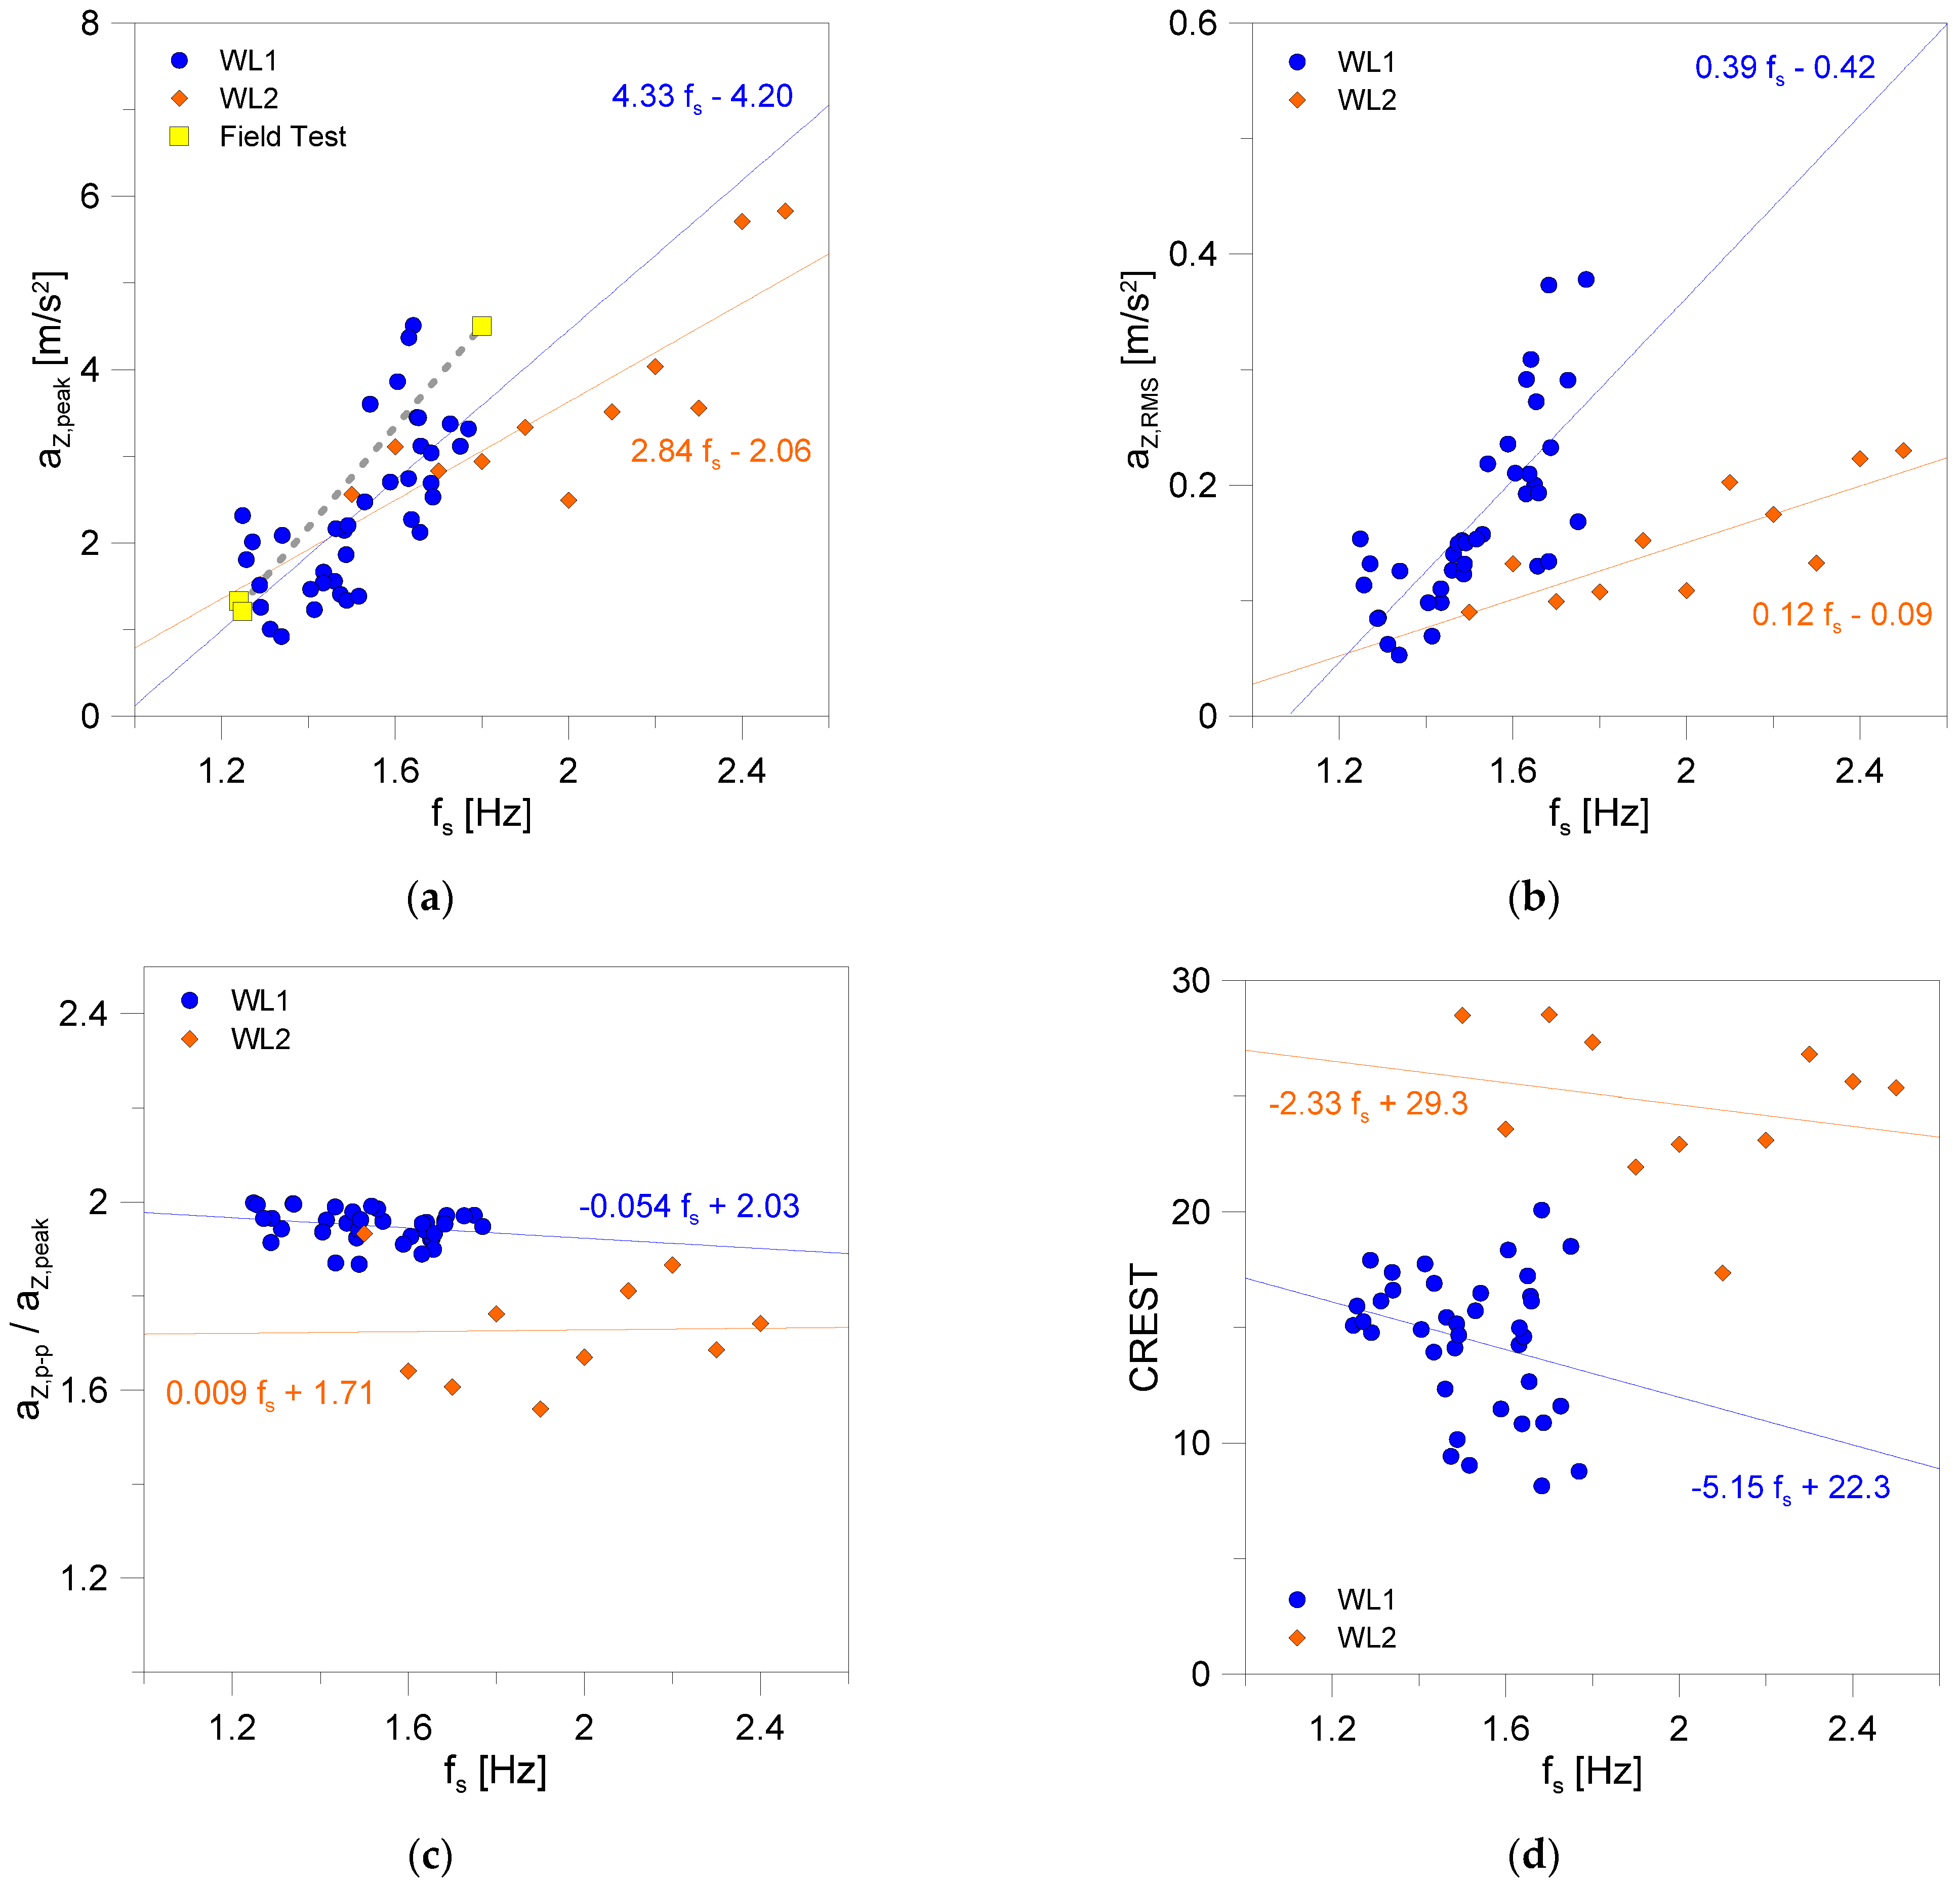
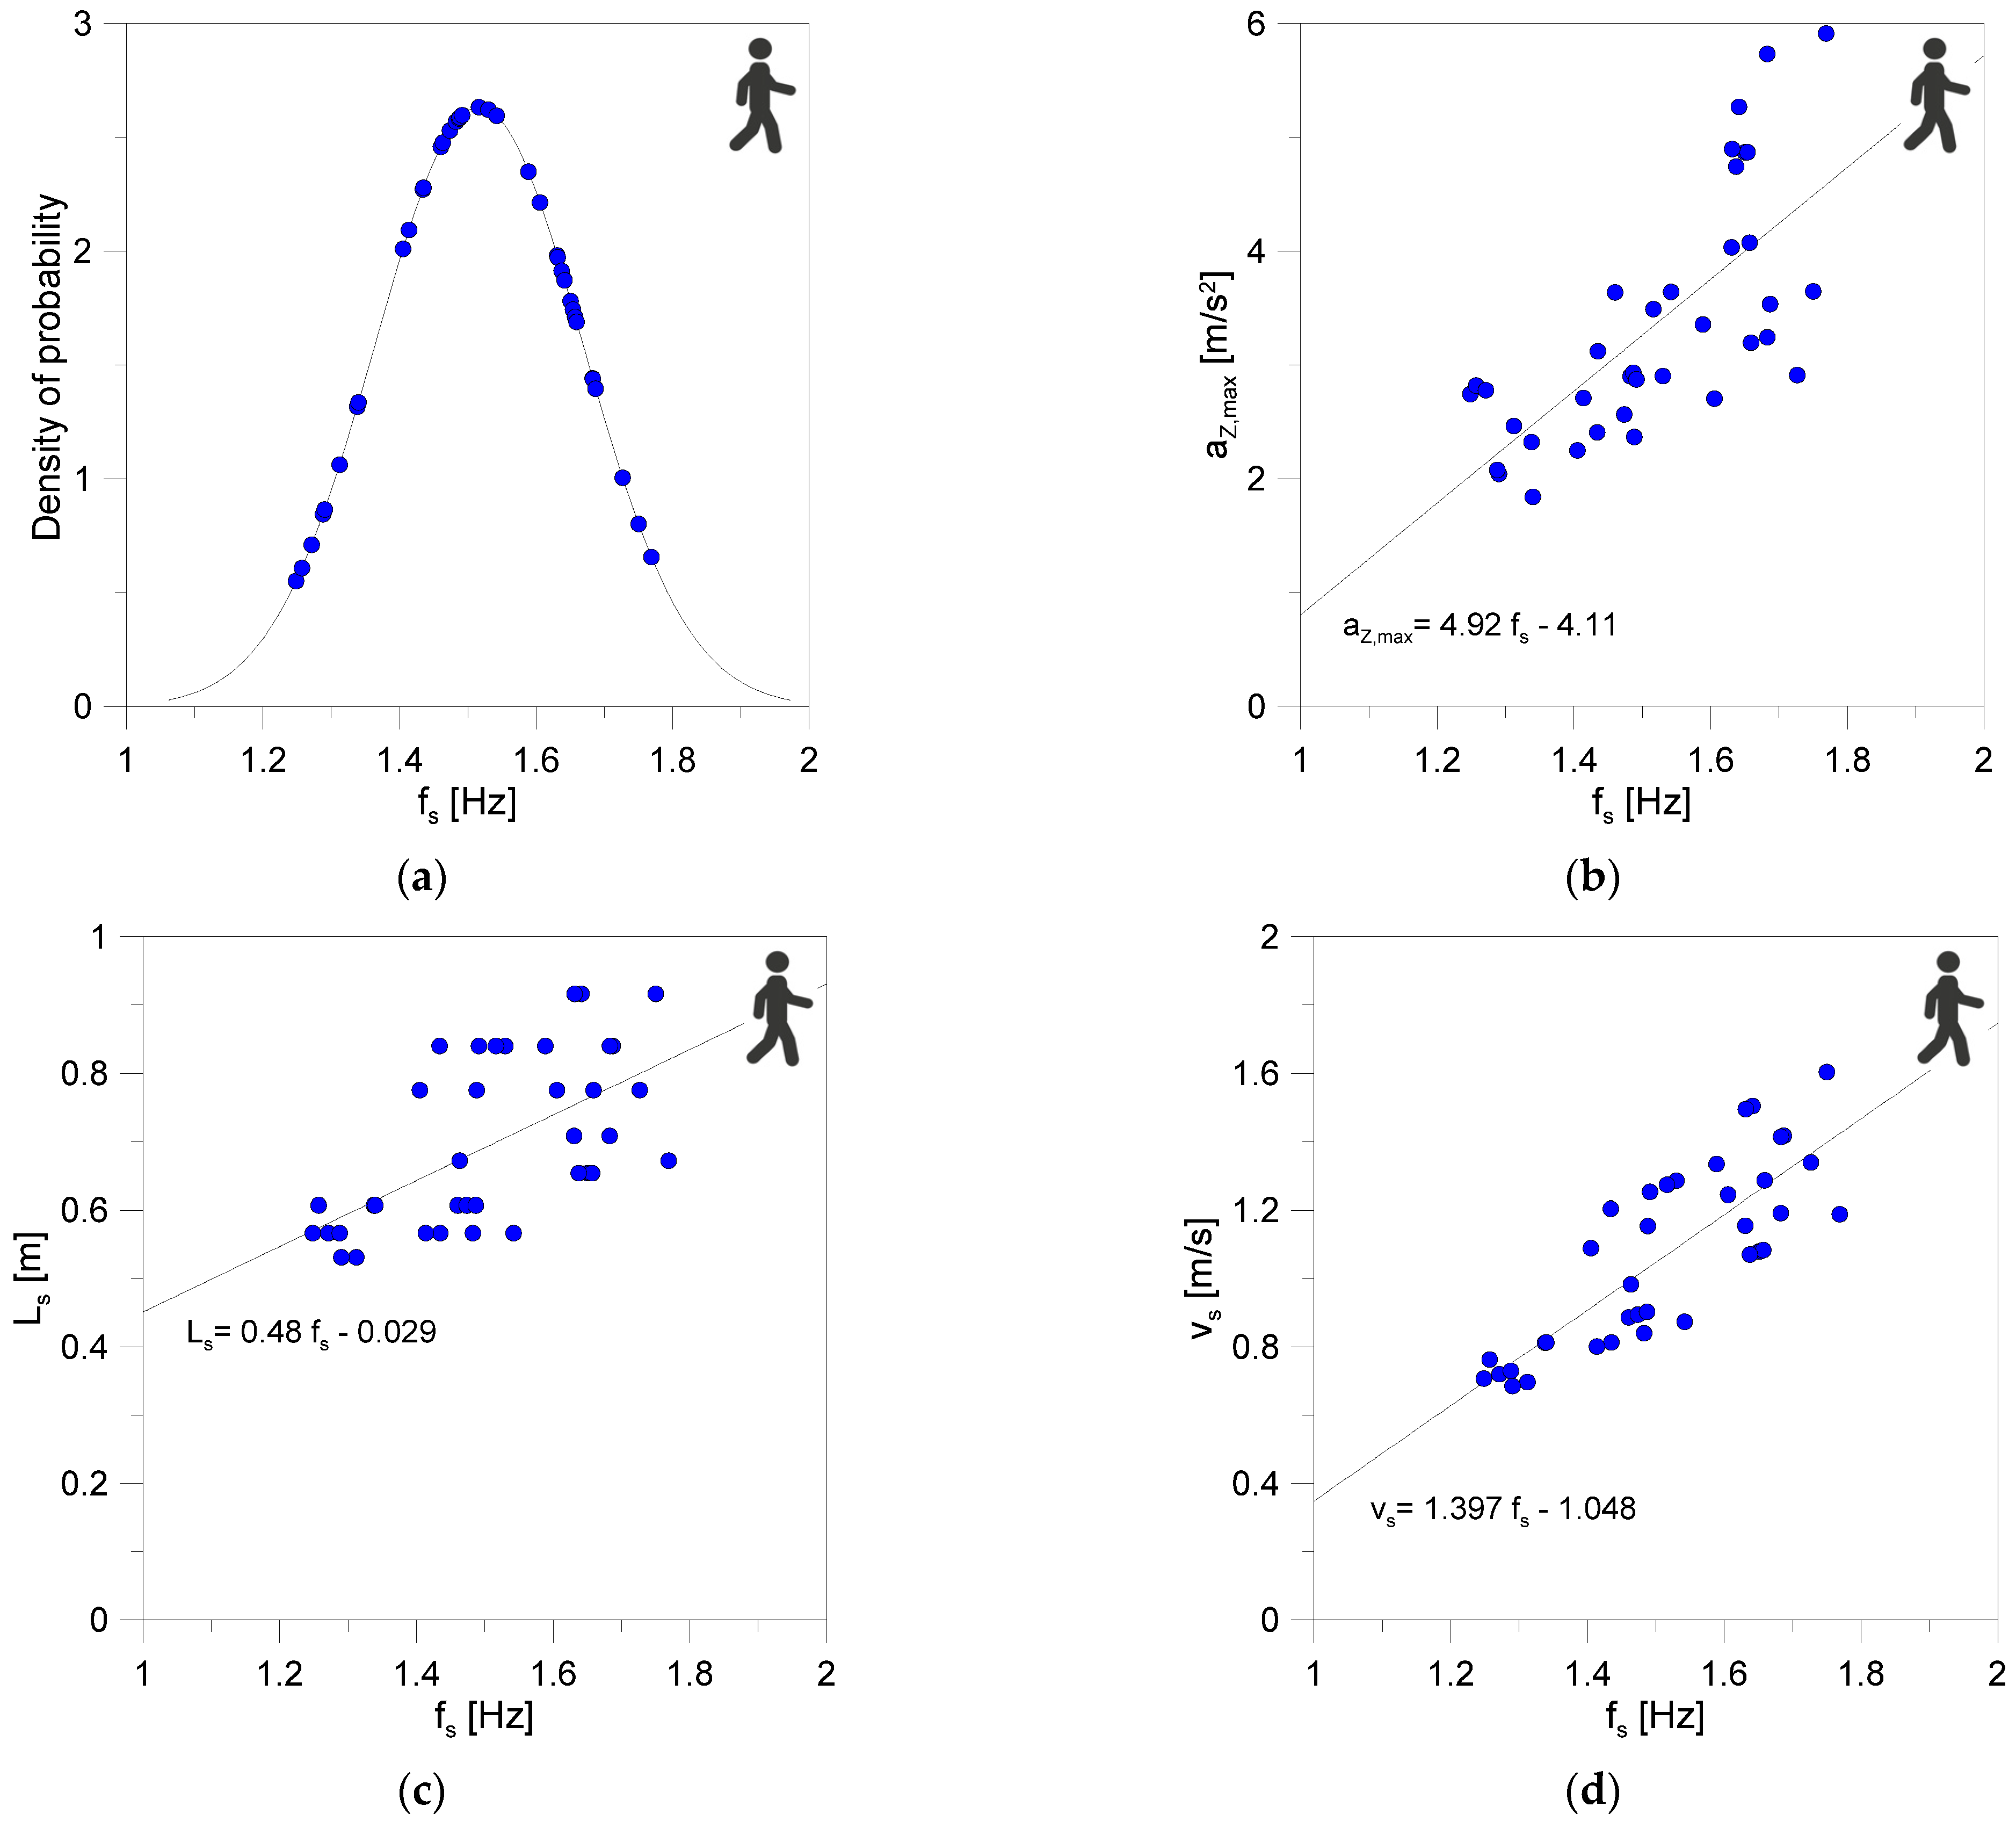
3.3. Characteristics of Experimental Laboratory Walks
4. Finite Element Numerical Analysis
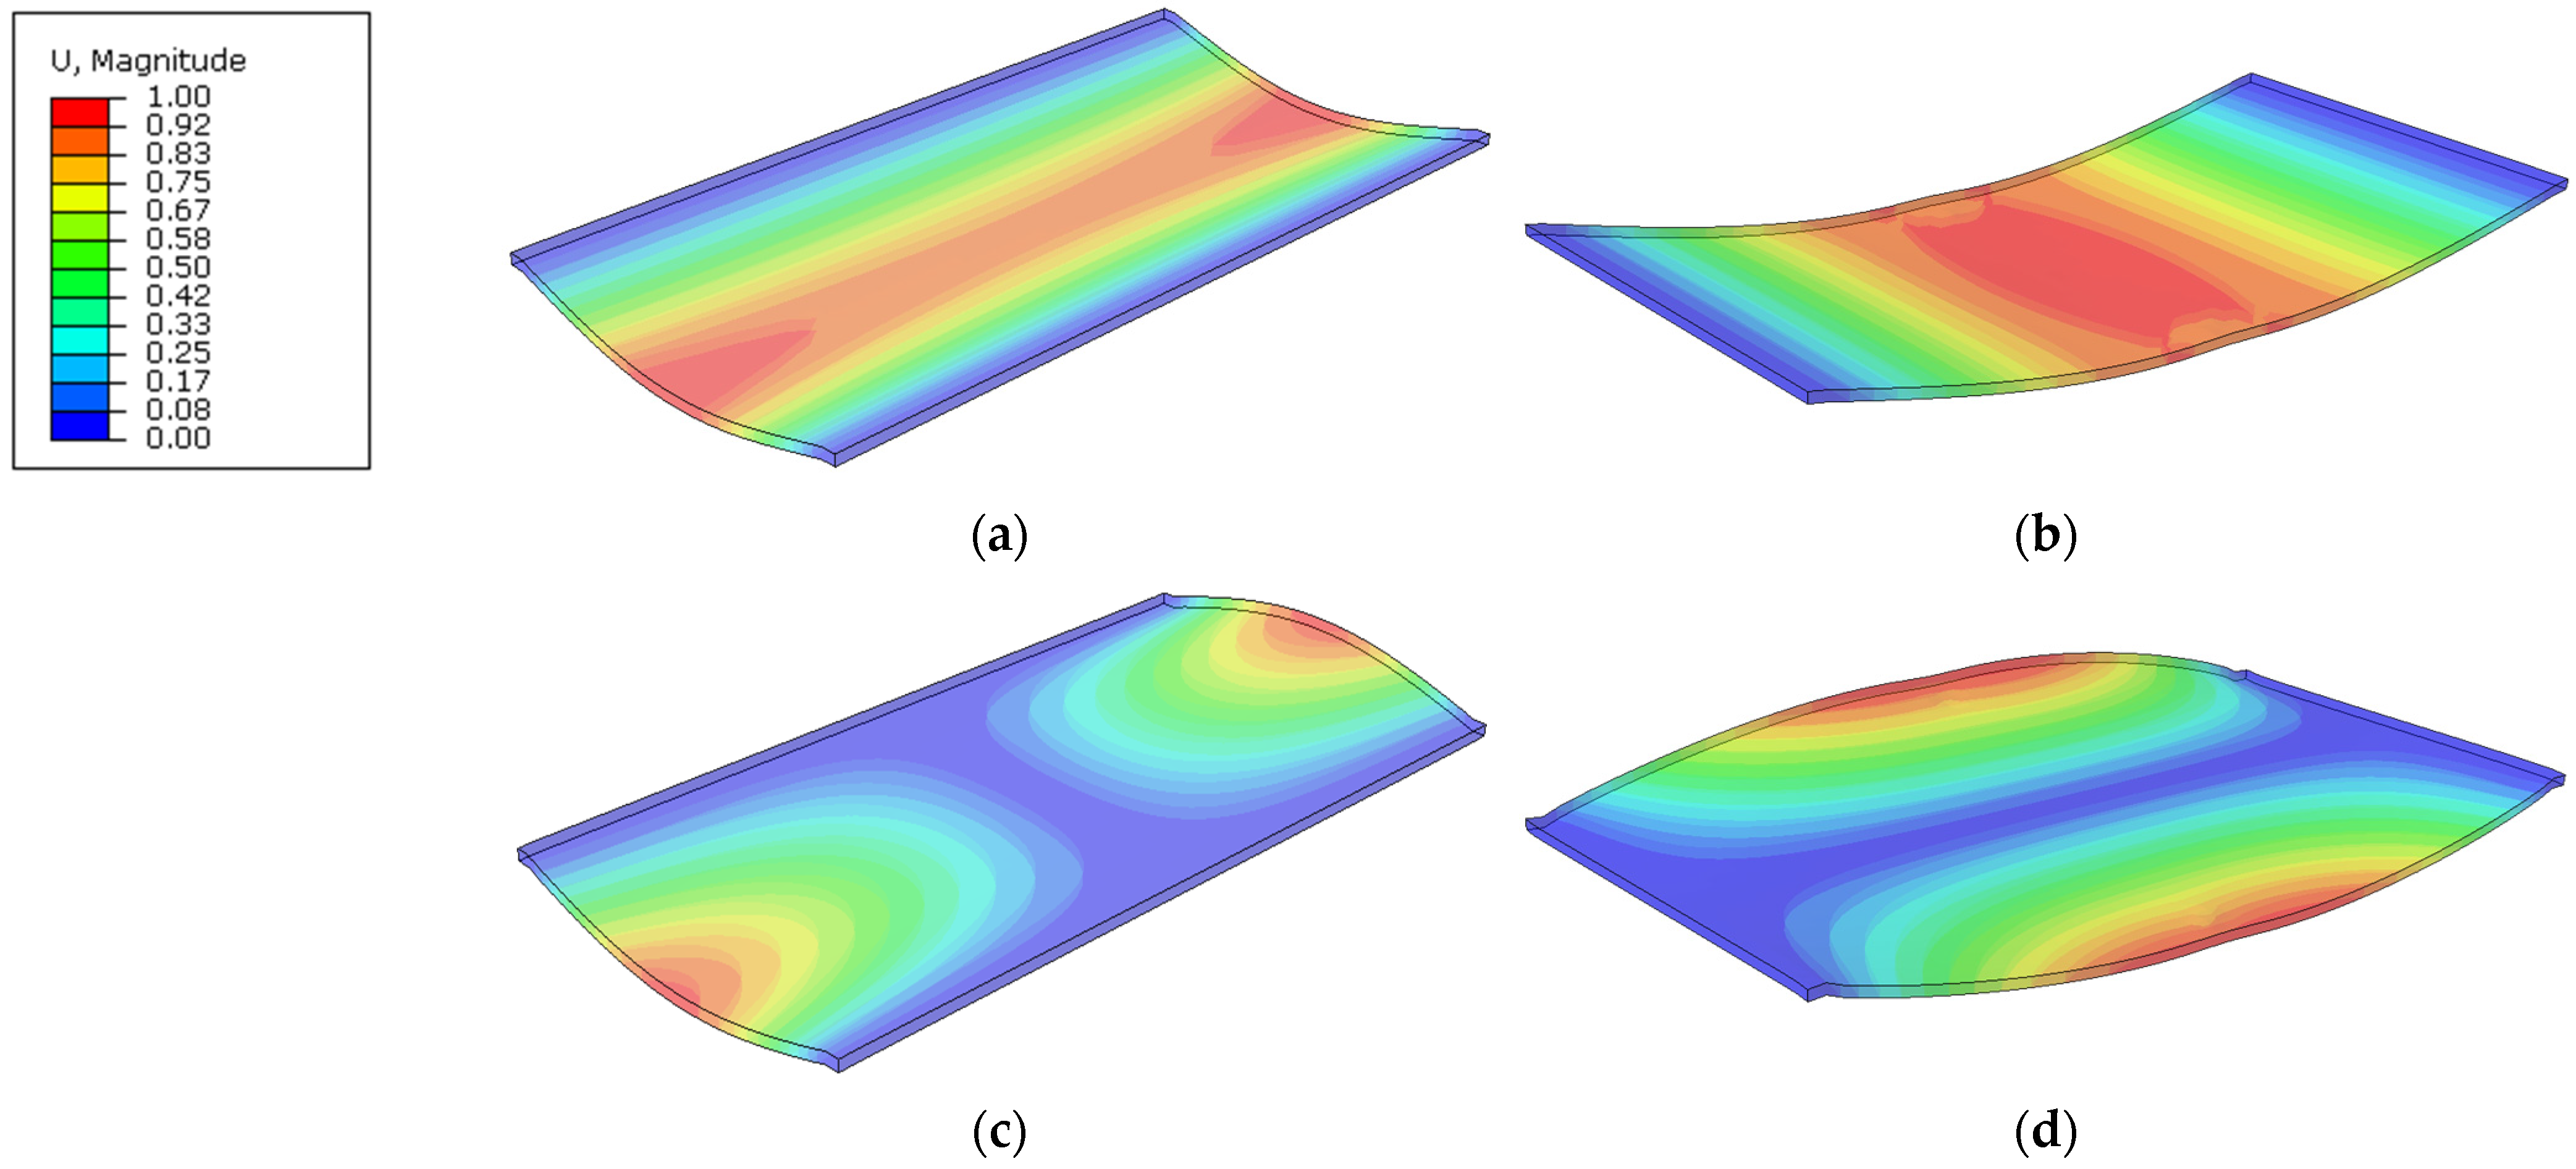
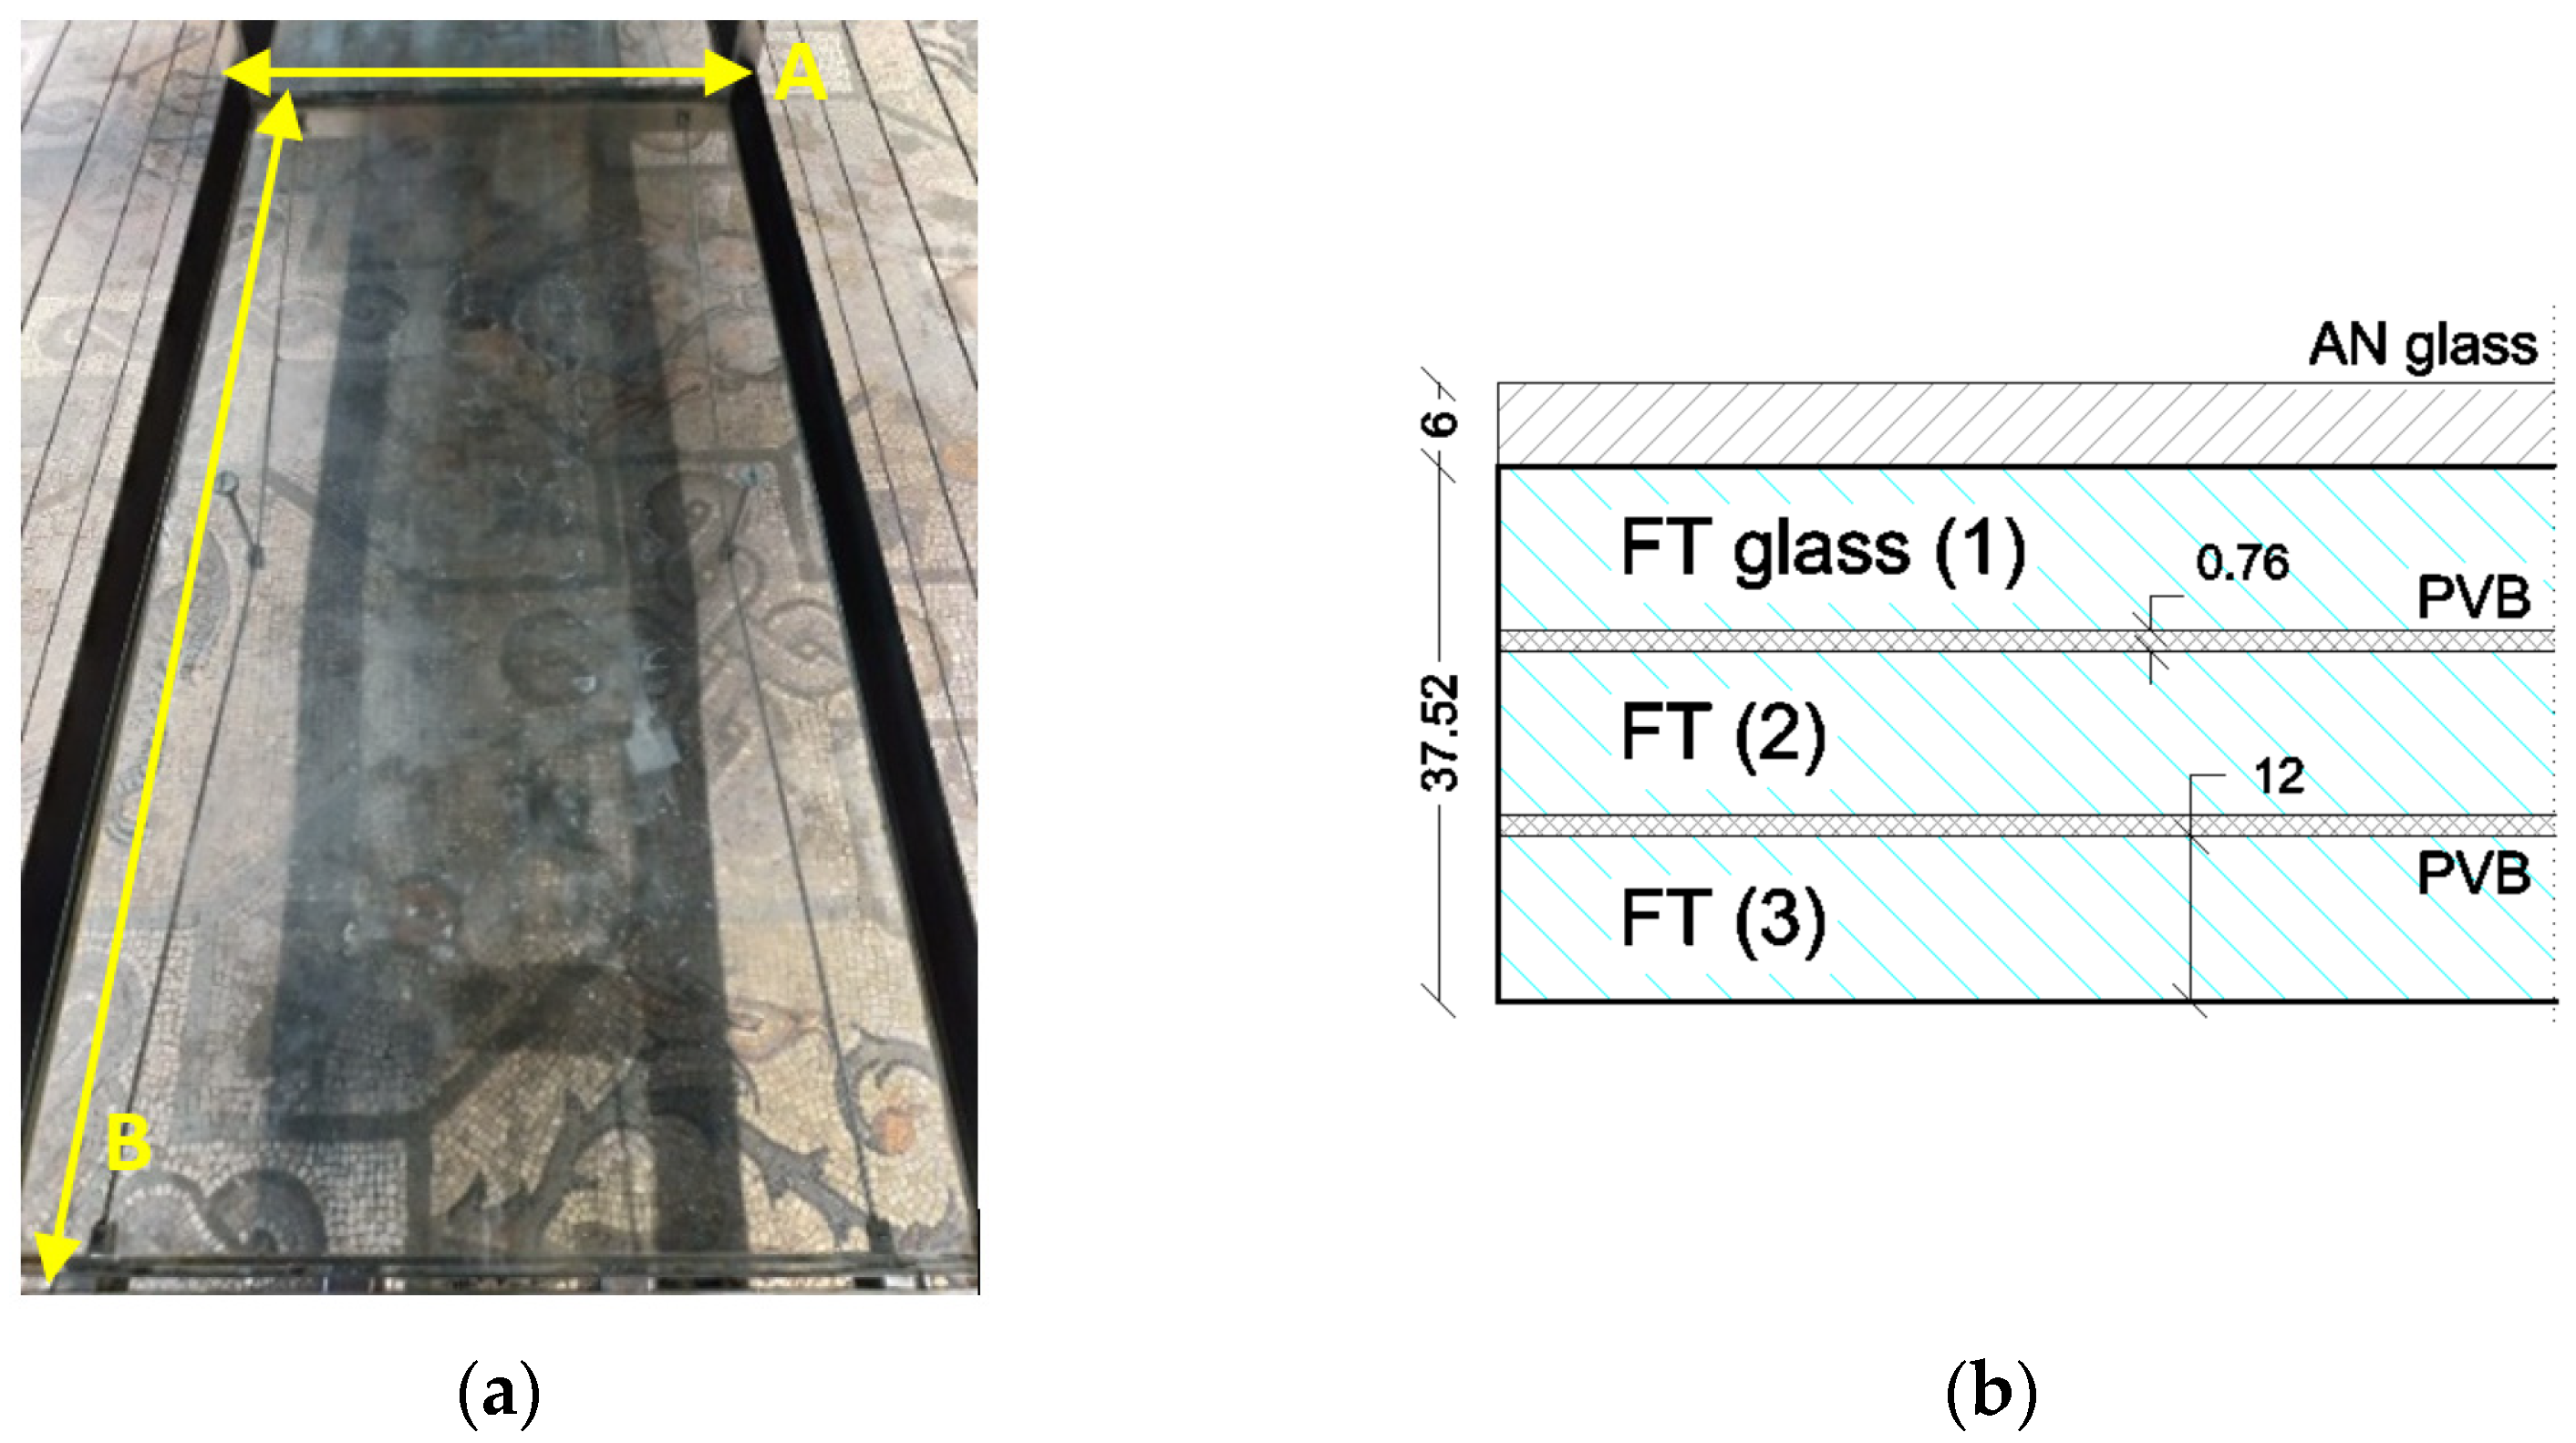
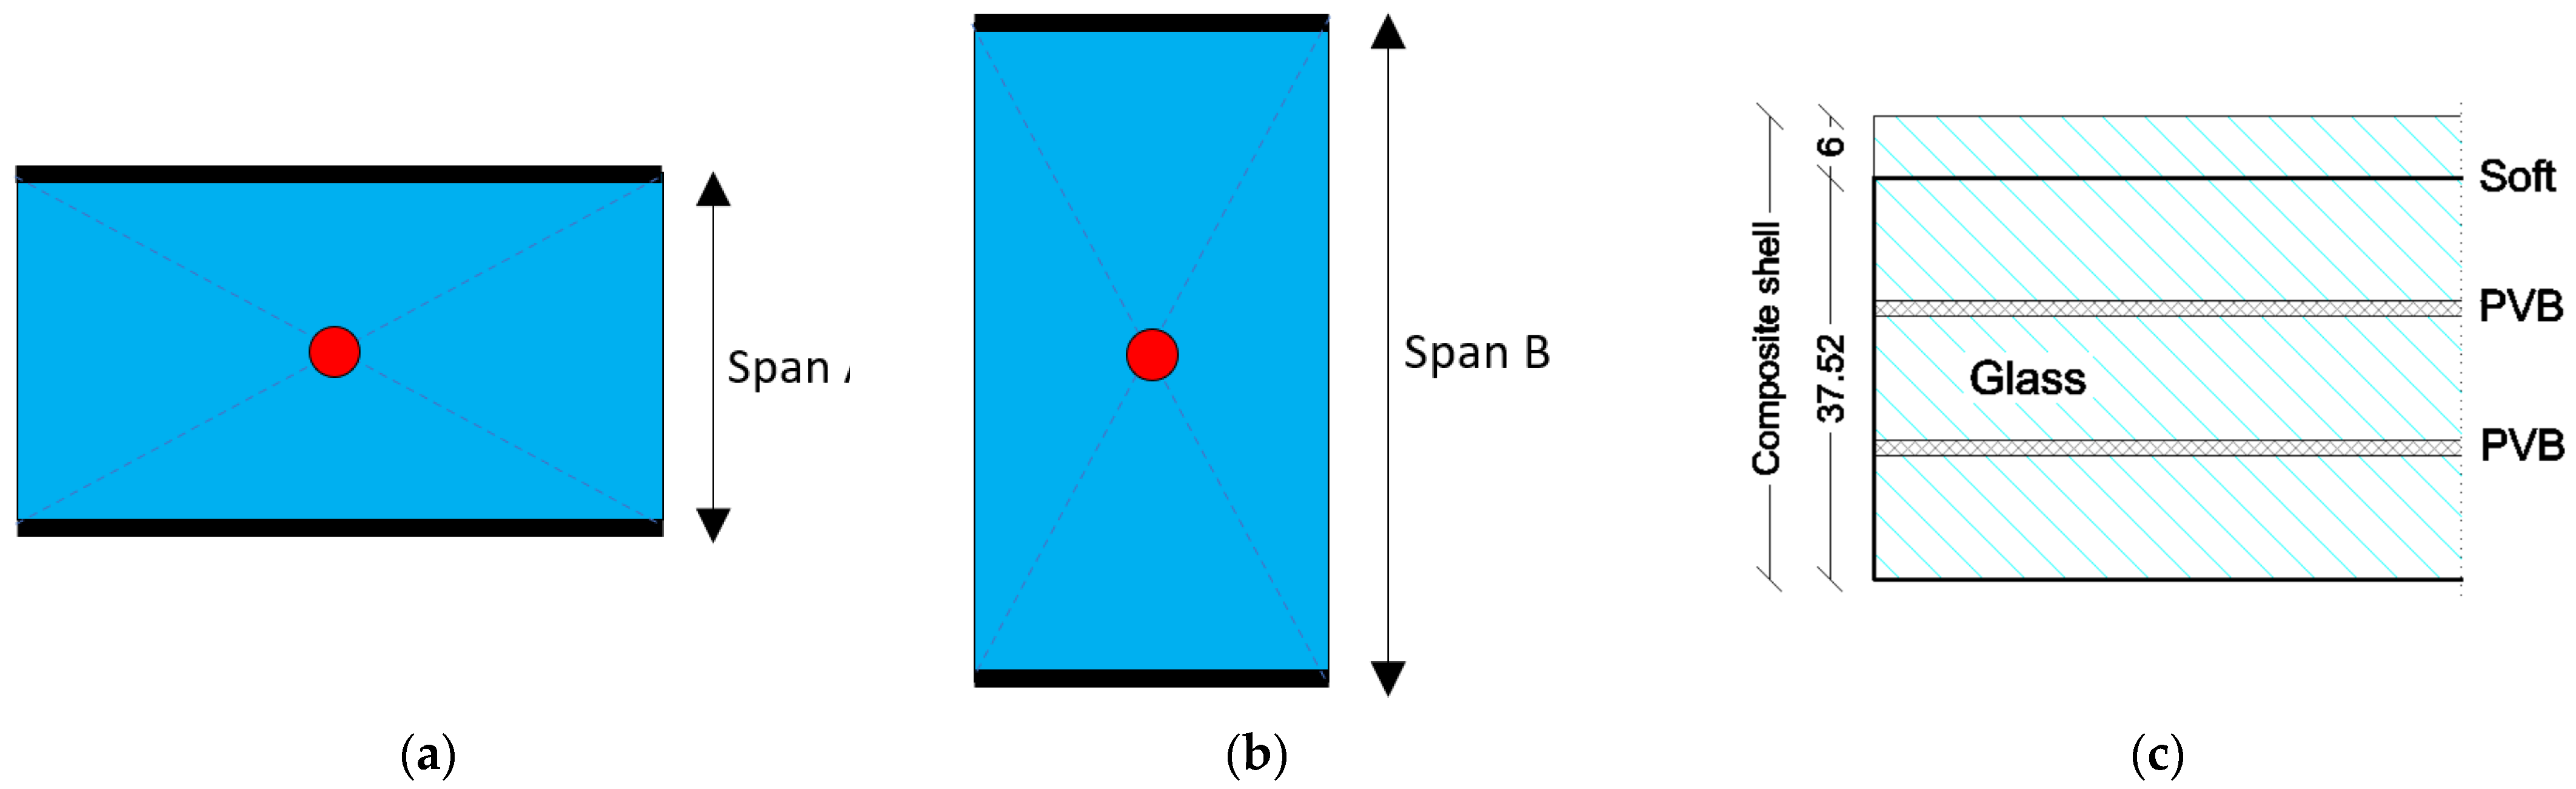
4.1. Slab Features and Modelling
- GS1 = linear supports along the B edges of LG module, with A edges unrestrained.
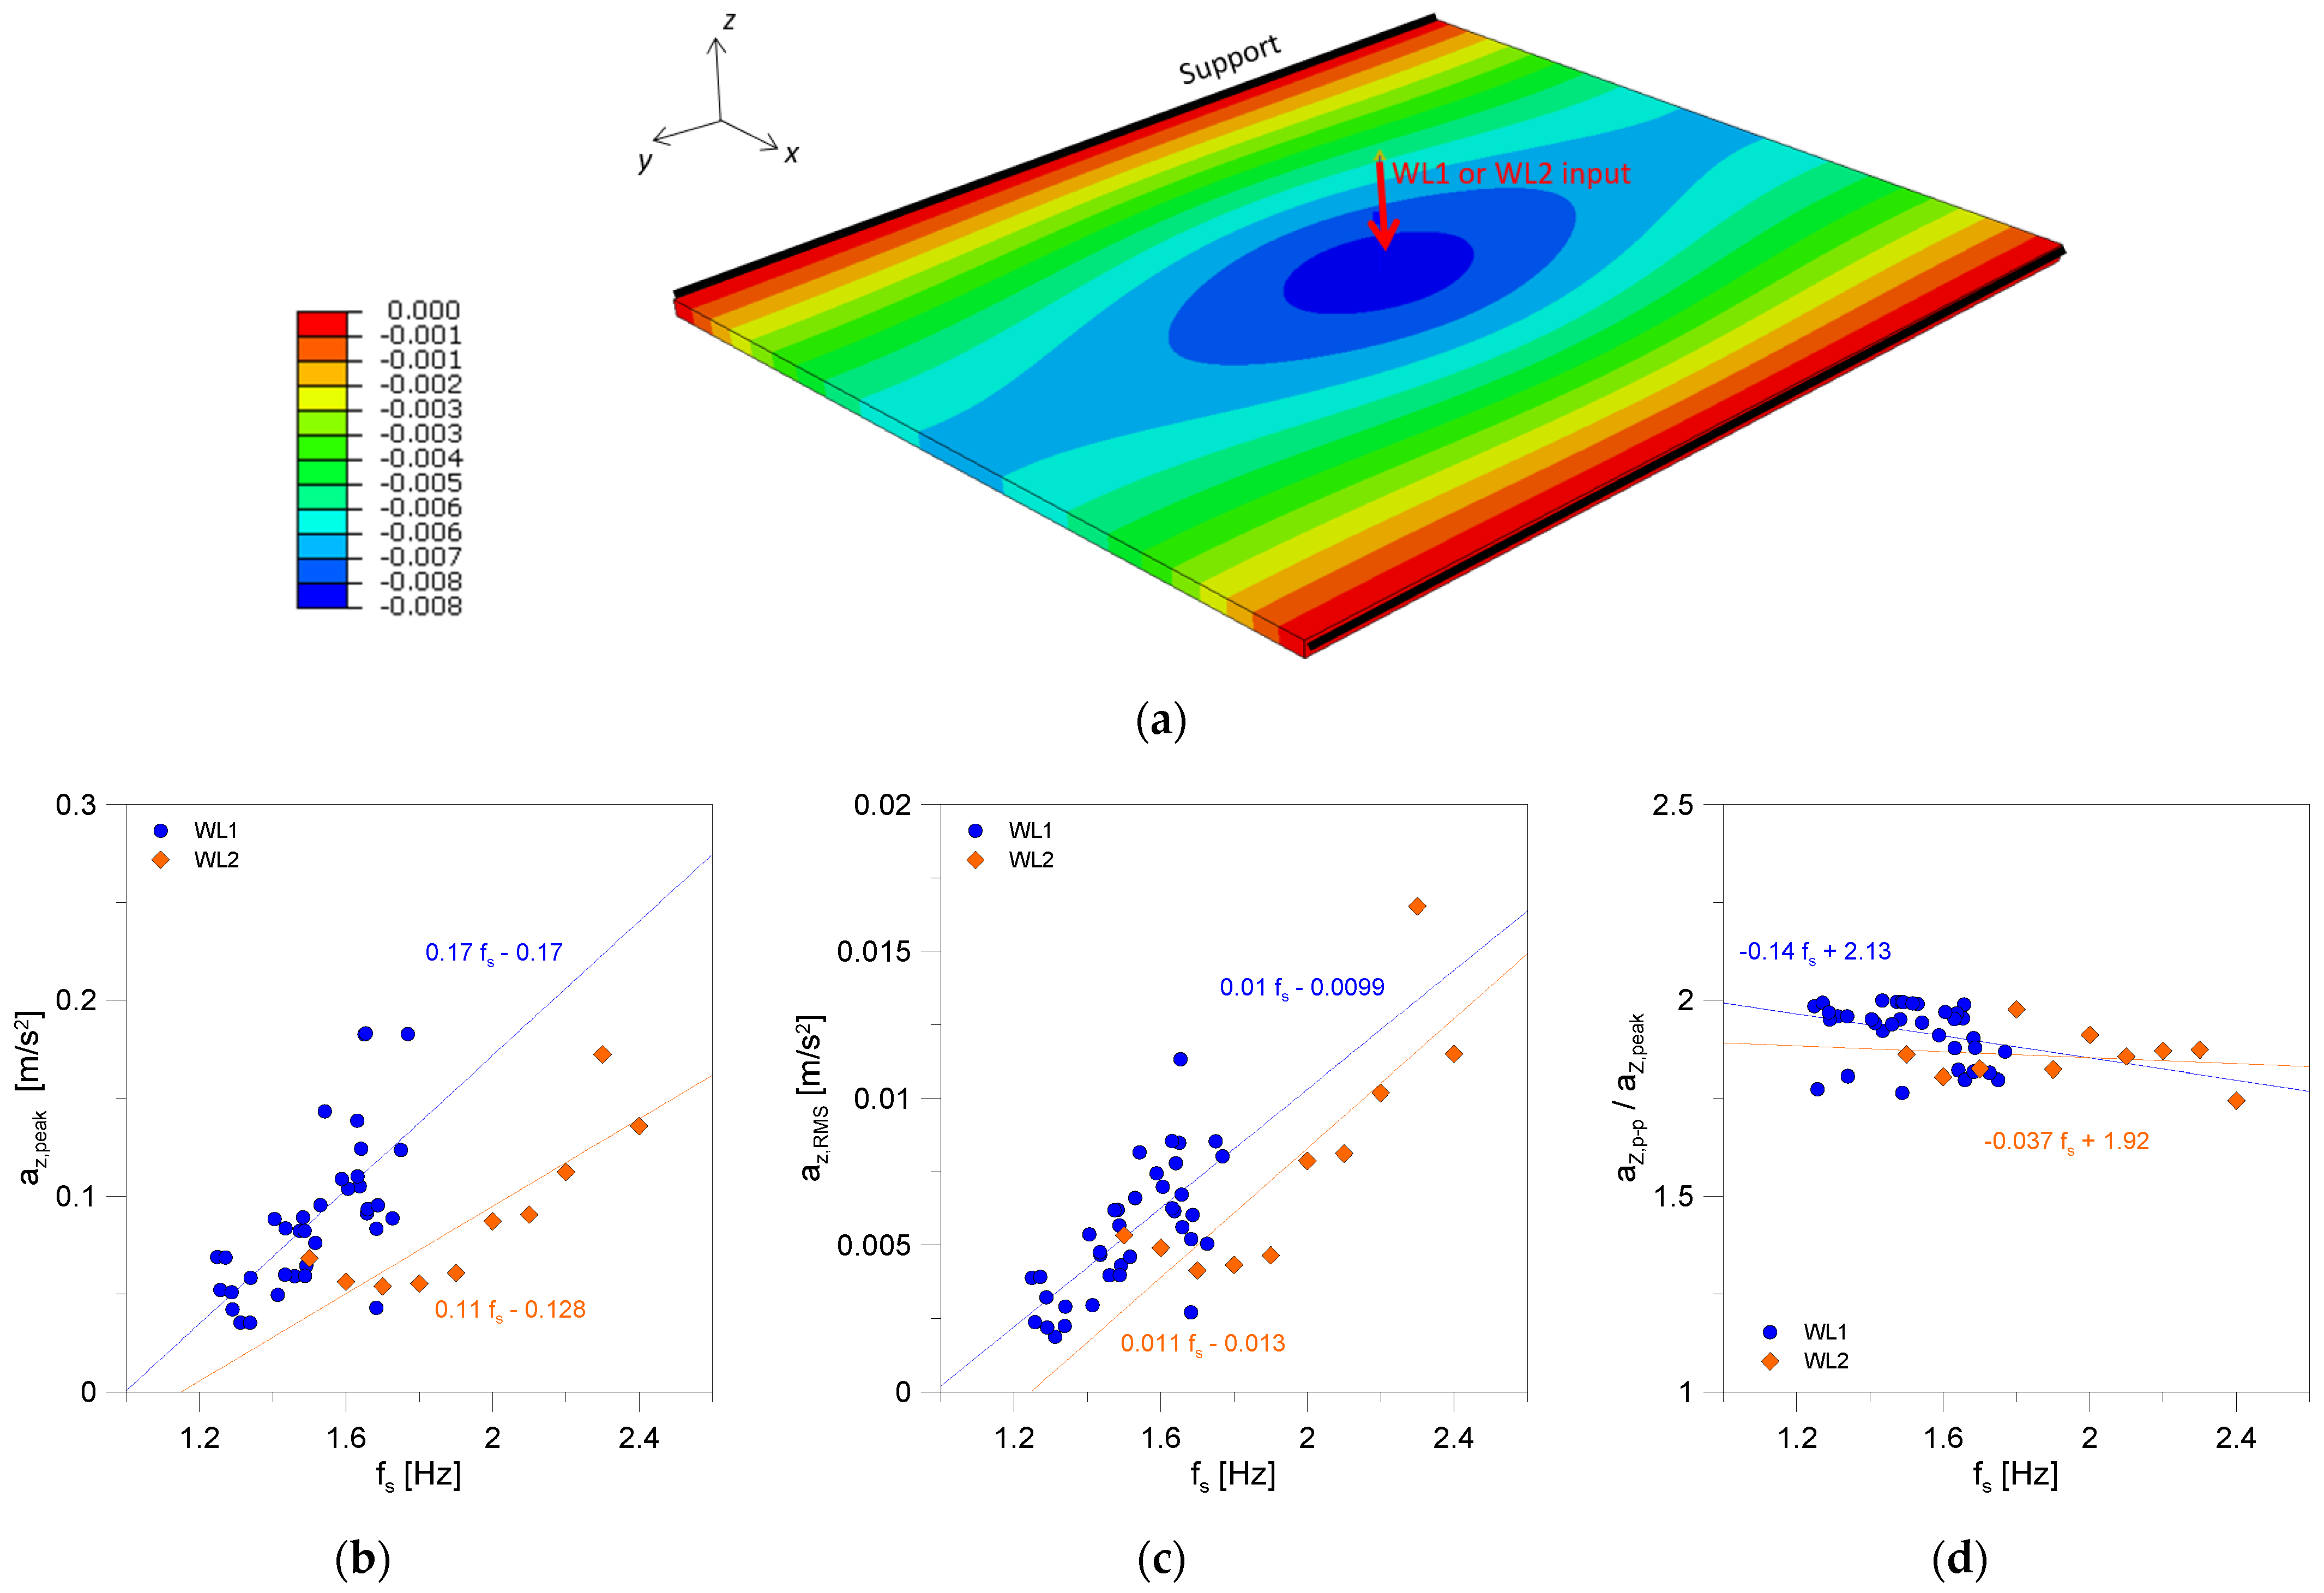
- GS2 = linear supports along the short A edges of LG module. In this case, two pairs of pre-stressed tendons (AISI 316 steel, 10 mm diameter), installed at mid-span with mechanical unilateral point fixings, were also taken into account to avoid large bending deformations due to vertical loads from pedestrians [9].
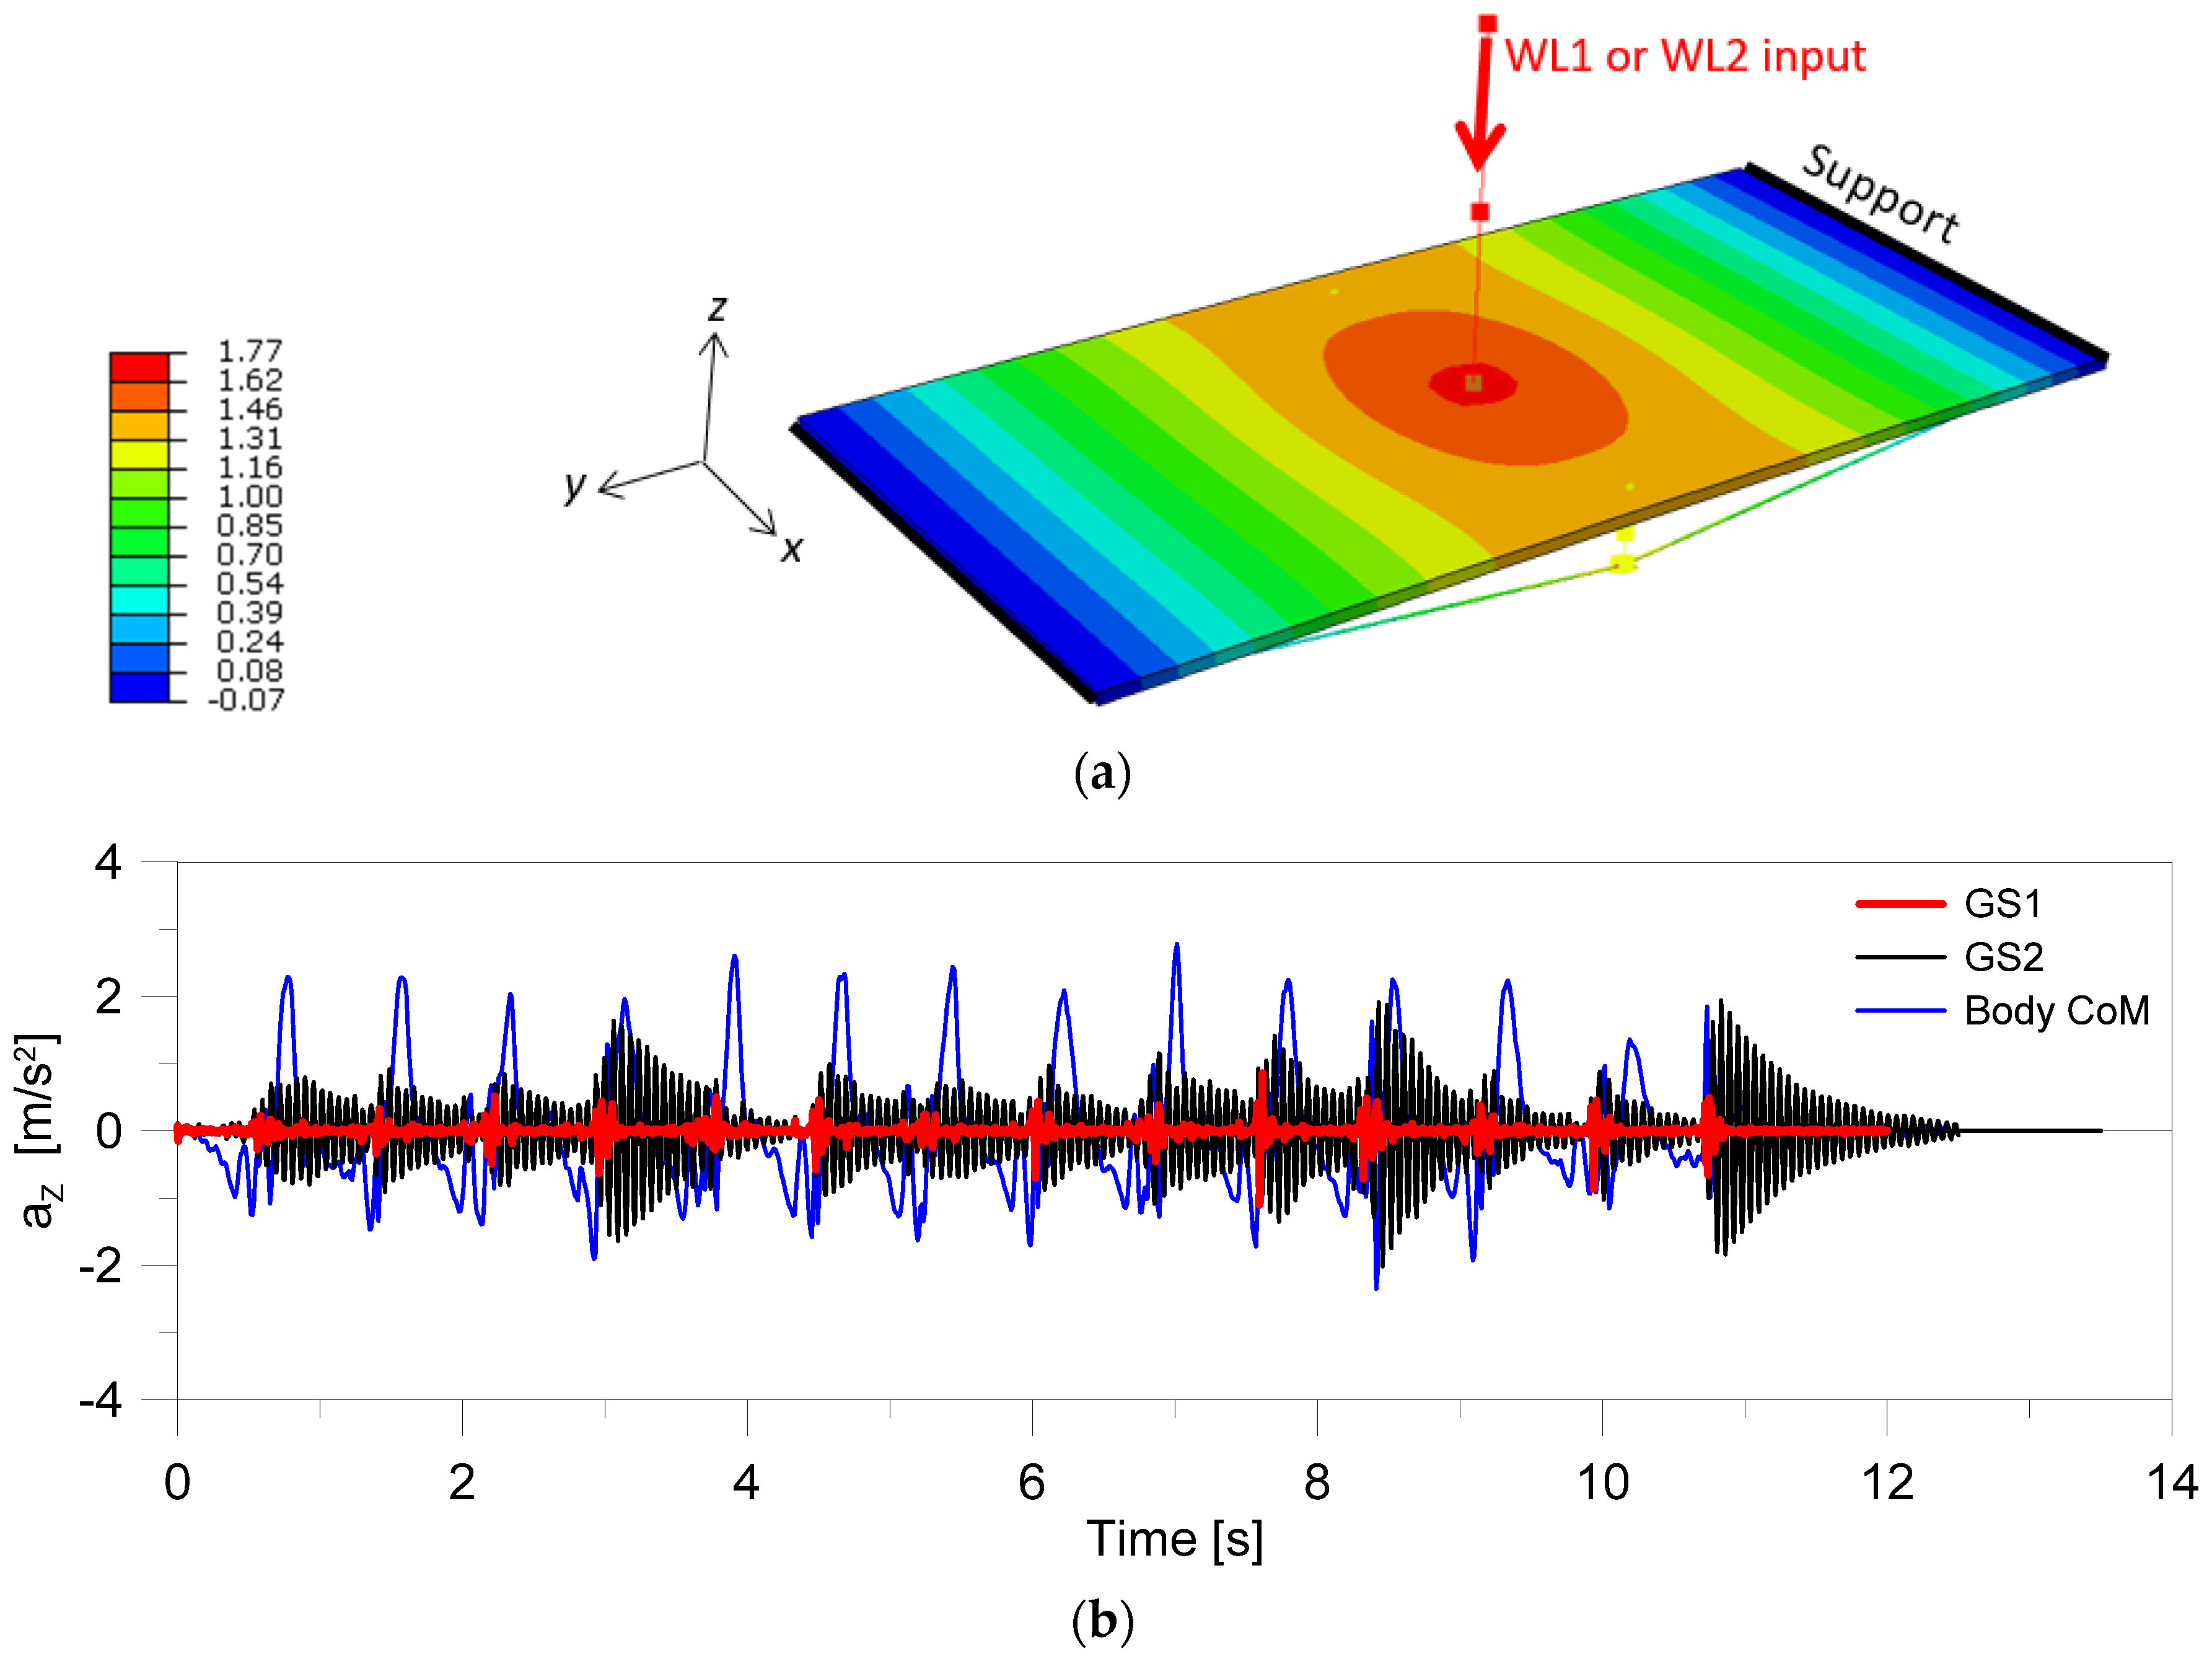
4.2. Loading Strategy and Solving Approach
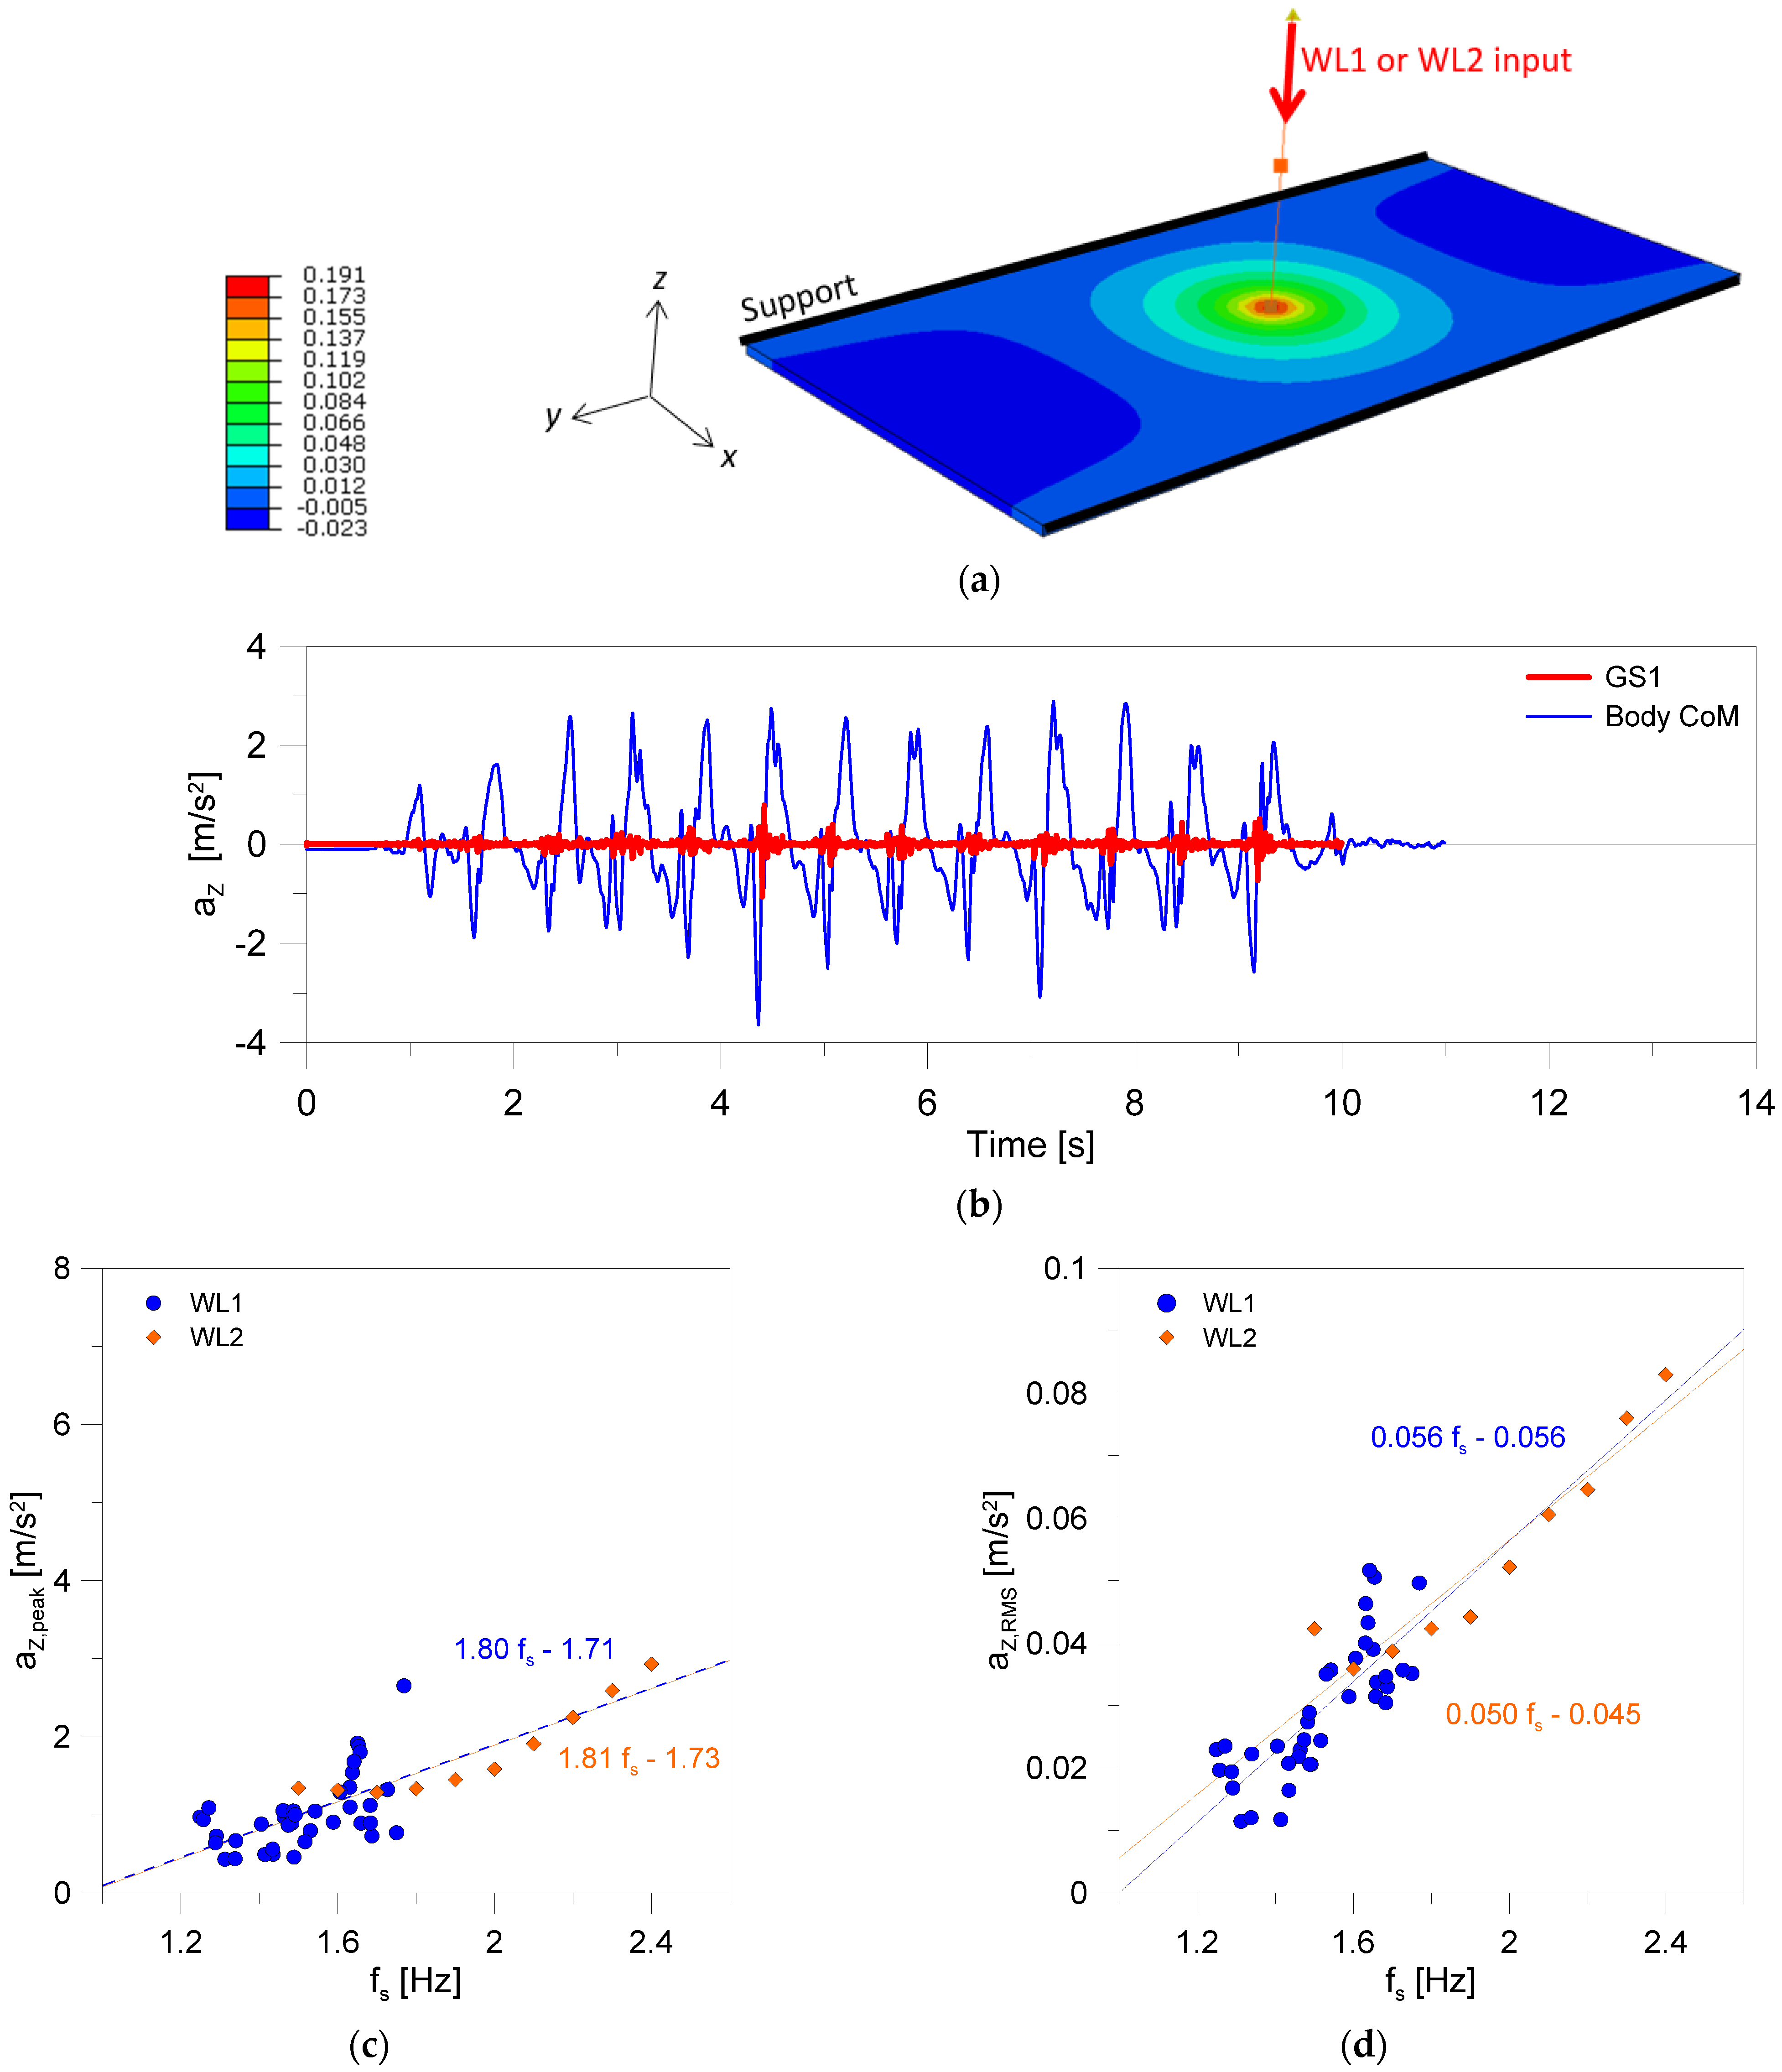
- WL1 = a set of FE models in which a single degree of freedom (SDOF) system was rigidly connected to a slab, see Figure 12a, to apply body effects on the base of vertical acceleration time histories (from laboratory experiments in Section 3 and Equation (1)) and a CoM lumped mass representative of the involved volunteer (M = 80 kg). The vertical force transferred by a pedestrian on a substructure can in fact be estimated from Newton’s second law of motion, where the dynamic term from experimental input can be expressed as:
- WL2 = a set of FE models in which the pedestrian input was described on the base of the deterministic approach in Equation (2), as in Figure 12b, for various walking frequencies fs. The range 1.5–2.5 Hz was numerically explored (with M = 80 kg and a progressive frequency increase of 0.1 Hz)
5. Discussion of Results
5.1. GS1 Performance Indicators
5.2. GS2 Performance Indicators
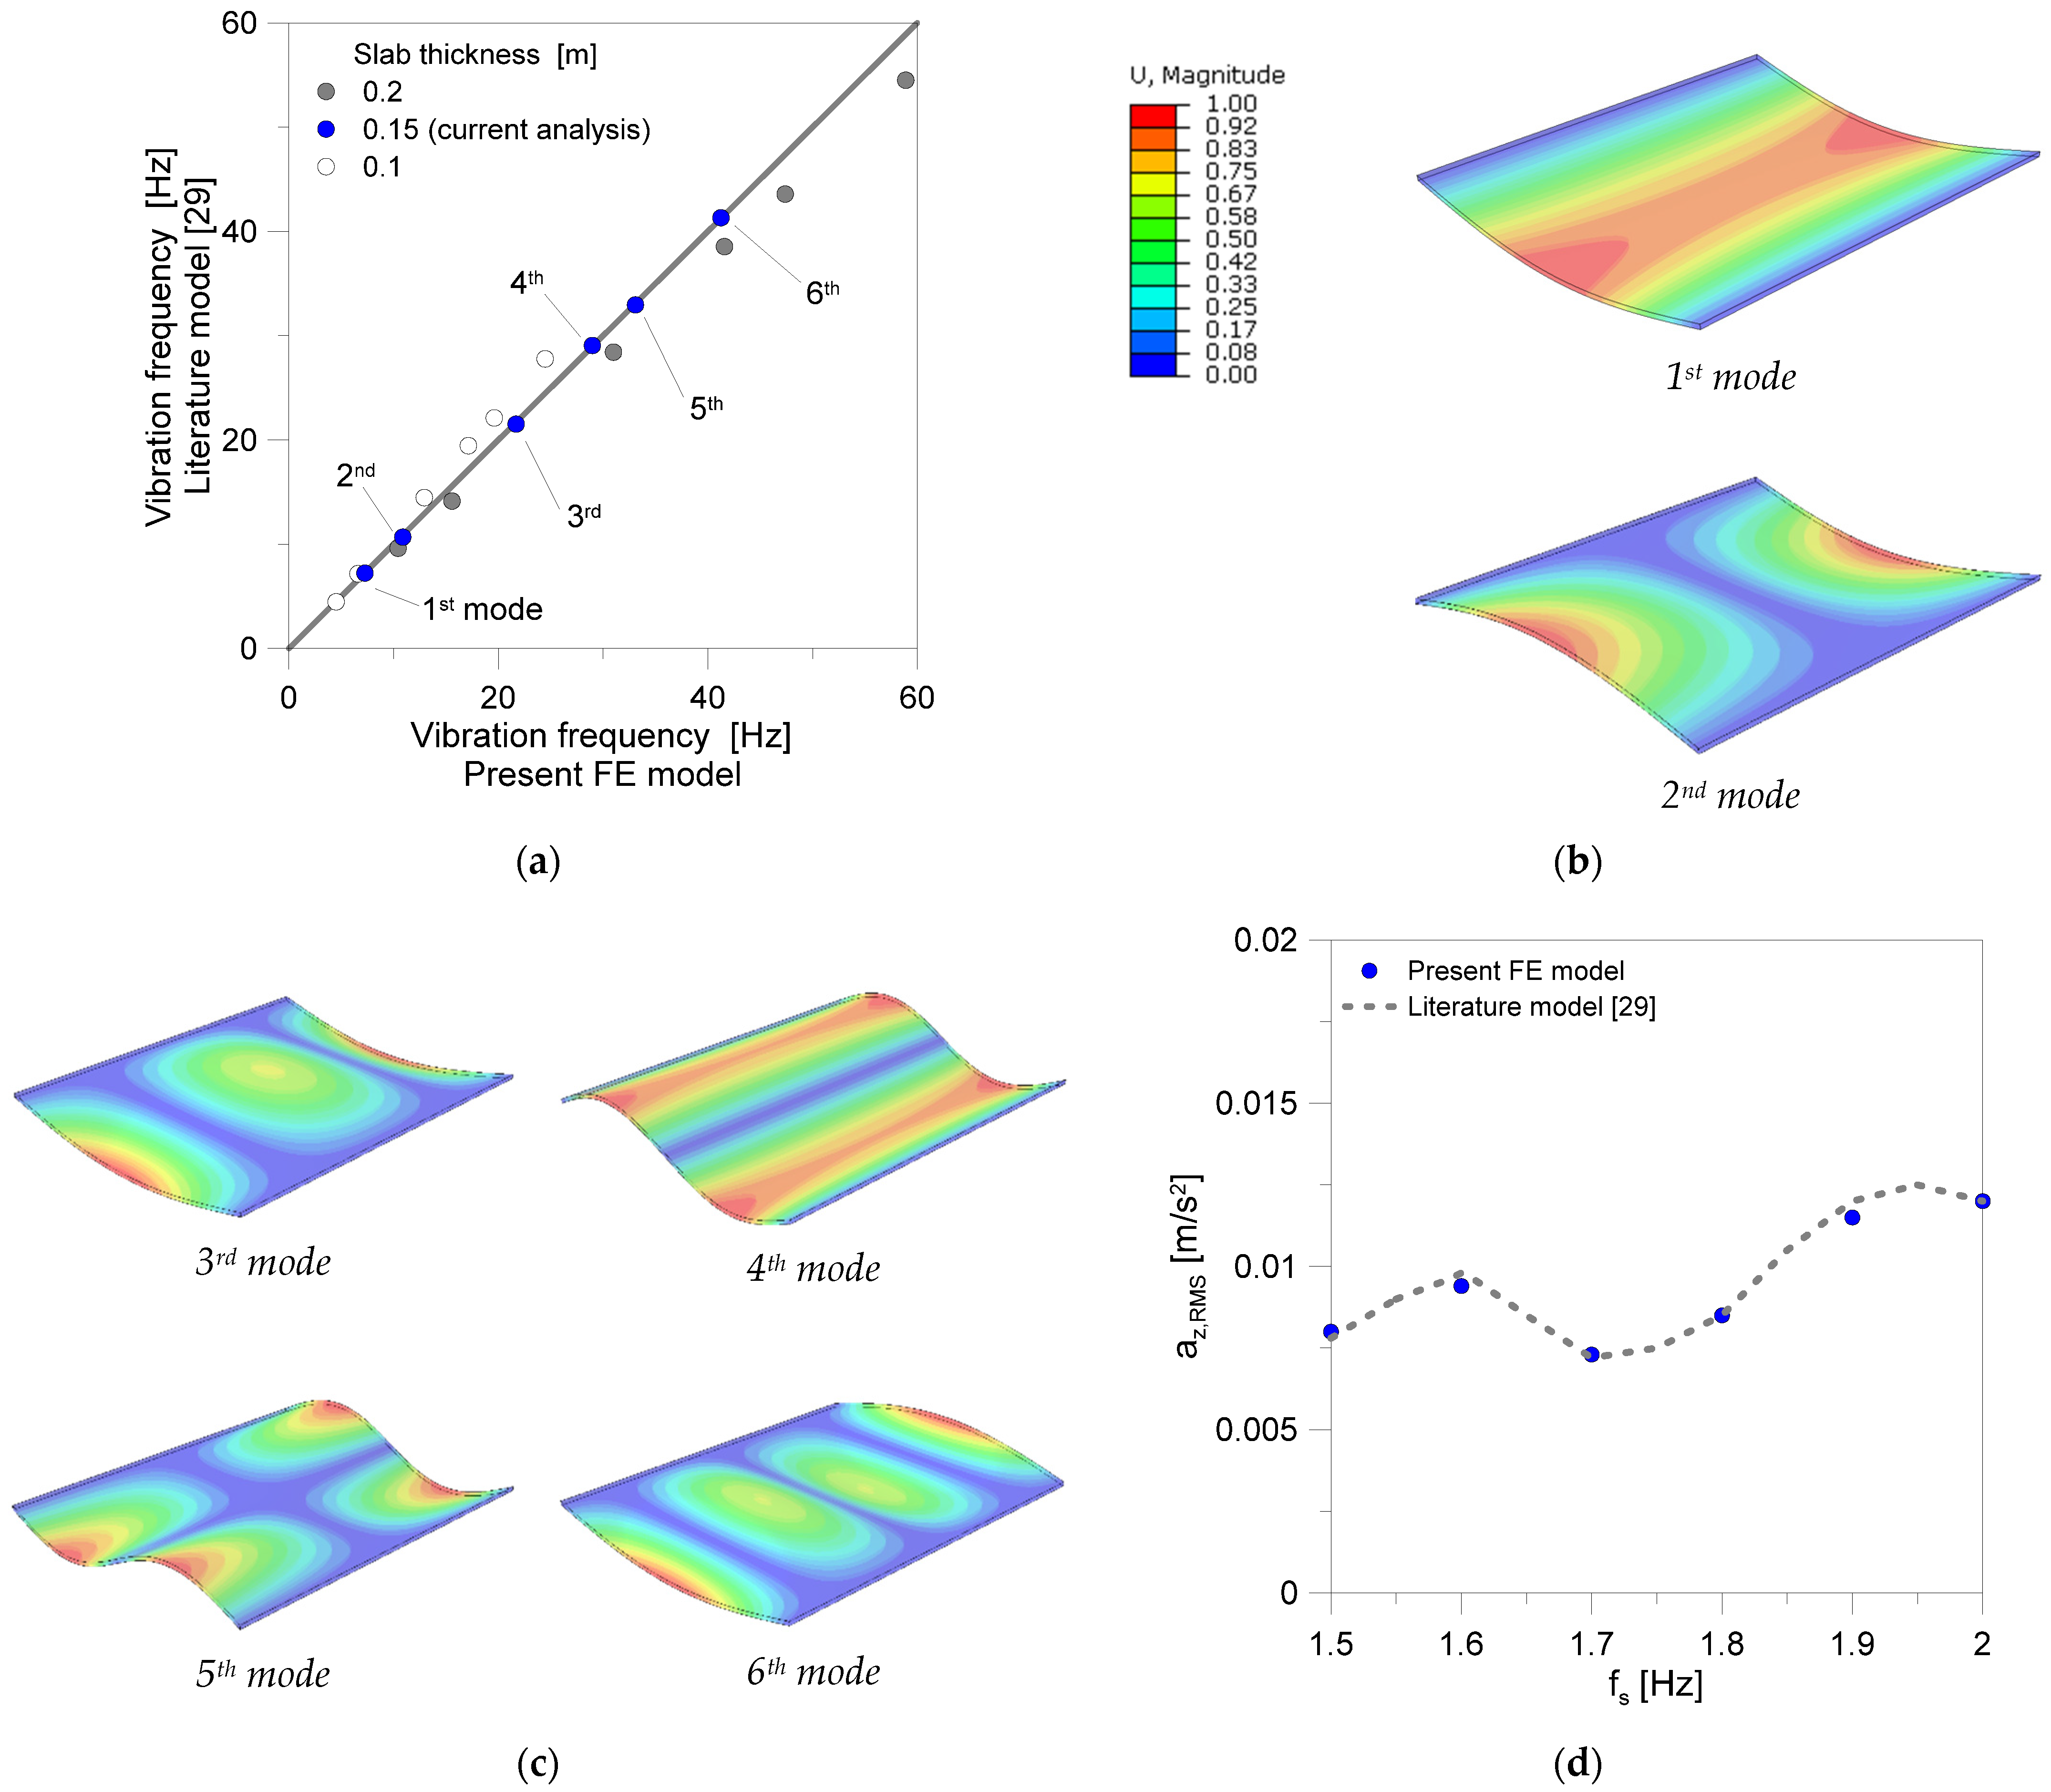
5.3. CS3 Performance Indicators
6. Conclusions
Author Contributions
Funding
Institutional Review Board Statement
Informed Consent Statement
Data Availability Statement
Conflicts of Interest
References
- CEN/TC 250; prCEN/TS xxxx-1: 2019—In-Plane Loaded Glass Components. CEN—European Committee for Standardization: Brussels, Belgium, 2019.
- CEN/TC 250; prCEN/TS xxxx-2: 2019—Out of-Plane Loaded Glass Components. CEN—European Committee for Standardization: Brussels, Belgium, 2019.
- CNR-DT 210/2013; Istruzioni Per la Progettazione, L’esecuzione ed il Controllo di Construzioni con Elementi Strutturali di Vetro. National Research Council of Italy (CNR): Roma, Italy, 2013. (In Italian)
- Zemanová, A.; Zeman, J.; Janda, T.; Schmidt, J.; Šejnoha, M. On modal analysis of laminated glass: Usability of simplified methods and Enhanced Effective Thickness. Compos. Part B Eng. 2018, 151, 92–105. [Google Scholar] [CrossRef] [Green Version]
- Zemanová, A.; Zeman, J.; Šejnoha, M. Comparison of viscoelastic finite element models for laminated glass beams. Int. J. Mech. Sci. 2017, 131-132, 380–395. [Google Scholar] [CrossRef] [Green Version]
- Bedon, C. Issues on the Vibration Analysis of In-Service Laminated Glass Structures: Analytical, Experimental and Numerical Investigations on Delaminated Beams. Appl. Sci. 2019, 9, 3928. [Google Scholar] [CrossRef] [Green Version]
- Bedon, C. Experimental investigation on vibration sensitivity of an indoor glass footbridge to walking conditions. J. Build. Eng. 2020, 29, 101195. [Google Scholar] [CrossRef]
- Bedon, C. Diagnostic analysis and dynamic identification of a glass suspension footbridge via on-site vibration experiments and FE numerical modelling. Compos. Struct. 2019, 216, 366–378. [Google Scholar] [CrossRef]
- Bedon, C.; Noè, S. Post-Breakage Vibration Frequency Analysis of In-Service Pedestrian Laminated Glass Modular Units. Vibration 2021, 4, 836–852. [Google Scholar] [CrossRef]
- Gong, M.; Li, Y.; Shen, R.; Wei, X. Glass Suspension Footbridge: Human-Induced Vibration, Serviceability Evaluation, and Vibration Mitigation. J. Bridg. Eng. 2021, 26, 05021014. [Google Scholar] [CrossRef]
- Sedlacek, G.; Heinemeyer, C.; Butz, C. Generalisation of Criteria for Floor Vibrations for Industrial, Office, Residential and Public Building and Gymnasium Halls; European Commission: Luxembourg, 2006. [Google Scholar]
- Bachmann, H.; Ammann, W. Vibrations in structures induced by man and machines. Can. J. Civ. Eng. 1987, 15, 1086–1087. [Google Scholar]
- Shahabpoor, E.; Pavic, A.; Racic, V. Interaction between Walking Humans and Structures in Vertical Direction: A Literature Review. Shock Vib. 2016, 2016, 3430285. [Google Scholar] [CrossRef] [Green Version]
- Miyazaki, S. Long-term unrestrained measurement of stride length and walking velocity utilizing a piezoelectric gyroscope. IEEE Trans. Biomed. Eng. 1997, 44, 753–759. [Google Scholar] [CrossRef]
- Veltink, P.H.; Bussmann, H.B.J.; De Vries, W.; Martens, W.L.J.; Van Lummel, R.C. Detection of static and dynamic activities using uniaxial accelerometers. IEEE Trans. Rehabil. Eng. 1996, 4, 375–385. [Google Scholar] [CrossRef] [Green Version]
- Sabatini, A.M.; Martelloni, C.; Scapellato, S.; Cavallo, F. Assessment of Walking Features from Foot Inertial Sensing. IEEE Trans. Biomed. Eng. 2005, 52, 486–494. [Google Scholar] [CrossRef] [Green Version]
- Van Nimmen, K.; Lombaert, G.; Jonkers, I.; De Roeck, G.; Van den Broeck, P. Characterisation of walking loads by 3D inertial motion tracking. J. Sound Vib. 2014, 333, 5212–5226. [Google Scholar] [CrossRef] [Green Version]
- Van Nimmen, K.; Zhao, G.; Seyfarth, A.; Van den Broeck, P. A Robust Methodology for the Reconstruction of the Vertical Pedestrian-Induced Load from the Registered Body Motion. Vibration 2018, 1, 250–268. [Google Scholar] [CrossRef] [Green Version]
- Bocian, M.; Brownjohn, J.; Racic, V.; Hester, D.; Quattrone, A.; Monnickendam, R. A framework for experimental determination of localised vertical pedestrian forces on full-scale structures using wireless attitude and heading reference systems. J. Sound Vib. 2016, 376, 217–243. [Google Scholar] [CrossRef] [Green Version]
- Simonetti, E.; Bergamini, E.; Vannozzi, G.; Bascou, J.; Pillet, H. Estimation of 3D Body Center of Mass Acceleration and Instantaneous Velocity from a Wearable Inertial Sensor Network in Transfemoral Amputee Gait: A Case Study. Sensors 2021, 21, 3129. [Google Scholar] [CrossRef]
- Busca, G.; Cappellini, A.; Manzoni, S.; Tarabini, M.; Vanali, M. Quantification of changes in modal parameters due to the presence of passive people on a slender structure. J. Sound Vib. 2014, 333, 5641–5652. [Google Scholar] [CrossRef]
- Setareh, M.; Gan, S. Vibration testing, analysis and human-structure interaction studies of a slender footbridge. J. Perform. Constr. Facil. 2018, 32, 040018068. [Google Scholar] [CrossRef]
- Muhammad, Z.; Reynolds, P.; Avci, O.; Hussein, M. Review of Pedestrian Load Models for Vibration Serviceability Assessment of Floor Structures. Vibration 2019, 2, 1–24. [Google Scholar] [CrossRef] [Green Version]
- Bedon, C.; Fasan, M. Reliability of field experiments, analytical methods and pedestrian’s perception scales for the vibration serviceability assessment of an in-service glass walkway. Appl. Sci. 2019, 9, 1936. [Google Scholar] [CrossRef] [Green Version]
- Bedon, C.; Mattei, S. Facial Expression-Based Experimental Analysis of Human Reactions and Psychological Comfort on Glass Structures in Buildings. Buildings 2021, 11, 204. [Google Scholar] [CrossRef]
- BeanDevice® Wilow® User Manual—Wilow® Wireless Sensor, version 2.3.2; BenAir: Berlin, Germany, 2019.
- Bedon, C.; Bergamo, E.; Izzi, M.; Noé, S. Prototyping and Validation of MEMS Accelerometers for Structural Health Monitoring—The Case Study of the Pietratagliata Cable-Stayed Bridge. J. Sens. Actuator Netw. 2018, 7, 30. [Google Scholar] [CrossRef] [Green Version]
- ABAQUS Computer Software v.6.14; Simulia: Dassault, RI, USA, 2021.
- Cai, Y.; Gong, G.; Xia, J.; He, J.; Hao, J. Simulations of human-induced floor vibrations considering walking overlap. SN Appl. Sci. 2019, 2, 19. [Google Scholar] [CrossRef] [Green Version]
- Clough, R.W.; Penzien, J. Dynamics of Structures; McGrawHill: Berkeley, CA, USA, 1993. [Google Scholar]


| Coefficient | fs (Hz) | ||
|---|---|---|---|
| ≤1.75 | 1.75 ÷ 2 | ≥2 | |
| K1 | −8 fs + 38 | 24 fs − 18 | 75 fs − 120 |
| K2 | 376 fs − 844 | −404 fs + 521 | −1720 fs + 3153 |
| K3 | −2804 fs + 6025 | 4224 fs − 6274 | 17,055 fs − 31,936 |
| K4 | 6308 fs − 16,573 | −29,144 fs + 45,468 | −94,265 fs + 175,710 |
| K5 | 1732 fs − 13,619 | 109,976 fs − 175,808 | 298,940 fs − 553,736 |
| K6 | −24,638 fs + 16,045 | −217,424 fs + 353,403 | −529,390 fs + 977,335 |
| K7 | 31,836 fs − 33,614 | 212,776 fs − 350,259 | 481,665 fs − 888,073 |
| K8 | −12,948 fs + 15,532 | −81,572 fs + 135,624 | −174,265 fs + 321,008 |
| Samples | Frequency | Length | Velocity | |||
|---|---|---|---|---|---|---|
| fs (Hz) | Range (Hz) | Ls (m) | R | vs (m/s) | R | |
| 40 | 1.517 (±0.153) | 1.248–1.769 | 0.702 (±0.124) | 0.66 | 1.078 (±0.270) | 0.84 |
| Samples | Peak | Average | Peak-to-Peak | ||||
|---|---|---|---|---|---|---|---|
| (m/s2) | Range (m/s2) | R | (m/s2) | R | (m/s2) | R | |
| 40 | 3.348 (±1.057) | 1.840–5.913 | 0.71 | 0.0032 (±0.003) | 0.34 | 6.219 (±1.736) | 0.75 |
| Material Property | Unit | Glass | Interlayer | Steel (for GS2 Only) |
|---|---|---|---|---|
| Modulus of elasticity | MPa | 70000 | 4 | 160000 |
| Poisson’s ratio | - | 0.23 | 0.49 | 0.3 |
| Density | kg/m3 | 2500 | 1100 | 7850 |
| Slab | Material | Size (m2) | Span (m) | Thickness (m) | Span/Thickness | λ | MTOT (kg) | RM | f1 * (Hz) |
|---|---|---|---|---|---|---|---|---|---|
| GS1 | Laminated glass | 1.35 × 2.65 | 1.35 | 0.04352 | ≈31 | 107 | 320 | ≈4 | 51.2 |
| GS2 | Laminated glass | 1.35 × 2.65 | 2.65 | 0.04352 | ≈61 | 211 | 320 | ≈4 | 14.3 |
| CS3 | Concrete | 5 × 6 | 5 | 0.15 | ≈33 | 115 | 11,250 | ≈140 | 7.1 |
Publisher’s Note: MDPI stays neutral with regard to jurisdictional claims in published maps and institutional affiliations. |
© 2022 by the authors. Licensee MDPI, Basel, Switzerland. This article is an open access article distributed under the terms and conditions of the Creative Commons Attribution (CC BY) license (https://creativecommons.org/licenses/by/4.0/).
Share and Cite
Bedon, C.; Noè, S. Uncoupled Wi-Fi Body CoM Acceleration for the Analysis of Lightweight Glass Slabs under Random Walks. J. Sens. Actuator Netw. 2022, 11, 10. https://doi.org/10.3390/jsan11010010
Bedon C, Noè S. Uncoupled Wi-Fi Body CoM Acceleration for the Analysis of Lightweight Glass Slabs under Random Walks. Journal of Sensor and Actuator Networks. 2022; 11(1):10. https://doi.org/10.3390/jsan11010010
Chicago/Turabian StyleBedon, Chiara, and Salvatore Noè. 2022. "Uncoupled Wi-Fi Body CoM Acceleration for the Analysis of Lightweight Glass Slabs under Random Walks" Journal of Sensor and Actuator Networks 11, no. 1: 10. https://doi.org/10.3390/jsan11010010
APA StyleBedon, C., & Noè, S. (2022). Uncoupled Wi-Fi Body CoM Acceleration for the Analysis of Lightweight Glass Slabs under Random Walks. Journal of Sensor and Actuator Networks, 11(1), 10. https://doi.org/10.3390/jsan11010010