1. Introduction
Cellular manufacturing systems have shown considerable good results in batch manufacturing platforms. Some of the advantages of cellular manufacturing are: throughput time reduction, smaller Work in Process, flexibility increase, product quality improvement and control simplification. The high flexibility cell design is recognized by the research community as a complex optimization problem [
1]. This flexibility leads to some wired network implementation difficulties. Implementing wireless technologies should ease the wired connections main drawbacks and facilitates the increase of the number of devices, expanding the factory network, being able to increase the layout flexibility. Machine-to-machine (M2M) communications are not new to industries. Message queuing telemetry transport (MQTT) [
2], is very known Internet of Things (IoT) M2M connectivity. Factory automation has been based on tight sensor-actuator control loops, where sensors “feed” data into Programmable Logic Controllers through the wired analog and digital I/O ports of the controllers [
3,
4,
5].
The availability of machines and other critical assets directly affects the effectiveness of manufacturing operations. Critical information systems may provide either real time or estimated information which presents a great potential for saving production costs. The data collected, being accessible online from anywhere, could be used to optimize decision-making throughout the manufacturing line, increasing its efficiency and responsiveness [
6].
With the goal of implementing a flexible, secure, easy to maintain and capable to evolve infrastructure, industries need to adapt quickly to this constant technological evolution, implementing measures and connecting machines and robots at critical points to the Internet, instrumenting them using the concept of IoT.
IoT is getting increased public acceptance, leading to higher investments and developments [
7,
8,
9,
10]. The cloud services infrastructures supported the rise of new dedicated IoT cloud infrastructures, allowing device representations that ease the integration of sensors and actuators connected with each other by software solutions and Artificial Intelligence (AI) bots [
11,
12].
The higher investment and adoption of IoT support leads to an increase of IoT solutions offered in the market. The diversified offer of IoT technologies and solutions to solve the same problems and suppress the same needs, lead to new challenges [
3,
9,
10,
13,
14,
15,
16]. This multiplicity of solutions brings an extra effort to assure extra security measures that can overcome existing threats and overseen future risks [
17].
Security is one of the main factors for enabling the widespread adoption of IoT technologies in industries and professional environments. Data encryption, integrity and authentication are the major issues in security that should be carefully analyzed [
18].
In [
19] the authors propose schemes that can be used to encrypt and authenticate any digital data not only images. In [
20] the authors show a comparative analysis versus related works that also use chaotic encryption and classic algorithms, such as: AES, DES, 3DES and IDEA. The security analysis confirms that the proposed process to improve the randomness of chaotic maps, is appropriate to implement an encryption scheme that is secure and robust against several known attacks and other statistical tests. Finally, it was experimentally verified that this chaotic encryption scheme can be used in practical applications such as M2M and IoT.
This paper is a contribution for IoT application in Smart Industries, under the Industry 4.0 scope. Results are shown upgrading a legacy wired manufacturing cell composed by seven stages, towards IoT. A multi-layer wireless solution using ZigBee mesh network is proposed for local communication. The exchange data command frame, the network security using multiple encryption algorithms and necessary modules are presented and discussed. The legacy equipment is kept but adapted to the new IoT technologies.
The paper is organized as follows.
Section 2 presents an introduction to manufacturing cells, IoT and the contributions of IoT implementation to the Smart Industry.
Section 3 presents the actual state of the existing manufacturing cell.
Section 4 presents the IoT services proposed architecture.
Section 5 presents the field tests conducted to evaluate the key aspects of the proposed architecture. Finally,
Section 6 outlines the conclusions and further work.
2. Internet of Things
The British technology pioneer Kevin Ashton, co-founder of the Auto-ID Center at the Massachusetts Institute of Technology (MIT), is known by introducing the term IoT in 1999. IoT is not just a new definition of interconnected things over the Internet [
21]. The exponentially increasing implementation phenomenon has been driven by the recent developments and price reduction of smart devices, cloud computing services, sensors and actuators that are able to interconnect to each other over the internet. The reduced price of those IoT essential components, allied to the open source nature of many of them and recent investments, result on the quick expansion of their adoption.
Multiple IoT definitions and designations have been presented by different technological companies, research institutes, independent organizations and governments. Some of those designations are: Internet of Sensors and Actuators; Internet of Everything; Smarter Planet; Industrial Internet among others. On this work the IoT will be referring the interrelationship of physical and digitally connected world supported by embedded technology and software cloud services, aiming to simplify, facilitate and enhance business processes and operators life, offering at the same time a platform to interconnect and manage all the intervenient devices.
Communication infrastructures are a very important part in the IoT structure, allowing the communication and interaction between different machines, sensors and actuators.
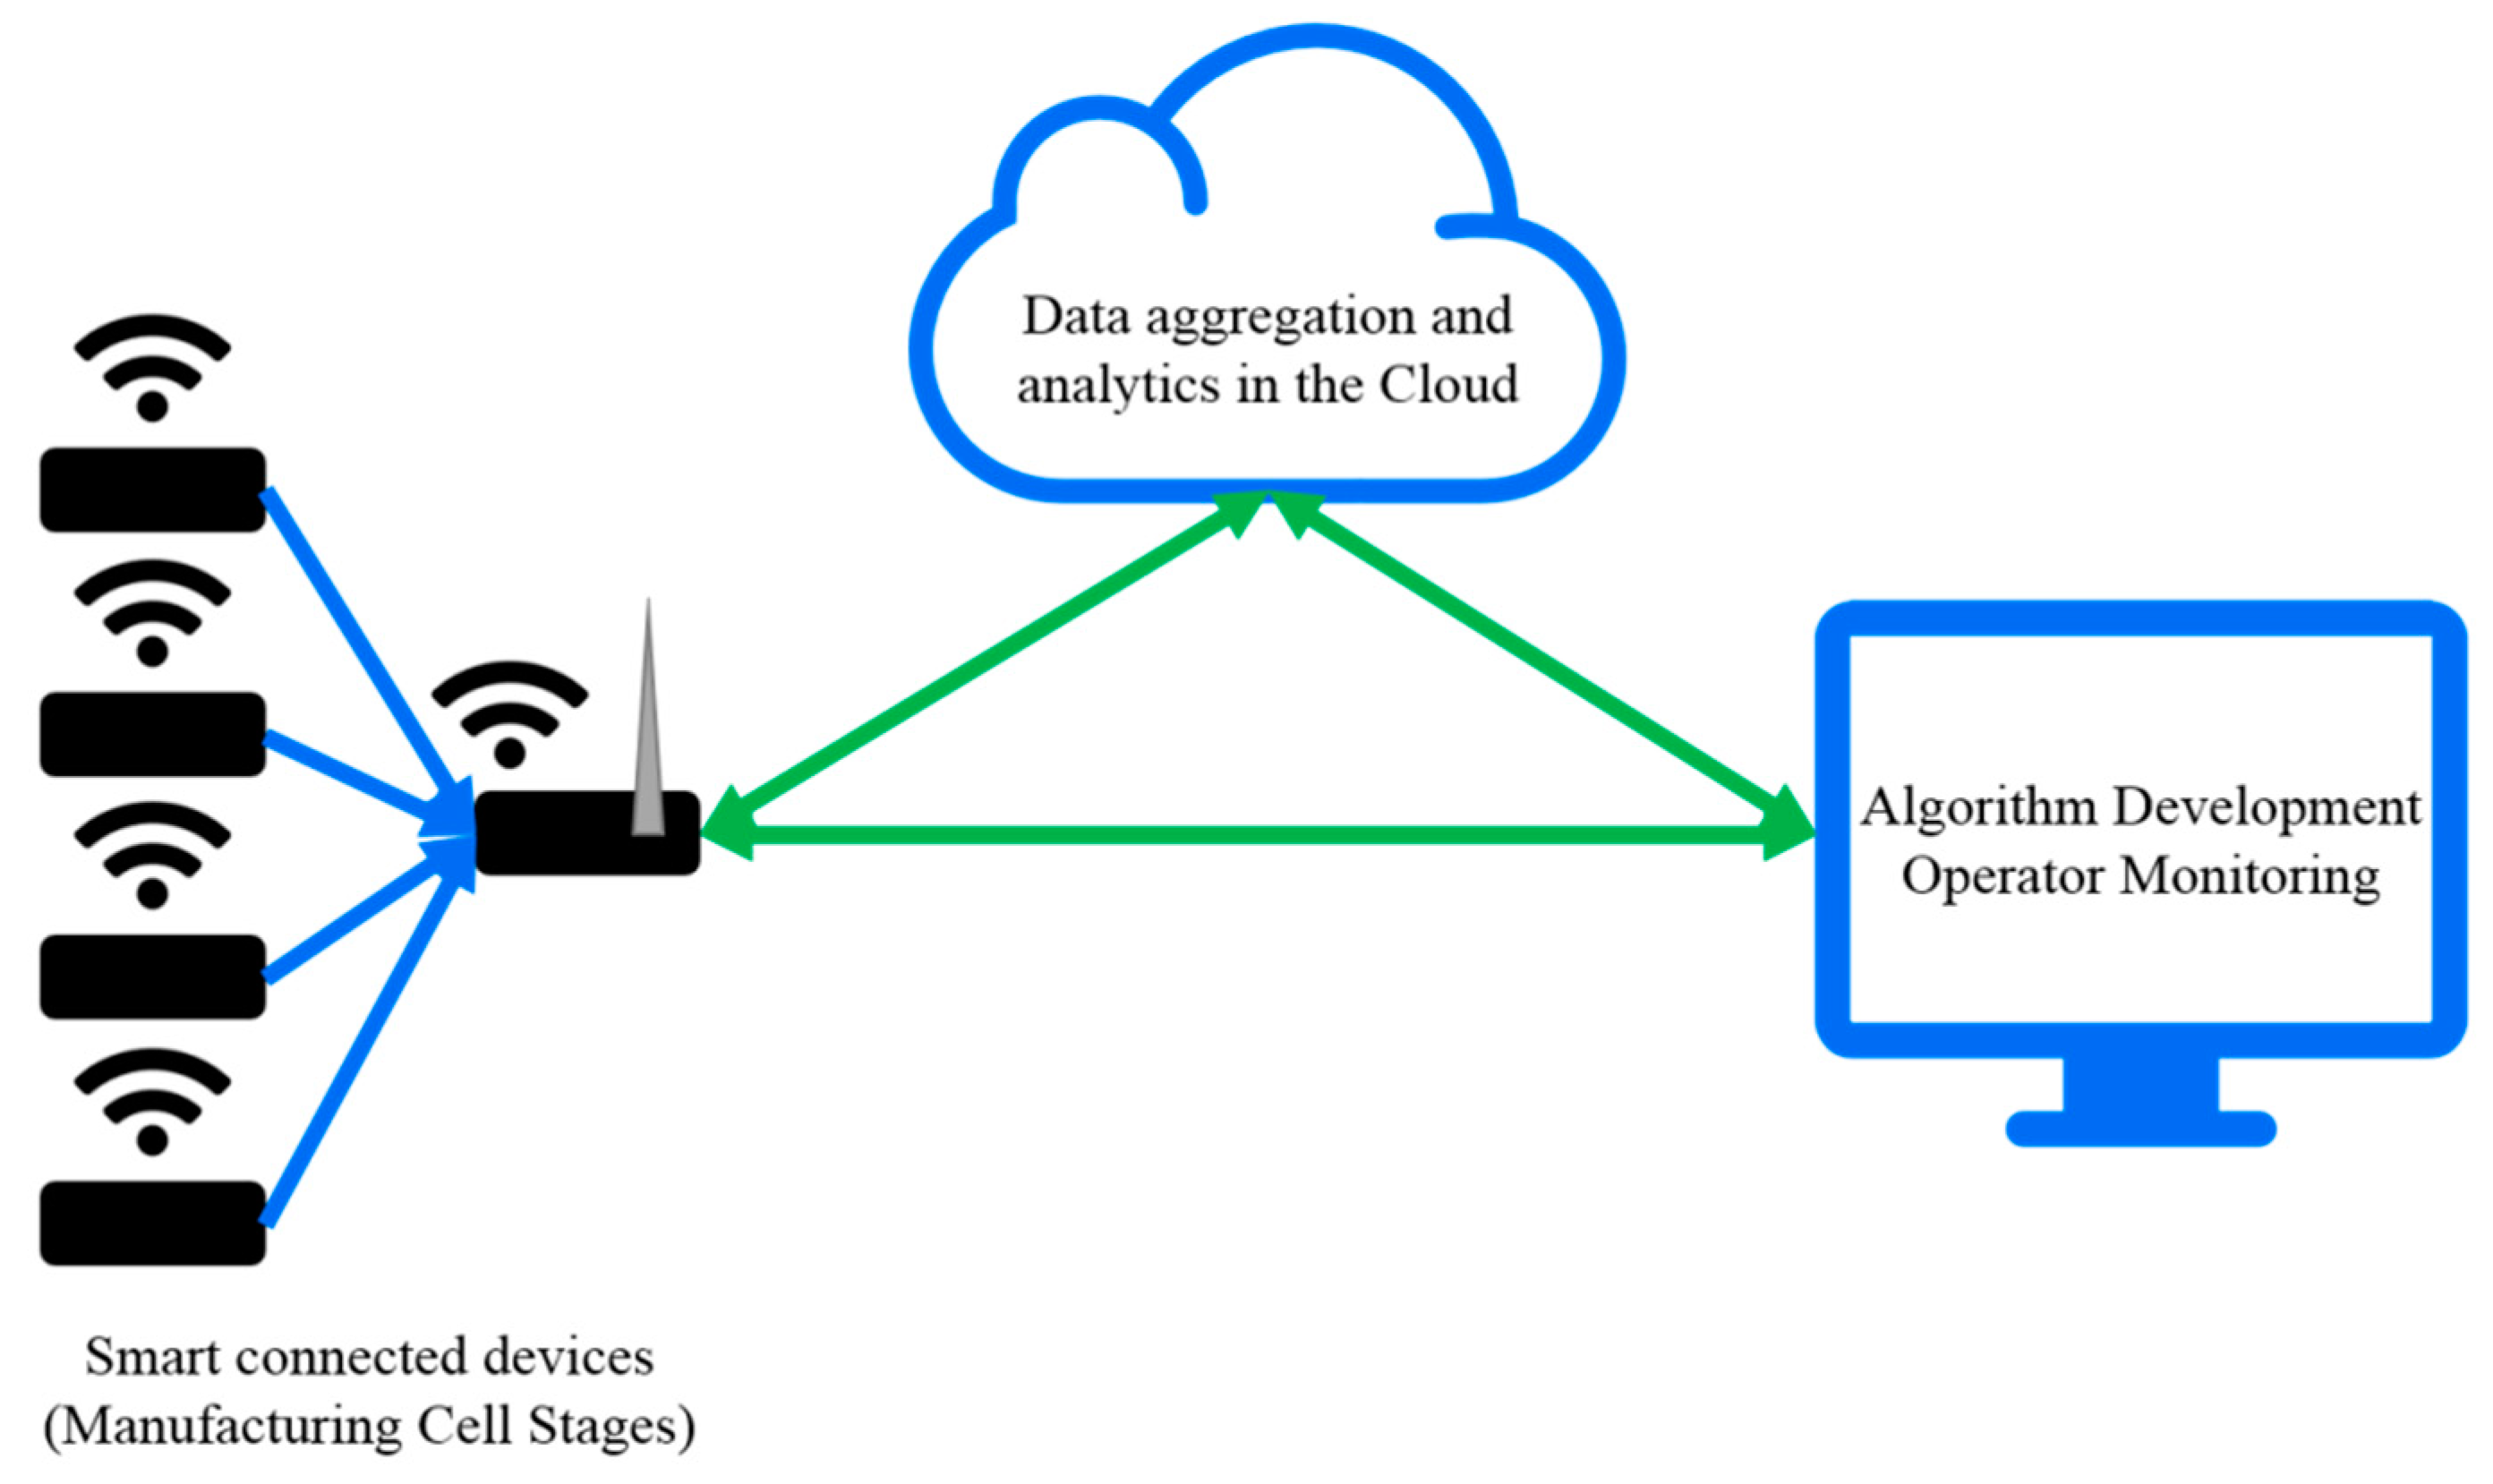
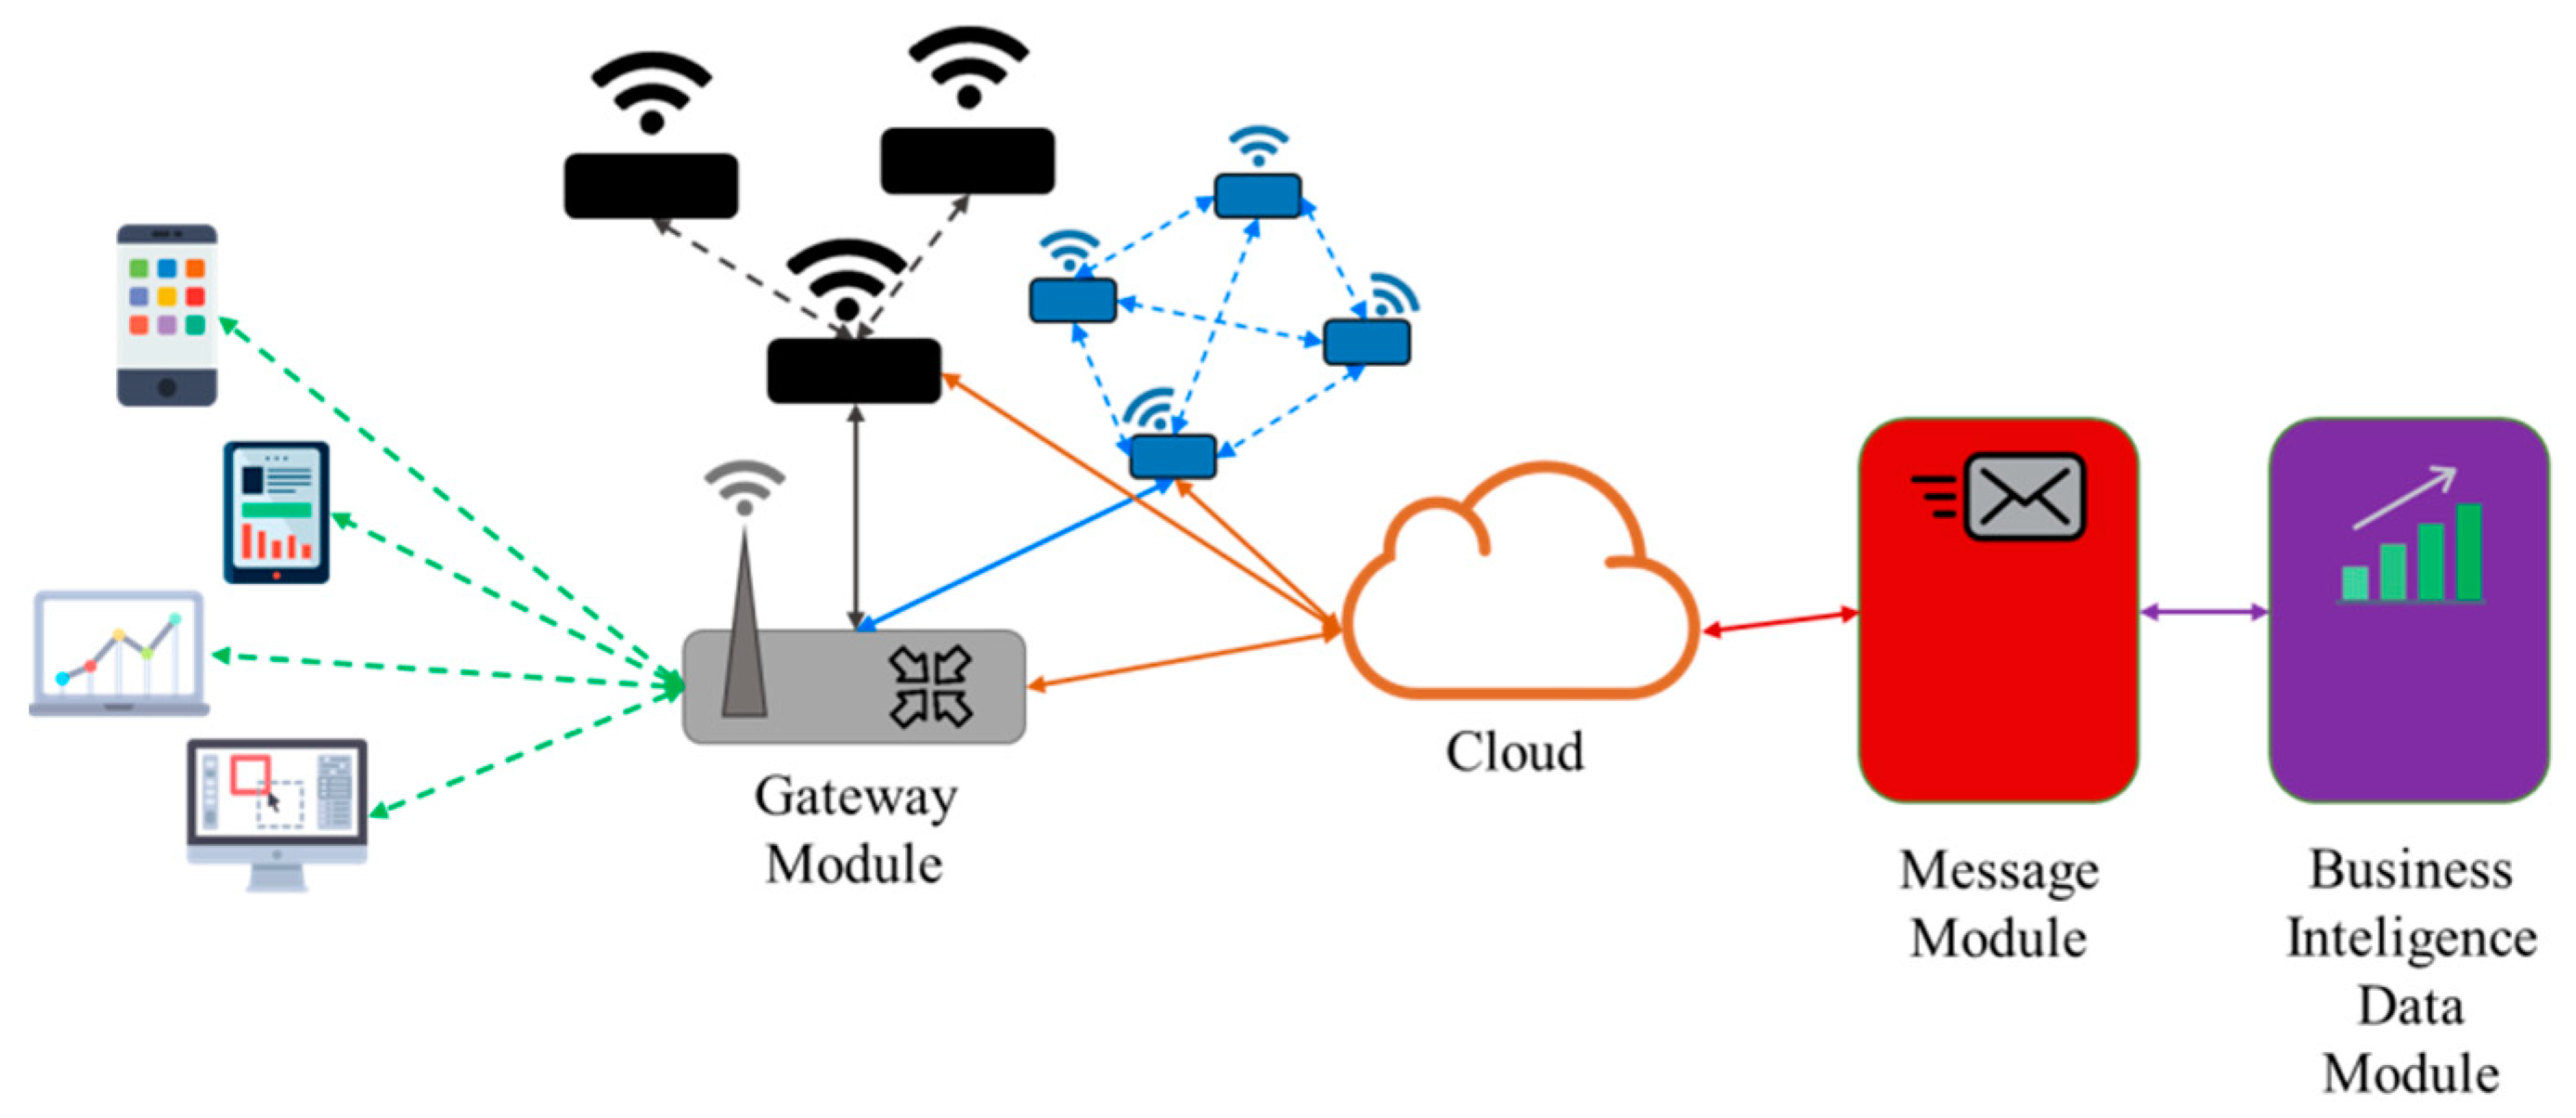
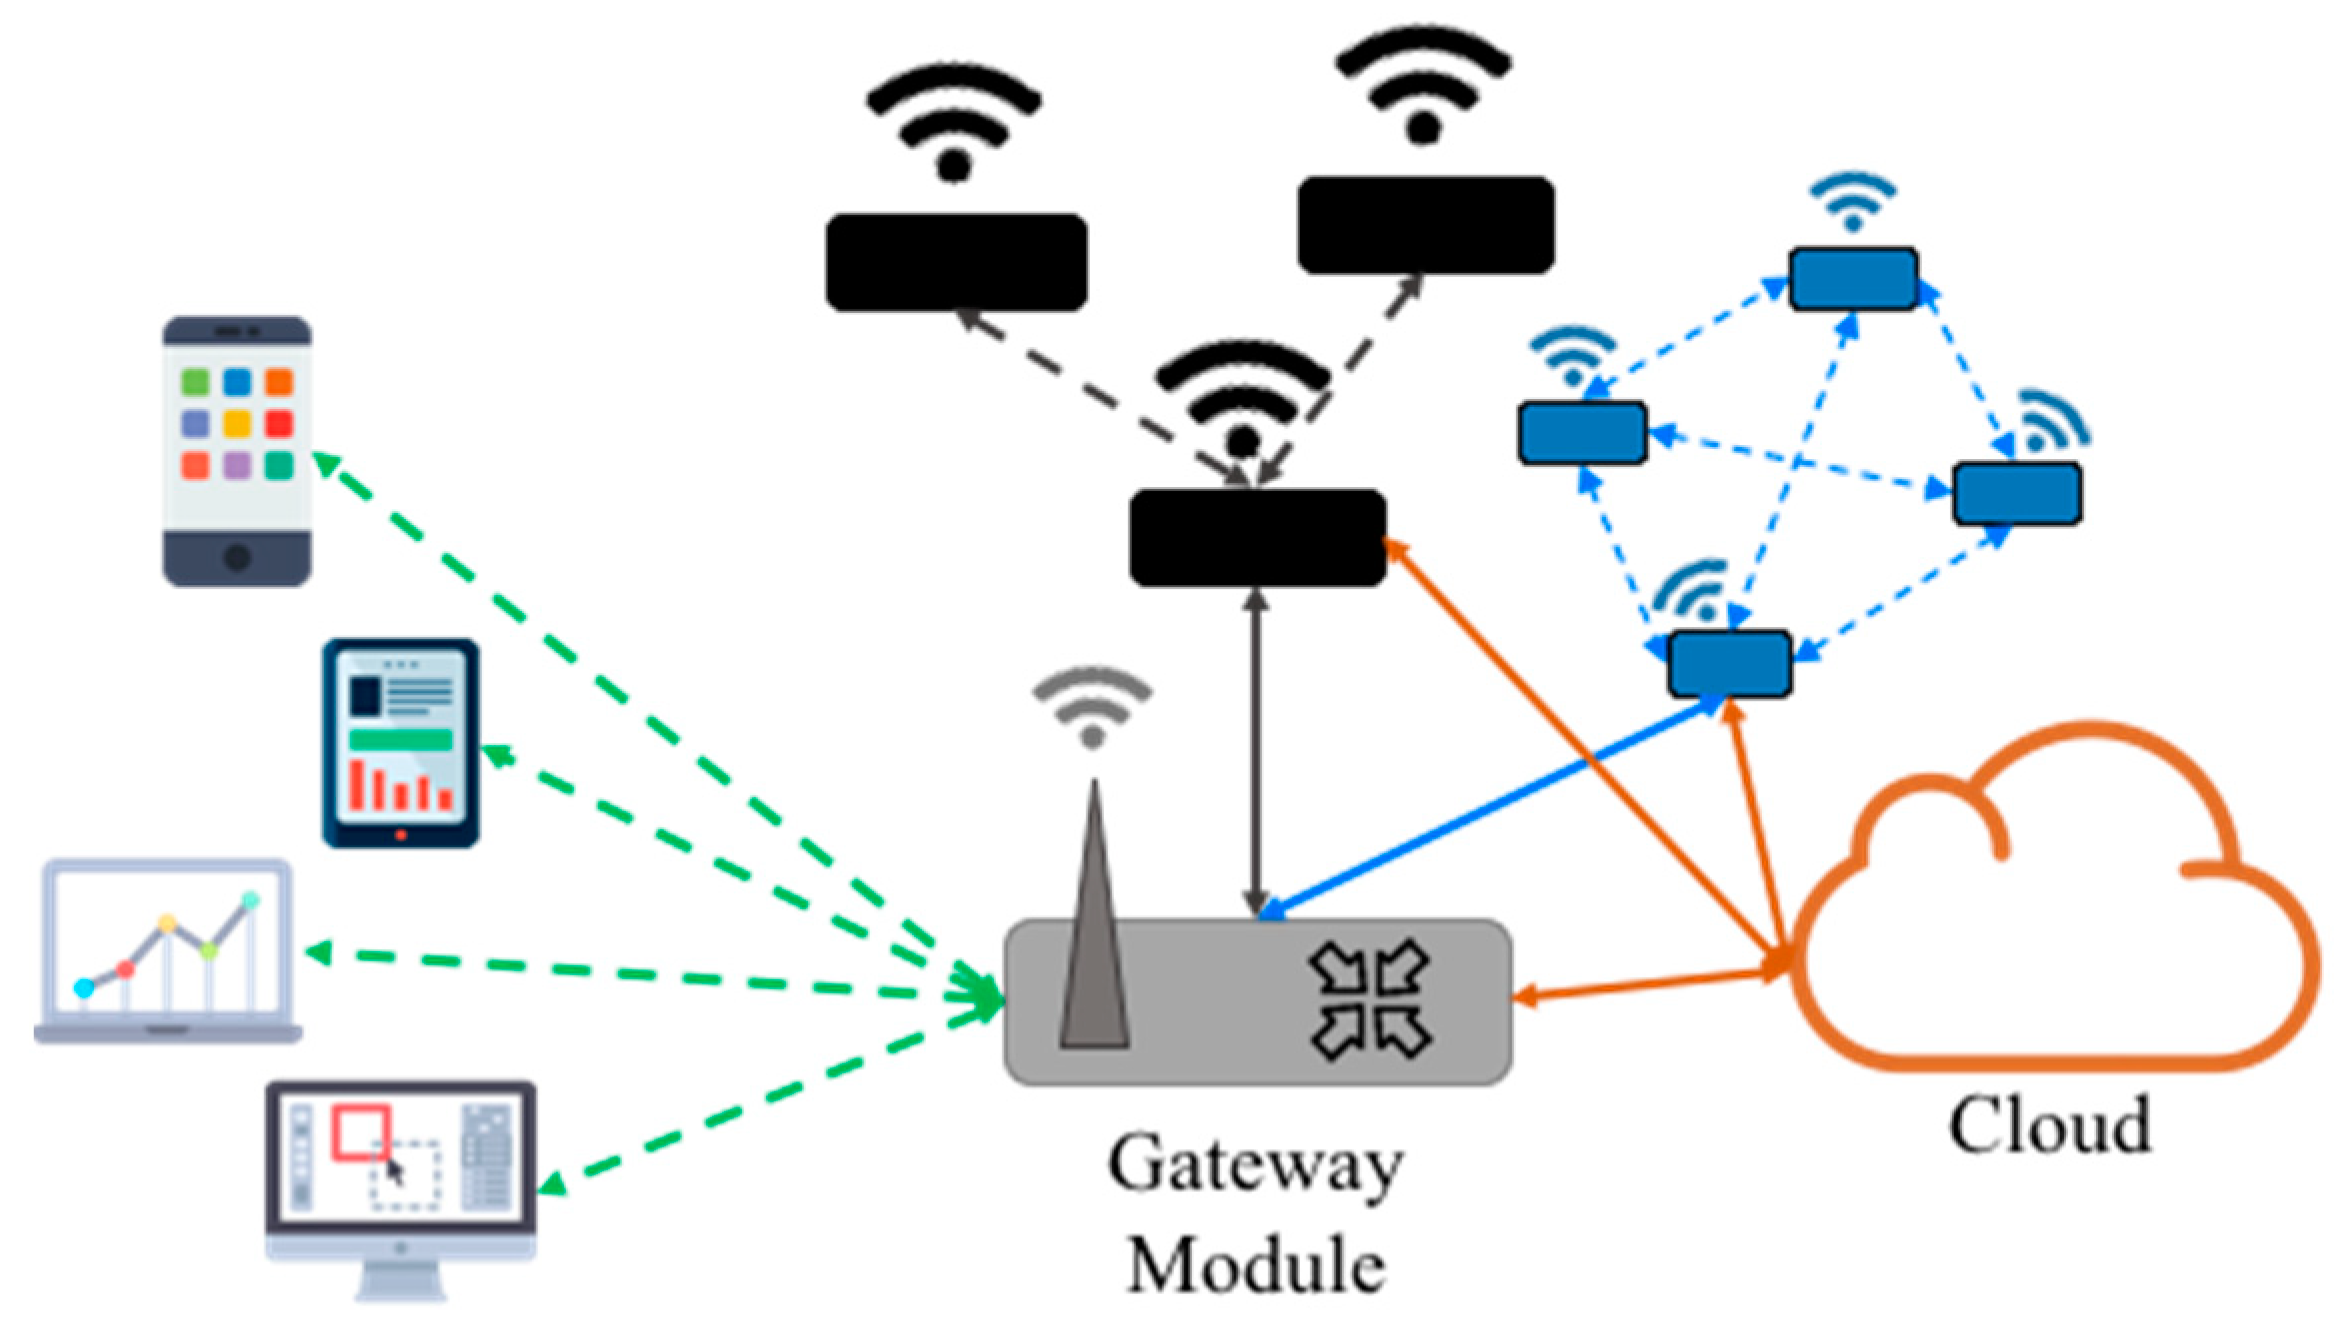
The IoT components are becoming less expensive, smaller, with increased functionality and more interconnected. As they became more accessible in the off-the-shelf market, small entrepreneur companies emerged, which in turn brought new insights of the IoT solutions. The embedded technologies may have restricted processing power that is needed to sense, control and interact with the physical world, offered by simple and cheap microcontroller kits. The embedded devices need to be connected with services that bring the IoT alive by wire or wireless communication devices. The embedded devices although having some internal processing capabilities are not able to offer a full IoT experience. To simplify, facilitate and enhance business processes and operators’ activity, the embedded devices must be supported by services and software, which live in their majority in the Cloud. The interconnections between the industrial cell, the operator monitoring and the cloud are illustrated in
Figure 1.
IoT brings new market possibilities for Smart Industries services providers, but at the same time brings several technology and security issues that need to be considered to offer products that are appellant to the clients and market competitive for the present and for the future IoT.
Modern industries can’t ignore the integration of IoT, with a growing implementation of control solutions wirelessly using the Internet, converting them into Smart Industries. The most obvious direction is to apply the concepts and all this IoT development to solve and simplify everyday tasks in industries, such as remote monitoring, offline planning, big data analysis or real-time control. It is possible already to find some tools for the selective control of workspace lighting, irrigation systems, measuring stations for the local air quality, among many others.
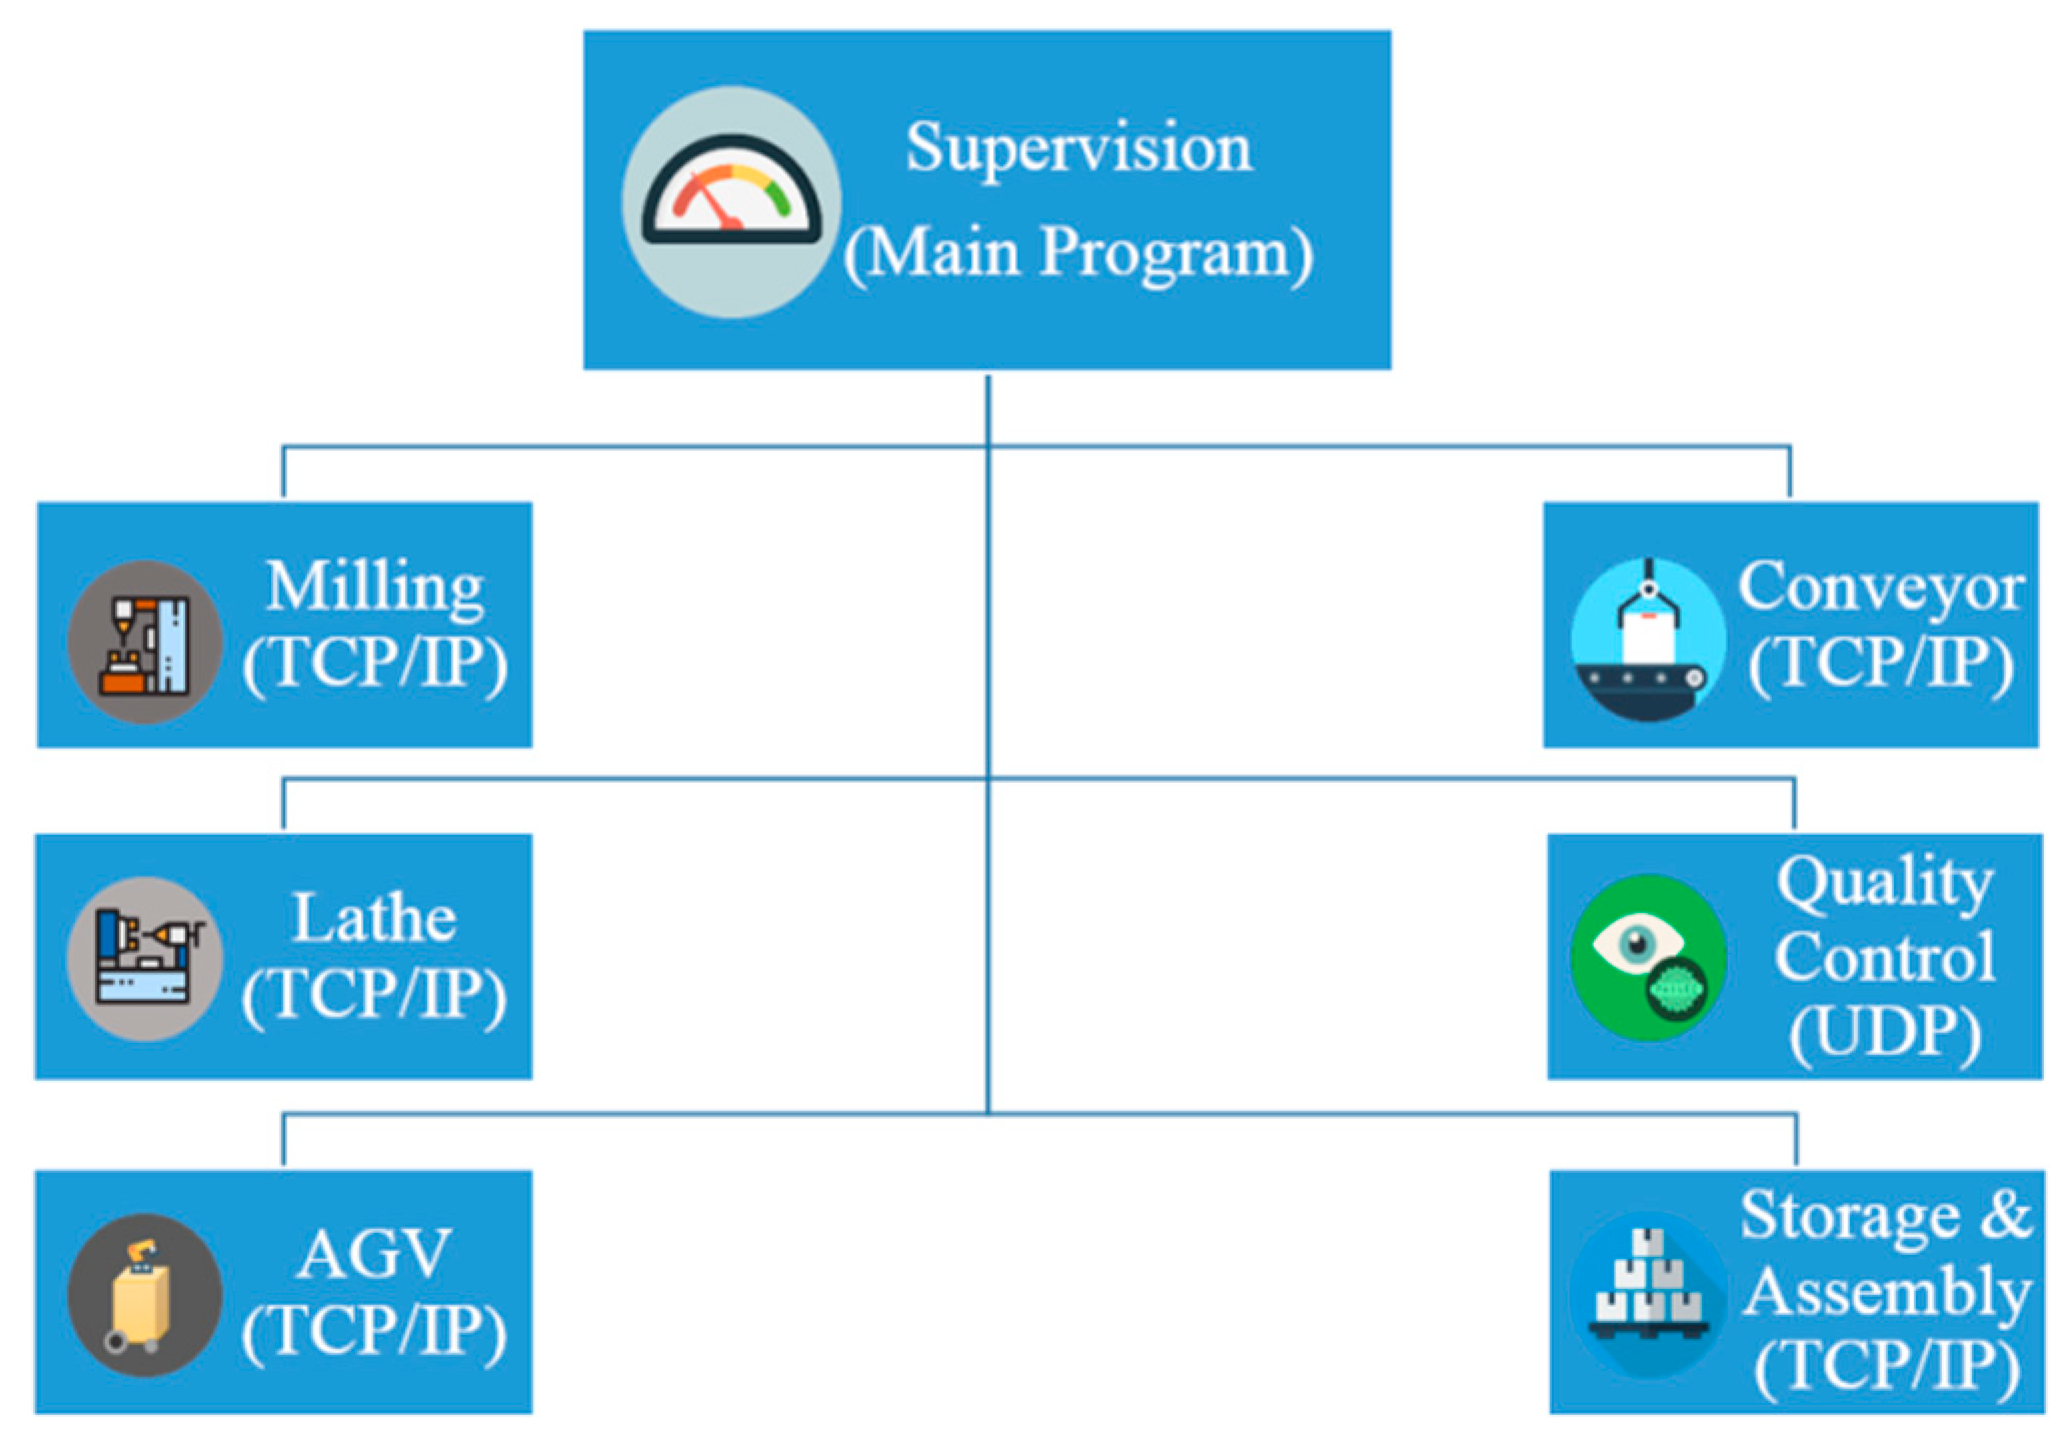
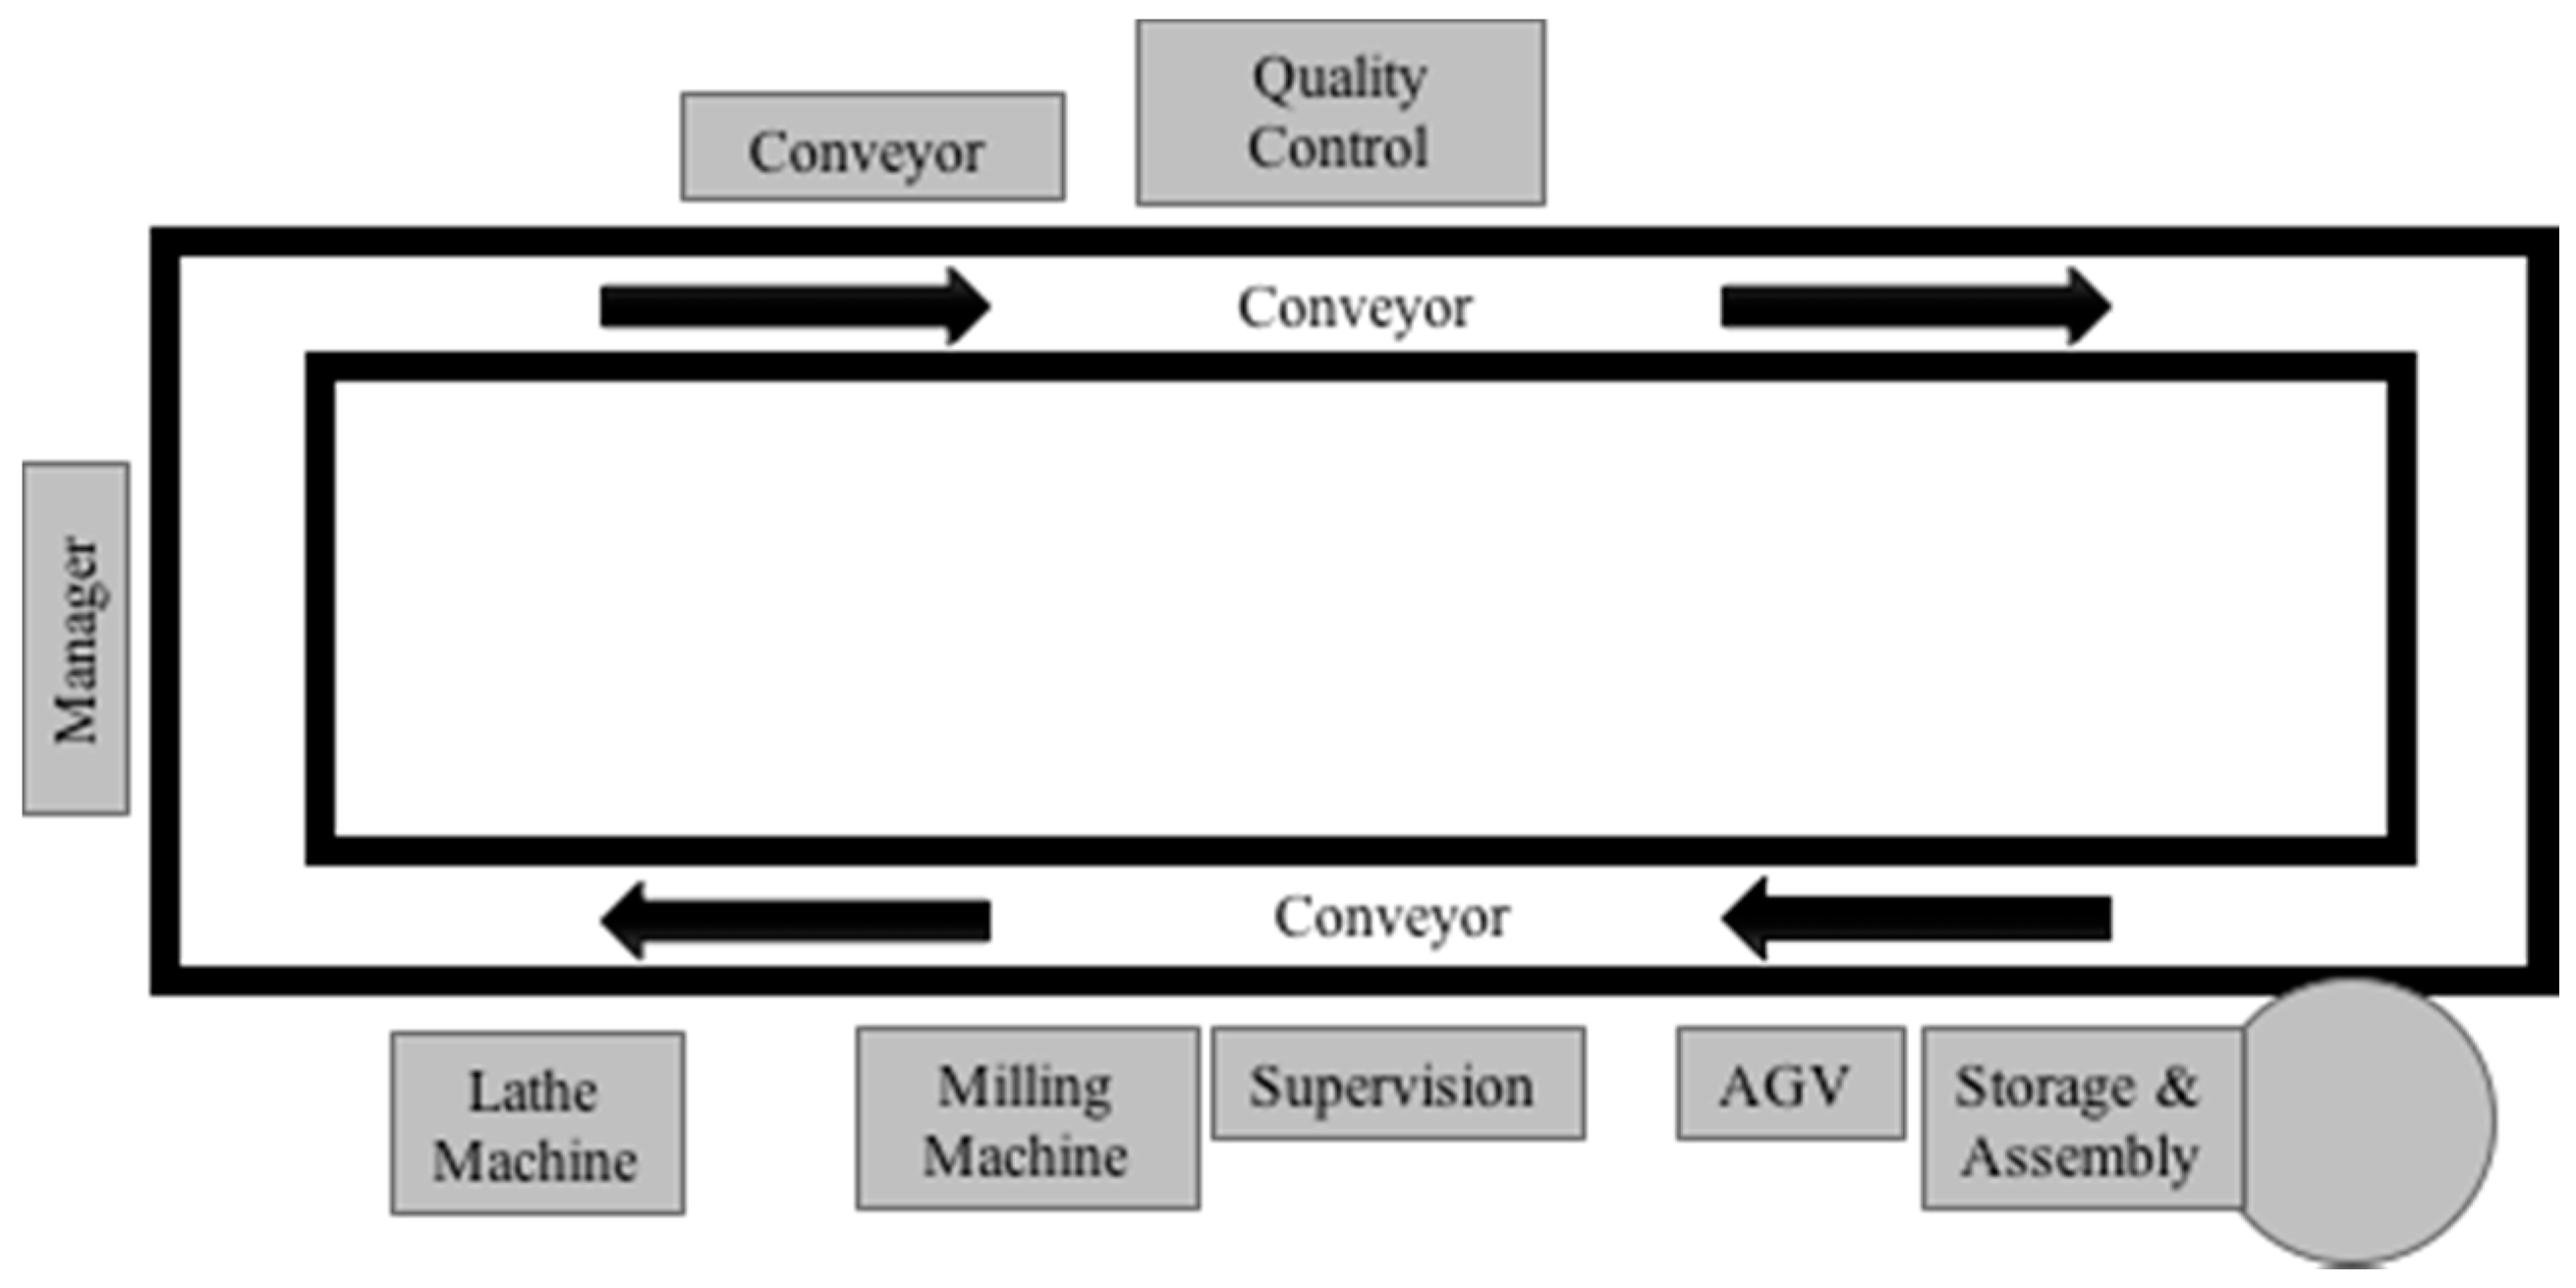
3. Manufacturing Cell Architecture
The existing manufacturing cell is composed by seven different stages: supervision, lathe machine, milling machine, conveyor, automated guided vehicle, quality control and storage/assembly. All the manufacturing cell stages are illustrated in
Figure 2.
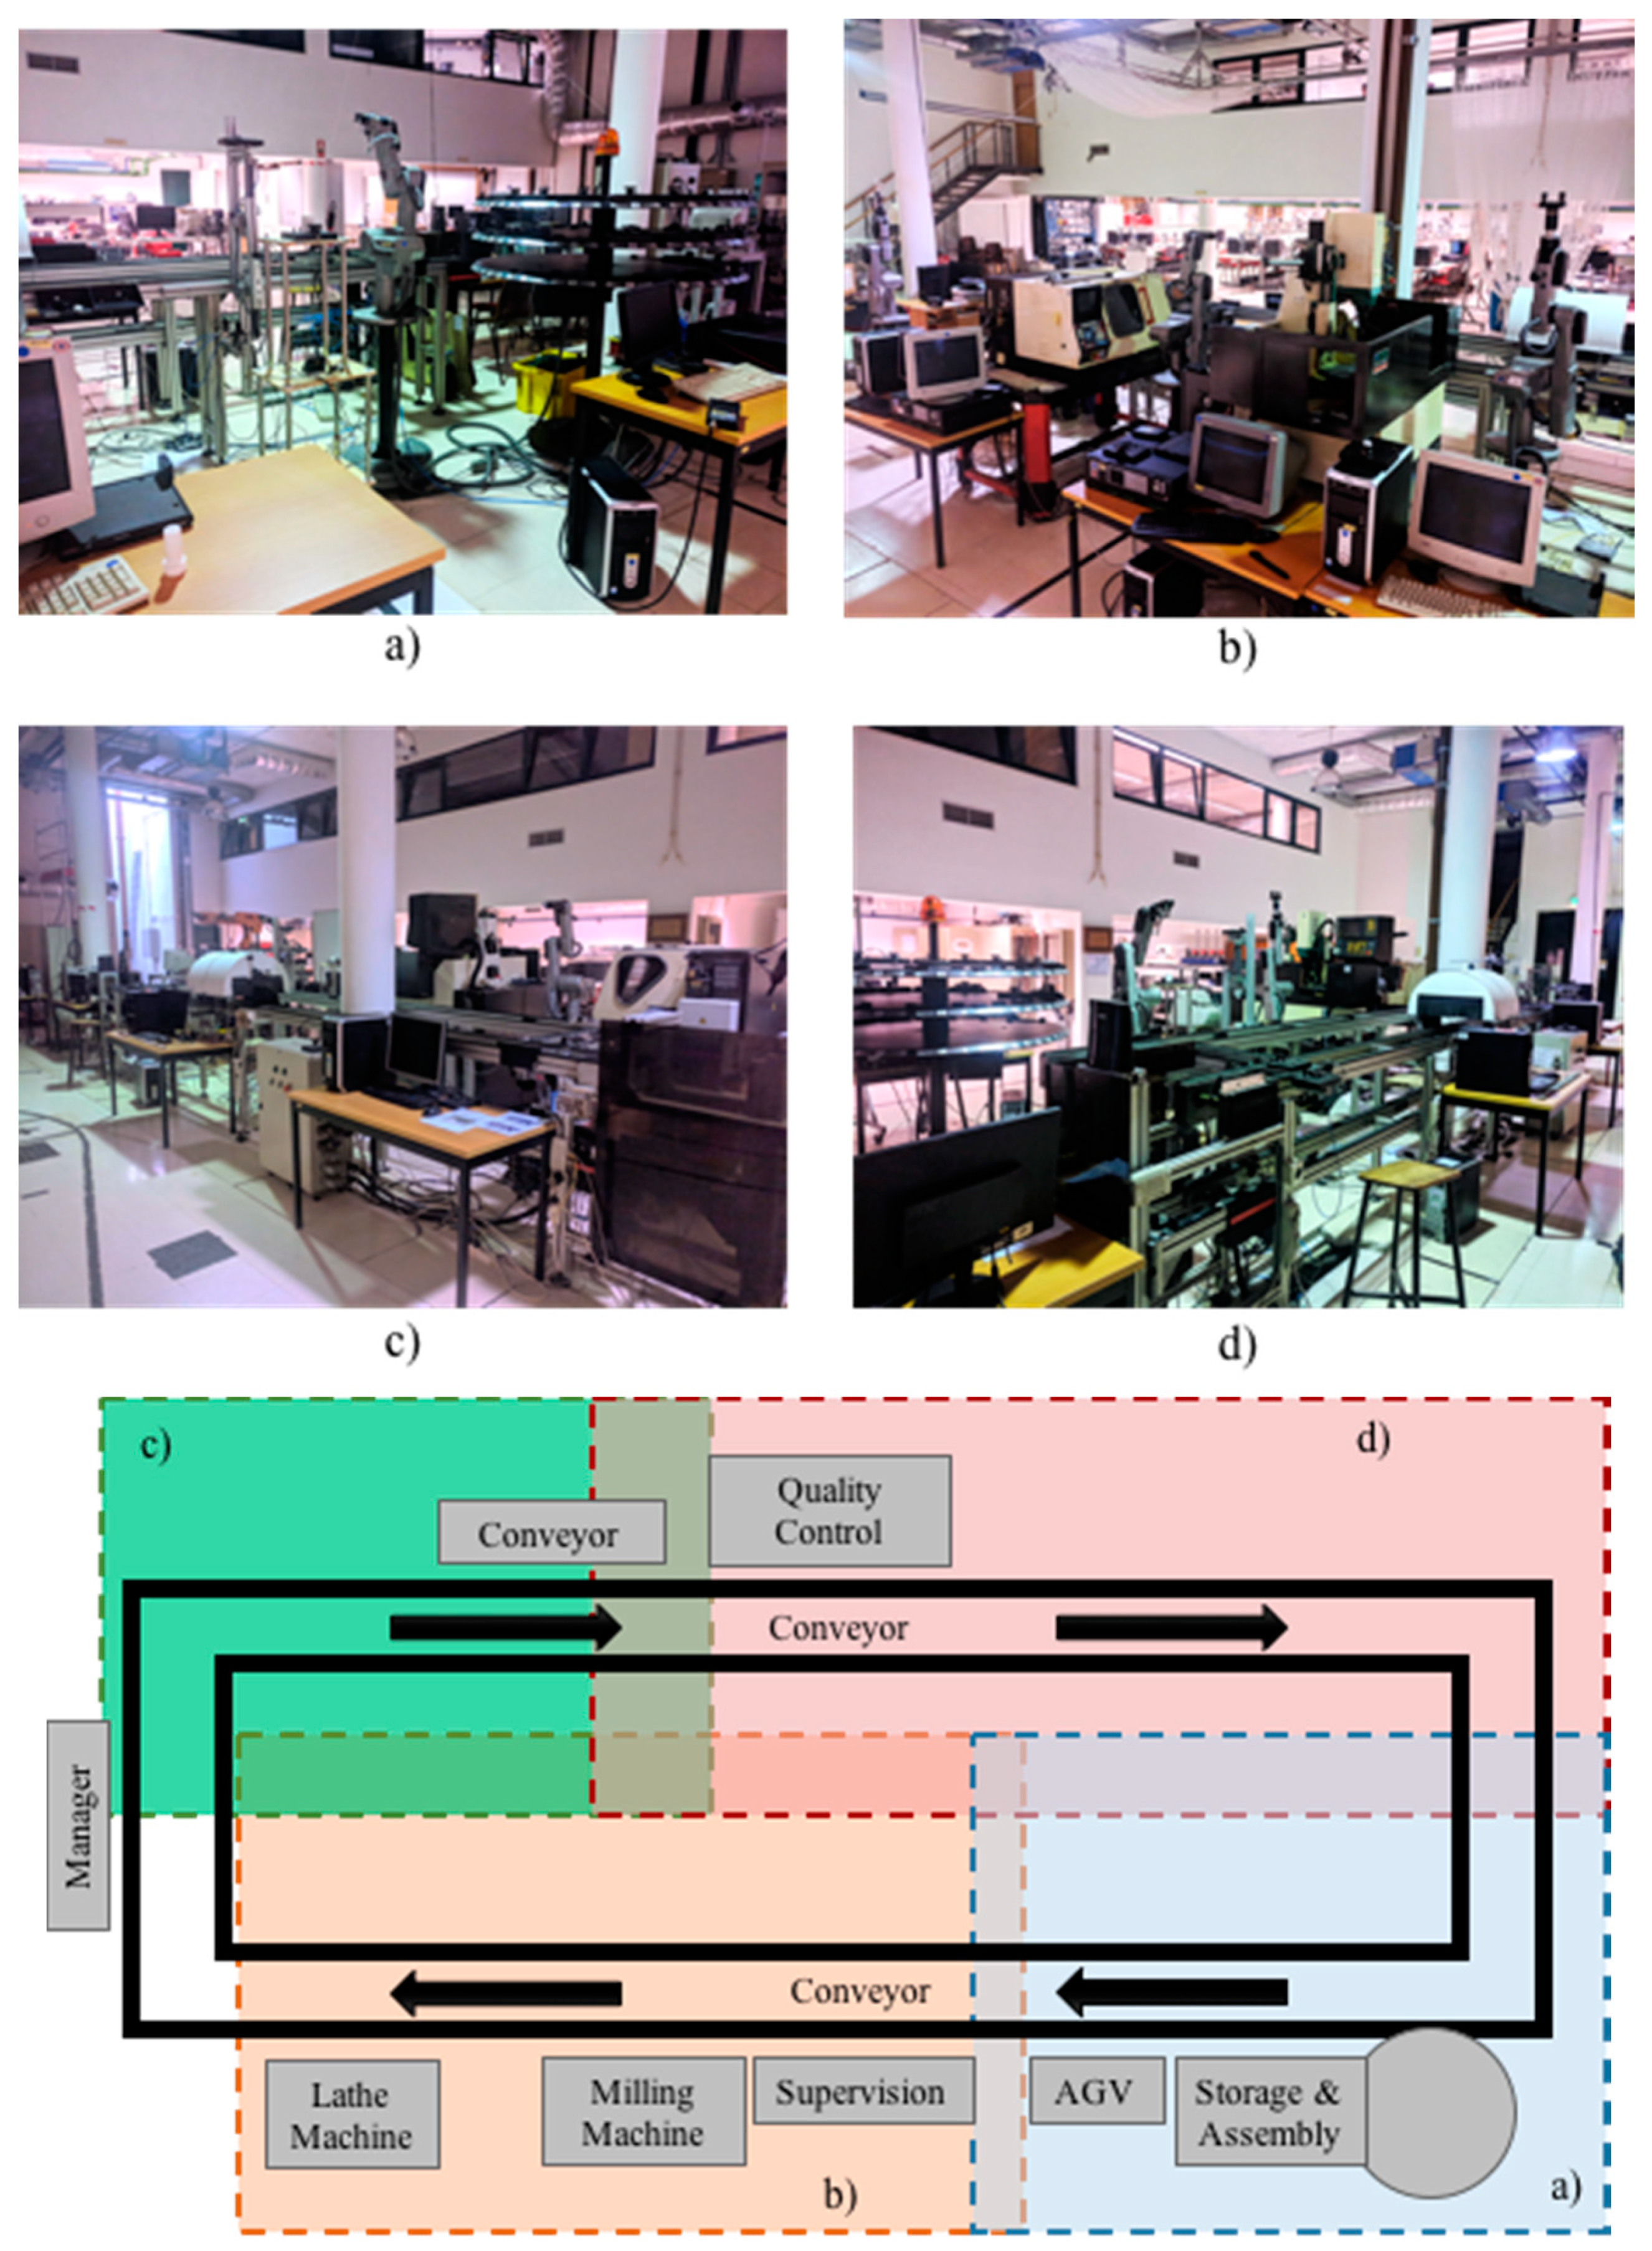
The main objective of this installation is to provide engineering students with a prototype manufacturing cell to build and assemble new products using all the tools.
The actual manufacturing cell plant is illustrated in
Figure 3.
The manufacturing machines (hardware) of all the stages from the cell are illustrated in
Figure 4.
The actual state of the manufacturing cell and a future expected one are compared in
Table 1.
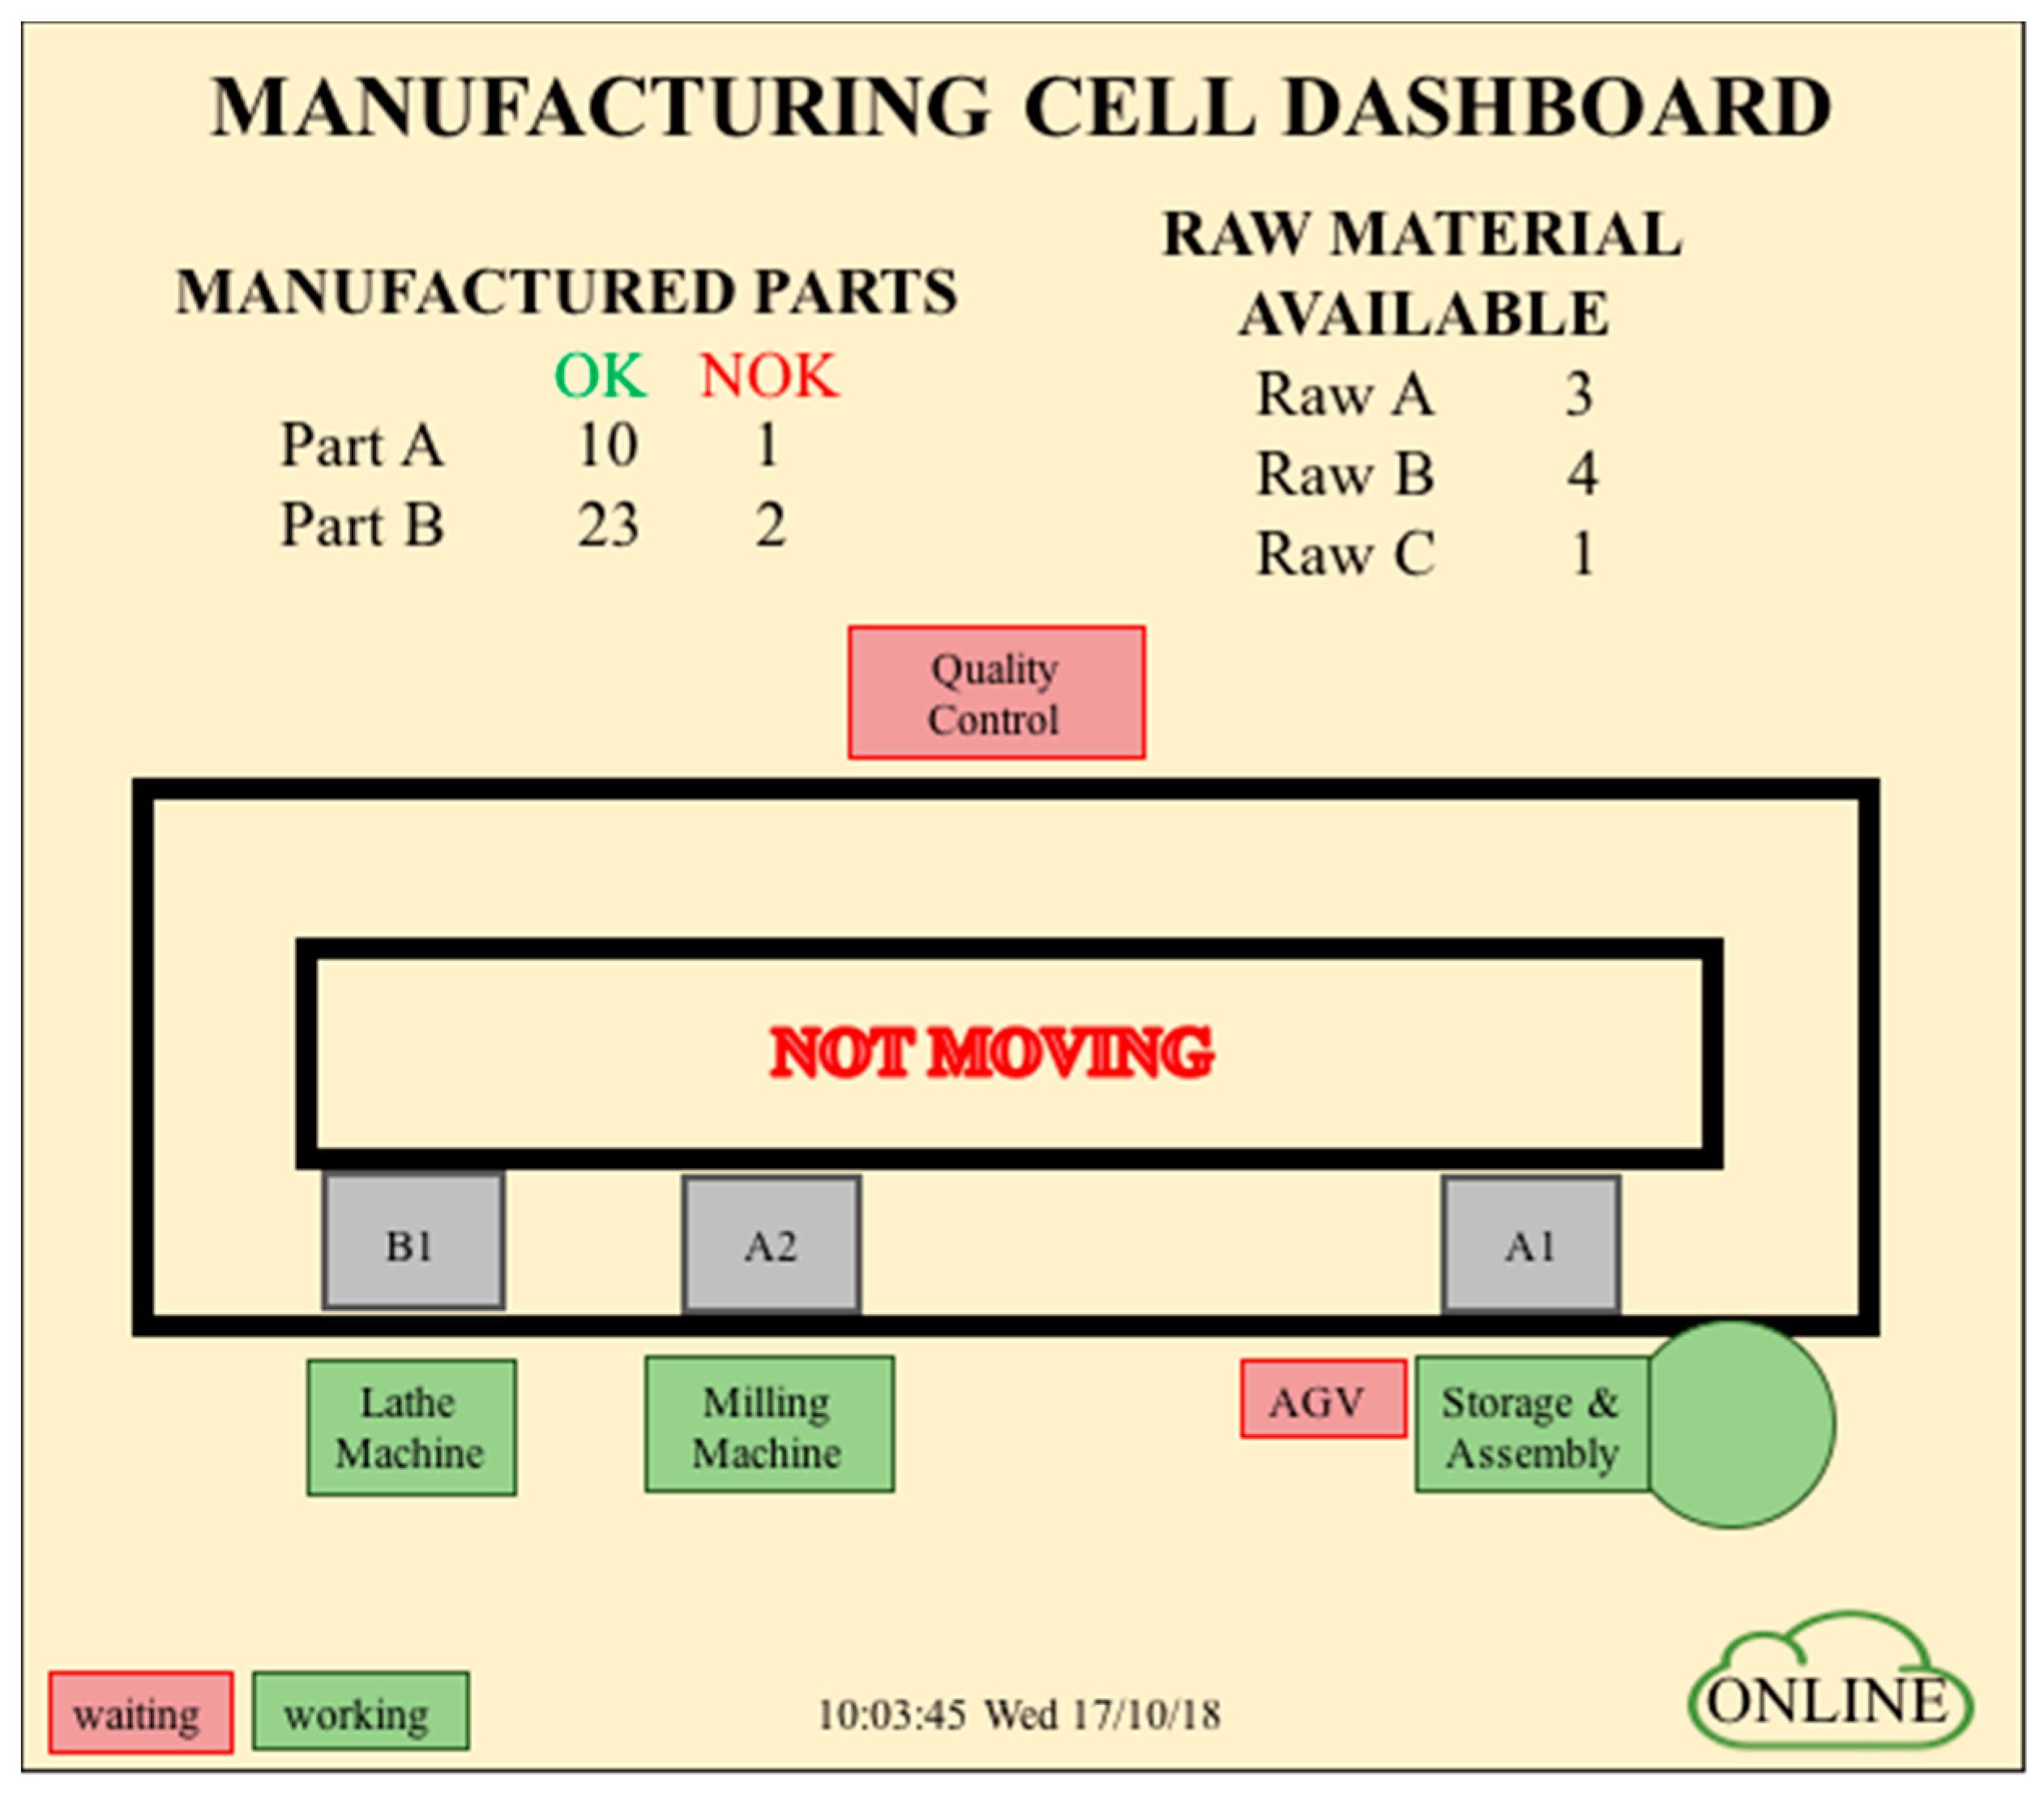
3.1. Supervision
The supervision has the job to ensure the complete process of manufacture of the product and the communications between all the stages. Using several planning tools such as Gantt diagrams and State Machines, the production is planned. The communications protocols are selected to be adequate to every stage. Using TCP/IP and UDP the cell controllers communicate under the same Local Area Network (LAN). A main program assures the communication between all stages of the manufacturing cell. One dashboard is also created allowing the control and setup of all the machines from one single station. Using software services connected over the internet and supported in the Cloud, the manufacturing machines should show their status as well as the production stage of any product produced in the cell. An example of a manufacturing cell dashboard containing all the cell stages and the connection to the cloud is shown in
Figure 5.
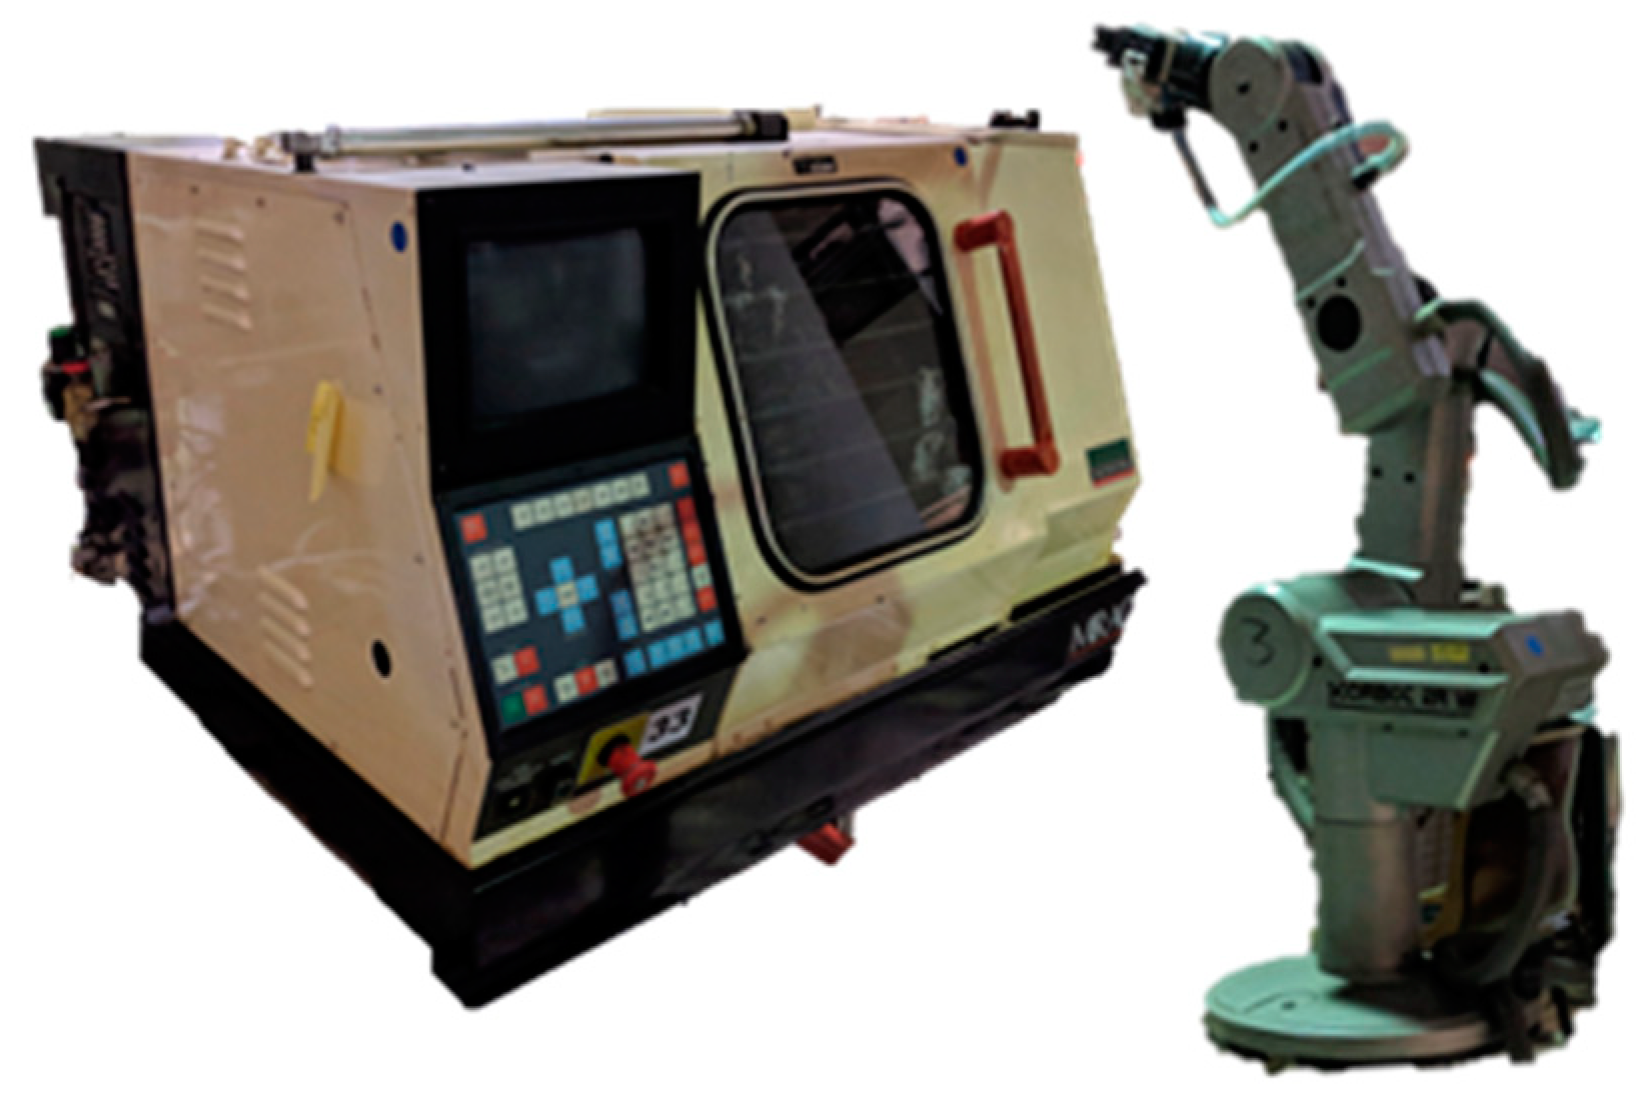
3.2. Lathe Machine
The lathe machine in the manufacturing cell is a Legacy Lathe, model Mirac, manufactured by Denford, Brighouse, West Yorkshire, UK. This Computer Numeric Control (CNC) machine understands the common G-Code, to control the different parts such as the spinner, the cutting tool, and the safety door. One robotic arm, model SCORBOT ER VII, manufactured by Eshed Robotec (now RoboGroup Education), Rosh Ha’Ayin, Israel, which grabs and manipulates the parts to be machined. The cell lathe machine and the robotic arm are shown in
Figure 6.
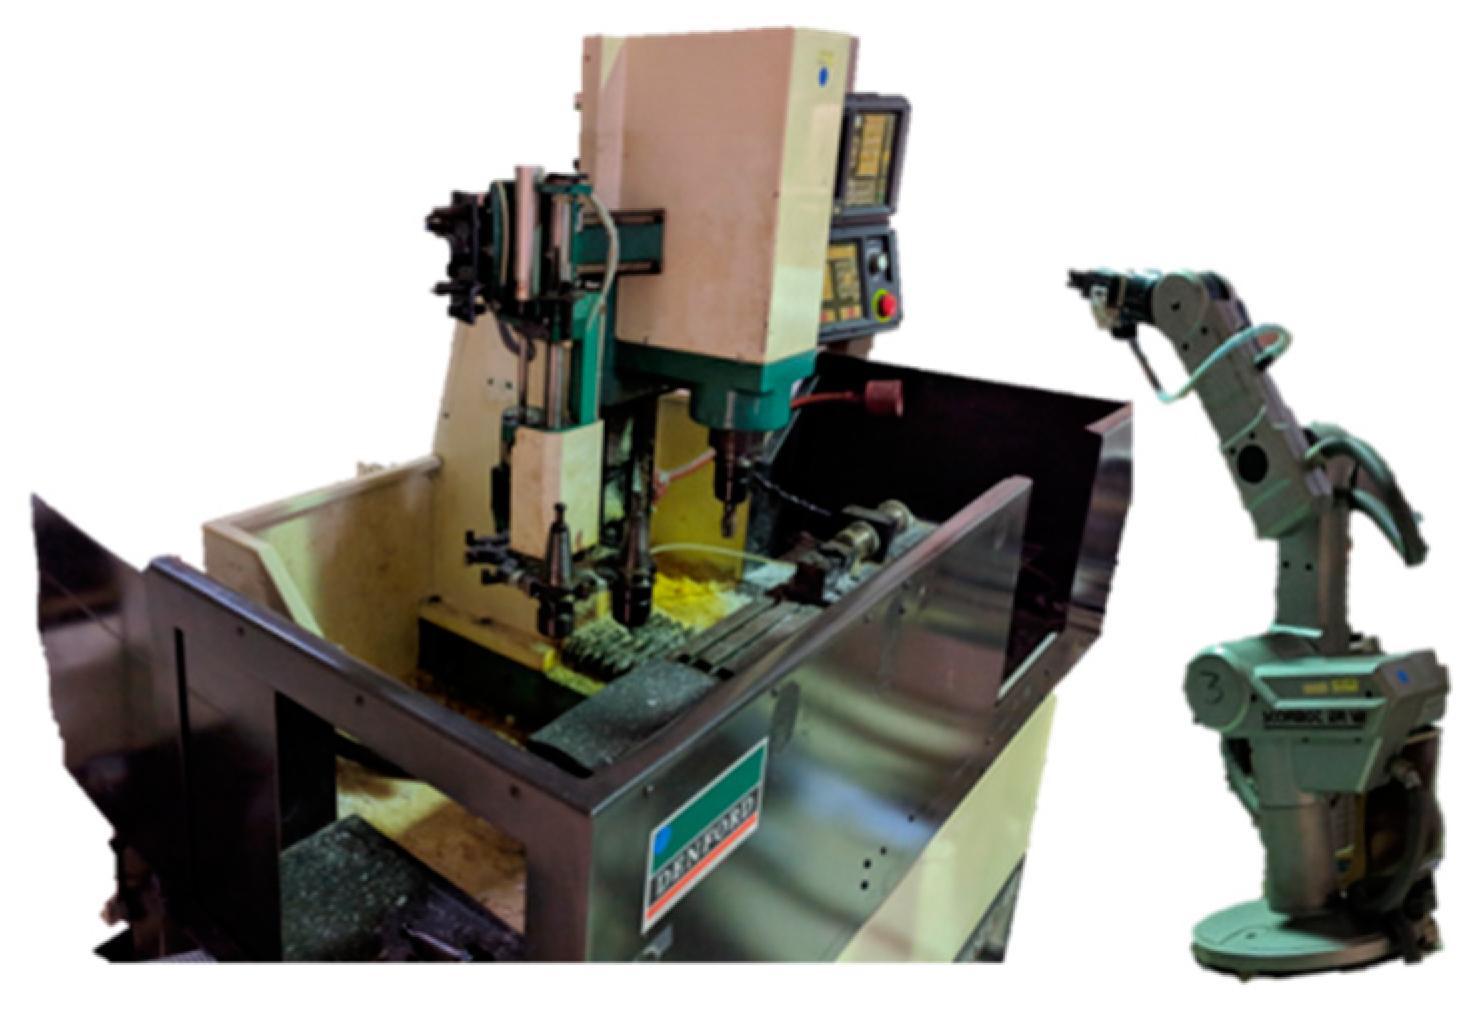
3.3. Milling Machine
The milling machine in the manufacturing cell is a Legacy Milling Machine, model Triac Fanuc OM series, manufactured by Denford, Brighouse, West Yorkshire, UK. It uses CNC programming language as interface with the user. There are two ways to operate the machine: the Teach Pendant mode, to introduce the commands manually; and the CNC-Programming mode, to use the CNC program file sent to the machine. As in the lathe machine, one SCORBOT ER VII robotic arm can grab and manipulate the parts to be machined. The manufacturing cell milling machine and the robotic arm are shown in
Figure 7.
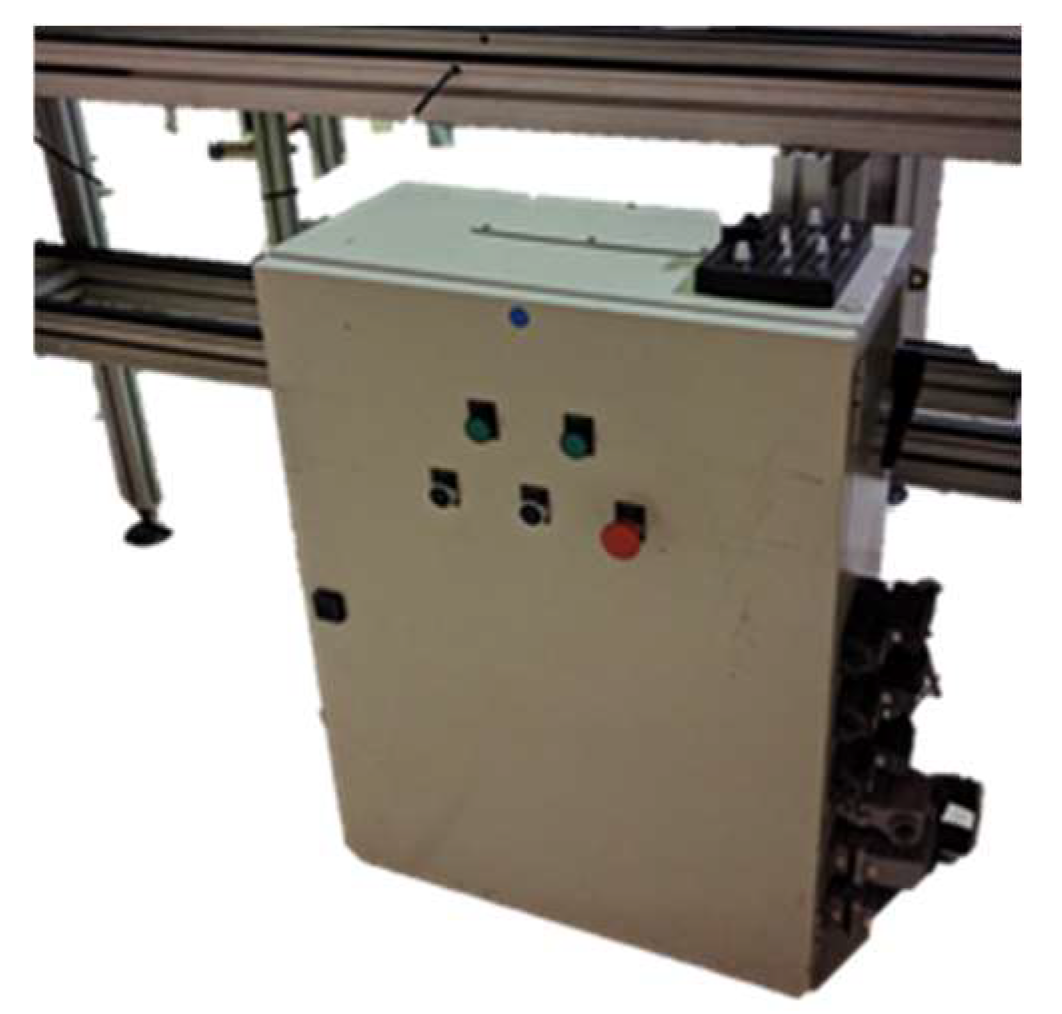
3.4. Conveyor
The cell has 3 major conveyor belts in two floors (two belts on the top floor and one in the bottom floor), 28 presence sensors and 6 flow blockers. Several WT2 Bosch platforms allow the products to flow through the workspace and two lifters exchange platforms between floors. All the sensors, motors, blockers and communication with a PC base station are controlled by a centralized automaton BOSCH (Robert Bosch GmbH,) equipped with the modules ZE200 and R200 (Gerlingen, Germany). The ZE200 module assures all the input/output connections with all the sensors and actuators controlled by the automaton. The R200 module registers all the dataflags and memory used by the program and establishes all the communications between the automaton and the cell network using LabVIEW (LabVIEW 2021). The cell ZE200 and R200 automatons modules are shown in
Figure 8.
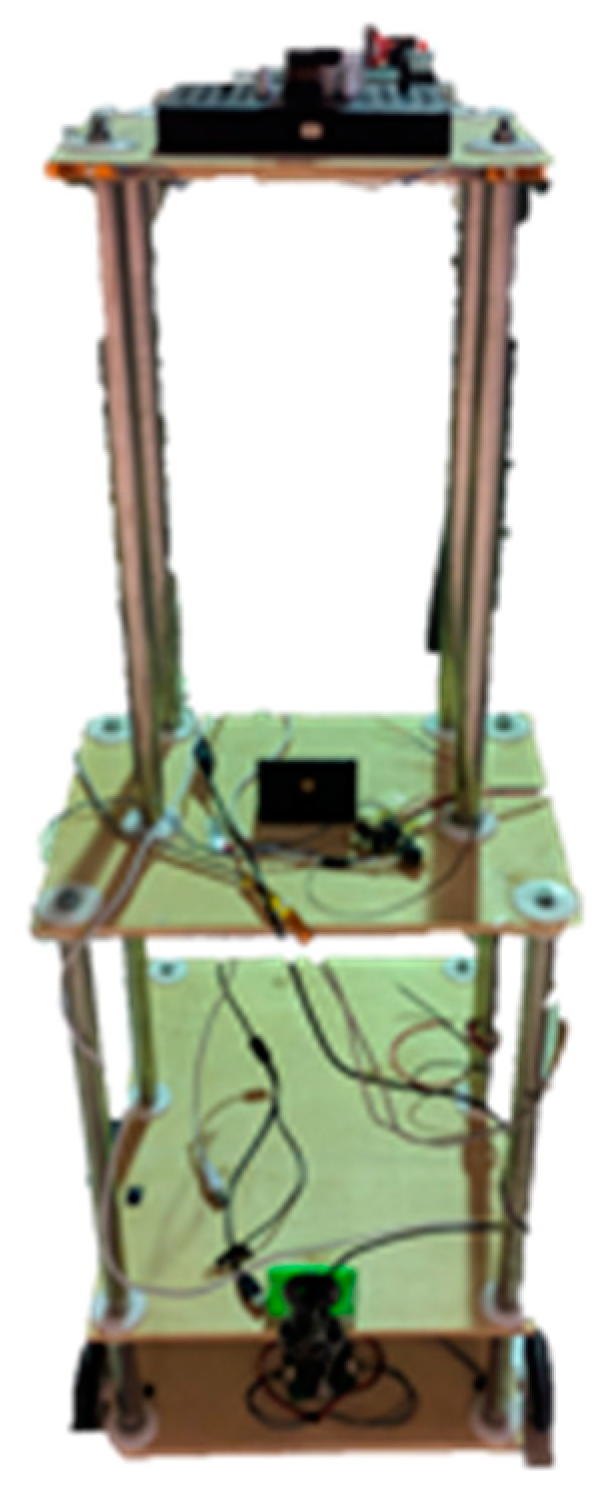
3.5. Automated Guided Vehicle
The cell has one motorized automated guided vehicle (AGV), which is a prototype built in the laboratory from other researches. It includes a small plastic robotic arm controlled by five servo motors connected to a microcontroller board. An infrared proximity sensor is used in the front of the vehicle to avoid collisions with the different stations of the cell. To control what is the present job and to give warning about the self-operation some RGB LED strips are used. Another separate microcontroller controls the proximity sensor and the LED strips. A webcam is used to follow a line in the cell floor, allowing the robot to move between stations. The network is very flexible being able to increase the number of available AGV’s. One computer running MATLAB interconnects everything and establishes the communication with the supervision station. The manufacturing cell AGV is shown in
Figure 9 (model Torre, manufactured by IDMEC/Instituto Superior Técnico, Lisboa, Portugal).
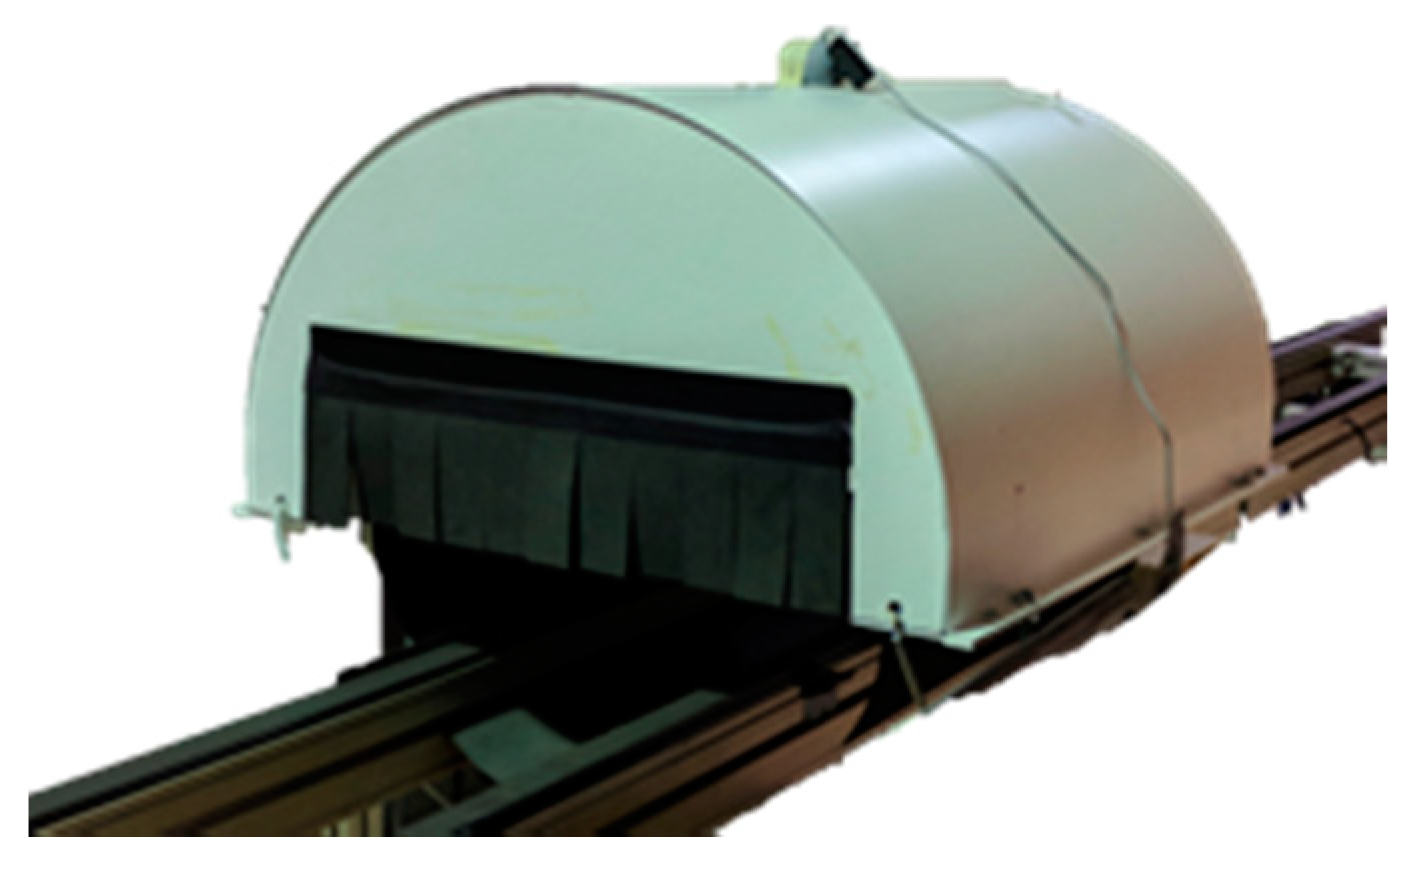
3.6. Quality Control
The main goal of this workstation is to check the produced parts for errors and report the results to the Supervision. The velocity in detecting errors in the production line is very important, has it impacts in production costs. This station is composed by a tunnel with white LED lighting, granting the best illumination conditions for a webcam in the top. The webcam captures several images and MATLAB processes all the data in real-time, assuring that the conveyor belt never stops. Some good parts need to be previously analyzed and the descriptors stored, giving values to be compared with the produced parts. The MATLAB communicate via UDP with the LabVIEW and report to the Supervision. The cell quality control setup is shown in
Figure 10 (model “Campânula”, manufactured by IDMEC/Instituto Superior Técnico, Lisboa, Portugal).
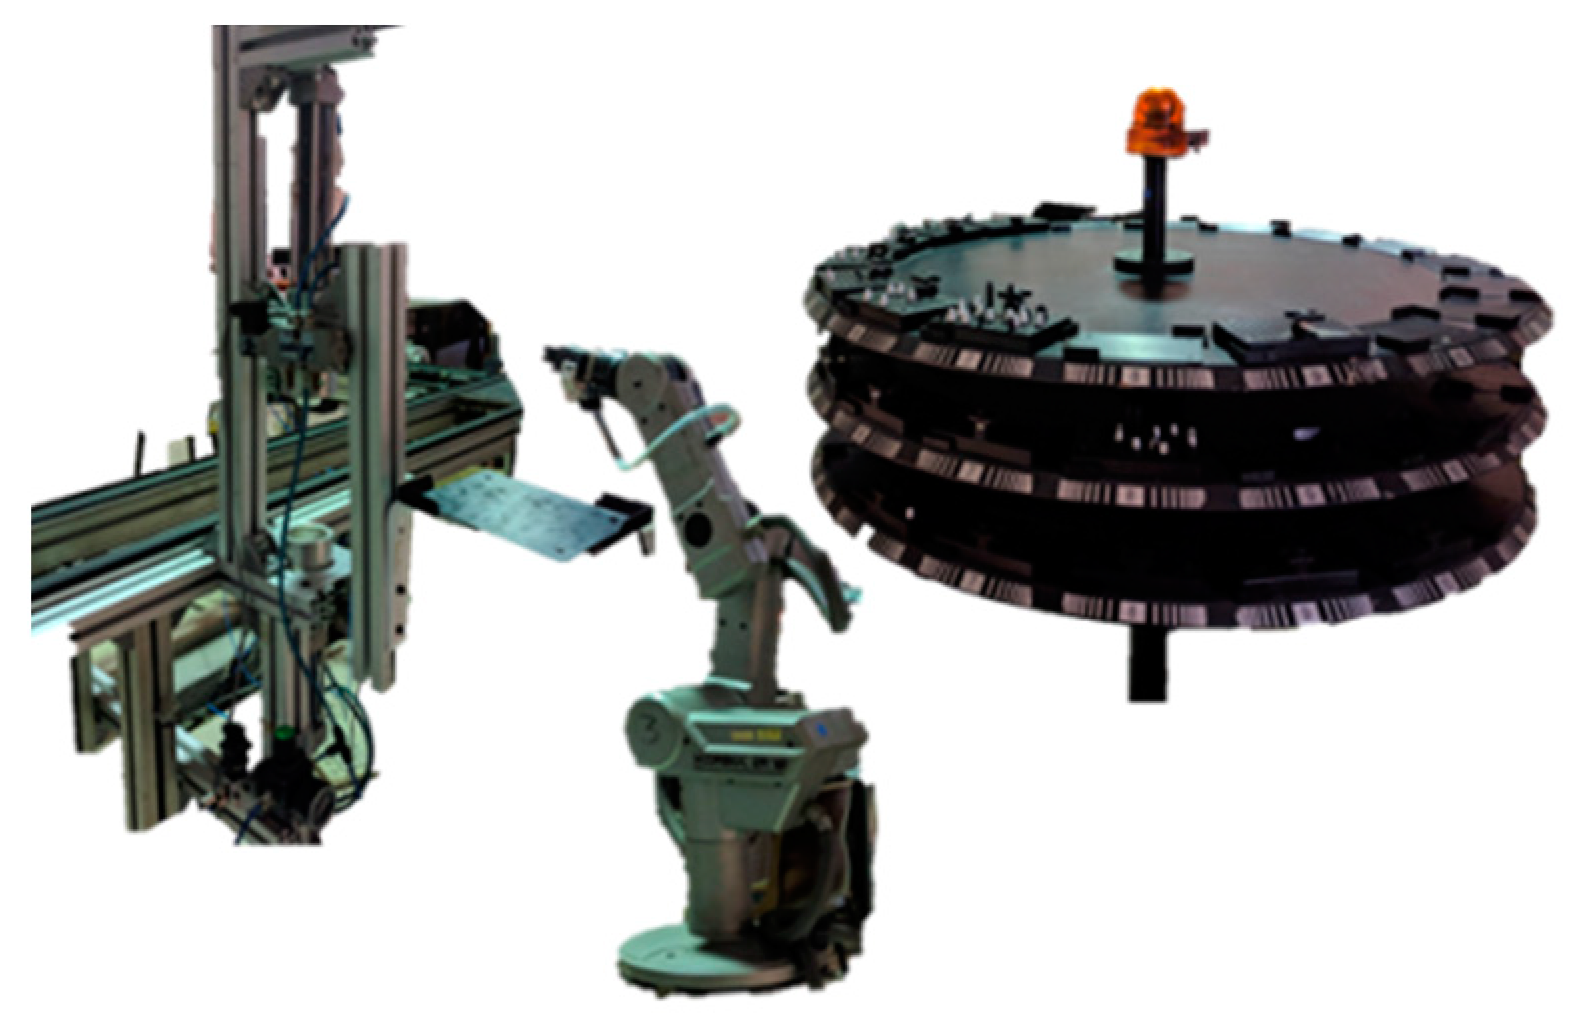
3.7. Storage and Assembly
This stage has three main objectives: store the raw material before the production, assemble all the parts of the final product and store the final product.
It is composed by a three-floor tower rotatory storage, one legacy robotic arm SCORBOT ER VII and two assembly pneumatic cylinders.
The cylinders, the storage and the robotic arm are controlled by the SCORBOT. Cylinders are commanded by electro-pneumatic valves. The motor of the storage tower can rotate in one direction and a yellow rotary light warns that the storage tower is moving. The necessary cycles for the production are compiled and programed in HyperTerminal and are called via LabVIEW or Matlab. The manufacturing cell assembly setup with pneumatic cylinders, the robotic arm and the storage tower are shown in
Figure 11.
4. IoT Services Proposed Architecture
A IoT architecture is proposed for the upgrade of the previously described production cell, enabling the integration of the needed services in a cloud infrastructure, easing the creation of future services and simplifying the existing infrastructure.
The architecture is comprised of 3 main modules: Gateway module, Message module and Business Intelligence Data module and is shown in
Figure 12.
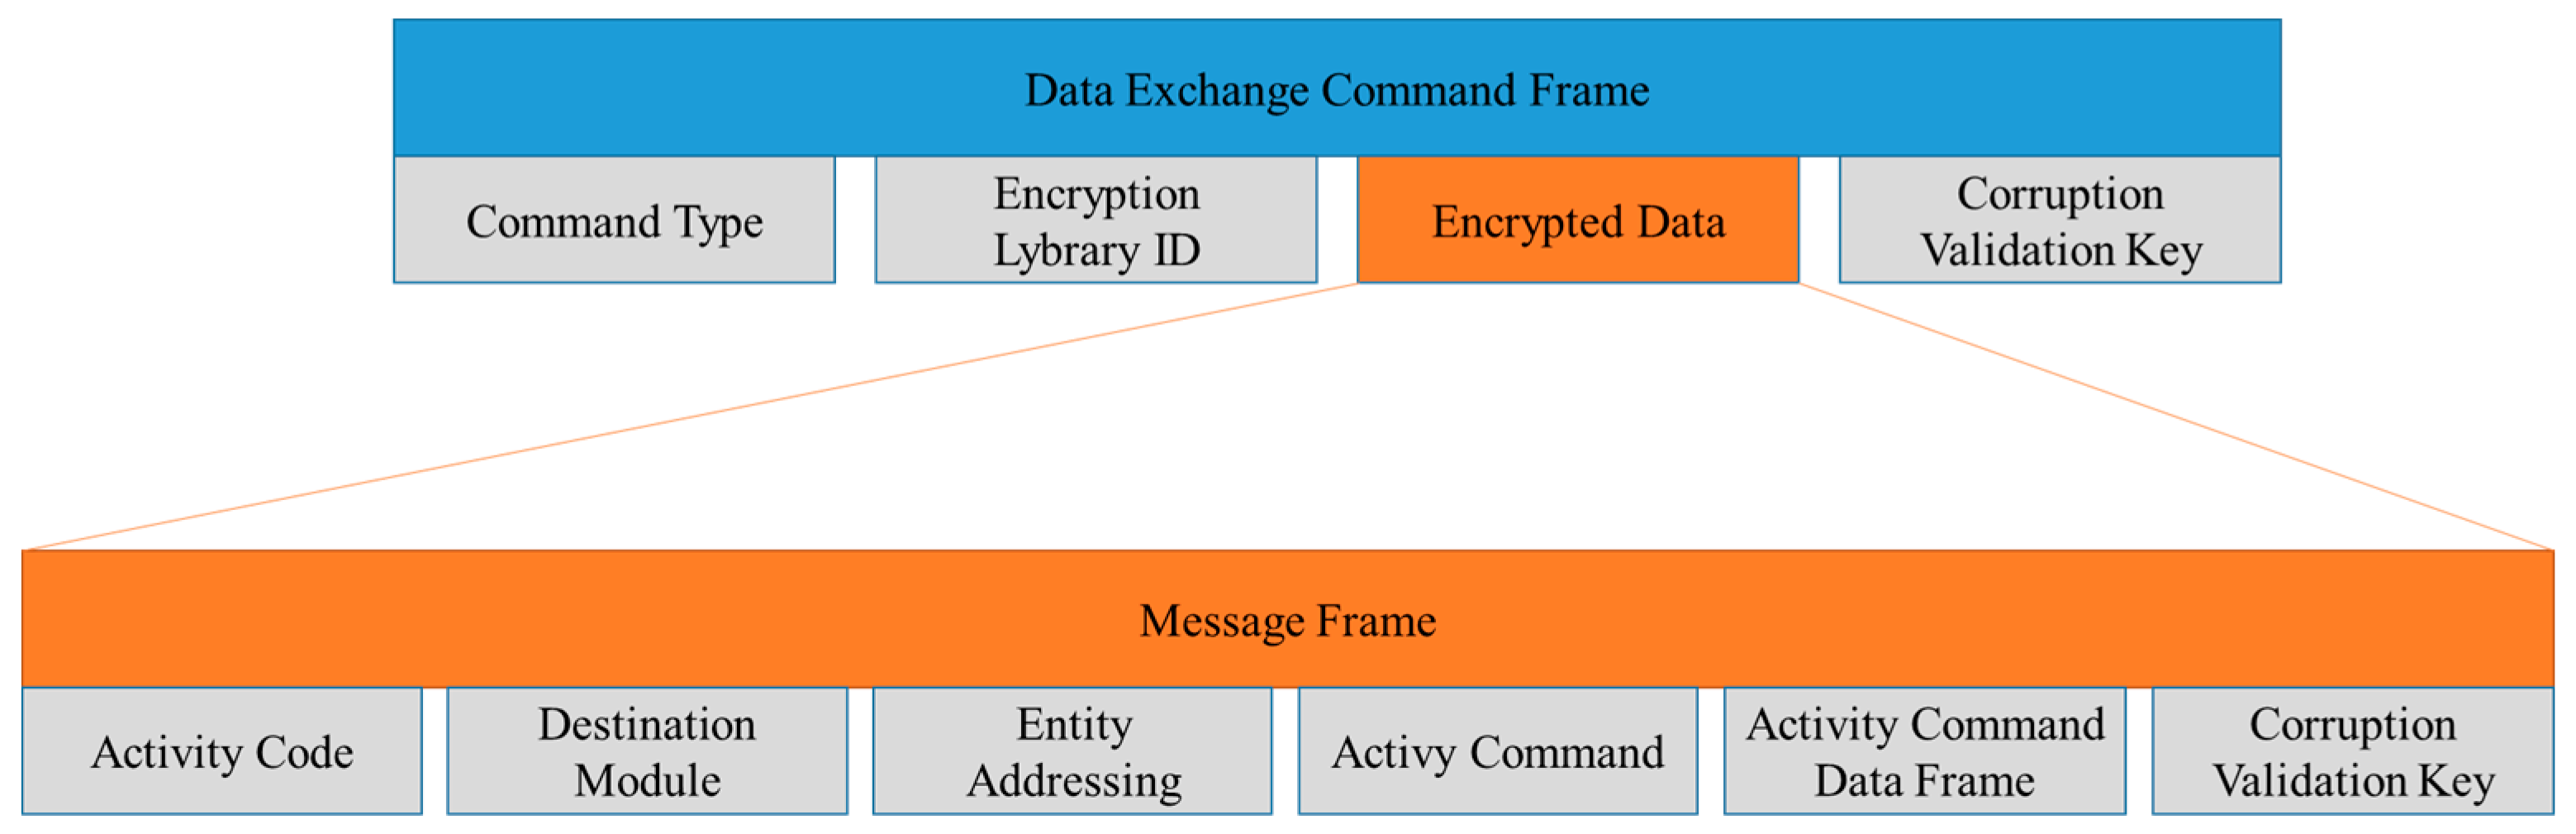
Commands correspond to data exchange among modules, specifying the interaction types. The interaction types can be such as request status, action order, and data transport. The command frame that is shown in
Figure 13.
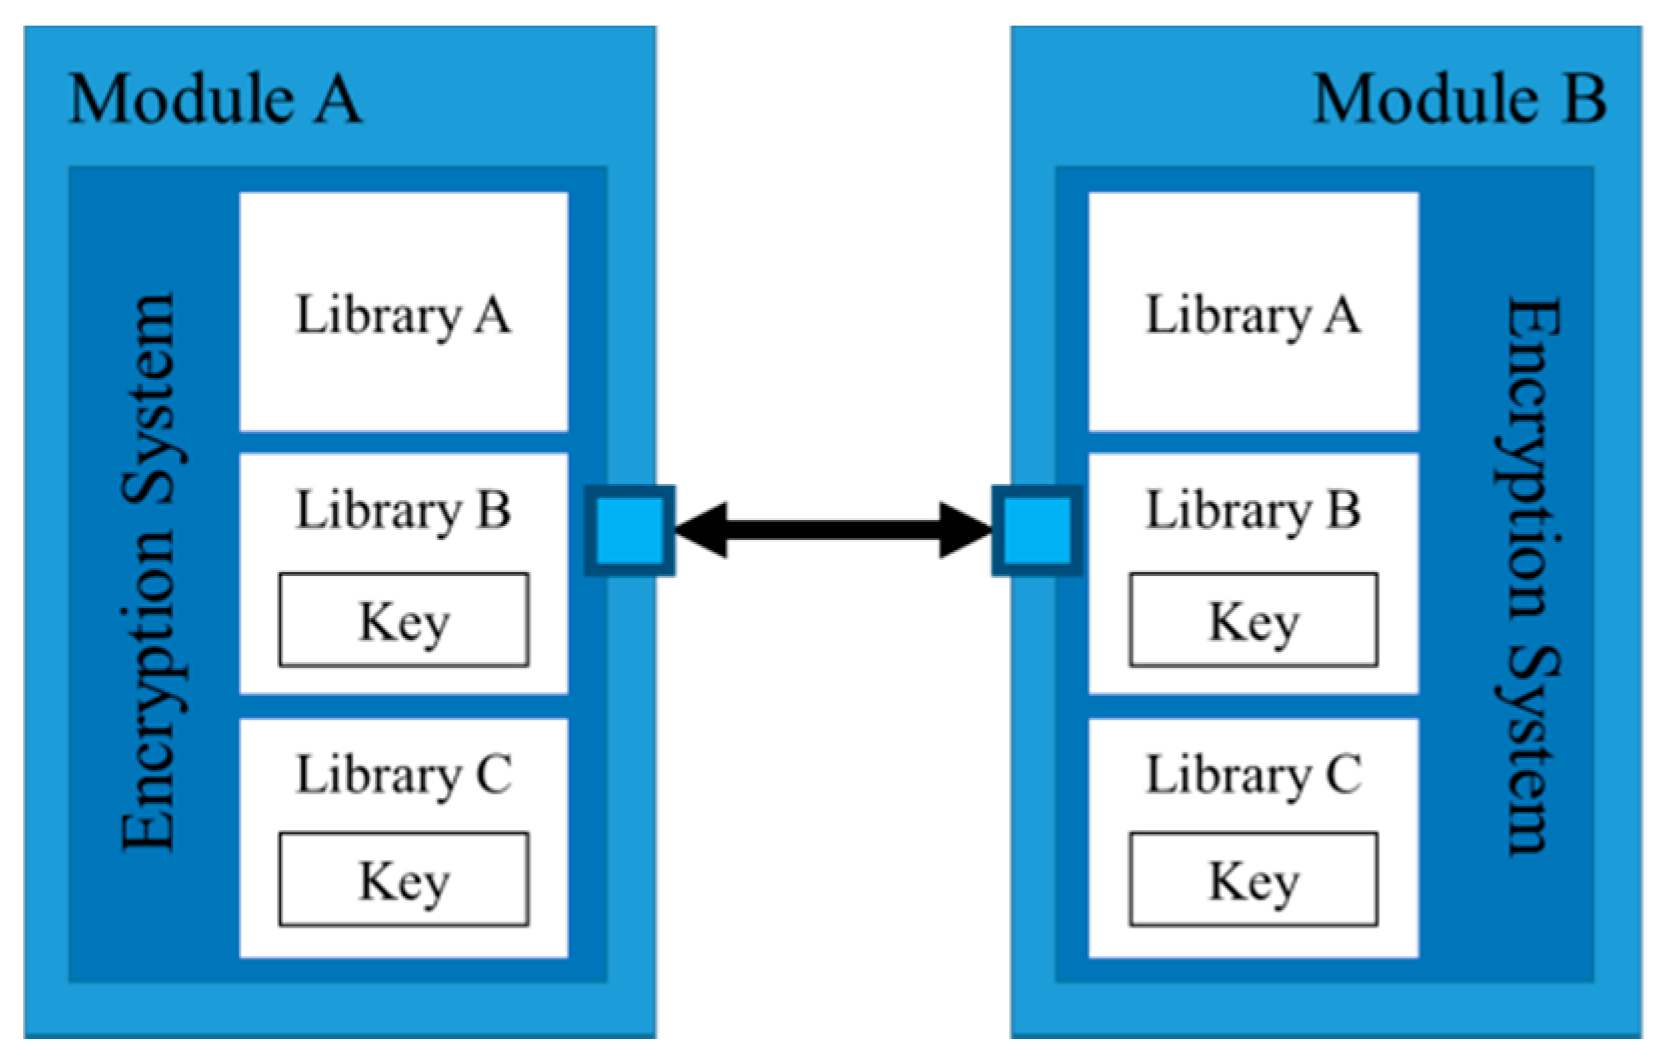
The encryption library identification defines the library to be used for the encryption and decryption of the message data. As shown in
Figure 14, the system can apply different encryption algorithms for each module or within the same module at the same time, boosting network security.
The corruption validation key is used to determine whether the message was changed during transmission. The corruption validation key is calculated using the frame data’s other fields, allowing you to check if the message has been modified. A message frame is included in the encrypted message data and is used for the activity itself. The activity code, destination module reference, entity addressing, activity command, activity data frame, and a corruption validation key are all included in the message frame.
4.1. Gateway Module
The Gateway module is liable for the business rationale of the combination of the interrelationship of physical and computerized world. It contains the services expected to present the needs of a specific IoT element activity. It receives and sends orders from and to the various modules. The Gateway module can demand data about the nodes, status of the current activity. A command can be created in this module and sent to an IoT module.
The creation of services eases the client/operator activity and their usability, but the control has to be transparent for the client. The client interacts directly and asynchronously with an embedded device. The Gateway module stays behind communication filtering and firewalls.
The Gateway module is illustrated in
Figure 15.
4.2. Message Module
The Message module deals with the interaction among the embedded devices. The client requests the status update, configuration or software update to the Integration module. Using web services, the Message module offers several types of communications to the clients.
5. System Implementation Tests and Results
Prototypes were developed for testing the implementation of activity data routes, modules, and cloud communication services in the industrial cell.
Table 2 shows different wireless technologies [
22,
23,
24].
5.1. System Communication Infrastructure
ZigBee [
25,
26,
27,
28,
29,
30,
31,
32,
33,
34,
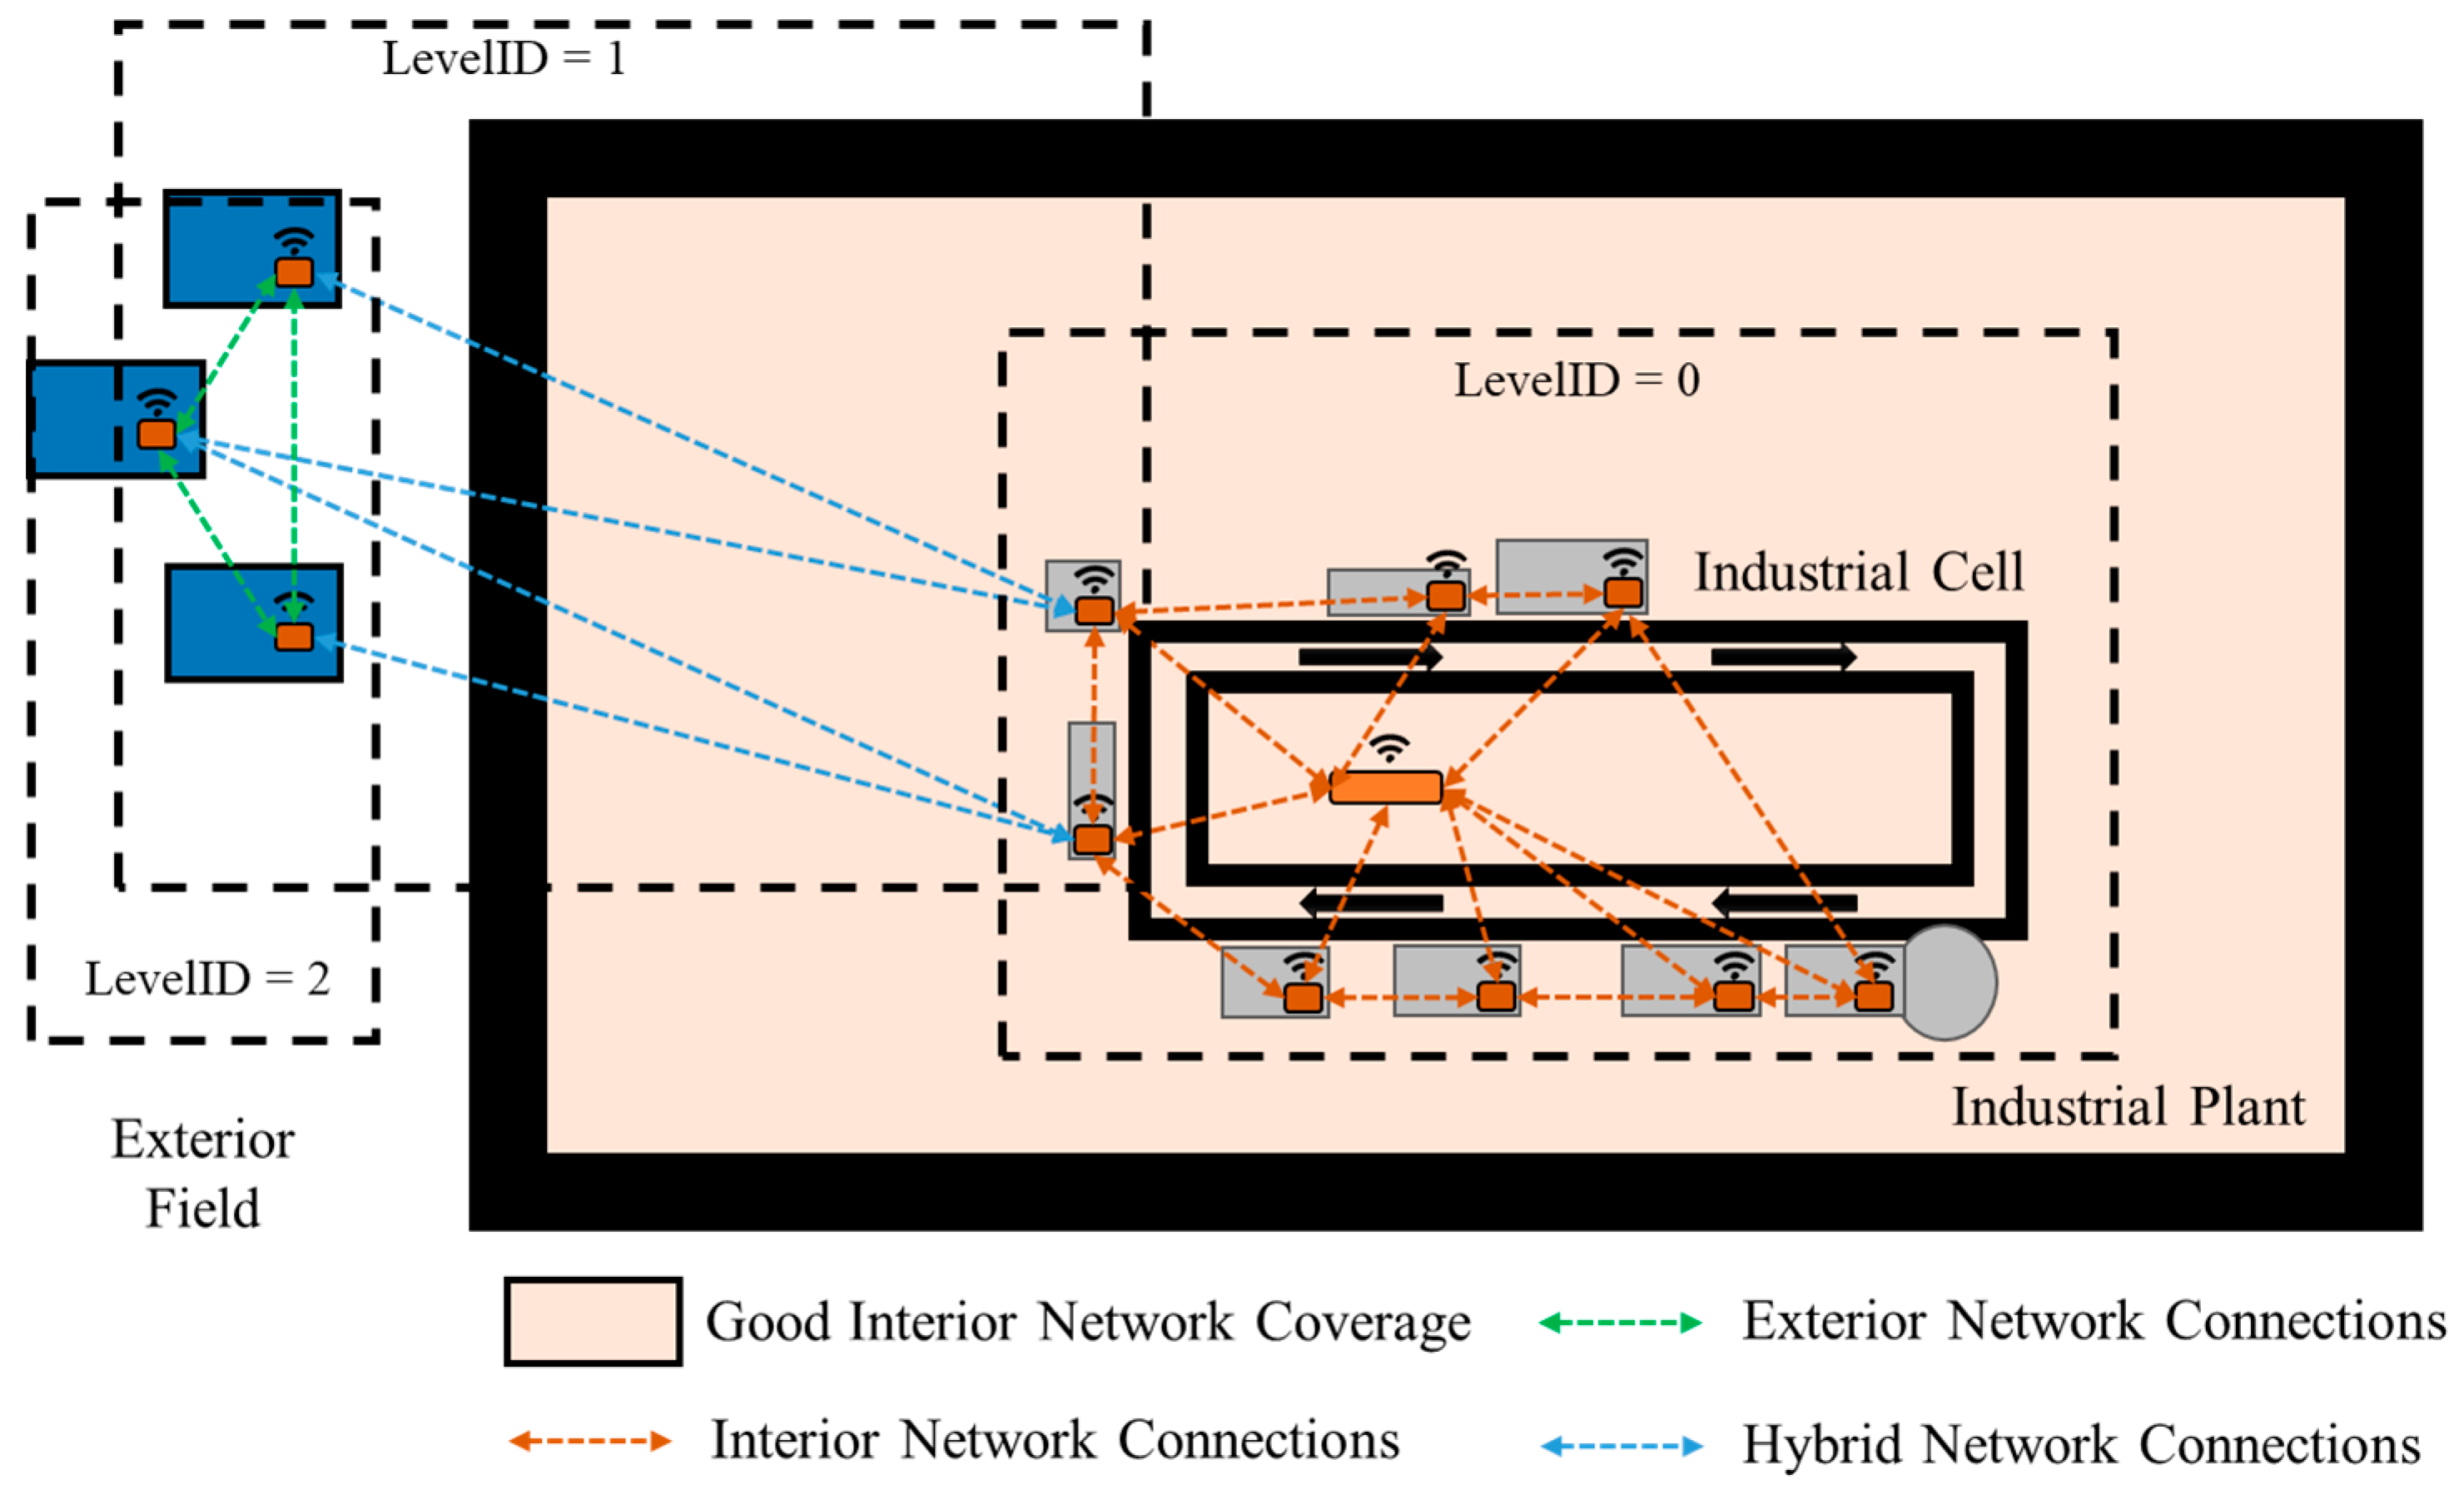
35] was the protocol chosen for the implementation using a mesh network topology. There are three different types of ZigBee module functionality: coordinator, router, and end device. The coordinator manages the network. The router relais messages from other nodes. The end device is connected to sensors and actuators and can be asleep to save the device consumption energy. A fully functional wireless network, with interior (LevelID = 0), exterior (LevelID = 2) and hybrid connection (LevelID = 1) networks is shown in
Figure 16.
5.2. Gateway Module and Cloud Integration Test
A gateway module and cloud integration test has been created to test the communication between the system and the cloud infrastructures. Using a microcontroller with a ESP8266MOD module some information was sent to the cloud using the ThingSpeak service [
36]. The ThingSpeak platform allows to collect the different data from the sensors, instantaneous plot visualization, analyze and processing it using Matlab scripts online.
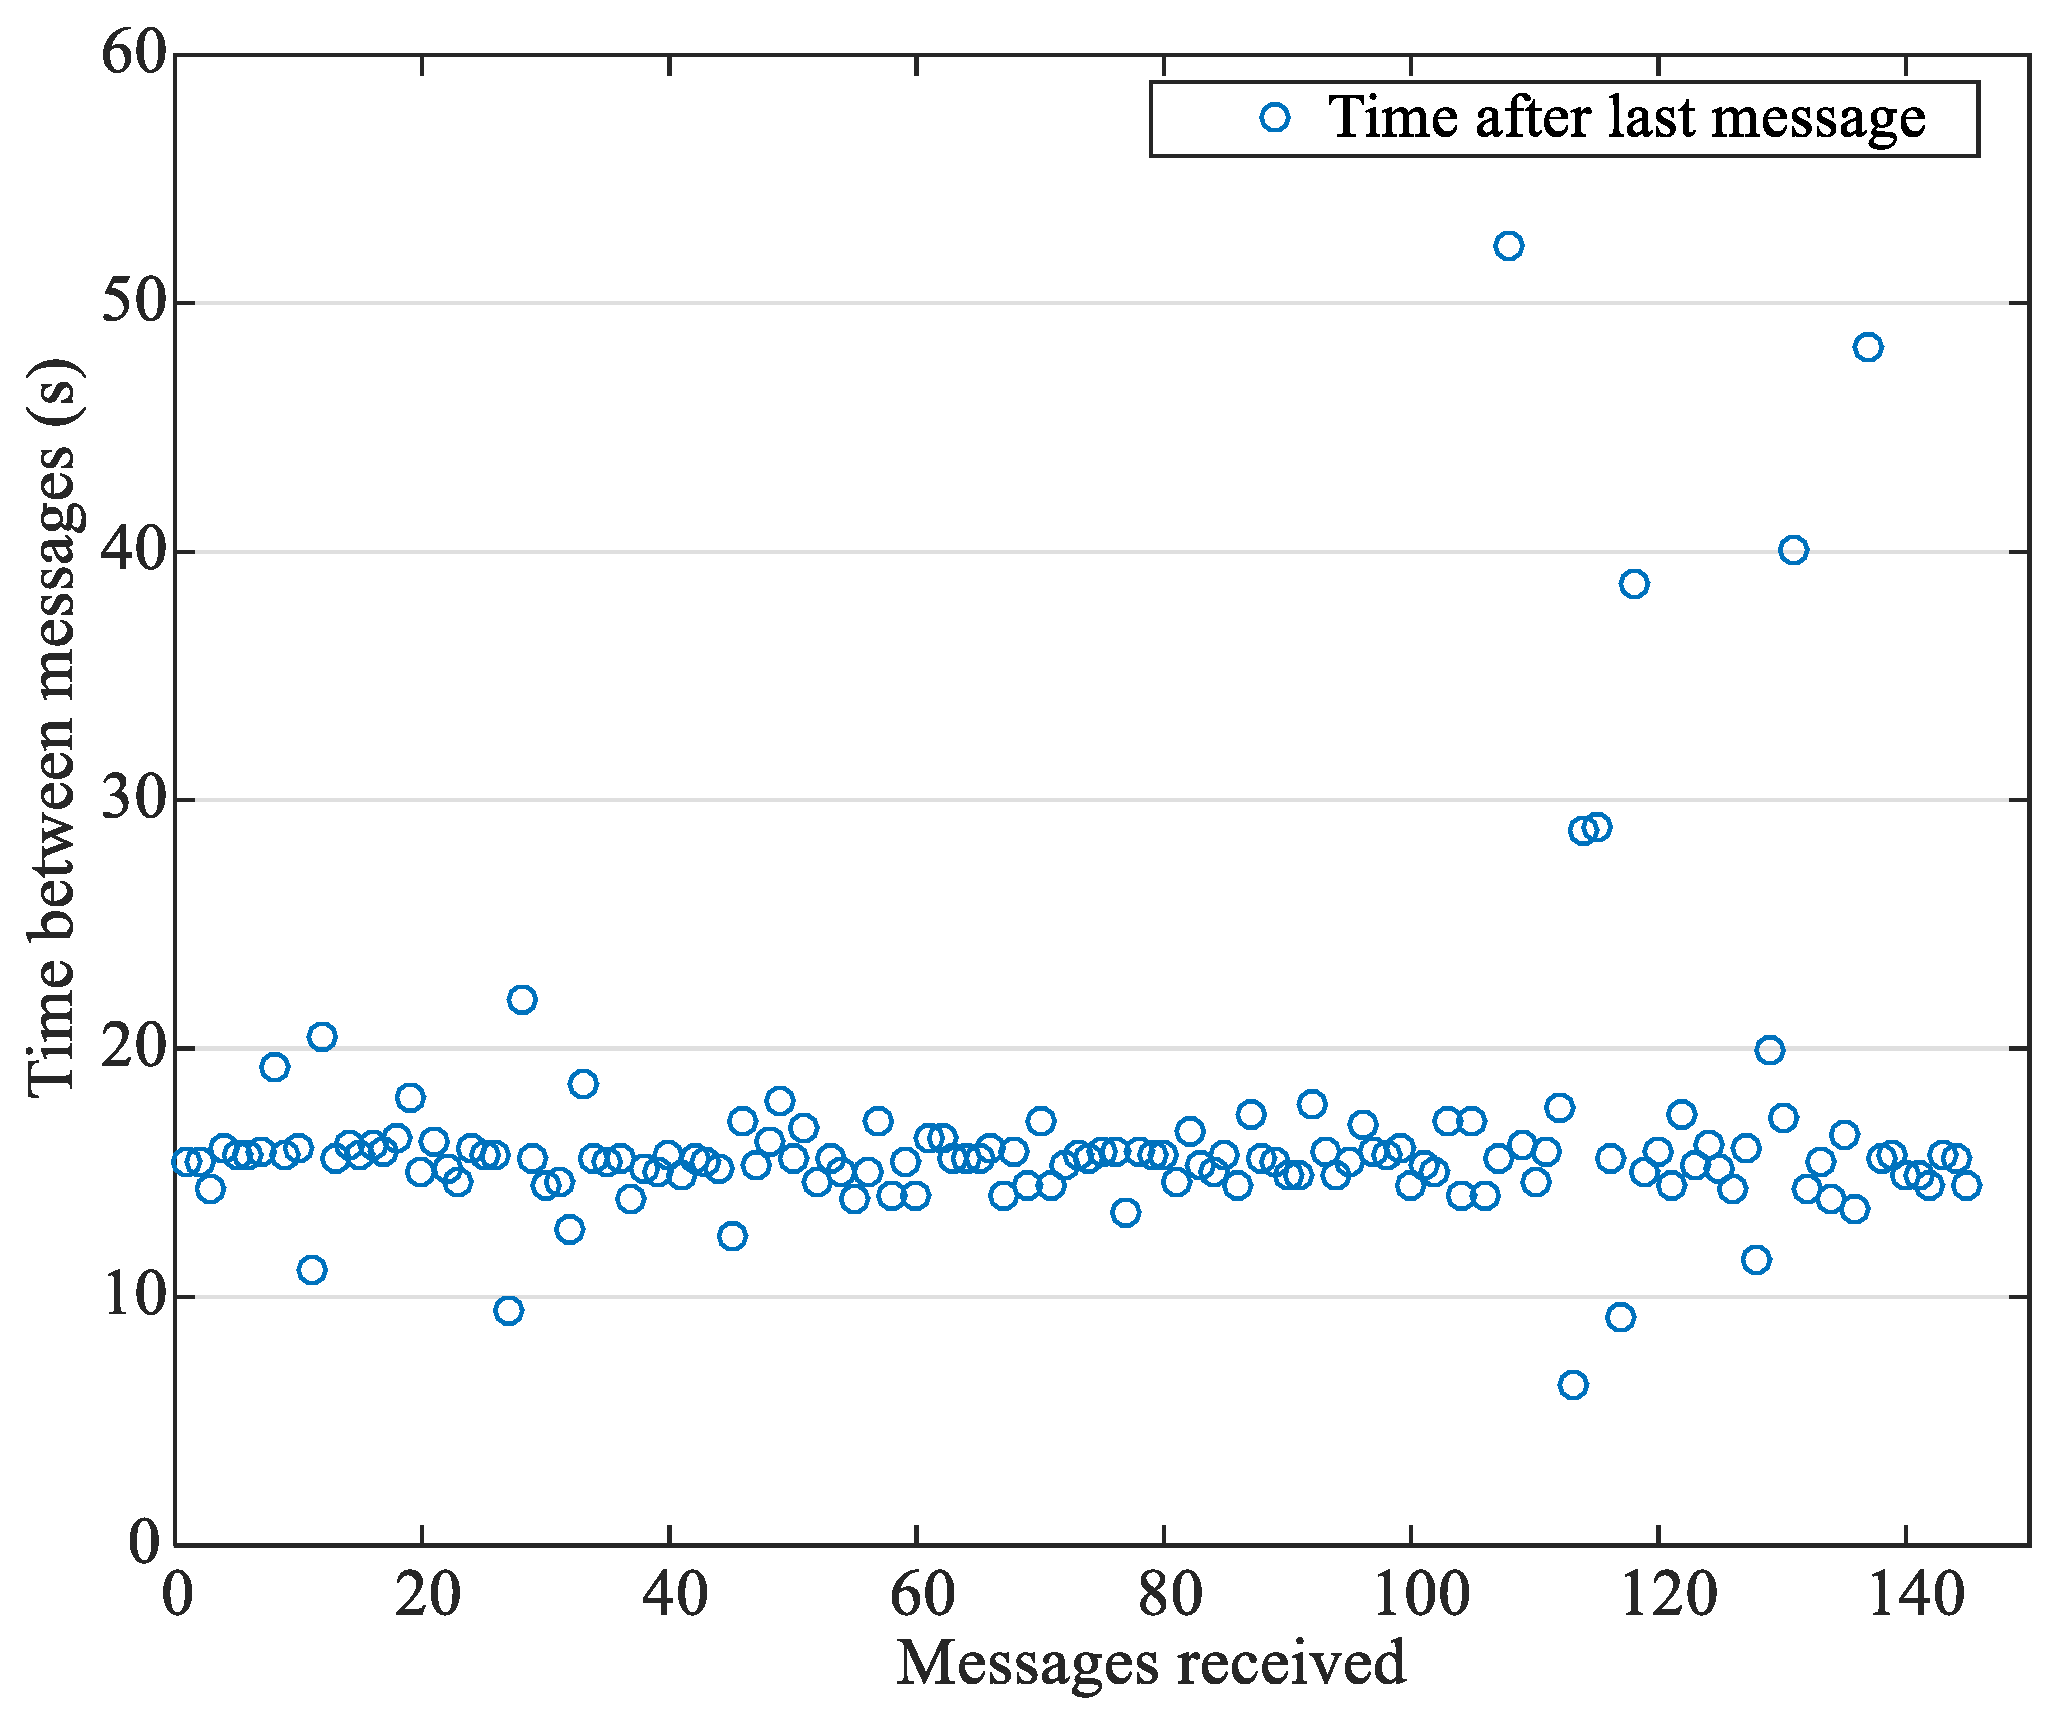
The microcontroller generates an index number and a timer and sent these two values to the ThingSpeak platform in loop. Exporting the acquired online data and processing it using MATLAB, the time difference between the received messages is shown in
Figure 17.
From the data collected the mean interval between received messages is 16.43 s. The plot demonstrates a drawback of this free platform being inadequate to real-time data acquisition and control, bellow 15 s of refresh rate.
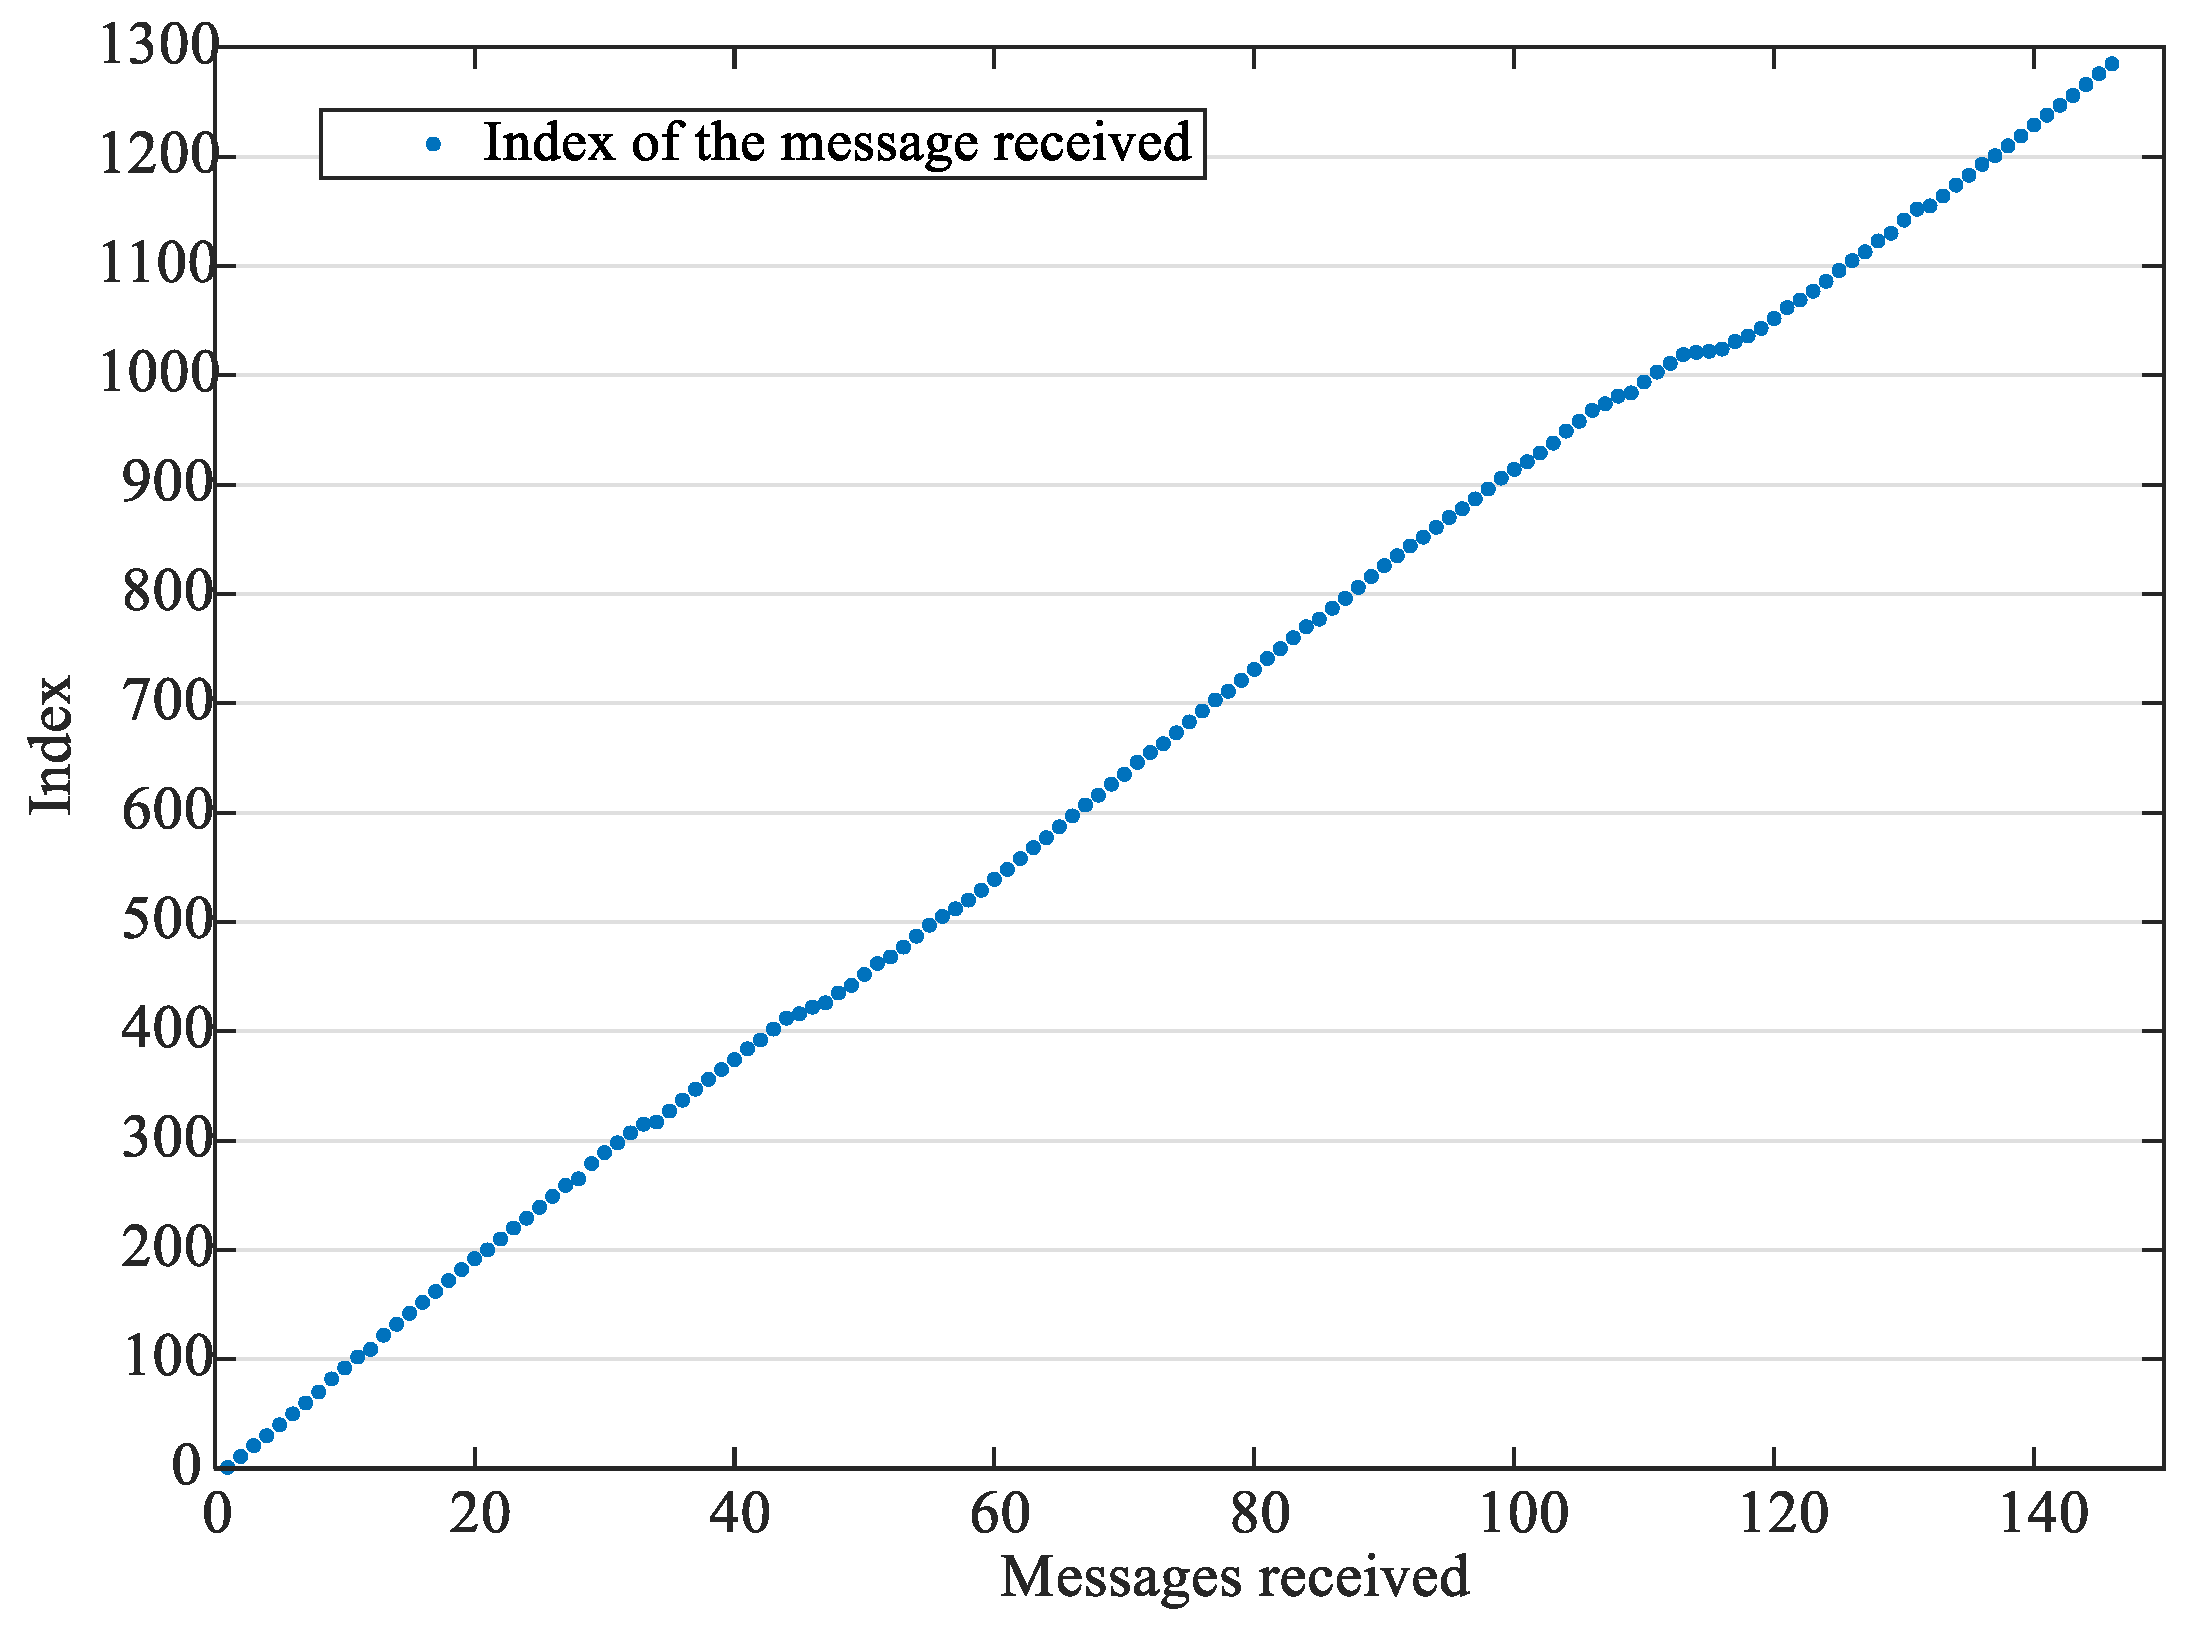
Due to this bottleneck, some of the messages are expected to not be received as it’s confirmed by the discrepancy in the index numbers of the received messages shown in
Figure 18.
A reception ratio (
RR) is calculated comparing the number of received messages with the not received messages and it’s given by:
This shows that near only one message in each 10 is received by the ThingSpeak platform. Important and frequent messages must be avoided to send to cloud using this platform. Some acknowledge measures should be used to assure the correct reception.
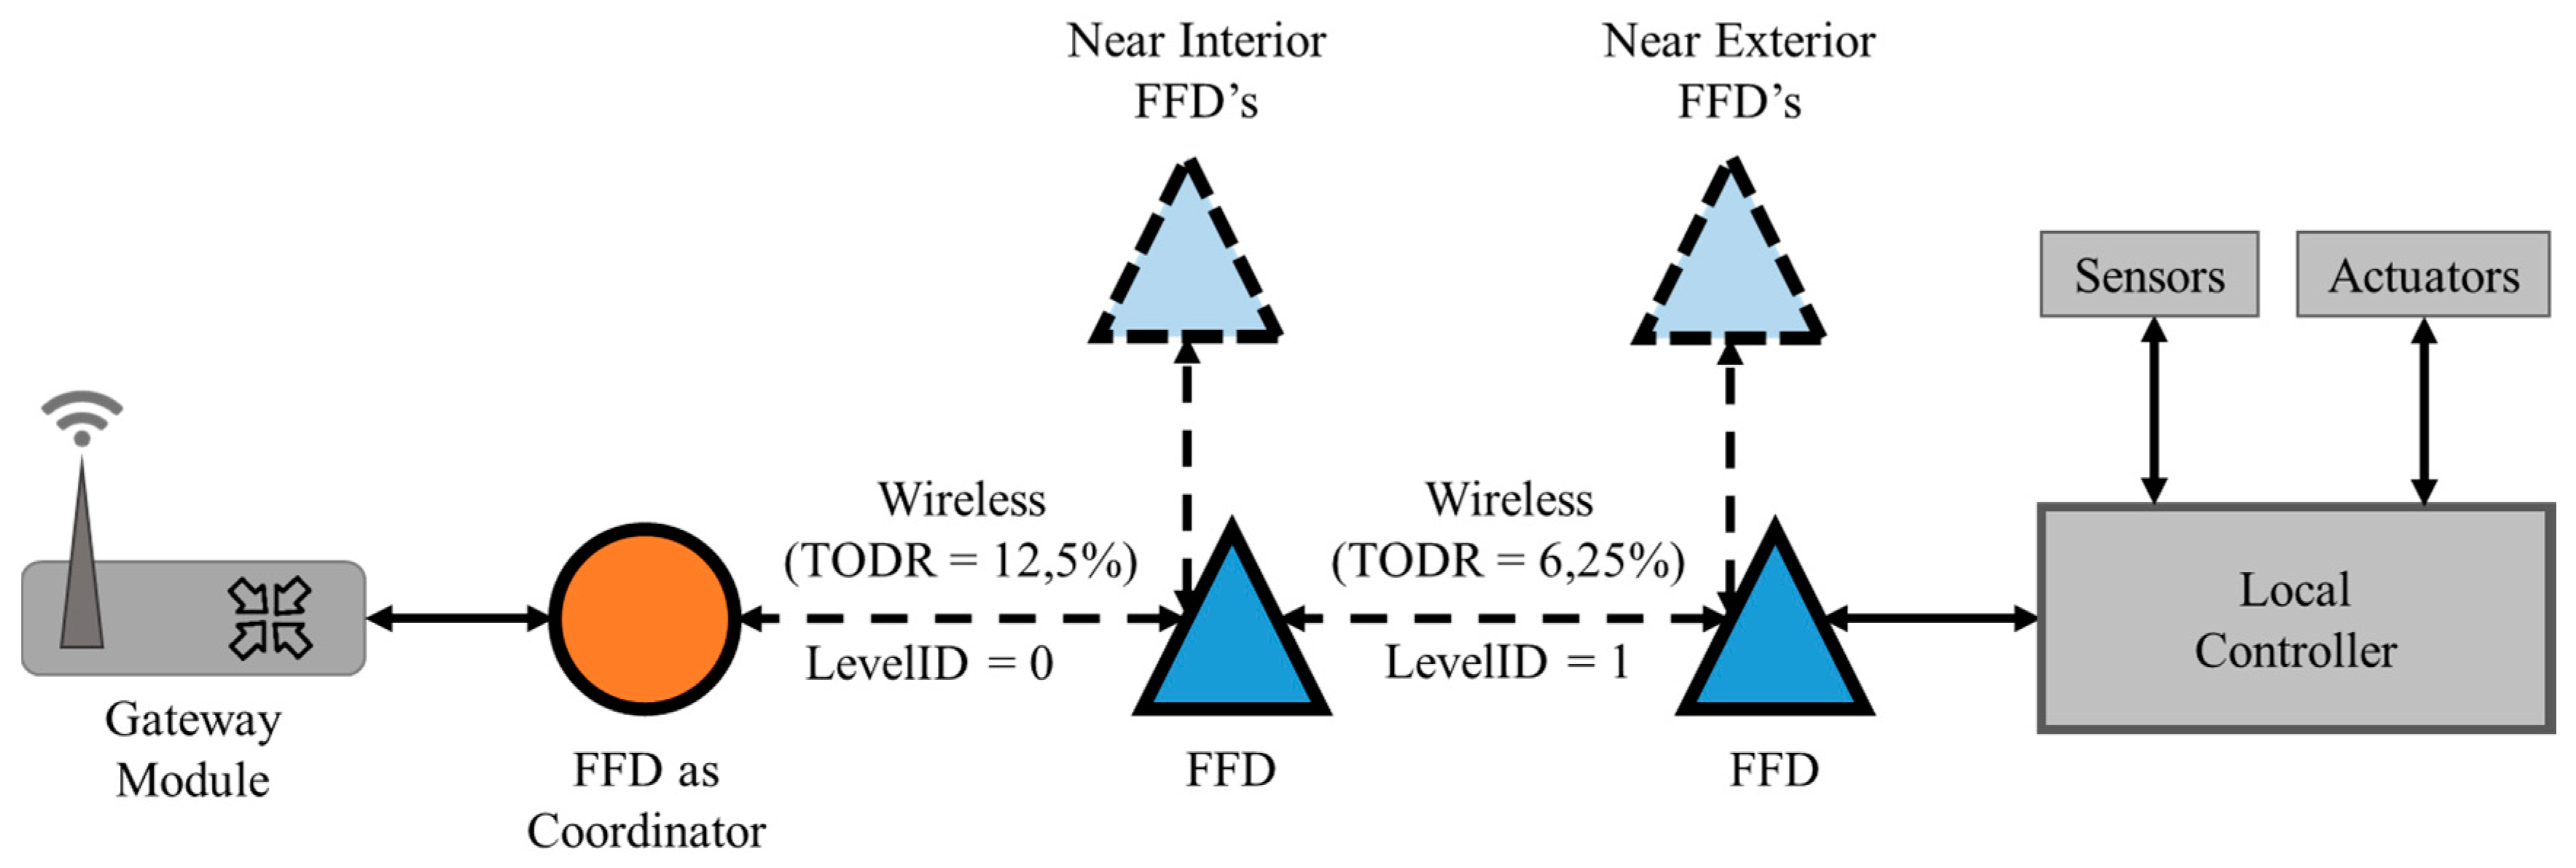
5.3. Time Occupation Duty Ratio Analysis
A parameter to be considered when using communications in a multi-level architecture is the Time Occupation Duty Ratio (TODR) that indicates the time period which communication driver can take to transmit data to the FFD coordinator [
37]. The final TODR value depends on the quantity of ZigBee levels,
q, within the network and it’s given by:
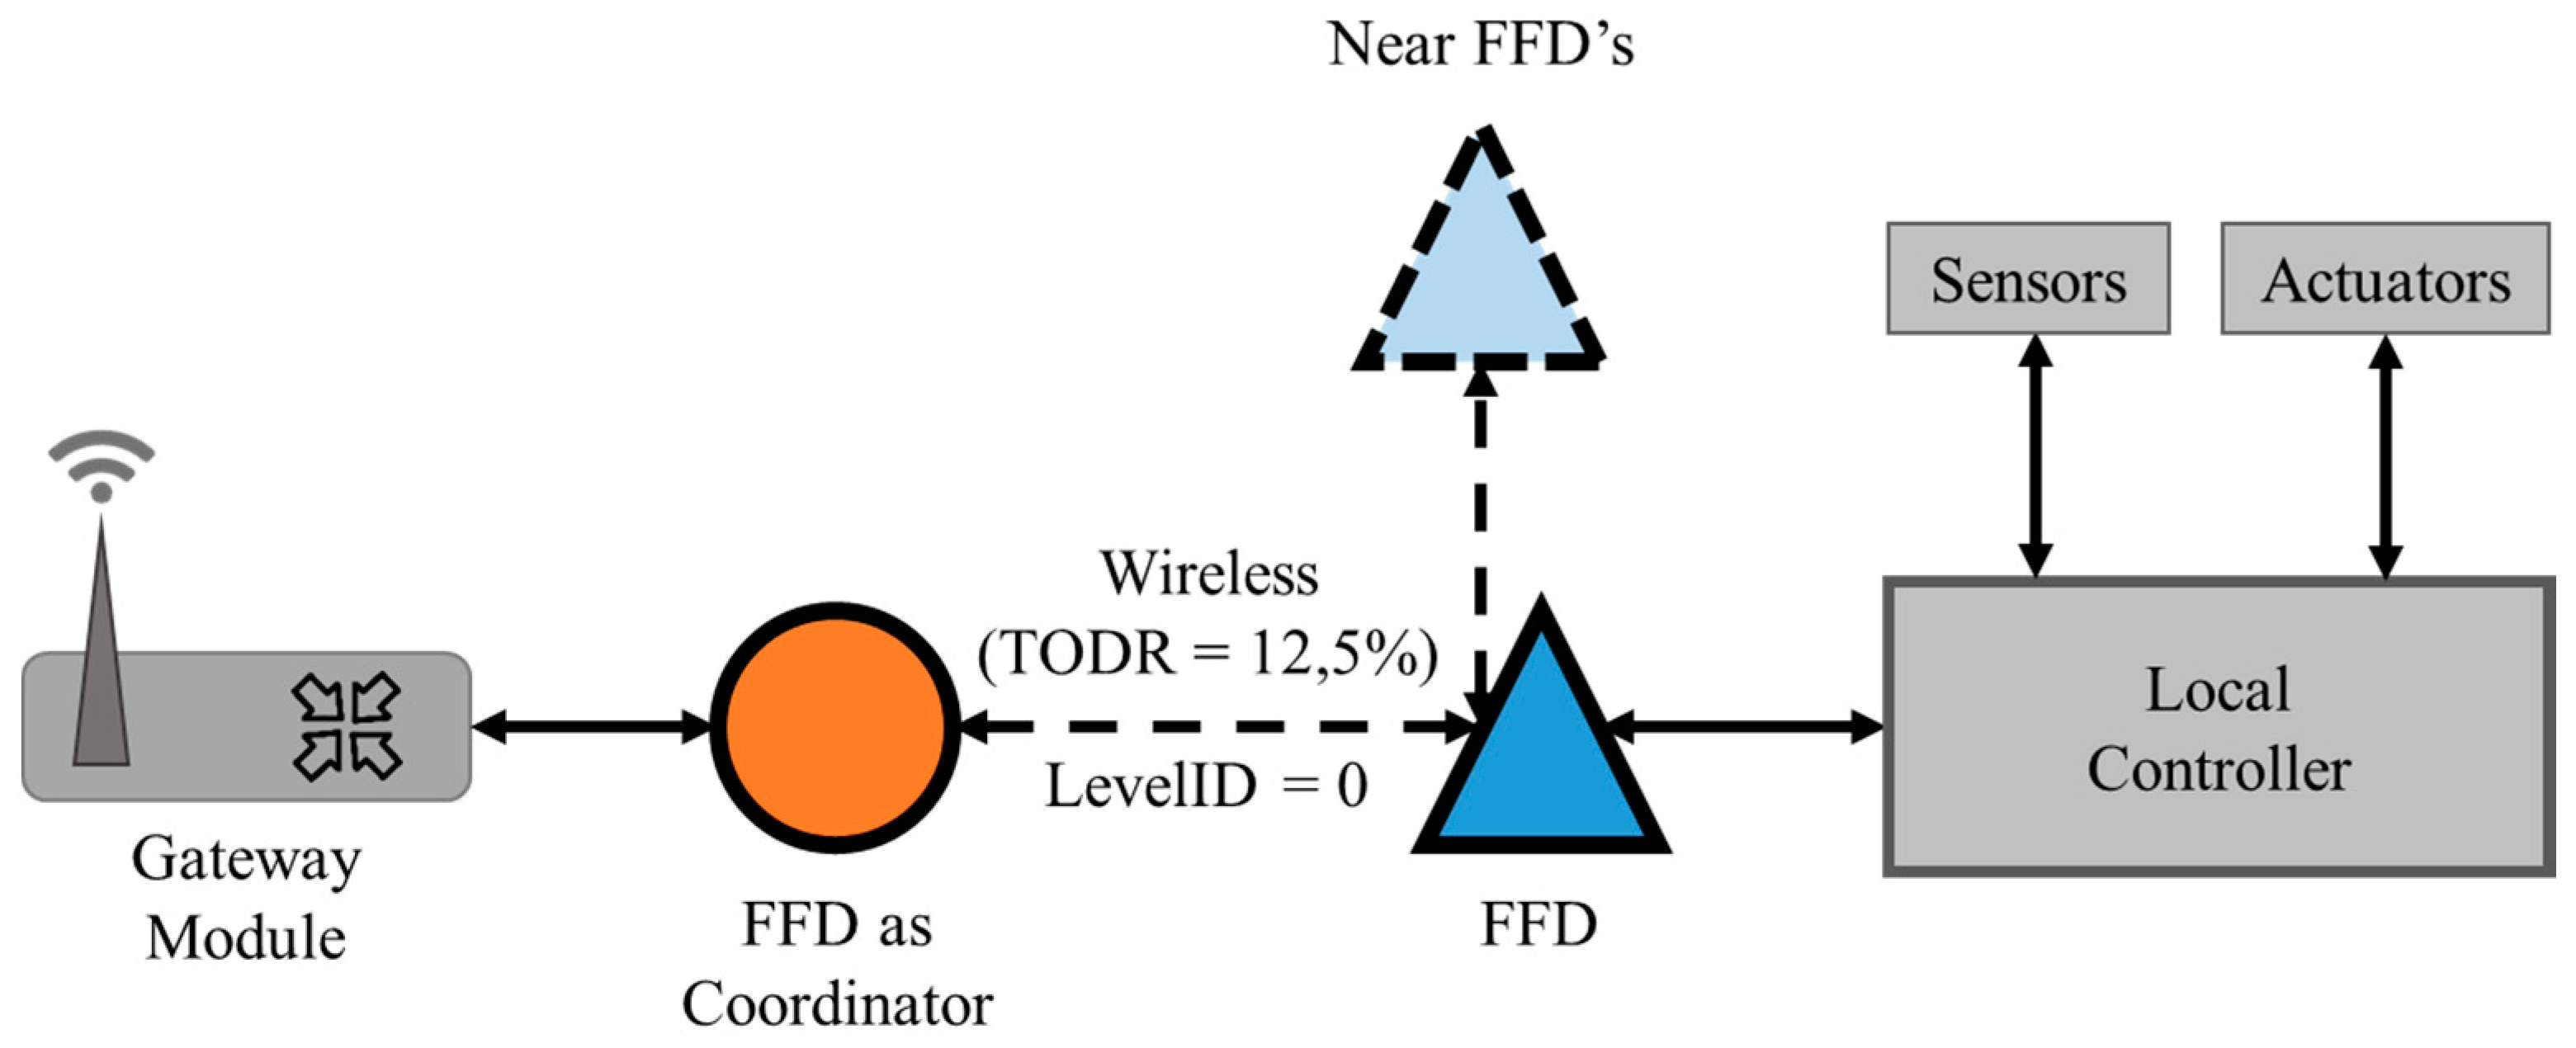
Using the network example shown in
Figure 16 for the
LevelID = 0, the network coordinator level, based on (2) the TODR value is given by:
Using the same approach as (3) but for the hybrid level, the
LevelID = 1 (
q = 1) the TODR value is given by:
This shows that one FFD in the exterior network has a TODR value 2 times smaller than one FFD in the interior network. Therefore, the communication drivers placement should take this in consideration based on the importance and frequency of data transmission to the main gateway and coordinator.
A manufacturing cell interior connections example diagram with TODR value is shown in
Figure 19.
A manufacturing cell interior and hybrid connections example diagram with TODR values is shown in
Figure 20.
5.4. Distance Measurement Test
The location information of the materials, parts, products, platforms, robots and other assets inside an industrial plant is extremely valuable. Using the communication drivers and applying the Shadowing model [
38,
39], it’s possible to use the received signal strength indication (RSSI) to estimate de distance between the drivers inside a network.
The strength of signal falls off with distance over transmission medium. Using the Shadowing model, the wireless signal transmission is given by:
Where in (5), d is the distance from the transmitter to receiver and its unit is meter, d0 is a reference distance and usually equals 1 m, is the signal power received from the transmitter and its unit is dBm, is the signal power measured at the reference distance, X is a Gaussian random variable whose mean value is 0 and it reflects the change of the received signal power in certain distance, n is the path loss index and relates to the environment.
Simplifying the Shadowing model (5) results (6) given by:
Applying mathematical transformations in (6), the pretended distance value
d is given by:
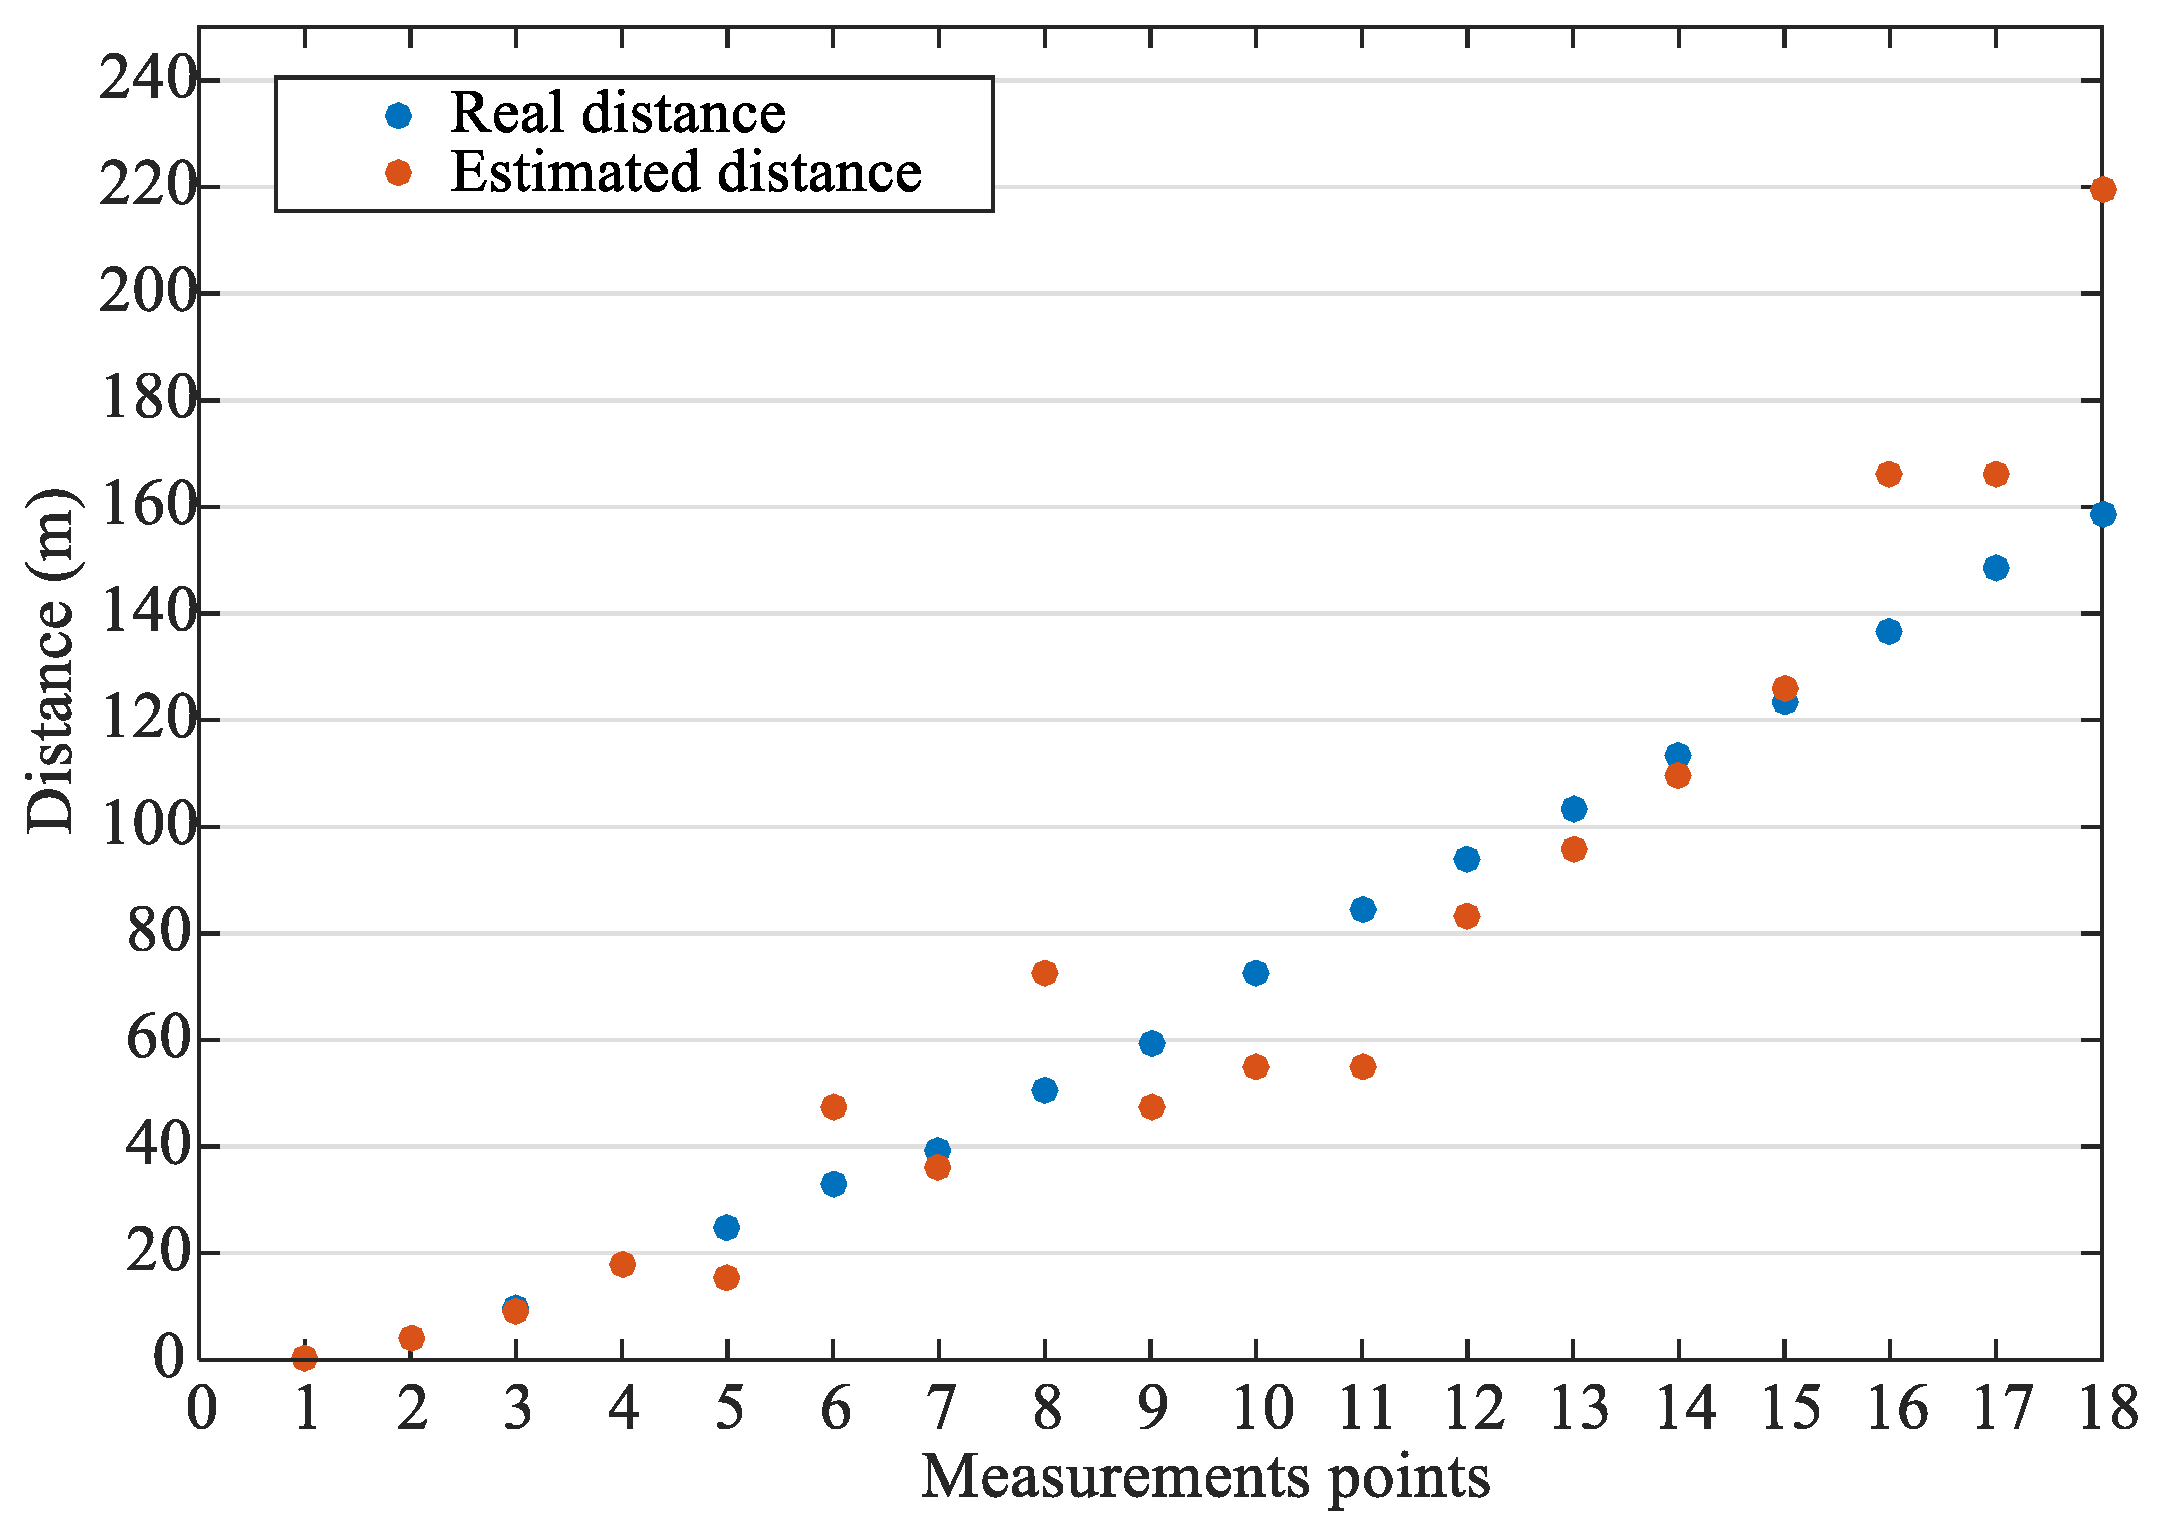
A line-of-sight situations range test was made to verify the, approximate, maximum distance that the modules can communicate ones among the others and the estimated distance is calculated using (7). To implement the test a microcontroller was used, connected to a communication driver module in Router API mode, transmitting a message within a one second period. With another communication driver connected via USB to a laptop it was possible to register the local RSSI given by the X-CTU program. The results of distance estimation obtained in the test for the wireless device are presented in
Table 3.
Although having some points with an excessive error, the mean value of 0.66% is pretty good taking into consideration that there were used only two FFD’s. Increasing the number of devices used and applying other equations to make a triangulation for the position the estimated distances would be more precise.
For better explanation of the results obtained, a plot was made containing the real distance of the measurements and the estimation using (7) is shown in
Figure 21.
6. Conclusions
This paper focused on the study and development of an IoT architecture for Smart Industry services providers. The study was applied to a legacy manufacturing cell. The architecture is aware of the main technologies, protocols and services in order to be an enabler of integrated services empowering the interrelationship of heterogeneous technologies of the present and future IoT.
The heterogeneity of available technologies and solutions brings obstacles and challenges when supported by the same architecture. The prototypes facilitate these technologies and services integration addressing the concerns of integration in an industrial cell. They offer extra security measures that are important to cover in a professional situation, added to overcome existing threats and overseen future risks. The modularity of the system offers the ability to integrate in the platform different technologies solutions and security measures. The implementation of all the IoT devices proposed simplifies, facilitates and enhances business intelligence and operators’ activity.
The generalization of this work to other manufacturing cells presents some advantages but also many challenges: one challenge is related to the more complex cells, such as aeronautics construction, where the number of machines largely surpasses the number of machines analyzed in this work. Nevertheless, the IoT architecture defined was tested for seven machines simultaneously and the load did not go over 12.5% of the maximum load. So, in a very rough estimation, the number of machines may be four time higher and the load will still be in the order of 50%, which is relatively safe. Moreover, the architecture assumes that many gateways can be created for handling several groups of nodes. Generating too much data may be difficult to handle on the management mainframes, so these mainframes will probably need to be upgraded.
Other challenge is related to the legacy equipment that have no sort of communications interfaces and, in many cases, are still operated manually. The existence of IoT sensors in the machine may provide smooth integration of the machine operations, namely on-off, loading, processing, unloading. The sensors installation highly depends on the availably of opening the equipment. In a less ambition phase, pressure sensors may be put over the operating buttons to sense and transmit the operator commands. In an even less ambition phase, the operators have a board where they log the operations. The integration proposed in the two previous phases are smooth as they do not deviate the operator from productive work. This last phase is the less smooth integration as it requires the operators to enroll other activities deviating then from the productive work.
Anyway, as long as data is acquired, the IoT architecture proposed handles all the remaining to integrate the legacy cell into an Industry 4.0 system.
The cloud platform chosen was tested and relevant details are achieved. Some important measures were proposed to avoid some existent bottlenecks. Other free platforms could be used such as Carriots, among others [
36], but this drawback can only be overcome by the development of own platform using free tools such as Kaa [
36].


