Article

Machine Learning Enabled Food Contamination Detection Using RFID and Internet of Things System

1
James Watt School of Engineering, University of Glasgow, Glasgow G12 8QQ, UK
2
School of Electronic Science and Engineering, University of Electronic Science and Technology of China (UESTC), Chengdu 611731, China
3
College of Engineering and IT, Ajman University, Ajman AE 346, United Arab Emirates
*
Author to whom correspondence should be addressed.
J. Sens. Actuator Netw. 2021, 10(4), 63; https://doi.org/10.3390/jsan10040063
Submission received: 1 August 2021 / Revised: 12 October 2021 / Accepted: 30 October 2021 / Published: 2 November 2021
(This article belongs to the Special Issue Machine Learning in IoT Networking and Communications)

Abstract

:
This paper presents an approach based on radio frequency identification (RFID) and machine learning for contamination sensing of food items and drinks such as soft drinks, alcohol, baby formula milk, etc. We employ sticker-type inkjet printed ultra-high-frequency (UHF) RFID tags for contamination sensing experimentation. The RFID tag antenna was mounted on pure as well as contaminated food products with known contaminant quantity. The received signal strength indicator (RSSI), as well as the phase of the backscattered signal from the RFID tag mounted on the food item, are measured using the Tagformance Pro setup. We used a machine-learning algorithm XGBoost for further training of the model and improving the accuracy of sensing, which is about 90%. Therefore, this research study paves a way for ubiquitous contamination/content sensing using RFID and machine learning technologies that can enlighten their users about the health concerns and safety of their food.

1. Introduction

The Internet of Things (IoT) and machine learning (ML) are reshaping our lives by providing numerous emerging applications ranging from healthcare, smart environments, smart sensing, etc. [1,2,3,4,5,6,7]. Moreover, short-range IoT technologies such as RFID are considered to be last-mile solutions in many applications such as inventory management, supply chain tracking, healthcare, waste management, and so forth [8,9,10,11,12,13,14]. The UHF RFID technology provides sensing benefits due to its inherent capability of noticing impedance variations with respect to the permittivity of background environments [15,16,17,18,19]. Moreover, the passive UHF RFID tag also provides a relatively long read range as compared to other competitors such as low frequency (LF) RFID and high frequency (HF) RFID. Additionally, the passive UHF RFID tags pose easily printable sticker-type structures, which helps their low-cost and bulk manufacturing [20,21].
Food contamination is one of the biggest issues among public health problems. Moreover, the spoilage and deterioration of food quality during storage is another challenge for both the food industry and environmental perspectives [22,23]. According to the world health organization (WHO) fact sheet, every year almost 600 million people fall ill after eating contaminated food. Similarly, almost 0.42 million people die after eating contaminated food [24]. An RFID sensor was proposed for detecting the quality of food [25]. The quality and contamination of food were detected by measuring the read range due to variation in permittivity of background food packets. However, this technique requires a pair of tags to be mounted at a fixed distance. A remote patient monitoring system has been proposed in [26] using RFID and ML for early detection of suicidal behavior in mental health facilities. A range of machine learning algorithms was tested and found that the Decision tree algorithm provides a better result as compared to random forest and XGBoost in this scenario. In [27], RFID and ML based techniques were used to detect the human presence and daily human activities. The proposed algorithms successfully demonstrated the accuracy of 96.7% in recognizing 24 different daily activities. The dielectric properties of organic aqueous liquids were tested with a range of different permittivity values. The label-type RFID tag antenna was mounted to either a clear borosilicate glass bottle or Petri plate. Different solutions were tested solutions consist of high-relative permittivity (such as water) along with low permittivity, lossy liquids (such as xylene) having distinctive frequency characteristics with a read range of up to 7 m for each type of container. The proposed sensor was also able to detect ‘unknown’ solutions and determine the dielectric properties by utilizing standard curve analysis with an accuracy of ±0.834 relative permittivity and ±0.050 S · m−1 conductivity.
In [28], a human activity recognition system was proposed by combining passive RFID tags and a machine learning algorithm. A passive UHF RFID tag-based wall was designed for the activity recognition experiment. Moreover, a machine learning algorithm was implemented using a multivariate Gaussian algorithm for classification and prediction of sampled activities. In this scenario, the multivariate Gaussian algorithm achieved better performance in terms of accuracy as compared with standard algorithms such as random forest, logistic regression, and support vector machine (SVM) classifiers.
An idea regarding food quality sensing using RFID tags is presented in [29]. The authors used RFIDs and USRP N210 software radios for food content sensing. This set uses two frequency excitation techniques for food quality sensing. The first frequency was utilized for delivering the power in industrial, scientific, and medical (ISM) bands. The second frequency was aimed to record the changes in RFID tag’s response mounted on liquid over a wideband (due to dielectric effects). Moreover, an algorithm was implemented in MATLAB for averaging 50 RFID responses for extracting amplitude and phase. In addition to this, another XGBoost algorithm was implemented in python for gradient boosting tree classifiers. This experiment was tested for alcohol tainting and baby formula adulteration with an accuracy of 96%. Although, this experiment provides good accuracy with a difference of 25% approximately 10 g’s addition each time in sample. Therefore, the sample having in between values was not tested. Additionally, this setup is very expensive and can be used for a commercial solution.
Therefore, this paper provides a simple approach that only requires a small handheld.
RFID reader for measuring backscatter power from tagged food samples in terms of RSSI. The proposed technique employs sticker-type inkjet printed RFID tags and a machine learning algorithm for food contamination sensing and accuracy improvements. The received signal strength indicator (RSSI), as well as phase of the backscattered signal from RFID tag mounted on a food item, are measured using Tagformance Pro setup. The normal spring water was taken as a food sample. A known amount of salt and sugar quantity was deliberately added to water and mixed evenly. The food contamination/contents were sensed with an accuracy of 90%. We used the XGBoost algorithm for further training of the model and improving the accuracy of sensing, which is about 90%. Therefore, this research study paves a way for ubiquitous contamination sensing using RFID and machine learning technologies that can enlighten their users about the health concerns and safety of their food.

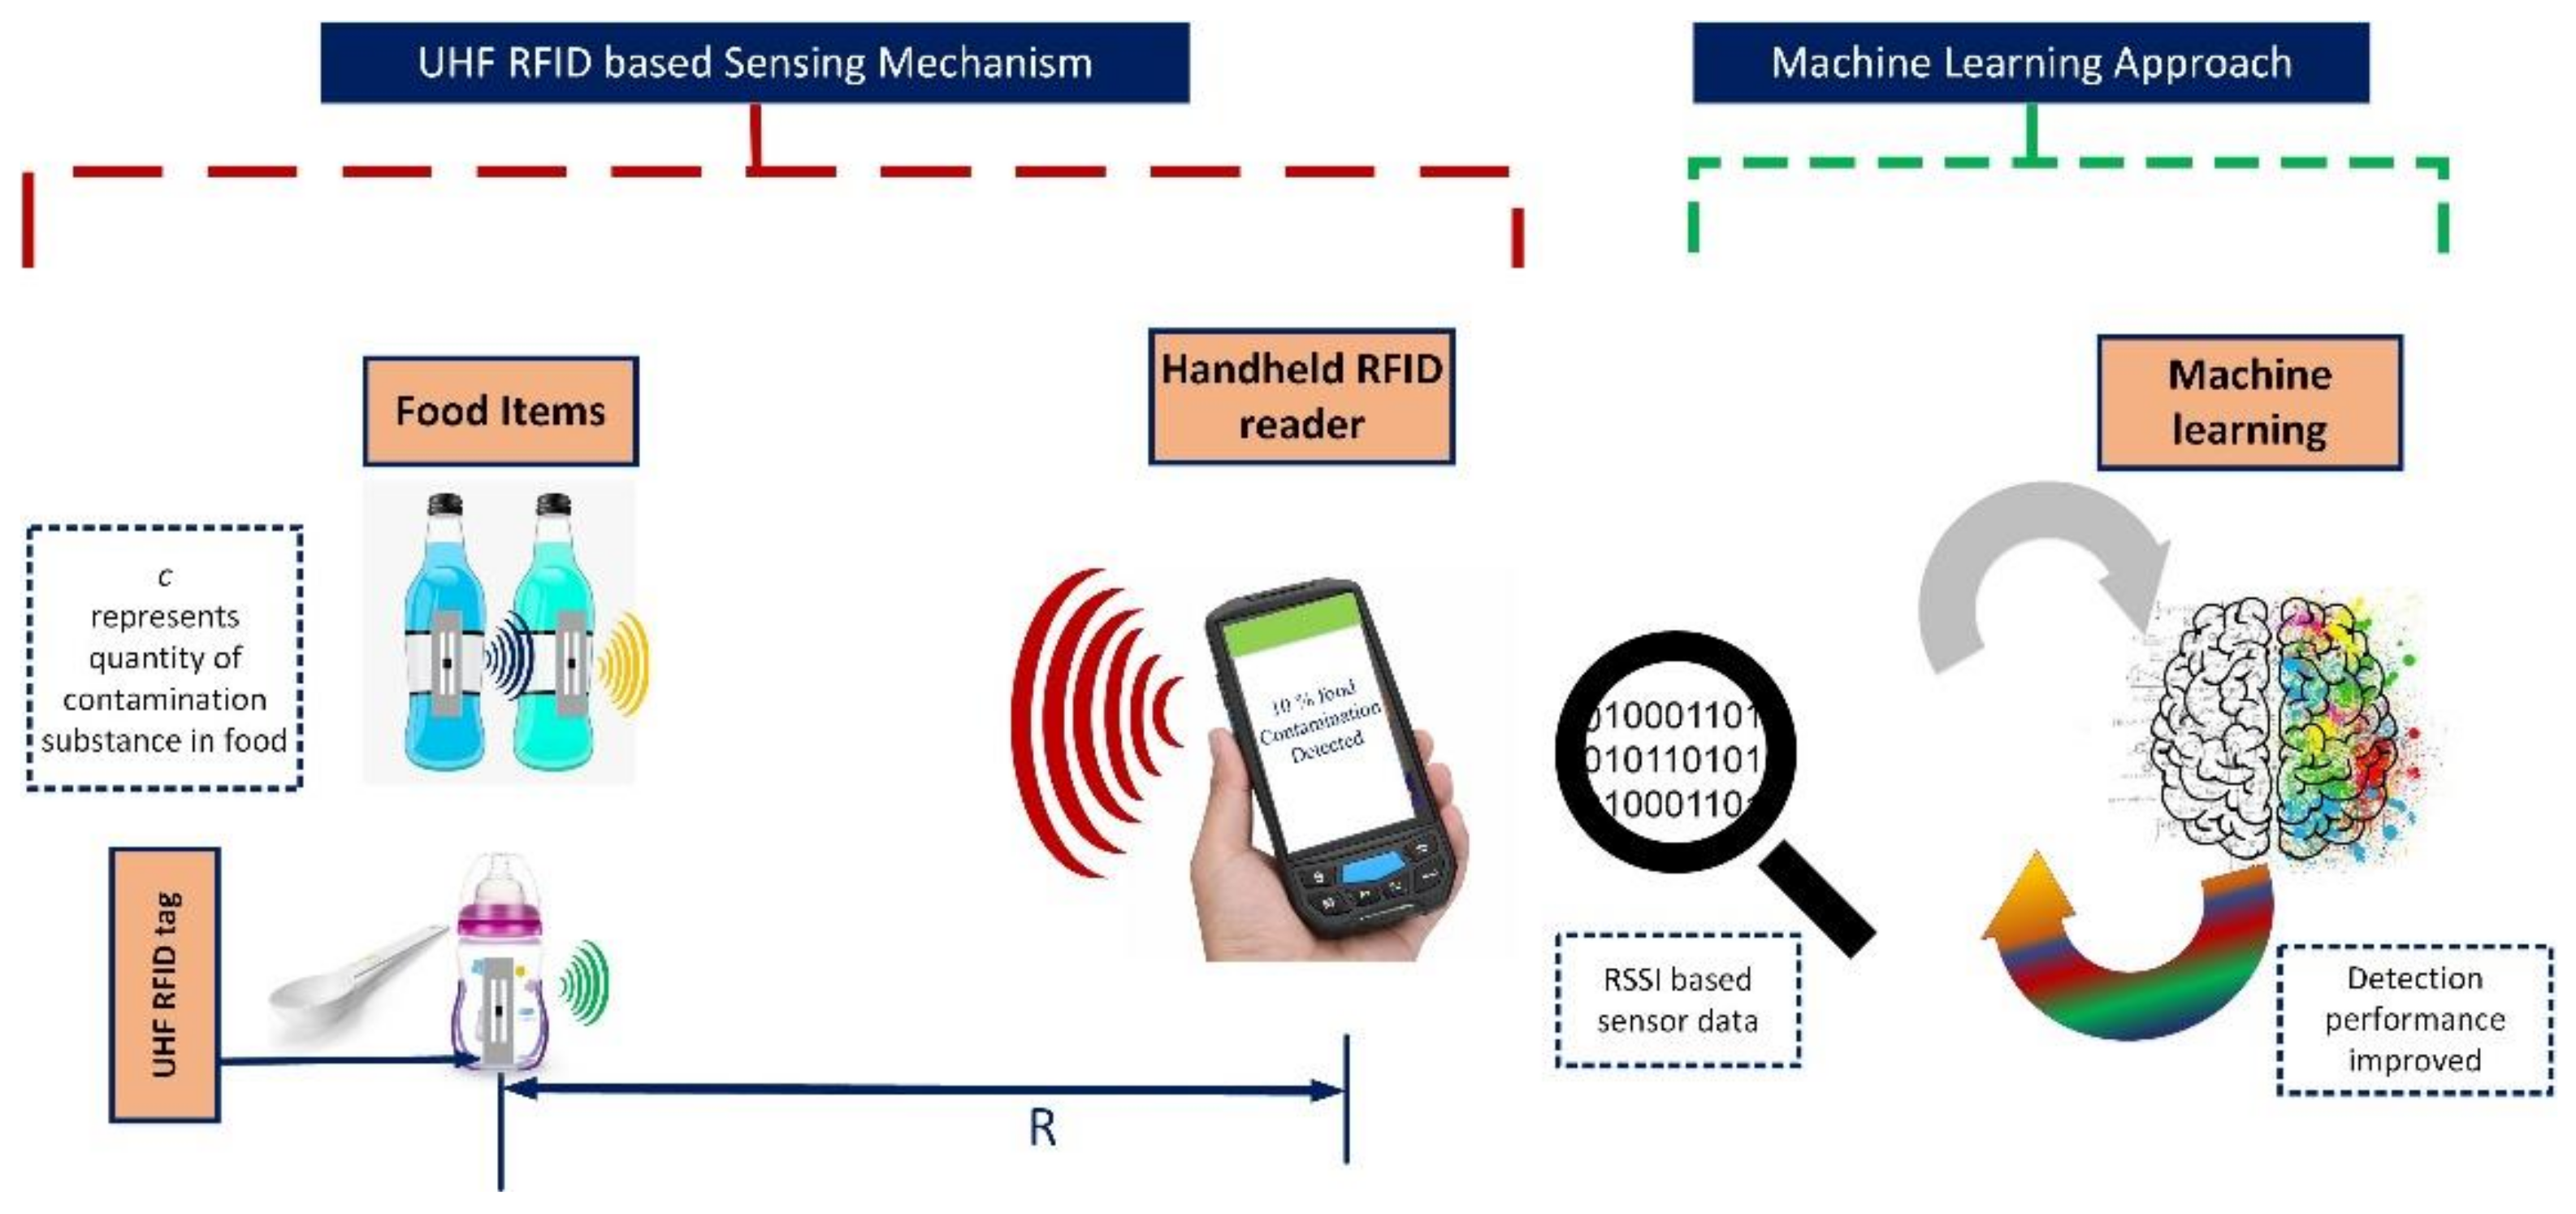
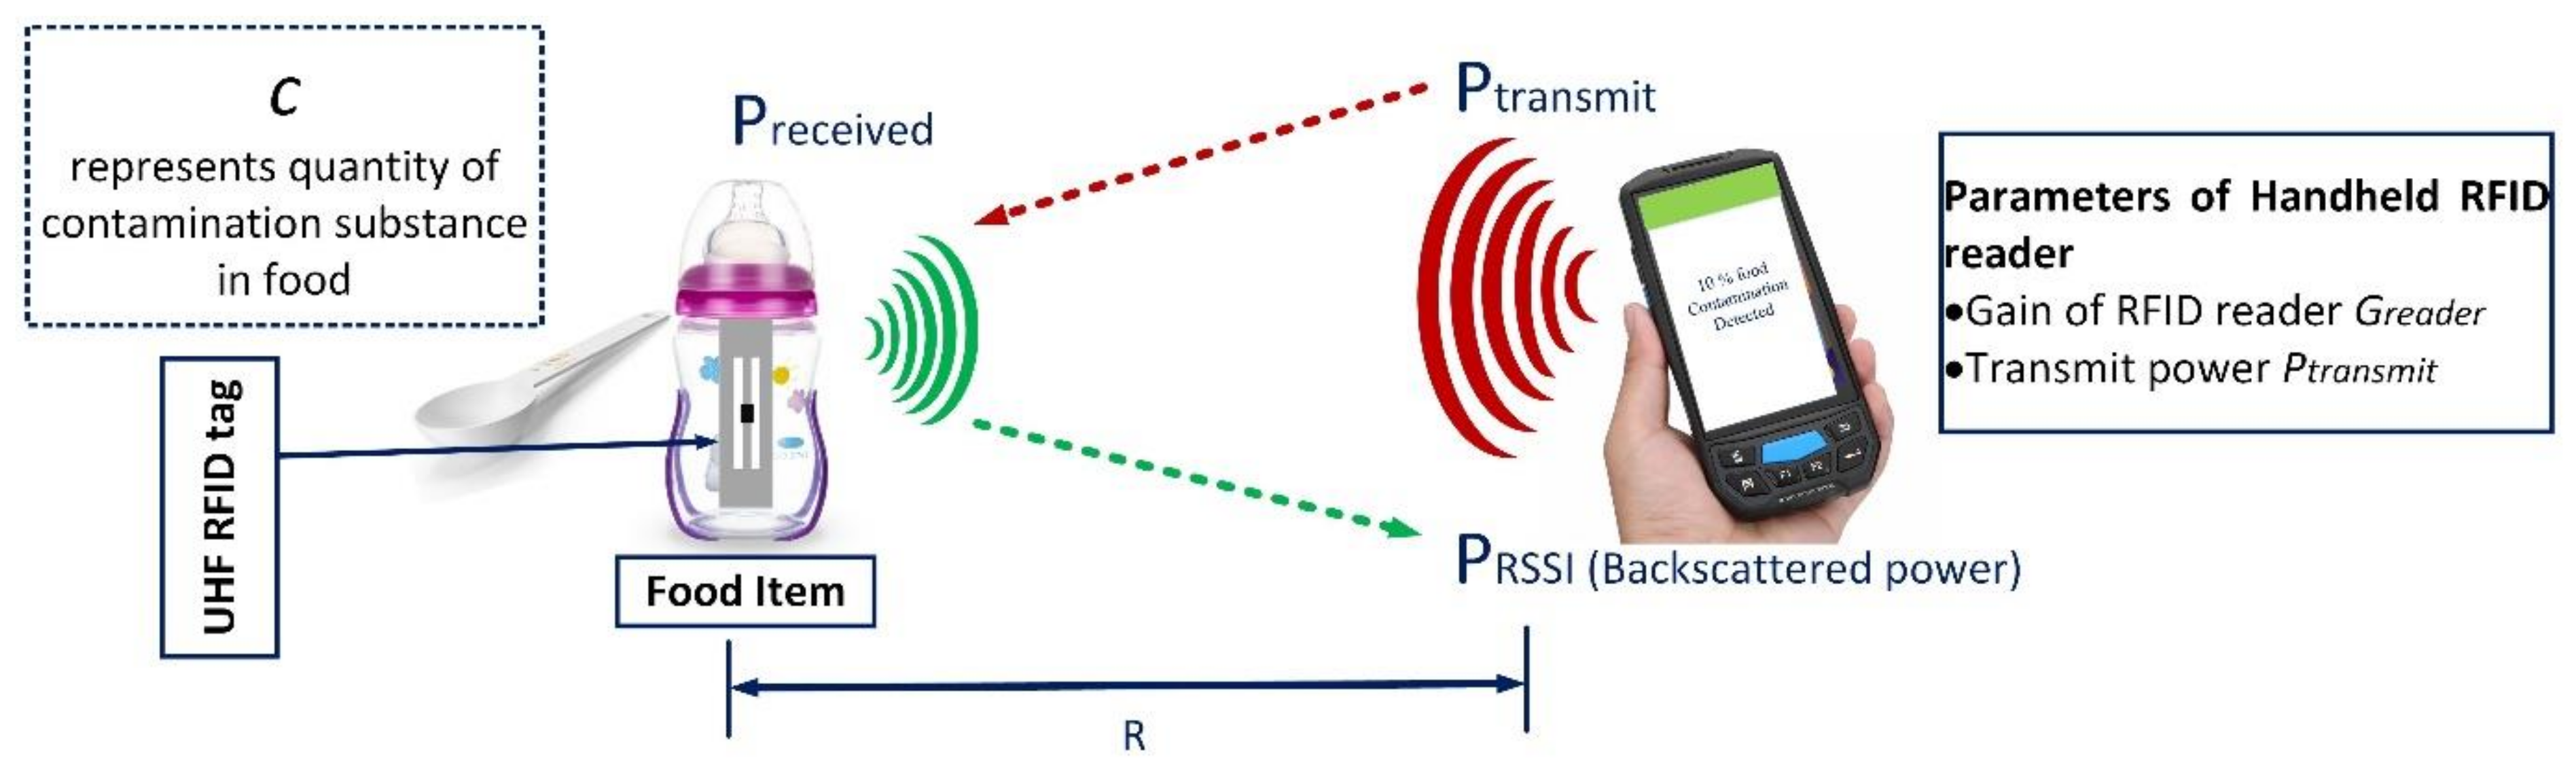
2. Proposed Methodology for Sensing Contamination

Figure 1 shows the proposed system for food contamination detection using UHF RFID tags and machine learning. For food contamination sensing proposes, the RFID reader is placed at a fixed distance ‘R’ from the food item to be sensed. A UHF RFID tag antenna is mounted on each food item such as designed in [30]. The backscattered power from pure food items and contaminated food items will be compared and the data would be given as input to the machine learning algorithm. The machine learning algorithm trains its self and improves food contamination sensing.
Figure 2 illustrates the methodology for food contamination sensing using UHF RFID tags. Let “c” represents the quantity of substance added as a contaminant in a pure substance. Moreover, the known parameters of reader setup such as transmitted power P t r a n s m i t and reader antenna gain G r e a d e r would help to calculate P r e c e i v e d by the tag antenna. Accordingly, the equations presented in [20,30,31] can be modified as follows:
P r e c e i v e d = P t r a n s m i t G r e a d e r 4 π R 2 λ 2 4 π G T a g [ c ] η p o l a r i z a t i o n
where G T a g [ c ] is the associated gain of tag antenna with respect to the quantity of contaminant substance contents c. Moreover, η p o l a r i z a t i o n represents a polarization mismatch between the tag and reader antenna, which will be equal to 1 in our case as both tag and reader antenna are aligned.
The power extracted by RFID chip from tag antenna can be expressed as follow:
P r _ c h i p = P t r a n s m i t G r e a d e r 4 π R 2 λ 2 4 π G T a g [ c ] η p τ [ c ]
where τ [ c ] measures the impedance mismatch between RFID chip and tag, also known as power transmission coefficient:
τ [ c ] = 4 R c h i p R T a g [ c ] Z c h i p + Z T a g [ c ] 2
The tag and chip impedance associated with contaminant quantity are Z T a g [ c ] = R T a g [ c ] + j X T a g [ c ] and Z c h i p = R c h i p + j X c h i p , respectively.
Therefore, the backscatter power from the tag can be expressed as:
P b a c k s c a t t e r = P t r a n s m i t G r e a d e r 4 π R 2 λ 2 4 π G T a g [ c ] η p o l a r i z a t i o n G T a g [ c ] Γ m ( c ) 2
where Γ m ( c ) reflection coefficient of tag and is related to power transmission coefficient as τ [ c ] = 1 Γ m ( c ) 2 .
Accordingly, the received signal strength indicator (RSSI) extracted by the RFID reader from backscatter power is represented as:
P R S S I [ c ] = 1 4 π d 2 * λ 2 4 π G r e a d e r * P b a c k s c a t t e r
P R S S I [ c ] = 1 4 π R 2 * λ 2 4 π G r e a d e r * P t r a n s m i t G r e a d e r 4 π R 2 λ 2 4 π G T a g [ c ] η p o l a r i z a t i o n G T a g [ c ] Γ m ( c ) 2
where r c s T a g [ c ] = λ 2 4 π G T a g 2 [ c ] Γ m ( c ) 2 can be represented as radar cross-section of the tag antenna.
P R S S I [ c ] = 1 4 π λ 4 π R 2 P t r a n s m i t G 2 r e a d e r r c s T a g [ c ] η 2 p o l a r i z a t i o n
The quantity of contaminant ‘c’ can be sensed by comparing the P R S S I [ c ] and pure food item P R S S I . Similarly, the different quantity of contaminant ‘c1’ and also be sensed by comparing P R S S I [ c ] and P R S S I [ c 1 ] .

3. Experimental Setup

Figure 3 shows the experimental system includes Tagformace Pro setup from voyantic company(Espoo, Finland) [32,33] and water bottles samples having a different quantity of salt and sugar. The Tagformance Pro includes a transceiver unit, a 6 dBi linearly polarized antenna, and a foam spacer. The transceiver unit was attached to a computer system with a pre-installed Tagformance software setup that helps to record different RFID tag’s performance parameters such as read range, backscatter power, and RSSI. The Tagformance setup uses Frii’s formula as described by (1) for calculating RSSI and theoretical read range. The RSSI or read range was determined for known fixed distance, which is kept fixed by a foam spacer. The water samples are placed 30 cm apart using a foam spacer and the corresponding RSSI was recorded. The tag antenna was mounted on each sample as described in the subset of Figure 3. The Tagformance Pro setup also uses a similar principle as described in the previous section for RSSI measurement.
A frequency sweep was run from 860 to 960 MHz and the corresponding RSSI associated with tag antenna mounted on a particular food sample was recorded by Tagformance Pro software. The Tagformance also uses a similar principle as described in the previous section for RSSI measurement. The 500 mL water sample packed in a PET bottle (with relative permittivity ϵr = 3.4) was used for experiment proposes. We prepared 84 samples in total, with half of the samples for salt and half for sugar contamination detection.

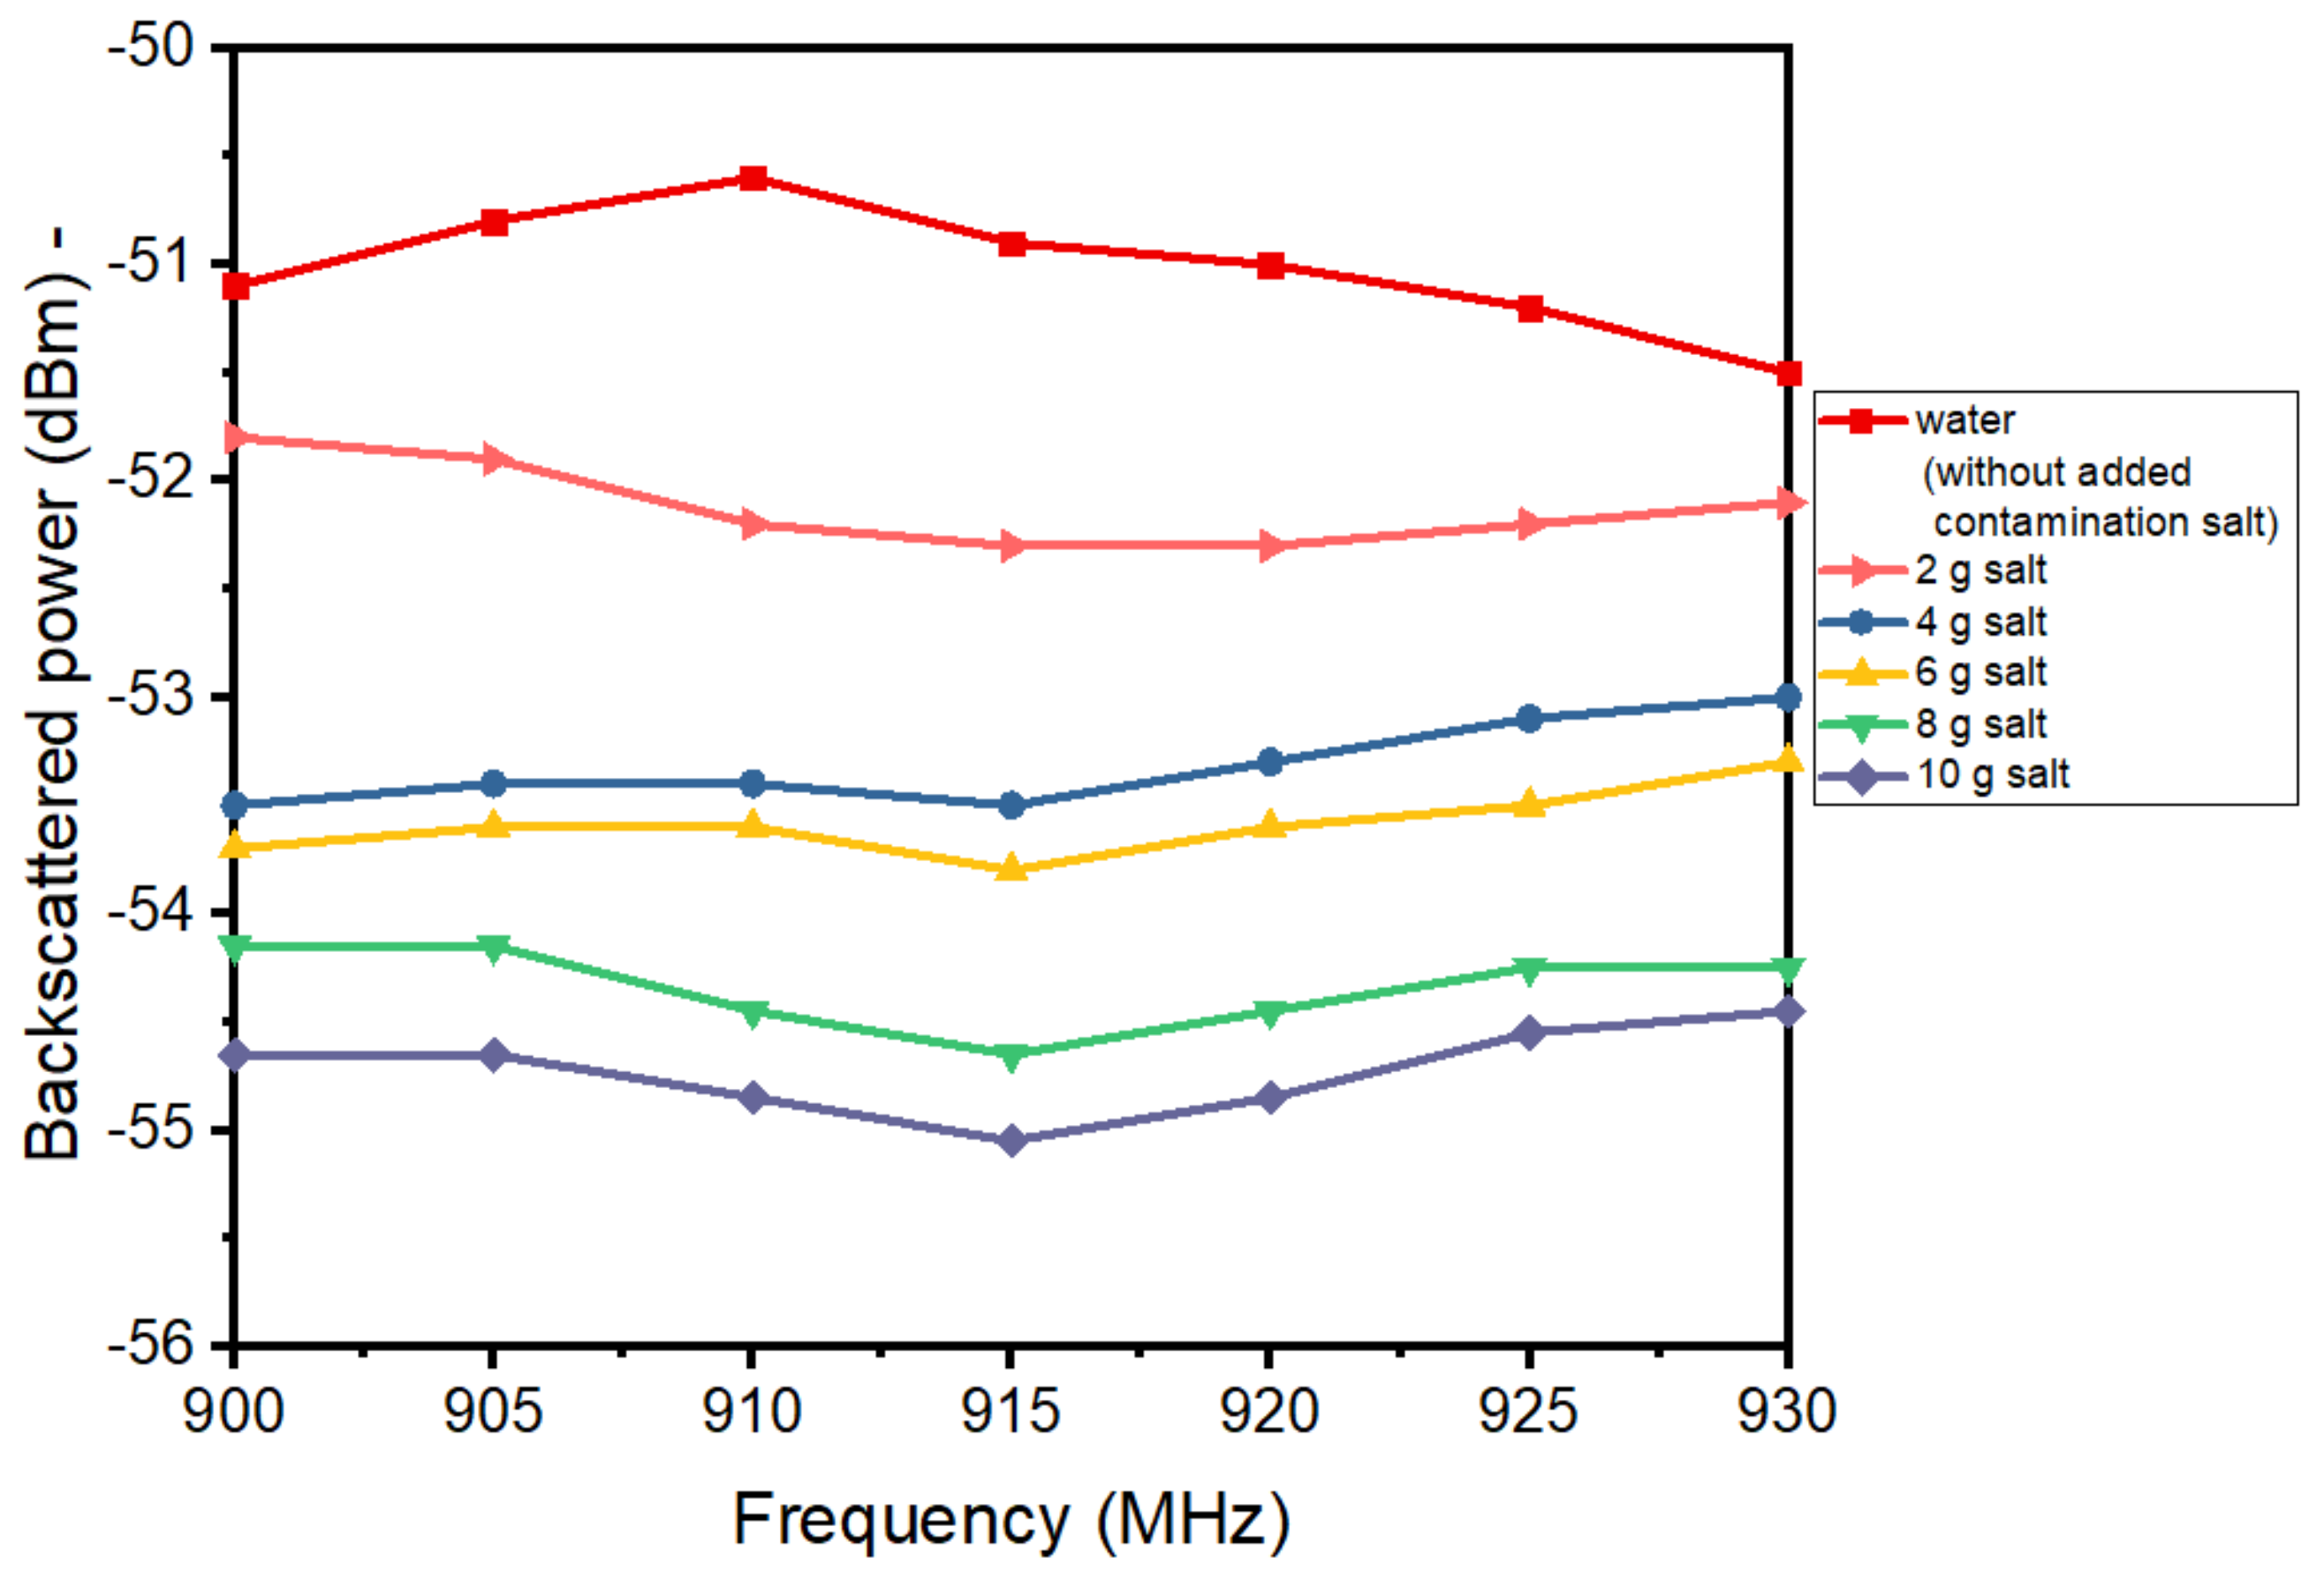
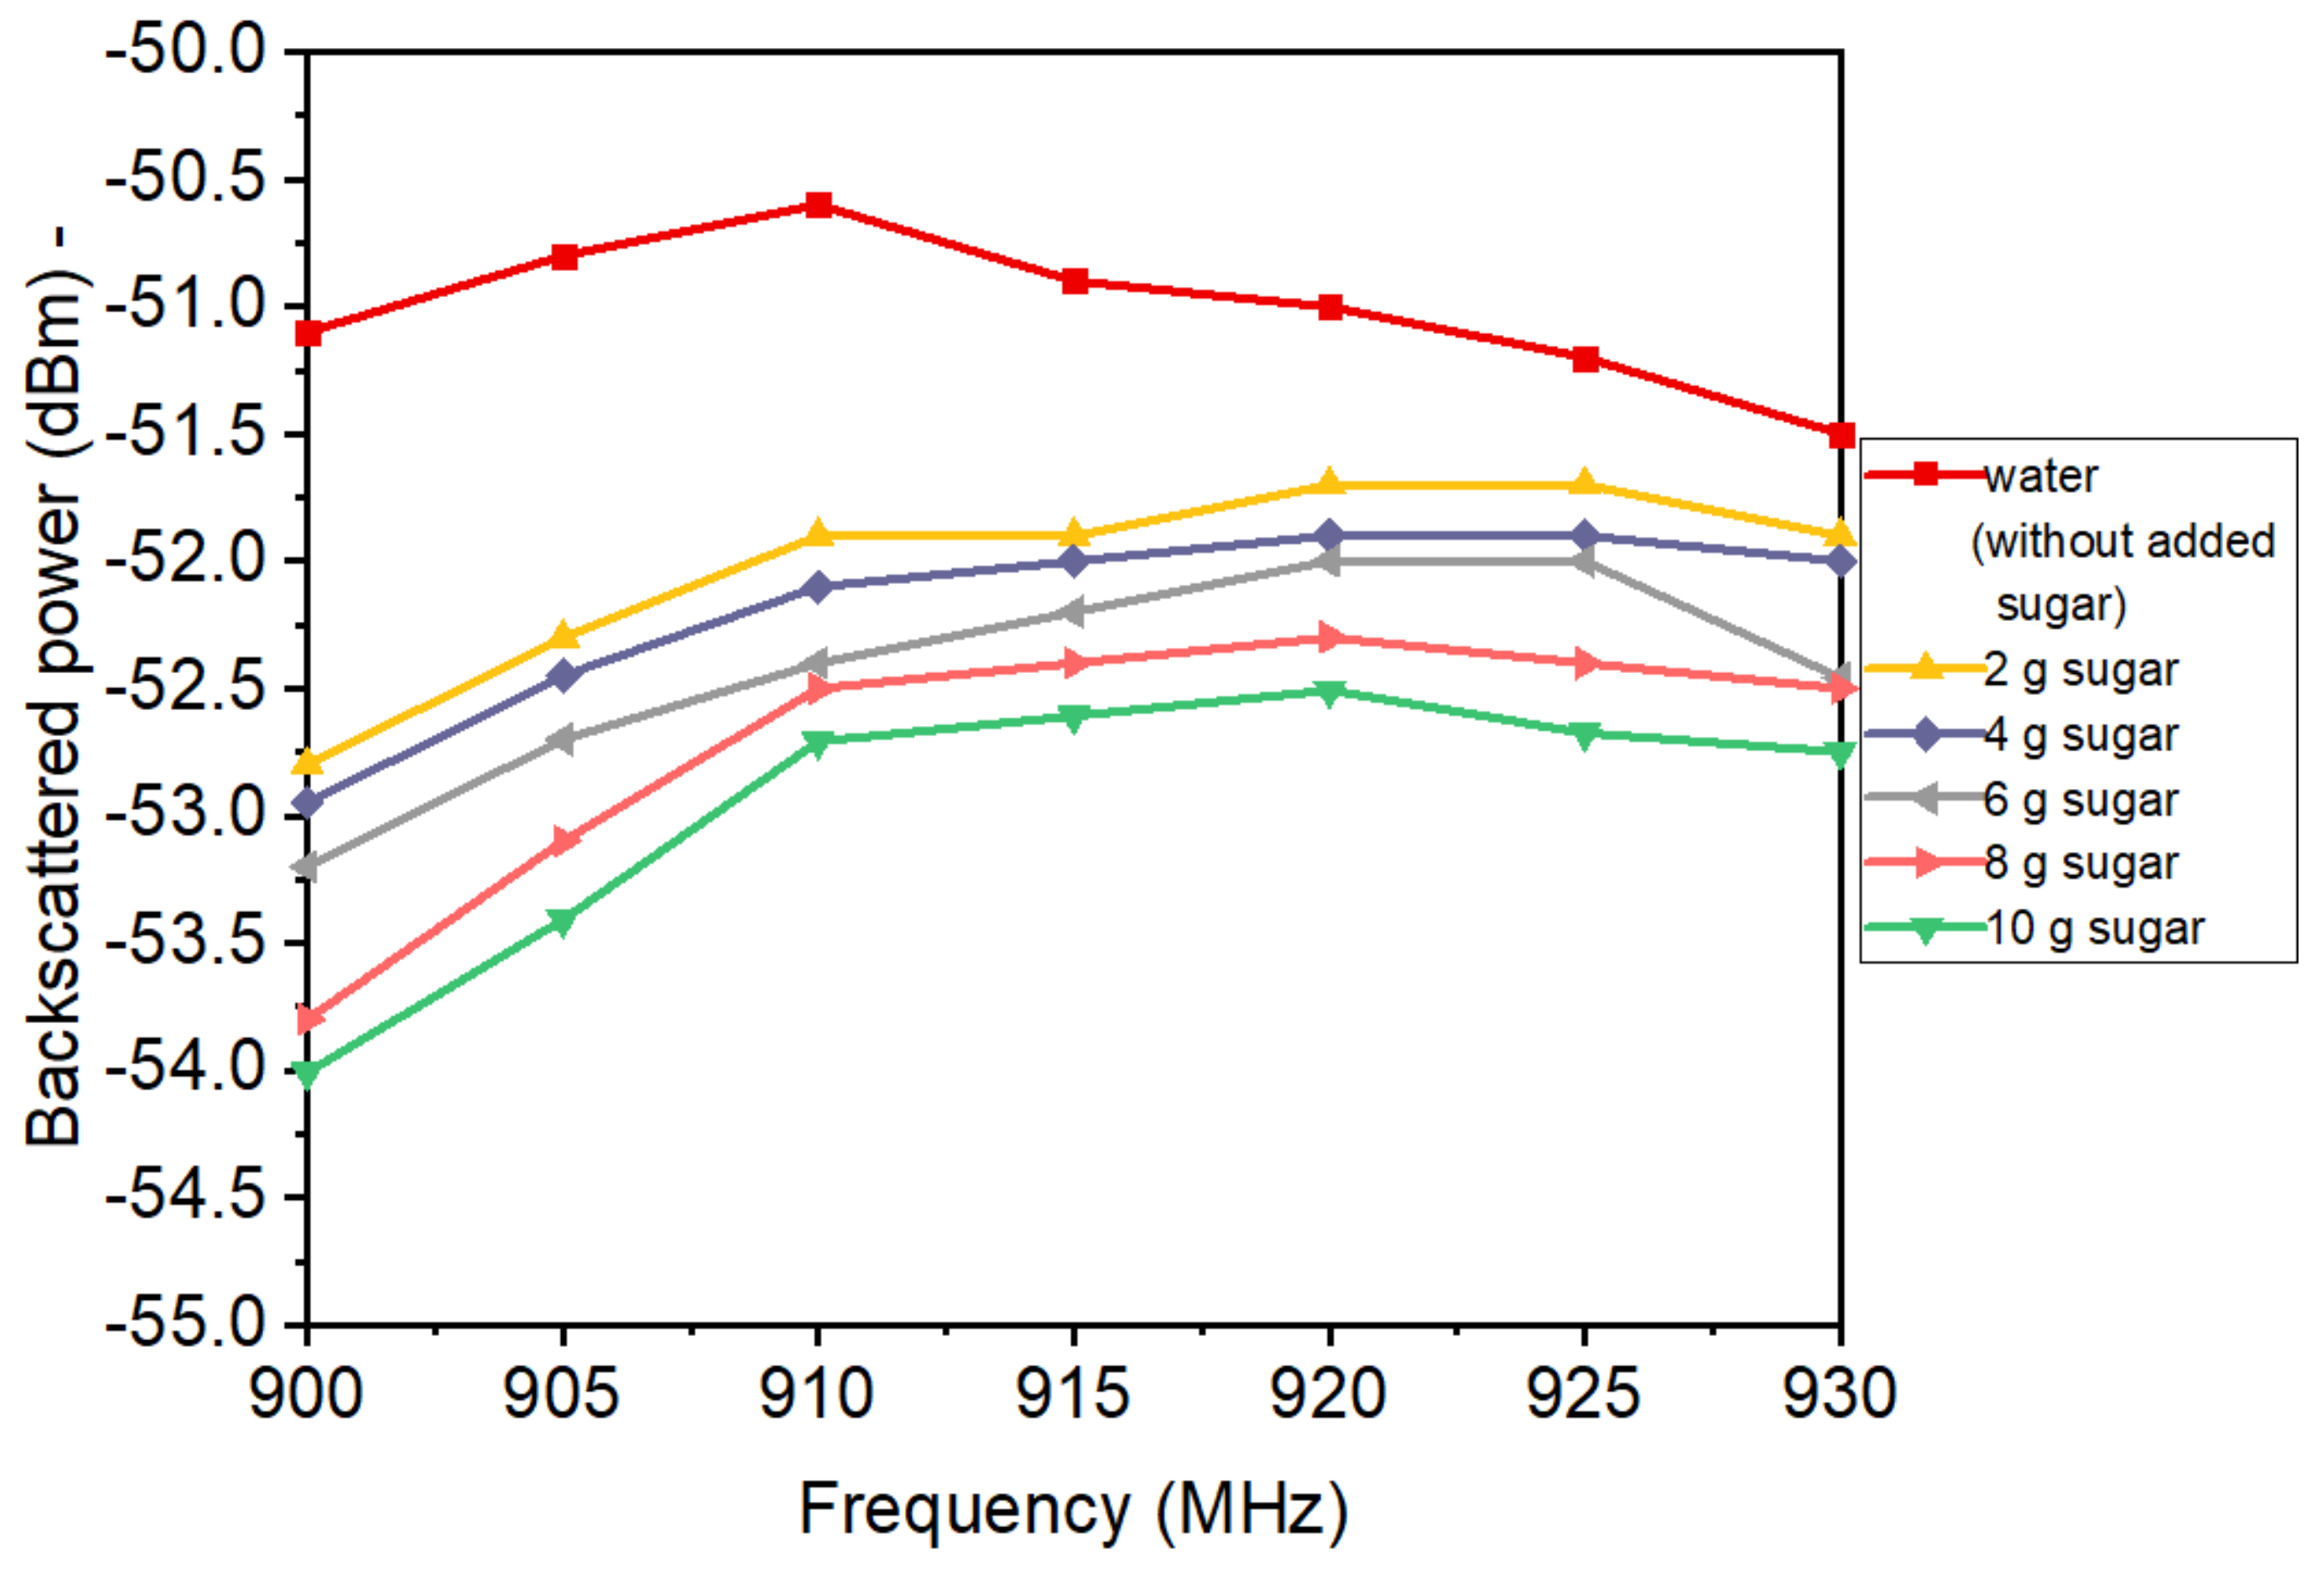
4. Results and Discussion

In experimental testing, the Tagformance Pro setup and 500 mL water-filled plastic bottle were used. This experiment can be done by any RFID reader, which has RSSI collecting features. Most handheld RFID readers from other manufacturers also have similar RSSI collecting features. However, for accuracy and benchmarking, the Tagformance setup was used for recording RSSI over a complete RFID band ranging from 860 MHz to 960 MHz. We solved different quantities of salt and sugar contents separately and prepared different samples with the same quantity of contaminant for robustness. The salt contents were mixed evenly in water and each sample was tagged using RFID tag antenna [20]. Figure 4 represents the corresponding RSSI values associated with different quantities of salt added as a contaminant as well as RSSI value associated with pure water. It can be observed, the RSSI value decreases as the quantity of salt increases. This is because increasing the salt content increases the conductivity of water. Hence, the corresponding RSSI value decreases as salt content increases. The value of RSSI at 915 MHz was taken into consideration for comparison proposes. The RSSI value associated with simple water is around −51 dBm. Moreover, the value of RSSI for 2, 4, 6, 8, and 10 g of salt contents were −52, −53.4, −53.7, −54.5, and −55 dBm, respectively.
Similarly, the corresponding RSSI values associated with different quantities of sugar added as a contaminant as well as RSSI values associated with pure water are illustrated in Figure 5. It can be observed, the RSSI value decreases as the number of sugar contents increases. This is because increasing the sugar contents produces a variation in the permittivity of water. Therefore, the corresponding RSSI value decreases as sugar content increases. The value of RSSI at 915 MHz was taken into consideration for comparison proposes. The RSSI value associated with simple water is around −51 dBm. Moreover, the value of RSSI for 2, 4, 6, 8, and 10 g of sugar were −52 dBm, −52.25 dBm, −52.7 dBm, −53 dBm, and −53.5 dBm, respectively. The change in RSSI value associated with salt contents is more obvious as compared with sugar contents.
This paper proposes a simple approach, which requires a small handheld RFID reader for measuring backscatter power from tagged food samples in terms of RSSI. The proposed technique uses sticker-like inkjet printed RFID tags for food contamination sensing. Moreover, this work includes the application of a machine learning algorithm on RFID sensors data for accuracy improvements. The received signal strength indicator (RSSI), as well as the phase of the backscattered signal from the RFID tag mounted on a food item, are measured using Tagformance Pro setup. The normal spring water was taken as a food sample. A known amount of salt and sugar quantity was deliberately added to water and mixed evenly. The food contamination/contents were sensed with an accuracy of 90%. To keep the setup commercially deployable, a handheld UHF RFID reader-based setup connected with smartphone having an android app was used for food contamination sensing as shown in Figure 6. The RFID reader has a size of 135 × 75 × 32 mm3 with 10,000 mAh battery that lasts after 16 working hours. The food sample was placed 30 cm apart using the foam spacer. The RFID reader was connected to a smartphone using Bluetooth low energy (BLE) [34,35], that has preinstalled app associated with this reader setup to show the tag’s Electronic Product Code (EPC) [36] value, as well as RSSI of the tag, mounted on the food item.
The RSSI data collected using Tagformance pro setup was exploited for machine learning algorithm in order to better food contamination section accuracy. The python program was used for the implementation of XGBoost algorithm [37]. The reason behind the use of XGBoost algorithm is its scalability feature, which enables it to use less memory by utilizing distributive computing and parallel data. XGBoost uses bagging and boosting technique. For any dataset having n instances and m attributes, the explanatory variables such as sensor RSSI data can be defined as si = (si1, si2, si3, …, sim). We can also define objective variable as ci, i = 1, 2, 3, …, n.
Now, the output of decision tree can be represented as c ^ i ( t ) , The error ε i ( 1 ) between objective function c ^ i ( t ) and first decision tree output can be represented as
ε i ( 1 ) = c ^ i ( 1 ) c i
The kth decision tree can be described as fk. So, the predicted value after K time boosting can be shown as:
c ^ i = k = 1 K f k ( s i )
The final target is to minimize the objective function L ( ϕ ) , which is based on loss function ( l ( c ^ i , c i ) ).
L ( ϕ ) = i = 1 I l ( c ^ i , c i ) + k = 1 K Ω ( f k )
where Ω ( f k ) = γ T + 1 2 λ w 2 is penalize function.
First of all, we prepared the samples by adding different amounts of salt concentrations. The first set was pure water without any addition of extra salt. The rest of the samples contain 2, 4, 6, 8, and 10 g salt. For data collection, we utilized 500 mL water bottles and 7 samples were used for each salt concentration to validate the robustness of the solution.
Therefore, 42 samples were used in total with salt contaminating detection. Figure 7a illustrates the results as confusion a matrix for detection of salt contamination. The different columns represent the predicted samples successfully recognized by the algorithm, while the rows represent the actual samples. It can be seen from Figure 7a, the proposed system can classify the different concentrations of salt contents with an average accuracy of 92% due to error in adjacent classes. Therefore, the proposed can be used to classify the contamination of salt contents. Similarly, we prepared the 42 samples by adding different concertation of sugar in water. The first class was pure water without adding additional sugar, while the rest of the samples contains 2, 4, 6, 8, and 10 g of sugar contamination. The result of sugar contamination detection is shown as a confusion matrix in Figure 7b. The rows and columns represent the actual and predicted sample, respectively. Therefore, the proposed system can also successfully classify different concentrations of sugar contaminants. However, the average accuracy of sugar detection is about 90% with more false detection in adjacent samples. So, the proposed system shows a potential towards the classification of the food contents as well as contamination detection.

5. Conclusions

This paper provides a simple approach that only requires a small handheld RFID reader for measuring backscatter power from tagged food samples in terms of RSSI. The proposed technique employs sticker-type inkjet printed RFID tags and a machine learning algorithm for food contamination sensing and accuracy improvements. The received signal strength indicator (RSSI), as well as the phase of the backscattered signal from the RFID tag mounted on the food item, are measured using the Tagformance Pro setup. The normal spring water was taken as a food sample. A known amount of salt and sugar quantity was deliberately added to water and mixed evenly. The food contamination/contents were sensed with an accuracy of 90%.
We used the machine learning XGBoost algorithm that was implemented in python for further training of the model and improving the accuracy of sensing, which is about 90%. Therefore, this research study paves a way for ubiquitous contamination sensing using RFID and machine learning technologies that can enlighten their users about the health concerns and safety of their food. Moreover, this research also provides sufficient information regarding food spoilage and saves a lot of food waste.

Author Contributions

Conceptualization, A.S. and Q.H.A.; methodology, A.S., Q.H.A., S.A., M.A.I. and K.A.; software, A.S., S.A. and M.Z.A.; validation, A.S., Q.H.A. and H.T.A.; formal analysis, J.K. and M.A.I.; writing—original draft preparation, A.S. and Q.H.A.; writing—review and editing, Q.H.A. and M.A.I.; supervision, M.A.I. and K.A.; project administration, M.A.I.; funding acquisition, M.A.I. All authors have read and agreed to the published version of the manuscript.

Funding

This work was supported in part by EPSRC IAA award is EP/R511705/1.

Institutional Review Board Statement

Not applicable.

Informed Consent Statement

Not applicable.

Conflicts of Interest

The authors declare no conflict of interest.

References

  1. Osifeko, M.O.; Hancke, G.P.; Abu-Mahfouz, A.M. Artificial intelligence techniques for cognitive sensing in future IoT: State-of-the-Art, potentials, and challenges. J. Sens. Actuator Netw. 2020, 9, 21. [Google Scholar] [CrossRef]
  2. Sharif, A.; Ouyang, J.; Yang, F.; Chattha, H.T.; Imran, M.A.; Alomainy, A.; Abbasi, Q.H. Low-cost inkjet-printed UHF RFID tag-based system for internet of things applications using characteristic modes. IEEE Internet Things J. 2019, 6, 3962–3975. [Google Scholar] [CrossRef] [Green Version]
  3. Lai, J.; Luo, C.; Wu, J.; Li, J.; Wang, J.; Chen, J.; Feng, G.; Song, H. TagSort: Accurate Relative Localization Exploring RFID Phase Spectrum Matching for Internet of Things. IEEE Internet Things J. 2020, 7, 389–399. [Google Scholar] [CrossRef]
  4. Singh, R.; Singh, E.; Nalwa, H.S. Inkjet printed nanomaterial based flexible radio frequency identification (RFID) tag sensors for the internet of nano things. RSC Adv. 2017, 7, 48597–48630. [Google Scholar] [CrossRef] [Green Version]
  5. Li, T.; Hong, Z.; Yu, L. Machine Learning-based Intrusion Detection for IoT Devices in Smart Home. In Proceedings of the 2020 IEEE 16th International Conference on Control & Automation (ICCA), Singapore, 9–11 October 2020; pp. 277–282. [Google Scholar] [CrossRef]
  6. Kouzayha, N.; Jaber, M.; Dawy, Z. Measurement-Based Signaling Management Strategies for Cellular IoT. IEEE Internet Things J. 2017, 4, 1434–1444. [Google Scholar] [CrossRef]
  7. Sharif, A.; Kumar, R.; Ouyang, J.; Abbas, H.T.; Alomainy, A.; Arshad, K.; Assaleh, K.; Althuwayb, A.; Imran, M.A.; Abbasi, Q.H. Making assembly line in supply chain robust and secure using UHF RFID. Sci. Rep. 2021, 11, 18041. [Google Scholar] [CrossRef] [PubMed]
  8. Amendola, G.M.S.; Caccami, M.C.; Caponi, A.; Catarinucci, L.; Cardellini, V.; Di Giampaolo, E.; Manzari, S.; Martinelli, F.; Milici, S.; Occhiuzzi, C. RFID & IoT: A Synergic Pair. IEEE RFID Virtual J. 2015, 1–21. Available online: http://ieeexplore.ieee.org/virtual-journals/rfid/issue/8 (accessed on 6 September 2021).
  9. Mafamane, R.; Mansour, A.A.; Ouadou, M.; Minaoui, K. FTSMAC: A Multi-Channel Hybrid Reader Collision Avoidance Protocol for RFID Network. J. Sens. Actuator Netw. 2021, 10, 46. [Google Scholar] [CrossRef]
  10. Khalil, G.; Doss, R.; Chowdhury, M. An Extended Reselling Protocol for Existing Anti-Counterfeiting Schemes. J. Sens. Actuator Netw. 2021, 10, 12. [Google Scholar] [CrossRef]
  11. Kapun, A.; Adrion, F.; Gallmann, E. Case Study on Recording Pigs’ Daily Activity Patterns with a UHF-RFID System. Agriculture 2020, 10, 542. [Google Scholar] [CrossRef]
  12. Khalil, G.; Doss, R.; Chowdhury, M. A New Secure RFID Anti-Counterfeiting and Anti-Theft Scheme for Merchandise. J. Sens. Actuator Netw. 2020, 9, 16. [Google Scholar] [CrossRef] [Green Version]
  13. Kayad, A.; Rainato, R.; Picco, L.; Sartori, L.; Marinello, F. Assessing Topsoil Movement in Rotary Harrowing Process by RFID (Radio-Frequency Identification) Technique. Agriculture 2019, 9, 184. [Google Scholar] [CrossRef] [Green Version]
  14. Khalil, G.; Doss, R.; Chowdhury, M. A Comparison Survey Study on RFID Based Anti-Counterfeiting Systems. J. Sens. Actuator Netw. 2019, 8, 37. [Google Scholar] [CrossRef] [Green Version]
  15. Colella, R.; Tarricone, L.; Catarinucci, L. SPARTACUS: Self-Powered Augmented RFID Tag for Autonomous Computing and Ubiquitous Sensing. IEEE Trans. Antennas Propag. 2015, 63, 2272–2281. [Google Scholar] [CrossRef]
  16. Occhiuzzi, C.; Caizzone, S.; Marrocco, G. Passive UHF RFID antennas for sensing applications: Principles, methods, and classifcations. IEEE Antennas Propag. Mag. 2013, 55, 14–34. [Google Scholar] [CrossRef] [Green Version]
  17. Manzari, S.; Occhiuzzi, C.; Nawale, S.; Catini, A.; Di Natale, C.; Marrocco, G. Humidity sensing by polymer-loaded UHF RFID antennas. IEEE Sens. J. 2012, 12, 2851–2858. [Google Scholar] [CrossRef] [Green Version]
  18. Makarovaite, V.; Hillier, A.J.R.; Holder, S.J.; Gourlay, C.W.; Batchelor, J.C. Passive Wireless UHF RFID Antenna Label for Sensing Dielectric Properties of Aqueous and Organic Liquids. IEEE Sens. J. 2019, 19, 4299–4307. [Google Scholar] [CrossRef] [Green Version]
  19. Perret, E.; Tedjini, S.; Nair, R.S. Design of antennas for UHF RFID tags. Proc. IEEE 2012, 100, 2330–2340. [Google Scholar] [CrossRef]
  20. Dobkin, D. The RF in RFID: Passive UHF RFID in Practice; Elsevier Inc.: Philadelphia, PA, USA, 2007. [Google Scholar]
  21. Sharif, A.; Ouyang, J.; Arshad, K.; Imran, M.A.; Abbasi, Q.H. Passive UHF RFID Tag Antennas-Based Sensing for Internet of Things Paradigm. In Backscattering and RF Sensing for Future Wireless Communication; Wiley: New York, NY, USA, 2021; pp. 133–155. [Google Scholar]
  22. Kamala, K.; Kumar, V.P. Food Products and Food Contamination. In Microbial Contamination and Food Degradation; Academic Press: New York, NY, USA, 2018; pp. 1–19. [Google Scholar] [CrossRef]
  23. Hassanzadeh, M.K.; Najaran, Z.T.; Nasery, M.; Emami, S.A. Summer Savory (Satureja hortensis L.) Oils. In Essential Oils in Food Preservation, Flavor and Safety; Academic Press: New York, NY, USA, 2016; pp. 757–764. [Google Scholar] [CrossRef]
  24. Food Safety. Available online: https://www.who.int/news-room/fact-sheets/detail/food-safety (accessed on 13 August 2021).
  25. Nguyen, D.S.; Phan, G.T.; Pham, T.T.; Le, N.N.; Dang, M.C.; Tedjni, S. A battery free RFID sensor for quality detection of food products. In Proceedings of the Progress In Electromagnetics Research Symposium Proceedings, Stockholm, Sweden, 2–15 August 2013; pp. 583–587. [Google Scholar]
  26. Tao, X.; Shaik, T.B.; Higgins, N.; Gururajan, R.; Zhou, X. Remote patient monitoring using radio frequency identification (Rfid) technology and machine learning for early detection of suicidal behaviour in mental health facilities. Sensors 2021, 21, 776. [Google Scholar] [CrossRef] [PubMed]
  27. Li, H.; Wan, C.Y.; Shah, R.C.; Sample, A.P.; Patel, S.N. IDAct: Towards unobtrusive recognition of user presence and daily activities. Phoenix, AZ, USA, 2–4 April 2019. [Google Scholar] [CrossRef]
  28. Oguntala, G.A.; Abd-Alhameed, R.A.; Ali, N.T.; Hu, Y.F.; Noras, J.M.; Eya, N.N.; Elfergani, I.; Rodriguez, J. SmartWall: Novel RFID-Enabled Ambient Human Activity Recognition Using Machine Learning for Unobtrusive Health Monitoring. IEEE Access 2019, 7, 68022–68033. [Google Scholar] [CrossRef]
  29. Ha, U.; Ma, Y.; Zhong, Z.; Hsu, T.M.; Adib, F. Learning food quality and safety from wireless stickers. In Proceedings of the 17th ACM Workshop on Hot Topics in Networks, Redmond, WA, USA, 15–16 November 2018; pp. 106–112. [Google Scholar] [CrossRef]
  30. Sharif, A.; Ouyang, J.; Raza, A.; Imran, M.A.; Abbasi, Q.H. Inkjet-printed UHF RFID tag based system for salinity and sugar detection. Microw. Opt. Technol. Lett. 2019, 61, 2161–2168. [Google Scholar] [CrossRef]
  31. Nikitin, P.; Rao, K.V. Theory and measurement of backscattering from RFID tags. IEEE Antennas Propag. Mag. 2006, 48, 212–218. [Google Scholar] [CrossRef]
  32. Tagformance Pro|Voyantic. Available online: https://voyantic.com/products/tagformance-pro (accessed on 17 August 2021).
  33. Sohrab, A.P.; Huang, Y.; Hussein, M.N.; Carter, P. A Hybrid UHF RFID Tag Robust to Host Material. IEEE J. Radio Freq. Identif. 2017, 1, 163–169. [Google Scholar] [CrossRef]
  34. Bluetooth Vs. Bluetooth Low Energy (LE): What’s the Difference? Available online: https://www.link-labs.com/blog/bluetooth-vs-bluetooth-low-energy (accessed on 11 October 2021).
  35. GS1. EPC/RFID|GS1. 2015. Available online: https://www.gs1.org/standards/epc-rfid (accessed on 11 October 2021).
  36. Intro to Bluetooth Low Energy|Bluetooth® Technology Website. Available online: https://www.bluetooth.com/bluetooth-resources/intro-to-bluetooth-low-energy/ (accessed on 11 October 2021).
  37. XGBoost Python Package—Xgboost 1.5.0-dev Documentation. Available online: https://xgboost.readthedocs.io/en/latest/python/index.html (accessed on 17 August 2021).
Figure 1. Proposed system for food contamination sensing using RFID and machine learning.
Jsan 10 00063 g001
Figure 2. Methodology for food contamination sensing using UHF RFID technology.
Jsan 10 00063 g002
Figure 3. Tagformance Pro based setup for food contamination sensing.
Jsan 10 00063 g003
Figure 4. Measured RSSI using Tagformance setup with different quantities of salt as a contaminant.
Jsan 10 00063 g004
Figure 5. Measured RSSI using Tagformance setup with different quantities of sugar as a contaminant.
Jsan 10 00063 g005
Figure 6. Handheld reader based setup connected with smart phone for food contamination sensing.
Jsan 10 00063 g006
Figure 7. Confusion matrix for detection of food contamination detection (different columns represent the predicted samples while the rows represent the actual samples). (a) Salt as contaminant; (b) sugar as contaminant.
Jsan 10 00063 g007
Publisher’s Note: MDPI stays neutral with regard to jurisdictional claims in published maps and institutional affiliations.

