Article

Variable Light Condition Improves Root Distribution Shallowness and P Uptake of Soybean in Maize/Soybean Relay Strip Intercropping System

1
College of Agronomy, Sichuan Agricultural University, Chengdu 611130, Sichuan, China
2
College of pharmacy, Chengdu University of Traditional Chinese Medicine, Chengdu 611137, Sichuan, China
3
Institute of Sorghum Potato, Yibin Academy of Agricultural Sciences, Yibin 644000, Sichuan, China
4
Agricultural and Rural Bureau of Sishui County, Jining 273200, Shandong, China
*
Authors to whom correspondence should be addressed.
These authors contributed equally to this work.
Plants 2020, 9(9), 1204; https://doi.org/10.3390/plants9091204
Submission received: 15 August 2020 / Revised: 5 September 2020 / Accepted: 11 September 2020 / Published: 15 September 2020

Abstract

:
In this study, soybean root distribution in an inter-cropping system was influenced by various environmental and biotic cues. However, it is still unknown how root development and distribution in inter-cropping responds to aboveground light conditions. Herein, soybeans were inter- and monocropped with P (phosphorus) treatments of 0 and 20 kg P ha yr−1 (P0 and P20, respectively) in field experiment over 4 years. In 2019, a pot experiment was conducted as the supplement to the field experiment. Shade from sowing to V5 (Five trifoliolates unroll) and light (SL) was used to imitate the light condition of soybeans in a relay trip inter-cropping system, while light then shade from V5 to maturity (LS) was used to imitate the light condition of soybeans when monocropped. Compared to monocropping, P uptake and root distribution in the upper 0–15 cm soil layer increased when inter-cropped. Inter-cropped soybeans suffered serious shade by maize during a common-growth period, which resulted in the inhibition of primary root growth and a modified auxin synthesis center and response. During the solo-existing period, plant photosynthetic capacity and sucrose accumulation increased under ameliorated light in SL (shade-light). Increased light during the reproductive stage significantly decreased leaf P concentration in SL under both P-sufficient and P-deficient conditions. Transcripts of a P starvation response gene (GmPHR25) in leaves and genes (GmEXPB2) involved in root growth were upregulated by ameliorated light during the reproductive stage. Furthermore, during the reproductive stage, more light interception increased the auxin concentration and expression of GmYUCCA14 (encoding the auxin synthesis) and GmTIR1C (auxin receptor) in roots. Across the field and pot experiments, increased lateral root growth and shallower root distribution were associated with inhibited primary root growth during the seedling stage and ameliorated light conditions in the reproductive stage. Consequently, this improved topsoil foraging and P uptake of inter-cropped soybeans. It is suggested that the various light conditions (shade-light) mediating leaf P status and sucrose transport can regulate auxin synthesis and respond to root formation and distribution.

Graphical Abstract

1. Introduction

Phosphorus (P) is a critical element for plant growth and development, but its availability in soil is often limited [1,2]. In order to improve soil fertility and obtain a high crop yield, a large amount of P fertilizer has been put into farmland ecosystems. However, the excessive application of P fertilizer not only causes a waste of resources but destroys ecological environments through surface water runoff and eutrophication. In addition, P is a non-renewable mineral resource and studies have shown that half of known reserves will be consumed from 2040 to 2060 [3]. It is therefore important to enhance the use of accumulated P in soil by exploiting the biological potential of plants in cropping systems [4].
Inter-cropping is a farming practice that involves two or more crop species growing together or coexisting for a time. It is widely practiced worldwide and provides opportunities for the sustainable intensification of agriculture, as it offers a greater yield per unit land and a more efficient use of fertilizer than monocropping [5,6,7,8,9]. Inter-cropping is an internationally recognized efficient cropping system in terms of fertilizer resource utilization. Cereal/legume mixtures can explore various P resources and achieve higher P uptake than monocropping [10,11]. It is generally believed that the P uptake advantage of inter-cropping mainly comes from the following aspects: (1) under low P stress, legume root can release protons/hydroxyls, carboxylates, and enzymes to activate insoluble P in soil, and the P which is mobilized via legumes may be made available for cereal [12,13]. (2) Due to contrasting root architecture, spatial complementarity between cereals and legumes leads to the exploitation of P pools in different soil horizons [14]. (3) Indirect interspecific P facilitation in the rhizosphere can occur as a consequence of shifts in microbial biomass, community structure, and activity that contributes to increased P uptake [15,16]. (4) Compensation effects enable late-growing crops to obtain more resources after harvesting former crops (including the residual underground nutrients of the former crop and the better light environment), which is beneficial to nutrients uptake [17,18]. Researches on the advantages of nutrient absorption in inter-cropping mainly focused on interspecific interaction, while less attention paid to understand how light aboveground influences root growth, and subsequently P uptake [19,20,21,22]. Our previous study found that the nutrient acquisition and yield advantages of inter-cropped soybeans were mainly regulated by the aboveground light condition rather than interspecific root interactions in maize-soybean relay strip inter-cropping systems, especially in the area with low radiation [18,23].
It has been reported that root development and morphology are directly or indirectly regulated by aboveground light, such as primary root elongation, lateral root formation, nutrient absorption, etc. [24,25,26]. The light signal is mainly transmitted to the root in one of the following three ways: (i) transfer of mobile signaling messengers, (ii) roots that sense light directly, and (iii) light channeling through the stem [27]. Among these, the sucrose export from the shoot is a critical signal linking shoot light capture and root growth [28,29]. Moreover, it has been observed that sucrose plays an important role in the systemic control of plant P starvation responses [30]. In addition, the phytohormone auxin is an iconic long-distance signaling molecule that influences root development via polar transport [31]. Lateral root growth makes a considerable contribution to the spatial configuration of the root system in the soil and, subsequently, determines the ability of a plant to absorb nutrients in soil, such as P. Auxin. Its local accumulation in root pericycle cells are a necessary signal to prespecify these cells into lateral root founder cells [32]. Previous studies have proven that an increase in auxin levels and signaling is always accompanied by lateral root emergence, which increases the sufficient acquisition of lateral root founder cell identity [32].
Light can affect auxin at several level, i.e., its synthesis, transport, and signaling. Young tissues are the main source of auxin and are subsequently transported to the root, where it regulates root development, such as lateral root formation, that implicates auxin as a crucial integrator of light signal and root growth [33,34]. The transport of light-induced auxin from shoot to root is related to the E3 ubiquitin ligase (COP1), which acts as the main inhibitor of photomorphogenesis through the degradation of target proteins related to photoreaction [35]. In the dark, COP1 can mediate the transcriptional inhibition of PIN in the shoot by targeting the light morphology-inducing molecule HY5. However, the function of COP1 is inhibited under light, which can promote the transport of auxin to the root [36,37]. In the dark, the PIN1 and PIN2 proteins are located in the vacuoles of root cells, which could not perform a transport function, thus inhibiting the growth of taproot elongation. Under the light condition, PIN protein is located on the plasma membrane of root cells and performs a auxin transport function [38].
In the maize-soybean relay strip inter-cropping system, soybean experiences two very different periods: the common-growth and solo-existing periods. The growth of soybean during inter-cropping is inhibited by shade caused by maize during the common-growth period, but the inter-cropped soybean transfers to the full sunlight after the harvest of maize, and the ameliorated light condition substantially contributes in promoting soybean growth [6,18,39,40,41,42]. The ameliorated light condition during soybean’s reproductive stage of in inter-cropping increases the total root length and surface, which is associated with lower P concentrations in leaves and greater sucrose allocation [18]. However, root growth stimulation by increased light capture might not be controlled solely by increased sucrose allocation to roots. Instead, other systemic signals can be involved in this regulation process. For instance, auxin plays a major role in plant root formation [31,33,43,44]. Moreover, to date, it is not clear how the light-mediated auxin pathway regulates the growth and distribution in the soil of soybean roots, especially under variable light conditions.
In the present study, we conducted a long-term field experiment with a maize-soybean relay strip in an inter-cropped system, as well as a pot experiment to simulate the light environment of soybean, to investigate how the variable light condition of inter-cropped soybeans involved in regulating root growth and distribution in soil profiles, and the capacity of P uptake. We specifically examined whether the variable light condition and the auxin pathway were associated with the shallow distributed root of inter-cropped soybeans. Our hypothesis was that the formation of shallower distributed root systems might occur via a variable light condition, which (i) results in increased root auxin concentration or (ii) mediated shoot P status to regulate auxin response. This eventually shaped the P-efficient root architecture. Therefore, the aboveground light affected plant development and was taken as the entry point of this work. We studied soybeans in the relay strip inter-cropped system to investigate how the light condition mediates shoot P status and auxin pathway root growth and distribution in soil. Ultimately, it was revealed that, from the aspect of above-underground interactions, the mechanisms of nutrients efficiently uptake in the inter-cropping system.

2. Results

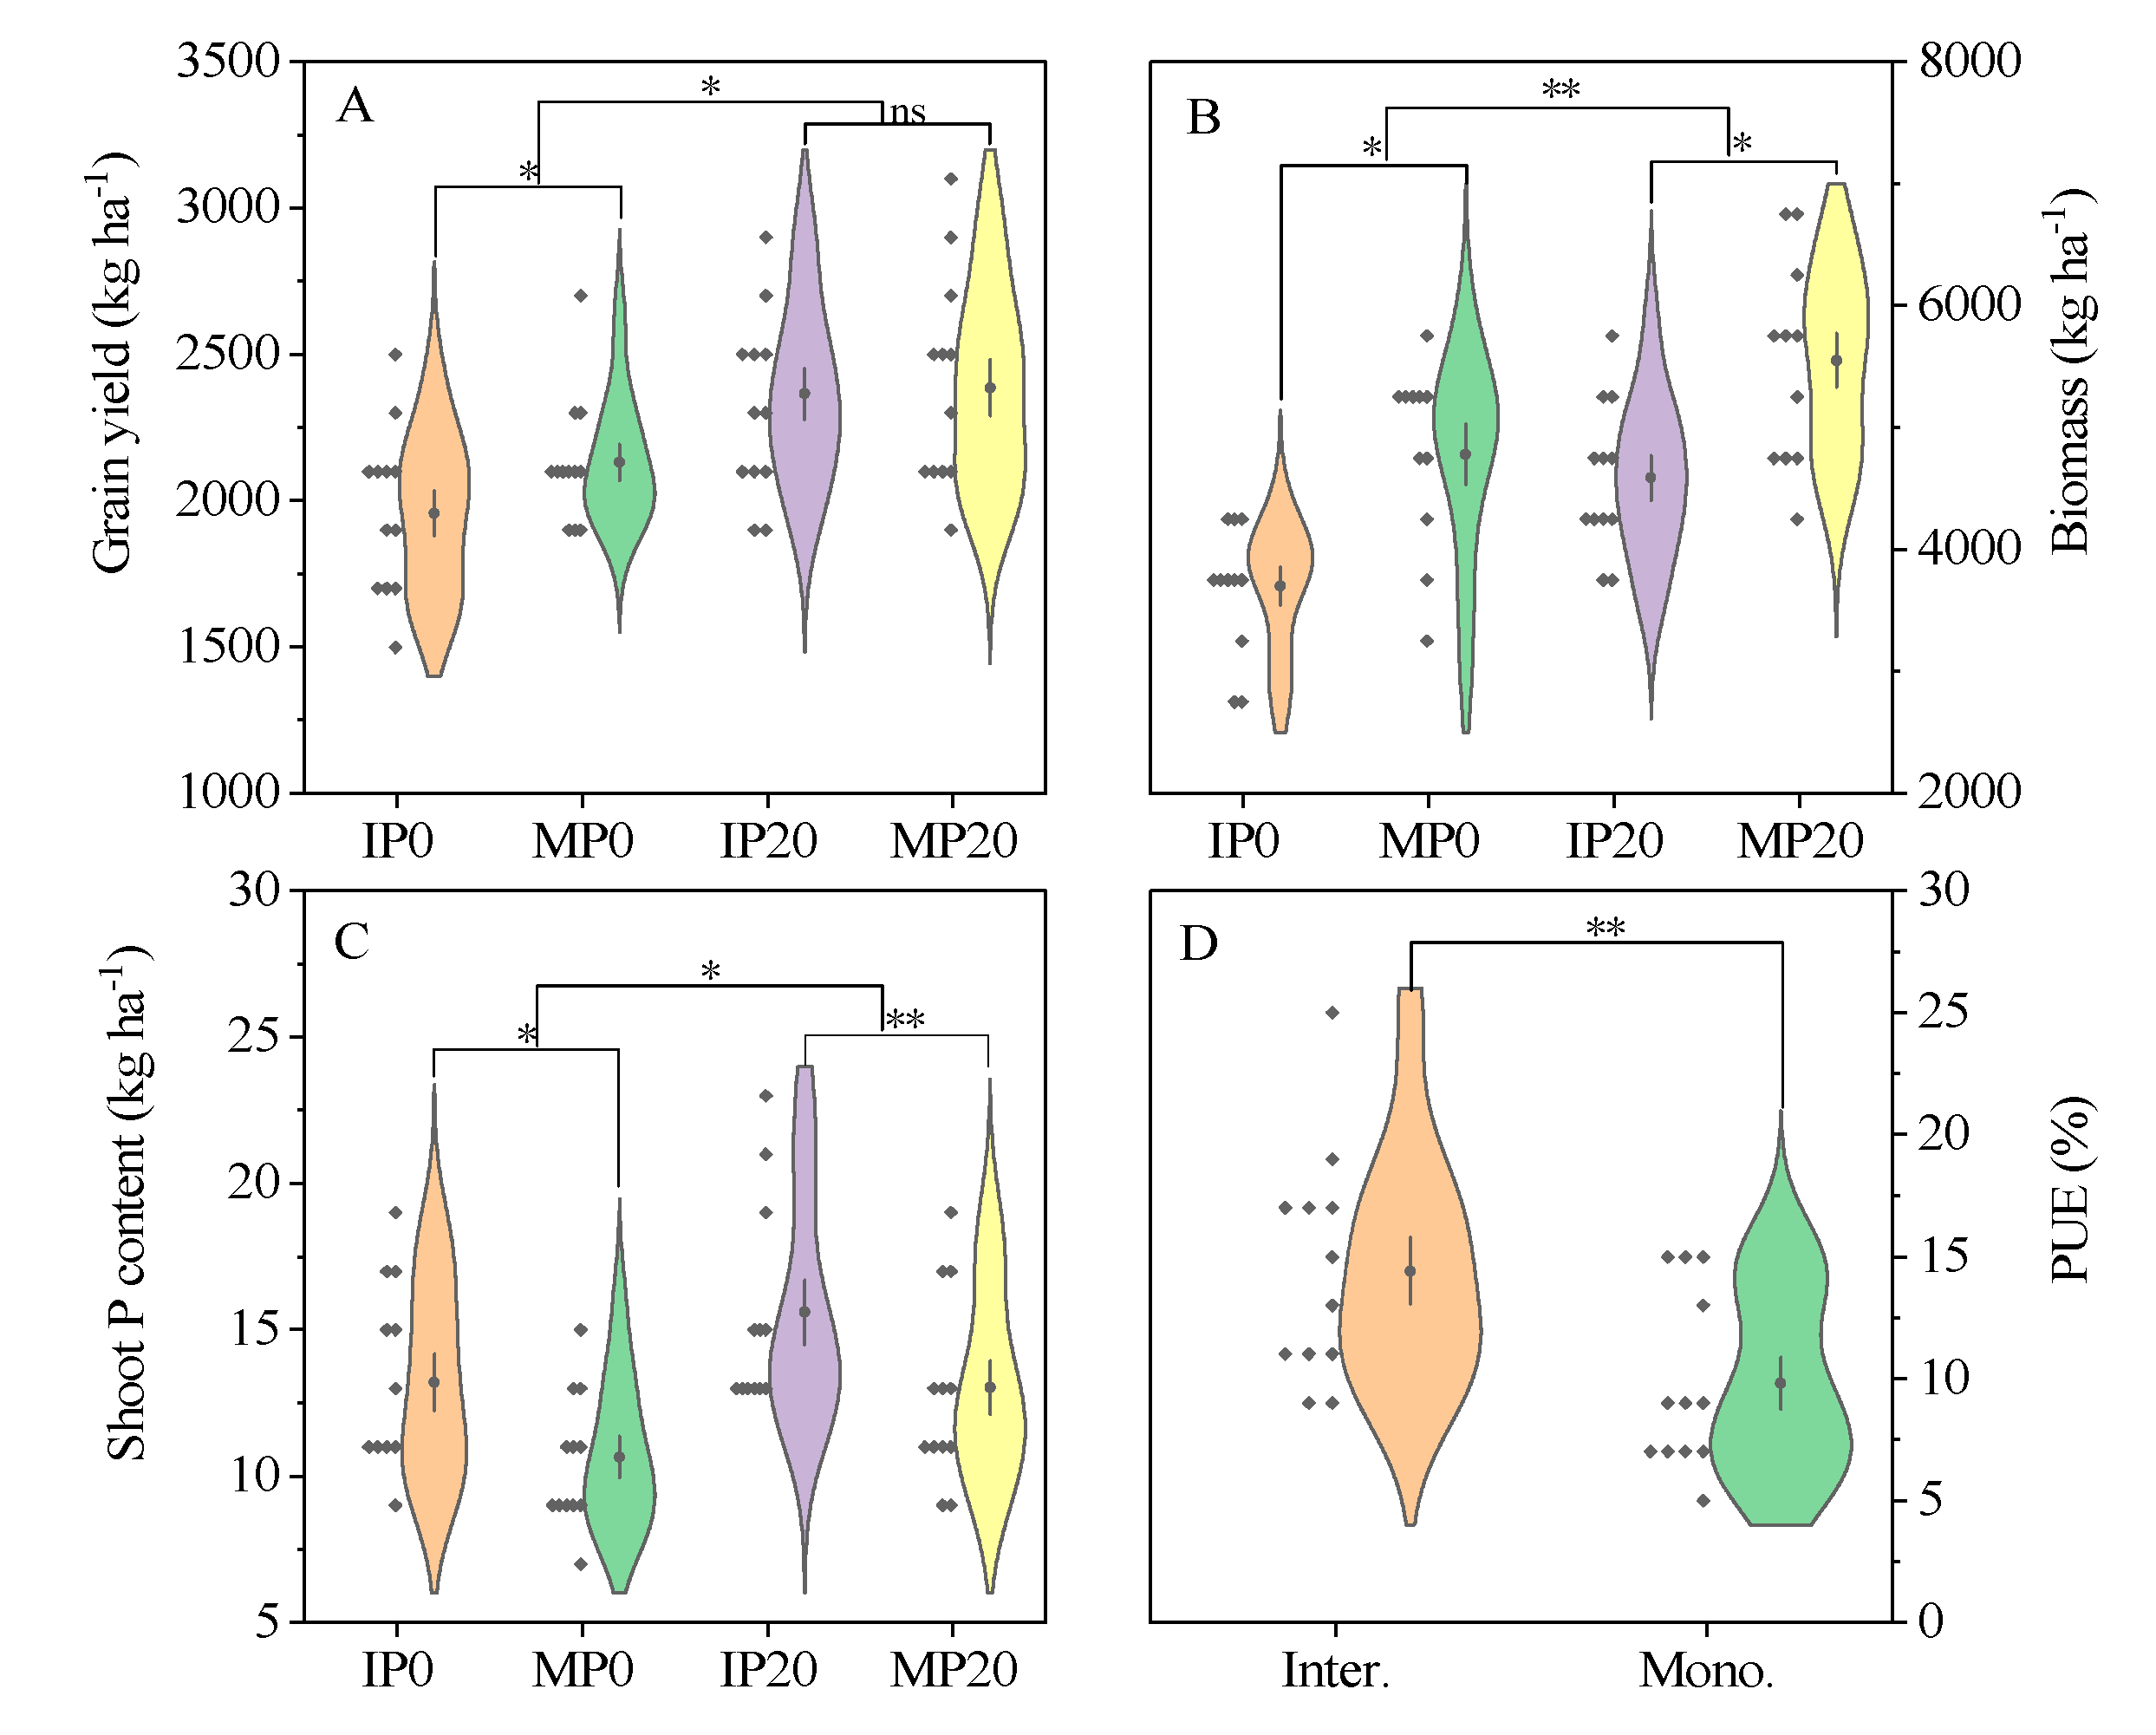
2.1. Yield and P Uptake Capability

The results of a 4-year orientation experiment showed that soybean grain yield of conventional P supply treatment (P20) was significantly (p ≤ 0.05) higher than that of zero-P supply treatment (P0), irrespective of cropping system (Figure 1A). In the P0 treatment, the grain yield in monocropping was significantly (p ≤ 0.05) higher than inter-cropping, while no significant (p > 0.05) difference was observed between them in the P20 treatment across all 4 years (Figure 1A).
Regardless of cropping system, P fertilizer significantly (p ≤ 0.01) increased the shoot dry weight (Figure 1B). The biomass accumulation in monocropping was significantly (p ≤ 0.05) higher than inter-cropping (Figure 1B). Nevertheless, the shoot growth rate of inter-cropped soybeans was greater than monocropped soybeans from V5 to R3 stages. The gap between them was decreased in the reproduction stages (Table S1). We did not observe any significant (p > 0.05) soybean growth rate when P fertilizer was applied.
Compared with zero-P application, conventional P application significantly (p ≤ 0.05) increased P accumulation irrespective of the cropping system (Figure 1C). The shoot P uptake and apparent P fertilizer efficiency (PUE) of inter-cropped soybeans was significantly (p ≤ 0.01) higher than monocropped soybeans (Figure 1C,D). From 2016 to 2019, the average PUE of the inter-cropping system was 14.3%, which was 58.9% higher than monocropping (Figure 1D).

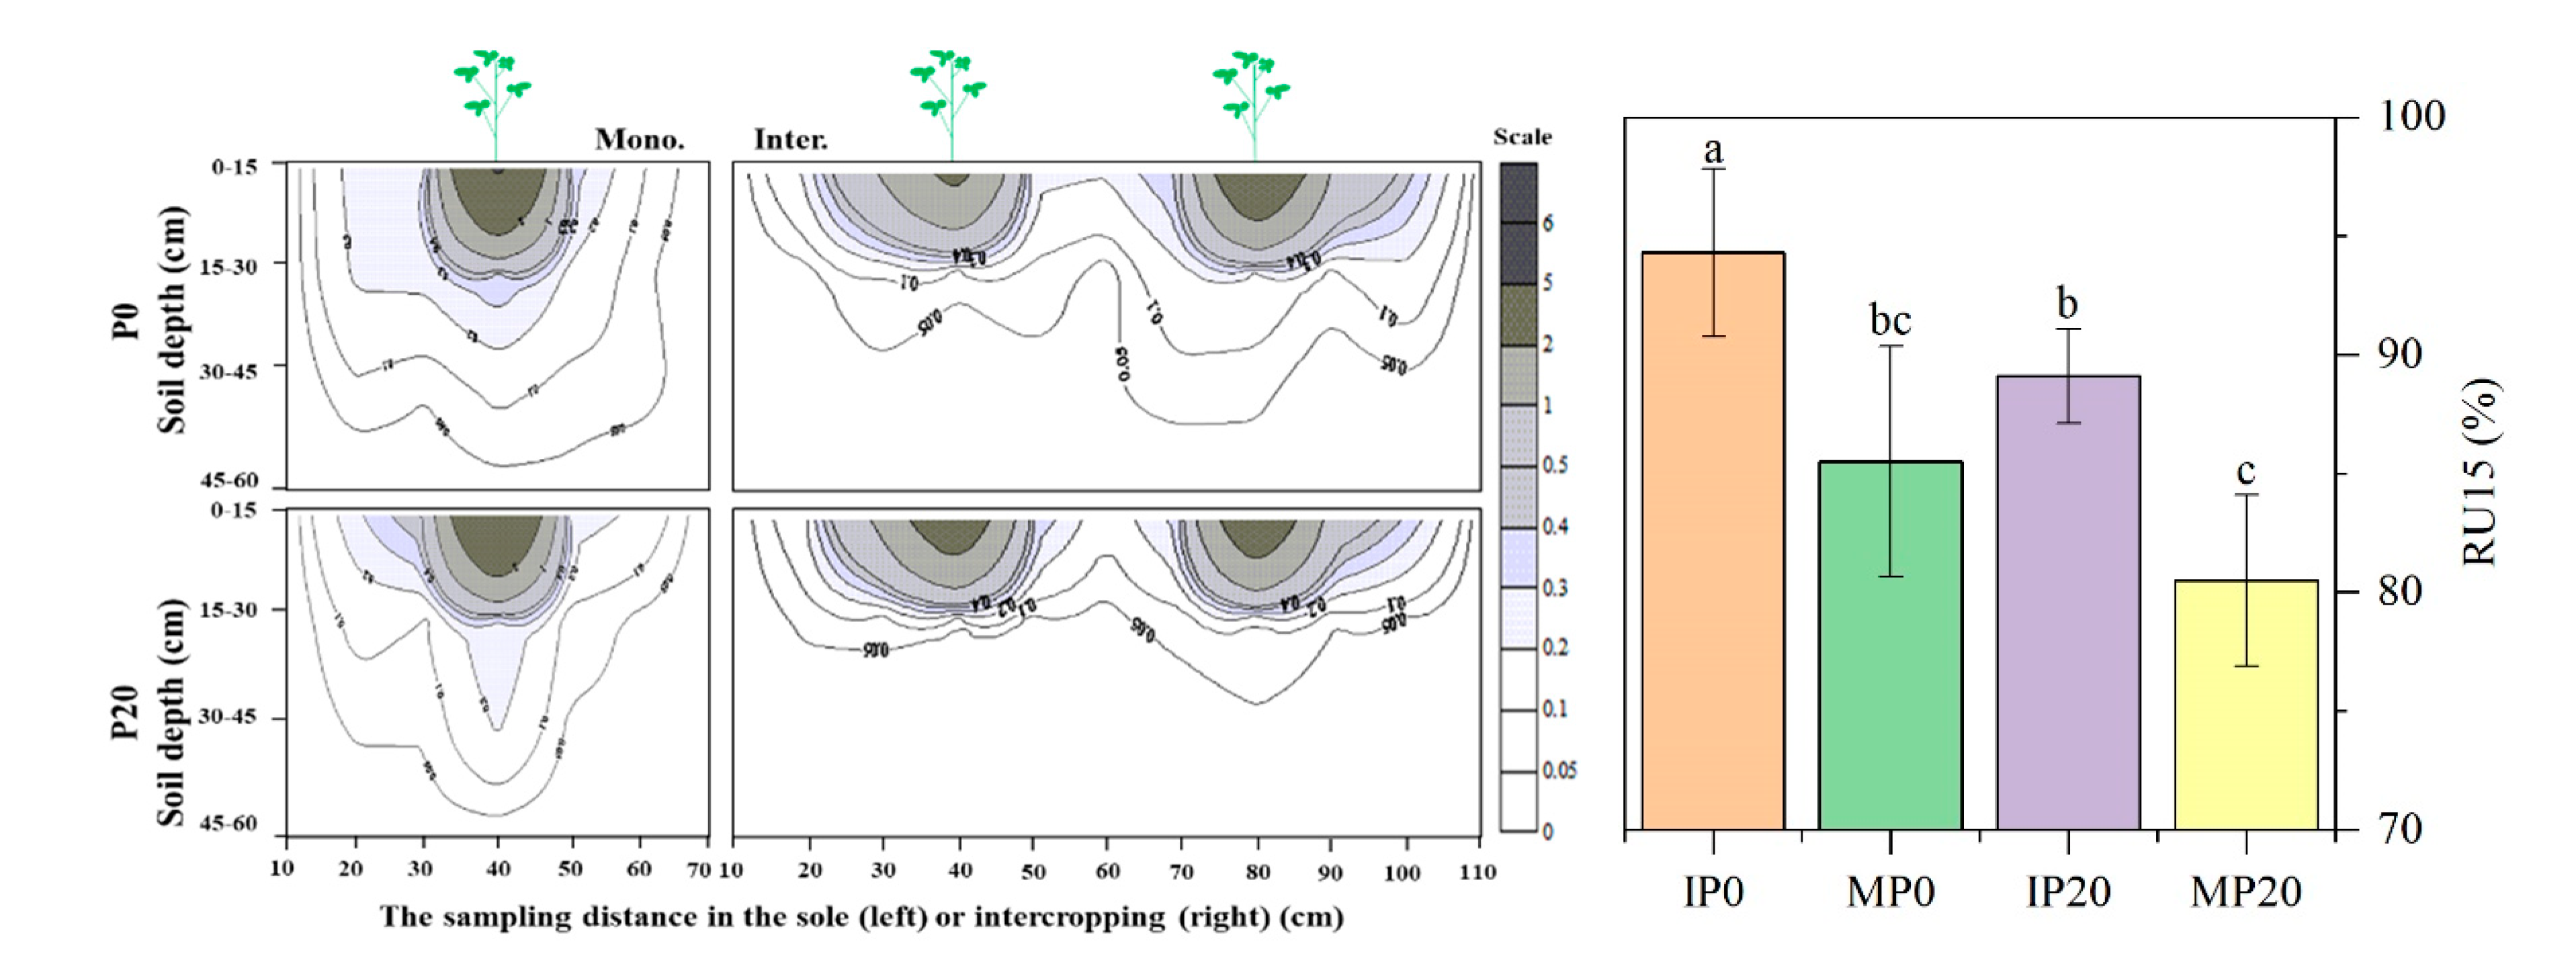
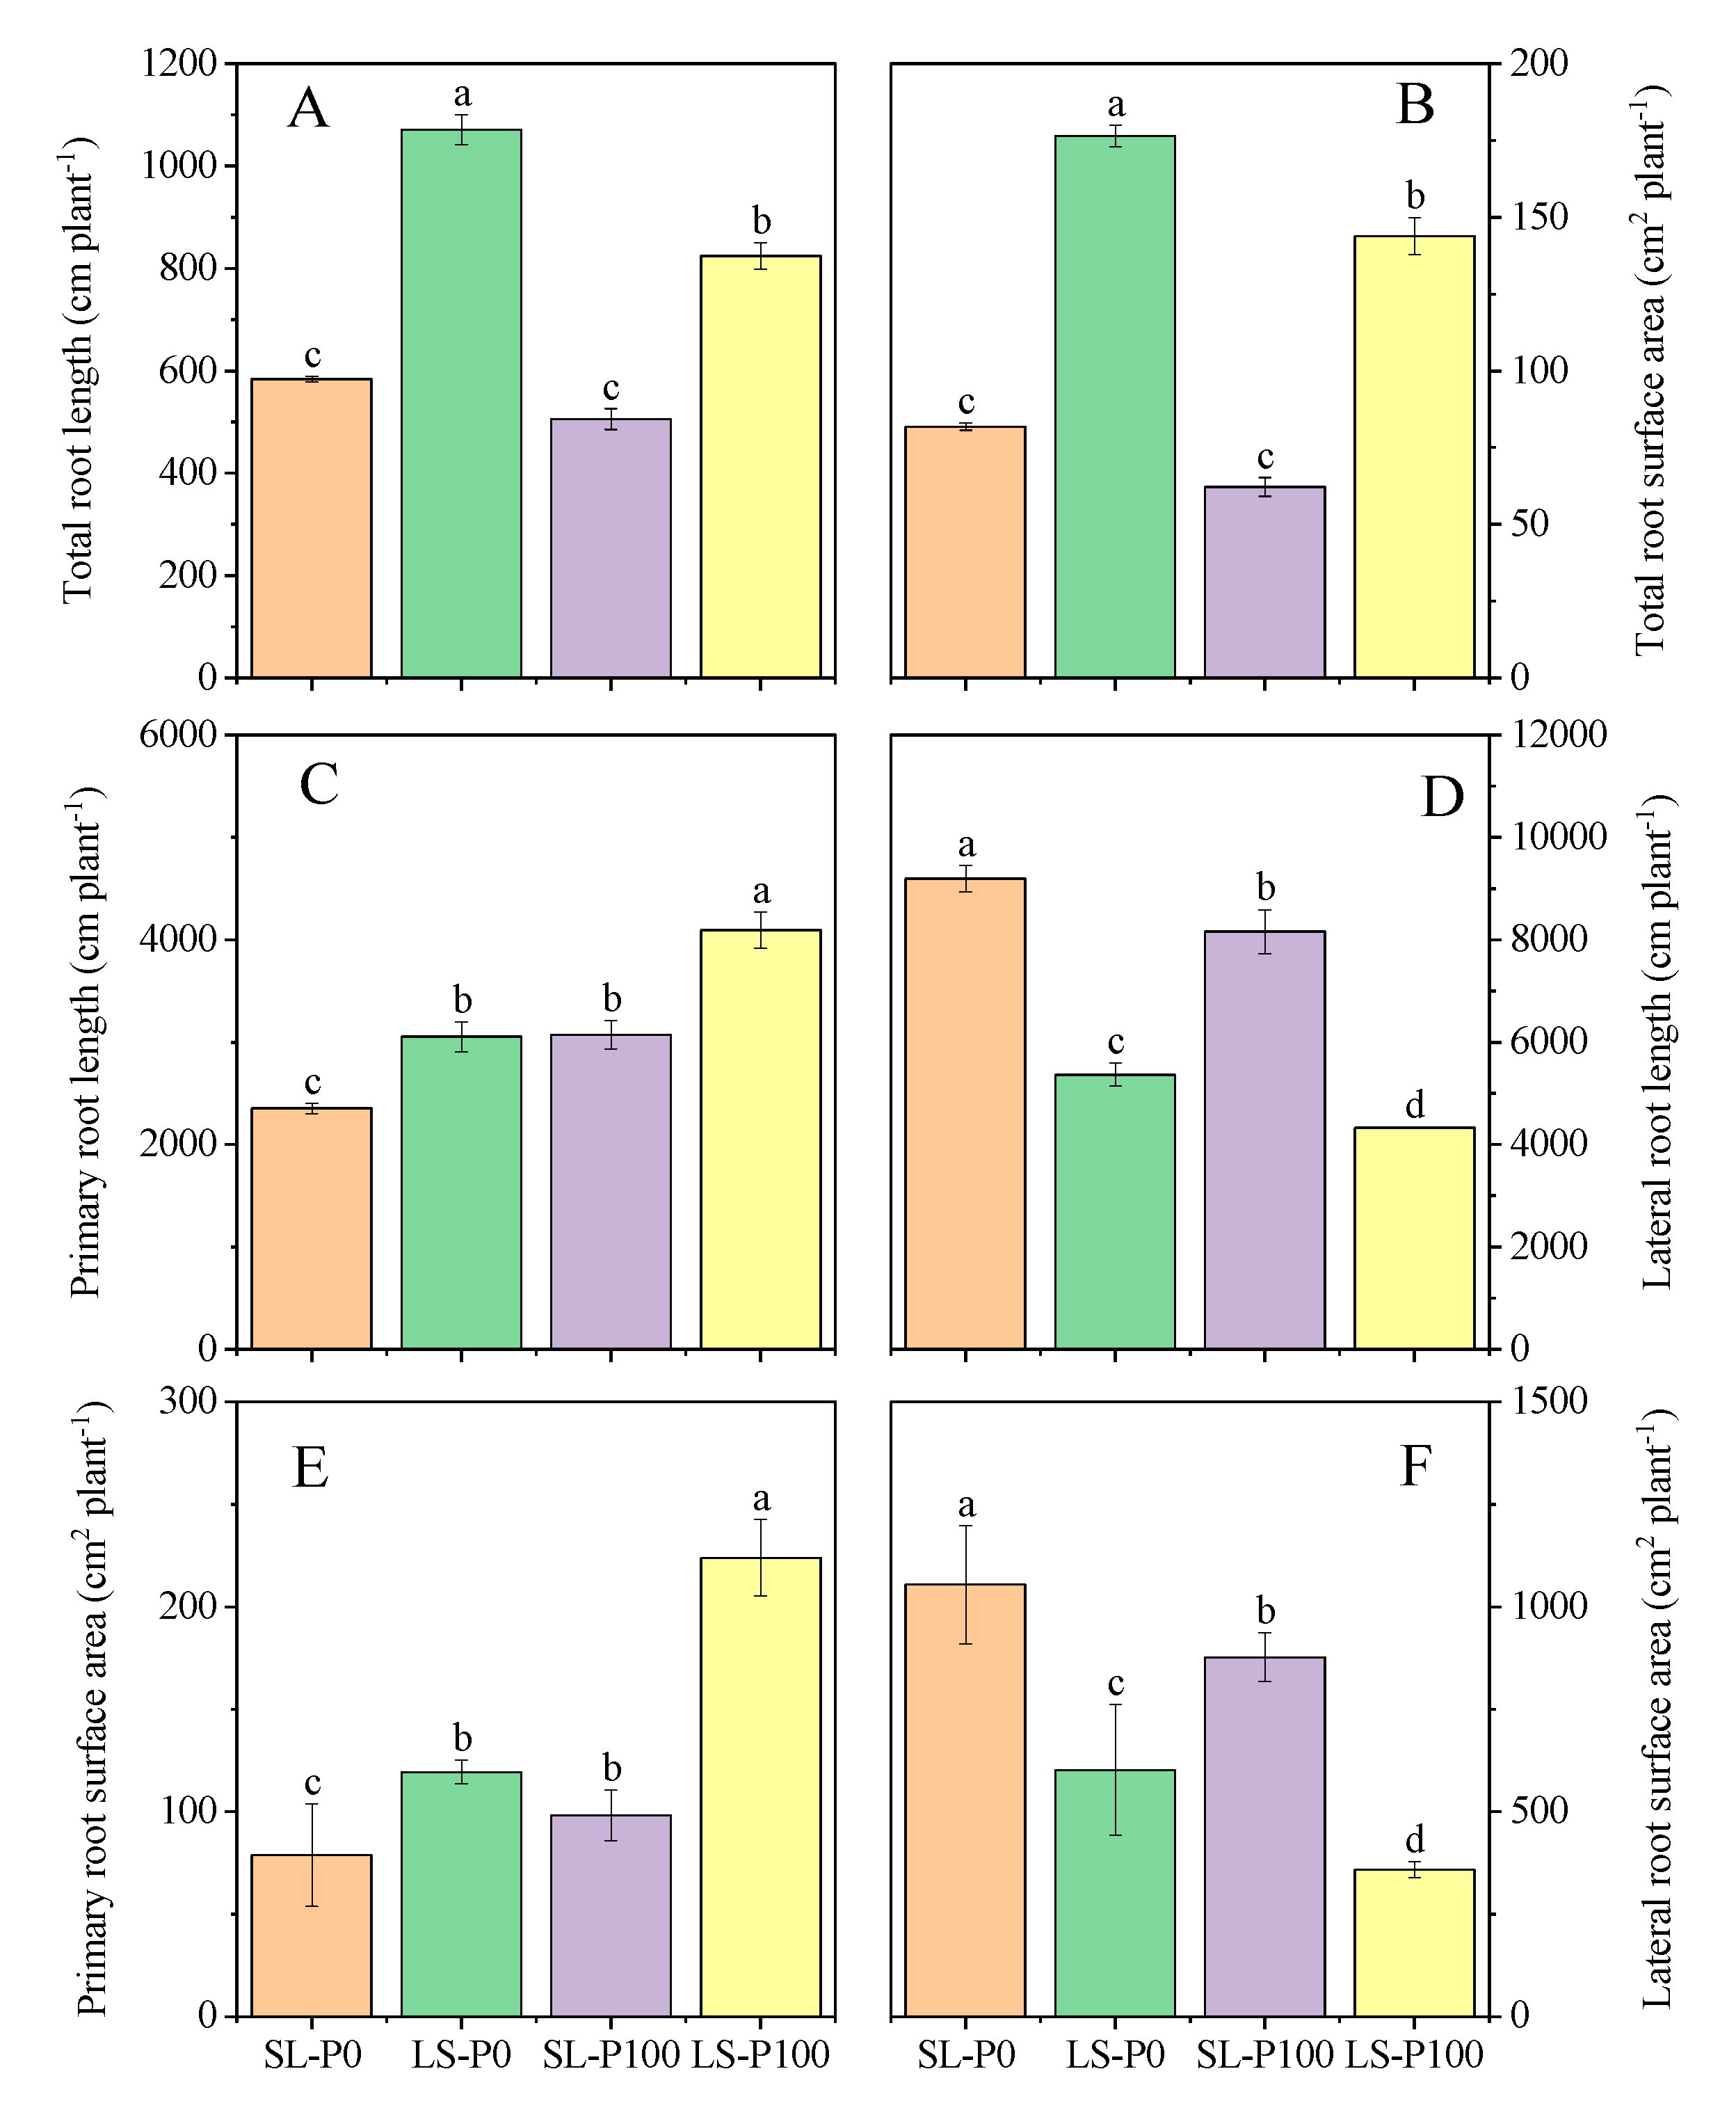
2.2. Root Distribution and Morphological Traits

In the field experiment, the cropping system changed the distribution of soybean root in the soil. More than 90% of the roots in the inter-cropping system were distributed in the upper 0–15 cm soil layer; the deepest was about 45 cm (Figure 2). However, most of the roots in the monocropping system were distributed in the 0–30 cm layer; the deepest was about 55 cm (Figure 2). The RU15 (the proportion of roots distributed in the upper 15 cm soil layer) of inter-cropped soybeans was significantly (p ≤ 0.05) higher than monocropped soybeans, irrespective of the cropping system. Compared to P20 treatment, roots distribution was shallower in P0. In the horizontal direction, inter-cropped soybeans allocated more roots to the wide row side, while reduced allocation to the narrow row. For monocropped soybean, the root systems on both sides of the soybean were almost symmetrically distributed (Figure 2).
In the pot experiment, the total root length and root surface area of soybeans in LS treatments were significantly (p ≤ 0.05) higher than in SL treatments at the V5 stage, irrespective of P application (Figure 3A,B), while the total root length and surface area in SL treatment were significantly (p ≤ 0.05) greater than LS at the R3 stage. The effects of light intensity on root morphological traits were more pronounced when plants were grown without P application rather than soybeans supplied with sufficient P. Additionally, the increased total root length and surface area of soybeans in SL treatment were caused by increased length of lateral root, as the primary root length and surface area of soybeans in LS treatment were still significantly (p ≤ 0.05) greater than SL treatment at the R3 stage (Figure 3C–F).
The expression of GmEXPB2, which was associated with root growth and P uptake, was determined by P supply and light condition. More light capture and low-P supply increased the expression of GmEXPB2 in the V5 and R3 stages (Figure 4).

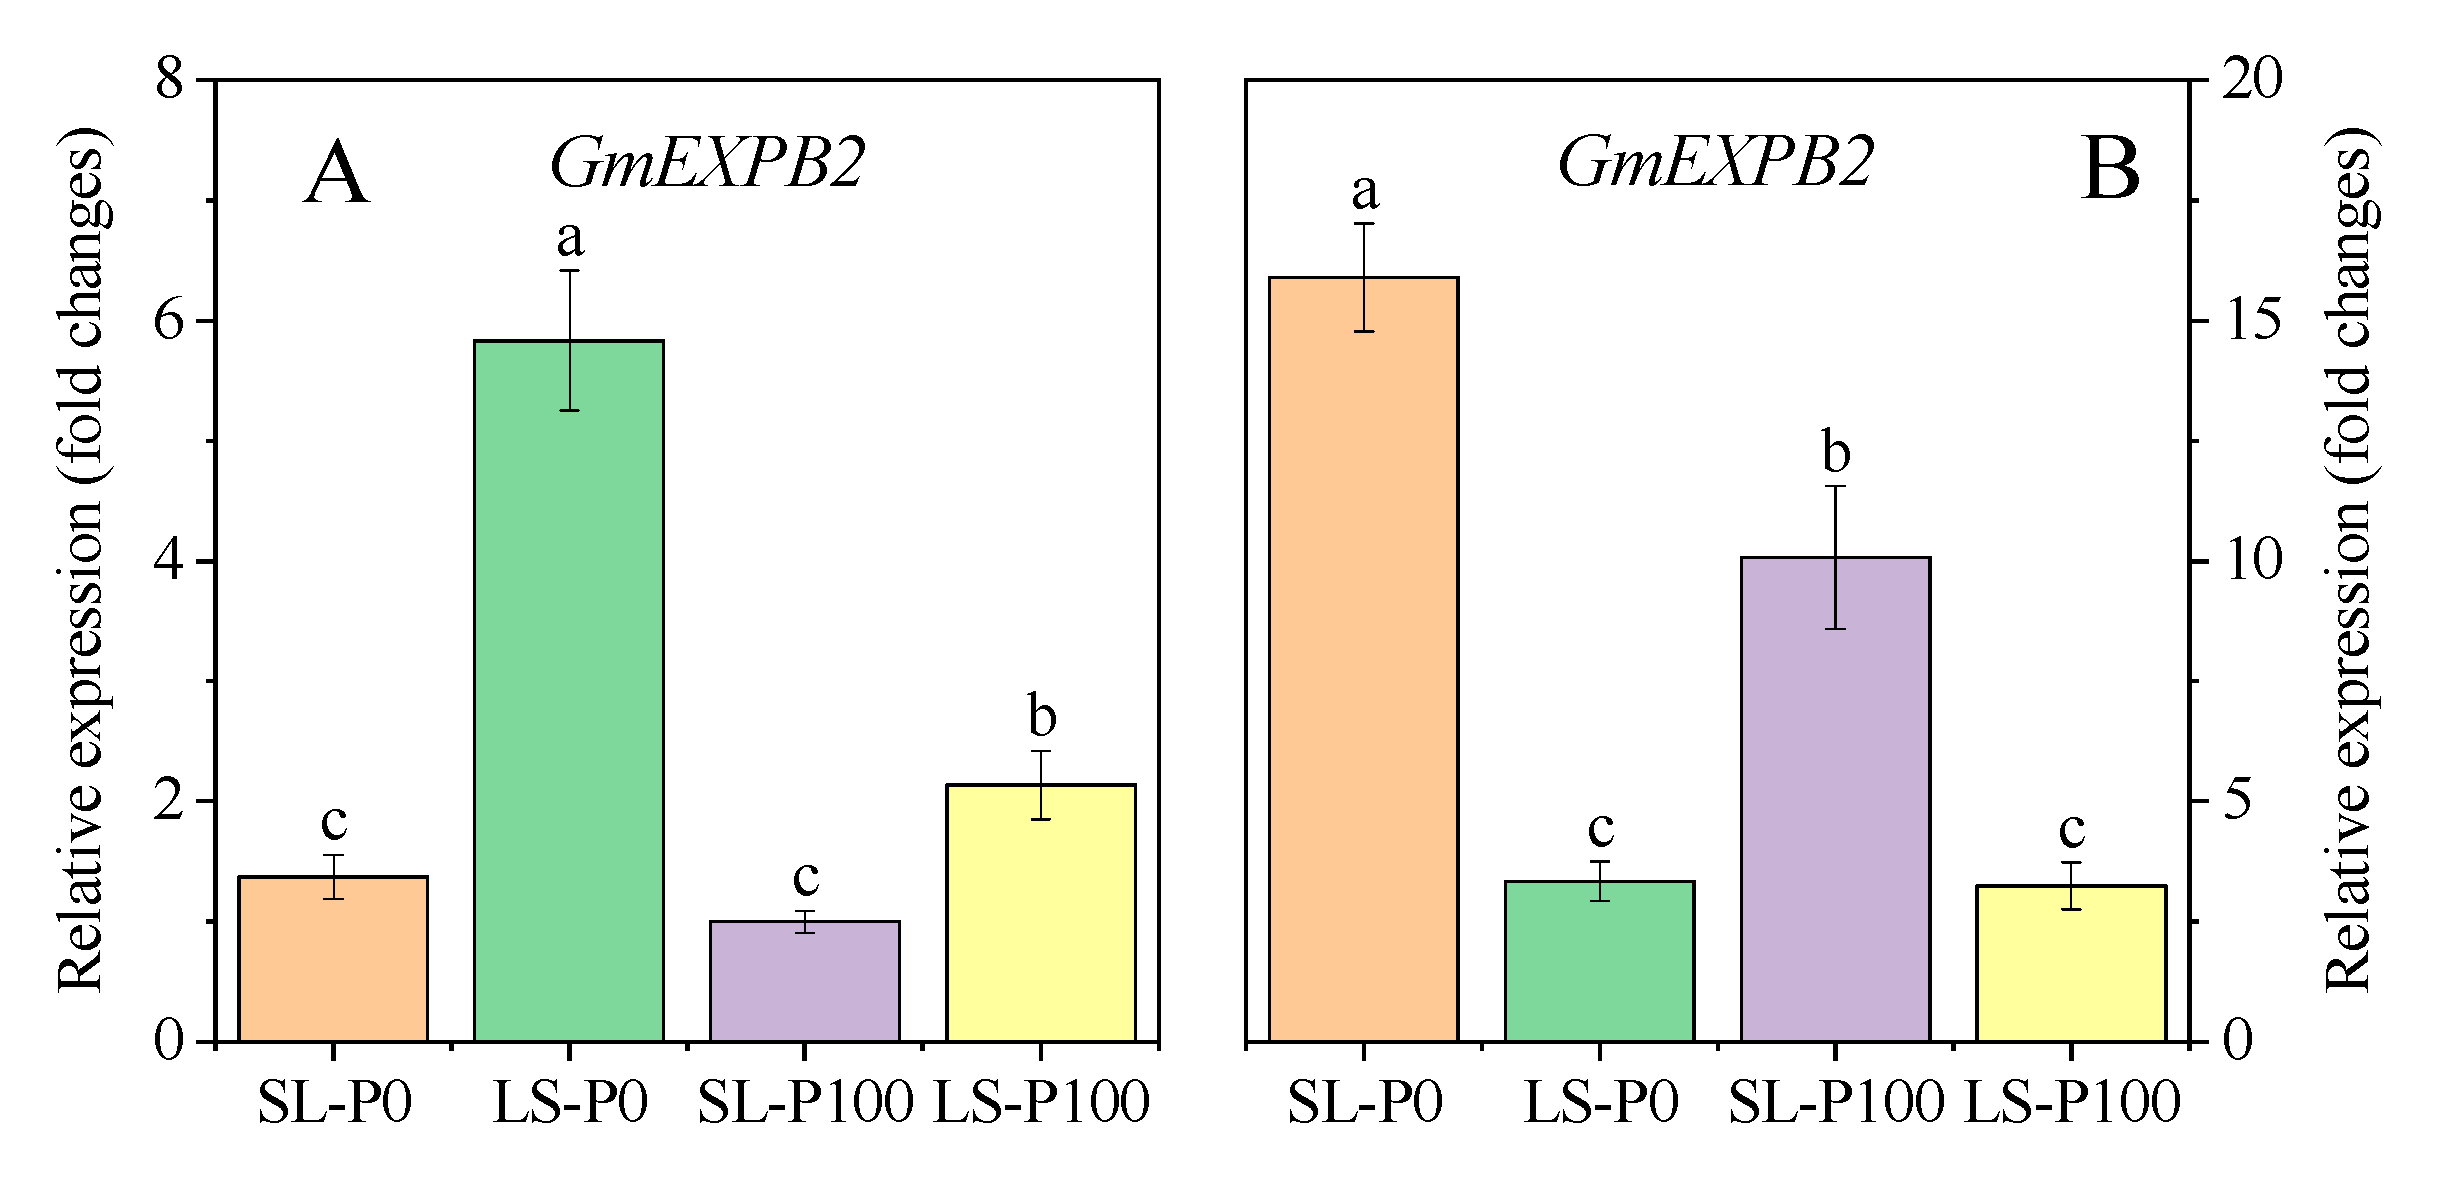
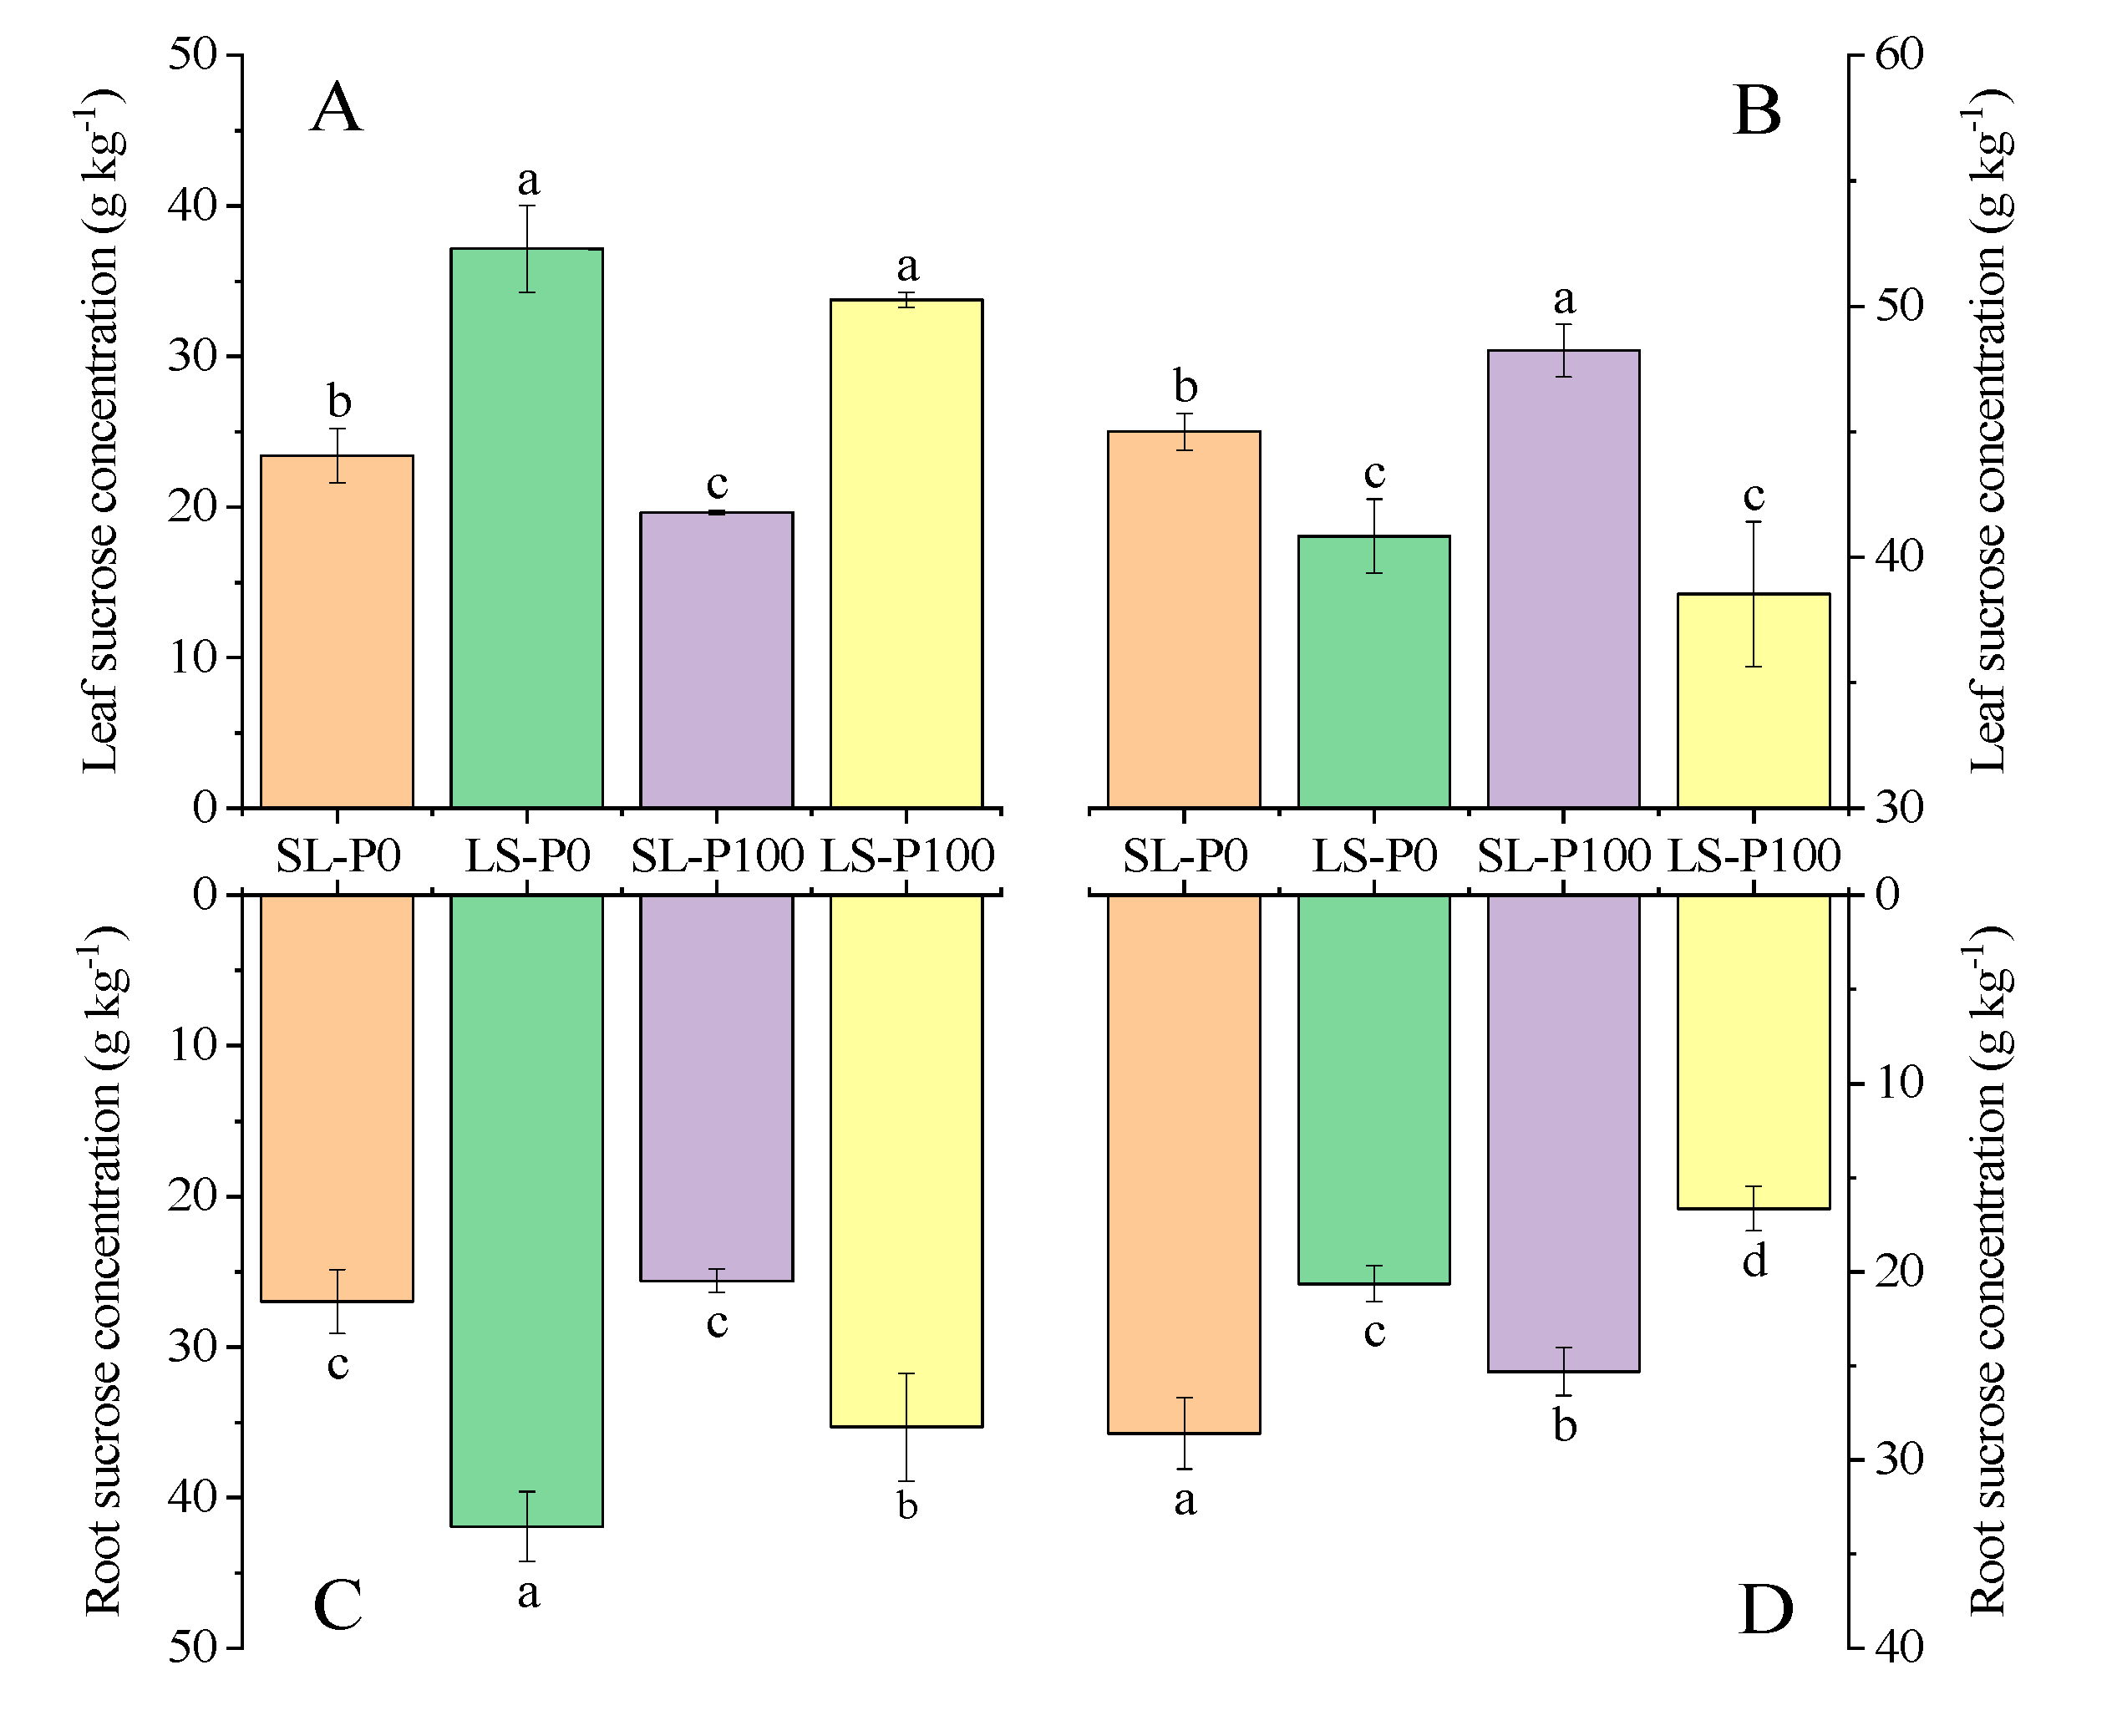
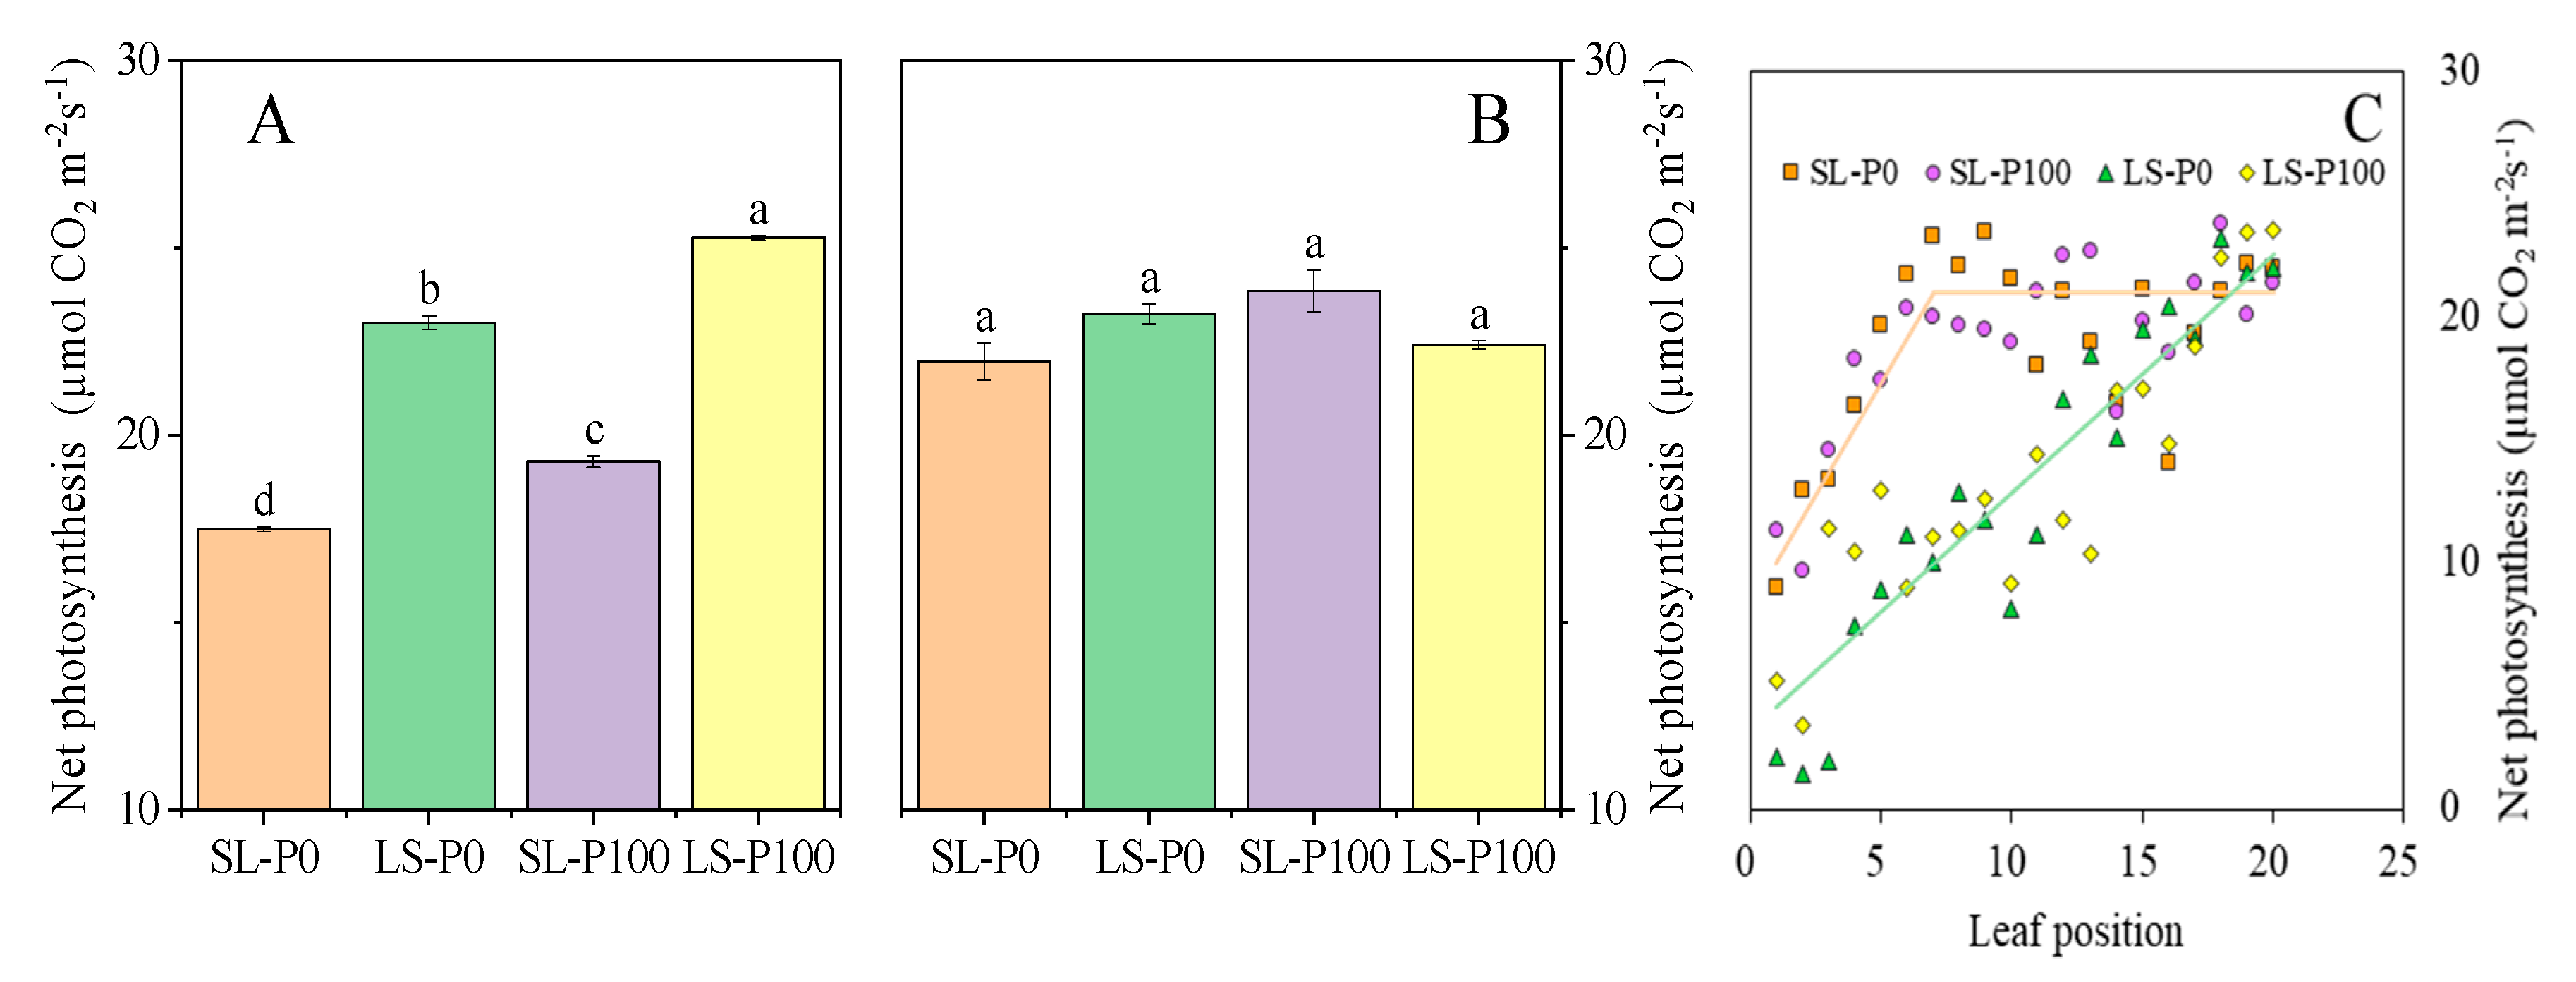
2.3. Photosynthetic Efficiency and Sucrose Accumulation

At the V5 stage, net photosynthesis (Pn) of the youngest fully expanded leaf supplied with adequate P was significantly (p ≤ 0.05) higher than the zero-P supply. Increasing light intensity increased the Pn (Figure 5A). However, neither the light condition nor P application had a significant (p > 0.05) effect on the Pn of the youngest fully expanded leaf at the R3 stage (Figure 5B). The Pn of all soybean leaves from the oldest to the youngest were measured. We found that the Pn of old leaves in the LS treatment sharply decreased, while all leaves in the SL treatment maintained a relatively high level of Pn (Figure 5C).
At the V5 stage, the sucrose concentration in roots and leaves in LS were significantly (p ≤ 0.05) higher than SL treatments, especially in roots (Figure 6A,C). On the contrary, sucrose concentration in roots and leaves in SL were significantly (p ≤ 0.05) greater than LS at the R3 stage. Leaf sucrose concentration increased with P supply, while the root sucrose concentration in the P0 treatment was significantly (p ≤ 0.05) higher than in the P100 treatment (Figure 6B,D).

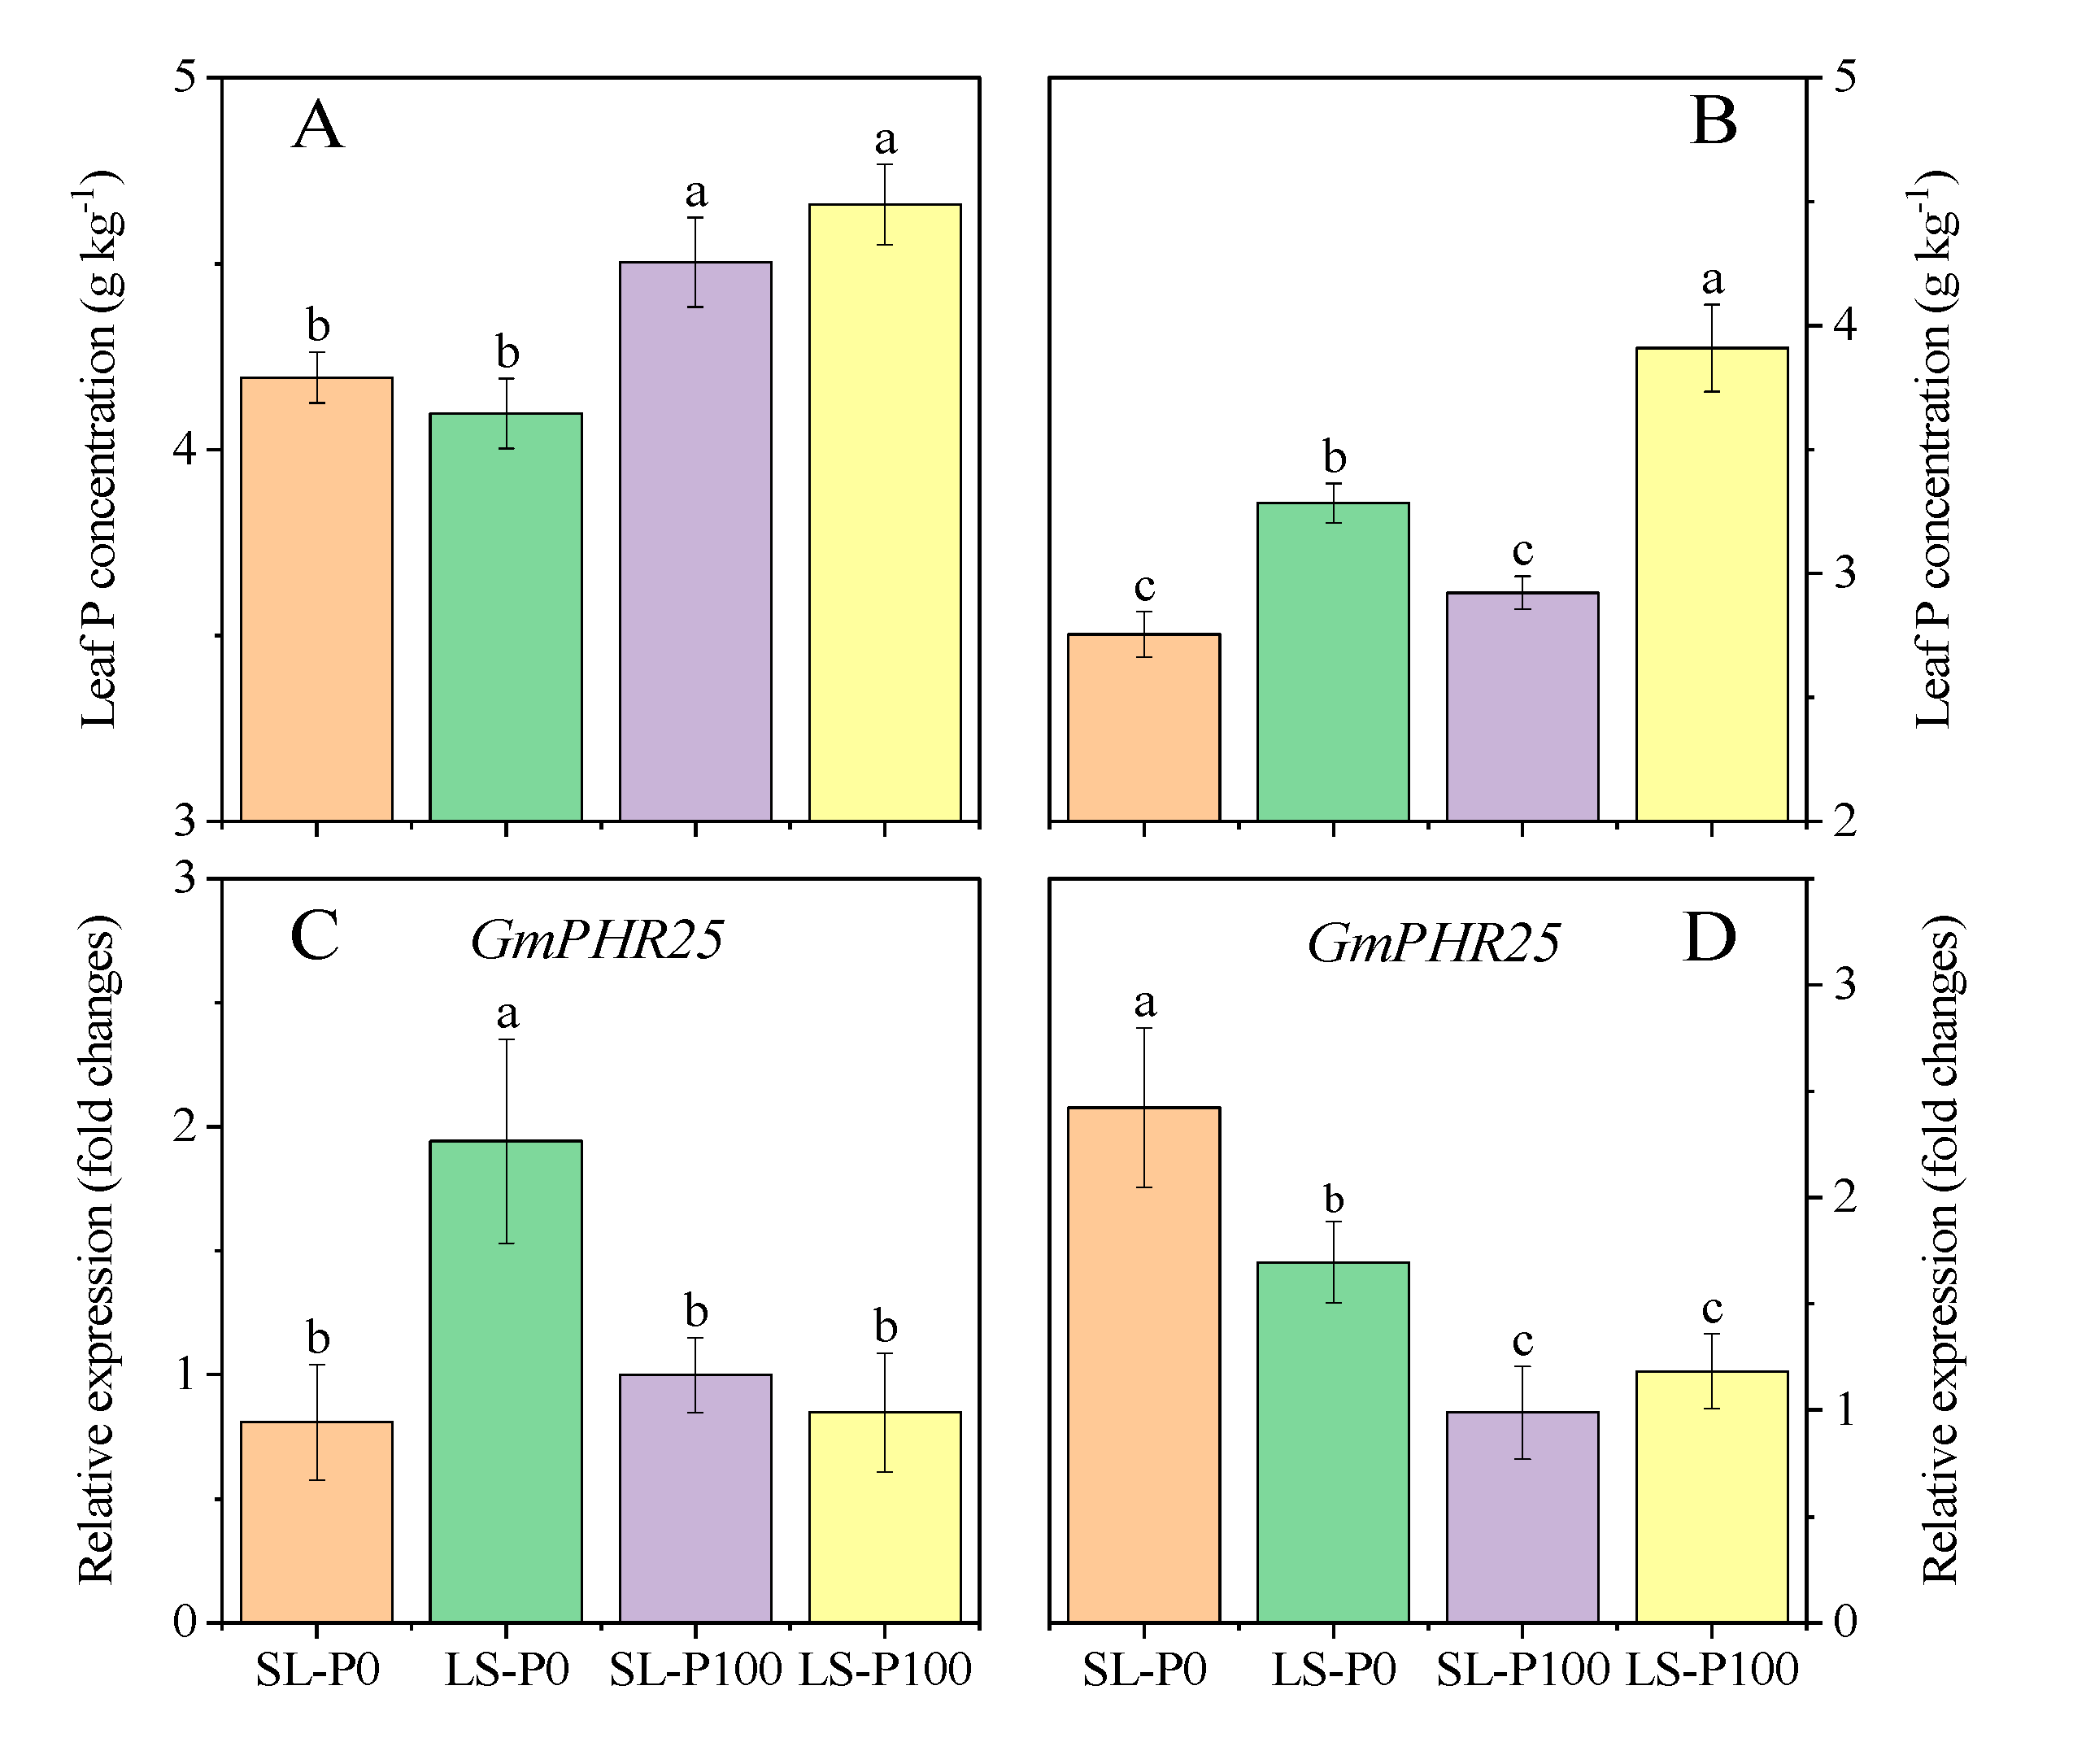
2.4. P Status in Leaf

In the P100 treatment, P concentration in leaves was significantly (p ≤ 0.05) higher than in P0 treatment, but the light condition had no significant (p > 0.05) effect on the leaf P concentration at the V5 stage (Figure 7A). Meanwhile, it was observed that GmPHR25, which was involved in the P starvation response, was highly expressed in the LS treatment compared with SL (Figure 7C). Both increasing light capture and low P condition significantly (p ≤ 0.05) decreased the leaf P concentration at the R3 stage (Figure 7B). The expression of GmPHR25 in SL was significantly (p ≤ 0.05) higher compared to LS (Figure 7D). Whether it was at the V5 or R3 stage, the expressions of GmPHR25 between two light conditions showed significant (p ≤ 0.05) difference only under P-deficient treatments, but no significant (p > 0.05) difference under P-sufficient treatments (Figure 7C,D).

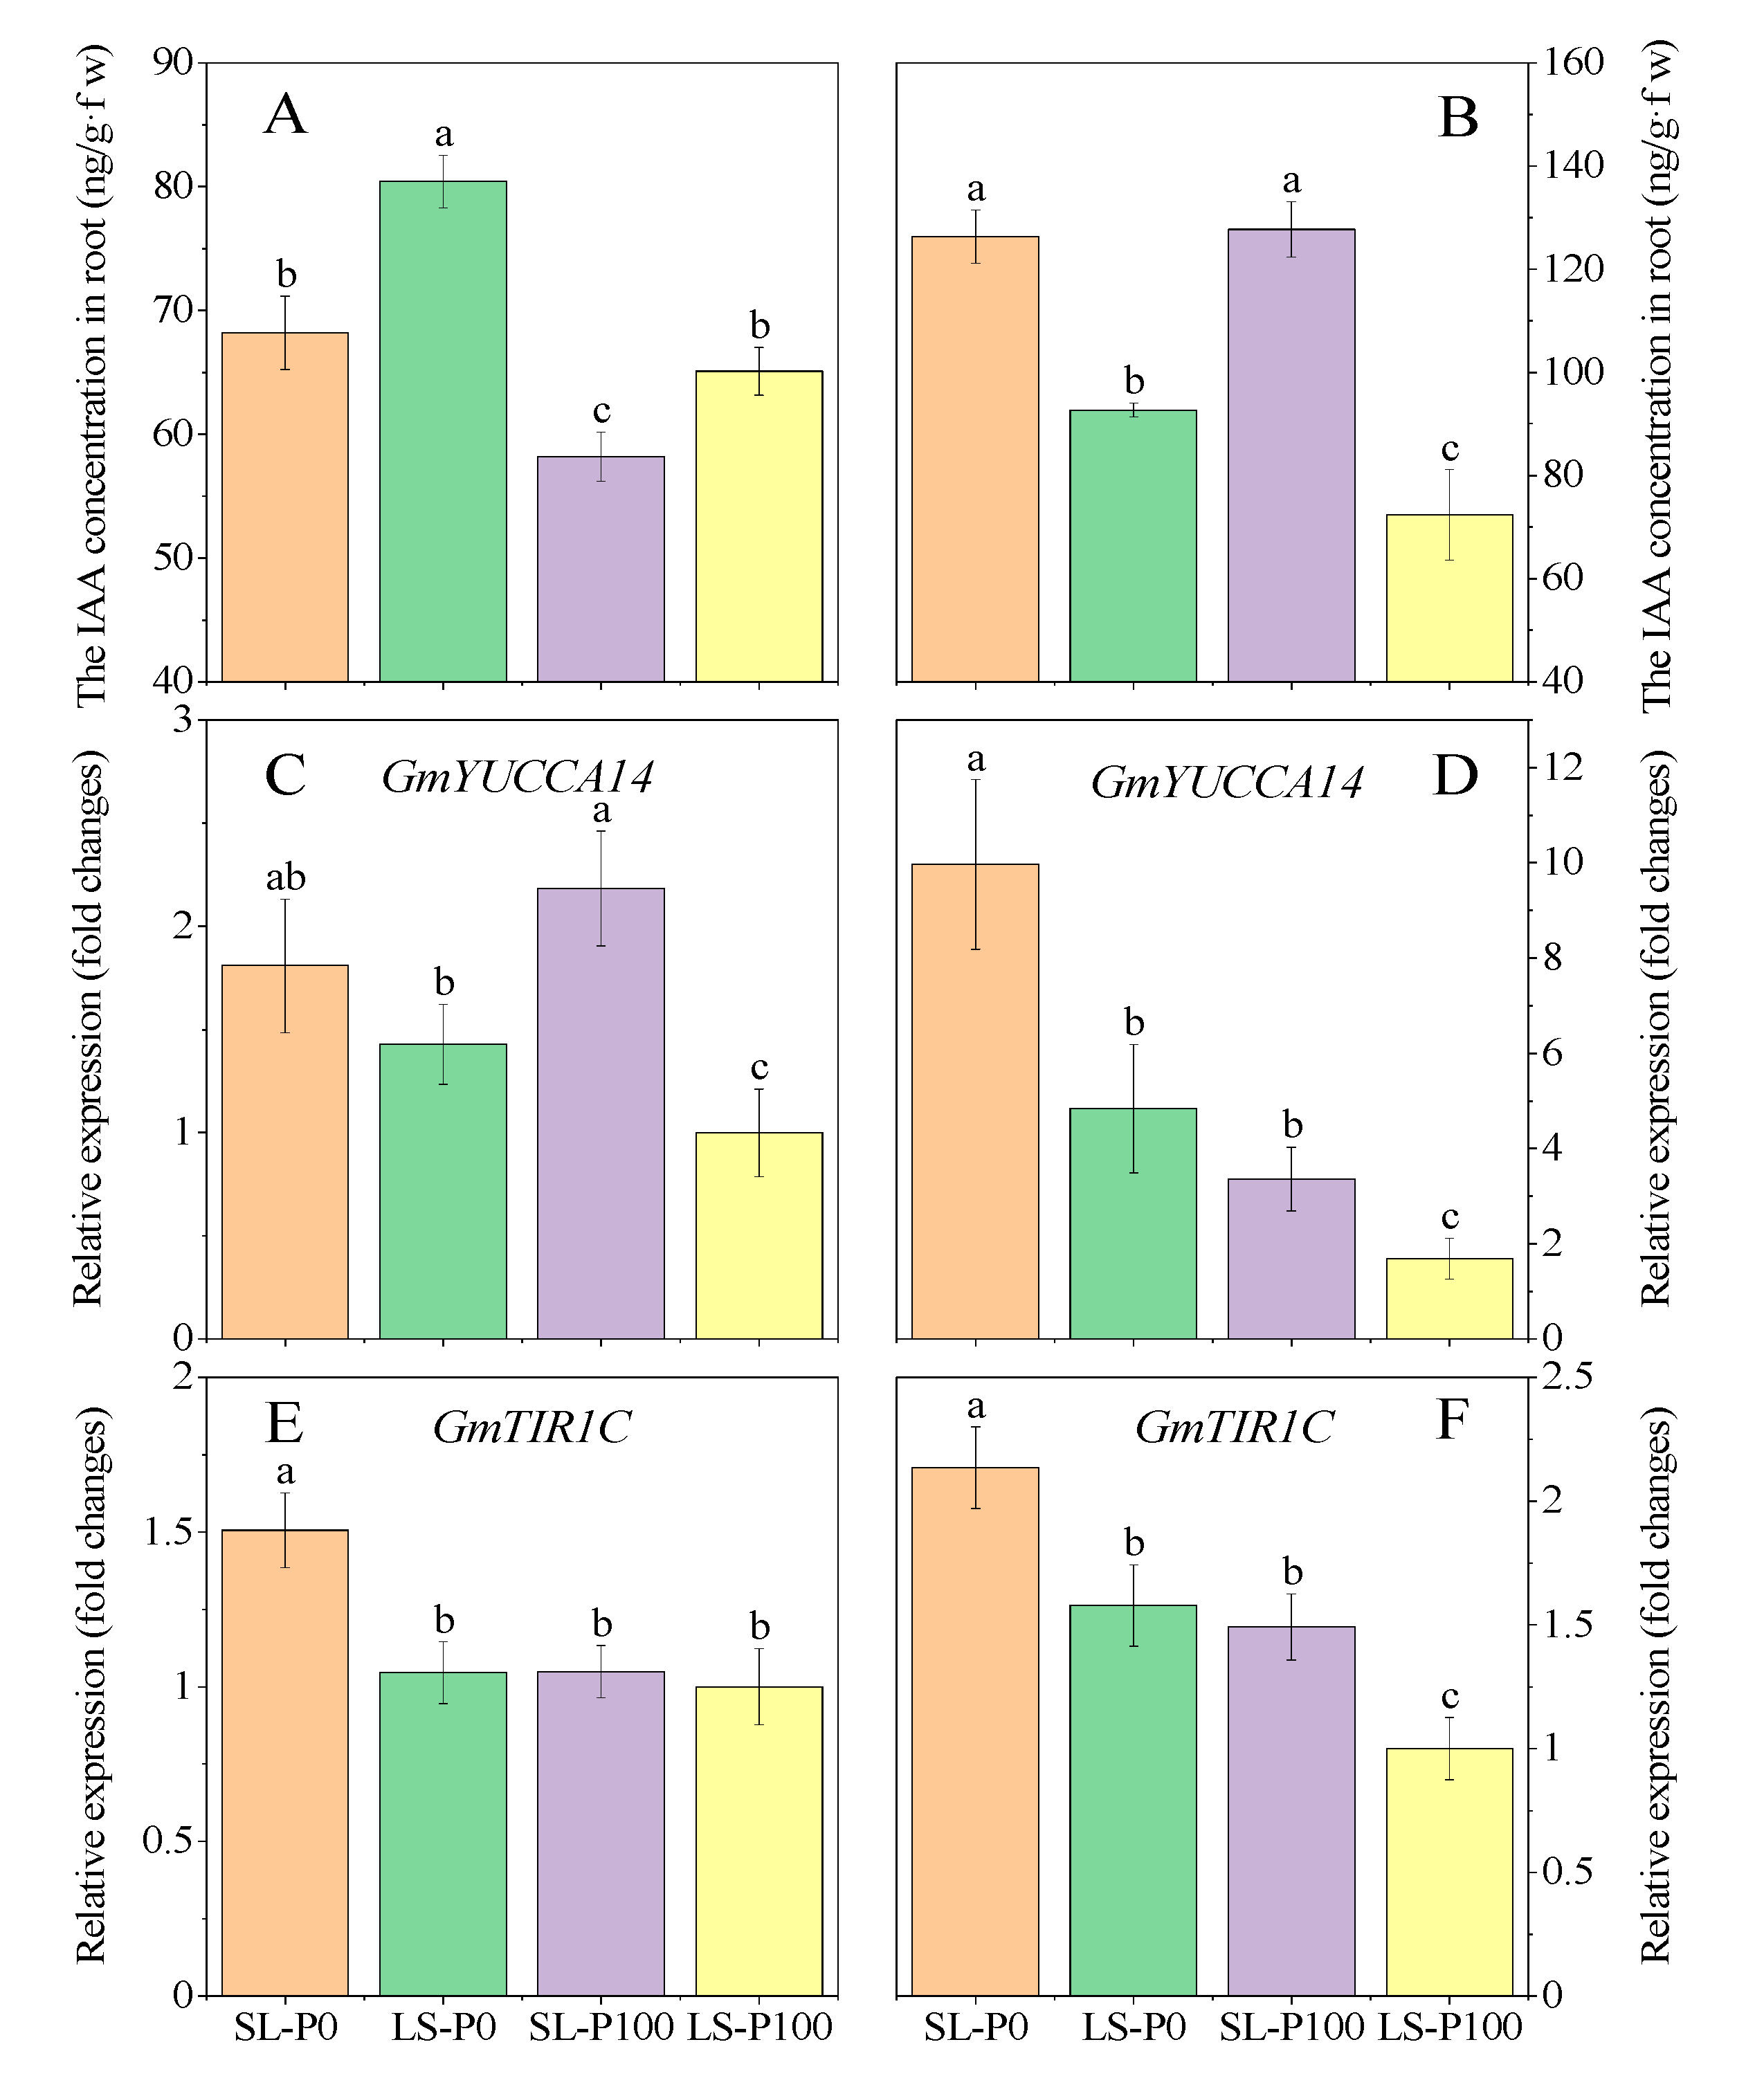
2.5. IAA Concentration and Expression of Auxin-Related Gene

At the V5 stage, the root IAA concentration in LS was significantly (p ≤ 0.05) higher than SL irrespective of P application (Figure 8A). On the contrary, the root IAA concentration in SL treatment was significantly (p ≤ 0.05) higher than LS at the R3 stage (Figure 8B). Whether it was the V5 or R3 stage, our results showed that auxin concentration in roots was increased by zero-P supply (Figure 8A,B).
Aboveground light conditions and P application had significant (p ≤ 0.05) effects on the expression of genes related to auxin synthesis and root response. GmYUCCA14 and GmTIR1C were found to be predominantly expressed in soybean roots, implying their specific roles in root development [45,46]. In the present experiment, the expression of the gene GmYUCCA14 encoding the auxin synthesis in soybean roots was increased by reducing the light intensity (Figure 8C). The GmTIR1C (auxin receptor) was highly expressed by reducing the light only under P deficiency at the V5 stage (Figure 8E). On the contrary, the expression of these two genes increased when the P supply was reduced and more light capture stimulated the expression at the R3 stage (Figure 8D,F).

3. Discussion

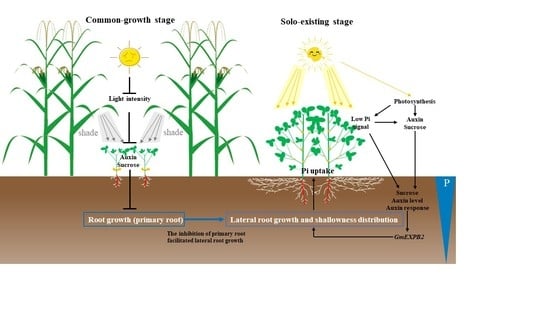
3.1. Root Growth and Distribution in the Variable Light Condition of Inter-cropped soybeans

Generally, crops acquire nutrients directly from soil, not water, in which the bioavailability of nutrients is typically suboptimal, especially the P nutrient [47]. Some important root architecture traits—such as total root length, root hair formation, and root branching—can be modified by P deficiency in order to enhance the P uptake capacity in the root system [48]. Consistent with those under P deficiency, plants under high light intensity showed a higher root/shoot ratio associated with greater carbohydrate concentrations in roots [18,49,50,51,52]. Inter-cropped soybeans suffered serious shade stress (low light intensity and quality) caused by maize during the common-growth period [18,53,54]. In the present study, we observed that variable light conditions in the relay strip inter-cropping system regulated soybean root growth and distribution. Soybean root growth in SL in the pot experiment was inhibited by shading at the V5 stage, as well as in the root biomass, total root length, and root surface area, all of which were significantly lower than LS treatment (Figure 3A,B). Harvesting empty strip maize leaves empty in the field increased light and growing space availability for inter-cropped soybeans, while the major leaves of monocropped soybeans were in a weak light condition because of the self-shading at the R3 stage [18,39]. Coincidentally, the length and surface area of lateral roots in SL were significantly higher, as compared to those in LS at the R3 stage (Figure 3D,F). However, the length and surface area of primary roots in SL were still lower than in LS (Figure 3C,E). The shade during the common-growth period inhibited not only the elongation of the primary root, but the formation and growth of the lateral root. Moreover, the inhibition of root elongation mainly affected cell differentiation and caused irreversible damage. These results indicated that the variable light (from shade to ameliorated light) of soybeans favored the formation of lateral roots rather than the growth of primary roots during the reproductive stage. This was considered to be the peak period of P uptake.
P bioavailability is usually greatest in the topsoil because of P deposition from crop residues, limited P leaching to deeper soil strata, and greater biotic activity in the topsoil [55]. One opportunity to increase P uptake for crops is to improve foraging in the P-rich soil area (i.e., the topsoil in most agricultural soils). Topsoil foraging can be improved through greater lateral root density, greater root hair length/density, shallower root distribution, reduced root metabolic cost, and so on [47,55]. Except for root growth, the light condition of the inter-cropping system was also involved in distributing soybean roots in the soil profile. During the common-growth period, both the growth of primary and lateral roots were inhibited. At the R3 stage, more than 90% of the roots of inter-cropped soybeans were distributed in the top layer of 0–15 cm soil, whereas the distribution depth of vertical inter-cropped soybeans was shallower than for monocropped soybeans (Figure 2). Stout primary roost with a low density of lateral roots were found in monocropped soybeans, while a large number of secondary and tertiary lateral roots were observed in inter-cropped soybeans at the R3 stage (Figure S2C,D). The root architecture of inter-cropped soybeans was P efficient, but did not adapt to moisture stress. Fortunately, the precipitation from June to October (soybean growing season) accounts for more than 75% of precipitation for the whole year in this study area and so soybean growth is not subject to drought stress (Figure 9).

3.2. Auxin Concentration and Related Gene Expression Involves in Root Architecture

Our previous study proved that the formation of P-efficient root morphology at the R3 stage was attributed to the ameliorated light condition [18]. However, stimulating the lateral root formation increased light capture and was not exclusively controlled by an increased translocation of sucrose to roots. Instead, other systemic signals such as auxin could contribute to the induction of lateral root formation and growth [31,32,56,57,58].
To address the question of auxin’s role in the morphogenetic changes induced by the light condition, we analyzed the effect of auxin on root architecture and lateral root formation in different light environments. The results in the pot experiment showed that the IAA concentration in soybean roots was significantly decreased by the shade during the seedling stage, while the expression of the auxin synthesis gene GmYUCCA14 and auxin receptor gene GmTIR1C were up-regulated in roots (Figure 8A,C,E). Our result is consistent with previous studies, which have indicated that continuous shade decreases photosynthesis, auxin synthesis substrates, and auxin concentration reduction, especially in the root [59,60]. Interestingly, in order to maintain Arabidopsis thaliana growth, the expression of receptor genes AtTIR1, AtIAA19, and AtIAA29 that control the auxin response is significantly up-regulated in the continuous shade condition [59,60,61,62]. The results proved that the continuous shade can up-regulate the signal pathway involved in root auxin synthesis and response to maintain soybean root growth in the case of auxin concentration, which limits root growth. However, the expression of GmYUCCA14 and GmTIR1C at the R3 stage were up-regulated by increased light intensity, which seems contradictory to the results (Figure 8D,F). In fact, this consequence is related to the growth character of soybeans. During the seedling stage, the root growth is regulated by photosynthates and nutrients acquired from soil by roots are supplied for shoot morphogenesis. However, nutrients acquired by roots during the reproductive period are mainly for grain formation and root growth enters a rapid growth period mainly regulated by shoot demand [63]. At the V5 stage, the photosynthetic capacity of soybeans in SL was limited by low light (Figure 5A) and root growth was inhibited by photosynthate. Thus, IAA synthesis and accumulation decreased in roots (Figure 8A). At the R3 stage, due to the weak light environment of soybeans in LS, the shoot demand decreased after sharply dropping in the flower and pod. Subsequently, the lateral root growth was slow (auxin regulation pathway was weakened). In contrast, both the IAA concentration and gene expression (GmYUCCA14 and GmTIR1C) in SL at the R3 stage were up-regulated, which indicated that the shoot demand of soybeans dominated the lateral root formation (Figure 8B,D,F).
Except for shade, sucrose and P-deficiency up-regulated the sensitivity of auxin receptors [31,34,48,61,62]. Under low P conditions, IAA accumulation in the root tip inhibited the elongation of plant roots. After the sensitivity of the auxin receptor in mature regions increased, lateral root density was promoted [57]. In the present study, the P concentration of soybean leaves in SL at R3 stage was significantly lower than LS and the expression of the gene GmPHR25 was also down-regulated (Figure 7B,D). Moreover, the sucrose concentration increased due to the ameliorated light condition (Figure 6B,D). The expression of the auxin receptor gene GmTIR1C in the root was up-regulated by the low P in leaves and high sucrose in roots. The density and length of lateral roots in SL were higher than soybeans in LS, especially in P0 treatment. At the R3 stage, the low P status in the leaves of SL increased the sensitivity of the auxin receptor gene and the lateral root length also increased, which seemed contrary to our previous study. The effect of P-deficiency on root elongation was mainly inhibited by the mitosis of cells in the meristematic zone so as to reduce the number and elongation growth of cells [64,65,66]. In the present study, low P concentration of leaves in SL during the R3 stage did not cause stress on plant growth. Moreover, the photosynthate produced in the shoot was translocated to the root as sucrose (Figure 6B,D), which served as both a signal for the integration of shoot light and P status that transduced to the root and a C-substrate for root growth [34,52,67,68]. Our results demonstrated that the increase of translocation in sucrose from shoot to root not only enhanced auxin synthesis but up-regulated the expression of the auxin receptor gene (Figure 8F). The light environment of SL at the R3 stage mediated sucrose and low-P signal to regulate auxin synthesis and sensitivity in the root, thus promoting the formation and elongation of the lateral root. A previous study in Nicotiana tabacum found that increased light intensity rapidly enhanced root growth by elevating sucrose export from shoot to root [28]. In addition, a similar result was found in white lupin, which increased the light mediating sucrose and auxin pathway resulted in greater production of cluster roots, and subsequently improved P uptake [52].
Root architecture, defined as the spatial configuration of a root system, is especially important for P acquisition by plants, since the relative immobility of P in soils makes P acquisition very dependent on soil exploration in time and space [69]. The results of the experiment reported here showed that root growth was regulated by auxin synthesis and response. However, it cannot completely explain the shallower root formation of the inter-cropped soybeans, because most of the lateral root arose at the 0–15 cm soil layer rather than the whole root. The two main reasons for the shallower root distribution of inter-cropped soybeans were as follows: (i) the ameliorated light significantly decreased the P concentration and up-regulated the expression of the low-P response gene (GmPHR25) in soybean leaves (Figure 7B,D). Meanwhile, the expression of GmEXPB2 (encoding root growth) was also up-regulated (Figure 4B). P-deficiency inhibited the secondary growth of crop roots in dicots and legume crops with greater inhibition of secondary growth under P stress had reduced root costs and greater elongation growth [47,70]. The decrease of secondary growth showed that the elongation of the primary root was inhibited and the density of the lateral root significantly increased [71]. (ii) The inhibition of primary root growth was caused by shading during the early stage, which played a critical role in distributing lateral roots formed during the reproductive growth period of inter-cropped soybeans. The inhibition of the primary root modified the auxin synthesis center, transport pathway, and sensitivity of the auxin receptor gene located in the mature region in the root, thus promoting lateral root formation [48]. The growth of the primary root of soybean in SL was strongly inhibited with the destruction of the root tip and the auxin synthesis center was replaced by the primary lateral root tip at the V5 stage. Multiple primary lateral roots (instead of one primary root) provided more sites for secondary and tertiary lateral roots, ensuring the possibility of forming more lateral roots.

3.3. P Uptake Was Improved by the Relay Strip Inter-Cropping System

In the present study, inter-cropped soybeans had a P uptake advantage compared with monocropped soybeans across all 4 years (Figure 1C). The growth and development of lateral roots were crucial for maximizing the ability of the root to absorb P from the soil. Lateral roots assisted the acquisition of P by increasing the absorptive surface of the root and the formation of a highly branched root system may be a result of the canalization of carbon and energy resources to form a root system capable of exploring large areas of the upper soil layer, where P-rich patches are normally present [72]. The shade of inter-cropped soybeans suffered during the seedling stage and were inhibited by root the growth, especially the primary root. The ameliorated light condition after maize harvest mediation P status and photosynthate (sucrose) regulated the formation and growth of lateral roots, which were mainly distributed in the 0–15 cm soil profile. The early shading inhibited the development of the primary root and changed the auxin synthesis center from a primary root tip to multiple lateral root tips, which provided more sites for the occurrence of secondary lateral roots. During the reproductivity stage, the low-P signal and photosynthates formed by the ameliorated light not only increased the sensitivity to auxin but increased the IAA concentration in the root, thus increasing the density and length of the lateral root. Consequently, a root architecture with P-efficient uptake during the reproductive growth period was observed in the inter-cropped soybean. The P capture of inter-cropped soybeans was significantly improved because of the greater production of lateral roots, especially the hypocotyl-borne roots (Figure S2D), which typically had very shallow growth angles. Thus, the metabolic cost decreased [73,74].
In addition to the root architecture, the requirement for P in the shoot was a critical factor for the P uptake in soybeans. Available evidence suggests that the formation and nutrient uptake of roots are mainly regulated by shoot nutrient status through root split and local fertilization experiments [75,76,77,78]. The three major routes of shoot P status that regulate root growth and P uptake are as follows: (1) increased photosynthate distributes roots [51]; (2) systematic low P signal upregulates the expression of genes related to root growth [76]; (3) shoot P status mediates the synthesis and transport of hormones, such as promoting auxin transport from shoot to root, and increasing the sensitivity of auxin receptors in roots to increase lateral root density [48]. Due to the rapid growth rate during the vegetative growth period, monocropped soybeans suffered serious self-shading during the reproductive growth stage, which affected the photosynthetic capacity of the leaves located in the lower position. Moreover, flowers and pods decreased nutrient demand [18]. In contrast, the ameliorated light condition of inter-cropped soybeans significantly increased the photosynthetic capacity of the whole soybean plant and subsequently increased the requirement of P (Figure 5C). The findings of our study were consistent with the observations that inter-cropped soybeans have significant advantages of shoot P and PUE compared with monocropped soybeans (Figure 1C,D). However, the results showed that the average PUE of inter-cropping was only about 14.2% across 4 years, which may be attributed to the fact that soybeans absorbed a large amount of P soil rather than P fertilizer. Except for sucrose and auxin, other systemic signals could contribute to root growth. For example, ethylene was also involved in lateral root formation and primary root growth. Therefore, further work is needed to elucidate the role of ethylene when regulating the root growth of soybean in the variable light condition.

4. Materials and Methods

4.1. Field Experiment

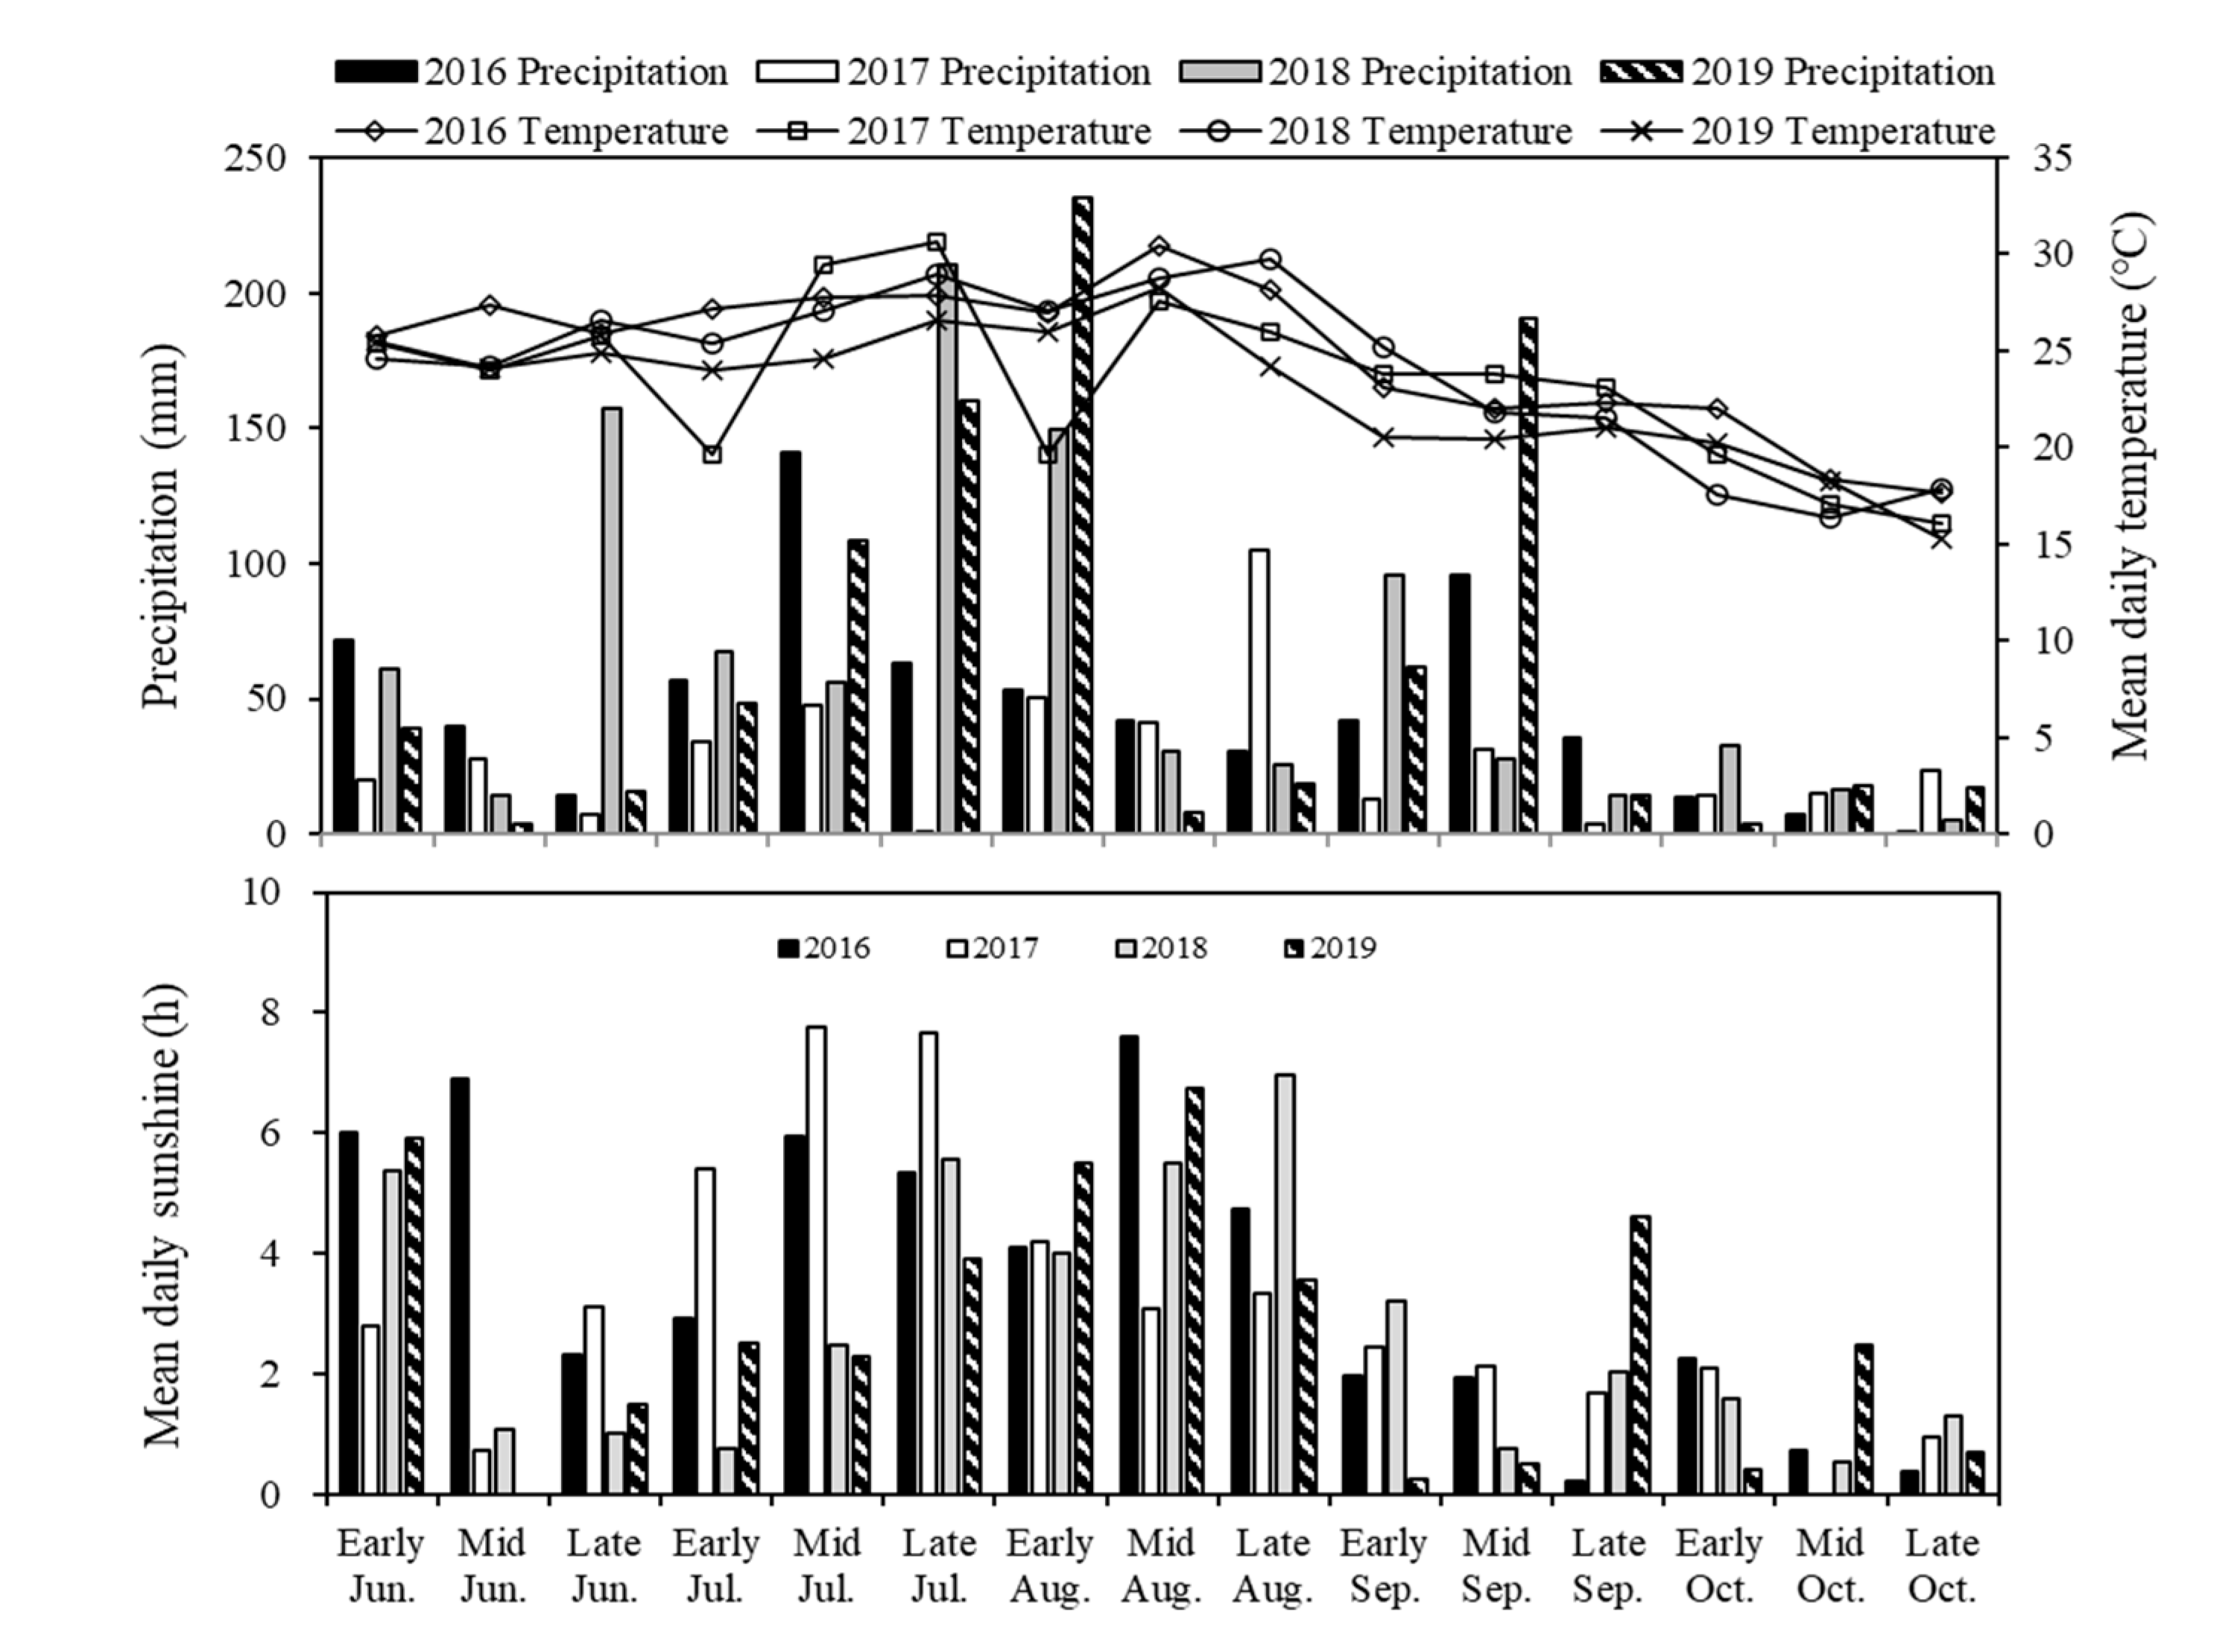
4.1.1. Site Description

Field experiments were carried out from 2016–2019 at the department of Sichuan Agricultural University Renshou Experimental Station (30°06′ N, 104°02′ E) in Sichuan Province, China. Annual mean temperature was 17.4 °C with a maximum and minimum temperature of 25.4 °C and 6.1 °C, respectively. Annual precipitation was 1009.4 mm, annual sunshine was about 1196.4 h, and total solar radiation averages was around 3850 MJ m−2 yr −1. The detailed meteorological data during the during soybean growth season from 2016 to 2019 are shown in Figure 9. The experimental soil was classified as purple soil (Luvic Xerosols) and Olsen-P content was low. The soil characters at the study site in 2016 were as follows: pH (1:2.5, soil:water) 6.8, cation exchange capacity 22.1 cmol kg−1, organic matter content 20.5 g kg−1, total nitrogen (N) 1.5 g kg−1, available N 0.11g kg−1, exchange K 0.115 g kg−1, and Olsen-P 12.6 mg kg−1 of dry soil in the top 20 cm soil layer. After the present study, the available P content in the treatment P0 and P20 were 8.5 mg kg−1 and 14.6 mg kg−1, respectively.

4.1.2. Experiment Design and Crop Management

The field experiment was a split-plot design. The main plot included two P application rates (P0: zero-P supply and P20: 20 kg P ha−1) and the sub-plot consisted of a maize (Zea mays L. cv. Chuandan no.418)/soybean (Glycine max L. cv. Nandou No. 12) relay strip in an inter-cropped soybean system (Glycine max L. cv. Nandou No. 12) and monocropped soybean system. Chuandan No. 418 is one of the 10 main popularized maize varieties in Sichuan Province. It is a semi-compact maize variety suitable for planting in the maize-soybean relay strip. Nandou No. 12 is a Sichuaneses summer soybean cultivar with the largest acreage. It is grown wildly in the maize-soybean relay strip inter-cropped system because of its shade-tolerant. The area of each individual plot was 6.0 × 5.0 m2 for inter-cropping and 3.5 × 5.0 m2 for monocropping. Each inter-cropped plot consisted of 3 strips with 2.0 m in width (distance between maize rows was 0.4 m and gap width for growing soybeans was 1.6 m) and the maize/soybean row ratio was 2:2, while each monocropping plot consisted of 7 soybean rows (distance between rows was 0.5 m). The density of inter-cropped maize was 60,000 plants per hectare and the density of both inter-cropped and monocropped soybeans were 105,000 plants per hectare.
The sowing dates of maize from 2016 to 2019 were on 3rd April, 4th April, 2nd April, and 30th March; harvest dates were on 30th July, 30th July, 1st August, and 28th July of that year. Soybean sowing dates were on 20th June, 20th June, 15th June, and 21st June; harvest dates were on 30th October, 30th October, 2nd November, and 29th October of that year. The seedling phase of the soybean and reproductive phase of maize overlapped over a period of approximately 40 days between soybean sowing and maize harvesting.
All of the urea (30 kg N ha−1), superphosphate, and potassium chloride (20 kg K ha−1) fertilizers were applied as basal fertilizer before soybean sowing. The fertilization of inter-cropped soybeans was located on the side of the wide row. The distance from the seeds was 3–5 cm and the depth was 5 cm, while the fertilization position of the monocropped soybeans was at the left below the seed (to avoid damage to young roots caused by fertilizer). During the whole process of the experiment, no application of organic fertilizer or artificial irrigation were used. Weeds were removed manually during the whole growth period and pesticide control were used in flowering stage of soybean.

4.1.3. Plant Harvest and Measurements of Yield and P Concentration.

From 2016–2018, samples at the maturity stage were collected. In each plot, 5 plants with uniform growth were cut off from the base of the stem, which were divided into stem and pod, and subsequently dried at 75 °C to calculate the biomass. To measure the grain yield, all the middle strips of soybeans in each plot were harvested and measured the effective plant number, then naturally air-dried, and finally the actual grain yield was calculated. The samples at the stages of V5 (Five trifoliolates unroll), R3 (Pods are about 5 mm long on one of the four uppermost nodes on the main stem with a fully developed leaf), and R8 (95% of pods reach mature pod color) were collected in 2019. The sampling method at the stage of R8 was the same as mentioned in maturity. Next, 5 plants with uniform growth in each plot were cut off from the base of the stem, which were divided into stem and leaf, then dried at 75 °C to calculate the biomass at the stages of V5 and R3. The dry material was ground to pass through a 0.149-mm mesh sieve, then a 0.3-g sample was digested with concentrated H2SO4 and H2O2 (30% v/v), and P was determined by the vanadomolybdate method [79].

4.1.4. Determination of Root Distribution

In order to obtain the biomass of the soybean root system and its distribution in soil, layer by layer and blocks extraction were adopted to dig out the roots from the soil in 2018. The volume of each small soil block of inter-cropped soybeans was about 20 cm (length) × 10 cm (width) × 15 cm (height), and the total volume of dug soil was 110 cm (row spacing) × 20 cm (nest spacing) × 60 cm (depth). The volume of each monocropped soybean was 20 cm (length) × 10 cm (width) × 15 cm (height), and the total volume of soil dug was 50 cm (row spacing) × 20 cm (nest spacing) × 60 cm (depth). The roots were carefully picked out from the soil, and washed free of soil then dried at 75 °C to calculate biomass.

4.2. Pot Experiment

4.2.1. Site Description

In 2019, the pot experiments were conducted in the Teaching Farm of Sichuan Agricultural University (30°42′ N, 103°51′ E), which is located in Wenjiang District, Chengdu City, Sichuan Province. The field and pot experimental site were 150 km apart and had similar climatic conditions, such as precipitation, sunshine hours, temperature, and so on. The paddy soil (Ochric Aquic Cambosol soil) was used in the pot experiment and the soil characters were as follows: pH (1:2.5, soil:water) 6.7, organic matter content 8.3 g kg−1, total N 0.21 g kg−1, available N 0.1g kg−1, exchange K 0.103 g kg−1, and Olsen-P 3.0 mg kg−1.

4.2.2. Experiment Design and Crop Management

In the pot experiment, soybean (Glycine max L. cv. Nandou no.12) was grown in shade-light (SL) and light-shade (LS) with two P application rates (P0: zero-P supply; P100: 100 mg P kg−1 soil). The sunshade net was used to simulate the light environment in the field. The light transmittance of sunshade net measured by HR350 (Hipoint Inc., Gaoxiong, Taiwan) was about 50%. Shading the whole soybean plant from sowing to V5 then lighting was used to imitate the light condition of soybean in the relay trip inter-cropping system, while soybean shaded all around from V5 to maturity was used to imitate the light condition of monocropped soybeans. The volume of the pot was about 0.021 m3 and each pot was filled with 10 kg air-dried soil. To ensure that the nutrient supply was sufficient for soybean growth, soil was fertilized with basal nutrients at the following rates (pot−1): Ca(NO3)2·4H2O 16,870 mg, CaCl2 1260 mg, MgSO4·7H2O 430 mg, ZnSO4·7H2O 100 mg, MnSO4·4H2O 67 mg, EDTA-FeNa 58 mg, CuSO4·5H2O 20.0 mg, H3BO3 6.7 mg, and (NH4)6Mo7O24·4H2O 2.6 mg. In the P100 treatment, KH2PO4 was used as P fertilizer and K2SO4 was used to make up the potassium in the P0 treatment. One month before sowing, all fertilizers were manually mixed into the soil, then water was added and placed until sowing. After aging, the content of available P in soil of P0 and P100 were 3.0 and 24.7 mg kg−1, respectively.
Before sowing, the same sized seeds with intact seed coats were selected and sterilized with 30% v/v H2O2 for 20 min. There were 20 pots in each treatment and 4 seeds were sowed. In total, 2 plants in each pot were kept for 5 days after emergence. Each pot was covered with foam cardboard to prevent rain from entering and all pots were watered daily to control the soil water content about 70% of the field capacity until harvest. The main sampling period were concentrated at the V5, R3, and R8 stages, and the specific dates were 31st July, 10th September, and 30th October, respectively.

4.2.3. Determination of P, Net Photosynthesis, Sucrose and Auxin Concentration.

At the stages of V5, R3, and R8, the P content was determined in the shoot and root materials after digesting in a mixture of H2SO4 and H2O2 (30% v/v). P concentration was determined by the vanadomolybdate method [79].
Net photosynthesis (Pn) was measured at the middle part of the youngest expended leaf by using a Li6400 photosynthesis system (Li-COR, Lincoln, NE, USA). Measurement was conducted between 10:00 a.m. and 12:00 p.m. at the V5 and R3 stages.
Individual samples of leaves and roots were collected at about 18:00 in the afternoon of the sampling day, homogenized, and extracted with 80% ethanol. Sucrose was measured directly in the extract by the spectrophotometer DU-730 (Beck Man Coulter Inc., Brea, CA, USA), using resorcinol as the color reagent [80].
To measure the root auxin concentration, samples of root tips were collected. We removed the soil completely from the pot, put it into running water, and rinsed slowly until the root system was exposed, then washed it with deionized water. Finally, the 2 cm-long root tips were cut off with sterilized scissors and immediately preserved in liquid nitrogen, and then brought back to the laboratory for storage at −80 °C. Determination of IAA concentration in roots by an enzyme-linked immunosorbent assay (ELISA). The standard sample and antibody of auxin were provided by China Agricultural University.

4.2.4. Measurements of Root Morphology

At the V5 and R3 stages, the root samples were washed with deionized water. Before scanning, the soybean root samples were divided into primary root and lateral roots. (The primary root referred to the primary root of biology and the attached fine root, while the lateral root referred to the branches growing from the primary root and all the fine roots on the branches.) Then, the root samples were scanned using an Epson Perfection V700 Photo scanner (Nagano-ken, Japan). Images were analyzed using WinRHIZO (WinRHIZO Pro2004, Quebec, Canada) to calculate the root length and surface area.

4.2.5. Quantitative Real-Time PCR Analysis

Excised tissues (leaves and roots) were immediately frozen in liquid nitrogen and stored at −80 °C until gene expression analysis. Total RNA was extracted using a RNAisoTM Plus reagent (TaKaRa, Tokyo, Japan). The obtained RNA sample was treated with RNase-free DNase I, then MMLV-reverse transcriptase (Promega) was used to synthesize the first strand cDNA. Quantitative real time RT-PCR was performed using the SYBR Green PCR Master Mix (TaKaRa, Tokyo, Japan) in the QuantStudio 6 Flex real-time PCR detection system (Thermo Fisher Scientific, Waltham, MA, USA) with appropriate primers. Relative expression of genes compared to ACTIN was calculated using the ΔΔCt method [81].
The primers used to quantify gene expression were: GmACTIN, 5′-ATCTTGACTGAGCGTGGTTATTCC-3′ and 5′-GCTGGTCCTGGCTGTCTCC-3′; GmPHR25, 5′-AAAGGCCGACAAGAAAGAAACAGG-3′ and 5′-AACCACCGCTACAGCACCAGAAC-3′; GmEXPB2, 5′-TACCCTCCTCTTGTTTCAACCCT-3′ and 5′-AGCACCACCTTCACTACCGTCC-3′; GmYUCCA14, 5′-GATCTTCCATCCTTGGAGGC-3′ and 5-GCAACAGTATGCACTTGACCTTAC-3′; GmTIR1C, 5′-GGTGACAAGGCCCTTTTG-3′ and 5′-CTCACCGAGCAGGAGGAC-3′;

4.3. Statistical Analyses

The two-dimensional distribution of the root system in soil was simulated using the Surfer (Surfer 8.0, USA) software according to the root dry weight. The calculation of the root dry weight ratio of 0–15 cm soil layer (i.e., the proportion of root distributed in the upper 15 cm soil layer, RU15) was as follows:
R U 15 = r o o t   d r y   w e i g h t   i n   t h e   u p p e r   15   c m   s o i l t o t a l   r o o t   d r y   w e i g h t   × 100 %
The formula for calculating the apparent P fertilizer-use efficiency (PUE) was as follows:
PUE ( % ) = ( U f U 0 P f ) × 100
Among them, Uf represented the amount of P accumulation in the shoot of the P20 treatment, U0 represented the amount of P accumulation in the shoot of the P0 treatment, and Pf referred to the total amount of P fertilizer application.
The relationship between the standard curve auxin concentration and the measured OD value was fitted by the Logit equation:
Logit B B 0 = ln B / B 0 1 B / B 0 = ln B B 0 B
Among them, B0 was chromogenic value of 0 ng mL−1, while B was the chromogenic value of other concentrations. According to the logit of the chromogenic value, the natural logarithm of the hormone concentration (ng mL−1) can be found out from the graph, and then the hormone concentration (ng mL−1) can be calculated by the inverse number. After obtaining the auxin concentration of the samples, the auxin content of soybean root (ng g·fw−1) could be calculated according to the volume fraction of the whole extraction and dilution process and the weight of the sample.
The data were sorted in the Excel 2019 (Microsoft) software package and then the significant differences among means were separated according to LSD at the level of p ≤ 0.05 using a SPSS statistical software package (Version 19.0, SPSS Institute Inc., New York, NY, USA). All data were subjected to one-way ANOVA to assess the significant differences among the four treatments. The tables and figures were made by Excel 2019 and Origin 2020b.

5. Conclusions

Here, our results demonstrated that the increase in lateral root formation and soybean growth in variable light environments are, at least in part, mediated by increases in auxin level and root sensitivity. The ameliorated light during the solo-existing period increased the IAA concentration in inter-cropped soybean roots. Moreover, the inhibition of plant growth caused by shade during the common-growth period leads to growth-induced P deficiency during the reproductive stage, and subsequently, upregulates the auxin response. It was envisaged that the variable light condition (shade-light) mediated leaf P status and sucrose to regulate auxin synthesis and response, which resulted in more lateral root growth and shallower root distribution of soybeans in the relay strip inter-cropping system. This study enriches the theory of increasing production and efficiency of strip inter-cropping system, providing a reference for taking strip inter-cropping as an effective agro-ecological technology to efficiently manage farmland P resources and to maintain soil fertility.

Supplementary Materials

The following are available online at https://www.mdpi.com/2223-7747/9/9/1204/s1, Figure S1: The shoot P accumulation as affected by the P application and light condition in the pot experiment. Figure S2: Effect of cropping system on the root morphology and distribution; Table S1: The dry matter and shoot P accumulation (g m−2) of soybeans during the growth period as affected by P application and cropping system in the field experiment.

Author Contributions

Data curation, T.Z. and M.X.; formal analysis, L.W. and S.Q.; funding acquisition, W.L. and W.Y.; methodology, T.Z. and B.C.; project administration, W.Y.; resources, J.L. and S.L.; software, Y.D. and T.L.; supervision, W.L., and W.Y.; validation, Y.G.; writing—original draft, L.W. All authors have read and agreed to the published version of the manuscript.

Funding

This work was supported by the National Natural Science Foundation of China (31771728), and Sichuan Innovation Team Project of National Modern Agricultural Industry Technology System (SCCXTD-2020-20).

Conflicts of Interest

All authors have declared no conflict of interest. The submitted work was carried out in the absence of any personal, professional, or financial relationships.

References

  1. Zhang, W.; Ma, W.; Ji, Y.; Fan, M.; Oenema, O.; Zhang, F. Efficiency, economics, and environmental implications of phosphorus resource use and the fertilizer industry in China. Nutr. Cycl. Agroecosystems 2007, 80, 131–144. [Google Scholar] [CrossRef] [Green Version]
  2. Otani, T.; Ae, N. Phosphorus (P) uptake mechanisms of crops grown in soils with low P status. Soil Sci. Plant Nutr. 1996, 42, 155–163. [Google Scholar] [CrossRef]
  3. Zhang, F.; Chen, X.; Vitousek, P. Chinese agriculture: An experiment for the world. Nature 2013, 497, 1476–4687. [Google Scholar] [CrossRef] [PubMed]
  4. Zhang, F.; Shen, J.; Zhang, J.; Zuo, Y.; Li, L.; Chen, X. Rhizosphere Processes and Management for Improving Nutrient Use Efficiency and Crop Productivity. Adv. Agron. 2010, 107, 1–32. [Google Scholar] [CrossRef]
  5. Du, J.; Han, T.; Gai, J.-Y.; Yong, T.; Sun, X.; Wang, X.-C.; Yang, F.; Liu, J.; Shu, K.; Liu, W.-G.; et al. Maize-soybean strip intercropping: Achieved a balance between high productivity and sustainability. J. Integr. Agric. 2018, 17, 747–754. [Google Scholar] [CrossRef] [Green Version]
  6. Liu, X.; Rahman, T.; Song, C.; Yang, F.; Su, B.; Cui, L.; Bu, W.; Yang, W.-Y. Relationships among light distribution, radiation use efficiency and land equivalent ratio in maize-soybean strip intercropping. Field Crop. Res. 2018, 224, 91–101. [Google Scholar] [CrossRef]
  7. Xia, H.; Wang, Z.-G.; Zhao, J.-H.; Sun, J.-H.; Bao, X.-G.; Christie, P.; Zhang, F.; Li, L. Contribution of interspecific interactions and phosphorus application to sustainable and productive intercropping systems. Field Crop. Res. 2013, 154, 53–64. [Google Scholar] [CrossRef]
  8. Zhang, L.; Spiertz, H.; Zhang, S.; Li, B.; Van Der Werf, W. Nitrogen economy in relay intercropping systems of wheat and cotton. Plant Soil 2007, 303, 55–68. [Google Scholar] [CrossRef] [Green Version]
  9. Brooker, R.W.; Bennett, A.E.; Cong, W.; Daniell, T.J.; George, T.S.; Hallett, P.; Hawes, C.; Iannetta, P.P.M.; Jones, H.G.; Karley, A.J.; et al. Improving intercropping: A synthesis of research in agronomy, plant physiology and ecology. New Phytol. 2014, 206, 107–117. [Google Scholar] [CrossRef]
  10. Li, L.; Tilman, D.; Lambers, H.; Zhang, F. Plant diversity and overyielding: Insights from belowground facilitation of intercropping in agriculture. New Phytol. 2014, 203, 63–69. [Google Scholar] [CrossRef]
  11. Hinsinger, P.; Betencourt, E.; Bernard, L.; Brauman, A.; Plassard, C.; Shen, J.; Tang, X.; Zhang, F. P for Two, Sharing a Scarce Resource: Soil Phosphorus Acquisition in the Rhizosphere of Intercropped Species. Plant Physiol. 2011, 156, 1078–1086. [Google Scholar] [CrossRef] [PubMed] [Green Version]
  12. Li, Y.F.; Luo, A.C.; Wei, X.H.; Yao, X.G. Genotypic variation of rice in phosphorus acquisition from iron phosphate: Contributions of root morphology and phosphorus uptake kinetics. Russ. J. Plant Physiol. 2007, 54, 230–236. [Google Scholar] [CrossRef]
  13. Zhang, D.; Zhang, C.; Tang, X.; Li, H.; Zhang, F.; Rengel, Z.; Whalley, W.R.; Davies, W.J.; Shen, J. Increased soil phosphorus availability induced by faba bean root exudation stimulates root growth and phosphorus uptake in neighbouring maize. New Phytol. 2015, 209, 823–831. [Google Scholar] [CrossRef] [PubMed] [Green Version]
  14. Zhang, C.; Postma, J.A.; York, L.M.; Lynch, J.P. Root foraging elicits niche complementarity-dependent yield advantage in the ancient ‘three sisters’ (maize/bean/squash) polyculture. Ann. Bot. 2014, 114, 1719–1733. [Google Scholar] [CrossRef] [Green Version]
  15. Tang, X.; Bernard, L.; Brauman, A.; Daufresne, T.; Deleporte, P.; Desclaux, D.; Souche, G.; Placella, S.A.; Hinsinger, P. Increase in microbial biomass and phosphorus availability in the rhizosphere of intercropped cereal and legumes under field conditions. Soil Boil. Biochem. 2014, 75, 86–93. [Google Scholar] [CrossRef]
  16. Tang, X.; Placella, S.A.; Daydé, F.; Bernard, L.; Robin, A.; Journet, E.; Justes, É.; Hinsinger, P. Phosphorus availability and microbial community in the rhizosphere of intercropped cereal and legume along a P-fertilizer gradient. Plant Soil 2016, 407, 119–134. [Google Scholar] [CrossRef]
  17. Li, C.; Hoffland, E.; Kuyper, T.W.; Yu, Y.; Li, H.; Zhang, C.; Zhang, F.; Van Der Werf, W. Yield gain, complementarity and competitive dominance in intercropping in China: A meta-analysis of drivers of yield gain using additive partitioning. Eur. J. Agron. 2020, 113, 125987. [Google Scholar] [CrossRef]
  18. Zhou, T.; Wang, L.; Yang, H.; Gao, Y.; Liu, W.; Yang, W.-Y. Ameliorated light conditions increase the P uptake capability of soybean in a relay-strip intercropping system by altering root morphology and physiology in the areas with low solar radiation. Sci. Total. Environ. 2019, 688, 1069–1080. [Google Scholar] [CrossRef]
  19. Li, L.; Li, S.-M.; Sun, J.-H.; Zhou, L.-L.; Bao, X.-G.; Zhang, H.-G.; Zhang, F. Diversity enhances agricultural productivity via rhizosphere phosphorus facilitation on phosphorus-deficient soils. Proc. Natl. Acad. Sci. USA 2007, 104, 11192–11196. [Google Scholar] [CrossRef] [Green Version]
  20. Li, L.; Tang, C.; Rengel, Z.; Zhang, F. Chickpea facilitates phosphorus uptake by intercropped wheat from an organic phosphorus source. Plant Soil 2003, 248, 297–303. [Google Scholar] [CrossRef]
  21. Li, L.; Zhang, F.; Li, X.; Christie, P.; Sun, J.; Yang, S.; Tang, C. Interspecific facilitation of nutrient uptake by intercropped maize and faba bean. Nutr. Cycl. Agroecosystems 2003, 65, 61–71. [Google Scholar] [CrossRef]
  22. Callaway, R.M. Positive Interactions and Interdependence in Plant Communities; Springer Science and Business Media LLC: Berlin, Germany, 2007. [Google Scholar]
  23. Yang, F.; Liao, D.; Wu, X.; Gao, R.; Fan, Y.; Raza, M.A.; Wang, X.; Yong, T.; Liu, W.; Liu, J.; et al. Effect of aboveground and belowground interactions on the intercrop yields in maize-soybean relay intercropping systems. Field Crop. Res. 2017, 203, 16–23. [Google Scholar] [CrossRef]
  24. Bin Chen, X.; Yao, Q.; Gao, X.; Jiang, C.; Harberd, N.P.; Fu, X. Shoot-to-Root Mobile Transcription Factor HY5 Coordinates Plant Carbon and Nitrogen Acquisition. Curr. Boil. 2016, 26, 640–646. [Google Scholar] [CrossRef] [PubMed]
  25. Dyachok, J.; Zhu, L.; Liao, F.; He, J.; Huq, E.; Blancaflor, E.B. SCAR Mediates Light-Induced Root Elongation in Arabidopsis through Photoreceptors and Proteasomes. Plant Cell 2011, 23, 3610–3626. [Google Scholar] [CrossRef] [PubMed] [Green Version]
  26. Correll, M.; Kiss, J.Z. The Roles of Phytochromes in Elongation and Gravitropism of Roots. Plant Cell Physiol. 2005, 46, 317–323. [Google Scholar] [CrossRef] [Green Version]
  27. Lee, H.-J.; Park, Y.-J.; Ha, J.-H.; Baldwin, I.T.; Park, C.-M. Multiple Routes of Light Signaling during Root Photomorphogenesis. Trends Plant Sci. 2017, 22, 803–812. [Google Scholar] [CrossRef]
  28. Nagel, K.A.; Schurr, U.; Walter, A. Dynamics of root growth stimulation in Nicotiana tabacum in increasing light intensity. Plant Cell Environ. 2006, 29, 1936–1945. [Google Scholar] [CrossRef]
  29. Kircher, S.; Schopfer, P. Photosynthetic sucrose acts as cotyledon-derived long-distance signal to control root growth during early seedling development in Arabidopsis. Proc. Natl. Acad. Sci. USA 2012, 109, 11217–11221. [Google Scholar] [CrossRef] [Green Version]
  30. Müller, R.; Morant, M.; Jarmer, H.; Nilsson, L.; Nielsen, T.H. Genome-Wide Analysis of the Arabidopsis Leaf Transcriptome Reveals Interaction of Phosphate and Sugar Metabolism. Plant Physiol. 2006, 143, 156–171. [Google Scholar] [CrossRef] [Green Version]
  31. Saini, S.; Sharma, I.; Kaur, N.; Pati, P.K. Auxin: A master regulator in plant root development. Plant Cell Rep. 2013, 32, 741–757. [Google Scholar] [CrossRef]
  32. Dubrovsky, J.G.; Sauer, M.; Napsucialy-Mendivil, S.; Ivanchenko, M.G.; Friml, J.; Shishkova, S.; Celenza, J.; Benková, E. Auxin acts as a local morphogenetic trigger to specify lateral root founder cells. Proc. Natl. Acad. Sci. USA 2008, 105, 8790–8794. [Google Scholar] [CrossRef] [Green Version]
  33. Zhao, Y. Auxin Biosynthesis and Its Role in Plant Development. Annu. Rev. Plant Boil. 2010, 61, 49–64. [Google Scholar] [CrossRef] [Green Version]
  34. Van Gelderen, K.; Kang, C.; Pierik, R. Light Signaling, Root Development, and Plasticity. Plant Physiol. 2017, 176, 1049–1060. [Google Scholar] [CrossRef] [PubMed] [Green Version]
  35. Xu, D.; Jiang, Y.; Li, J.; Lin, F.; Holm, M.; Deng, X.W. BBX21, an Arabidopsis B-box protein, directly activates HY5 and is targeted by COP1 for 26S proteasome-mediated degradation. In Proceedings of the Proceedings of the National Academy of Sciences. Proc. Natl. Acad. Sci. USA 2016, 113, 7655–7660. [Google Scholar] [CrossRef] [PubMed] [Green Version]
  36. Hiltbrunner, A. Light-Activated Phytochrome A and B Interact with Members of the SPA Family to Promote Photomorphogenesis in Arabidopsis by Reorganizing the COP1/SPA Complex. Plant Cell 2015, 27, 189–201. [Google Scholar]
  37. Gangappa, S.N.; Botto, J.F. The Multifaceted Roles of HY5 in Plant Growth and Development. Mol. Plant 2016, 9, 1353–1365. [Google Scholar] [CrossRef] [PubMed] [Green Version]
  38. Sassi, M.; Lu, Y.; Zhang, Y.; Wang, J.; Dhonukshe, P.; Blilou, I.; Dai, M.; Li, J.; Gong, X.; Jaillais, Y.; et al. COP1 mediates the coordination of root and shoot growth by light through modulation of PIN1- and PIN2-dependent auxin transport in Arabidopsis. Development 2012, 139, 3402–3412. [Google Scholar] [CrossRef] [Green Version]
  39. Feng, L.; Raza, M.A.; Chen, Y.; Bin Khalid, M.H.; Meraj, T.A.; Ahsan, F.; Fan, Y.; Du, J.; Wu, X.; Song, C.; et al. Narrow-wide row planting pattern improves the light environment and seed yields of intercrop species in relay intercropping system. PLoS ONE 2019, 14, e0212885. [Google Scholar] [CrossRef]
  40. Coll, L.; Cerrudo, A.; Rizzalli, R.; Monzon, J.; Andrade, F.H. Capture and use of water and radiation in summer intercrops in the south-east Pampas of Argentina. Field Crop. Res. 2012, 134, 105–113. [Google Scholar] [CrossRef]
  41. Zhou, T.; Xu, K.; Wang, K.; Huang, W.; Zhang, C.; Chen, Y. Effect of phosphate fertilizer on the improvement of yieldand nutrient use efficiency of soybean in wheat-soybean and wheat/maize/soybean systems. J. Plant Nutr. Fertil. 2015, 21, 336–345. [Google Scholar]
  42. Wu, Y.; Gong, W.; Yang, F.; Wang, X.; Yong, T.; Yang, W. Responses to shade and subsequent recovery of soya bean in maize-soya bean relay strip intercropping. Plant Prod. Sci. 2016, 19, 206–214. [Google Scholar] [CrossRef] [Green Version]
  43. Osmont, K.S.; Sibout, R.; Hardtke, C.S. Hidden Branches: Developments in Root System Architecture. Annu. Rev. Plant Boil. 2007, 58, 93–113. [Google Scholar] [CrossRef] [PubMed]
  44. Overvoorde, P.; Fukaki, H.; Beeckman, T. Auxin Control of Root Development. Cold Spring Harb. Perspect. Boil. 2010, 2, a001537. [Google Scholar] [CrossRef] [PubMed] [Green Version]
  45. Wang, Y.; Liu, H.; Wang, S.; Li, H. Genome-wide identification and expression analysis of the YUCCA gene family in soybean (Glycine max L.). Plant Growth Regul. 2016, 81, 265–275. [Google Scholar] [CrossRef]
  46. Wang, Y.; Yang, W.; Zuo, Y.; Zhu, L.; Hastwell, A.H.; Chen, L.; Tian, Y.; Su, C.; Ferguson, B.J.; Li, X. GmYUC2a mediates auxin biosynthesis during root development and nodulation in soybean. J. Exp. Bot. 2019, 70, 3165–3176. [Google Scholar] [CrossRef]
  47. Lynch, J.P. Root phenotypes for improved nutrient capture: An underexploited opportunity for global agriculture. New Phytol. 2019, 223, 548–564. [Google Scholar] [CrossRef] [Green Version]
  48. López-Bucio, J.; Hernández-Abreu, E.; Sánchez-Calderón, L.; Nieto-Jacobo, M.F.; Simpson, J.; Herrera-Estrella, L. Phosphate Availability Alters Architecture and Causes Changes in Hormone Sensitivity in the Arabidopsis Root System. Plant Physiol. 2002, 129, 244–256. [Google Scholar] [CrossRef] [Green Version]
  49. Hebert, Y.; Guingo, E.; Loudet, O. The Response of Root/Shoot Partitioning and Root Morphology to Light Reduction in Maize Genotypes. Crop. Sci. 2001, 41, 363–371. [Google Scholar] [CrossRef]
  50. Wissuwa, M.; Gamat, G.; Ismail, A.M. Is root growth under phosphorus deficiency affected by source or sink limitations? J. Exp. Bot. 2005, 56, 1943–1950. [Google Scholar] [CrossRef] [Green Version]
  51. Hammond, J.P.; White, P.J. Sucrose transport in the phloem: Integrating root responses to phosphorus starvation. J. Exp. Bot. 2007, 59, 93–109. [Google Scholar] [CrossRef]
  52. Cheng, L.; Tang, X.; Vance, C.P.; White, P.J.; Zhang, F.; Shen, J. Interactions between light intensity and phosphorus nutrition affect the phosphate-mining capacity of white lupin (Lupinus albus L.). J. Exp. Bot. 2014, 65, 2995–3003. [Google Scholar] [CrossRef] [PubMed] [Green Version]
  53. Yang, F.; Huang, S.; Gao, R.; Liu, W.; Yong, T.; Wang, X.; Wu, X.; Yang, W. Growth of soybean seedlings in relay strip intercropping systems in relation to light quantity and red:far-red ratio. Field Crop. Res. 2014, 155, 245–253. [Google Scholar] [CrossRef]
  54. Fan, Y.; Chen, J.; Cheng, Y.; Raza, M.A.; Wu, X.; Wang, Z.; Liu, Q.; Wang, R.; Wang, X.; Yong, T.; et al. Effect of shading and light recovery on the growth, leaf structure, and photosynthetic performance of soybean in a maize-soybean relay-strip intercropping system. PLoS ONE 2018, 13, e0198159. [Google Scholar] [CrossRef] [PubMed]
  55. Lynch, J.P.; Brown, K.M. Topsoil foraging—An architectural adaptation of plants to low phosphorus availability. Plant Soil 2001, 237, 225–237. [Google Scholar] [CrossRef]
  56. Jain, A.; Poling, M.D.; Karthikeyan, A.S.; Blakeslee, J.J.; Peer, W.A.; Titapiwatanakun, B.; Murphy, A.S.; Raghothama, K.G. Differential Effects of Sucrose and Auxin on Localized Phosphate Deficiency-Induced Modulation of Different Traits of Root System Architecture in Arabidopsis. Plant Physiol. 2007, 144, 232–247. [Google Scholar] [CrossRef] [Green Version]
  57. Nacry, P.; Canivenc, G.; Muller, B.; Azmi, A.; Van Onckelen, H.; Rossignol, M.; Doumas, P. A Role for Auxin Redistribution in the Responses of the Root System Architecture to Phosphate Starvation in Arabidopsis1. Plant Physiol. 2005, 138, 2061–2074. [Google Scholar] [CrossRef] [Green Version]
  58. Pérez-Torres, C.-A.; López-Bucio, J.; Cruz-Ramírez, A.; Ibarra-Laclette, E.; Dharmasiri, S.; Estelle, M.; Herrera-Estrella, L. Phosphate Availability Alters Lateral Root Development in Arabidopsis by Modulating Auxin Sensitivity via a Mechanism Involving the TIR1 Auxin Receptor. Plant Cell 2008, 20, 3258–3272. [Google Scholar] [CrossRef] [Green Version]
  59. Bou-Torrent, J.; Galstyan, A.; Gallemi, M.; Cifuentes-Esquivel, N.; Molina-Contreras, M.J.; Salla-Martret, M.; Jikumaru, Y.; Yamaguchi, S.; Kamiya, Y.; Martinez-Garcia, J.F. Plant proximity perception dynamically modulates hormone levels and sensitivity in Arabidopsis. J. Exp. Bot. 2014, 65, 2937–2947. [Google Scholar] [CrossRef] [Green Version]
  60. De Wit, M.; Ljung, K.; Fankhauser, C. Contrasting growth responses in lamina and petiole during neighbor detection depend on differential auxin responsiveness rather than different auxin levels. New Phytol. 2015, 208, 198–209. [Google Scholar] [CrossRef] [Green Version]
  61. Pucciariello, O.; Legris, M.; Rojas, C.C.R.; Iglesias, M.J.; Hernando, C.E.; Dezar, C.; Vázquez, M.; Yanovsky, M.J.; Finlayson, S.A.; Prat, S.; et al. Rewiring of auxin signaling under persistent shade. Proc. Natl. Acad. Sci. USA 2018, 115, 5612–5617. [Google Scholar] [CrossRef] [Green Version]
  62. Hersch, M.; Lorrain, S.; De Wit, M.; Trevisan, M.; Ljung, K.; Bergman, S.; Fankhauser, C. Light intensity modulates the regulatory network of the shade avoidance response in Arabidopsis. Proc. Natl. Acad. Sci. USA 2014, 111, 6515–6520. [Google Scholar] [CrossRef] [Green Version]
  63. Mitchell, R.L.; Russell, W.J. Root Development and Rooting Patterns of Soybean (Glycine max (L.) Merrill) Evaluated Under Field Conditions1. Agron. J. 1907, 63, 313–316. [Google Scholar] [CrossRef]
  64. Ticconi, C.A.; Delatorre, C.A.; Lahner, B.; Salt, D.E.; Abel, S. Arabidopsis pdr2 reveals a phosphate-sensitive checkpoint in root development. Plant J. 2004, 37, 801–814. [Google Scholar] [CrossRef] [PubMed]
  65. Sánchez-Calderón, L.; López-Bucio, J.; Chacón-López, A.; Cruz-Ramirez, L.A.; Nieto-Jacobo, F.; Dubrovsky, J.G.; Herrera-Estrella, L.R.; Cruz-Ramirez, L.A. Phosphate Starvation Induces a Determinate Developmental Program in the Roots of Arabidopsis thaliana. Plant Cell Physiol. 2005, 46, 174–184. [Google Scholar] [CrossRef] [PubMed]
  66. Svistoonoff, S.; Creff, A.; Reymond, M.; Sigoillot-Claude, C.; Ricaud, L.; Blanchet, A.; Nussaume, L.; Desnos, T. Root tip contact with low-phosphate media reprograms plant root architecture. Nat. Genet. 2007, 39, 792–796. [Google Scholar] [CrossRef] [PubMed] [Green Version]
  67. Ljung, K.; Nemhauser, J.L.; Perata, P. New mechanistic links between sugar and hormone signalling networks. Curr. Opin. Plant Boil. 2015, 25, 130–137. [Google Scholar] [CrossRef]
  68. Ruan, Y. Sucrose Metabolism: Gateway to Diverse Carbon Use and Sugar Signaling. Annu. Rev. Plant Boil. 2014, 65, 33–67. [Google Scholar] [CrossRef]
  69. Lynch, J.P.; Beebe, S.E. Adaptation of beans (Phaseolus vulganis L.) to low phosphorus availity. Hortience 1995, 30, 1165–1171. [Google Scholar]
  70. Strock, C.F.; De La Riva, L.M.; Lynch, J.P. Reduction in Root Secondary Growth as a Strategy for Phosphorus Acquisition. Plant Physiol. 2017, 176, 691–703. [Google Scholar] [CrossRef] [Green Version]
  71. Torrey, J.G. The induction of lateral roots by indoleacetic acid and root decapitation. Am. J. Bot. 1950, 37, 257–264. [Google Scholar] [CrossRef]
  72. Ge, Z.; Rubio, G.; Lynch, J.P. The importance of root gravitropism for inter-root competition and phosphorus acquisition efficiency: Results from a geometric simulation model. Plant Soil 2000, 218, 159–171. [Google Scholar] [CrossRef] [PubMed]
  73. Miller, C.R.; Ochoa, I.; Nielsen, K.L.; Beck, D.; Lynch, J.P. Genetic variation for adventitious rooting in response to low phosphorus availability: Potential utility for phosphorusacquisition from stratified soils. Funct. Plant Boil. 2003, 30, 973–985. [Google Scholar] [CrossRef] [Green Version]
  74. Rangarajan, H.; Postma, J.A.; Lynch, J.P. Co-optimization of axial root phenotypes for nitrogen and phosphorus acquisition in common bean. Ann. Bot. 2018, 122, 485–499. [Google Scholar] [CrossRef] [PubMed]
  75. Chiou, T.-J.; Lin, S.-I. Signaling Network in Sensing Phosphate Availability in Plants. Annu. Rev. Plant Boil. 2011, 62, 185–206. [Google Scholar] [CrossRef] [PubMed] [Green Version]
  76. Zhang, Z.; Liao, H.; Lucas, W.J. Molecular mechanisms underlying phosphate sensing, signaling, and adaptation in plants. J. Integr. Plant Boil. 2014, 56, 192–220. [Google Scholar] [CrossRef]
  77. Zhou, T.; Wang, L.; Sun, X.; Wang, X.; Chen, Y.; Rengel, Z.; Liu, W.; Yang, W. Light intensity influence maize adaptation to low P stress by altering root morphology. Plant Soil 2019, 447, 183–197. [Google Scholar] [CrossRef]
  78. Wang, H.; Inukai, Y.; Yamauchi, A. Root Development and Nutrient Uptake. Crit. Rev. Plant Sci. 2006, 25, 279–301. [Google Scholar] [CrossRef]
  79. Page, A.L.; Miller, R.H.; Keeney, D.R. Methods of soil analysis. Am. Soc. Agron. 1982, 15, 99–100. [Google Scholar]
  80. Shi, H.; Wang, B.; Yang, P.; Li, Y.; Miao, F. Differences in Sugar Accumulation and Mobilization between Sequential and Non-Sequential Senescence Wheat Cultivars under Natural and Drought Conditions. PLoS ONE 2016, 11, e0166155. [Google Scholar] [CrossRef]
  81. Schmittgen, T.D.; Livak, K.J. Analyzing real-time PCR data by the comparative CT method. Nat. Protoc. 2008, 3, 1101–1108. [Google Scholar] [CrossRef]
Figure 1. The effect of P (Phosphorus) application and cropping system on soybean (A) grain yield, (B) biomass, (C) shoot P content, and (D) PUE (P fertilizer-use efficiency) in the field experiment from 2016 to 2019. IP0: soybean was grown in inter-cropping without P application; MP0: soybean was grown in monocropping without P application; IP20: soybean was grown in inter-cropping with 20 kg P ha−1 application; MP20: soybean was grown in monocropping with 20 kg P ha−1 application; ** means the difference between treatment was significant (p ≤ 0.01) by “t” test; * means the difference between treatment was significant (p ≤ 0.05) by “t” test; ns means no difference.
Plants 09 01204 g001
Figure 2. The effect of P application and cropping system on a two-dimensional distribution of soybean roots [g (5 dm−3)] in the top 60 cm of the soil profile at the R3 stage in the field experiment. Plants were grown in the inter-cropping (Inter.) and monocropping (Mono.) systems with two P application rates (P0 = 0 P application; P20 = 20 kg P ha−1 application). Values represent the mean of three replicates ± SE. Different letters on the columns are used to indicate means that differ significantly by LSD (p ≤ 0.05).
Plants 09 01204 g002
Figure 3. The effect of P application and light condition on (A) total root length, (B) total root surface at the V5 stage (Five trifoliolates unroll), the (C) primary root length, (D) lateral root length, (E) primary root surface, and (F) lateral root surface at the R3 stage (Pods are about 5 mm long on one of the four uppermost nodes on the main stem with a fully developed leaf) in the pot experiment. Plants were grown in two light conditions (SL: shade from sowing to the V5 stage and from V5 to R8 (95% of pods reach mature pod color) under natural light condition; LS: from sowing to the V5 stage under natural light condition and shade from V5 to R8) and two P application treatments (P0 = without P application; P100 = 100 mg P kg−1soil application). Values represent the mean of three replicates ± SE. Different letters on the columns are used to indicate means that differ significantly by LSD (p ≤ 0.05).
Plants 09 01204 g003
Figure 4. The effect of P application and light condition on the expression of gene GmEXPB2 in roots ((A): V5 stage, (B): R3 stage) in the pot experiment. Plants were grown in two light conditions (SL: shade from sowing to the V5 stage and from V5 to R8 under natural light condition; LS: from sowing to the V5 stage under natural light condition and shade from V5 to R8) and two P application treatments (P0 = without P application; P100 = 100 mg P kg−1soil application). Values represent the mean of three replicates ± SE. Different letters on the columns are used to indicate means that differ significantly by LSD (p ≤ 0.05). For GmEXPB2 expression, data are expressed as relative values based on the expression of GmEXPB2 in roots of soybean grown under the treatment of SL-P100 at V5 stage referenced as 1.0.
Plants 09 01204 g004
Figure 5. The effect of P application and light condition on net photosynthesis of the youngest fully expanded leaf ((A): V5 stage, (B): R3 stage) and (C) the whole plant Pn (Photosynthesis) was measured from the leaves situated lowest on the main stem to the highest (counted for 20 trifoliate leaves in soybean at R3 stage) in the pot experiment. Plants were grown in two light conditions (SL: shade from sowing to the V5 stage and from V5 to R8 under natural light condition; LS: from sowing to the V5 stage under natural light condition and shade from V5 to R8) and two P application treatments (P0 = without P application; P100 = 100 mg P kg−1soil application). Values represent the mean of three replicates ± SE. Different letters on the columns are used to indicate means that differ significantly by LSD (p ≤ 0.05).
Plants 09 01204 g005
Figure 6. The effect of P application and light condition on the leaf sucrose concentration ((A): V5 stage, (B): R3 stage), root sucrose concentration ((C): V5 stage, (D): R3 stage) in the field experiment. Plants were grown in two light conditions (SL: shade from sowing to the V5 stage and from V5 to R8 under natural light condition; LS: from sowing to the V5 stage under natural light condition and shade from V5 to R8) and two P application treatments (P0 = without P application; P100 = 100 mg P kg−1soil application). Values represent the mean of three replicates ± SE. Different letters on the columns are used to indicate means that differ significantly by LSD (p ≤ 0.05).
Plants 09 01204 g006
Figure 7. The effect of P application and light condition on the leaf P concentration ((A): V5 stage, (B): R3 stage), and the expression of gene GmPHR25 in leaf ((C): V5 stage, (D): R3 stage) in the pot experiment. Plants were grown in two light conditions (SL: shade from sowing to the V5 stage and from V5 to R8 under natural light condition; LS: from sowing to the V5 stage under natural light condition and shade from V5 to R8) and two P application treatments (P0 = without P application; P100 = 100 mg P kg−1soil application). Values represent the mean of three replicates ± SE. Different letters on the columns are used to indicate means that differ significantly by LSD (p ≤ 0.05). For GmPHR25 expression, data are expressed as relative values based on the expression of GmPHR25 in roots of soybean grown under the treatment of SL-P100 at the V5 stage, referenced as 1.0.
Plants 09 01204 g007
Figure 8. The effect of P application and light condition on the IAA concentration ((A): V5 stage, (B): R3 stage), and the expression of gene GmYUCCA14 ((C): V5 stage, (D): R3 stage), GmTIR1C ((E): V5 stage, (F): R3 stage) in the pot experiment. Plants were grown in two light conditions (SL: shade from sowing to the V5 stage and from V5 to R8 under natural light condition; LS: from sowing to the V5 stage under natural light condition and shade from V5 to R8) and two P application treatments (P0 = without P application; P100 = 100 mg P kg−1soil application). Values represent the mean of three replicates ± SE. Different letters on the columns are used to indicate means that differ significantly by LSD (p ≤ 0.05). For GmYUCCA14 and GmTIR1C expressions, data are expressed as relative values based on the expression of GmYUCCA14 and GmTIR1C in roots of soybean grown under the treatments of SL-P100 and SL-P100 at V5 stage referenced as 1.0, respectively.
Plants 09 01204 g008
Figure 9. The 10-day precipitation, mean daily temperature, and sunshine hours during soybean growth season in 2016, 2017, 2018, and 2019.
Plants 09 01204 g009

