Effect of Animal ByProducts Fertilization on Durum Wheat in Mediterranean Conditions: Preliminary Results


Abstract
1. Introduction
2. Results
3. Discussion
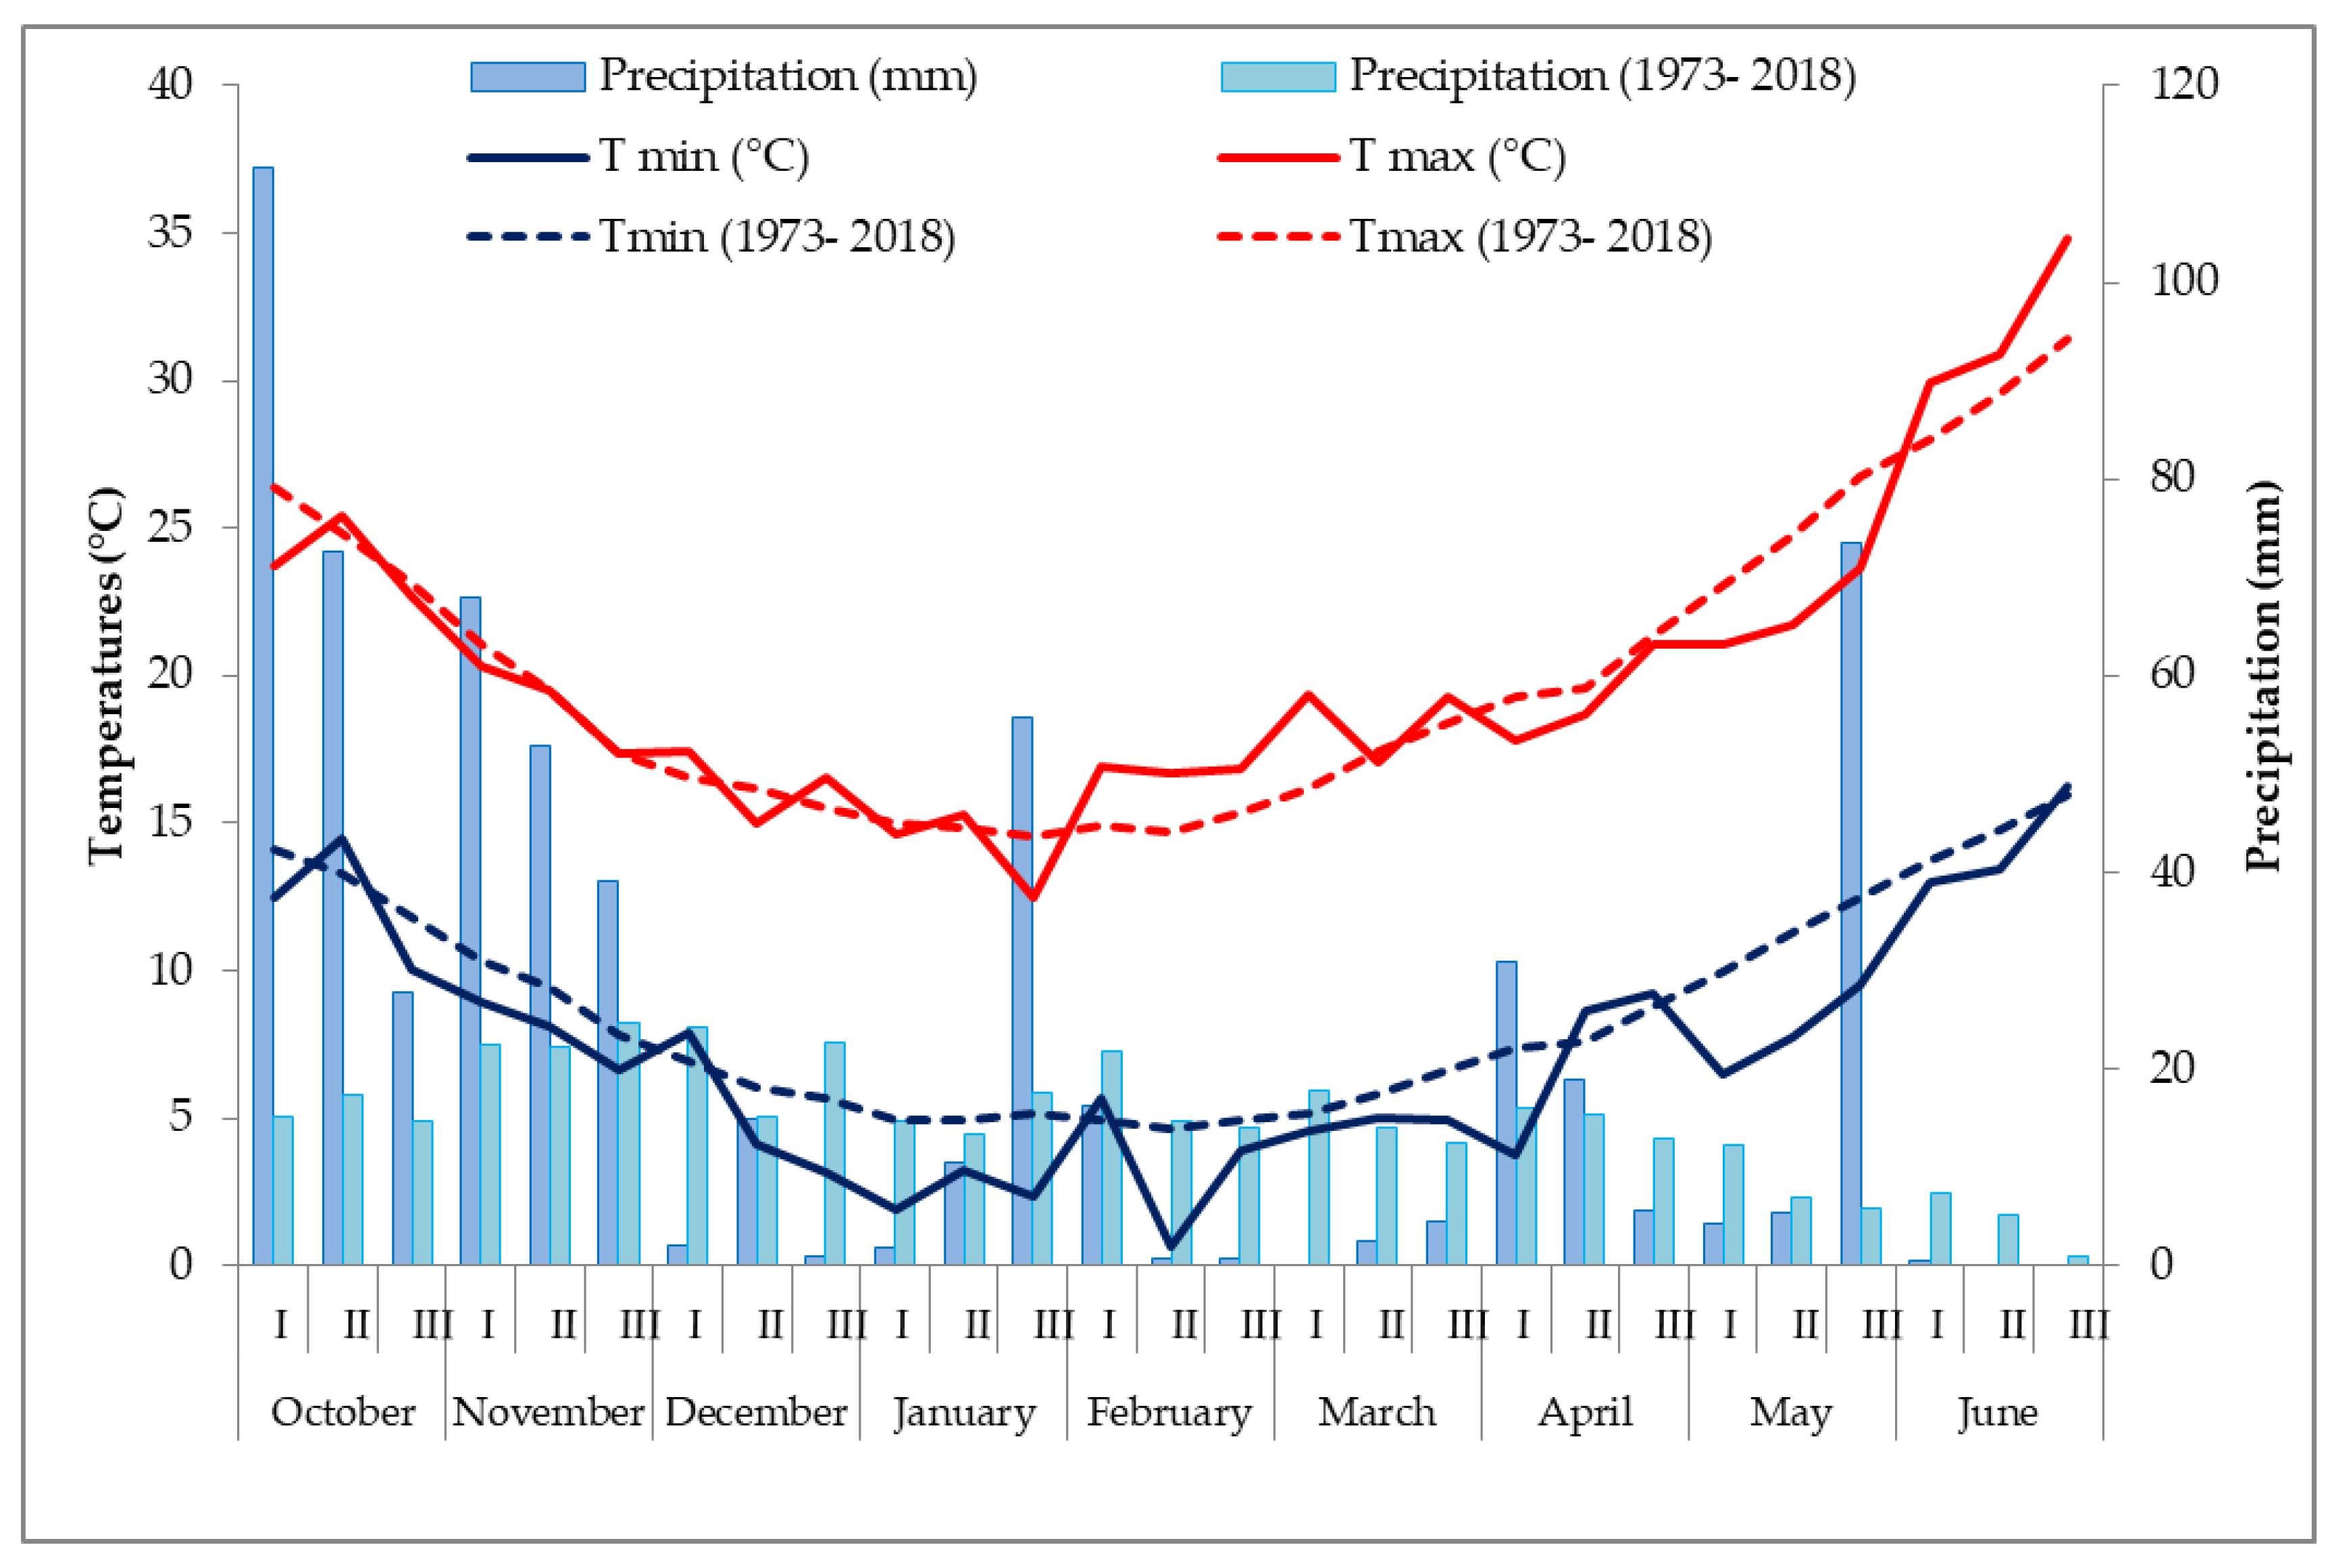
4. Materials and Methods
5. Conclusions
Author Contributions
Funding
Acknowledgments
Conflicts of Interest
References
- Mbow, C.; Rosenzweig, C.; Barioni, L.G.; Benton, T.G.; Herrero, M.; Krishnapillai, M.; Liwenga, E.; Pradhan, P.; Rivera-Ferre, M.G.; Sapkota, T.; et al. Food security. In Climate Change and Land: An IPCC Special Report on Climate Change, Desertification, Land Degradation, Sustainable Land Management, Food Security, and Greenhouse Gas Fluxes in Terrestrial Ecosystems; Shukla, P.R., Skea, J., Calvo Buendia, E., Masson-Delmotte, V., Pörtner, H.O., Roberts, D.C., Zhai, P., Slade, R., Connors, S., van Diemen, R., et al., Eds.; 2019; in press. [Google Scholar]
- FAO. The Future of Food and Agriculture: Alternative Pathways to 2050; Food and Agriculture Organization of the United Nations: Rome, Italy, 2018; p. 228. [Google Scholar]
- UNCCD. Elaboration of an International Convention to Combat Desertification in Countries Experiencing Serious Drought and/or Desertification, Particularly in Africa; General Assembly, United Nations: Paris, France, 1994; pp. 1–58. [Google Scholar]
- Plaza, C.; Zaccone, C.; Sawicka, K.; Méndez, A.M.; Tarquis, A.; Gascó, G.; Heuvelink, G.B.M.; Schuur, E.A.G.; Maestre, F.T. Soil resources and element stocks in drylands to face global issues. Sci. Rep. 2018, 8, 13788. [Google Scholar] [CrossRef] [PubMed]
- Iizumi, T.; Shiogama, H.; Imada, Y.; Hanasaki, N.; Takikawa, H.; Nishimori, N. Crop production losses associated with anthropogenic climate change for 1981–2010 compared with preindustrial levels. Int. J. Climatol. 2018, 38, 5405–5417. [Google Scholar] [CrossRef]
- Moore, F.C.; Lobell, D.B. The fingerprint of climate trends on European crop yields. Proc. Natl. Acad. Sci. USA 2018, 9, 2670–2675. [Google Scholar] [CrossRef] [PubMed]
- Asseng, S.; Ewert, F.; Martre, P.; Rötter, R.P.; Lobell, D.B.; Cammarano, D.; Kimball, B.A.; Ottman, M.J.; Wall, G.W.; White, J.W.; et al. Rising temperatures reduce global wheat production. Nat. Clim. Chang. 2015, 5, 143–147. [Google Scholar] [CrossRef]
- Liu, B.; Asseng, S.; Müller, C.; Ewert, F.; Elliott, J.; Lobell, D.B.; Martre, P.; Ruane, A.C.; Wallach, D.; Jones, J.W.; et al. Similar estimates of temperature impacts on global wheat yield by three independent methods. Nat. Clim. Chang. 2016, 6, 1130–1136. [Google Scholar] [CrossRef]
- Dettori, M.; Cesaraccio, C.; Duce, P. Simulation of climate change impacts on production and phenology of durum wheat in Mediterranean environments using CERES-Wheat model. Field Crop. Res. 2017, 206, 43–53. [Google Scholar] [CrossRef]
- Reed, M.S.; Stringer, L. Land Degradation, Desertification and Climate Change: Anticipating, Assessing and Adapting to Future Change; Routledge: New York, NY, USA, 2016; p. 178. [Google Scholar]
- Alessandri, A.; De Felice, M.; Zeng, N.; Mariotti, A.; Pan, Y.; Cherchi, A.; Lee, J.Y.; Wang, B.; Ha, K.J.; Ruti, P.; et al. Robust assessment of the expansion and retreat of Mediterranean climate in the 21st century. Sci. Rep. 2014, 4, 7211. [Google Scholar] [CrossRef]
- Polade, S.D.; Gershunov, A.; Cayan, D.R.; Dettinger, M.D.; Pierce, D.W. Precipitation in a warming world: Assessing projected hydro-climate changes in California and other Mediterranean climate regions. Sci. Rep. 2017, 7, 10783. [Google Scholar] [CrossRef]
- Giordani, C.; Zanchi, C. Elementi di Conservazione del Suolo; Patron Editore: Bologna, Italy, 1995; pp. 1–260. [Google Scholar]
- Lal, R. Soil Carbon Sequestration Impacts on Global Climate Change and Food Security. Science 2004, 304, 1623–1627. [Google Scholar] [CrossRef]
- Tilman, D.; Balzer, C.; Hill, J.; Befort, B.L. Global food demand and the sustainable intensification of Agriculture. Proc. Natl. Acad. Sci. USA 2011, 108, 20260–20264. [Google Scholar] [CrossRef]
- Smith, P.; Bustamante, M.; Ahammad, H.; Clark, H.; Dong, H.; Elsiddig, E.A.; Haberl, H.; Harper, R.; House, J.; Jafari, M.; et al. Agriculture, Forestry and other land use (AFOLU). In Climate Change 2014: Mitigation of Climate Change. Contribution of Working Group III to the Fifth Assessment Report of the Intergovernmental Panel on Climate Change; Edenhofer, O., Pichs-Madruga, R., Sokona, Y., Farahani, E., Kander, S., Seyboth, K., Adler, A., Baum, I., Brunner, S., Eickemeier, P., et al., Eds.; Cambridge University Press: Cambridge, UK; New York, NY, USA, 2014; pp. 811–922. [Google Scholar]
- Foxi, C.; Carboni, G.; Mulé, P.; Ramassini, W.; Ruiu, L.; Troccoli, A.; Satta, A. Long-term impact of tillage system on Heterodera avenae population density. Redia 2017, 100, 181–186. [Google Scholar] [CrossRef]
- Marandola, D. Riscoprire la Fertilità del Suolo con la Semina su Sodo. L’Inf. Agrar. 2012, 19, 67–70. [Google Scholar]
- Prestele, R.; Hirsch, A.L.; Davin, E.L.; Seneviratne, S.I.; Verburg, P.H. A spatially explicit representation of conservation agriculture for application in global change studies. Glob. Chang. Biol. 2018, 24, 4038–4053. [Google Scholar] [CrossRef] [PubMed]
- Sapkota, T.B.; Jat, R.K.; Singh, R.J.; Jat, M.L.; Stirling, C.M.; Jat, M.K.; Bijarnya, D.; Kumar, M.; Singh, V.; Saharawat, Y.S.; et al. Soil organic carbon changes after seven years of conservation agriculture based rice-wheat cropping system in the eastern Indo-Gangetc Plain of India. Soil Use Manag. 2017, 1–9. [Google Scholar] [CrossRef]
- Garnett, T. Sustainable intensification in agriculture: Premises and policies. Science 2013, 341, 33–34. [Google Scholar] [CrossRef] [PubMed]
- Wollenberg, E.; Richards, M.; Smith, P.; Havlík, P.; Obersteiner, M.; Tubiello, F.N.; Herold, M.; Gerber, P.; Carter, S.; Reisinger, A.; et al. Reducing emissions from agriculture to meet the 2 °C target. Glob. Chang. Biol. 2016, 22, 3859–3864. [Google Scholar] [CrossRef] [PubMed]
- Sapkota, T.B.; Shankar, V.; Rai, M.; Jat, M.L.; Stirling, C.M.; Singh, L.K.; Jat, H.S.; Grewal, M.S. Reducing global warming potential through sustainable intensification of Basmati rice-wheat systems in India. Sustainability 2017, 9, 1044. [Google Scholar] [CrossRef]
- Tubiello, F.N. Greenhouse Gas Emissions Due to Agriculture. In Encyclopedia of Food Security and Sustainability; Elsevier: Oxford, UK, 2019; Volume 1, pp. 196–205. [Google Scholar]
- Pretty, J.; Benton, T.G.; Bharucha, Z.P.; Dicks, L.V.; Butler Flora, C.; Charles, H.; Godfray, J.; Goulson, D.; Hartley, S.; Lampkin, N.; et al. Global assessment of agricultural system redesign for sustainable intensification. Nat. Sustain. 2018, 1, 441–446. [Google Scholar] [CrossRef]
- Rossi, L.; Piccinini, S. Sottoprodotti agroindustriali, un potenziale da sfruttare. L’Inf. Agrar. 2007, 34, 67–70. [Google Scholar]
- Fecondo, G.; Bucciarelli, S.; Di Paolo, E.; Ghianni, G. Biowaste compost effects on productive and qualitative characteristics of some field crops and on soil fertility. Ital. J. Agron. 2015, 10, 85–89. [Google Scholar] [CrossRef]
- Pasqualone, A.; Delvecchio, L.N.; Lacolla, G.; Piarulli, L.; Simeone, R.; Cucci, G. Effect of composted sewage sludge on durum wheat: Productivity, phenolic compounds, antioxidant activity, and technological quality. J. Food Agric. Environ. 2014, 12, 276–280. [Google Scholar]
- Hall, D.J.M.; Bell, R.W. Biochar and Compost Increase Crop Yields but the Effect is Short Term on Sandplain Soils of Western Australia. Pedosphere 2015, 25, 720–728. [Google Scholar] [CrossRef]
- De Stefanis, E.; Sgrulletta, D.; Pucciarmati, S.; Codianni, P. Effect of Cultivar and Nitrogen Fertilizer on Agronomic and Quality Traits of Durum Wheat under Organic Management. Cereal Res. Commun. 2012, 40, 423–435. [Google Scholar] [CrossRef]
- Rouse, J.W., Jr.; Haas, R.; Schell, J.; Deering, D. Monitoring Vegetation Systems in the Great Plains with Erts; NASA Special Publication 351; NASA: Washington, DC, USA, 1974; pp. 309–317. [Google Scholar]
- Porter, J.R.; Xie, L.; Challinor, A.J.; Cochrane, K.; Howden, S.M.; Iqbal, M.M.; Lobell, D.B.; Travasso, M.I. Food security and food production systems. In Climate Change 2014: Impacts, Adaptation, and Vulnerability. Part A: Global and Sectoral Aspects. Contribution of Working Group II to the Fifth Assessment Report of the Intergovernmental Panel on Climate Change; Cambridge University Press: Cambridge, UK; New York, NY, USA, 2014; pp. 485–533. [Google Scholar] [CrossRef]
- Leogrande, R.; Vitti, C.; Stellacci, A.M.; Cocozza, C.; Ventrella, D. Response of wheat crop during transition to organic system under Mediterranean conditions. Int. J. Plant Prod. 2016, 10, 565–578. [Google Scholar]
- Vaccari, F.P.; Baronti, S.; Lugato, E.; Genesio, L.; Castaldi, S.; Fornasier, F.; Miglietta, F. Biochar as a strategy to sequester carbon and increase yield in durum wheat. Eur. J. Agron. 2011, 34, 231–238. [Google Scholar] [CrossRef]
- Vv.Aa., Metodi Ufficiali di Analisi Chimica del Suolo; Ministero Risorse Agricole, Alimentari e Forestali: Roma, Italy, 1994.
- Soil Survey Staff. Keys to Soil Taxonomy, 11th ed.; USDA-Natural Resources Conservation Service: Washington, DC, USA, 2010. [Google Scholar]
- QGIS Development Team. QGIS Geographic Information System; Open Source Geospatial Foundation Project; 2020. Available online: http://qgis.osgeo.org (accessed on 22 July 2020).
- VSN International. Genstat for Windows, 20th ed.; VSN International: Hemel Hempstead, UK, 2019. [Google Scholar]


| Code | Treatment | Composition | Amount (kg ha−1) |
|---|---|---|---|
| CS/N | Compost O.M. 1 | Compost | 30 × 103 |
| CS 2 | Compost O.M. 2 | 100 kg ABP + 100 kg compost + 2 L sulfate + 50 g bio-lime + 500 mL peracid | 30 × 103 |
| CS 3 | Compost O.M. 3 | 100 kg ABP + 50 kg compost + 50 kg digestate + 2 L sulfate + 50 g bio-lime + 500 mL peracid | 23 × 103 |
| CS 4 | Compost O.M. 4 | 90 kg ABP + 45 kg compost + 45 kg potting soil + 2 L sulfate + 75 g bio-lime + 500 mL peracid | 22 × 103 |
| CN | Compost nitrogen | 100 kg ABP + 100 kg compost + 2 L sulfate + 50 g bio-lime + 500 mL peracid | 20 × 103 |
| CMIN | N-fertilization | diammonium phosphate | 200 |
| U | Untreated |
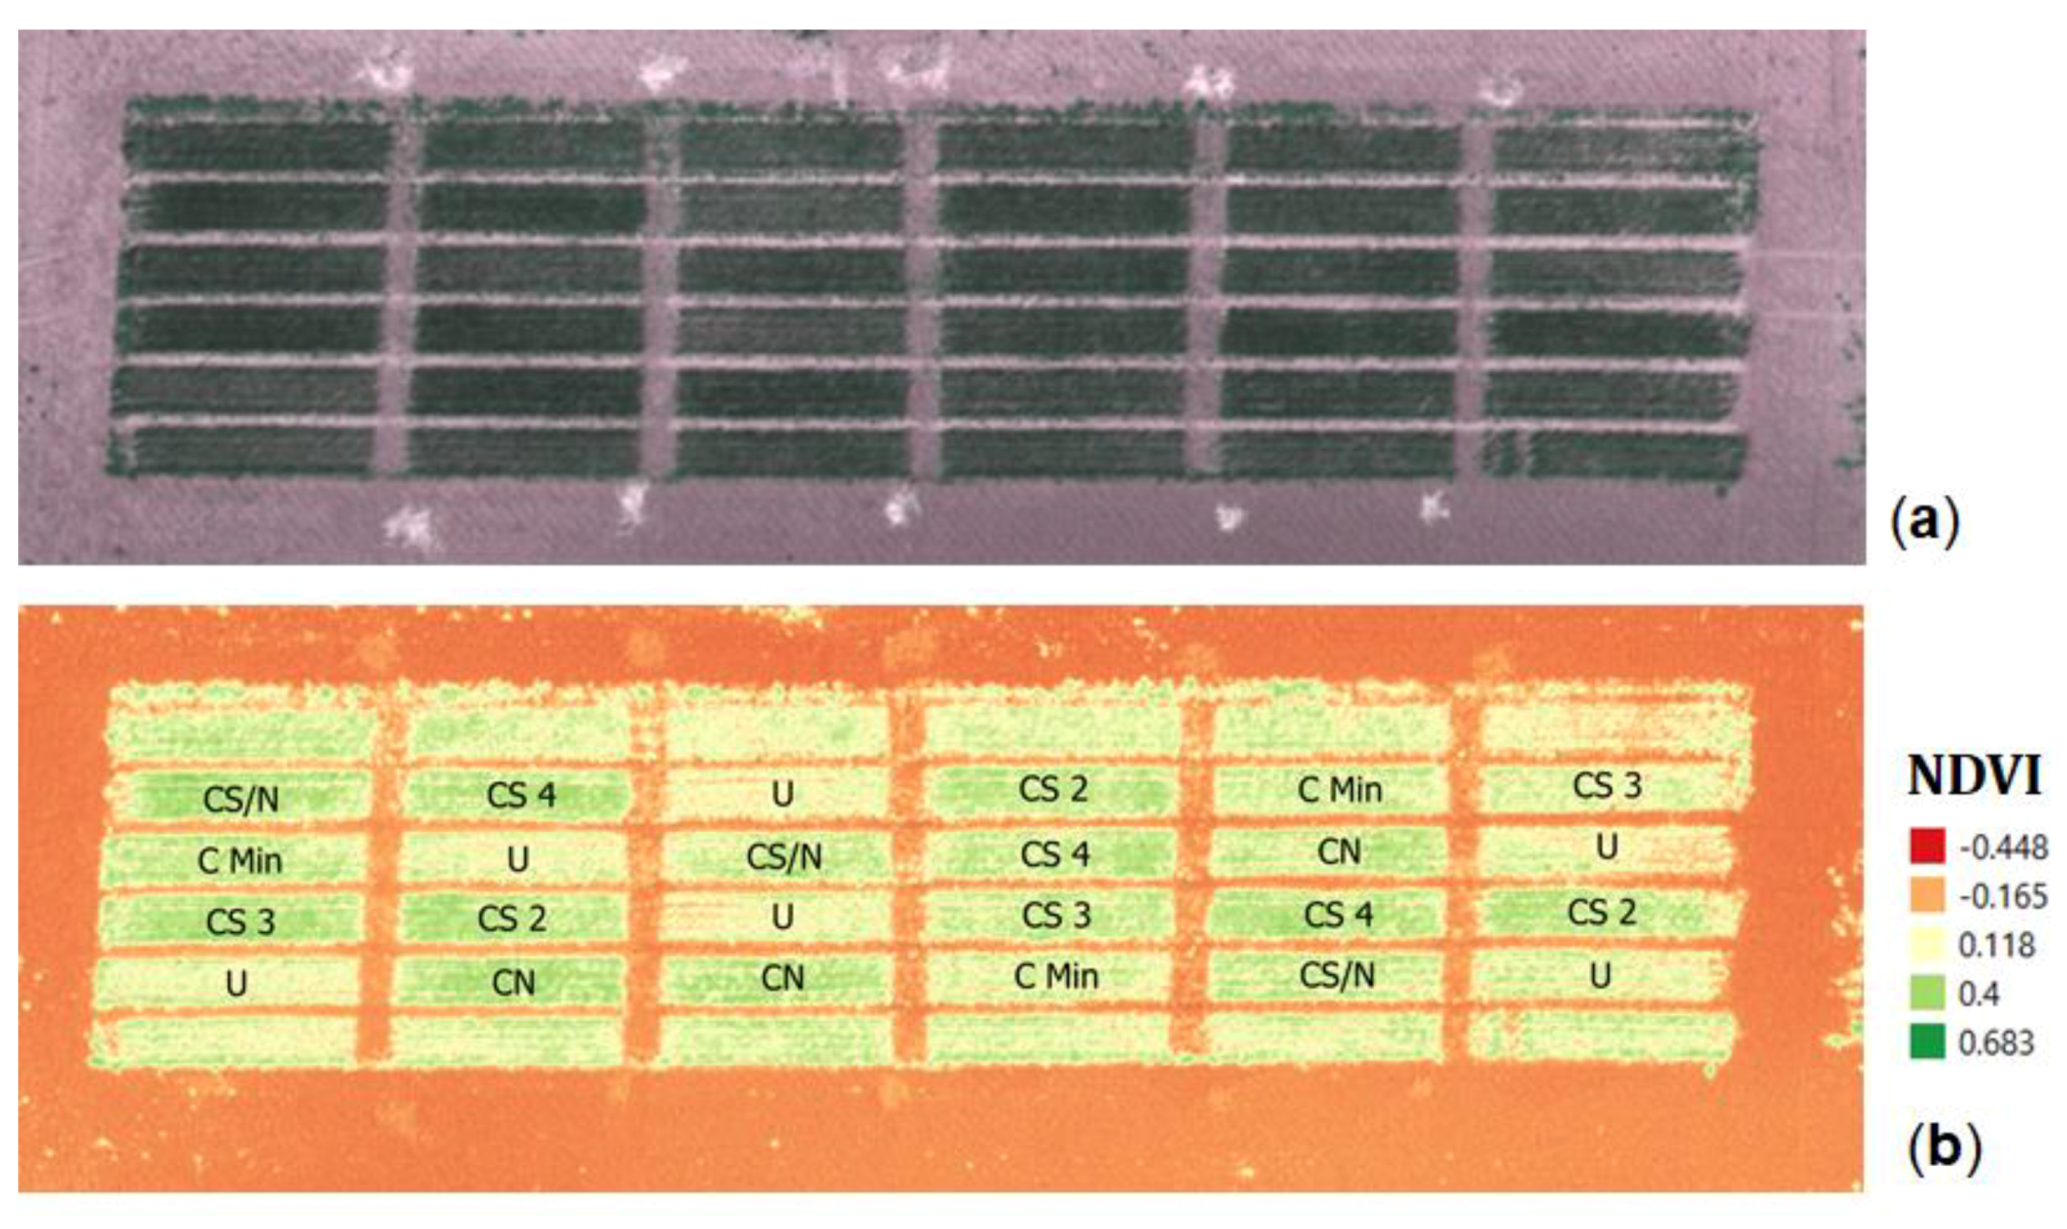
| Treatment | SOM (%) | Plant Height (cm) | Spike Weight (g) | Spike Density (n m−2) | NDVI (Booting) | NDVI (Flowering) | |||||
|---|---|---|---|---|---|---|---|---|---|---|---|
| U | 2.05 | bc | 66.1 | d | 2.61 | c | 256 | 0.238 | d | 0.121 | c |
| CMIN | 1.63 | c | 70.3 | abc | 3.03 | bc | 278 | 0.324 | c | 0.217 | b |
| CN | 1.77 | c | 71.3 | ab | 3.47 | ab | 291 | 0.384 | abc | 0.273 | a |
| CS 2 | 2.81 | bc | 70.9 | abc | 3.69 | a | 271 | 0.412 | a | 0.278 | a |
| CS 3 | 1.99 | bc | 69.8 | abcd | 3.59 | a | 270 | 0.331 | bc | 0.238 | ab |
| CS 4 | 3.29 | ab | 68.6 | bcd | 3.61 | a | 259 | 0.399 | a | 0.277 | a |
| CS/N | 4.31 | a | 73.4 | a | 2.87 | c | 288 | 0.391 | ab | 0.254 | ab |
| p | 0.012 | 0.019 | <0.001 | 0.859 | <0.001 | <0.001 | |||||
| Grain Yield (Mg ha−1) | Protein Content (%) | Gluten Content (%) | Protein Yield (Mg ha−1) | Test Weight (kg hL−1) | 1000 Kernel Weight (g) | Yellow Index b* | Gluten Index (0–100) | ||||||
|---|---|---|---|---|---|---|---|---|---|---|---|---|---|
| U | 2.61 | 11.1 | e | 8.6 | e | 0.289 | c | 84.2 | a | 44.8 | 14.77 | c | 95 |
| C MIN | 3.03 | 11.9 | cd | 9.5 | cd | 0.362 | ab | 83.6 | abc | 44.1 | 14.76 | c | 93 |
| CN | 3.22 | 12.6 | ab | 10.1 | ab | 0.406 | a | 82.8 | cde | 42.9 | 15.05 | a | 92 |
| CS 2 | 2.98 | 13.1 | a | 10.5 | a | 0.389 | a | 82.4 | de | 42.0 | 14.96 | ab | 86 |
| CS 3 | 3.01 | 12.4 | bc | 9.8 | bc | 0.371 | a | 83.3 | bcd | 43.6 | 15.07 | a | 94 |
| CS 4 | 2.76 | 12.9 | ab | 10.2 | ab | 0.357 | a–c | 82.2 | e | 41.8 | 15.03 | a | 88 |
| CS/N | 3.34 | 11.8 | d | 9.5 | cd | 0.393 | a | 83.4 | abc | 43.5 | 14.86 | bc | 96 |
| p | 0.105 | <0.001 | <0.001 | 0.029 | 0.004 | 0.190 | 0.004 | 0.137 | |||||
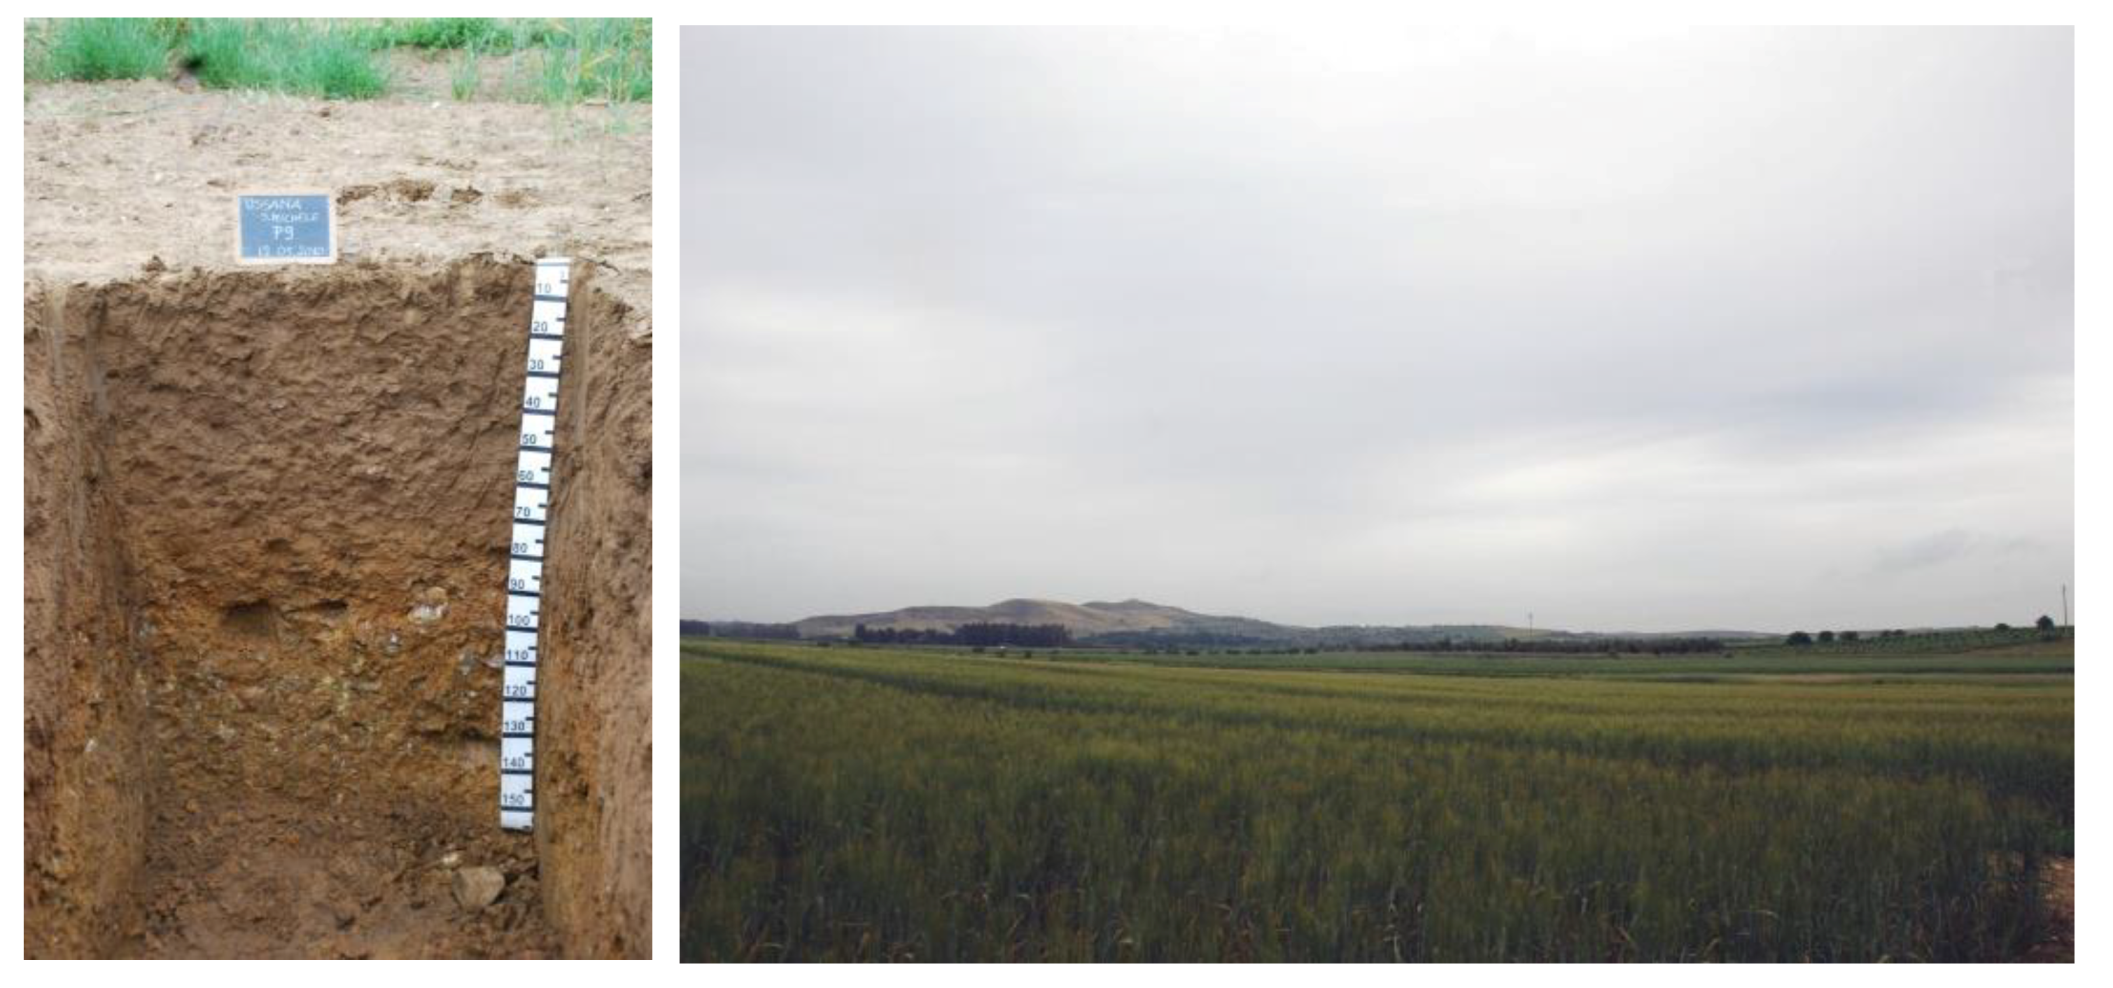
| Ap 0–40 cm | humid; wet matrix color brown (7.5 YR 4/4); coarse / thick angular polyhedral structure, highly developed, friable when wet; few (<2%) 4 mm iron manganese nodules; 10% skeleton consisting of 10% coarse gravel (20–75 mm); small pores (0.5–2 mm) abundant (2%–5%); well drained; linear abrupt limit |
| Bw 40–70 cm | humid; matrix color from wet brown (7.5 YR 4/3); 10% of streaks of strong brown color (7.5 YR 4/6), small (<5 mm) with weak contrast; very coarse / thick sub-angle polyhedral structure, friable when wet; common (2%–20%) 1 mm iron manganese nodules; 13% of skeleton made up of coarse gravel; abundant small pores (0.5–2 mm) (0.5%–2%); well drained; linear abrupt limit |
| Bt1 70–90 cm | humid; matrix color from wet yellowish red (5 YR 5/6); 10% of streaks of yellowish red color (5 YR 5/6), medium (15 mm) with distinct contrast; multifaceted fine / thin angular structure, strongly developed, friable when wet; common (2%–20%) 4 mm manganese iron concretions and common (2%–20%) soft concentrations of 4 mm manganese iron; few films (2%–5%) of clay; 75% skeleton consisting of 50% coarse gravel and 25% pebbles (76–250 mm); abundant small pores (0.5–2 mm) (0.5%–2%); well drained; wavy abrupt limit |
| Bt2 90–120 cm | humid; matrix color from wet brown (7.5 YR 5/4); 25% of streaks of yellowish red color (5 YR 5/8), medium (15 mm) with distinct contrast and 10% of streaks of strong brown color (7.5 YR 5/6), small (<5 mm) with distinct contrast; medium-sized, highly developed polyhedral structure, highly resistant to damp; common (2%–20%) manganese iron nodules of 4 mm and common (2%–20%) soft concentrations of manganese iron of 4 mm; many clay films (15%–40%); 50% skeleton made up of pebbles (76–250 mm); small pores (0.5–2 mm) few (0.1%–0.5%); rather poorly drained; linear abrupt limit |
| Bt3 120–160 cm | humid; brown wet matrix color (10 YR 5/3); 20% of streaks of strong brown color (7.5 YR 5/6), coarse (>15 mm) with distinct massive contrast; medium-sized, highly developed polyhedral structure, highly resistant to damp; common (2%–20%) 12 mm manganese iron nodules and common (2%–20%) soft concentrations of 4 mm manganese iron; many films (15%–40%) of clay; 75% skeleton made up of pebbles (76–250 mm); very small pores (<0.5 mm) very few (<0.5%); rather poorly drained. |
| Horizon Code | Ap | Bw | Bt1 | Bt2 | Bt3 | |
|---|---|---|---|---|---|---|
| Depth | cm | 0–40 | 40–70 | 70–90 | 90–120 | 120–160 |
| Total sand | g kg−1 | 584 | 540 | 585 | 427 | 392 |
| Total Lime | g kg−1 | 249 | 251 | 192 | 104 | 136 |
| Clay | g kg−1 | 167 | 209 | 223 | 469 | 472 |
| Texture class | SL | SCL | SCL | SC | C | |
| pH H2O | 7.4 | 7.9 | 8.2 | 8.1 | 8.3 | |
| pH KCl | 5.8 | 6.1 | 6.5 | 6.4 | 6.8 | |
| Organic carbon | g kg−1 | 7.58 | 2.96 | 1.90 | 2.06 | 1.31 |
| Organic matter | g kg−1 | 13.1 | 5.1 | 3.3 | 3.6 | 2.3 |
| Total nitrogen | g kg−1 | 0.76 | 0.35 | 0.27 | 0.34 | 0.21 |
| C/N | 10.0 | 8.5 | 7.0 | 6.1 | 6.2 | |
| Exchangeable Ca | mg kg−1 | 1389 | 1563 | 1579 | 2940 | 2632 |
| Exchangeable Mg | mg kg−1 | 146 | 178 | 268 | 628 | 706 |
| Exchangeable Na | mg kg−1 | 48.6 | 95.6 | 94.6 | 175.2 | 209.6 |
| Exchangeable K | mg kg−1 | 182 | 66 | 72 | 108 | 136 |
| CEC | meq 100 g−1 | 15.7 | 16.4 | 19.6 | 24.0 | 33.9 |
| Base saturation | % | 56 | 60 | 54 | 87 | 60 |
| Code | Carbon % | Total Nitrogen % | C/N | Phosphatemg kg−1 |
|---|---|---|---|---|
| CS/N | 27.71 | 2.88 | 9.6 | 7017 |
| CS 2 | 36.18 | 4.28 | 8.5 | 6927 |
| CS 3 | 38.49 | 5.72 | 6.7 | 983 |
| CS 4 | 32.42 | 4.46 | 7.3 | 4267 |
| CN | 36.18 | 4.28 | 8.5 | 6927 |
| CMIN | 18.00 | 46,000 |
| Operation | Date (mm/dd/yy) | Type |
|---|---|---|
| Disk harrowing (15 cm) | 01/07/19 | 15-cm depth |
| Treatment fertilization | 01/09/19 | Table 1 |
| Harrowing (5 cm) | 01/09/19 | 5-cm depth |
| Sowing | 01/17/19 | Plot drill |
| Weed control | 04/01/19 | Mesosulfuron-methyl + odosulfuron-methyl-sodium + mefenpyr-diethyl + bromoxynil |
| Fertilization | 03/13/19 | Urea (60 kg ha−1) |
| Harvest | 07/01/19 | Plot combine |
© 2020 by the authors. Licensee MDPI, Basel, Switzerland. This article is an open access article distributed under the terms and conditions of the Creative Commons Attribution (CC BY) license (http://creativecommons.org/licenses/by/4.0/).
Share and Cite
Mulè, P.; Dettori, M.; Carboni, G. Effect of Animal ByProducts Fertilization on Durum Wheat in Mediterranean Conditions: Preliminary Results. Plants 2020, 9, 1094. https://doi.org/10.3390/plants9091094
Mulè P, Dettori M, Carboni G. Effect of Animal ByProducts Fertilization on Durum Wheat in Mediterranean Conditions: Preliminary Results. Plants. 2020; 9(9):1094. https://doi.org/10.3390/plants9091094
Chicago/Turabian StyleMulè, Paolo, Marco Dettori, and Gianluca Carboni. 2020. "Effect of Animal ByProducts Fertilization on Durum Wheat in Mediterranean Conditions: Preliminary Results" Plants 9, no. 9: 1094. https://doi.org/10.3390/plants9091094
APA StyleMulè, P., Dettori, M., & Carboni, G. (2020). Effect of Animal ByProducts Fertilization on Durum Wheat in Mediterranean Conditions: Preliminary Results. Plants, 9(9), 1094. https://doi.org/10.3390/plants9091094