Identifying the Compounds of the Metabolic Elicitors of Pseudomonas fluorescens N 21.4 Responsible for Their Ability to Induce Plant Resistance

 , , and
Abstract
1. Introduction
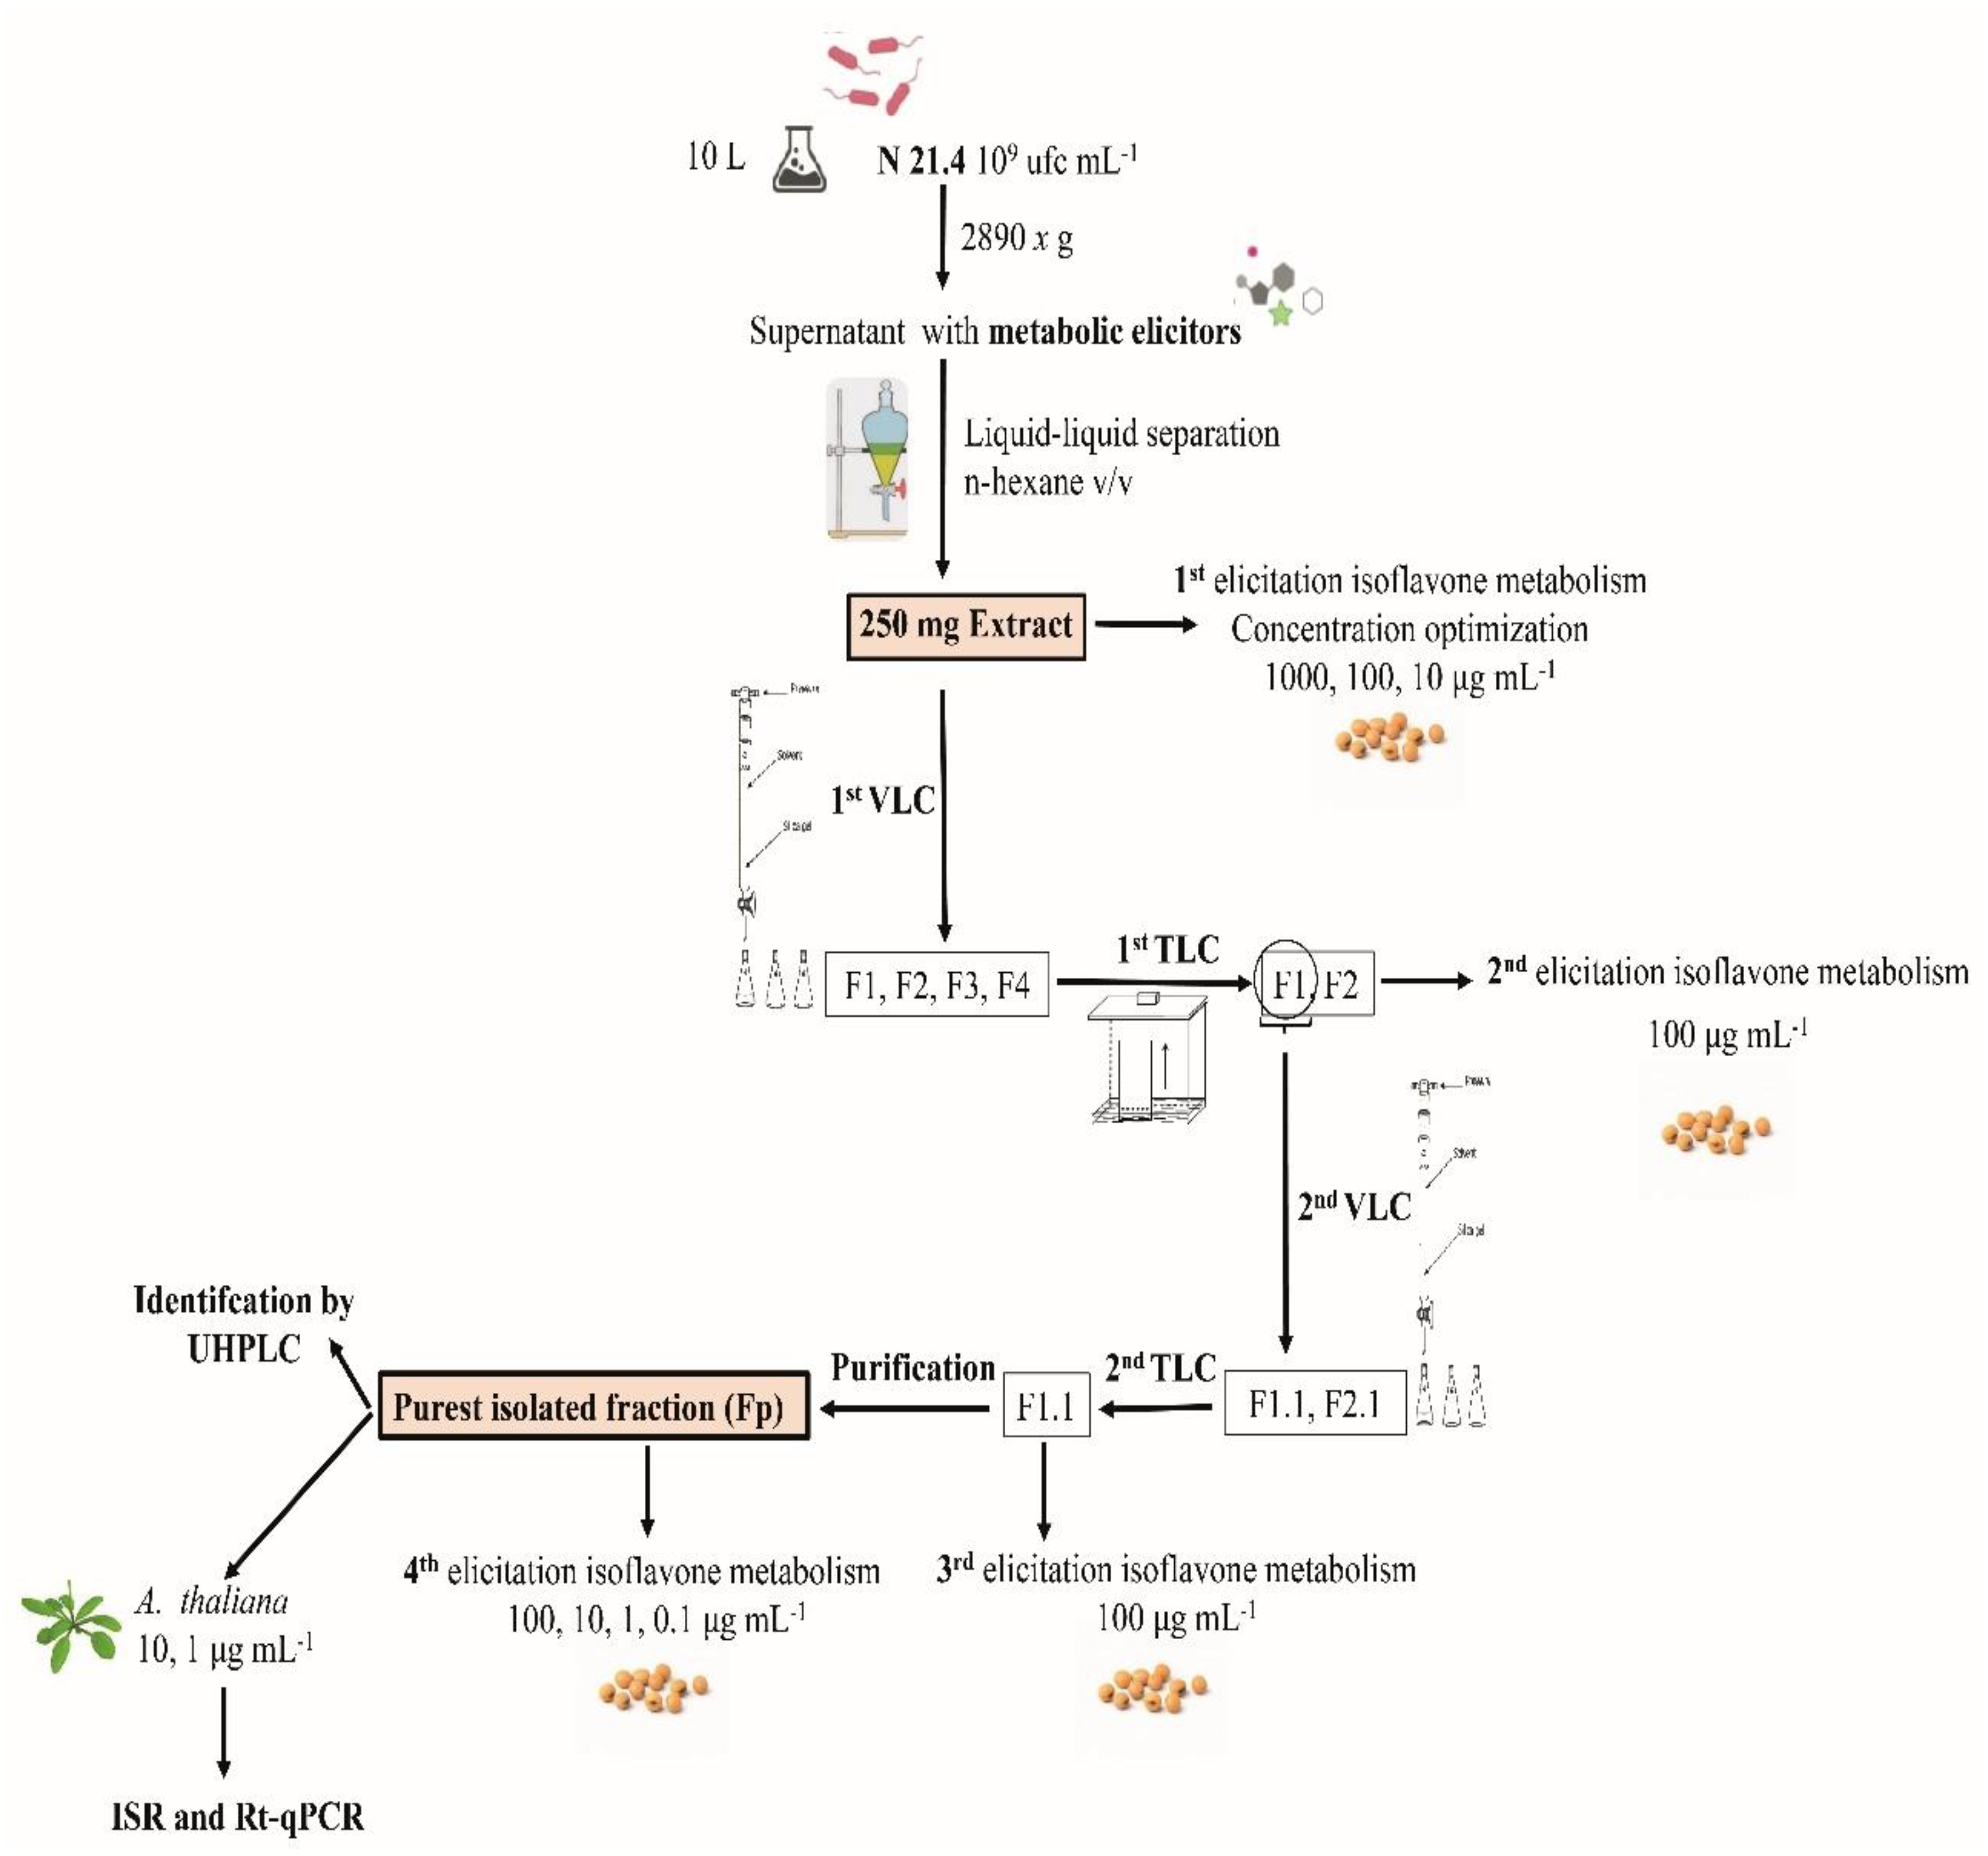
2. Material and Methods
2.1. Bacterial Strain
2.2. Metabolic Elicitor Extraction and Control Obtaining
2.3. Elicitation of Isoflavone Metabolism in the Soybean
2.4. Vacuum Liquid Chromatography (VLC)
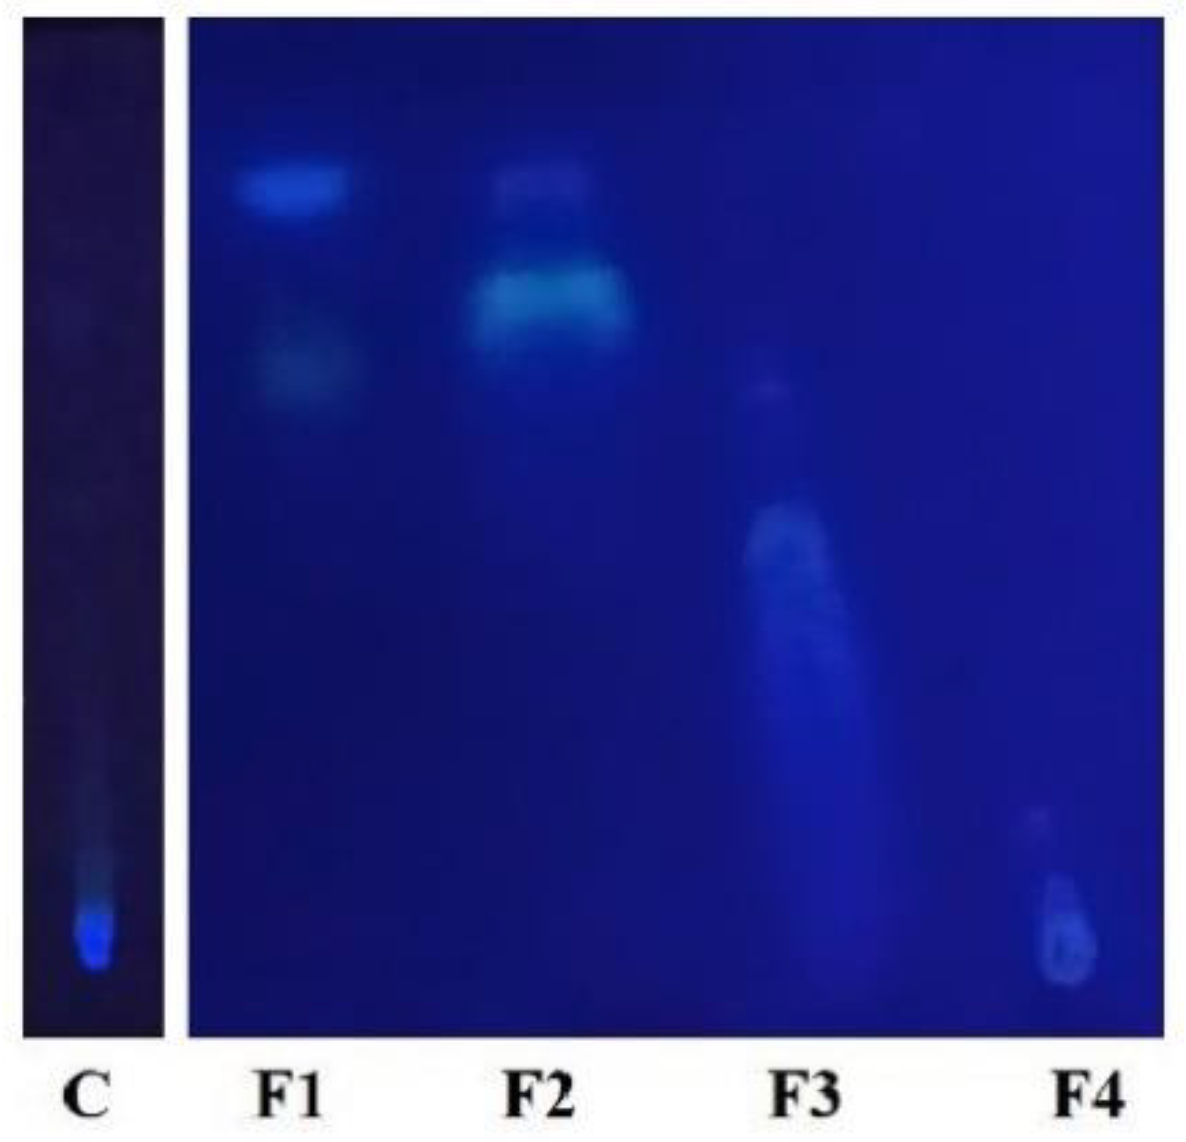
2.5. Thin Layer Chromatography (TLC)
2.6. Purification of F1.1
2.7. ISR Experiment
2.8. RT-qPCR Experiment
2.9. Tentative Identification and Characterization by UHPLC/ESI–QTOF–MS
2.9.1. Sample Preparation
2.9.2. UHPLC-MS Analysis
2.9.3. Data Handling
2.9.4. Compound Identification
2.10. Statistical Analysis
3. Results
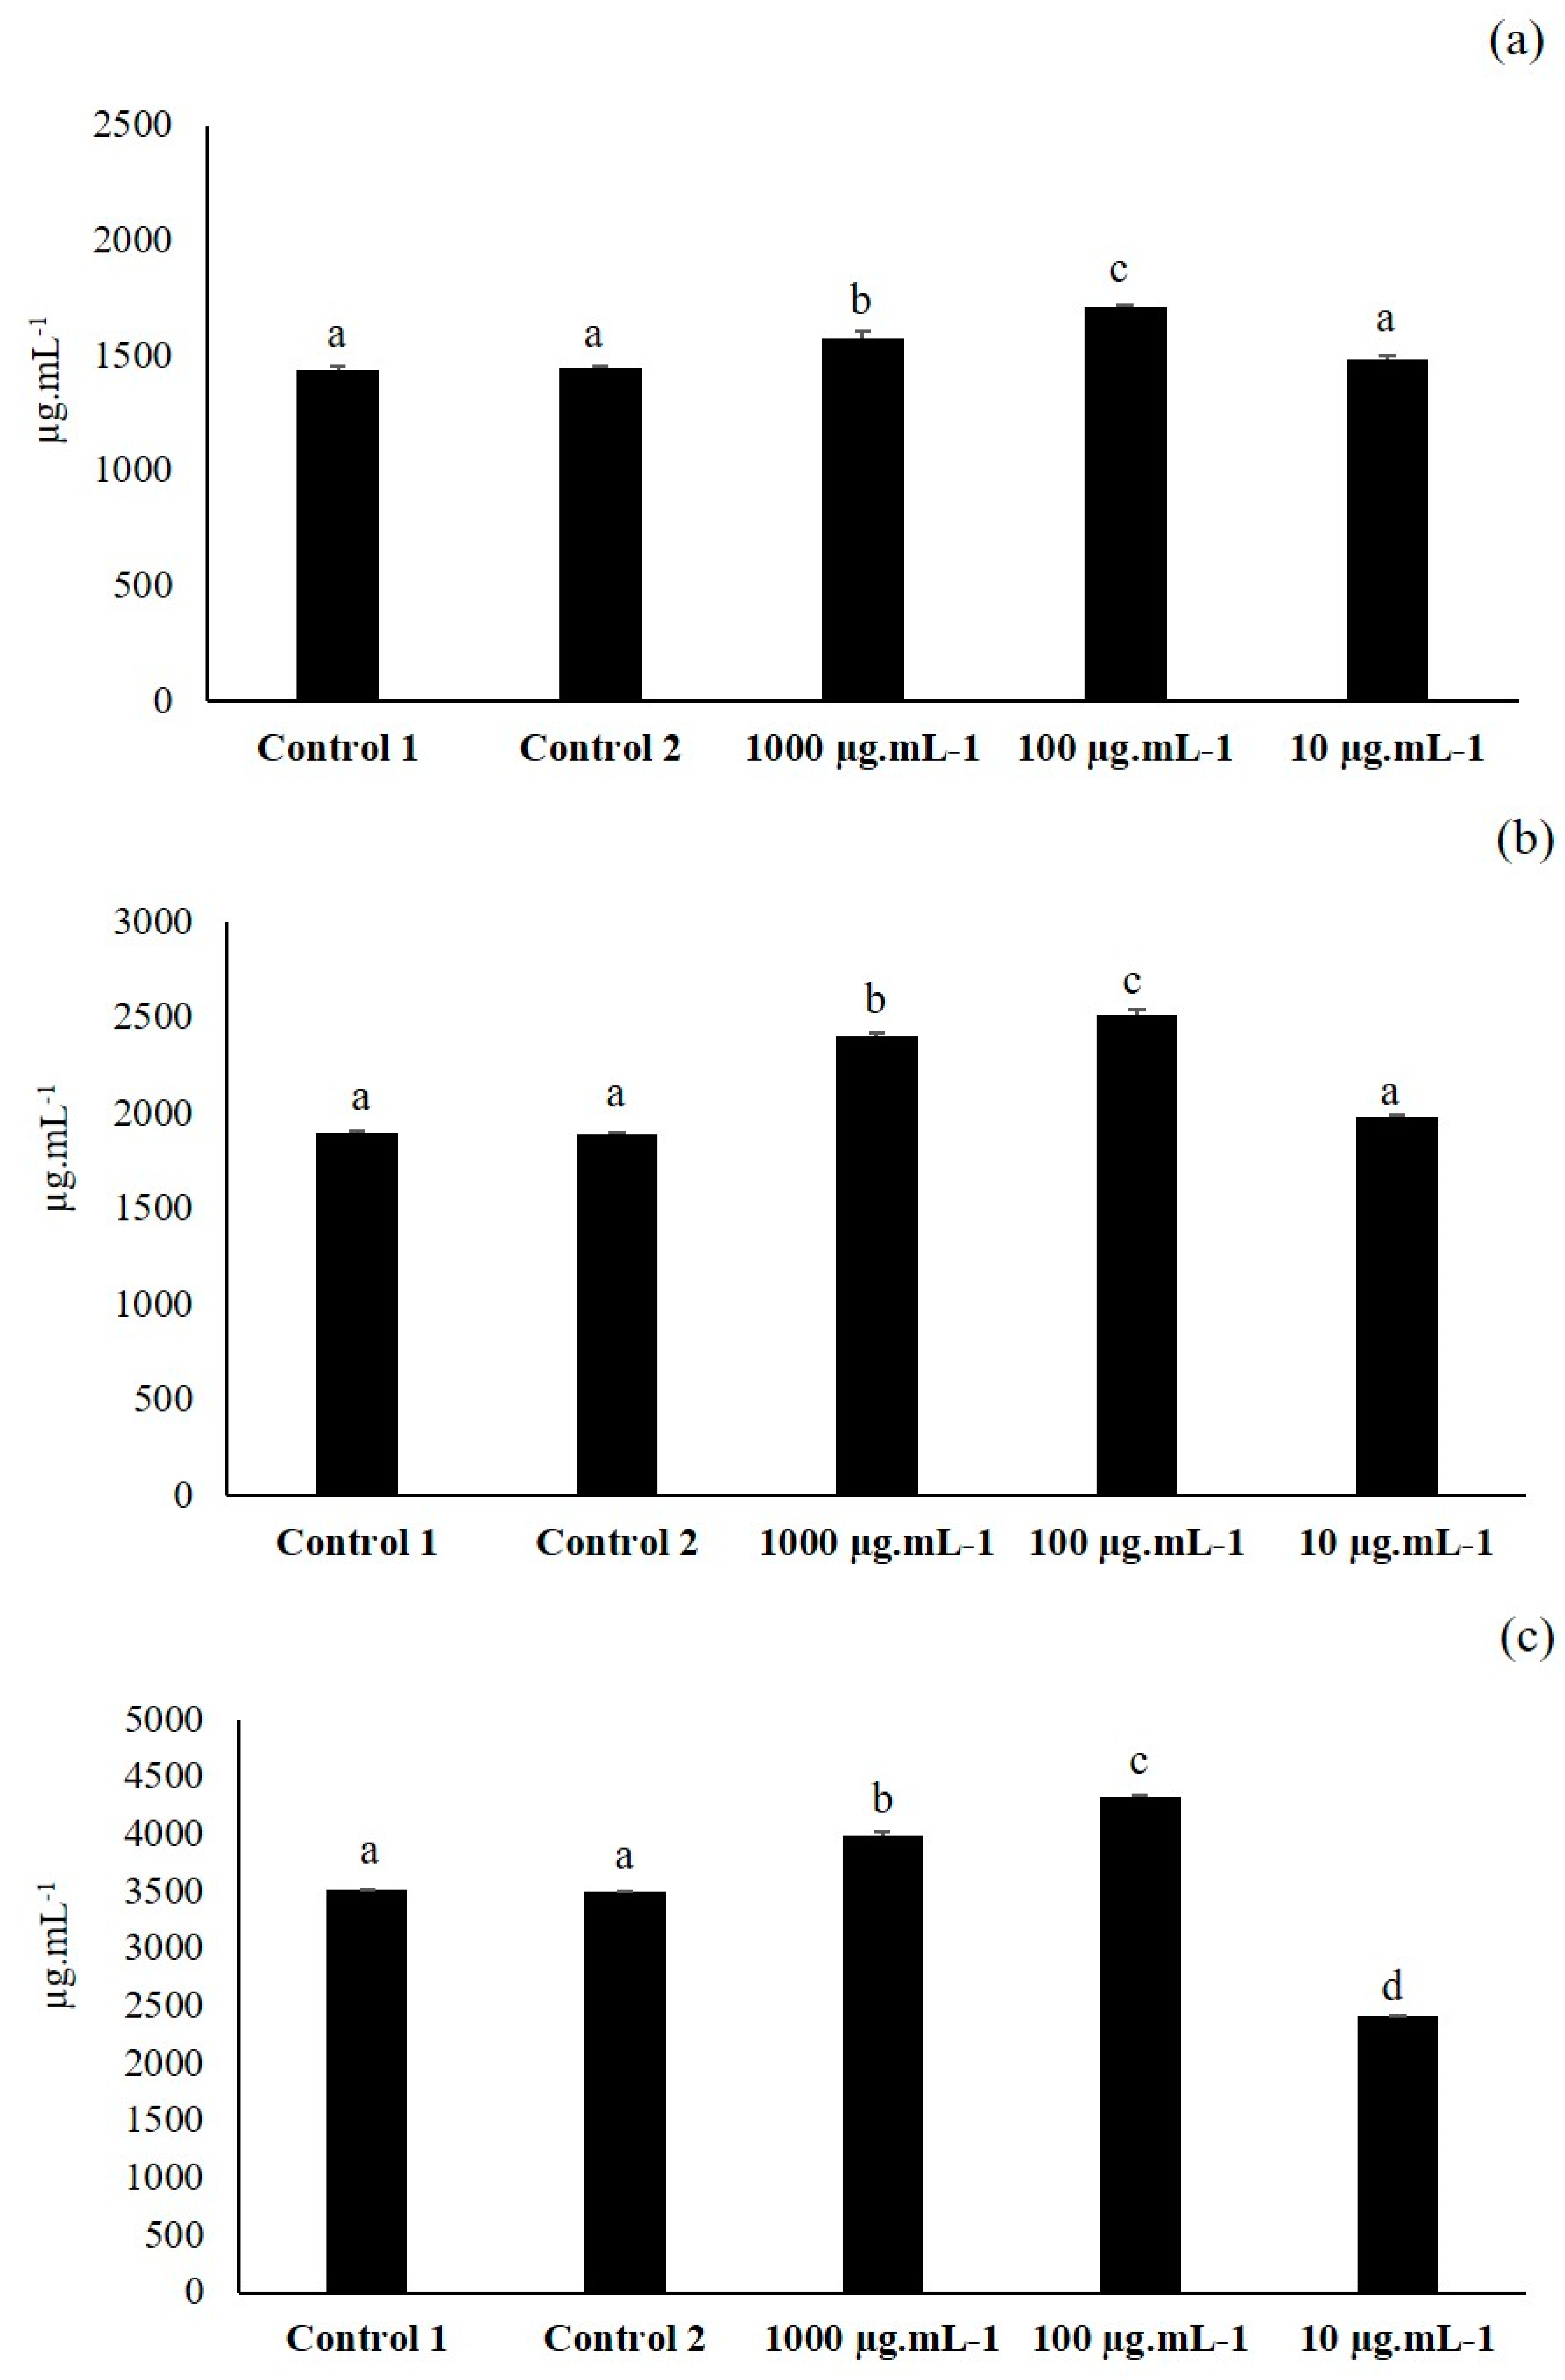
3.1. First Elicitation of Isoflavone in the Soybean: Concentration Optimization
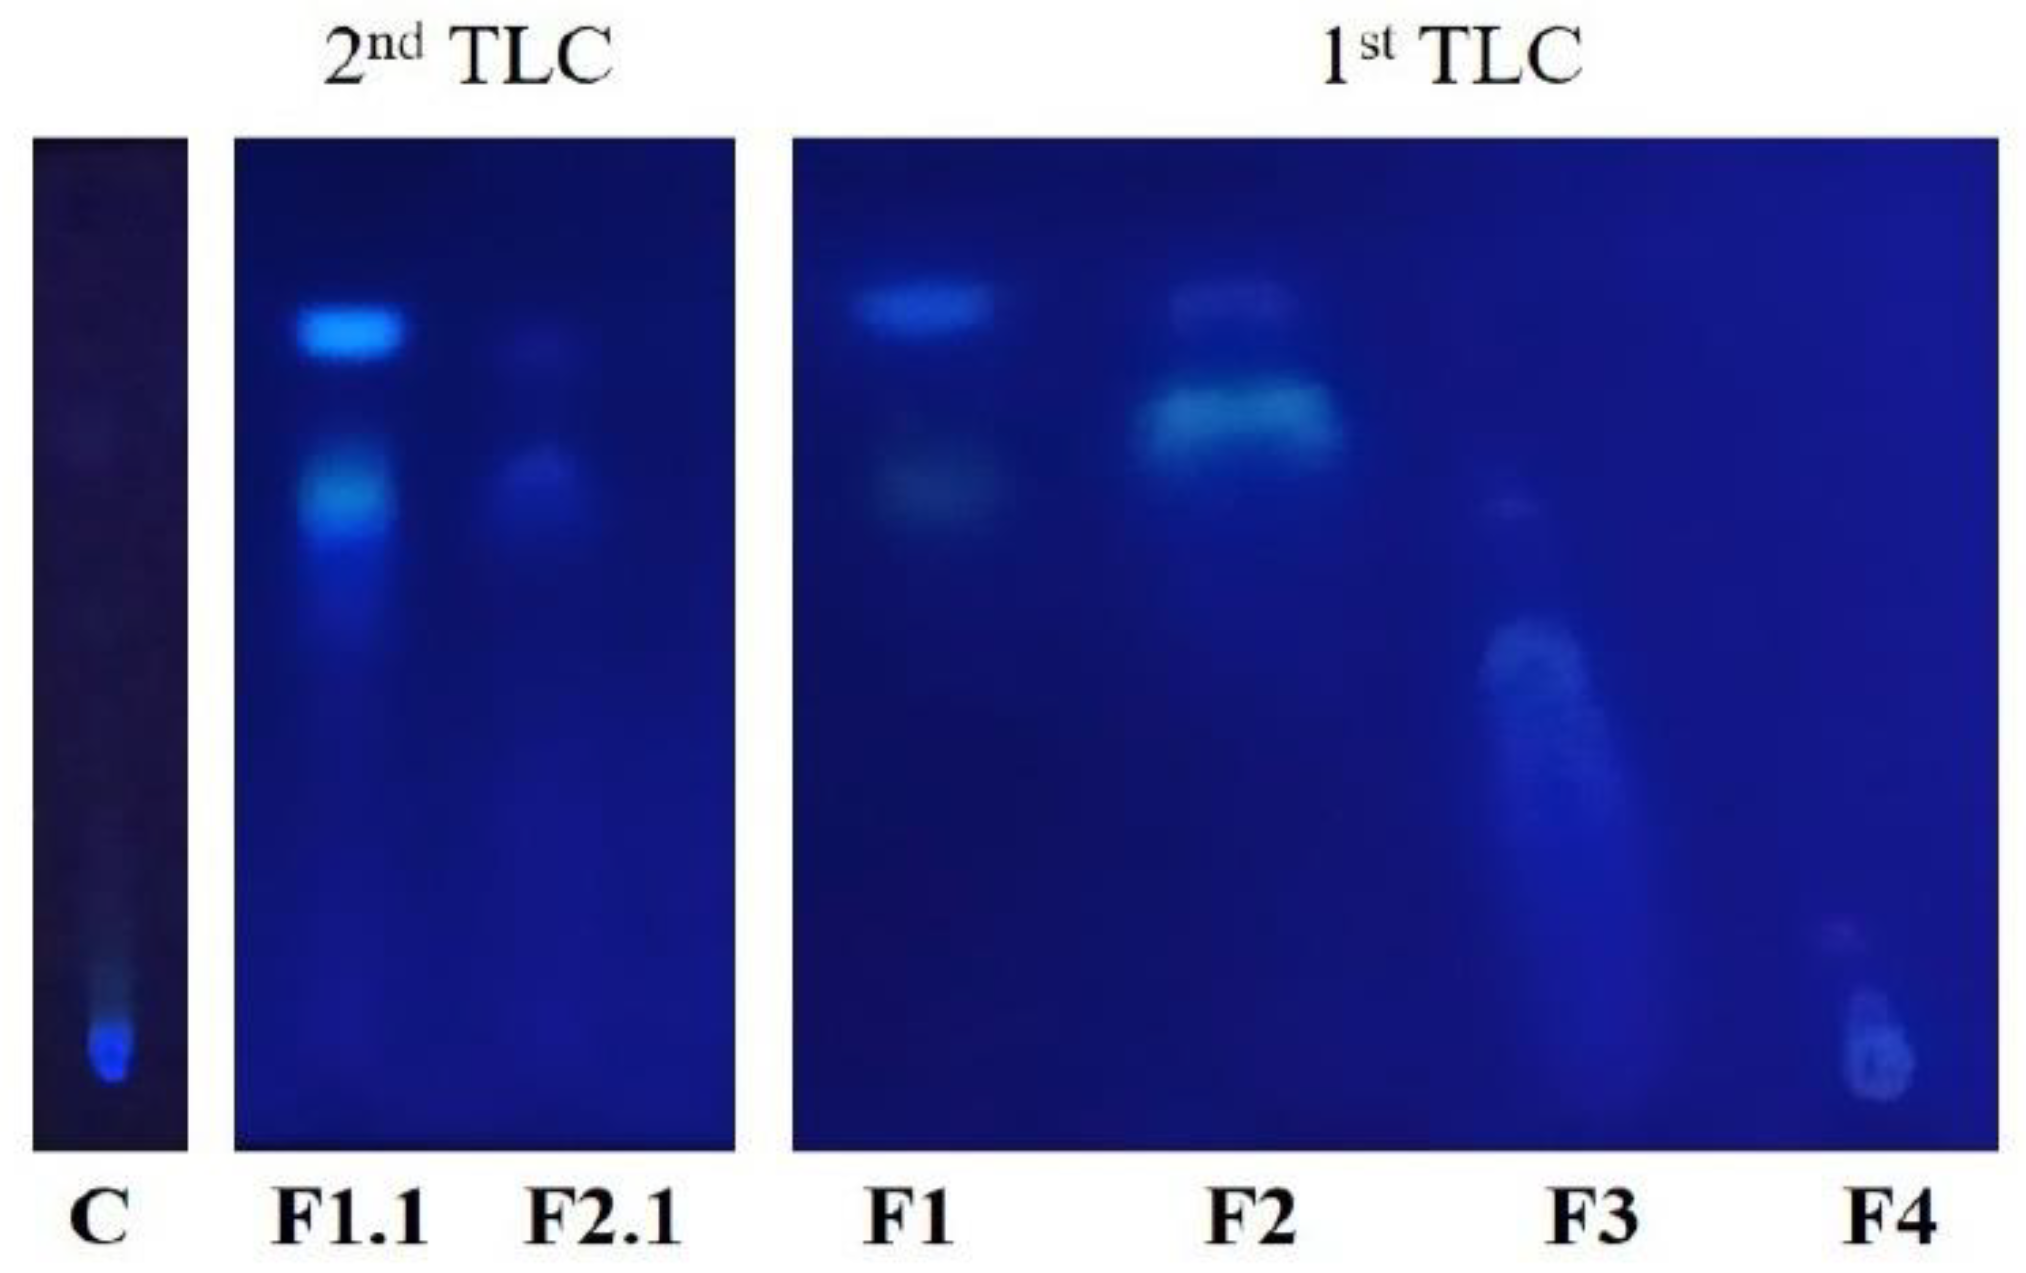
3.2. First TLC
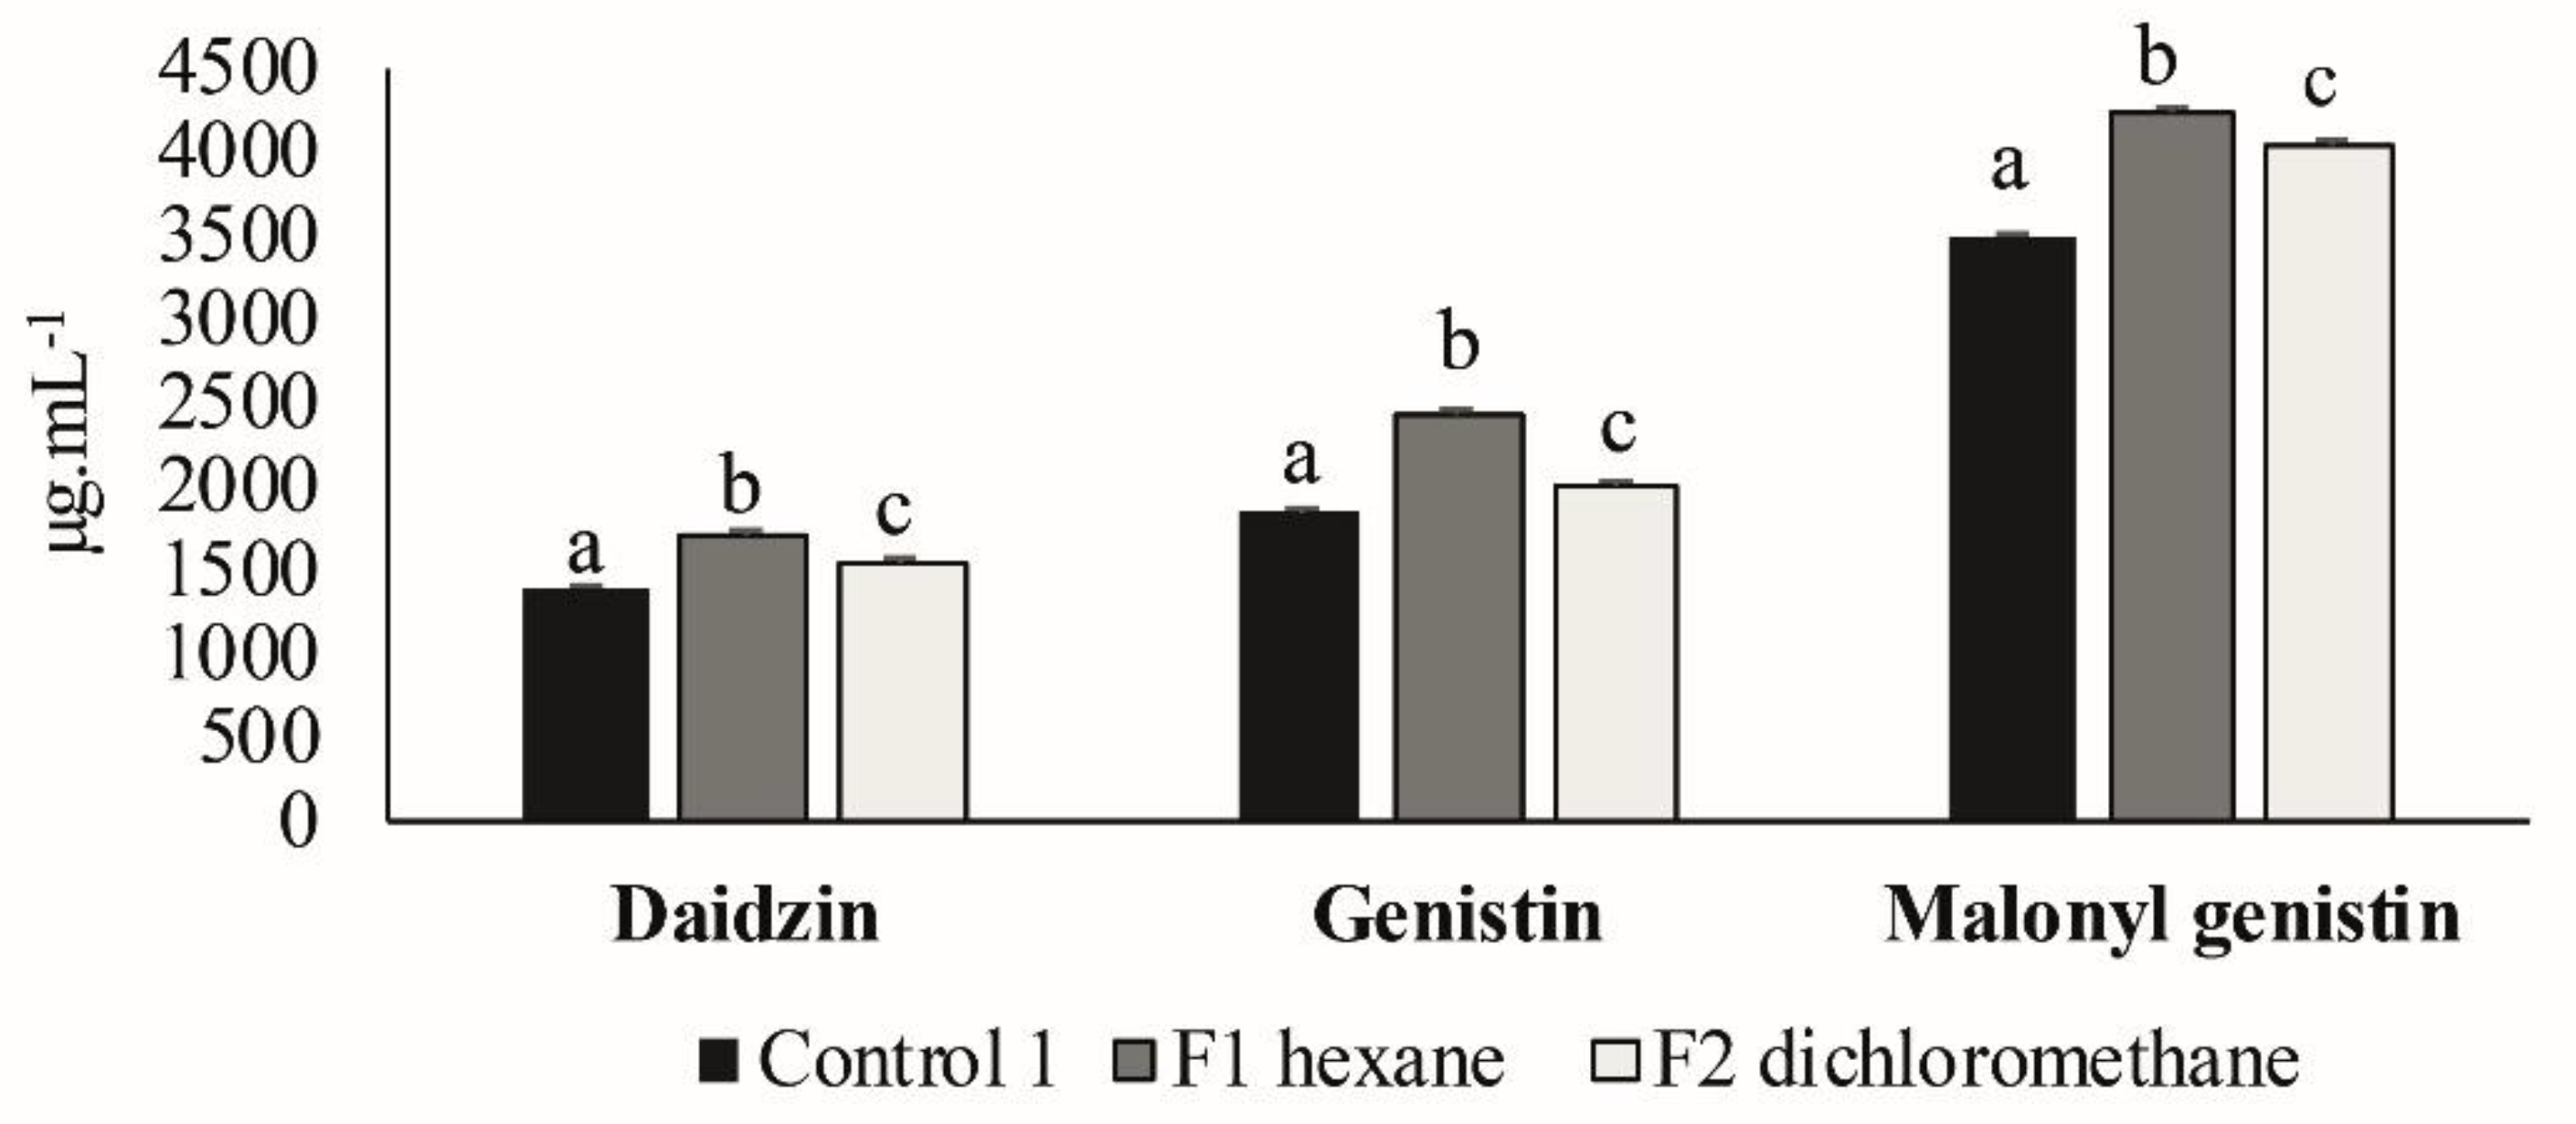
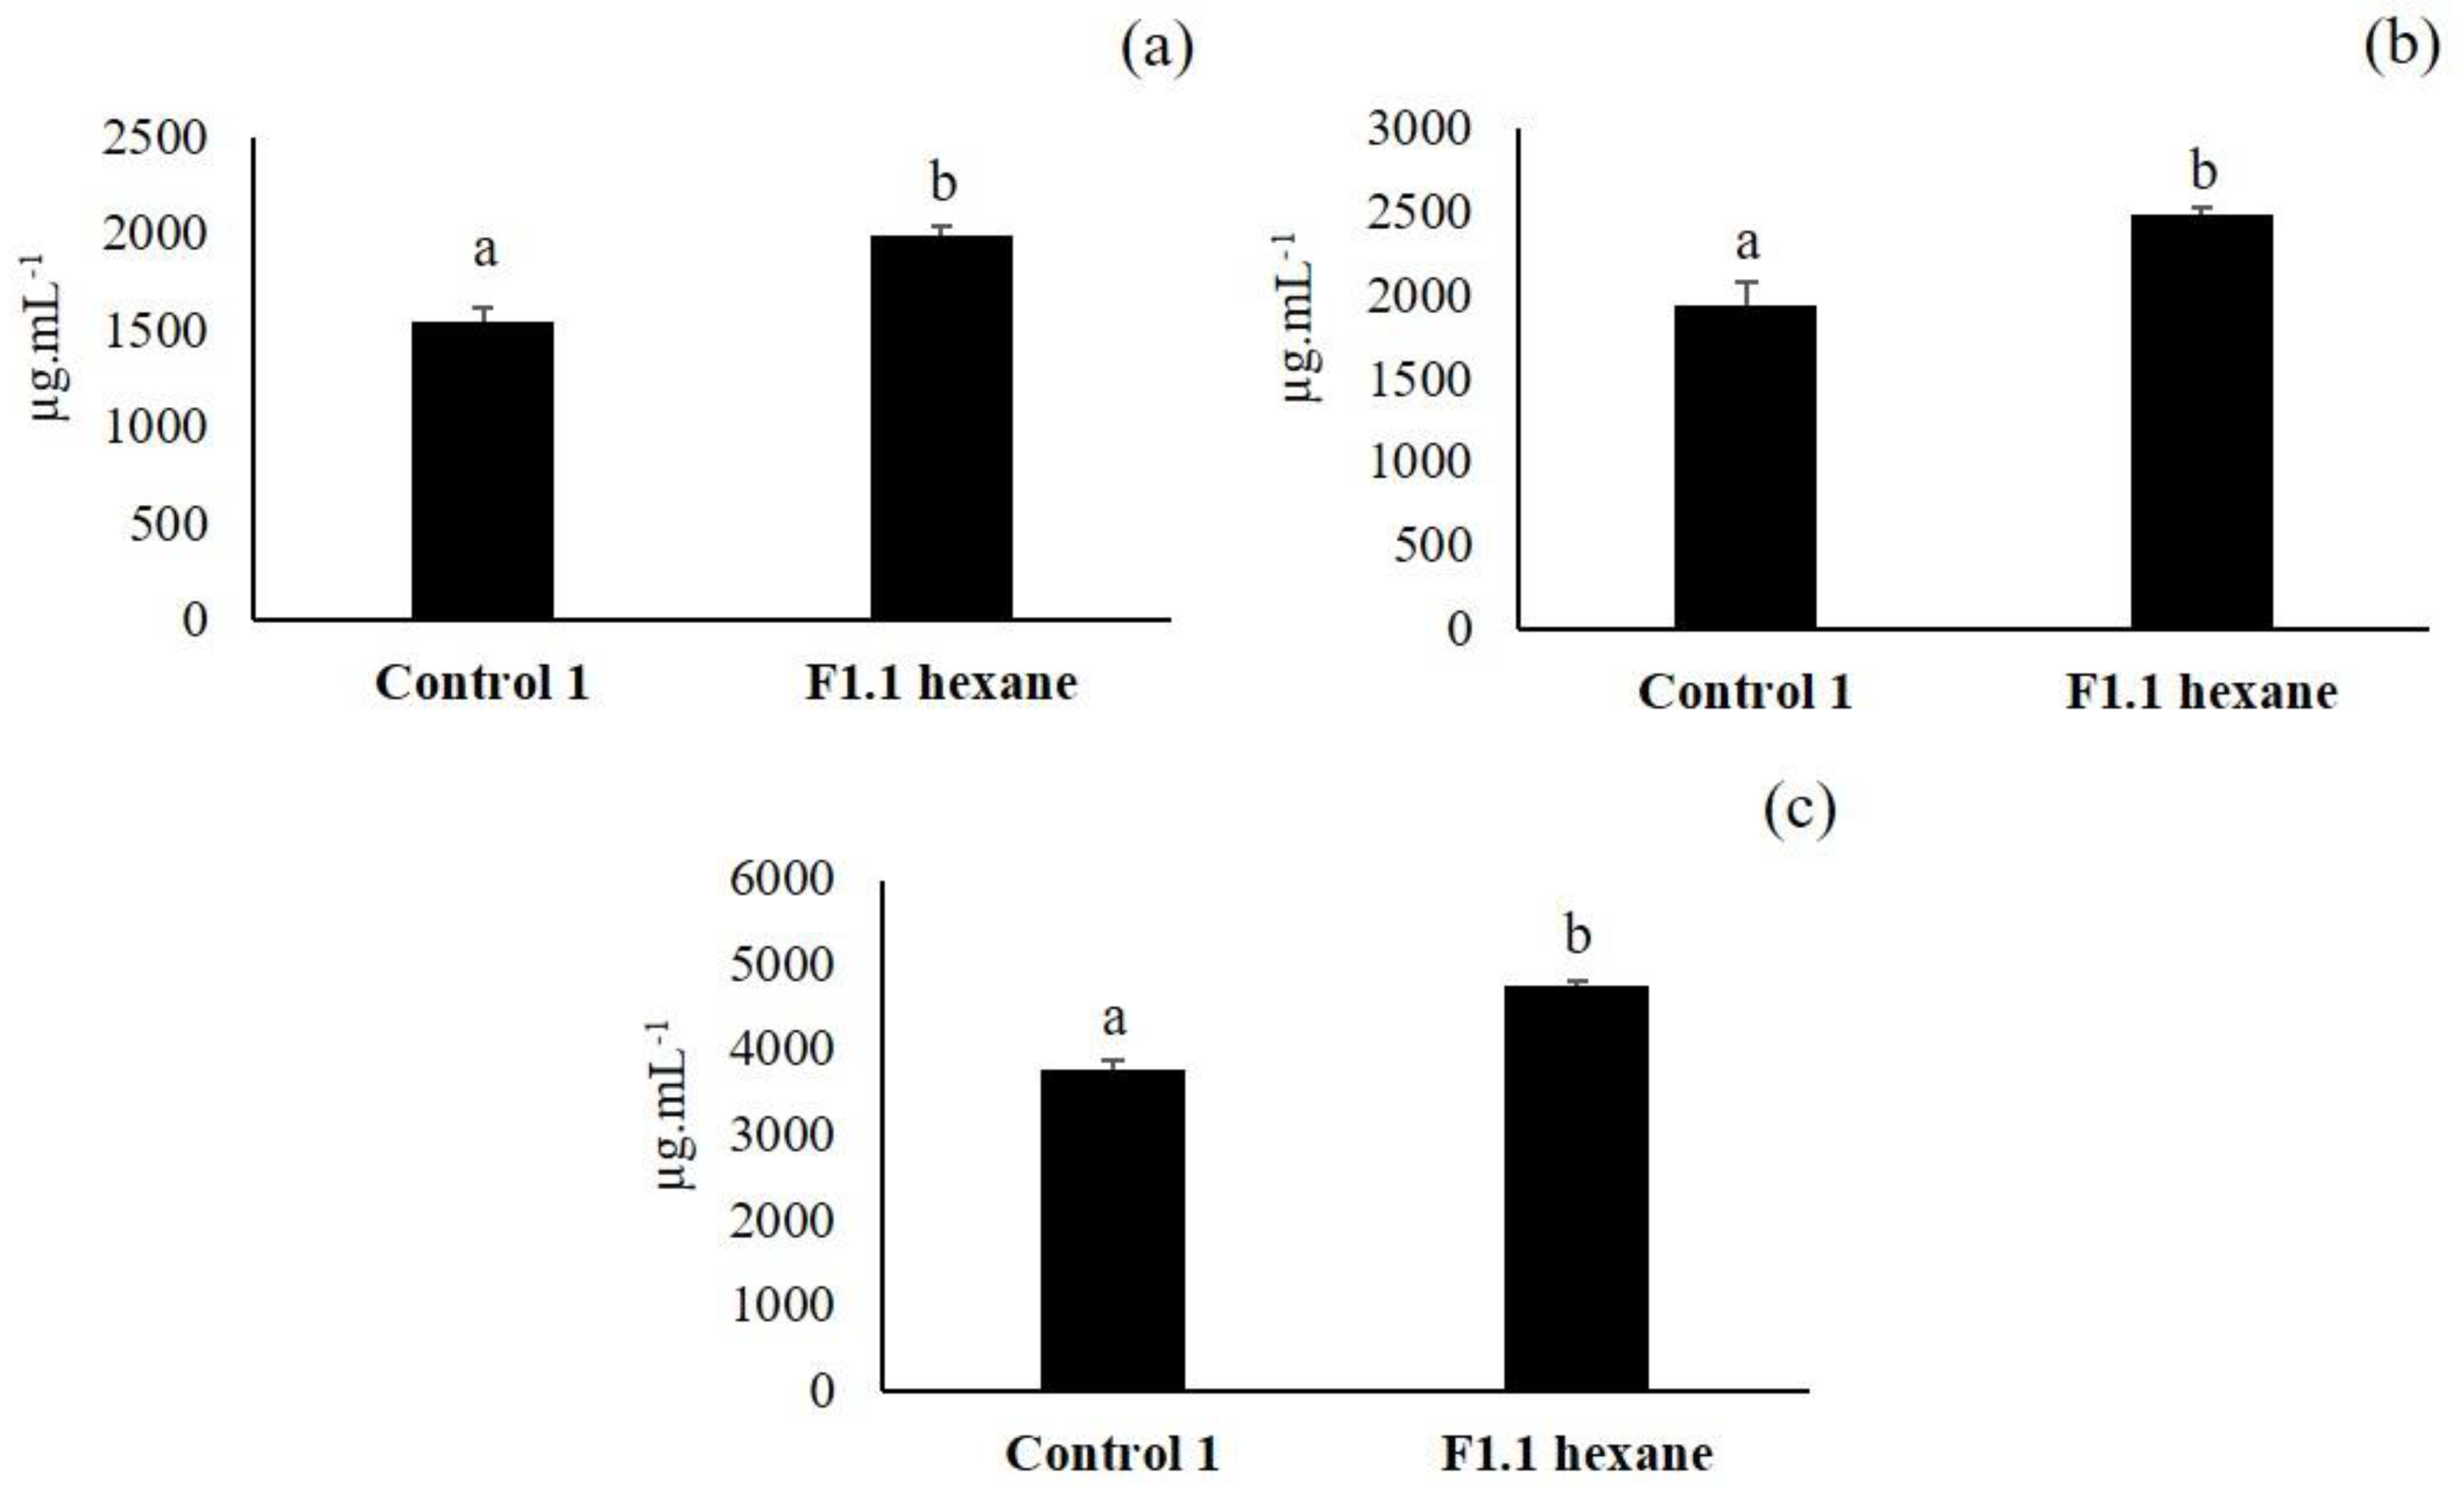
3.3. Second Elicitation of Isoflavone Metabolism in the Soybean
3.4. Second TLC
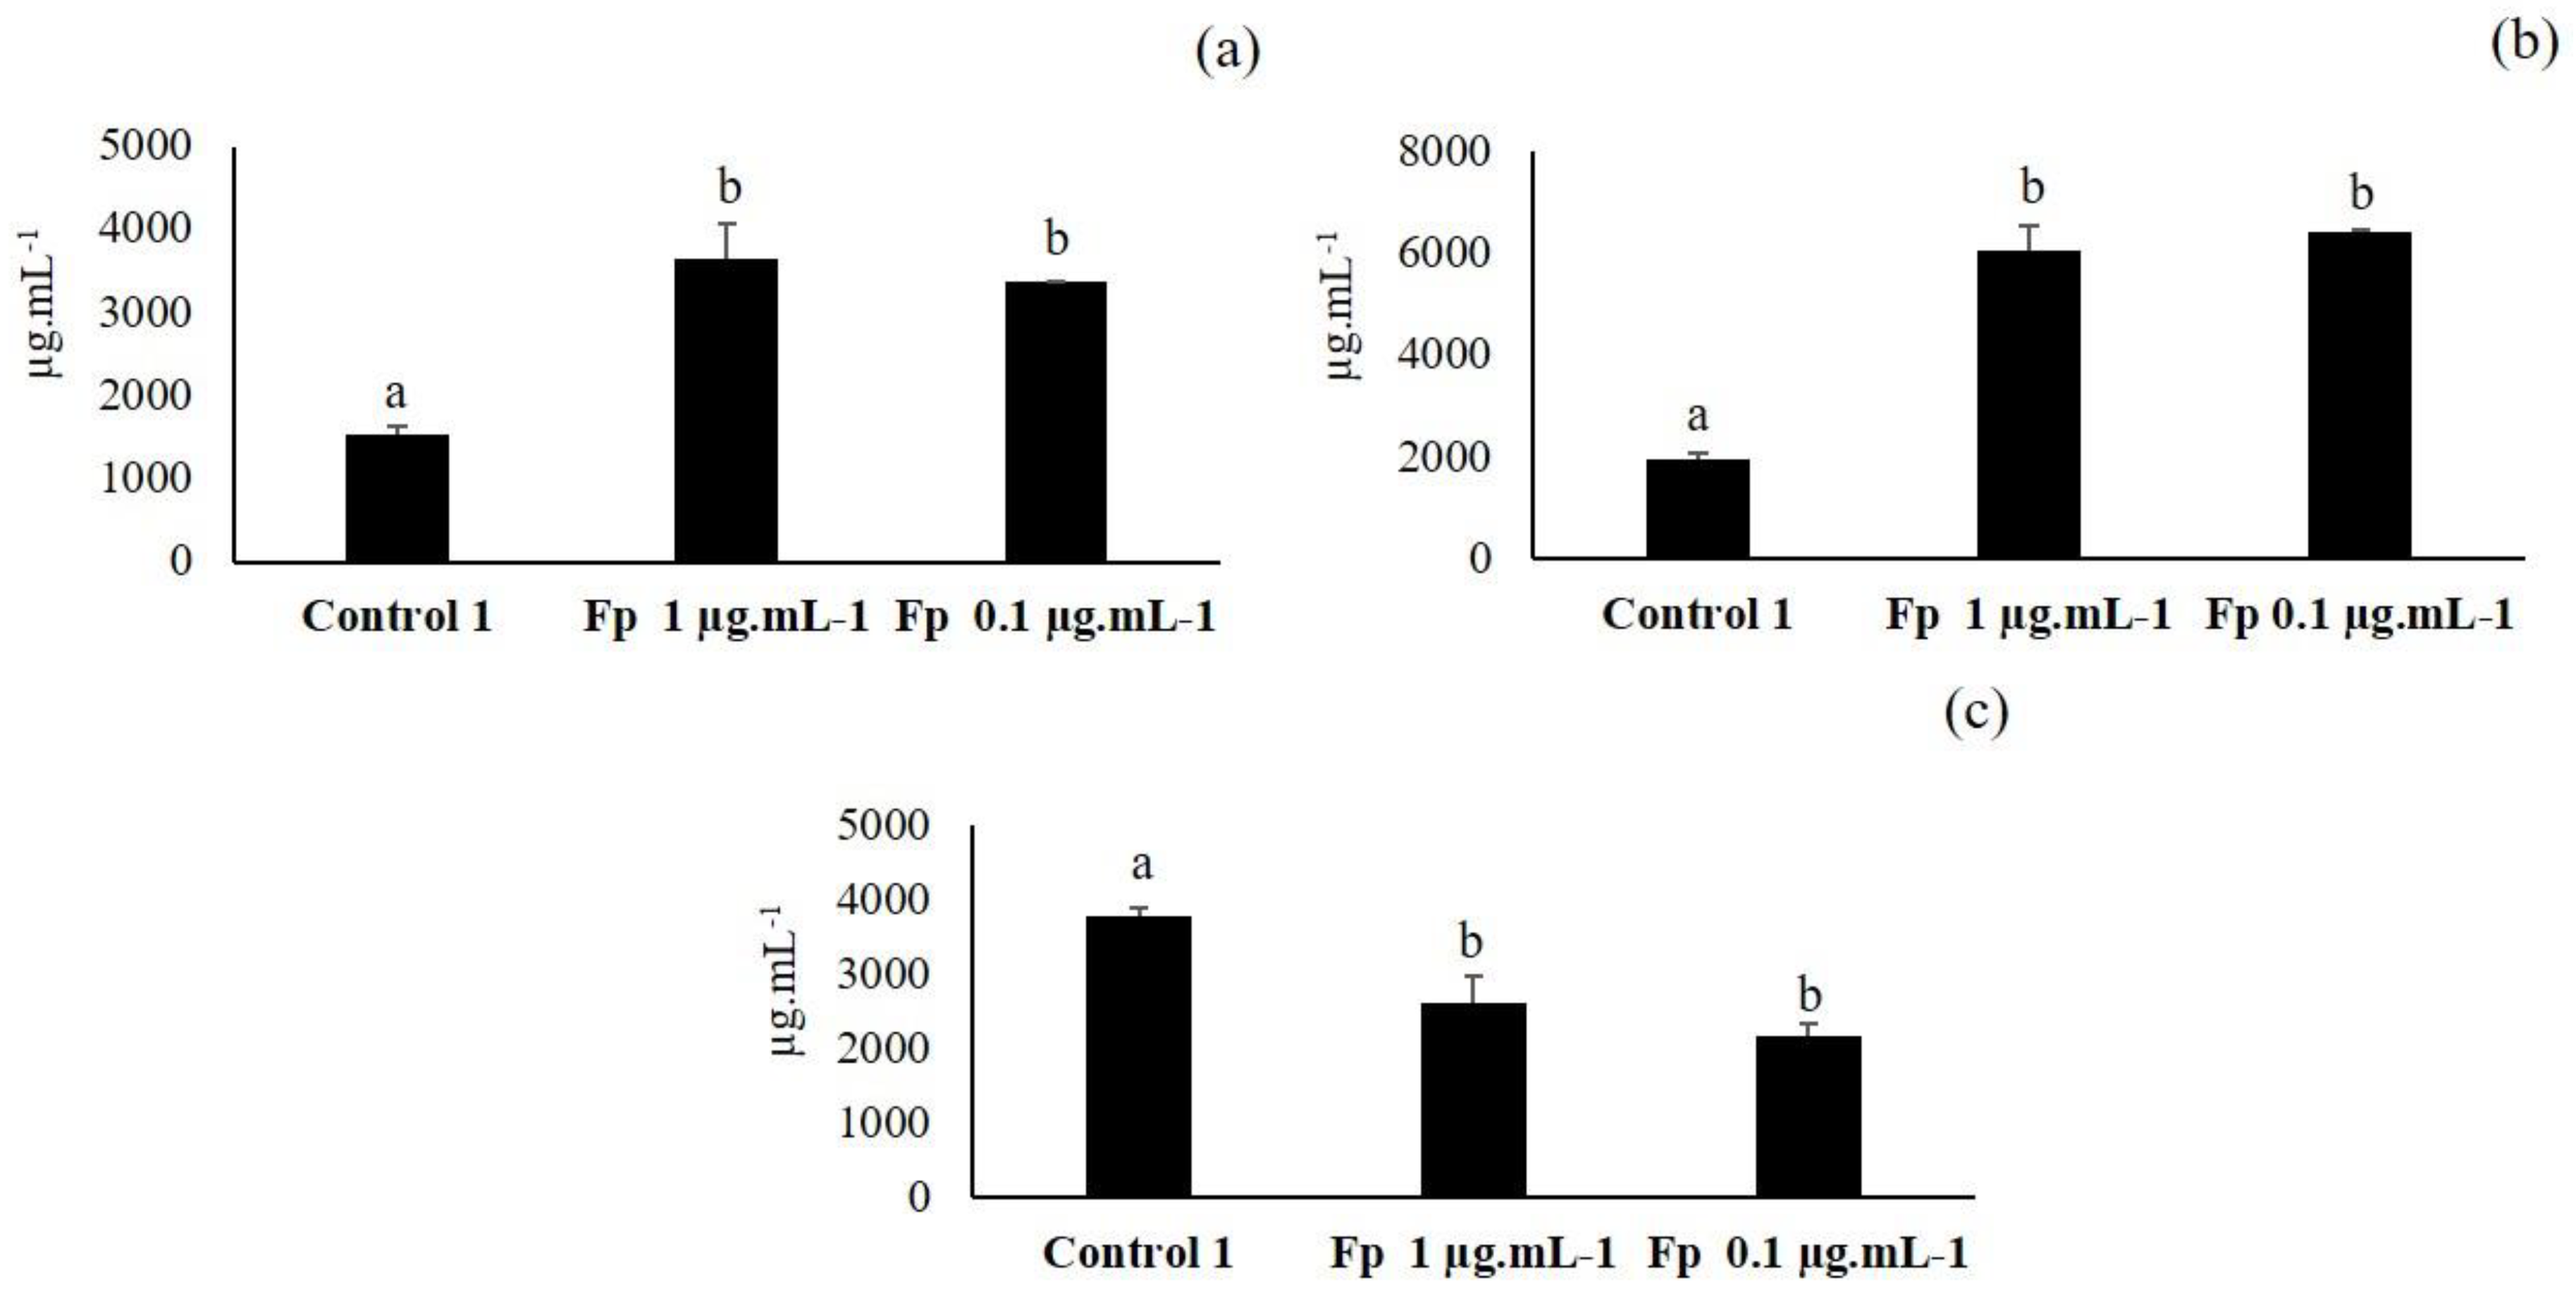
3.5. Third Elicitation of Isoflavone Metabolism in the Soybean
3.6. Fourth Elicitation of Isoflavone Metabolism in the Soybean
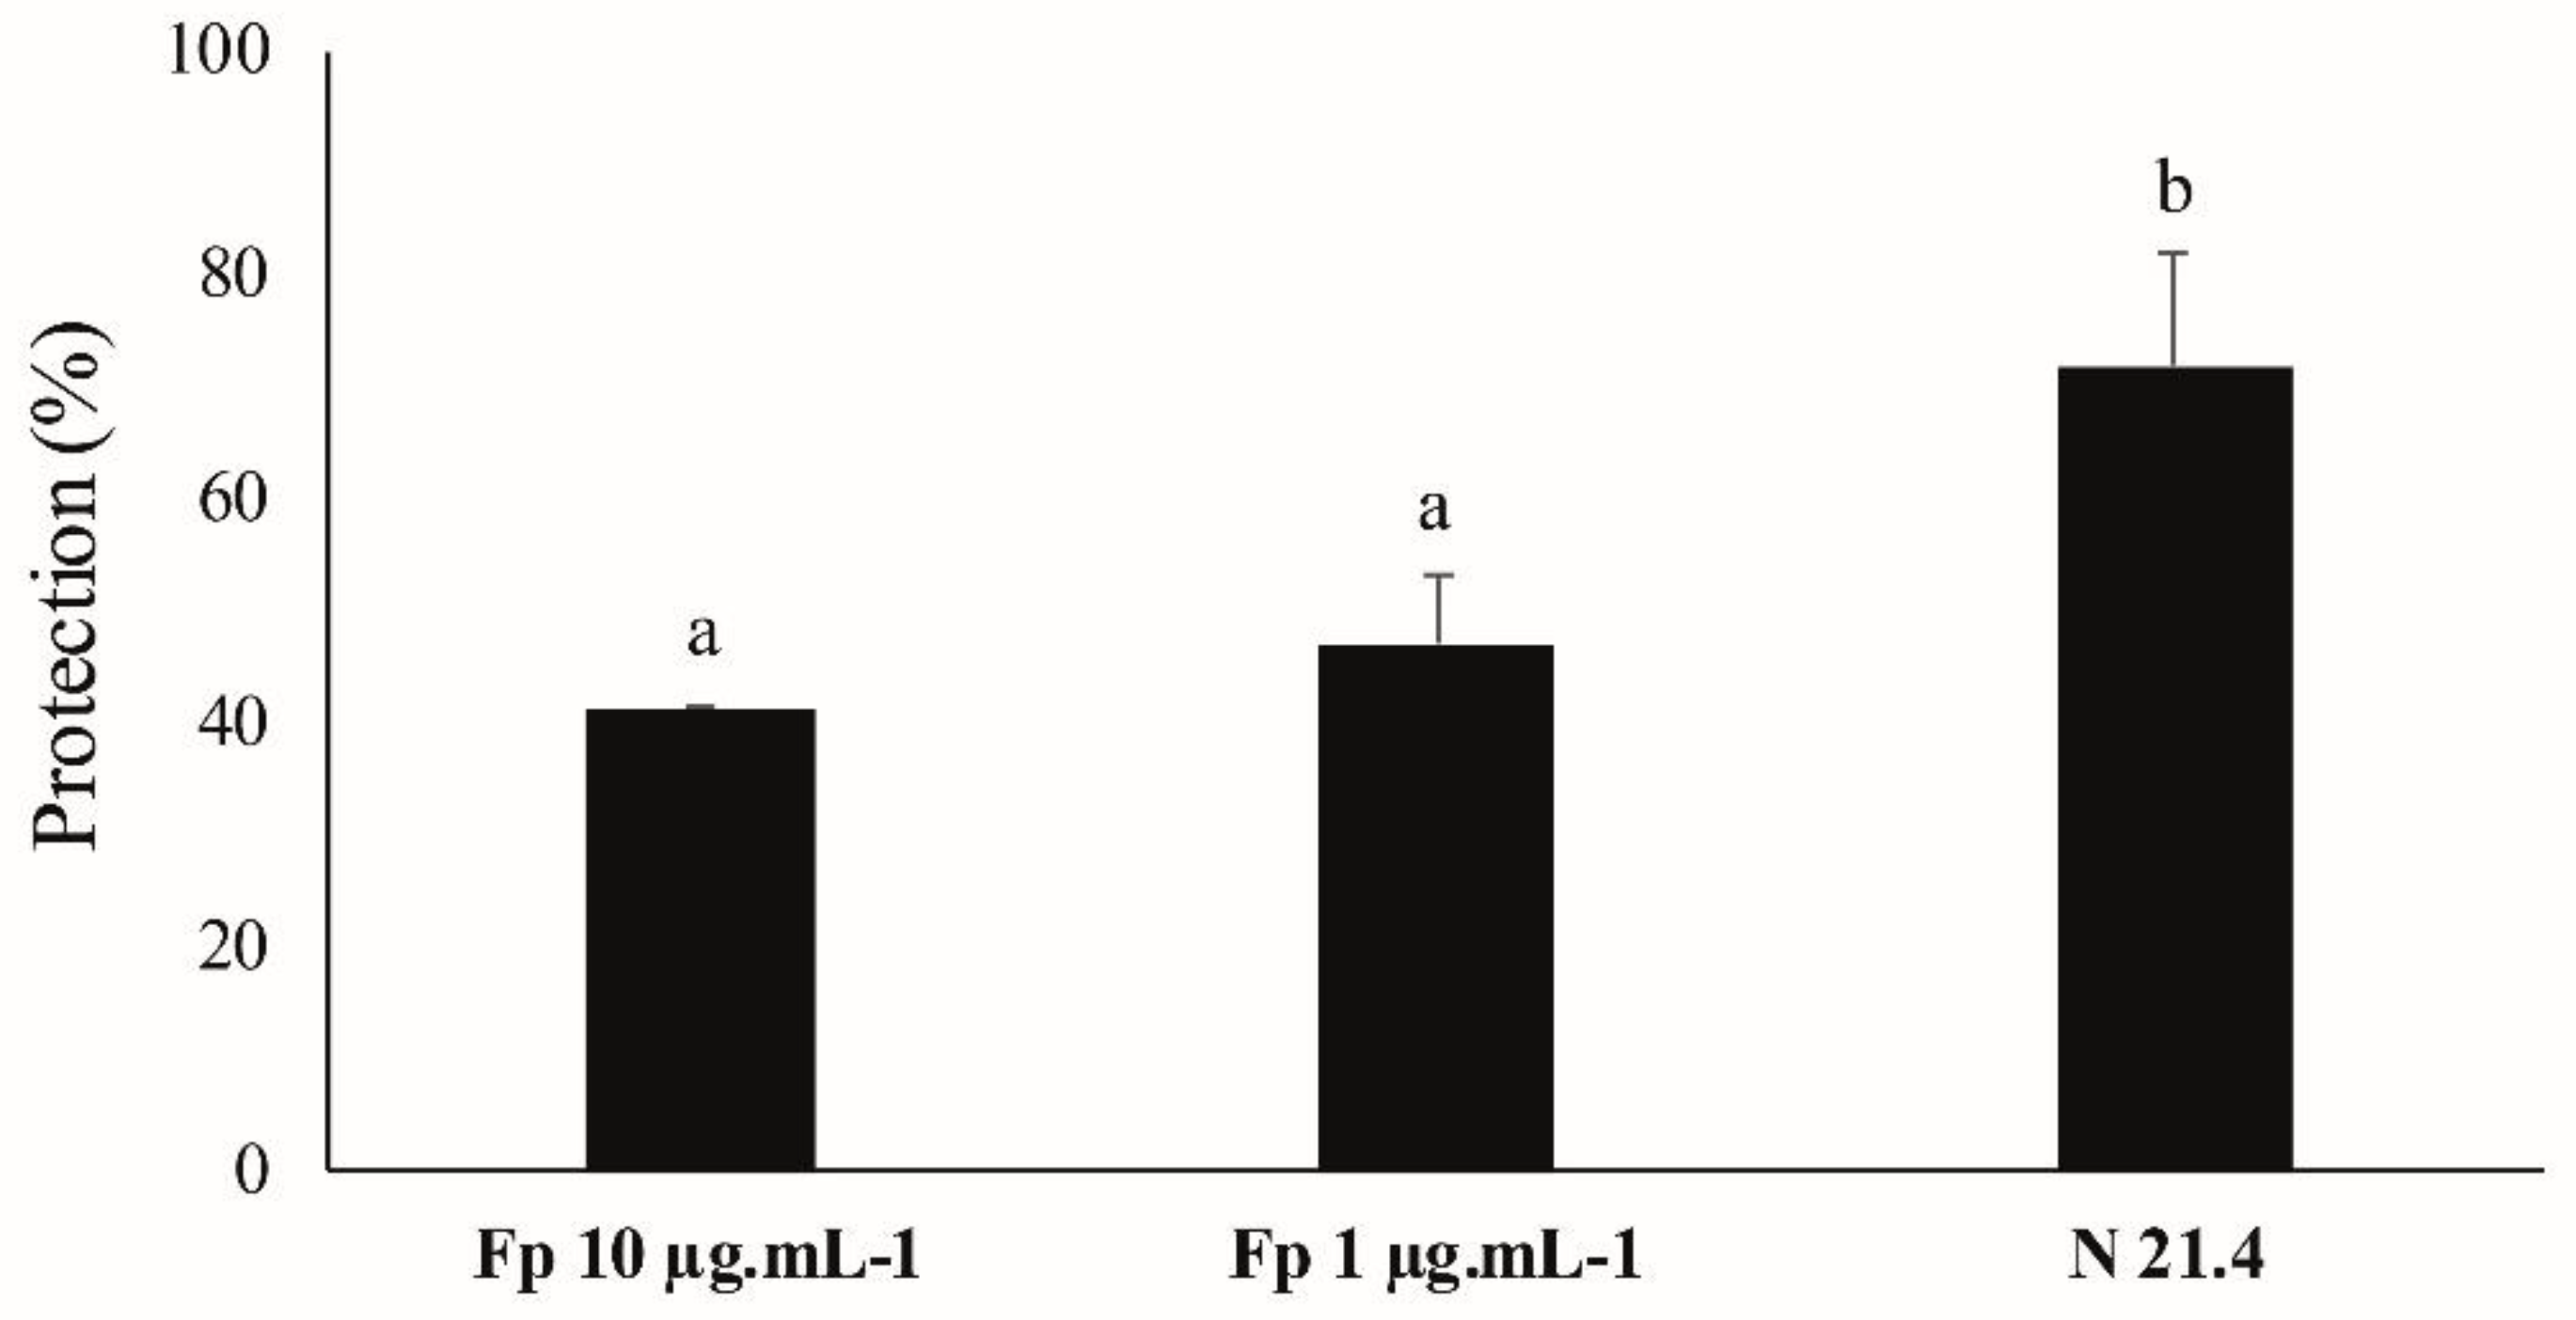
3.7. ISR Experiment
3.8. RT-qPCR Experiment
3.9. Characterization by UHPLC/ESI–QTOF–MS
4. Discussion
5. Conclusions
Supplementary Materials
Author Contributions
Funding
Conflicts of Interest
Abbreviations
| DMSO | Dimethyl sulfoxide |
| ESI | Electrospray ionization source |
| Hapc | Hours after pathogen challenge |
| ISR | Induced systemic resistance |
| JA/ET | Jasmonic acid/Ethylene |
| QTOF-MS | Quadrupole time-of-flight mass spectrometry |
| SA | Salicylic acid |
| TLC | Thin layer chromatography |
| UHPLC | Ultra high performance liquid chromatography |
| VLC | Vacuum liquid chromatography |
References
- Miller, R.; Ge Costa Alves, G.S.; Van Sluys, M.A. Plant immunity: Unravelling the complexity of plant responses to biotic stresses. Ann. Bot. 2017, 119, 681–687. [Google Scholar] [CrossRef] [PubMed]
- Van Loon, L.C.; Bakker, P.; Pieterse, C.M.J. Systemic resistance induced by rhizosphere bacteria. Annu. Rev. Phytopathol. 1998, 36, 453–483. [Google Scholar] [CrossRef] [PubMed]
- Pieterse, C.M.J.; Zamioudis, C.; Berendsen, R.L.; Weller, D.M.; Van Wees, S.C.; Bakker, P.A. Induced Systemic Resistance by Beneficial Microbes. Annu. Rev. Phytopathol. 2014, 52, 347–375. [Google Scholar] [CrossRef] [PubMed]
- Mauch-Mani, G.; Baccelli, I.; Luna, E.; Flors, V. Defense Priming: An Adaptive Part of Induced Resistance. Annu. Rev. Plant Biol. 2017, 68, 485–512. [Google Scholar] [CrossRef]
- Leite, B.; Roncato, L.D.B.; Pascholati, S.F.; Lambais, M.R. Reconhecimento e transdução de sinais moleculares em interações planta-fungos fitopatogênicos. RAPP 1997, 5, 235–280. [Google Scholar]
- Pascholati, S.F. Indução de resistência: Opção para o controle de doenças de plantas no século XXI. Summa Phytopathol. 2003, 29, 115–116. [Google Scholar]
- Van Loon, L.C.; Rep, M.; Pieterse, C.M. Significance of inducible defense-related proteins in infected plants. Annu. Rev. Phytopathol. 2006, 44, 135–162. [Google Scholar] [CrossRef]
- Ebel, J.; Cosio, E.G. Elicitors of plant defense responses. Int. Rev. Cytol. 1994, 148, 1–36. [Google Scholar] [CrossRef]
- Hahn, M.G. Microbial elicitors and their receptors in plants. Ann. Rev. Phytopathol. 1996, 34, 387–412. [Google Scholar] [CrossRef]
- Nürnberger, T. Signal perception in plant pathogen defense. Cell. Mol. Life Sci. 1999, 55, 167–182. [Google Scholar] [CrossRef]
- Gómez-vásquez, R.O.C.Í.O.; Day, R.; Buschmann, H.; Randles, S.; Beeching, J.R.; Cooper, R.M. Phenylpropanoids, phenylalanine ammonia lyase and peroxidases in elicitor-challenged cassava (Manihot esculenta) suspension cells and leaves. Ann. Bot. 2004, 94, 87–97. [Google Scholar] [CrossRef] [PubMed]
- Ramirez-Prado, J.S.; Abulfaraj, A.A.; Rayapuram, N.; Benhamed, M.; Hirt, H. Plant Immunity: From Signalling to Epigenetic Control of Defense. Trends Plant Sci. 2018, 9, 833–844. [Google Scholar] [CrossRef]
- Gozzo, F.; Faoro, F. Systemic Acquired Resistance (50 Years after Discovery): Moving from the Lab to the Field. J. Agric. Food Chem. 2013, 61, 12473–12491. [Google Scholar] [CrossRef] [PubMed]
- Wu, G.; Liu, Y.; Xu, Y.; Zhang, G.; Shen, Q.; Zhang, R. Exploring elicitors of the beneficial rhizobacterium Bacillus amyloliquefaciens SQR9 to induce plant systemic resistance and their interactions with plant signaling pathways. Mol. Plant Microbe Interact. 2018, 31, 560–567. [Google Scholar] [CrossRef]
- Baker, B.; Zambryski, P.; Staskawicz, B.; Dinesh-Kumar, S.P. Signaling in plant–microbe interactions. Science 1997, 276, 726–733. [Google Scholar] [CrossRef] [PubMed]
- Sarma, B.K.; Mehta, S.; Singh, H.B.; Singh, U.P. Plant growth-promoting rhizobacteria elicited alteration in phenolic profile of chickpea (Cicer arietinum) infected by Sclerotium rolfsii. Phytopathol. J. 2002, 150, 277–282. [Google Scholar] [CrossRef]
- Ramos-Solano, B.; Algar, E.; Garcia-Villaraco, A.; Garcia-Cristobal, J.; Lucas Garcia, J.A.; Gutierrez-Manero, F.J. Biotic elicitation of isoflavone metabolism with plant growth promoting rhizobacteria in early stages of development in Glycine max var. Osumi. J. Agric. Food Chem. 2010, 58, 1484–1492. [Google Scholar] [CrossRef]
- Martin-Rivilla, H.; Garcia-Villaraco, A.; Ramos-Solano, B.; Gutierrez-Manero, F.J.; Lucas, J.A. Extracts from cultures of Pseudomonas fluorescens induce defensive patterns of gene expression and enzyme activity while depressing visible injury and reactive oxygen species in Arabidopsis thaliana challenged with pathogenic Pseudomonas syringae. AoB Plants 2019, 11, 1–9. [Google Scholar] [CrossRef]
- De Oliveira, A.G.; Spago, F.R.; Simionato, A.S.; Navarro, M.O.P.; da Silva, C.S.; Barazetti, A.R.; Novello, C.R. Bioactive organocopper compound from Pseudomonas aeruginosa inhibits the growth of Xanthomonas citri subsp. citri. Front Microbiol. 2016, 7, 1–12. [Google Scholar] [CrossRef]
- Ngoroyemoto, N.; Gupta, S.; Kulkarni, M.G.; Finnie, J.F.; Van Staden, J. Effect of organic biostimulants on the growth and biochemical composition of Amaranthus hybridus L. S. Afr. J. Bot. 2019, 124, 1–7. [Google Scholar] [CrossRef]
- Thakur, M.; Sohal, B.S. Role of Elicitors in Inducing Resistance in Plants against Pathogen Infection: A Review. ISRN Biochem. Artic. 2013, 1–10. [Google Scholar] [CrossRef] [PubMed]
- Stockwell, V.O.; Stack, J.P. Using Pseudomonas spp. for Integrated Biological Control. Phytopathology 2007, 97, 244–249. [Google Scholar] [CrossRef] [PubMed]
- Navarro, M.O.P.; Simionato, A.S.; Barazetti, A.R.; dos Santos, I.M.O.; Cely, M.V.T.; Chryssafidis, A.L.; Andrade, G. Disease-Induced resistance and plant immunization using microbes. In Plant-Microbe Interactions in Agro-Ecological Perspectives; Singh, D., Singh, H., Prabha, R., Eds.; Springer: Singapore, 2017; pp. 447–465. [Google Scholar] [CrossRef]
- Gross, H.; Loper, J.E. Genomics of secondary metabolites production by Pseudomonas spp. Nat. Prod. Rep. 2009, 26, 1408–1446. [Google Scholar] [CrossRef] [PubMed]
- Choudhary, D.K.; Prakash, A.; Johri, B.N. Induced systemic resistance (ISR) in plants: Mechanism of action. Indian J. Microbiol. 2007, 47, 289–297. [Google Scholar] [CrossRef] [PubMed]
- Haas, D.; Defágo, G. Biological control of soil-borne pathogens by fluorescent pseudomonads. Nat. Rev. Microb. 2005, 3, 307–319. [Google Scholar] [CrossRef]
- Zzanatta, Z.G.C.; Moura, A.B.; Maia, L.C.; Santos, A.S. Bioassay for selection of biocontroller bacteria against bean common blight (Xanthomonas axonopodis pv. phaseoli). Braz. Microbiol. 2007, 38, 511–515. [Google Scholar] [CrossRef]
- Leisinger, T.; Margraff, R. Secondary metabolites of fluorescent pseudomonads. Microb. Rev. 1979, 43, 422–442. [Google Scholar] [CrossRef]
- Haas, D.; Keel, C.; Laville, J.; Maurhofer, M.; OberhÄnsli, T.; Schinder, U.; Voisard, C.; Wüthrich, B.; Defago, G. Secondary Metabolites of Pseudomonas Fluorescens Strain CHA0 Involved in the Suppression of Root Diseases. In Advances in Molecular Genetics of Plant-Microbe Interactions, Vol. 1. Current Plant Science and Biotechnology in Agriculture; Hennecke, H., Verma, D.P.S., Eds.; Springer: Dordrecht, The Netherland, 1991; Volume 10, pp. 450–456. [Google Scholar] [CrossRef]
- Neidig, N.; Rüdiger, J.P.; Scheu, S.; Jousset, A. Secondary Metabolites of Pseudomonas fluorescens CHA0 Drive Complex Non-Trophic Interactions with Bacterivorous Nematodes. Microb. Ecol. 2011, 61, 853–859. [Google Scholar] [CrossRef]
- Jankiewicz, U.; Koltonowicz, M. The Involvement of Pseudomonas Bacteria in Induced Systemic Resistance in Plants (Review). Appl. Biochem. Microbiol. 2012, 48, 244–249. [Google Scholar] [CrossRef]
- Domenech, J.; Ramos, B.; Probanza, A.; Lucas, J.A.; Gutierrez, F.J. Elicitation of systemic resistance and growth promotion of Arabidopsis thaliana by PGPRs from Nicotiana glauca: A study of the putative induction pathway. Plant Soil. 2007, 290, 43–50. [Google Scholar] [CrossRef]
- Ramos-Solano, B.; Lucas Garcia, J.A.; Garcia-Villaraco, A.; Algar, E.; Garcia-Cristobal, J.; Gutierrez Manero, F.J. Siderophore and chitinase producing isolates from the rhizosphere of Nicotiana glauca Graham enhance growth and induce systemic resistance in Solanum lycopersicum L. Plant Soil. 2010, 334, 189–197. [Google Scholar] [CrossRef]
- Gutiérrez Mañero, F.J.; Algar, E.; Martín Gómez, M.S.; Saco Sierra, M.D.; Ramos-Solano, B. Elicitation of secondary metabolism in Hypericum perforatum by rhizosphere bacteria and derived elicitors in seedlings and shoot cultures. Pharm. Biol. 2012, 50, 10. [Google Scholar] [CrossRef]
- Bonilla, A.; Sarria, A.L.; Algar, E.; Ledesma, F.J.; Ramos-Solano, B.; Fernandes, J.B.; Gutierrez-Mañero, F.J. Microbe associated molecular patterns from rhizosphere bacteria trigger germination and Papaver somniferum metabolism under greenhouse conditions. Plant Physiol. Biochem. 2014, 74, 133–140. [Google Scholar] [CrossRef] [PubMed]
- Ramos-Solano, B.; Garcia-Villaraco, A.; Gutierrez-Manero, F.J.; Lucas, J.A.; Bonilla, A.; Garcia-Seco, D. Annual changes in bioactive contents and production in field-grown blackberry after inoculation with Pseudomonas fluorescens. Plant Physiol. Biochem. 2014, 74, 1–8. [Google Scholar] [CrossRef]
- Garcia-Seco, D.; Zhang, Y.; Gutierrez-Manero, F.J.; Martin, C.; Ramos-Solano, B. Application of Pseudomonas fluorescens to blackberry under field conditions improves fruit quality by modifying flavonoid metabolism. PLoS ONE 2015, 10, e0142639. [Google Scholar] [CrossRef]
- Martin-Rivilla, H.; Garcia-Villaraco, A.; Ramos-Solano, B.; Gutierrez-Manero, F.J.; Lucas, J.A. Improving flavonoid metabolism in blackberry leaves and plant fitness by using the bioeffector Pseudomonas fluorescens N 21.4 and its metabolic elicitors: A biotechnological approach for a more sustainable crop. J. Agric. Food Chem. 2020, in press. [Google Scholar] [CrossRef]
- Martin-Rivilla, H.; Garcia-Villaraco, A.; Ramos-Solano, B.; Gutierrez-Manero, F.J.; Lucas, J.A. Metabolic elicitors of Pseudomonas fluorescens N 21.4 elicit flavonoid metabolism in blackberry fruit. J. Sci. Food Agric. 2020, in press. [Google Scholar] [CrossRef]
- Sumayo, M.; Hahm, M.S.; Ghim, S.Y. Determinants of Plant Growth-promoting Ochrobactrum lupini KUDC1013 Involved in Induction of Systemic Resistance against Pectobacterium carotovorum subsp. carotovorum in Tobacco Leaves. Plant Pathol. J. 2013, 29, 174–181. [Google Scholar] [CrossRef]
- Wang, C.C.; Prasaina, J.K.; Barnesa, S. Review of the methods used in the determination of phytoestrogens. J. Chromatogr. B 2002, 777, 3–28. [Google Scholar] [CrossRef]
- Lozovaya, V.V.; Lygin, A.V.; Zernova, O.V.; Li, S.; Hartman, G.L.; Widholm, J.M. Isoflavonoid accumulation in soybean hairy roots upon treatment with Fusarium solani. Plant Physiol. Biochem. 2004, 42, 671–679. [Google Scholar] [CrossRef]
- Remans, T.; Smeets, K.; Opdenakker, K.; Mathijsen, D.; Vangronsveld, J.; Cuypers, A. Normalisation of real-time RT-PCR gene expression measurements in Arabidopsis thaliana exposed to increased metal concentrations. Planta 2008, 227, 1343–1349. [Google Scholar] [CrossRef] [PubMed]
- Hillwig, M.L.; Zhu, Q.; Liu, X. Biosynthesis of ambiguine indole alkaloids in cyanobacterium Fischerella ambigua. ACS Chem. Biol. 2013, 9, 372–377. [Google Scholar] [CrossRef] [PubMed]
- Siebers, M.; Brands, M.; Wewer, V.; Duan, Y.; Holzl, G.; Dormann, P. Lipids in plant-microbe interactions. Biochim. Biophys. Acta 2016, 1861, 1379–1395. [Google Scholar] [CrossRef] [PubMed]
- Lenarcic, T.; Albert, I.; Bohm, H.; Hodnik, V.; Pirc, K.; Zavec, A.B.; Podobnik, M.; Pahovnik, D.; Zagar, E.; Pruitt, R.; et al. Eudicot plant-specific sphingolipids determine host selectivity of microbial NLP cytolysins. Science 2017, 358, 1431–1434. [Google Scholar] [CrossRef] [PubMed]
- Ali, U.; Li, H.; Wuang, X.; Guo, L. Emerging Roles of Sphingolipid Signaling in Plant Response to Biotic and Abiotic Stresses. Mol. Plant 2018, 11, 1328–1343. [Google Scholar] [CrossRef]
- Sokal, R.R.; Rohlf, F.J. Introducción a la bioestadística; Editorial Reverte SA: Barcelona, Spain, 1980. [Google Scholar]
- Yin, X.; Feng, T.; Liu, J.K. Structures and cytotoxicities of three new sesquiterpenes from cultures of Armillaria sp. Nat. Prod. Bioprospect 2012, 2, 245. [Google Scholar] [CrossRef][Green Version]
- Jing, W.; Zhang, X.X.; Zhou, H.; Wang, Y.; Yang, M.; Long, L.; Gao, H. Naturally occurring cassane diterpenoids (CAs) of Caesalpinia: A systematic review of its biosynthesis, chemistry and pharmacology. Fitoterapia 2019, 134, 226–249. [Google Scholar] [CrossRef]
- Lopes, L.P.; Oliveira, J.G., Jr.; Beranger, J.P.O.; Góis, C.G.; Vasconcellos, F.C.S.; San Martin, J.A.B.; Andrade, C.G.T.J.; Mello, J.C.P.; Andrade, G. Activity of extracellular compounds of Pseudomonas sp. against Xanthomonas axonopodis in vitro and bacterial leaf blight in eucaliptus. Trop. Plant Pathol. 2012, 37, 4. [Google Scholar] [CrossRef]
- Liu, L.; Sonbol, F.M.; Huot, B.; Gu, Y.; Withers, J.; Mwimba, M.; Yao, J.; He, S.Y.; Dong, X. Salicylic acid receptors activate jasmonic acid signalling through a non-canonical pathway to promote effector-triggered immunity. Nat. Commun. 2016, 7, 13099. [Google Scholar] [CrossRef]
- Betsuyaku, S.; Katou, S.; Takebayashi, Y.; Sakakibara, H.; Fukuda, H. Salicylic Acid and Jasmonic Acid Pathways are Activated in Spatially Different Domains Around the Infection Site During Effector-Triggered Immunity in Arabidopsis thaliana. Plant Cell Physiol. 2017, 59, 8–16. [Google Scholar] [CrossRef]
- Caarls, L.; Pieterse, C.M.J.; Van Wees, S.C.M. How salicylic acid takes transcriptional control over jasmonic acid signaling. Front Plant Sci. 2015, 6, 1–11. [Google Scholar] [CrossRef] [PubMed]
- Becher, P.G.; Keller, S.; Jung, G.; Roderich, D.S.; Juttner, F. Insecticidal activity of 12-epi-hapalindole J isonitrile. Phytochemistry 2007, 68, 2493–2497. [Google Scholar] [CrossRef] [PubMed]
- Smitka, T.A.; Bonjouklian, R.; Doolin, L.; Jones, N.D.; Deeter, J.B.; Yoshida, W.Y.; Prinsep, M.R.; Moore, R.E.; Patterson, G.M.L. Ambiguine isonitriles, fungicidal hapalindole-type alkaloids from three genera of blue-green algae belonging to the Stigonemataceae. J. Organ. Chem. 1992, 57, 857–861. [Google Scholar] [CrossRef]
- Mo, S.Y.; Krunic, A.; Chlipala, G.; Orjala, J. Antimicrobial ambiguine isonitriles from the cyanobacterium Fischerella ambigua. J. Nat. Prod. 2009, 72, 894–899. [Google Scholar] [CrossRef] [PubMed]
- Mo, S.Y.; Krunic, A.; Santarsiero, B.D.; Franzblau, S.G.; Orjala, J. Hapalindole-related alkaloids from the cultured cyanobacterium Fischerella ambigua. Phytochemistry 2010, 71, 2116–2123. [Google Scholar] [CrossRef] [PubMed]
- Lozano, G.L.; Park, H.B.; Bravo, J.I.; Armstrong, E.A.; Denu, J.M.; Stabb, E.V.; Broderick, N.A.; Crawford, J.M.; Handelsman, J. Bacterial Analogs of Plant Tetrahydropyridine Alkaloids Mediate Microbial Interactions in a Rhizosphere Model System. Appl. Environ. Microb. 2019, 85, e03058-18. [Google Scholar] [CrossRef] [PubMed]
- Heaver, S.L.; Johnson, L.E.; Ley, R.E. Sphingolipids in host–microbial interactions. Curr. Opin. Microbiol. 2018, 43, 92–99. [Google Scholar] [CrossRef]
- Giorni, P.; Dall’Asta, C.; Reverberi, M.; Scala, V.; Ludovici, M.; Cirlini, M.; Galaverna, G.; Fanelli, C.; Battilani, P. Open Field Study of Some Zea mays Hybrids, Lipid Compounds and Fumonisins Accumulation. Toxins 2015, 7, 3657–3670. [Google Scholar] [CrossRef]
- Dall’Asta, C.; Giorni, P.; Cirlini, M.; Gregori, R.; Ludovici, M.; Camera, E.; Fanelli, C.; Battilani, P.; Scala, V. Maize lipids play a pivotal role in the fumonisin accumulation. World Mycotoxin J. 2015, 8, 87–97. [Google Scholar] [CrossRef]
- Vorholt, J.A. Microbial life in the phyllosphere. Nat. Rev. Microbiol. 2012, 10, 828–840. [Google Scholar] [CrossRef]
- Saïdana, D.; Mahjoub, M.A.; Boussaada, O.; Chriaa, J.; Chéraif, I.; Daami, M.; Mighri, Z.; Helal, N. Chemical composition and antimicrobial activity of volatile compounds of Tamarix boveana (Tamaricaceae). Microbiol. Res. 2006, 163, 445–455. [Google Scholar] [CrossRef] [PubMed]
- Selim, S.A.; Aziz, M.H.A.; Mashait, M.S.; Warrad, M.F. Antibacterial activities, chemical constitutes and acute toxicity of Egyptian Origanum majorana L.; Peganum harmala L. and Salvia officinalis L. essential oils. Afr. J. Pharm. Pharm. 2013, 7, 725–735. [Google Scholar] [CrossRef]
- Choudhary, N.; Singh, V. Piper longum Linn: A review of its phytochemicals and their network pharmacological evaluation. PLoS ONE 2018, 13, e0191006. [Google Scholar] [CrossRef]
- Kiran, G.S.; Sabarathnam, B.; Selvin, J. Biofilm disruption potential of a glycolipid biosurfactant from marine Brevibacterium casei. Femns Immunol. Med. Microbiol. 2010, 59, 432–438. [Google Scholar] [CrossRef]
- Al-Jassaci, M.; Mohammed, G.; Hameed, I. Secondary metabolites analysis of Saccharomyces cerievisiae and evaluation of antibacterial activity. Int. J. Pharm. Clin. Res 2016, 8, 304–315. [Google Scholar]
- Anderson, R. Alkylamines: Novel lipid constituents in Deinococcus radiodurans. BBA-Gen Subj. 1983, 753, 266–268. [Google Scholar] [CrossRef]
- Nakano, C.; Kudo, F.; Eguchi, T.; Ohnishi, Y. Genome mining reveals two novel bacterial sesquiterpene cyclases: (-)-germacradien-4-ol and (-)-epi-alpha-bisabolol synthases from Streptomyces citricolor. Chembiochem 2011, 12, 2271–2275. [Google Scholar] [CrossRef]
- Yamada, Y.; Kuzuyama, T.; Komatsu, M.; Shin-Ya, K.; Omura, S.; Cane, D.E.; Ikeda, H. Terpene synthases are widely distributed in bacteria. Proc. Natl. Acad. Sci. USA 2014, 112, 857–862. [Google Scholar] [CrossRef]
- Fraga, B.M. Natural sesquiterpenoids. Nat. Prod. Rep. 2013, 30, 1226–1264. [Google Scholar] [CrossRef]
- Bohnert, M.; Nutzmann, H.W.; Schroeckh, V.; Horn, F.; Dahse, H.M.; Brakhage, A.A.; Hoffmeister, D. Cytotoxic and antifungal activities of melleolide antibiotics follow dissimilar structure-activity relationships. Phytochemistry 2014, 105, 101–108. [Google Scholar] [CrossRef]
- Helfrich, E.J.N.; Lin, G.M.; Voigt, C.A.; Clardy, J. Bacterial terpene biosynthesis: Challenges and opportunities for pathway engineering. Beilstein J. Organ. Chem. 2019, 15, 2889–2906. [Google Scholar] [CrossRef] [PubMed]
- Blin, K.; Pascal Andreu, V.; de los Santos, E.L.C.; Del Carratore, F.; Lee, S.Y.; Medema, M.H.; Weber, T. The antiSMASH database version 2: A comprehensive resource on secondary metabolite biosynthetic gene clusters. Nucleic Acids Res. 2019, 47, D625–D630. [Google Scholar] [CrossRef] [PubMed]
- Medema, M.H.; Kottmann, R.; Yilmaz, P.; Cummings, M.; Biggins, J.B.; Blin, K.; de Bruijn, I.; Chooi, Y.H.; Claesen, J.; Coates, R.C.; et al. Minimum Information about a Biosynthetic Gene cluster. Nat. Chem. Biol. 2015, 11, 625–631. [Google Scholar] [CrossRef] [PubMed]
- Kanda, N.; Ishizaki, N.; Inoue, M.; Oshima, A.; Handa, T.; Kitahara, J. Antibiotic. DB 23–73, a new alkylresorcinol antibiotic. J. Antibiot. Res. 1975, 28, 935–942. [Google Scholar] [CrossRef] [PubMed][Green Version]
- Budzikiewicz, H.; Scholl, W.; Neuenhaus, G.; Pulverer, H.; Korth, Z.; Naturforsch, C. Dialkyl Resorcinols from Pseudomonas aureofaciens. Z. Naturforsch. 1980, 35, 909–910. [Google Scholar] [CrossRef]


| Method Used | Treatment | Characteristics | Use |
|---|---|---|---|
| Growth in nutrient broth | P. fluorescens N 21.4 | 10 L 109 ufc.mL−1 | Liquid-Liquid separation ISR as positive control |
| Liquid-Liquid separation (bacterial culture) | Dry extract | 250 mg Aliquots dissolved in 10% DMSO | 1st Isoflavone elicitation: Concentration optimization (1000,100,10 µg·mL−1) 1st VLC |
| Liquid-Liquid separation (nutrient broth) | Control 1 | Dissolved in 10% DMSO | 1st,2nd,3rd and 4th isoflavone elicitation 1st and 2nd TLCs ISR as 0% of protection |
| Seed embryo cut | Control 2 | Not inoculated soybean seeds | 1st Isoflavone elicitation |
| 1st VLC with dry extract | F1 F2 F3 F4 | Hexane Dichloromethane Ethyl acetate Methanol | 1st TLC 1st TLC 1st TLC 1st TLC |
| 1st TLC with F1, F2, F3 and F4 | F1 F2 | 100 µg·mL−1 100 µg·mL−1 | 2nd Isoflavone elicitation |
| 2nd VLC with F1 | F1.1 F1.2 | Hexane Dichloromethane | 2nd TLC 2nd TLC |
| 2nd TLC with F1.1 and F1.2 | F1.1 | 100 µg·mL−1 | 3rd Isoflavone elicitation |
| Purification of F1.1 | Fp (Purest fraction) | 1, 0.1 µg·mL−1 | 4th Isoflavone elicitation |
| ISR in A. thaliana | Fp | 10, 1 µg·mL−1 | Pathogen protection (%) qPCR (SA and JA/ET marker genes) |
| UHPLC/ESI–QTOF–MS | Fp | 0.19 mg in 100 mL methanol LC-MS grade | Tentative compound identification |
| Forward Primer | Reverse Primer | |
|---|---|---|
| AtNPR1 | 5′-TATTGTCAARTCTRATGTAGAT | 5′-TATTGTCAARTCTRATGTAGAT |
| AtPR1 | 5′-AGTTGTTTGGAGAAAGTCAG | 5′-GTTCACATAATTCCCACGA |
| AtICS | 5′-GCAAGAATCATGTTCCTACC | 5′AATTATCCTGCTGTTACGAG |
| AtPDF1 | 5′-TTGTTCTCTTTGCTGCTTTCGA | 5′-TTGGCTTCTCGCACAACTTCT |
| AtLOX2 | 5′-ACTTGCTCGTCCGGTAATTGG | 5′-GTACGGCCTTGCCTGTGAATG |
| AtPR3 | 5′-AAATCAACCTAGCAGGCCACT | 5′-GAGGGAGAGGAACACCTTGACT |
| Sand | 5′-CTGTCTTCTCATCTCTTGTC | 5′-TCTTGCAATATGGTTCCTG |
| 10 µg·mL−1 | 1 µg·mL−1 | ||||||
|---|---|---|---|---|---|---|---|
| 6 hapc | 12 hapc | 24 hapc | 6 hapc | 12 hapc | 24 hapc | ||
| SA | PR1 | 1.2 ± 0.02 * | 5.35 ± 0.06 * | 0 | 0.83 ± 0 | 0 | 0 |
| NPR1 | 2.44 ± 0.21 * | 1.1 ± 0.05 | 0.73 ± 0 | 2.65 ± 0.13 * | 1.2 ± 0.03 * | 0 | |
| ICS | 1.66 ± 0.12 * | 0.66 ± 0.01 * | 0 | 2.02 ± 0.03 * | 1.47 ± 0.03 * | 0 | |
| JA/ET | PDF1 | 1.23 ± 0.01 * | 0 | 0 | 2.36 ± 0.02 * | 0 | 0 |
| LOX2 | 1.79 ± 0.06 * | 0.73 ± 0.03 | 0 | 0.9 ± 0.01 | 0 | 0 | |
| PR3 | 1.7 ± 0 * | 0.72 ± 0 | 0 | 3.4 ± 0.06 * | 1.31 ± 0.1 * | 0 | |
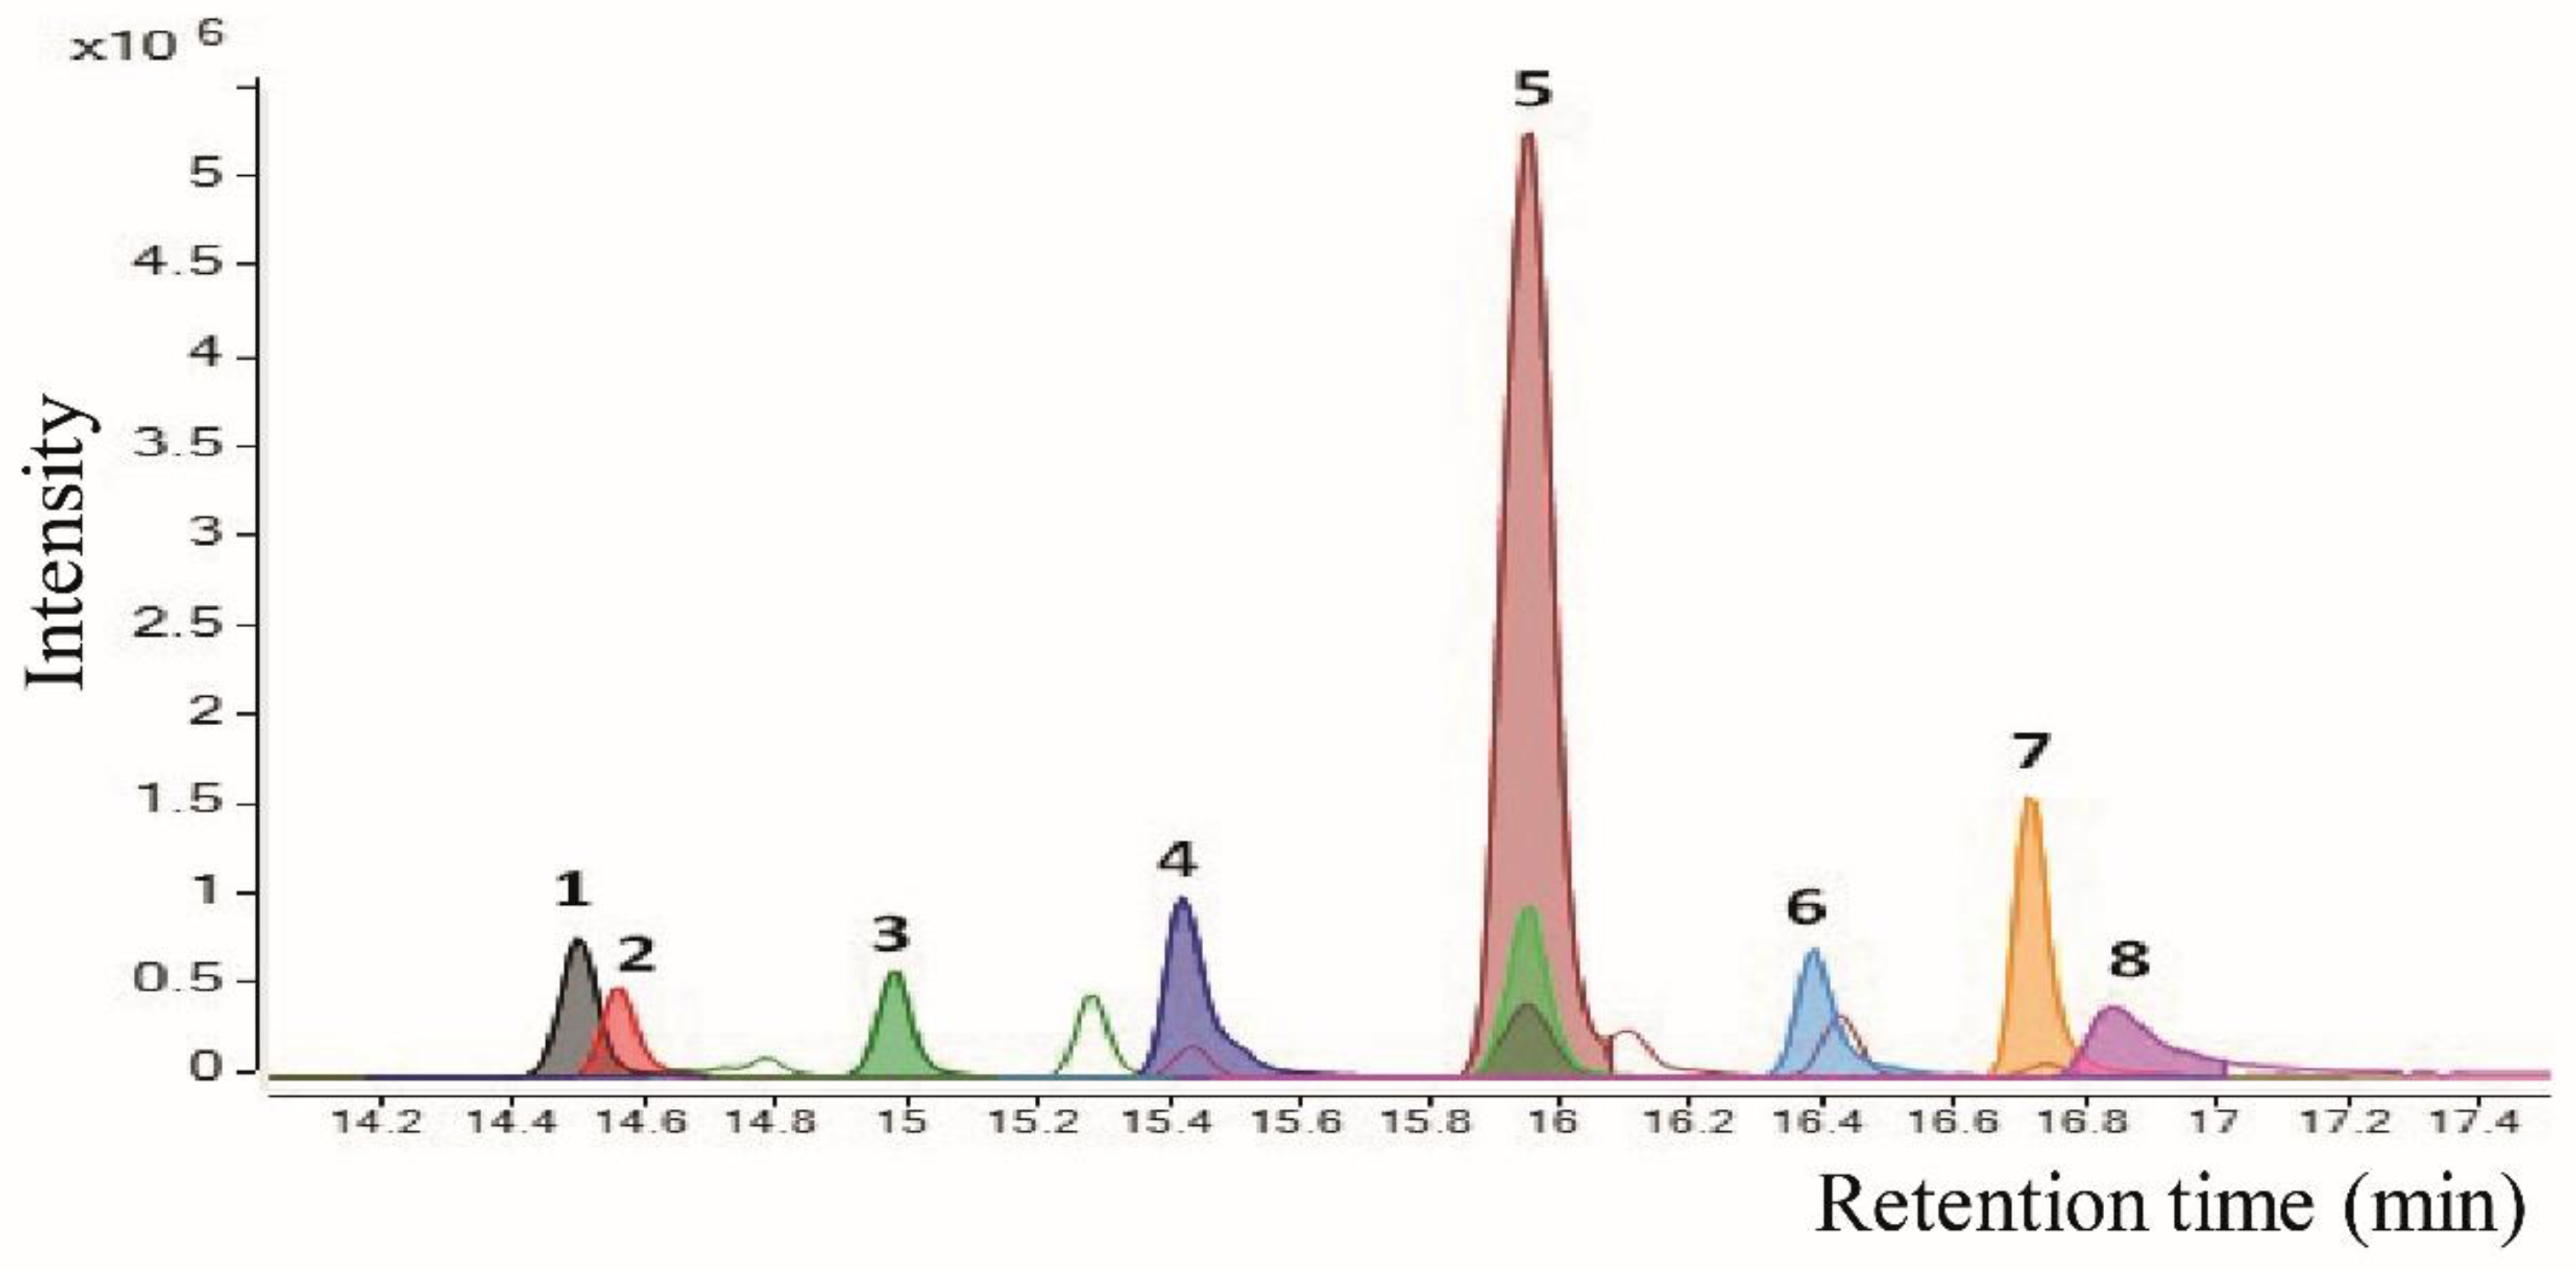
| nº | Tentative Annotation a | Rt (min) | Molecular Formula | Monoisotopic Mass | m/z Experimental | Fragments (MS2) |
|---|---|---|---|---|---|---|
| Unknowns | ||||||
| 1 | Unknown | 14.5 | C17H14N2S | 278.0878 | [M + Na]+ = 301.0762 | - |
| Alkaloids | ||||||
| 2 | - | 14.6 | C25H29NO | 359.2249 | [M + H]+ = 360.2333 | - |
| Amino lipids | ||||||
| 3 | Sphinganine C17 | 14.9 | C17H37NO2 | 287.2824 | [M + H]+ = 288.2999 [M + Na]+ = 310. | - |
| 8 | 1-Nonadecanamine | 16.8 | C19H41N | 283.3239 | [M + H]+ = 284.3320 | - |
| Terpenoids | ||||||
| 5 | - | 15.9 | C24H30O6 | 414.2042 | [M + Na]+ = 437.1946 [M + H]+ = 415.2121 [M + K]+ = 453.1680 [2M + Na]+ = 851.3989 [M + FA-H]− = 459.2029 | 303.1214, 73.0661 338.4838, 325.1891, 277.1818, 141.4137, 104.2879, 90.6591 |
| Arylalkylamines | ||||||
| 4 | N-benzyl-1-tetradecanamine | 15.4 | C21H37N | 303.2926 | [M + H]+ = 304.3003 | 212.2379, 91.0544, 65.0383, 58.0652 |
| 6 | N-benzyl-1-hexadecanamine | 16.4 | C23H41N | 331.3239 | [M + H]+ = 332.3320 | 240.2682, 91.0544, 69.0694, 58.0652 |
| 7 | N-benzyl-1-octadecanamine | 17.3 | C25H46N | 325.3709 | [M + H]+ = 360.3622 | 268.2993, 91.0544, 85.0652, 58.0652 |
© 2020 by the authors. Licensee MDPI, Basel, Switzerland. This article is an open access article distributed under the terms and conditions of the Creative Commons Attribution (CC BY) license (http://creativecommons.org/licenses/by/4.0/).
Share and Cite
Martin-Rivilla, H.; Gutierrez-Mañero, F.J.; Gradillas, A.; P. Navarro, M.O.; Andrade, G.; Lucas, J.A. Identifying the Compounds of the Metabolic Elicitors of Pseudomonas fluorescens N 21.4 Responsible for Their Ability to Induce Plant Resistance. Plants 2020, 9, 1020. https://doi.org/10.3390/plants9081020
Martin-Rivilla H, Gutierrez-Mañero FJ, Gradillas A, P. Navarro MO, Andrade G, Lucas JA. Identifying the Compounds of the Metabolic Elicitors of Pseudomonas fluorescens N 21.4 Responsible for Their Ability to Induce Plant Resistance. Plants. 2020; 9(8):1020. https://doi.org/10.3390/plants9081020
Chicago/Turabian StyleMartin-Rivilla, Helena, F. Javier Gutierrez-Mañero, Ana Gradillas, Miguel O. P. Navarro, Galdino Andrade, and José A. Lucas. 2020. "Identifying the Compounds of the Metabolic Elicitors of Pseudomonas fluorescens N 21.4 Responsible for Their Ability to Induce Plant Resistance" Plants 9, no. 8: 1020. https://doi.org/10.3390/plants9081020
APA StyleMartin-Rivilla, H., Gutierrez-Mañero, F. J., Gradillas, A., P. Navarro, M. O., Andrade, G., & Lucas, J. A. (2020). Identifying the Compounds of the Metabolic Elicitors of Pseudomonas fluorescens N 21.4 Responsible for Their Ability to Induce Plant Resistance. Plants, 9(8), 1020. https://doi.org/10.3390/plants9081020