Predicting the Suitable Geographical Distribution of Sinadoxa Corydalifolia under Different Climate Change Scenarios in the Three-River Region Using the MaxEnt Model

 ,
, 
Abstract
1. Introduction
2. Materials and Methods
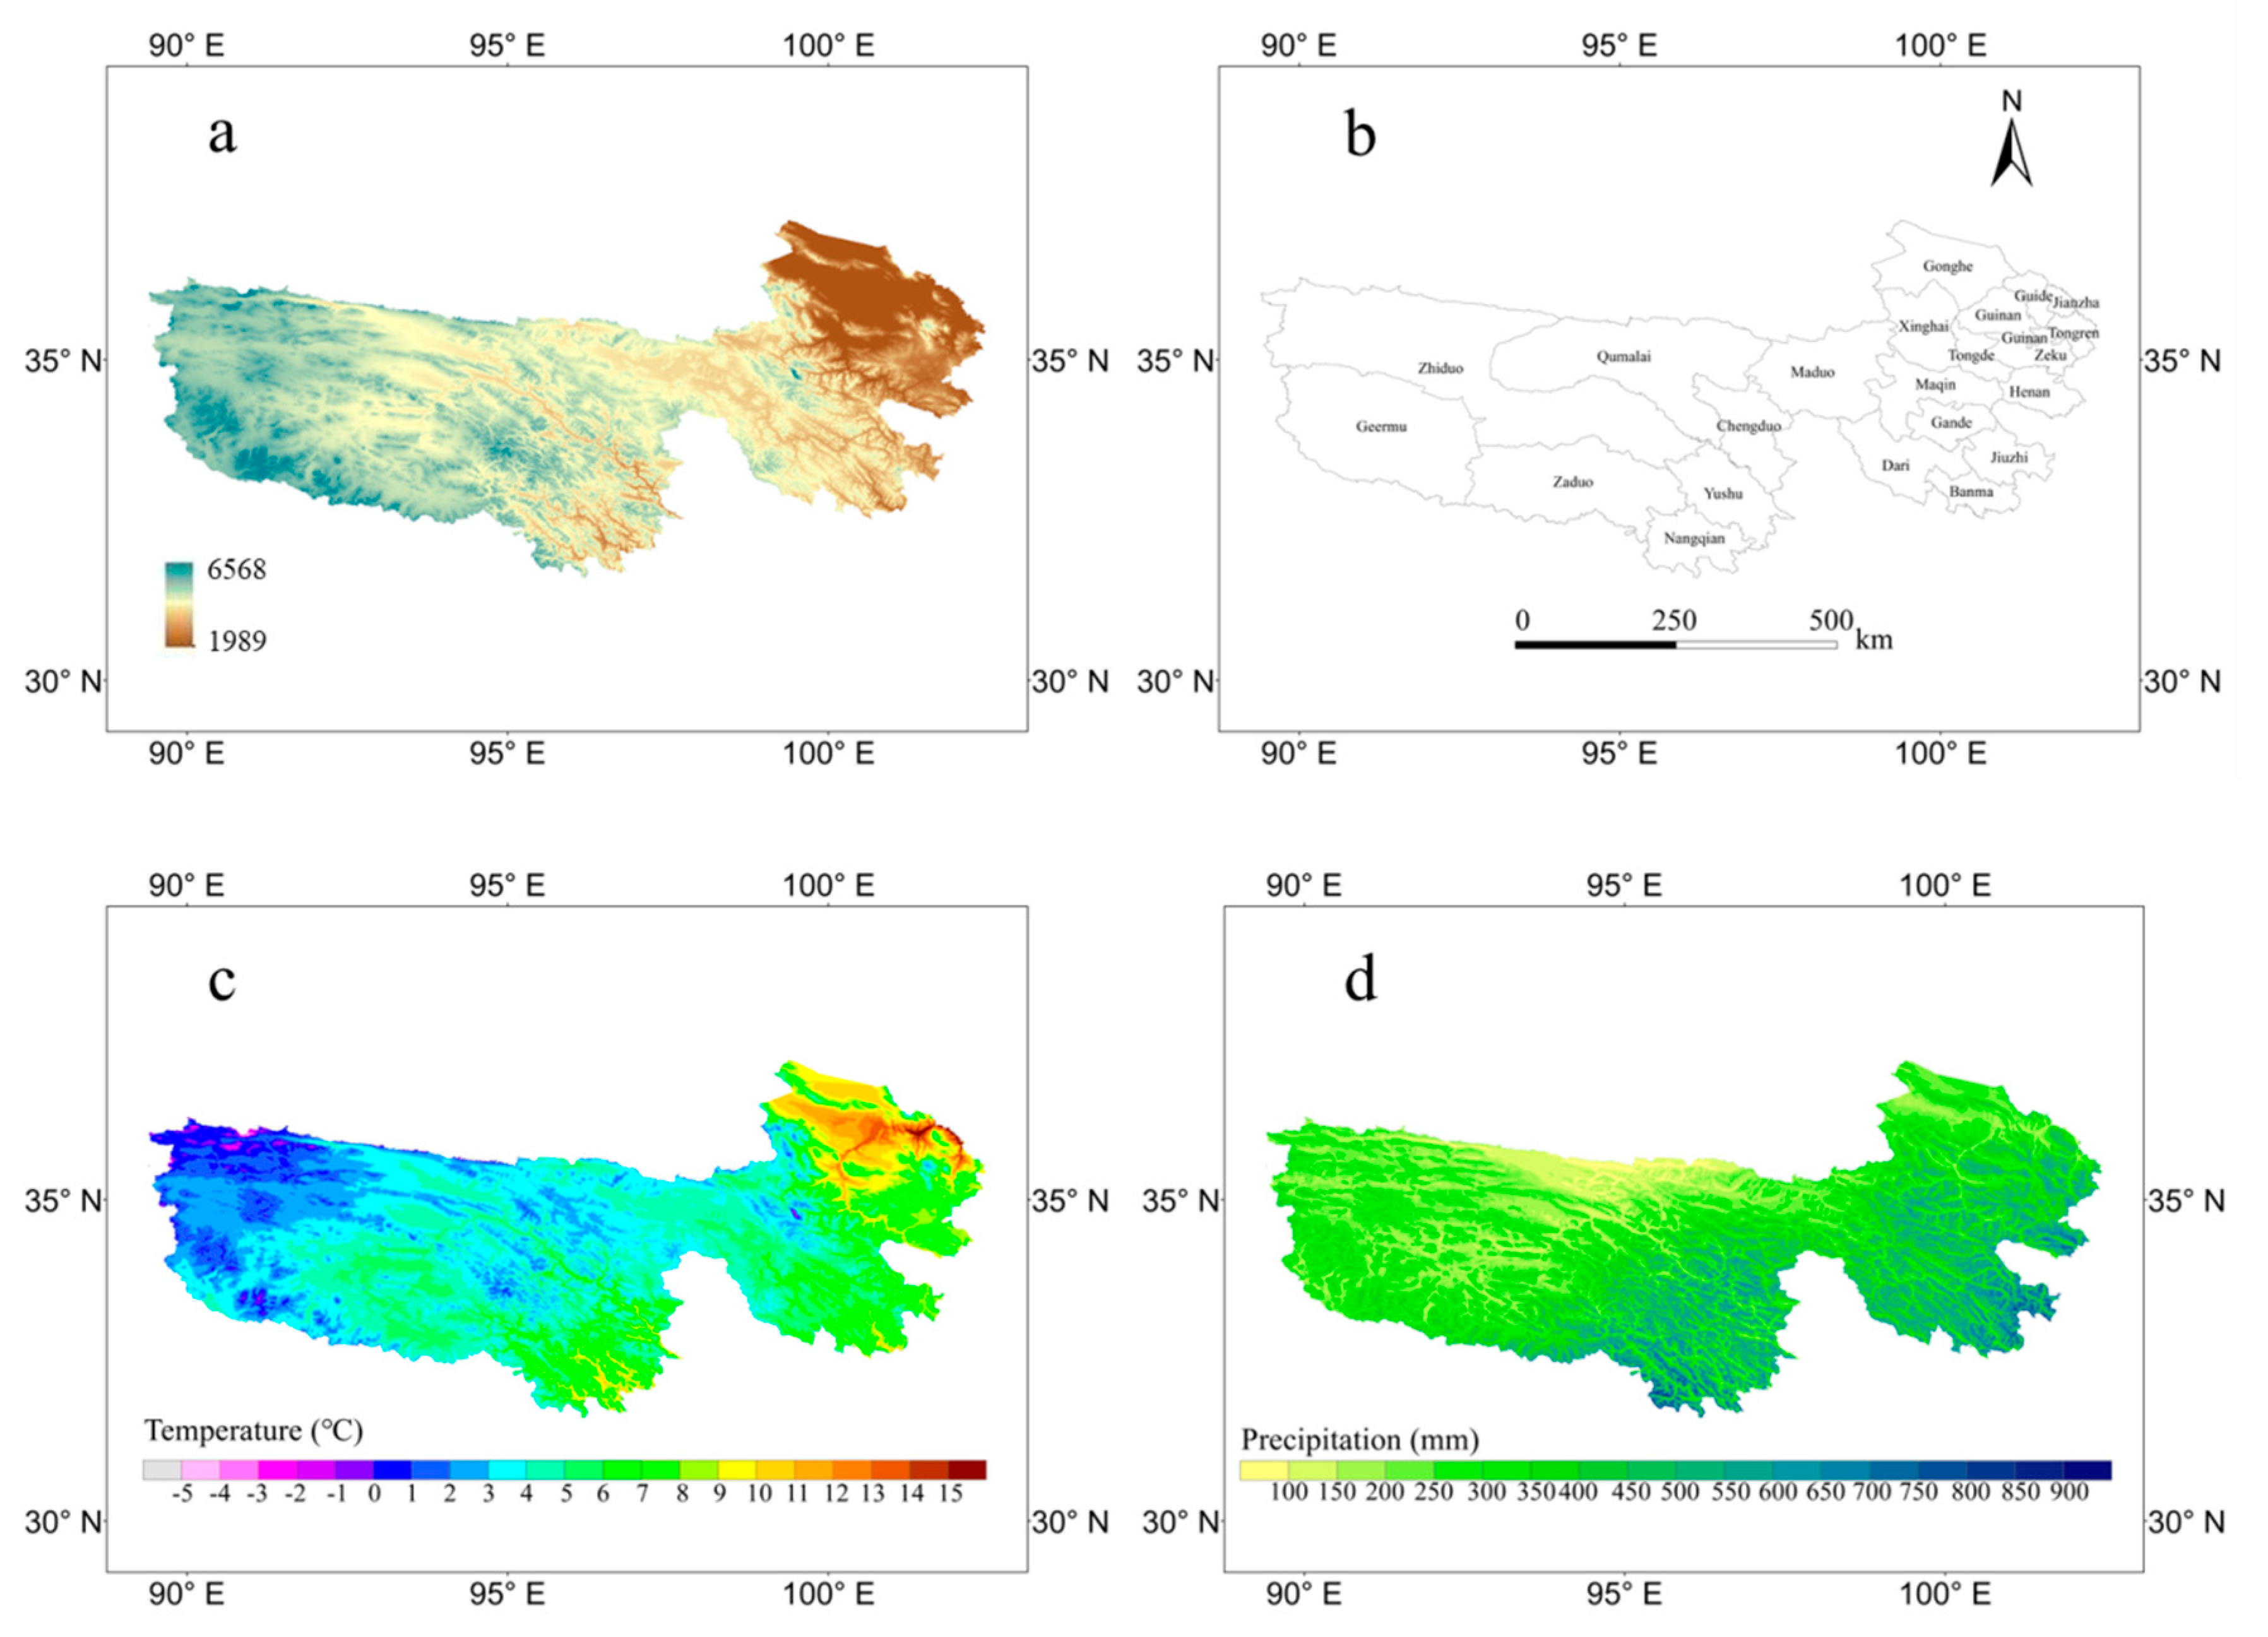
2.1. Study Area
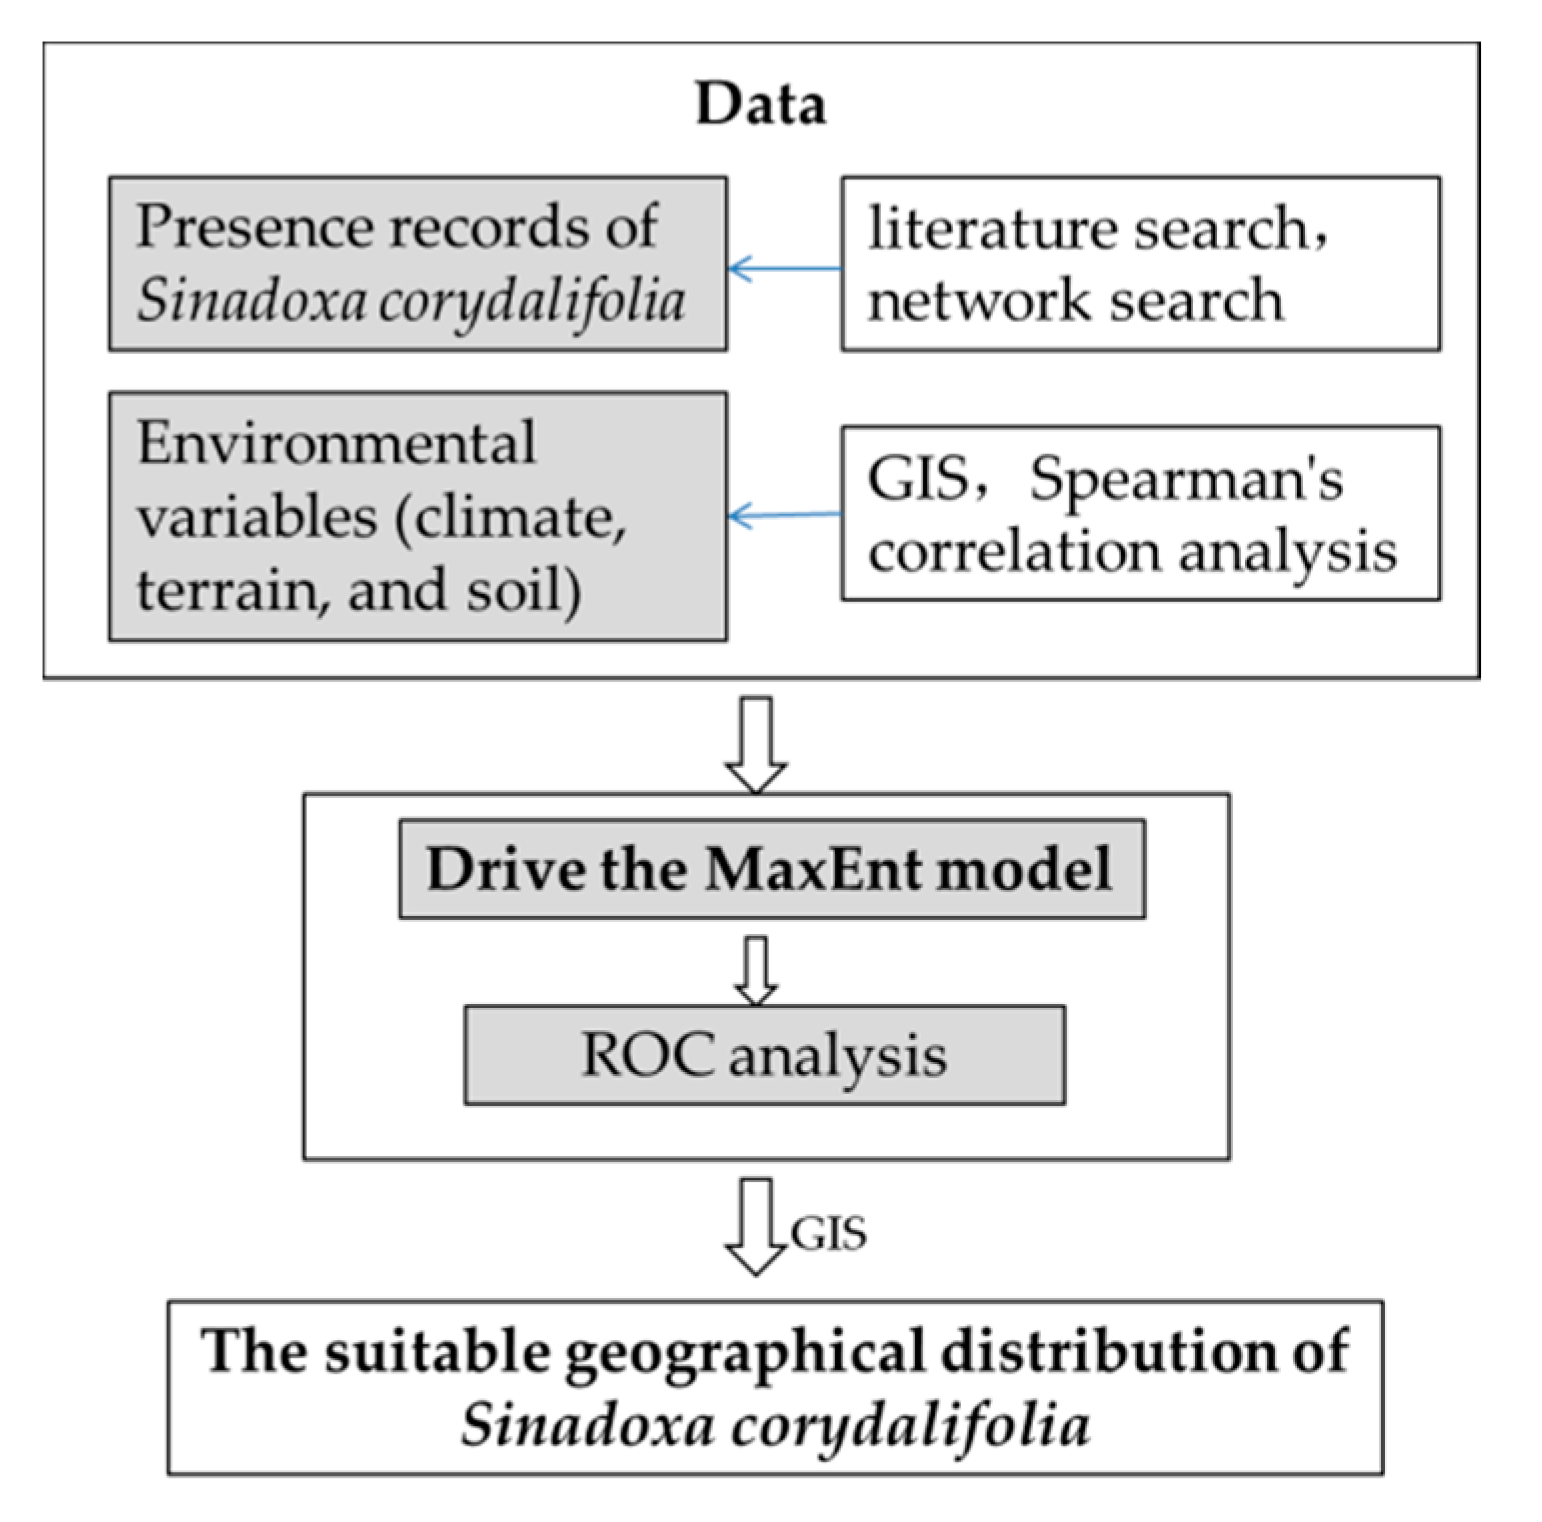
2.2. Data
2.2.1. Presence Records of Sinadoxa Corydalifolia
2.2.2. Environmental Variables and Processing
2.3. MaxEnt Model
3. Results
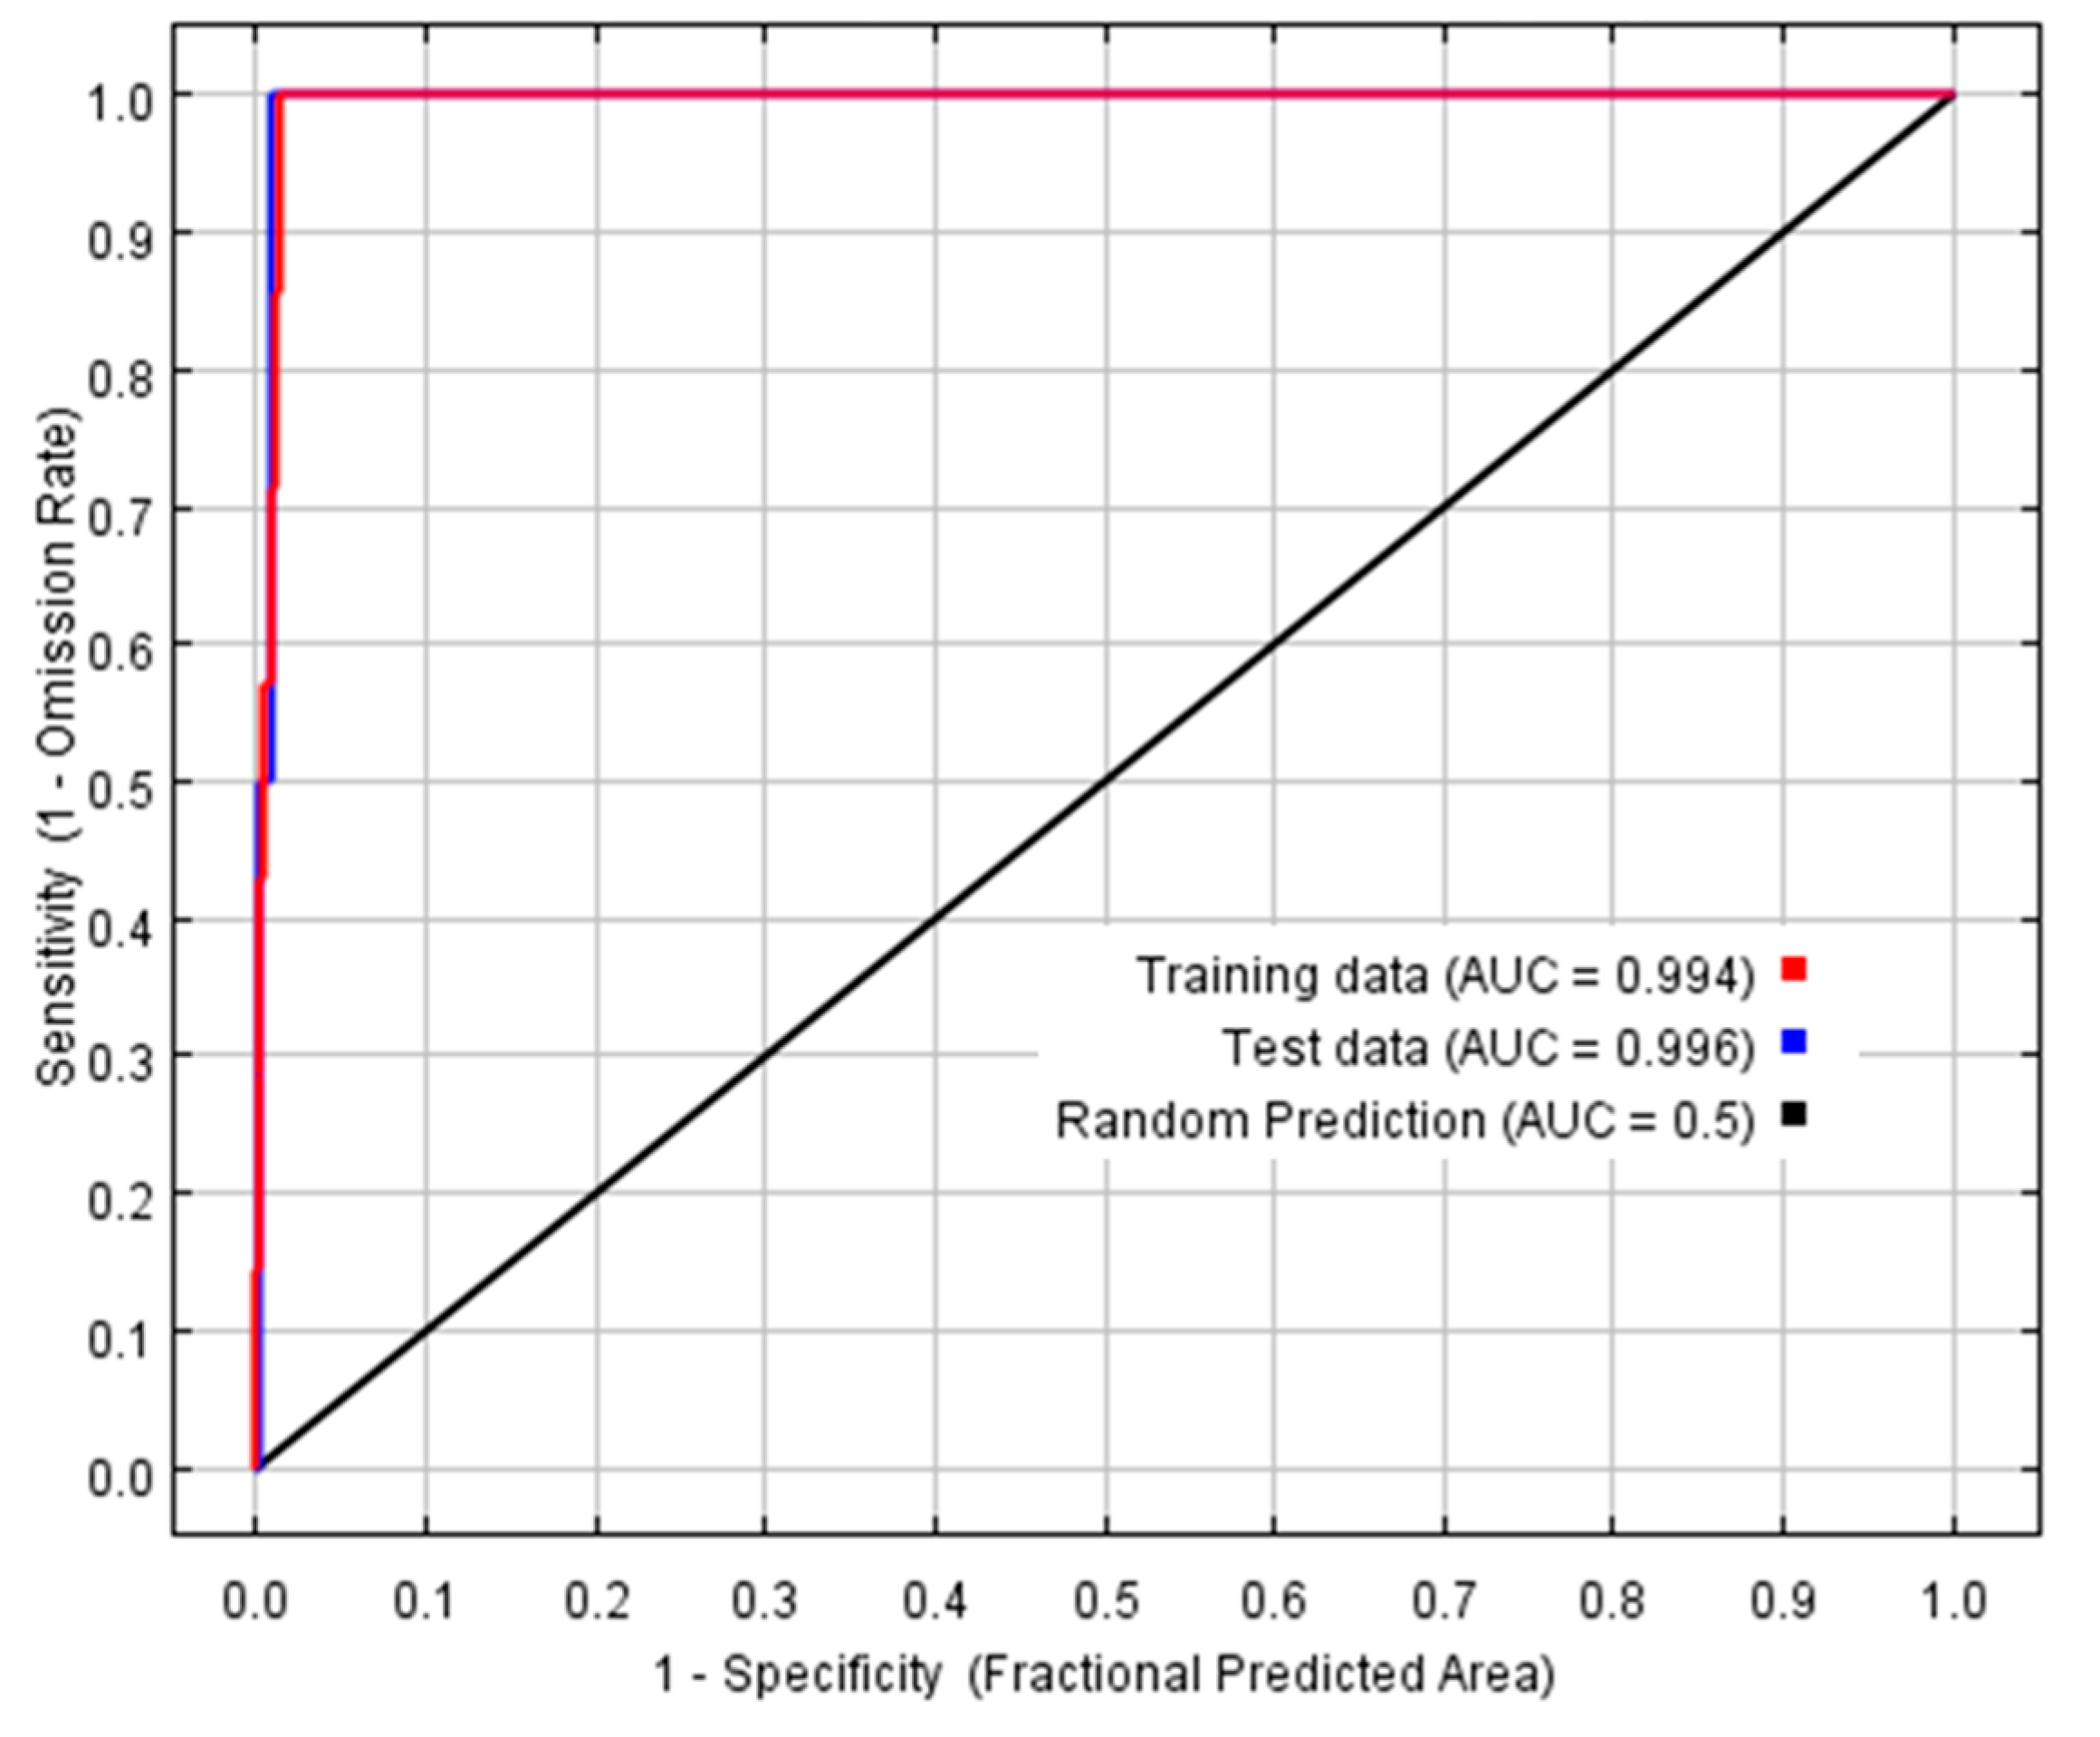
3.1. Model Validation
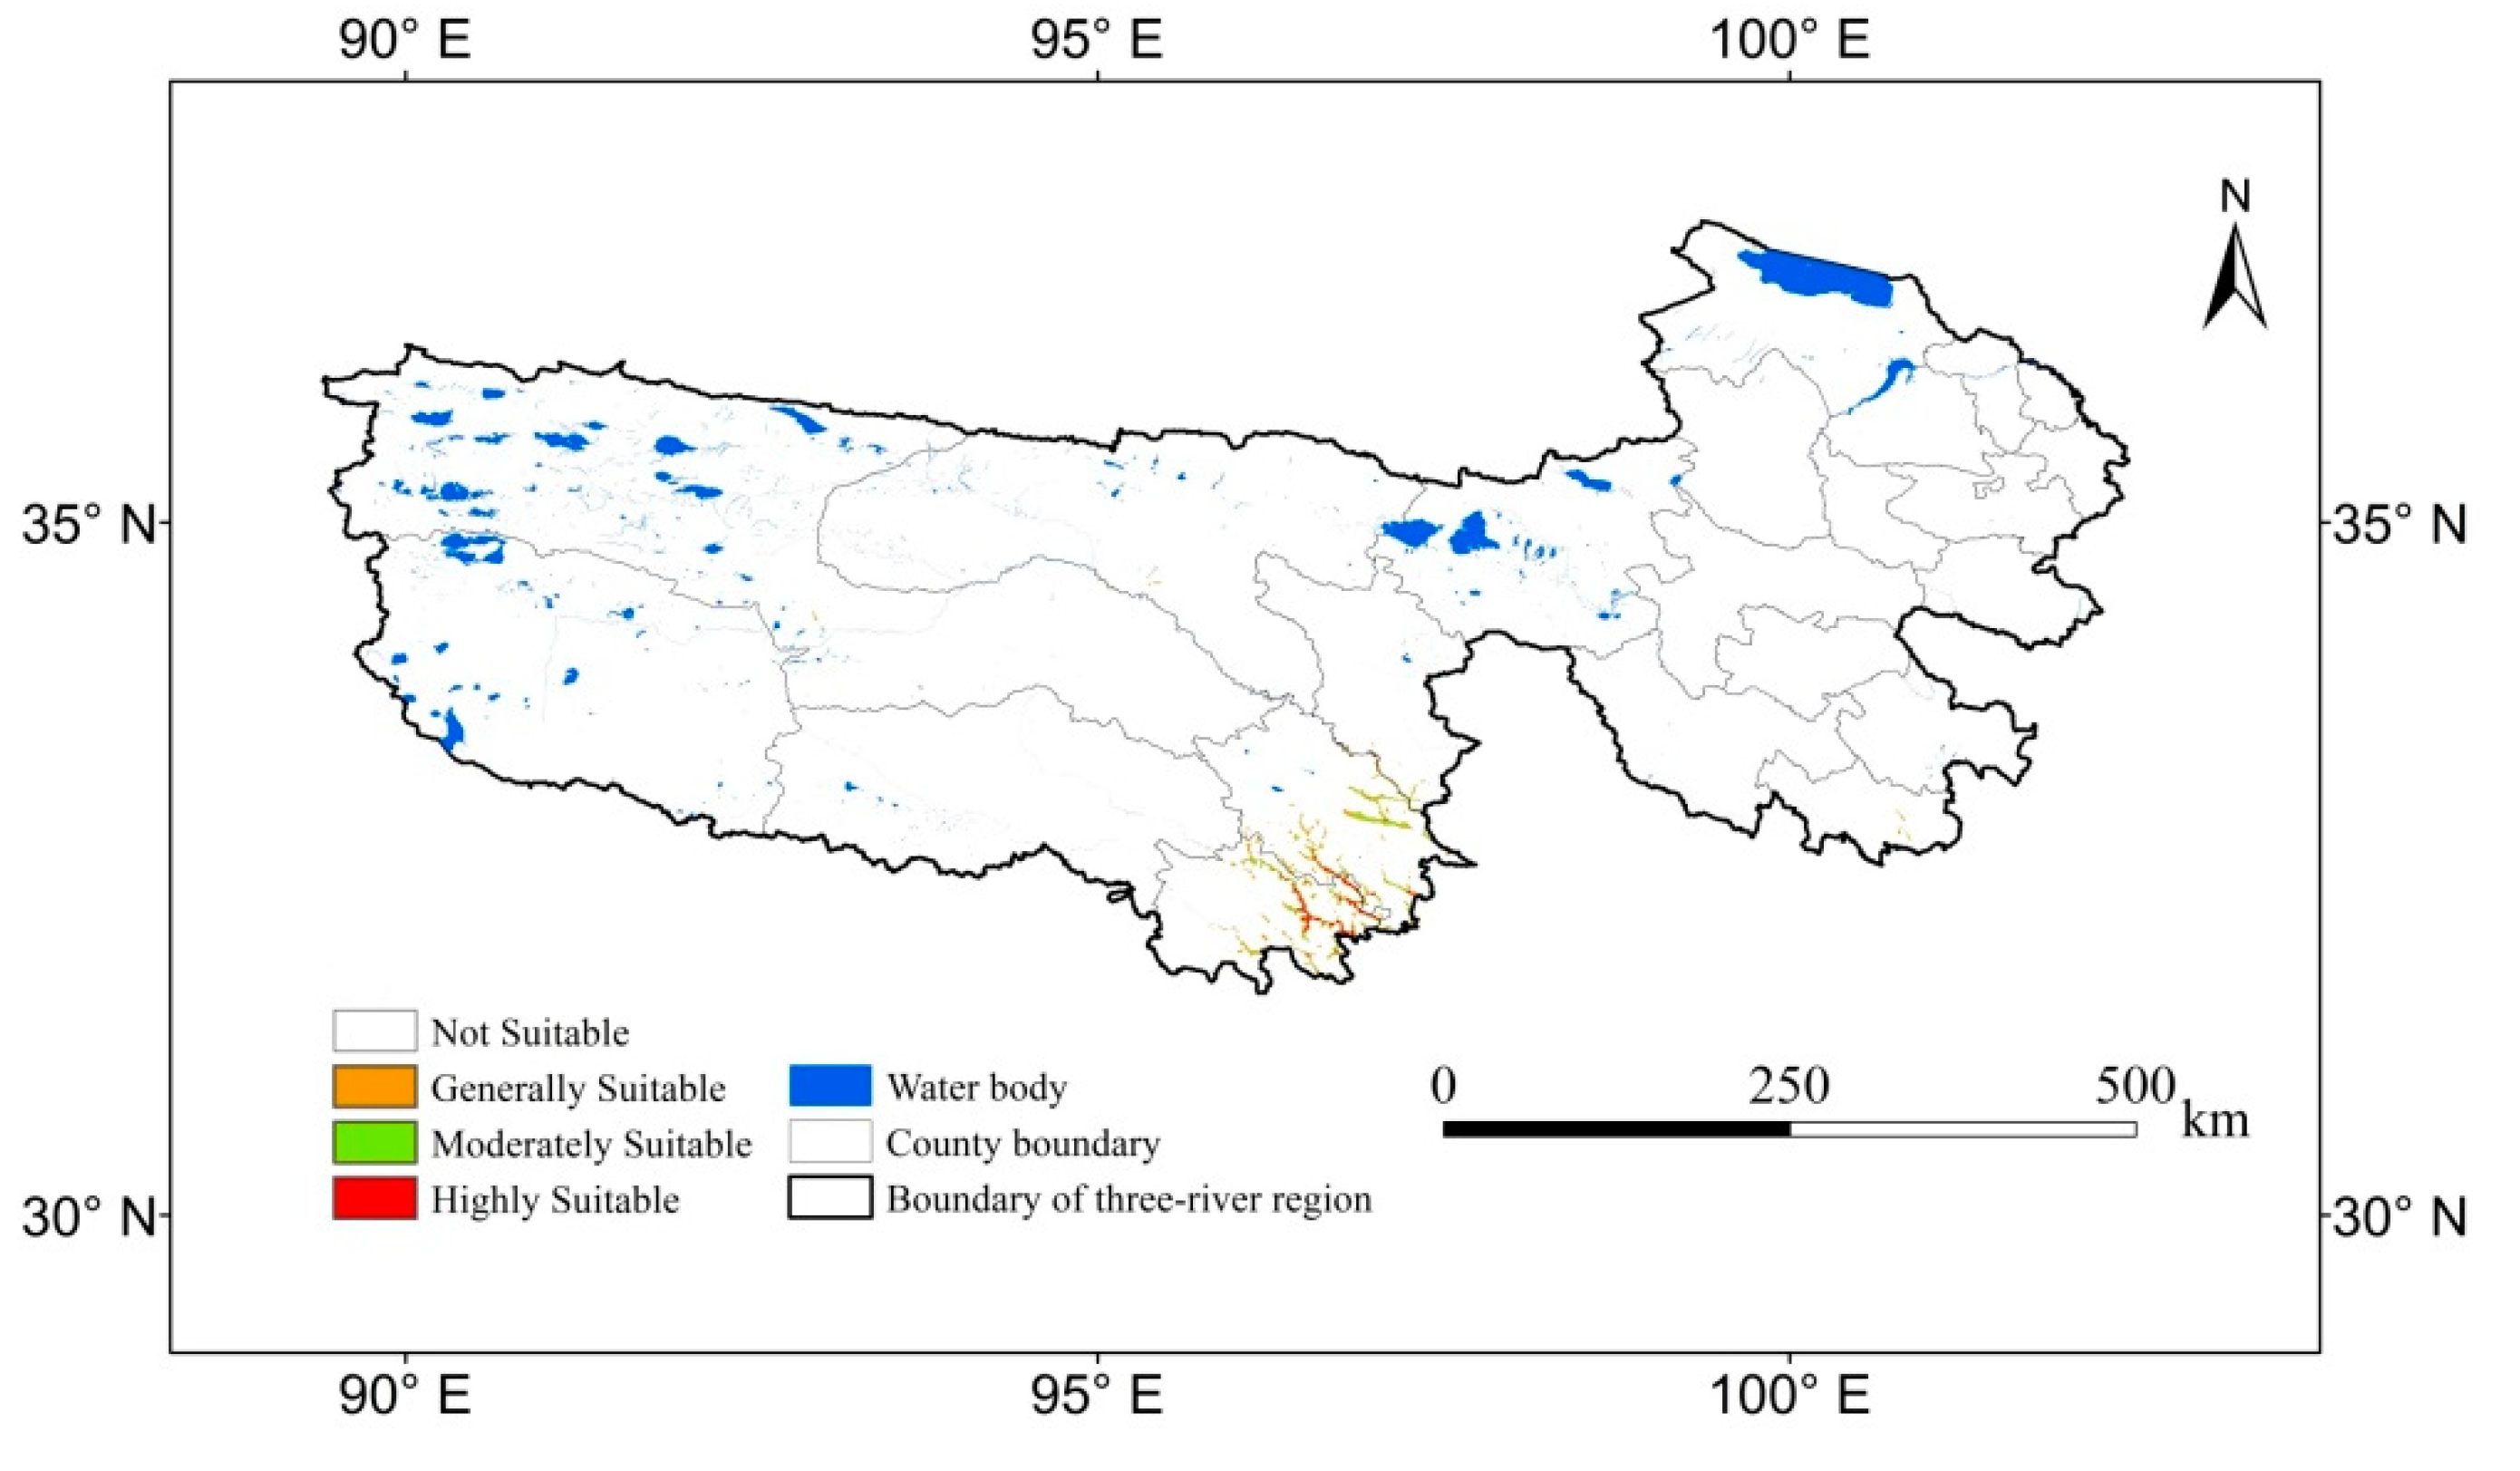
3.2. Predicted Current Potentially Suitable Distribution
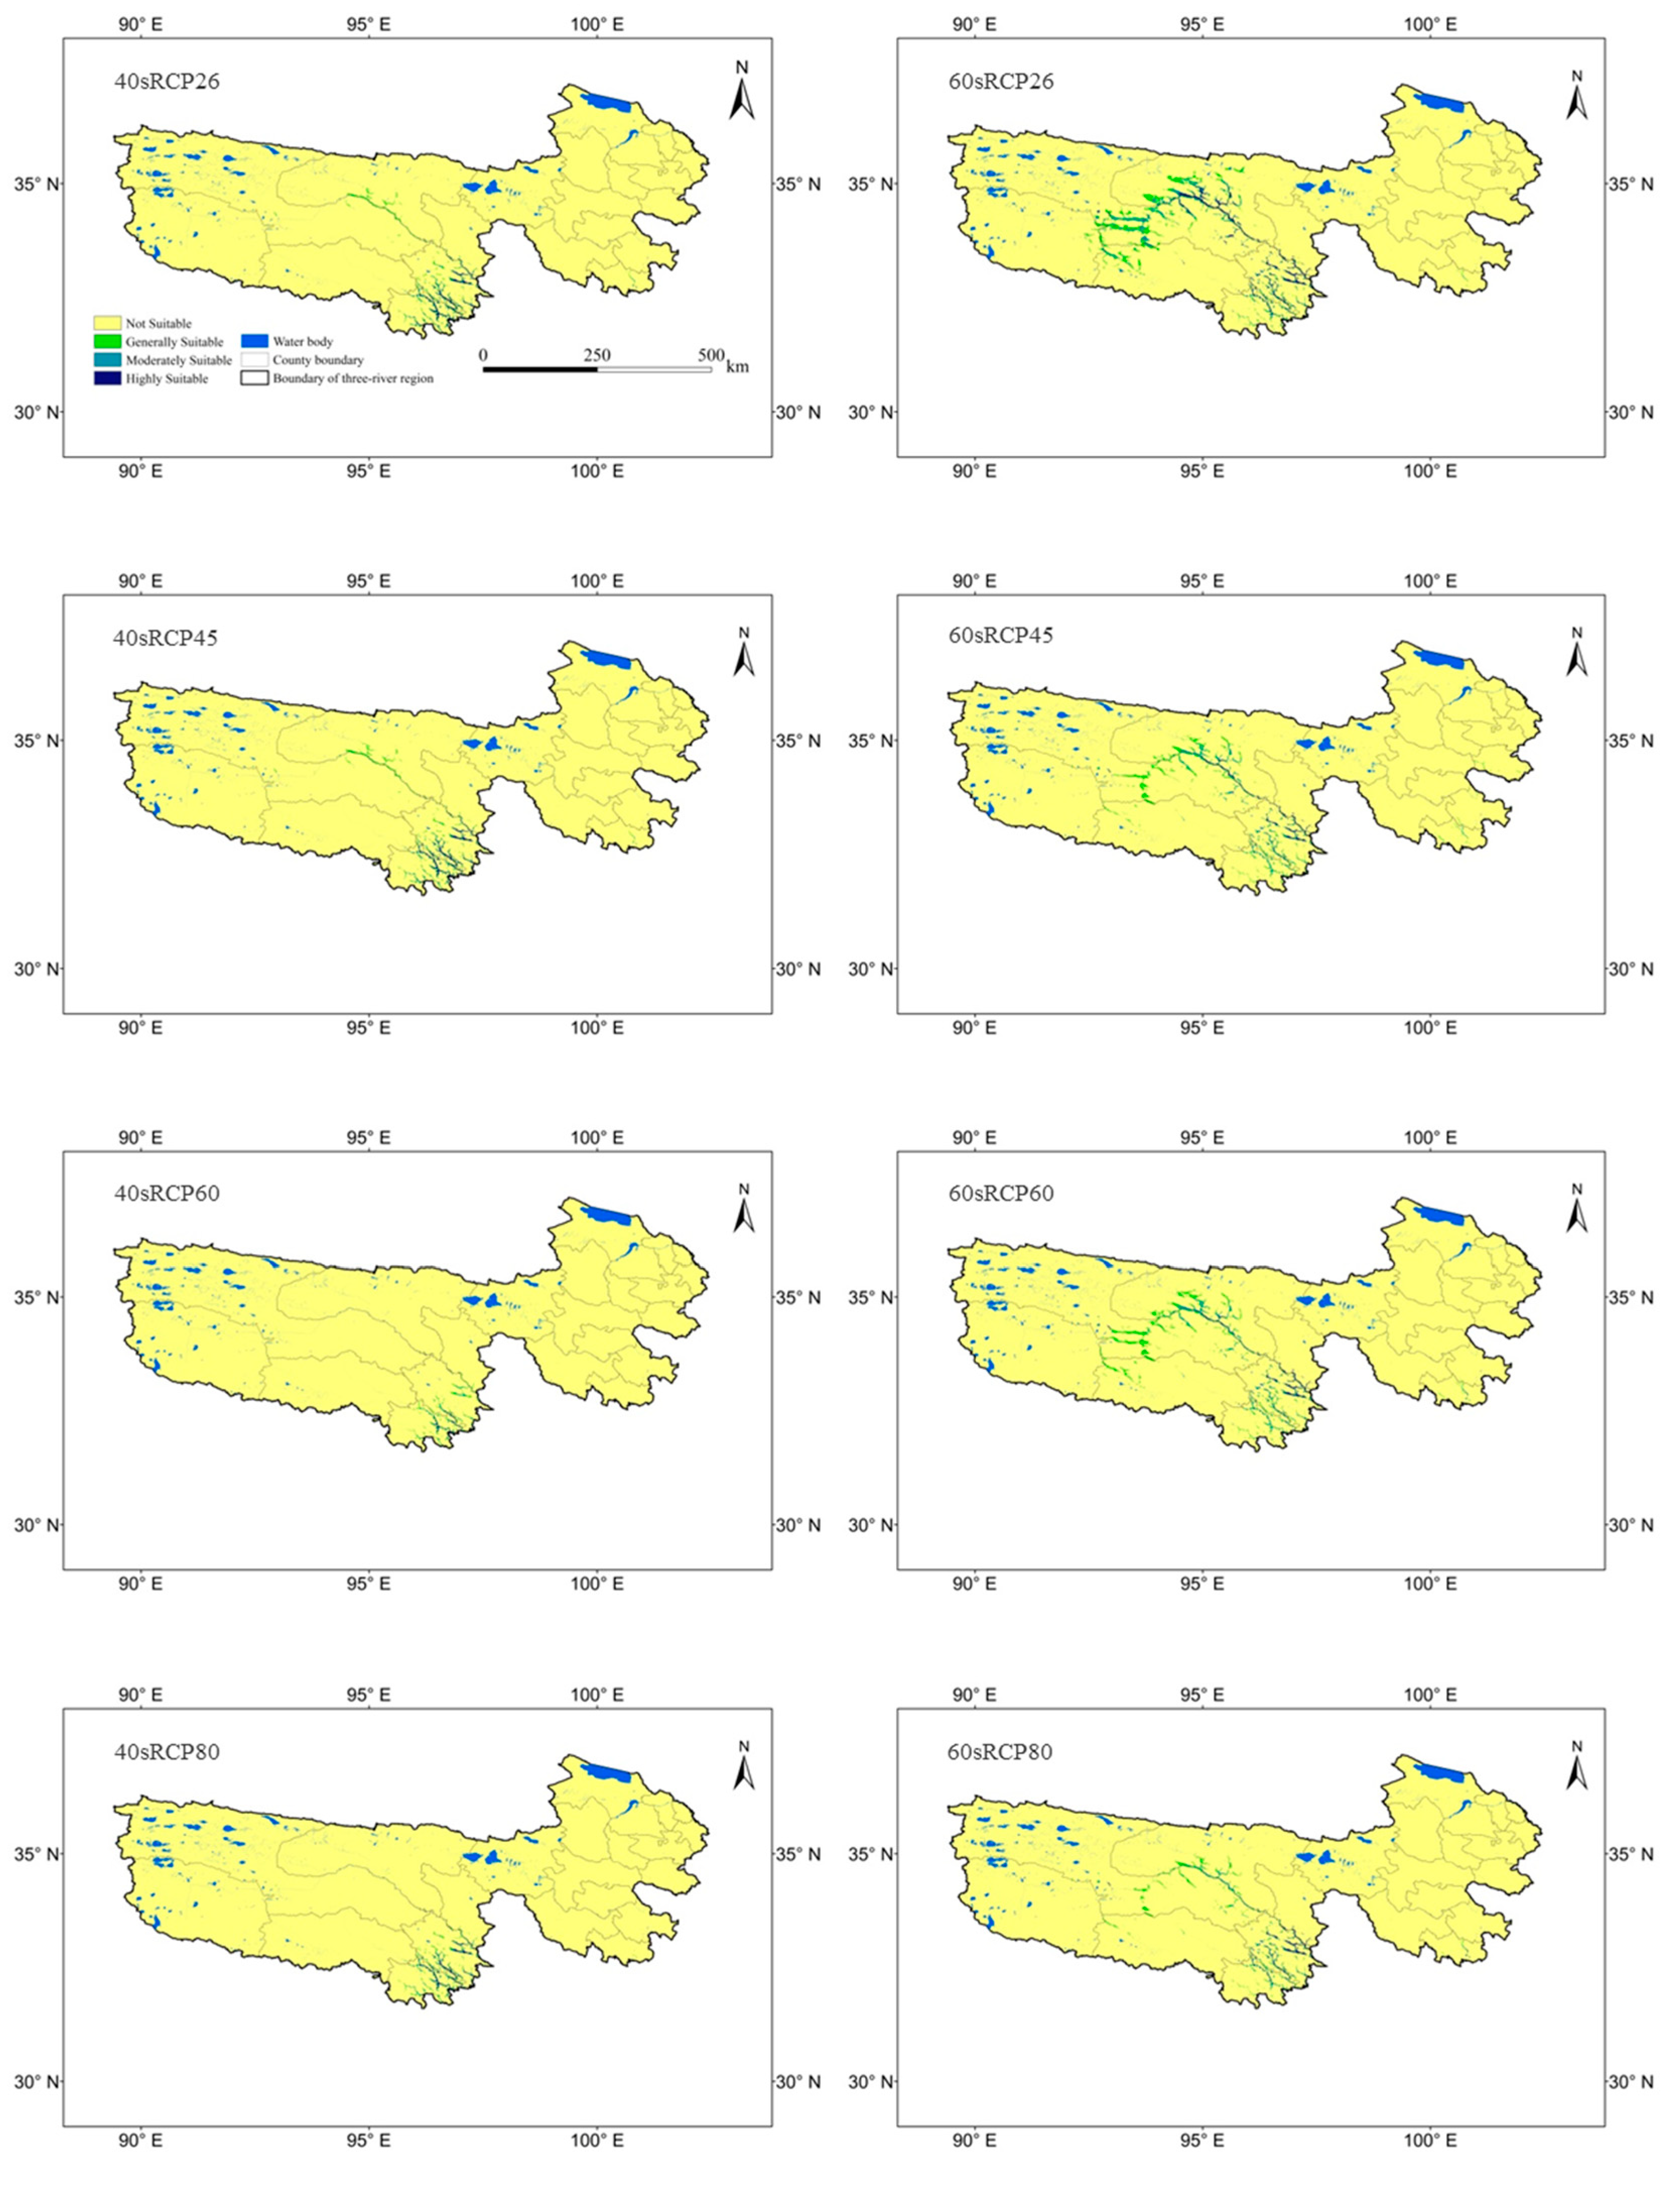
3.3. Predicted Future Suitable Distribution
4. Discussion
4.1. Uncertainty of the Results
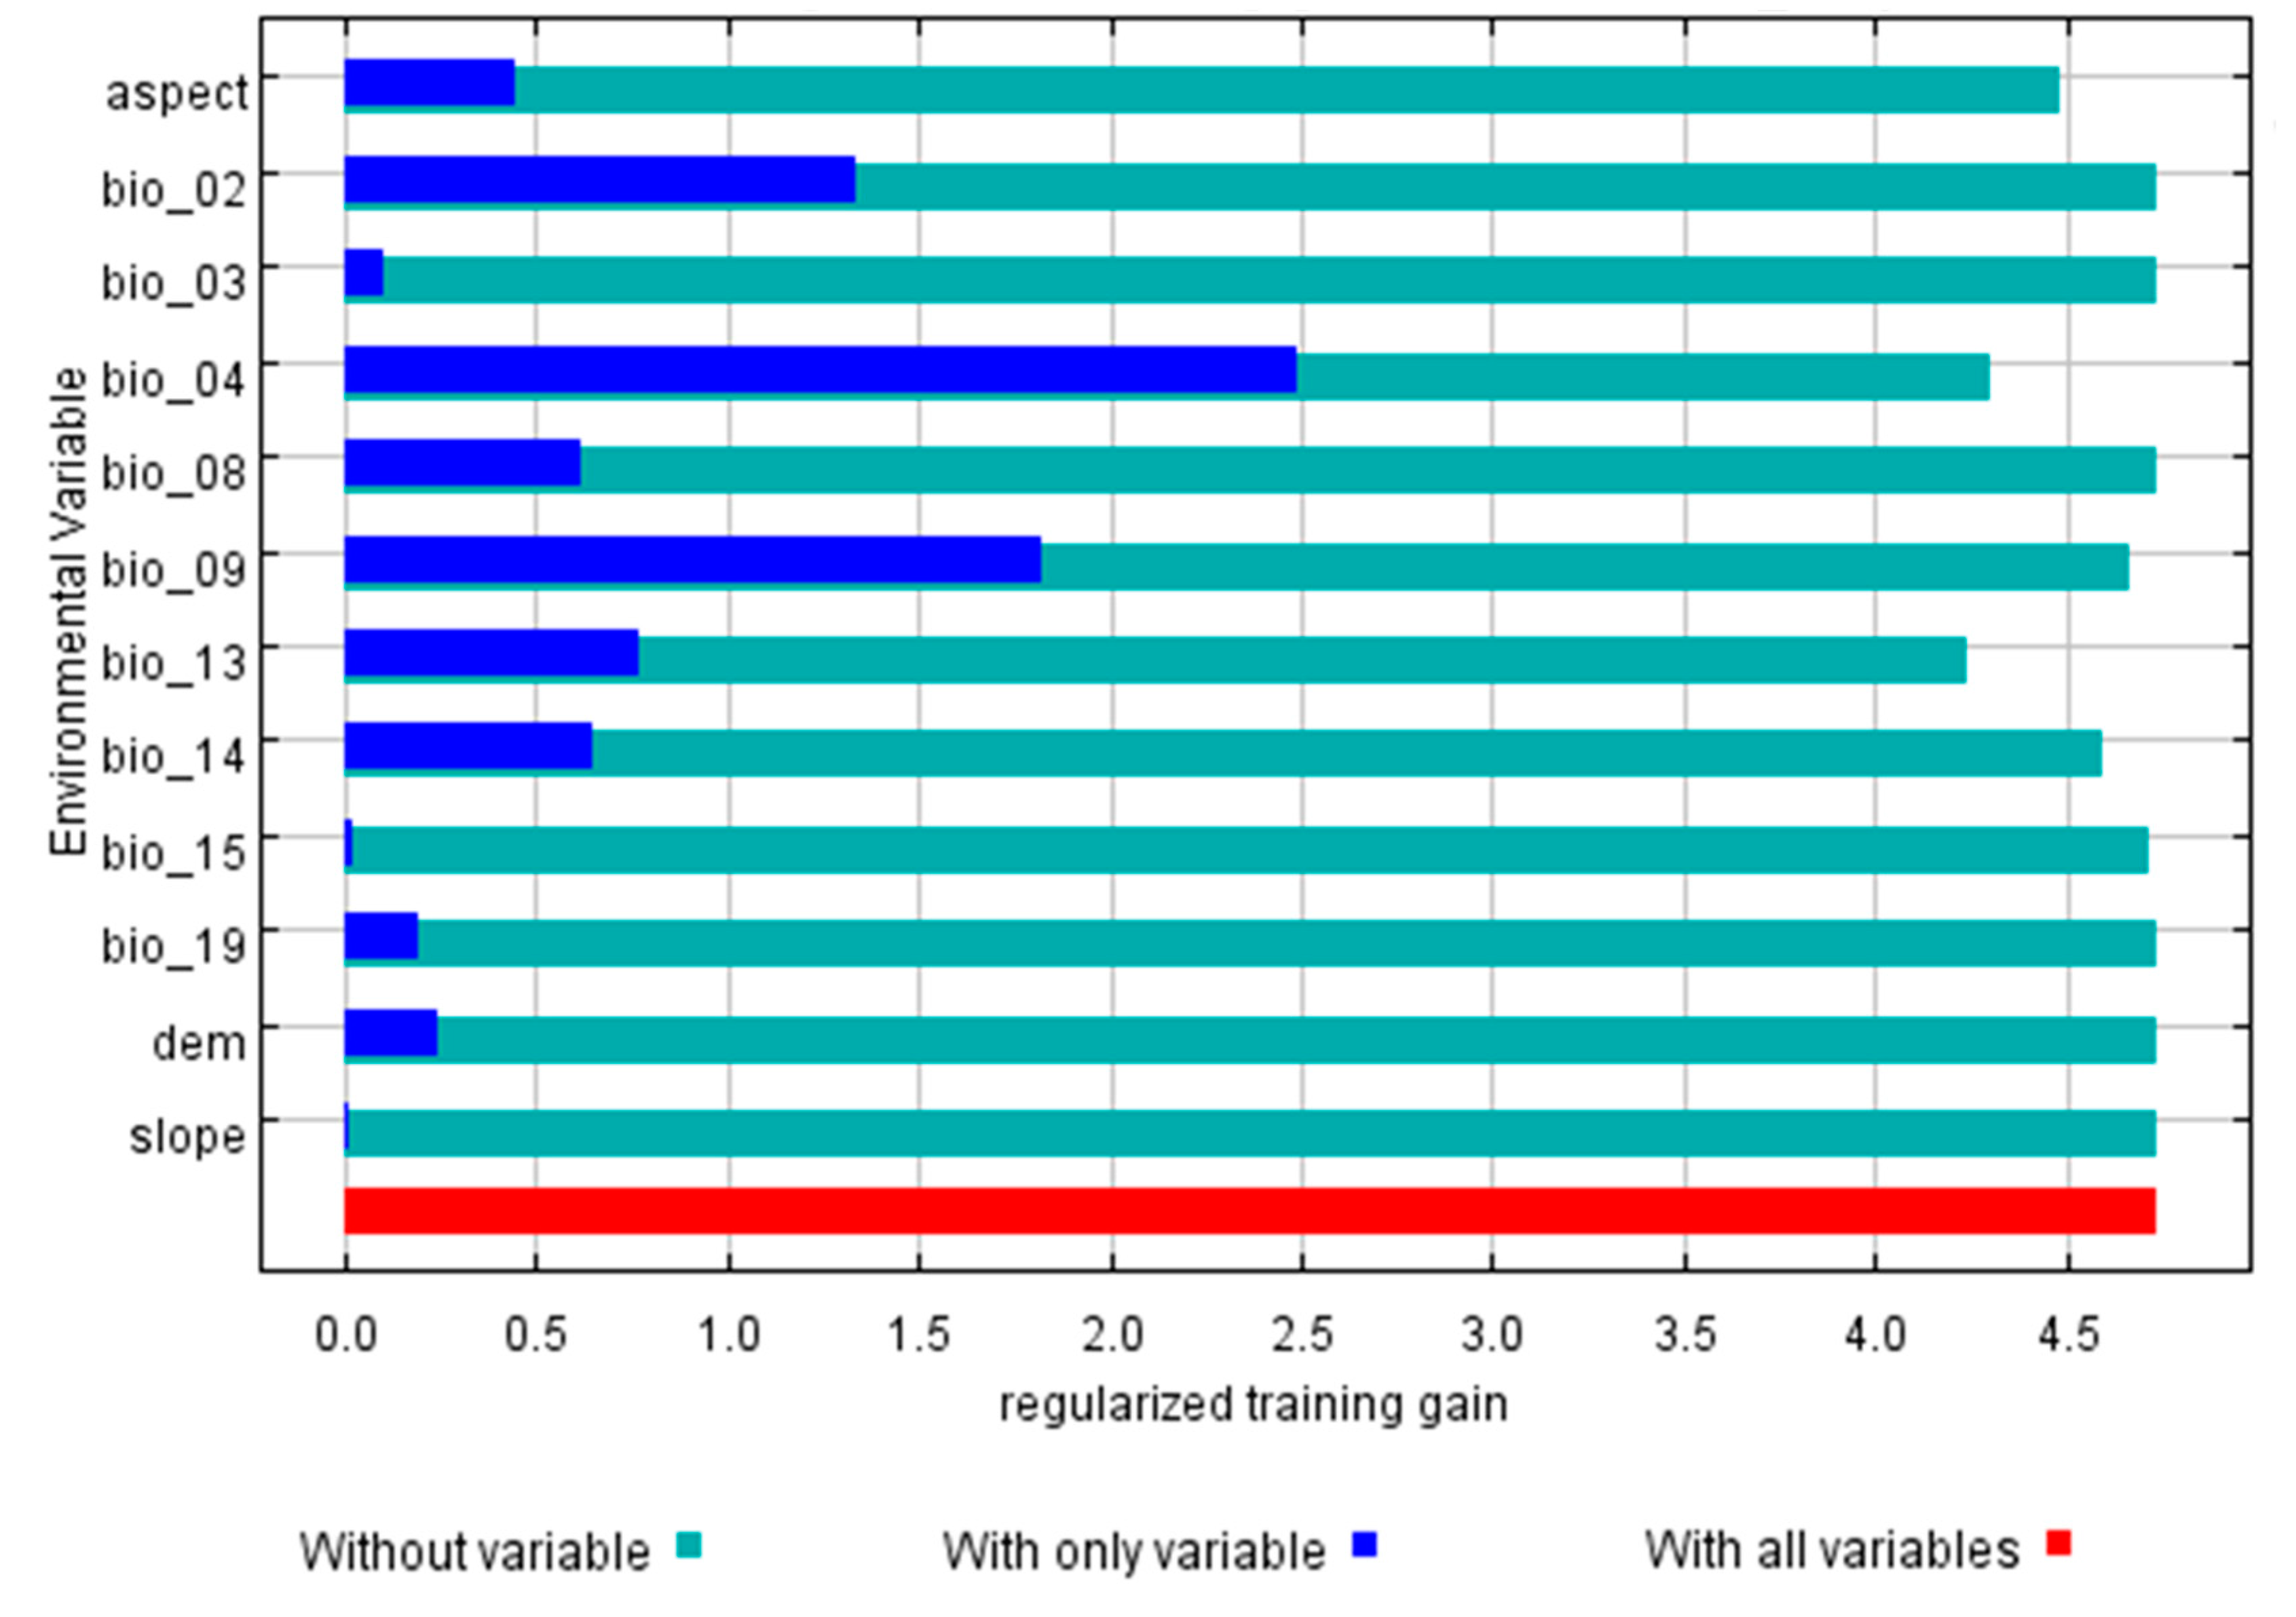
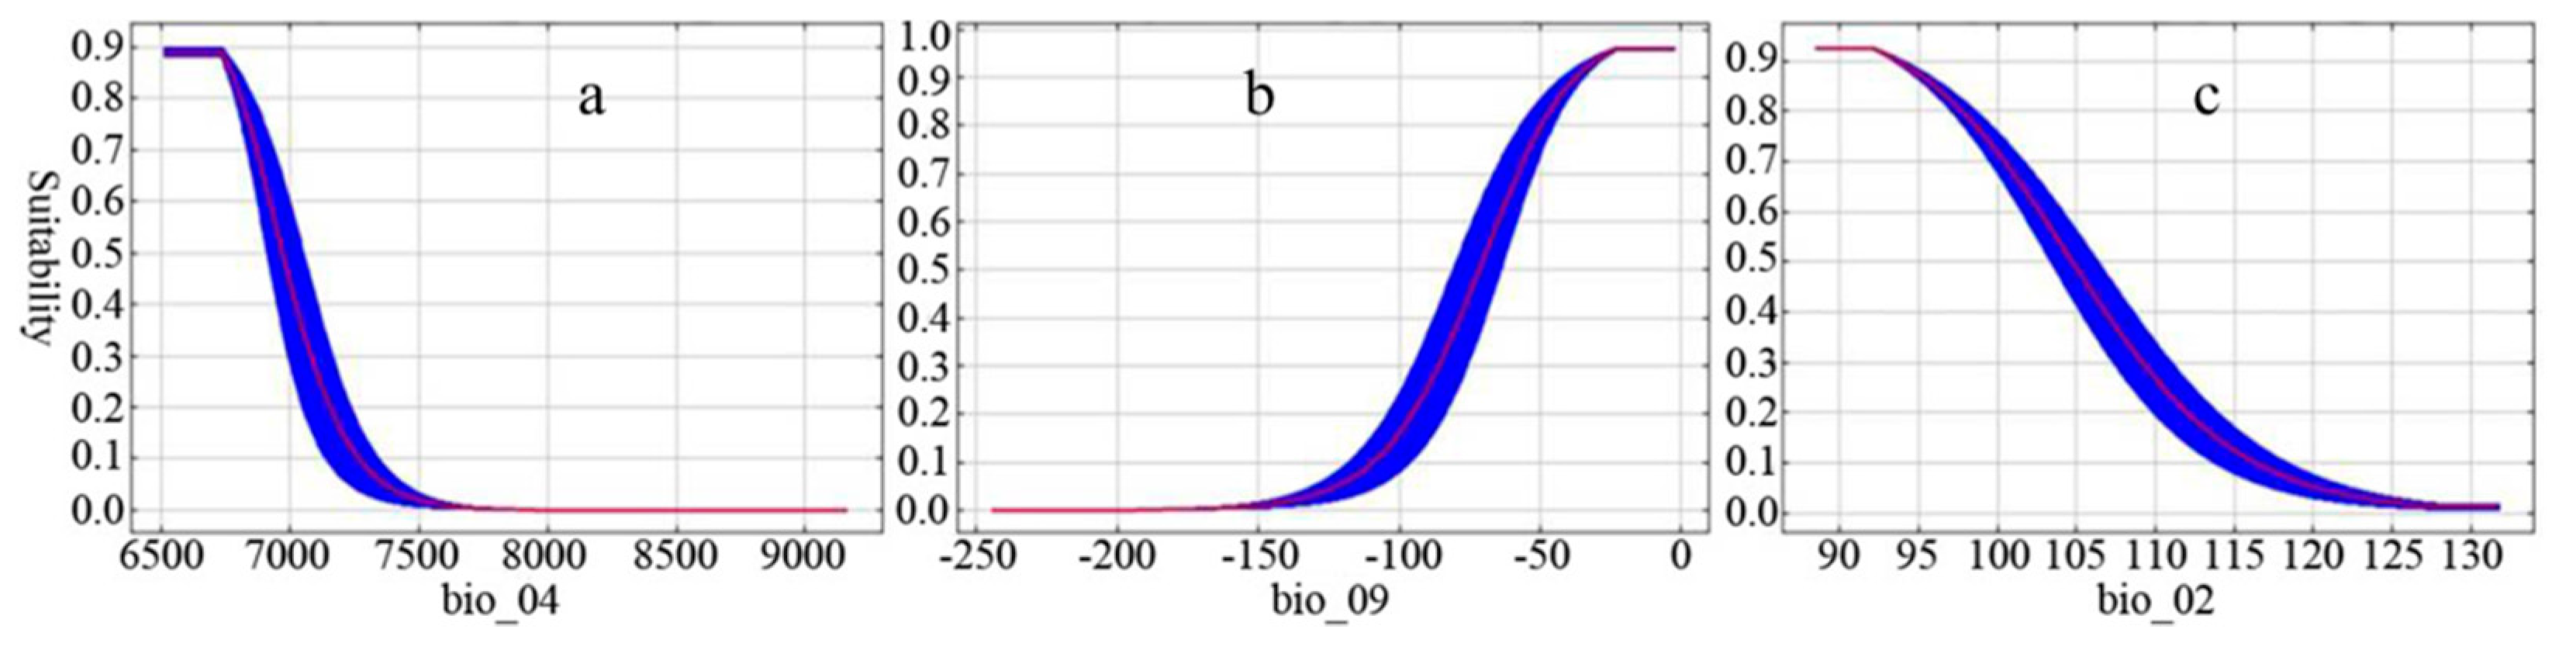
4.2. The Relationship between the Distribution and Environmental Factors
4.3. Change in the Spatial Distribution under Climate Change
4.4. Implications
5. Conclusions
Author Contributions
Funding
Conflicts of Interest
References
- Kiedrzynski, M.; Zielinska, K.M.; Rewicz, A.; Kiedrzynska, E. Habitat and spatial thinning improve the maxent models performed with incomplete data. J. Geophys. Res. Biogeosciences 2017, 122, 1359–1370. [Google Scholar] [CrossRef]
- Hu, Z.; Guo, K.; Jin, S.; Pan, H. The influence of climatic changes on distribution pattern of six typical kobresia species in tibetan plateau based on maxent model and geographic information system. Theor. Appl. Climatol. 2019, 135, 375–390. [Google Scholar] [CrossRef]
- Subedi, S.C.; Bhattarai, K.R.; Chauudhary, R.P. Distribution pattern of vascular plant species of mountains in nepal and their fate against global warming. J. Mt. Sci. 2015, 12, 1345–1354. [Google Scholar] [CrossRef]
- Xu, D.; Zhuo, Z.; Wang, R.; Ye, M.; Pu, B. Modeling the distribution of zanthoxylum armatum in china with maxent modeling. Glob. Ecol. Conserv. 2019, 19. [Google Scholar] [CrossRef]
- Yan, H.; Feng, L.; Zhao, Y.; Feng, L.; Wu, D.; Zhu, C. Prediction of the spatial distribution of alternanthera philoxeroides in china based on arcgis and maxent. Glob. Ecol. Conserv. 2020, 21, e00856. [Google Scholar] [CrossRef]
- Xiao, D.; Liu, D.L.; Wang, B.; Feng, P.; Bai, H.; Tang, J. Climate change impact on yields and water use of wheat and maize in the north china plain under future climate change scenarios. Agric. Water Manag. 2020, 238, 106238. [Google Scholar] [CrossRef]
- Ruela, R.; Sousa, M.C.; de Castro, M.; Dias, J.M. Global and regional evolution of sea surface temperature under climate change. Glob. Planet. Chang. 2020, 190, 103190. [Google Scholar] [CrossRef]
- Samant, S.S.; Butola, J.S.; Sharma, A. Assessment of diversity, distribution, conservation status and preparation of management plan for medicinal plants in the catchment area of parbati hydroelectric project stage-iii in northwestern himalaya. J. Mt. Sci. 2007, 4, 34–56. [Google Scholar] [CrossRef]
- Shen, X.; An, R.; Feng, L.; Ye, N.; Zhu, L.; Li, M. Vegetation changes in the three-river headwaters region of the tibetan plateau of china. Ecol. Indic. 2018, 93, 804–812. [Google Scholar] [CrossRef]
- Yi, Y.-J.; Cheng, X.; Yang, Z.-F.; Zhang, S.-H. Maxent modeling for predicting the potential distribution of endangered medicinal plant (h. Riparia lour) in yunnan, China. Ecol. Eng. 2016, 92, 260–269. [Google Scholar] [CrossRef]
- Jose, S.; Nameer, P.O. The expanding distribution of the indian peafowl (pavo cristatus) as an indicator of changing climate in kerala, southern india: A modelling study using maxent. Ecol. Indic. 2020, 110, 105930. [Google Scholar] [CrossRef]
- Yackulic, C.B.; Chandler, R.; Zipkin, E.F.; Royle, J.A.; Nichols, J.D.; Grant, E.H.C.; Veran, S. Presence-only modelling using maxent: When can we trust the inferences? Methods Ecol. Evol. 2013, 4, 236–243. [Google Scholar] [CrossRef]
- Schmidt, H.; Radinger, J.; Teschlade, D.; Stoll, S. The role of spatial units in modelling freshwater fish distributions: Comparing a subcatchment and river network approach using maxent. Ecol. Model. 2020, 418, 108937. [Google Scholar] [CrossRef]
- Zeng, Y.; Wei, L.B.; Yeo, D.C.J. Novel methods to select environmental variables in maxent: A case study using invasive crayfish. Ecol. Model. 2016, 341, 5–13. [Google Scholar] [CrossRef]
- Wei, B.; Wang, R.; Hou, K.; Wang, X.; Wu, W. Predicting the current and future cultivation regions of carthamus tinctorius l. Using maxent model under climate change in china. Glob. Ecol. Conserv. 2018, 16, e00477. [Google Scholar] [CrossRef]
- Wang, W.; Huang, R. A anatomical ezamination of sinadoxa corydalifolia as compared with adoxa moschatellica. Acta Bot. Boreali Occident. Sin. 1987, 7, 6–11. [Google Scholar]
- Wang, Y.; Liang, Q.; Hao, G.; Chen, C.; Liu, J. Population genetic analyses of the endangered alpine sinadoxa corydalifolia (adoxaceae) provide insights into future conservation. Biodivers. Conserv. 2018, 27, 2275–2291. [Google Scholar] [CrossRef]
- Keesstra, S.; Mol, G.; de Leeuw, J.; Okx, J.; Molenaar, C.; de Cleen, M.; Visser, S. Soil-related sustainable development goals: Four concepts to make land degradation neutrality and restoration work. Land 2018, 7, 133. [Google Scholar] [CrossRef]
- Keesstra, S.D.; Bouma, J.; Wallinga, J.; Tittonell, P.; Smith, P.; Cerda, A.; Montanarella, L.; Quinton, J.N.; Pachepsky, Y.; van der Putten, W.H.; et al. The significance of soils and soil science towards realization of the united nations sustainable development goals. Soil 2016, 2, 111–128. [Google Scholar] [CrossRef]
- Visser, S.; Keesstra, S.; Maas, G.; de Cleen, M.; Molenaar, C. Soil as a basis to create enabling conditions for transitions towards sustainable land management as a key to achieve the sdgs by 2030. Sustainability 2019, 11, 6792. [Google Scholar] [CrossRef]
- Wang, S.; Fan, J.; Li, Y.; Wu, D.; Zhang, Y.; Huang, L. Dynamic response of water retention to grazing activity on grassland over the three river headwaters region. Agric. Ecosyst. Environ. 2019, 286, 106662. [Google Scholar] [CrossRef]
- Deng, M.; Meng, X.; Li, Z.; Lyv, Y.; Lei, H.; Zhao, L.; Zhao, S.; Ge, J.; Jing, H. Responses of soil moisture to regional climate change over the three rivers source region on the tibetan plateau. Int. J. Climatol. 2020, 40, 2403–2417. [Google Scholar] [CrossRef]
- Zhang, X.; Liu, X.; Zhang, L.; Chen, Z.; Zhao, L.; Li, Q.; Chen, D.; Gu, S. Comparison of energy partitioning between artificial pasture and degraded meadow in three-river source region on the qinghai-tibetan plateau: A case study. Agric. For. Meteorol. 2019, 271, 251–263. [Google Scholar] [CrossRef]
- Zheng, Y.; Han, J.; Huang, Y.; Fassnacht, S.R.; Xie, S.; Lv, E.; Chen, M. Vegetation response to climate conditions based on ndvi simulations using stepwise cluster analysis for the three-river headwaters region of china. Ecol. Indic. 2018, 92, 18–29. [Google Scholar] [CrossRef]
- Sun, B.; Wang, H. Enhanced connections between summer precipitation over the three-river-source region of china and the global climate system. Clim. Dyn. 2019, 52, 3471–3488. [Google Scholar] [CrossRef]
- Liu, X.; Wu, Z.; Liu, Y.; Zhao, X.; Rui, Y.; Zhang, J. Spatial-temporal characteristics of precipitation from 1960 to 2015 in the three rivers’ headstream region, qinghai, china. Acta Geogr. Sin. 2019, 74, 1803–1820. [Google Scholar]
- Han, Z.; Song, W.; Deng, X.; Xu, X. Grassland ecosystem responses to climate change and human activities within the three-river headwaters region of china. Sci. Rep. 2018, 8. [Google Scholar] [CrossRef]
- Yu, H.L.; Fan, J.W.; Li, Y.Z.; Shi, W.J. Effects of myospalax baileyi disturbance on plant community at alpine meadow in three rivers headwater region, china. J. Appl. Ecol. 2018, 29, 1902–1910. [Google Scholar]
- Zhang, L.; Fan, J.; Zhou, D.; Zhang, H. Ecological protection and restoration programreduced grazing pressure in the three-river headwaters region, china. Rangel. Ecol. Manag. 2017, 70, 540–548. [Google Scholar] [CrossRef]
- Karger, D.N.; Conrad, O.; Boehner, J.; Kawohl, T.; Kreft, H.; Soria-Auza, R.W.; Zimmermann, N.E.; Linder, H.P.; Kessler, M. Data descriptor: Climatologies at high resolution for the earth’s land surface areas. Sci. Data 2017, 4, 170122. [Google Scholar] [CrossRef]
- Halvorsen, R.; Mazzoni, S.; Dirksen, J.W.; Naesset, E.; Gobakken, T.; Ohlson, M. How important are choice of model selection method and spatial autocorrelation of presence data. For distribution modelling by maxent? Ecol. Model. 2016, 328, 108–118. [Google Scholar] [CrossRef]
- Liu, C.; Huo, H.L.; Tian, L.M.; Dong, X.G.; Qi, D.; Zhang, Y.; Xu, J.Y.; Cao, Y.F. Potential geographical distribution of pyrus calleryana under different climate change scena-rios based on the maxent model. J. Appl. Ecol. 2018, 29, 3696–3704. [Google Scholar]
- Convertino, M.; Munoz-Carpena, R.; Chu-Agor, M.L.; Kiker, G.A.; Linkov, I. Untangling drivers of species distributions: Global sensitivity and uncertainty analyses of maxent. Environ. Model. Softw. 2014, 51, 296–309. [Google Scholar] [CrossRef]
- Convertino, M.; Troccoli, A.; Catani, F. Detecting fingerprints of landslide drivers: A maxent model. J. Geophys. Res. Earth Surf. 2013, 118, 1367–1386. [Google Scholar] [CrossRef]
- Shukla, P.K.; Baradevanal, G.; Rajan, S.; Fatima, T. Maxent prediction for potential risk of mango wilt caused by ceratocystis fimbriata ellis and halst under different climate change scenarios in india. J. Plant Pathol. 2020. [Google Scholar] [CrossRef]
- Zhang, J.; Jiang, F.; Li, G.; Qin, W.; Li, S.; Gao, H.; Cai, Z.; Lin, G.; Zhang, T. Maxent modeling for predicting the spatial distribution of three raptors in the sanjiangyuan national park, china. Ecol. Evol. 2019, 9, 6643–6654. [Google Scholar] [CrossRef]
- Gilfillan, D.; Joyner, T.A.; Scheuerman, P. Maxent estimation of aquatic escherichia coli stream impairment. Peerj 2018, 6, e5610. [Google Scholar] [CrossRef]
- Warren, D.L.; Seifert, S.N. Ecological niche modeling in maxent: The importance of model complexity and the performance of model selection criteria. Ecol. Appl. 2011, 21, 335–342. [Google Scholar] [CrossRef]
- Liu, Y.; Huang, P.; Lin, F.; Yang, W.; Gaisberger, H.; Christopher, K.; Zheng, Y. Maxent modelling for predicting the potential distribution of a near threatened rosewood species (dalbergia cultrata graham ex benth). Ecol. Eng. 2019, 141, 105612. [Google Scholar] [CrossRef]
- Zhang, K.; Zhang, Y.; Zhou, C.; Meng, J.; Sun, J.; Zhou, T.; Tao, J. Impact of climate factors on future distributions of paeonia ostii across china estimated by maxent. Ecol. Inform. 2019, 50, 62–67. [Google Scholar] [CrossRef]
- Zhang, K.; Yao, L.; Meng, J.; Tao, J. Maxent modeling for predicting the potential geographical distribution of two peony species under climate change. Sci. Total Environ. 2018, 634, 1326–1334. [Google Scholar] [CrossRef] [PubMed]
- Mousazade, M.; Ghanbarian, G.; Pourghasemi, H.R.; Safaeian, R.; Cerda, A. Maxent data mining technique and its comparison with a bivariate statistical model for predicting the potential distribution of astragalus fasciculifolius boiss. In fars, iran. Sustainability 2019, 11, 3452. [Google Scholar] [CrossRef]
- Zhang, D.H.; Hu, Y.M.; Liu, M. Potential distribution of spartinal alterniflora in china coastal areas based on maxent niche model. J. Appl. Ecol. 2019, 30, 2329–2337. [Google Scholar]
- Wang, R.; Yang, H.; Luo, W.; Wang, M.; Lu, X.; Huang, T.; Zhao, J.; Li, Q. Predicting the potential distribution of the asian citrus psyllid, diaphorina citri (kuwayama), in china using the maxent model. Peerj 2019, 7, e7323. [Google Scholar] [CrossRef]
- Abdelaal, M.; Fois, M.; Fenu, G.; Bacchetta, G. Using maxent modeling to predict the potential distribution of the endemic plant rosa arabica crep. In egypt. Ecol. Inform. 2019, 50, 68–75. [Google Scholar] [CrossRef]
- Moya, W.; Jacome, G.; Yoo, C. Past, current, and future trends of red spiny lobster based on pca with maxent model in galapagos islands, ecuador. Ecol. Evol. 2017, 7, 4881–4890. [Google Scholar] [CrossRef]
- Zhang, L.; Jing, Z.; Li, Z.; Liu, Y.; Fang, S. Predictive modeling of suitable habitats for cinnamomum camphora (l.) presl using maxent model under climate change in china. Int. J. Environ. Res. Public Health 2019, 16, 3185. [Google Scholar] [CrossRef]
- Ma, H.-M.; Qin, C.-X.; Wang, X.-Q.; Zhu, W.-T.; Yin, C.-H.; Xi, S.-G.; Zuo, T.; Pan, W.-N. Establishing potential habitats of mytilopsis sallei with maxent niche model. J. Appl. Ecol. 2020, 31, 1357–1364. [Google Scholar]
- Muluneh, A.; Stroosnijder, L.; Keesstra, S.; Biazin, B. Adapting to climate change for food security in the rift valley dry lands of ethiopia: Supplemental irrigation, plant density and sowing date. J. Agric. Sci. 2017, 155, 703–724. [Google Scholar] [CrossRef]
- Sannigrahi, S.; Zhang, Q.; Joshi, P.K.; Sutton, P.C.; Keesstra, S.; Roy, P.S.; Pilla, F.; Basu, B.; Wang, Y.; Jha, S.; et al. Examining effects of climate change and land use dynamic on biophysical and economic values of ecosystem services of a natural reserve region. J. Clean. Prod. 2020, 257, 120424. [Google Scholar] [CrossRef]
- Li, J.; Fan, G.; He, Y. Predicting the current and future distribution of three coptis herbs in china under climate change conditions, using the maxent model and chemical analysis. Sci. Total Environ. 2020, 698, 134141. [Google Scholar] [CrossRef] [PubMed]
- Zhang, H.; Wang, X.; Zhang, Y.; Hu, R.; Pan, Y.; Chen, N. Responses of plant growth of different life forms to rainfall amount changes in an arid desert area. Chin. J. Ecol. 2015, 34, 1847–1853. [Google Scholar]
- Ma, B.; Sun, J. Predicting the distribution of stipa purpurea across the tibetan plateau via the maxent model. Bmc Ecol. 2018, 18, 10. [Google Scholar] [CrossRef] [PubMed]


| Code | Variables | Unit |
|---|---|---|
| Bio2 | Mean diurnal air temperature range (mean of monthly (maximum air temperature–minimum air temperature)) | °C * 10 |
| Bio3 | Isothermality | Dimensionless |
| Bio4 | Air temperature seasonality | Dimensionless |
| Bio8 | Mean air temperature of the wettest quarter | °C * 10 |
| Bio9 | Mean air temperature of the driest quarter | °C * 10 |
| Bio13 | Precipitation of the wettest month | mm/month |
| Bio14 | Precipitation of the driest month | mm/month |
| Bio15 | Precipitation seasonality (coefficient of variation) | Dimensionless |
| Bio19 | Precipitation of the coldest quarter | mm/quarter |
| Elevation | Elevation | m |
| Slope | Slope | % |
| Aspect | Aspect | Degree |
| Variable | Percent Contribution (%) |
|---|---|
| bio_04 | 34.4 |
| bio_09 | 27.6 |
| bio_02 | 19.4 |
| aspect | 7.9 |
| bio_14 | 4.6 |
| bio_13 | 3 |
| bio_15 | 1.2 |
| bio_19 | 0.9 |
| slope | 0.4 |
| bio_03 | 0.3 |
| bio_08 | 0.2 |
| dem | 0.1 |
| Scenarios | Generally Suitable | Moderately Suitable | Highly Suitable | Perfectly Suitable | |
|---|---|---|---|---|---|
| current | area (km2) | 1409 | 972 | 726 | 3107 |
| Percentage of area (%) | 0.26 | 0.18 | 0.13 | 0.57 | |
| 40sRCP26 | area (km2) | 2505 | 1595 | 2071 | 6171 |
| Percentage of area (%) | 0.46 | 0.29 | 0.38 | 1.12 | |
| 40sRCP45 | area (km2) | 2378 | 1538 | 2101 | 6017 |
| Percentage of area (%) | 0.43 | 0.28 | 0.38 | 1.10 | |
| 40sRCP60 | area (km2) | 1173 | 867 | 465 | 2505 |
| Percentage of area (%) | 0. 21 | 0.16 | 0.08 | 0.46 | |
| 40sRCP80 | area (km2) | 1331 | 1378 | 1529 | 4238 |
| Percentage of area (%) | 0.24 | 0.25 | 0.28 | 0.77 | |
| 60sRCP26 | area (km2) | 7656 | 5511 | 5132 | 18,299 |
| Percentage of area (%) | 1.39 | 1.00 | 0.93 | 3.33 | |
| 60sRCP45 | area (km2) | 4942 | 3259 | 2153 | 10,354 |
| Percentage of area (%) | 0.90 | 0.59 | 0.39 | 1.89 | |
| 60sRCP60 | area (km2) | 6066 | 3607 | 2304 | 11,977 |
| Percentage of area (%) | 1.10 | 0.66 | 0.42 | 2.18 | |
| 60sRCP80 | area (km2) | 3284 | 2300 | 1955 | 7539 |
| Percentage of area (%) | 0.60 | 0.42 | 0.36 | 1.37 |
© 2020 by the authors. Licensee MDPI, Basel, Switzerland. This article is an open access article distributed under the terms and conditions of the Creative Commons Attribution (CC BY) license (http://creativecommons.org/licenses/by/4.0/).
Share and Cite
Huang, X.; Ma, L.; Chen, C.; Zhou, H.; Yao, B.; Ma, Z. Predicting the Suitable Geographical Distribution of Sinadoxa Corydalifolia under Different Climate Change Scenarios in the Three-River Region Using the MaxEnt Model. Plants 2020, 9, 1015. https://doi.org/10.3390/plants9081015
Huang X, Ma L, Chen C, Zhou H, Yao B, Ma Z. Predicting the Suitable Geographical Distribution of Sinadoxa Corydalifolia under Different Climate Change Scenarios in the Three-River Region Using the MaxEnt Model. Plants. 2020; 9(8):1015. https://doi.org/10.3390/plants9081015
Chicago/Turabian StyleHuang, Xiaotao, Li Ma, Chunbo Chen, Huakun Zhou, Buqing Yao, and Zhen Ma. 2020. "Predicting the Suitable Geographical Distribution of Sinadoxa Corydalifolia under Different Climate Change Scenarios in the Three-River Region Using the MaxEnt Model" Plants 9, no. 8: 1015. https://doi.org/10.3390/plants9081015
APA StyleHuang, X., Ma, L., Chen, C., Zhou, H., Yao, B., & Ma, Z. (2020). Predicting the Suitable Geographical Distribution of Sinadoxa Corydalifolia under Different Climate Change Scenarios in the Three-River Region Using the MaxEnt Model. Plants, 9(8), 1015. https://doi.org/10.3390/plants9081015