Article

Calcium Improves Germination and Growth of Sorghum bicolor Seedlings under Salt Stress

1
Life Sciences Building, Department of Biotechnology, University of the Western Cape, Private Bag X17, Bellville 7535, South Africa
2
SensorLab, Department of Chemical Sciences, University of the Western Cape, Private Bag X17, Bellville 7535, South Africa
3
iThemba Laboratory for Accelerator Based Science, Material Research Department, P.O. Box 722, Somerset West 7129, South Africa
4
Department of Chemistry, Biology & Biotechnology, University of Perugia, Borgo XX Giugno 74, 06121 Perugia, Italy
*
Author to whom correspondence should be addressed.
Plants 2020, 9(6), 730; https://doi.org/10.3390/plants9060730
Submission received: 19 April 2020 / Revised: 21 May 2020 / Accepted: 21 May 2020 / Published: 10 June 2020

Abstract

:
Salinity is a major constraint limiting plant growth and productivity worldwide. Thus, understanding the mechanism underlying plant stress response is of importance to developing new approaches that will increase salt tolerance in crops. This study reports the effects of salt stress on Sorghum bicolor during germination and the role of calcium (Ca2+) to ameliorate some of the effects of salt. To this end, sorghum seeds were germinated in the presence and absence of different NaCl (200 and 300 mM) and Ca2+ (5, 15, or 35 mM) concentrations. Salt stress delayed germination, reduced growth, increased proline, and hydrogen peroxide (H2O2) contents. Salt also induced the expression of key antioxidant (ascorbate peroxidase and catalase) and the Salt Overlay Sensitive1 genes, whereas in the presence of Ca2+ their expression was reduced except for the vacuolar Na+/H+ exchanger antiporter2 gene, which increased by 65-fold compared to the control. Ca2+ reversed the salt-induced delayed germination and promoted seedling growth, which was concomitant with reduced H2O2 and Na+/K+ ratio, indicating a protective effect. Ca2+ also effectively protected the sorghum epidermis and xylem layers from severe damage caused by salt stress. Taken together, our findings suggest that sorghum on its own responds to high salt stress through modulation of osmoprotectants and regulation of stress-responsive genes. Finally, 5 mM exogenously applied Ca2+ was most effective in enhancing salt stress tolerance by counteracting oxidative stress and improving Na+/K+ ratio, which in turn improved germination efficiency and root growth in seedlings stressed by high NaCl.

1. Introduction

Plants are affected by environmental factors throughout their life cycle and seed germination is the most critical stage that determines plant growth and productivity [1]. Seed germination is a complex physiological process, which begins when water is taken up by the seed and is completed by the appearance of the radicle [2]. Among other abiotic factors, such as high temperatures, heavy metals, and drought, salinity is one of the detrimental abiotic factors, causing up to 50% crop loss worldwide. About 20% of the cultivated land and 33% of all irrigated land worldwide are affected by salinization and this is expected to continue to worsen [3,4]. Salinity slows seed germination and hinders seedling growth, which could be a result of high osmotic pressure making it difficult for the seed to absorb water or by the effects of ions that are toxic to the embryo [5]. Osmotic stress is considered as the initial harmful effect of salinity on plants and is caused by decreased water absorption capacity and increased water loss from leaves. Ionic stress result from the accumulation of toxic Na+ and Cl ions, which cause ionic imbalances and prevent the uptake of essential ions such as potassium (K+) in plant tissues [6]. High NaCl concentration, causes Na+ to displace Ca2+ from membranes, increasing intracellular Na+, resulting in higher Na+/K+ ratio [7,8]. These events lead to nutrient imbalances, loss of membrane function, decreased photosynthesis, affects stomatal closure, and alters the ability of antioxidant enzymes to detoxify reactive oxygen species (ROS) [9]. ROS are chemical species that contain oxygen and commonly include; superoxide radical (O2), hydrogen peroxide (H2O2), singlet oxygen (O2), and hydroxyl radical (OH). ROS are highly toxic to plants when produced at high levels causing oxidative membrane damage, peroxidation of lipids, nucleic acids and proteins, ultimately leading to cell death [10,11]. ROS levels are regulated by both the non-enzymatic and enzymatic antioxidant systems. Enzymatic antioxidants include a set of enzymes namely, superoxide dismutase (SOD), peroxidase (POD), catalase (CAT) and enzymes of the ascorbate (ASC)-glutathione (GSH) cycle [ascorbate peroxidase (APX), glutathione reductase (GR), monodehydroascorbate dehydrogenase (MDHAR), and dehydroascorbate reductase (DHAR)] [11,12].
Compatible solutes, such as proline and carbohydrates contribute to the maintenance of the osmotic balance, stabilization of proteins and enzymes, and enable water absorption [13]. Ion transporters and channels such as the salt overly sensitive 1 (SOS1) and the vacuolar Na+/H+ exchanger (NHX) antiporter are some of the key components involved in ion homeostasis. Maintenance of ion homeostasis is also crucial to improve crop tolerance under salt stress. SOS1 is a plasma membrane Na+/H+ antiporter that enables Na+ efflux at the root surface and regulates its transport from the root to the shoot thereby maintaining the equilibrium of K+ and Ca2+ [14,15,16]. Na+ in the cytoplasm is transported into the vacuole for osmotic adjustment by NHX [17]. Ca2+ is a macronutrient that is beneficial in maintaining plant growth, development, and crop yield [18]. Ca2+ is not just a signaling molecule, but also a structural component of the cell wall and plasma membrane. It contributes to the strength of plant stems, improves the absorption of nutrients across the plasma membrane, influences the transfer of sugars, and helps form and stabilize organelles such as the mitochondria and nucleus [19]. In addition, Ca2+ functions as a secondary messenger that mediates the metabolic processes of plant growth, development, and stress tolerance [18,20,21]. It also alleviates ionic stress by binding to the plasma membrane and blocks the non-selective cation channels that are the major pathways for Na+ influx in plants [22,23]. Several studies demonstrated the effectiveness of exogenous Ca2+ to improve seed germination through maintaining ion homeostasis and modulating the antioxidant system under salt stress [8,24,25]
Thus, this study was conducted to elucidate aspects of salt stress tolerance mechanisms in Sorghum bicolor and the ability of exogenous Ca2+ to improve tolerance through enhancing the antioxidant and ion homeostasis systems. Sorghum is a C4 plant that is particularly adapted to grow and yield in arid and semi-arid areas and is moderately tolerant of drought and salt [26,27]. Hence, it is possible to take advantage of these characteristics and study the mechanisms of salt tolerance in order to develop ways to mitigate salt stress in cereals. Although some studies reported aspects of salt tolerance mechanisms in sorghum [28,29], to date, the effect of high salt on the germination and the role of exogenous Ca2+ to induce increased salt stress tolerance in sorghum have remained elusive.

2. Results

2.1. Physiological Analysis of the Effect of NaCl and Ca2+ on Seed Germination and Growth

In this study we used three parameters including germination assays (germination percentage, mean germination time, germination index, and total germination), measurements of root/shoot length and fresh/dry weights to determine the effects of salt stress and Ca2+ on seed germination and growth of Sorghum bicolor.

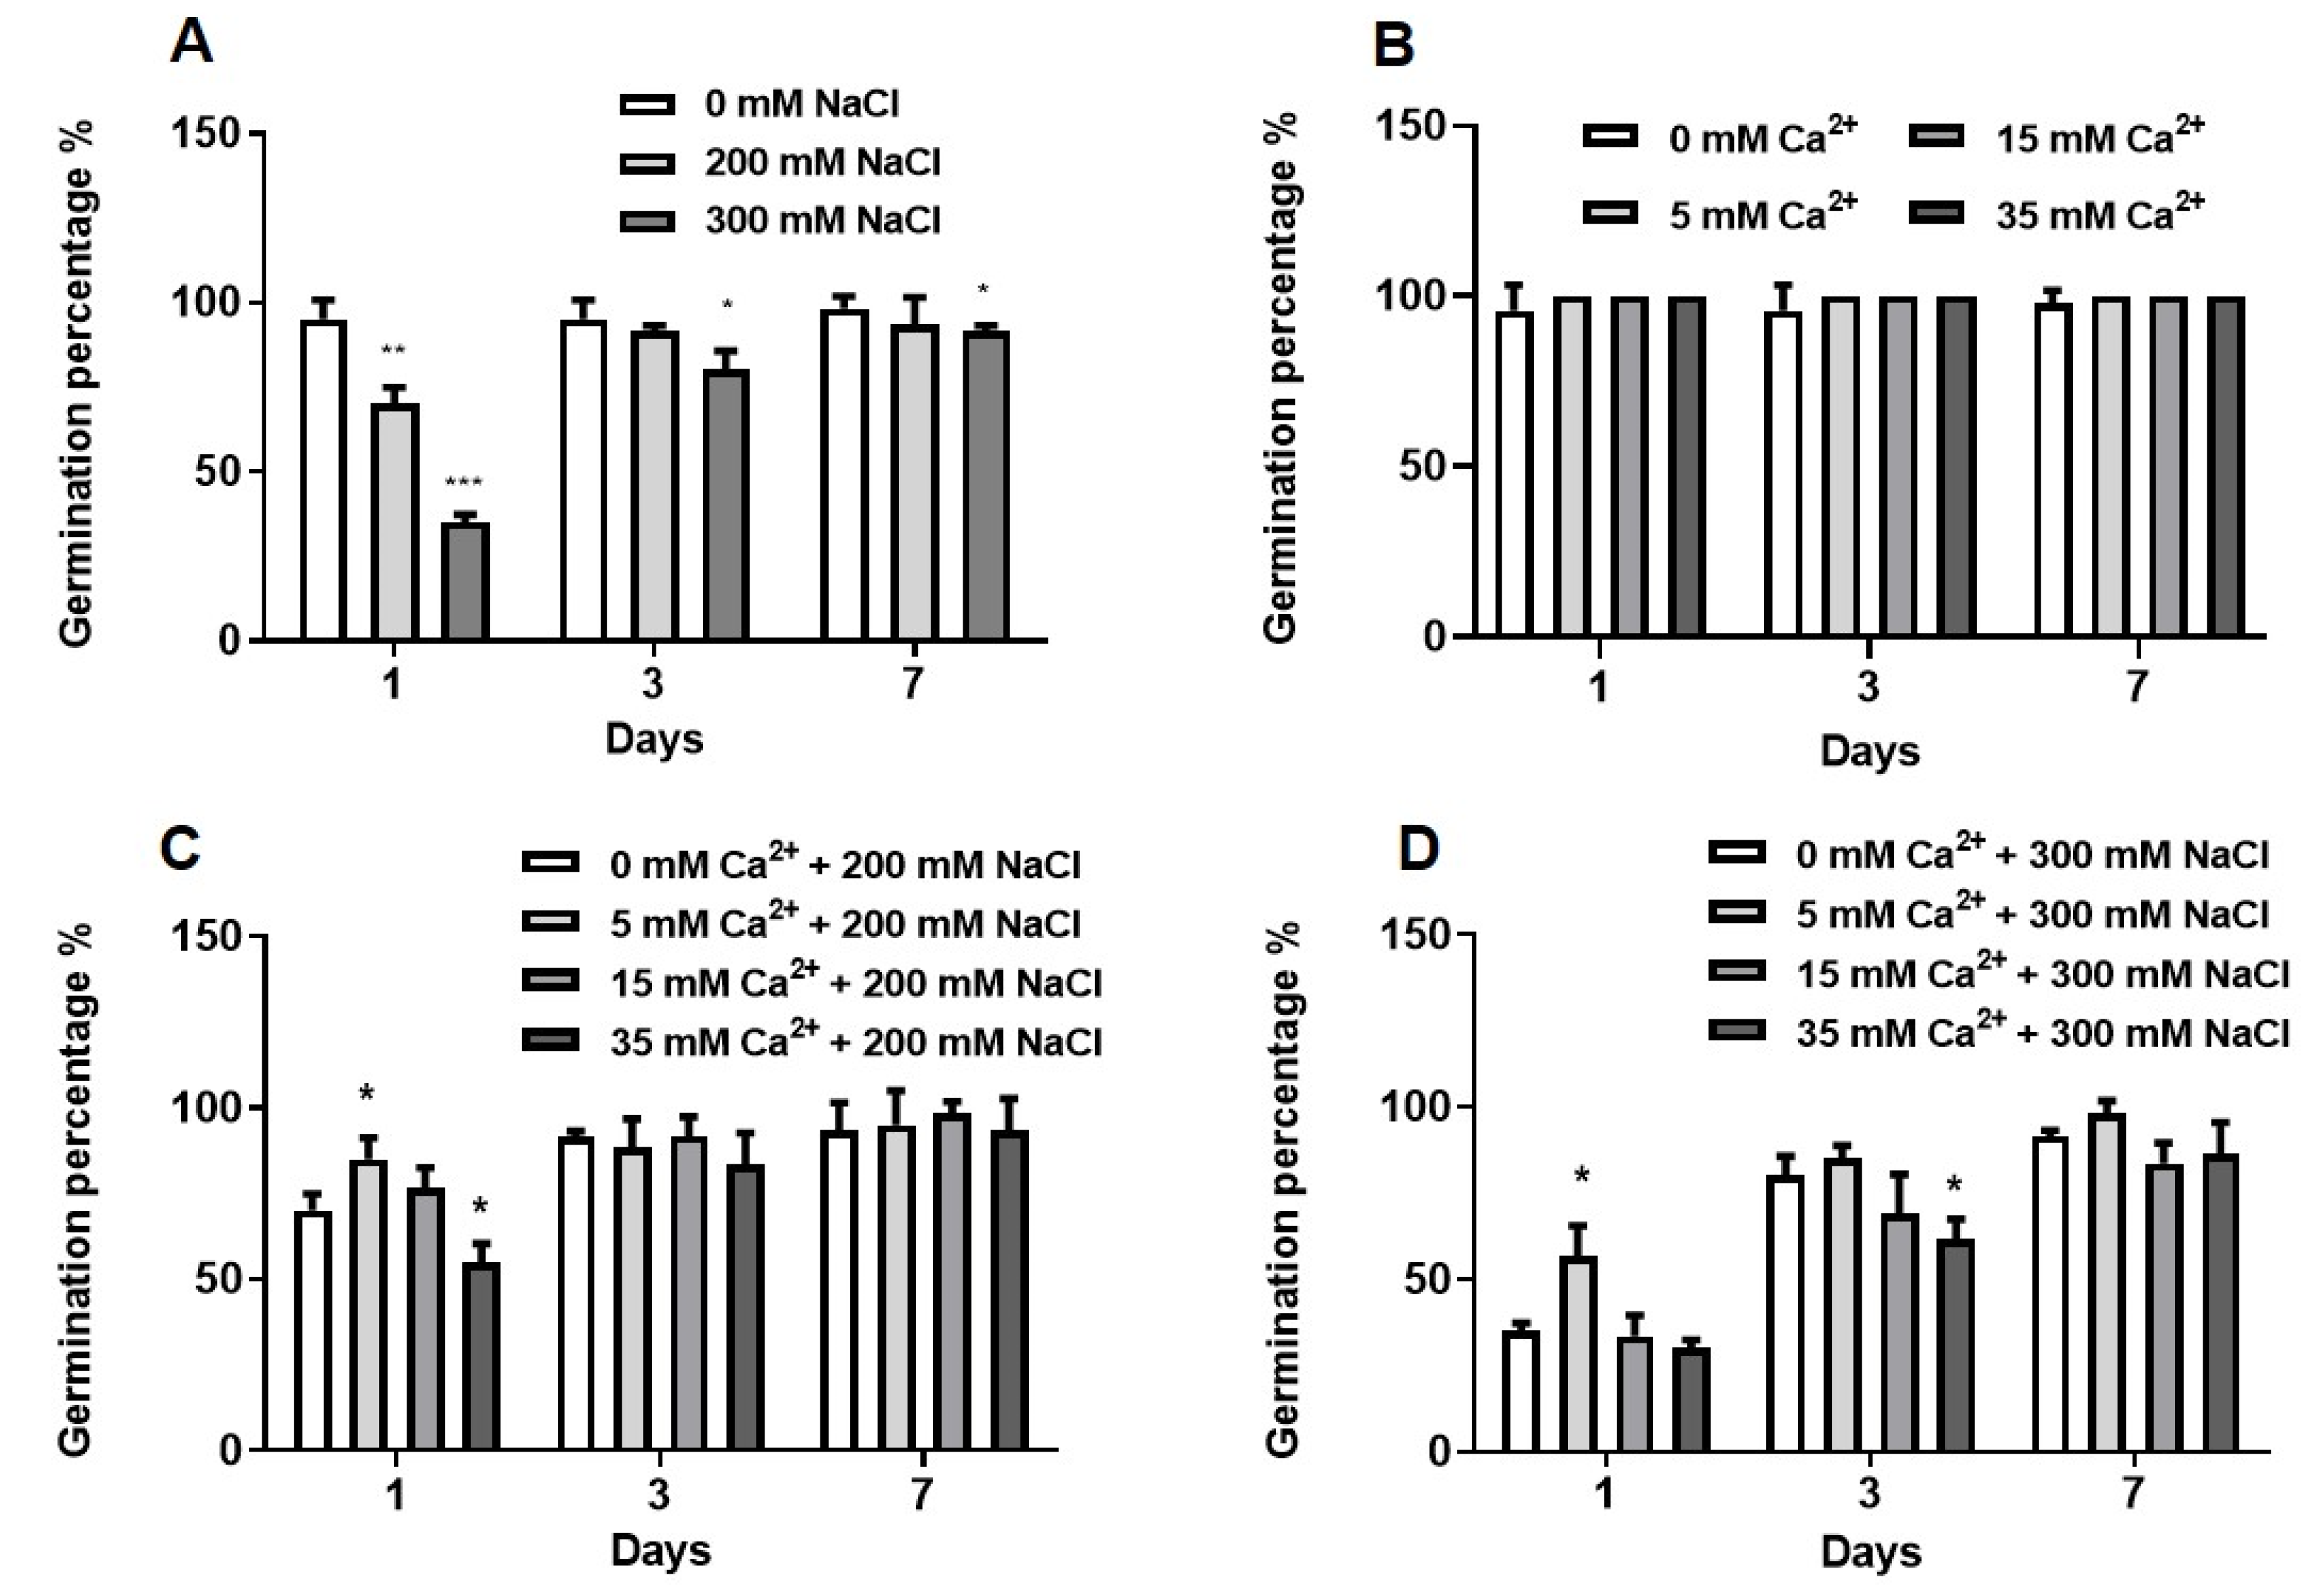
2.1.1. Germination Assays

Germination percentage is described as a qualitative measure that indicates the viability of a population of seeds at a critical stage in the life cycle [30]. Sorghum bicolor seeds were germinated in the absence (0 mM) and presence (200 and 300 mM) of NaCl for 7 days (Figure 1). Germination percentage decreased significantly by 30% and 65% for seedlings under 200 mM (p ≤ 0.01) and 300 mM (p ≤ 0.001) NaCl respectively after day 1. At days 3 and 7, the germination percentage was also significantly (p ≤ 0.05) affected by 300 mM NaCl (Figure 1A).
All Ca2+ concentrations (5, 15, 35 mM) improved germination of control seedlings (without added NaCl) reaching up to 100% germination percentage (Figure 1B). Only 5 and 15 mM Ca2+ increased germination percentage of seeds germinating under 200 mM NaCl on day 1, as compared to the control (200 mM NaCl only), which resulted in a mean germination percentage of ≥70% (Figure 1C). The germination percentage of seedlings germinating under 300 mM NaCl reached up to 56% on day 1 when treated with 5 mM Ca2+ (Figure 1D). The highest germination percentage of 100% was observed for control seedlings treated with Ca2+, followed by ~98%, which was obtained for seedlings treated with 200 or 300 mM NaCl in the presence of 15 or 5 mM Ca2+. Mean germination time, germination index, and total germination have been described in the Supplementary results (Table S1).

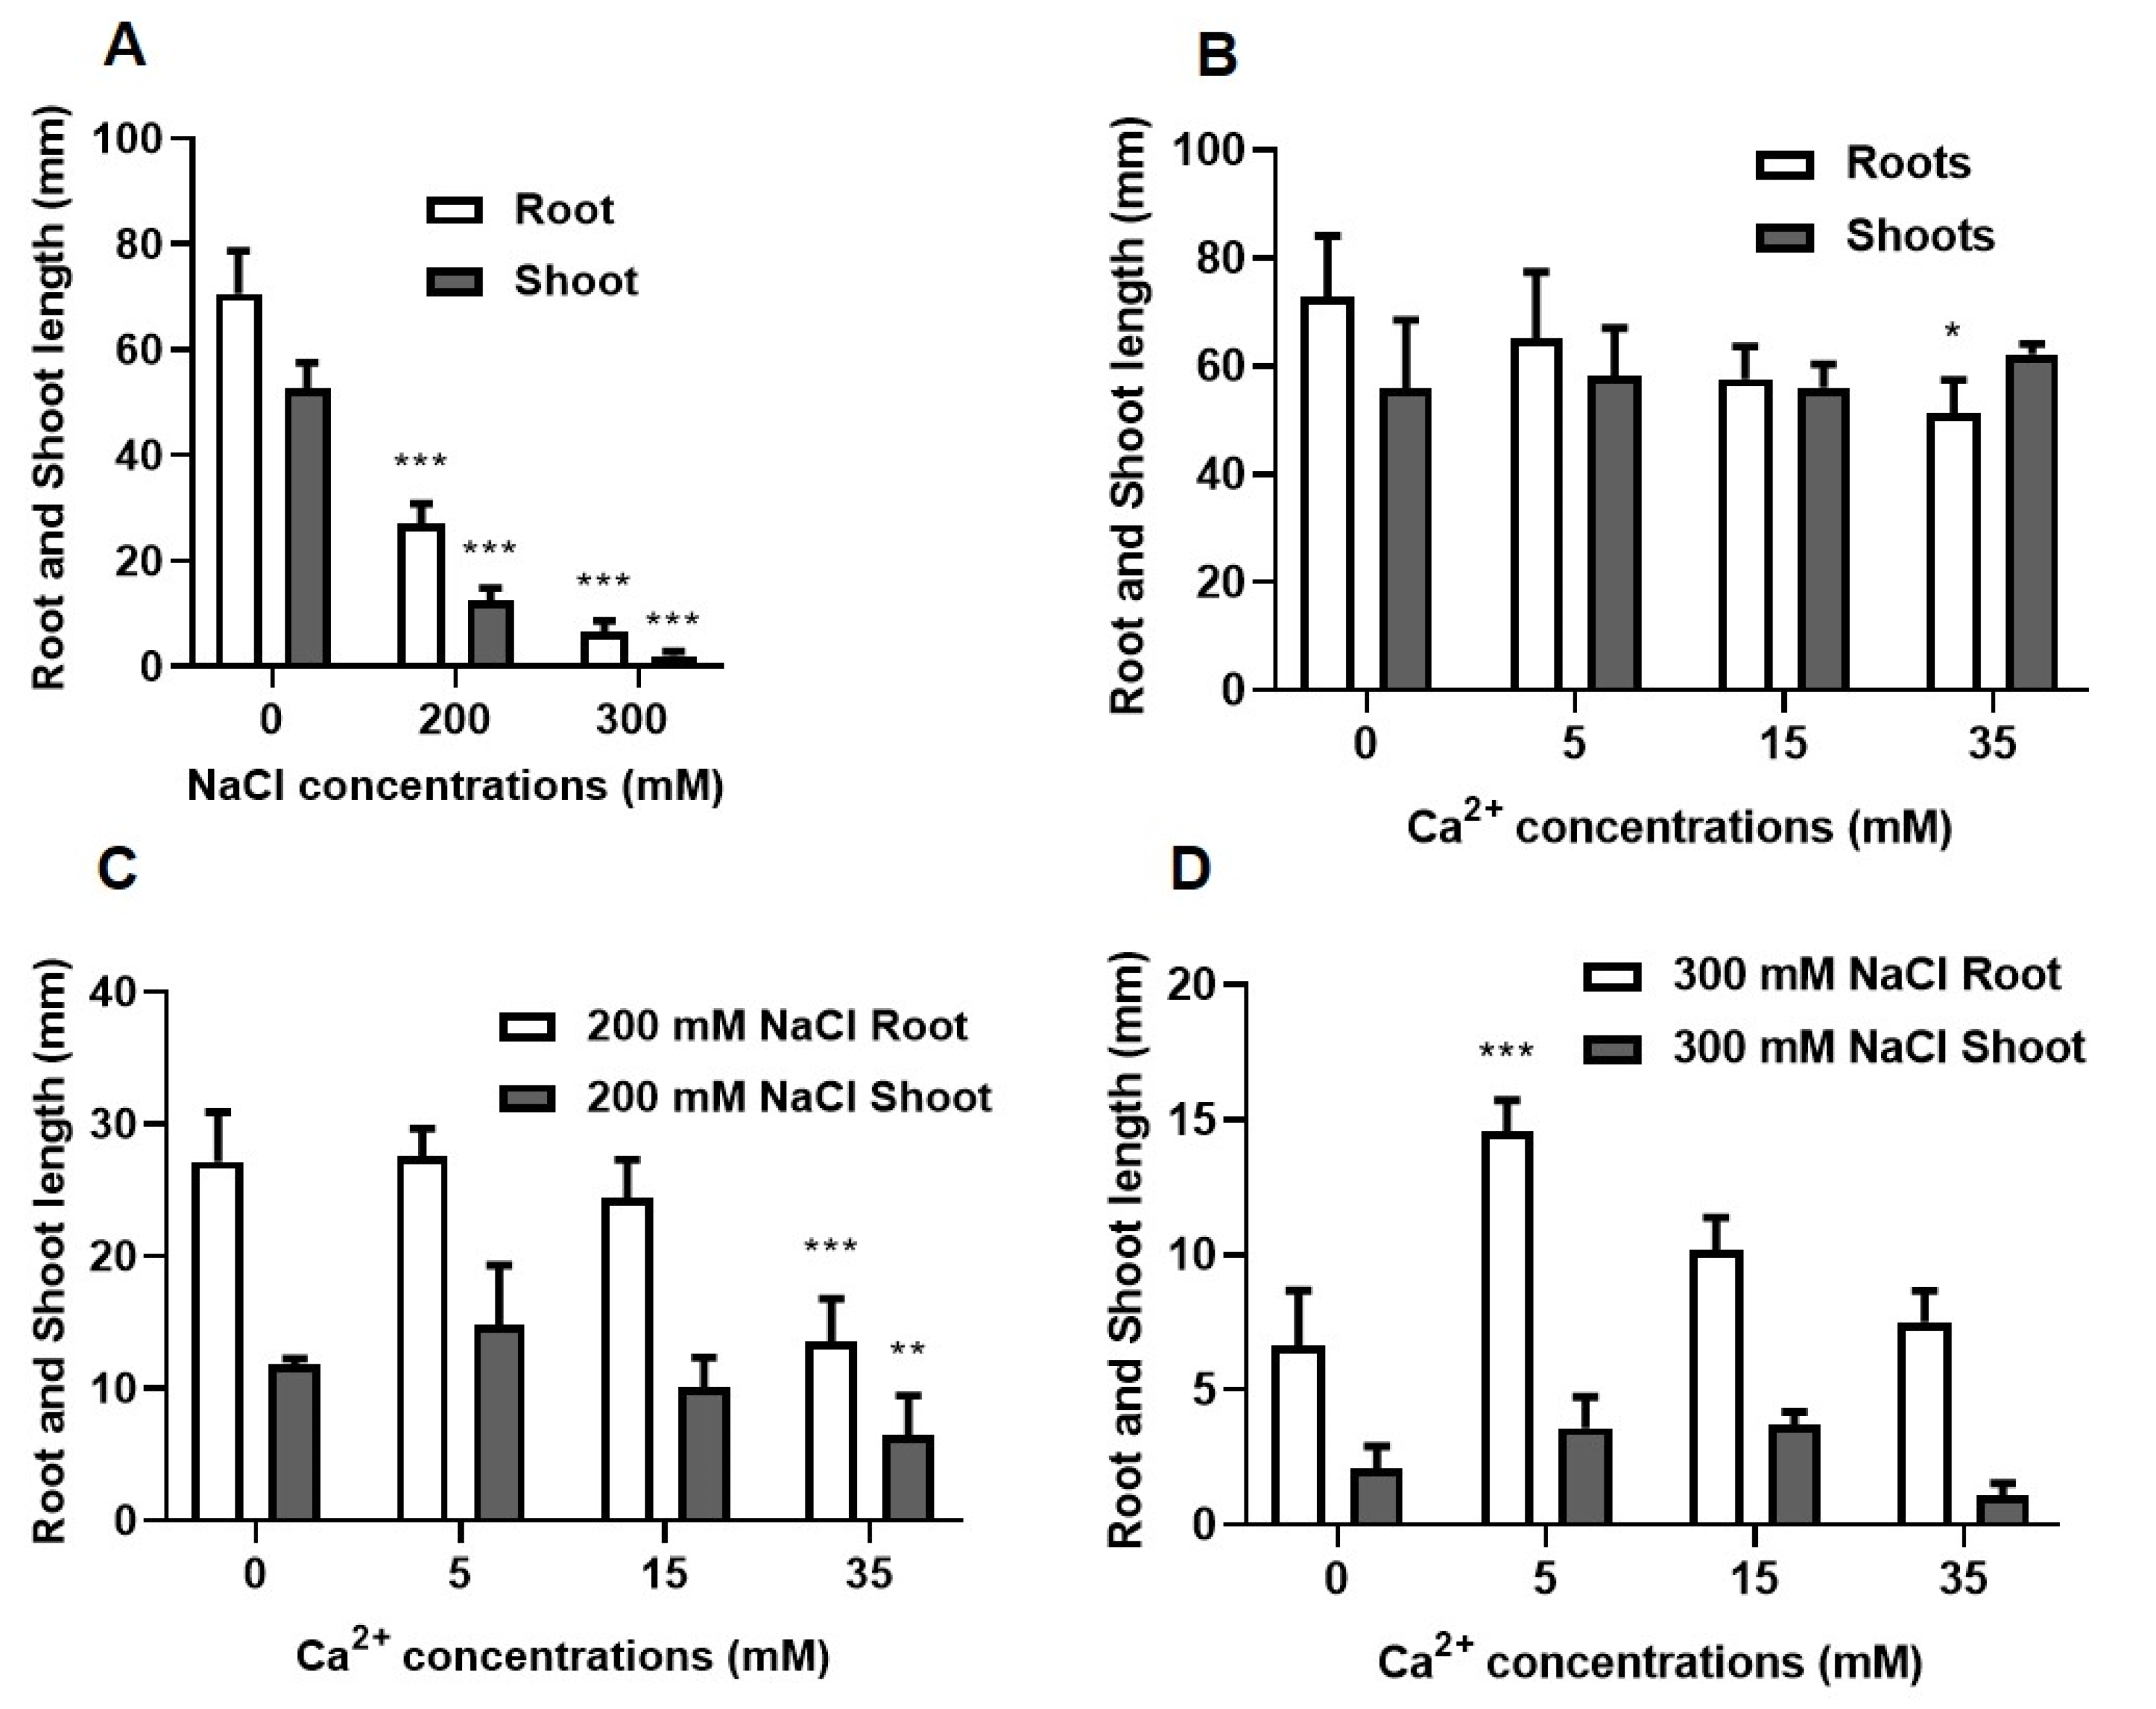
2.1.2. Growth Analysis

Root length was measured on day 3 (Figure S1) whereas both roots and shoots were measured on day 7 (Figure 2) and only the results obtained on day 7 will be described in this study. Both the root and shoot lengths significantly (p ≤ 0.001) decreased gradually with increasing NaCl concentration by more than 50% relative to the control seedlings (without added NaCl) (Figure 2A). The effect of Ca2+ on control seedlings (without added NaCl) was not significant at 5 mM and 15 mM Ca2+, whereas high concentrations (35 mM Ca2+) significantly (p ≤ 0.05) decreased root length (Figure 2B). The effect of low Ca2+ (5 and 15 mM) concentrations was not significant on the mean root and shoot lengths of seedlings grown under 200 mM NaCl. But a significant decrease was observed at 35 mM Ca2+ for both roots (p ≤ 0.001) and shoots (p ≤ 0.01).
For seedlings under 300 mM NaCl, the highest root length (15 mm) was observed for the 5 mM Ca2+ treatment and the lowest (7.5 mm) was observed for the 35 mM Ca2+ treatment as compared to the control (300 mM NaCl only). The same pattern was also observed in the shoots (Figure 2D).
Fresh and dry weights were measured and a reduction was observed under high NaCl (Table S2). Fresh weights decreased significantly (p ≤ 0.001) by 1.7-fold and 1.96-fold for seedlings under 200 and 300 mM NaCl. Control seedlings showed the highest mean fresh weight of 0.57 g and the lowest was 0.29 g for seedlings under 300 mM NaCl. Treatment of control (without added NaCl) and NaCl-stressed seedlings with Ca2+ showed no significant effects on the fresh and dry weights.

2.2. Biochemical Analysis of the Effect of NaCl and Ca2+ on Seed Germination

2.2.1. Proline Accumulation

Proline was measured to determine the capacity of osmotic balance by sorghum in the presence of NaCl and Ca2+ (Figure 3). Proline content significantly (p ≤ 0.001) increased in the presence of NaCl with no differences observed between 200 and 300 mM NaCl (Figure 3A). Control seedlings (without added NaCl) maintained a low proline content of 106.04 µmol/g−1FW as compared to seedlings under high NaCl (300 mM NaCl = 669.25 µmol/g−1FW proline). Control seedlings showed a more than 50% increase in proline when supplemented with 15 and 35 mM Ca2+ concentrations (Figure 3B). No significant changes in proline content were observed in NaCl-stressed sorghum seedlings treated with different Ca2+ concentrations (Figure 3C).

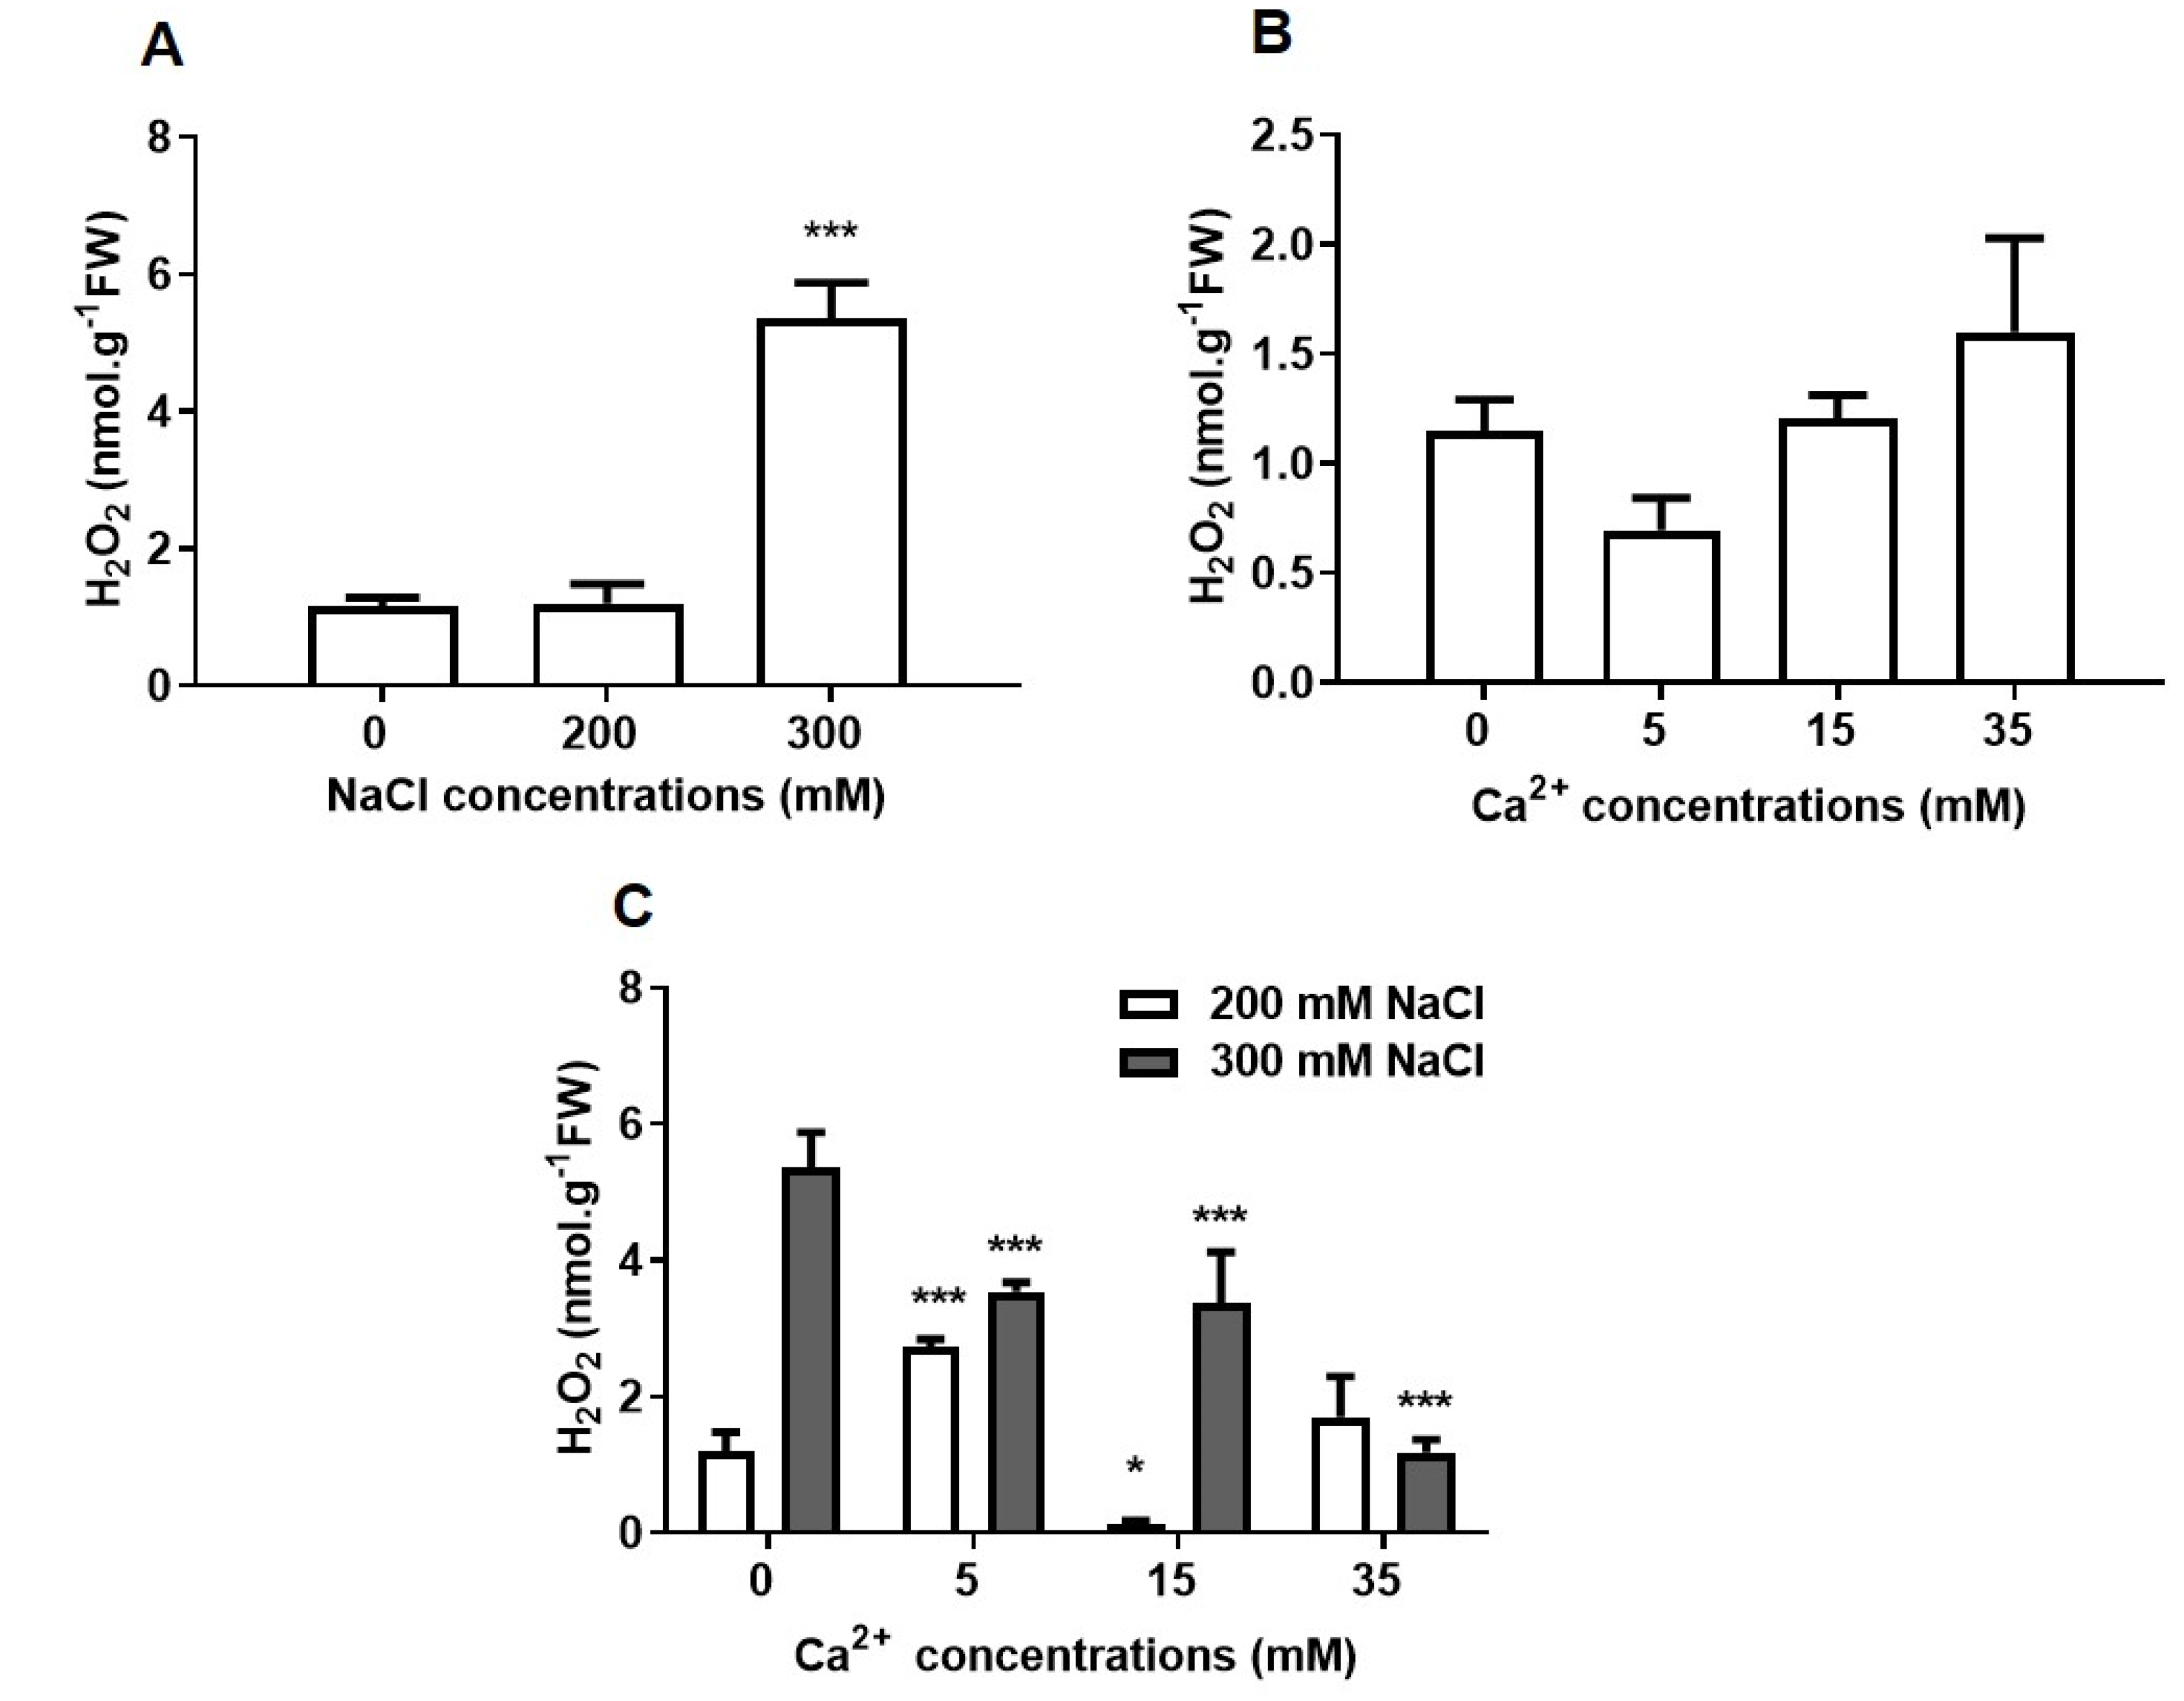
2.2.2. Oxidative Stress

Oxidative damage was determined by assaying the level of hydrogen peroxide (H2O2) (Figure 4) and membrane structure (Figure 5). H2O2 content remained at low levels similar to the control for seedlings under 200 mM NaCl, but at 300 mM NaCl, it significantly (p ≤ 0.001) increased by approximately 4-fold as compared to the control (Figure 4A). Ca2+ had no significant effects on the H2O2 content of control seedlings (without added NaCl) (Figure 4B). Different Ca2+ concentrations significantly (p ≤ 0.001) reduced H2O2 content in seedlings grown under 300 mM NaCl (Figure 4C).

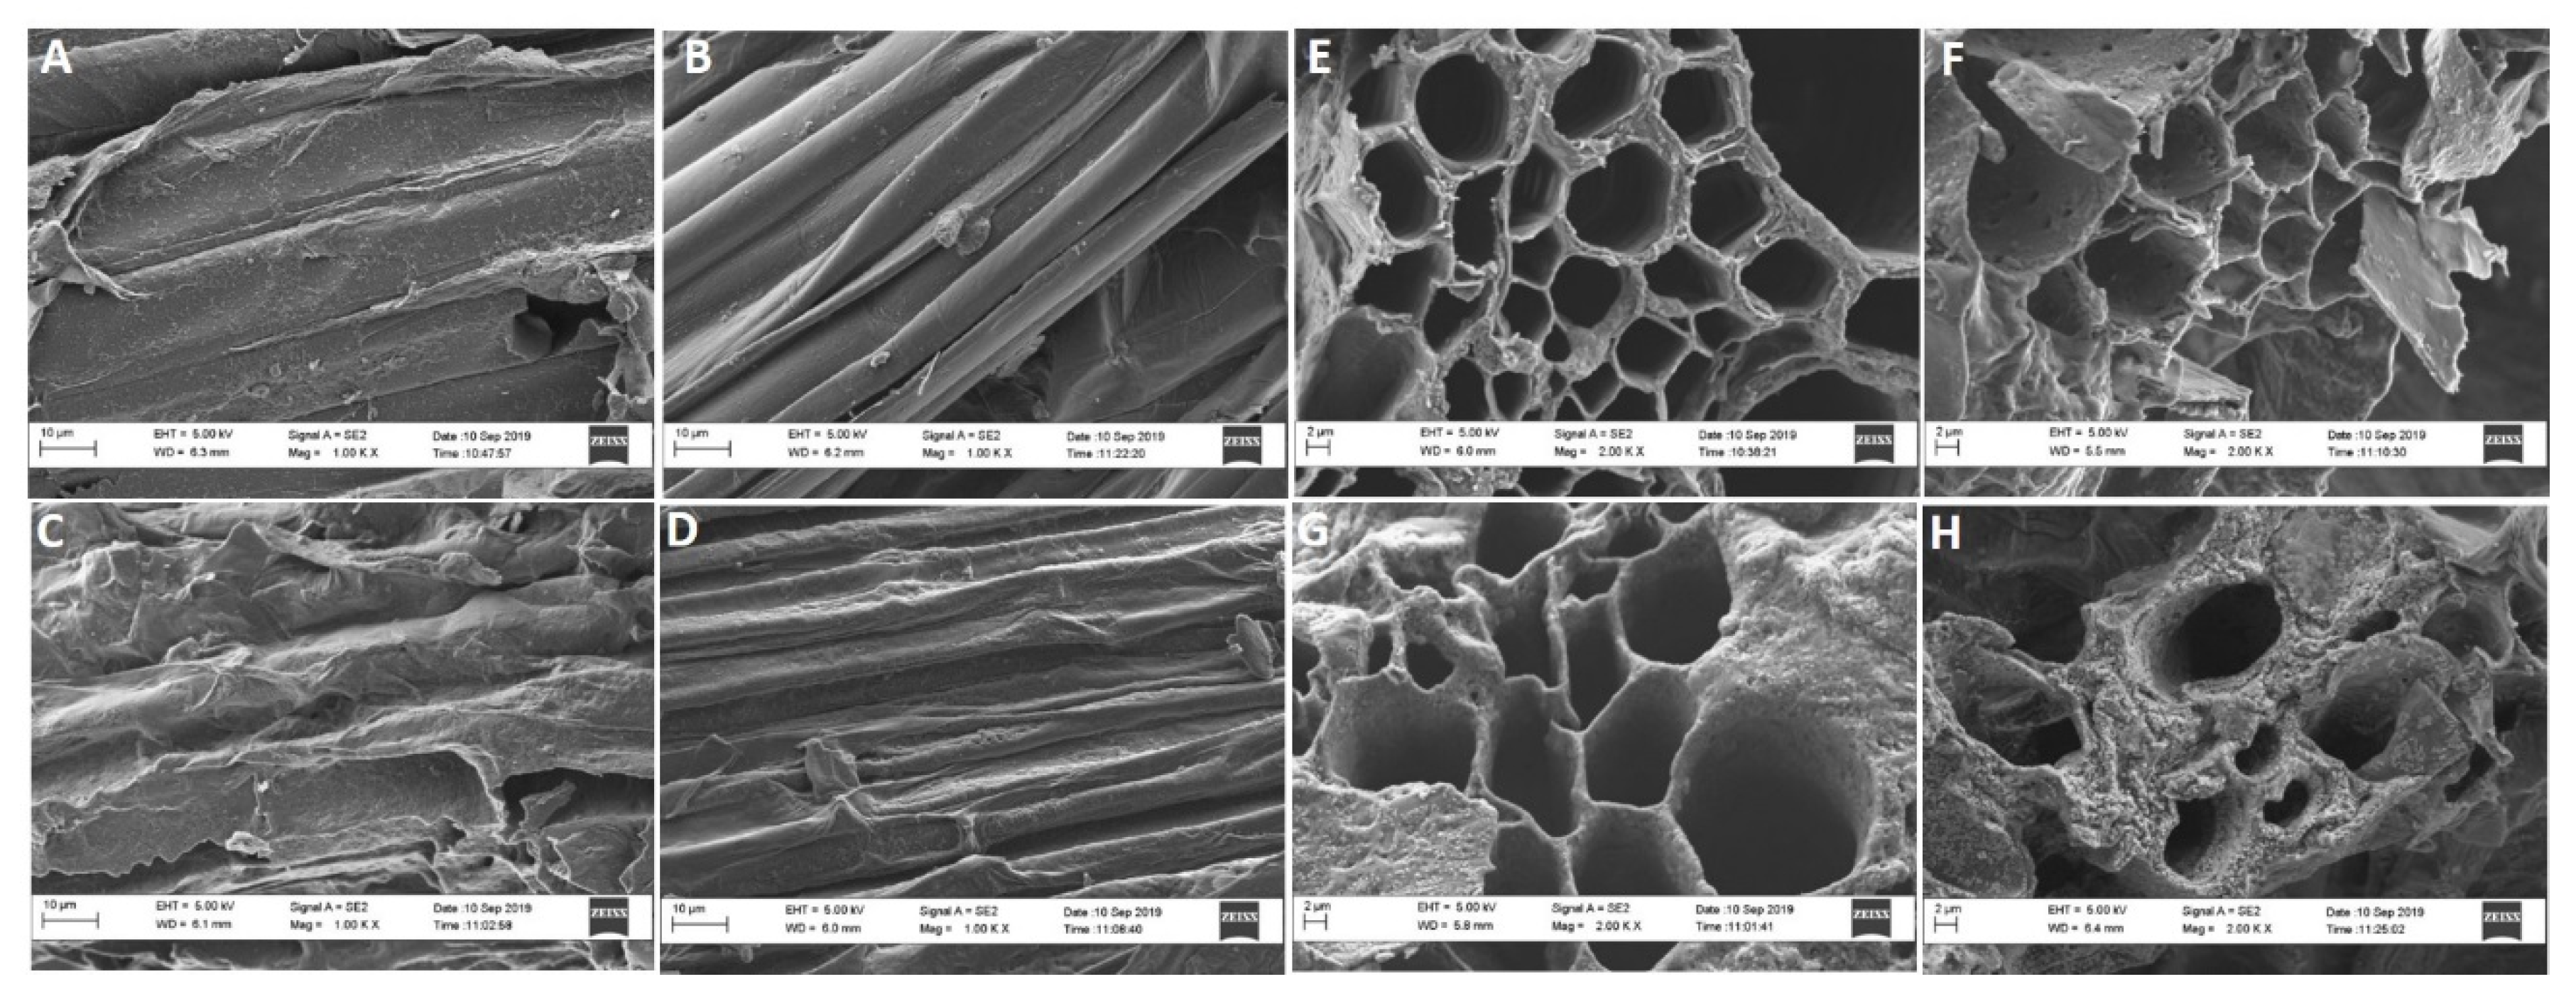
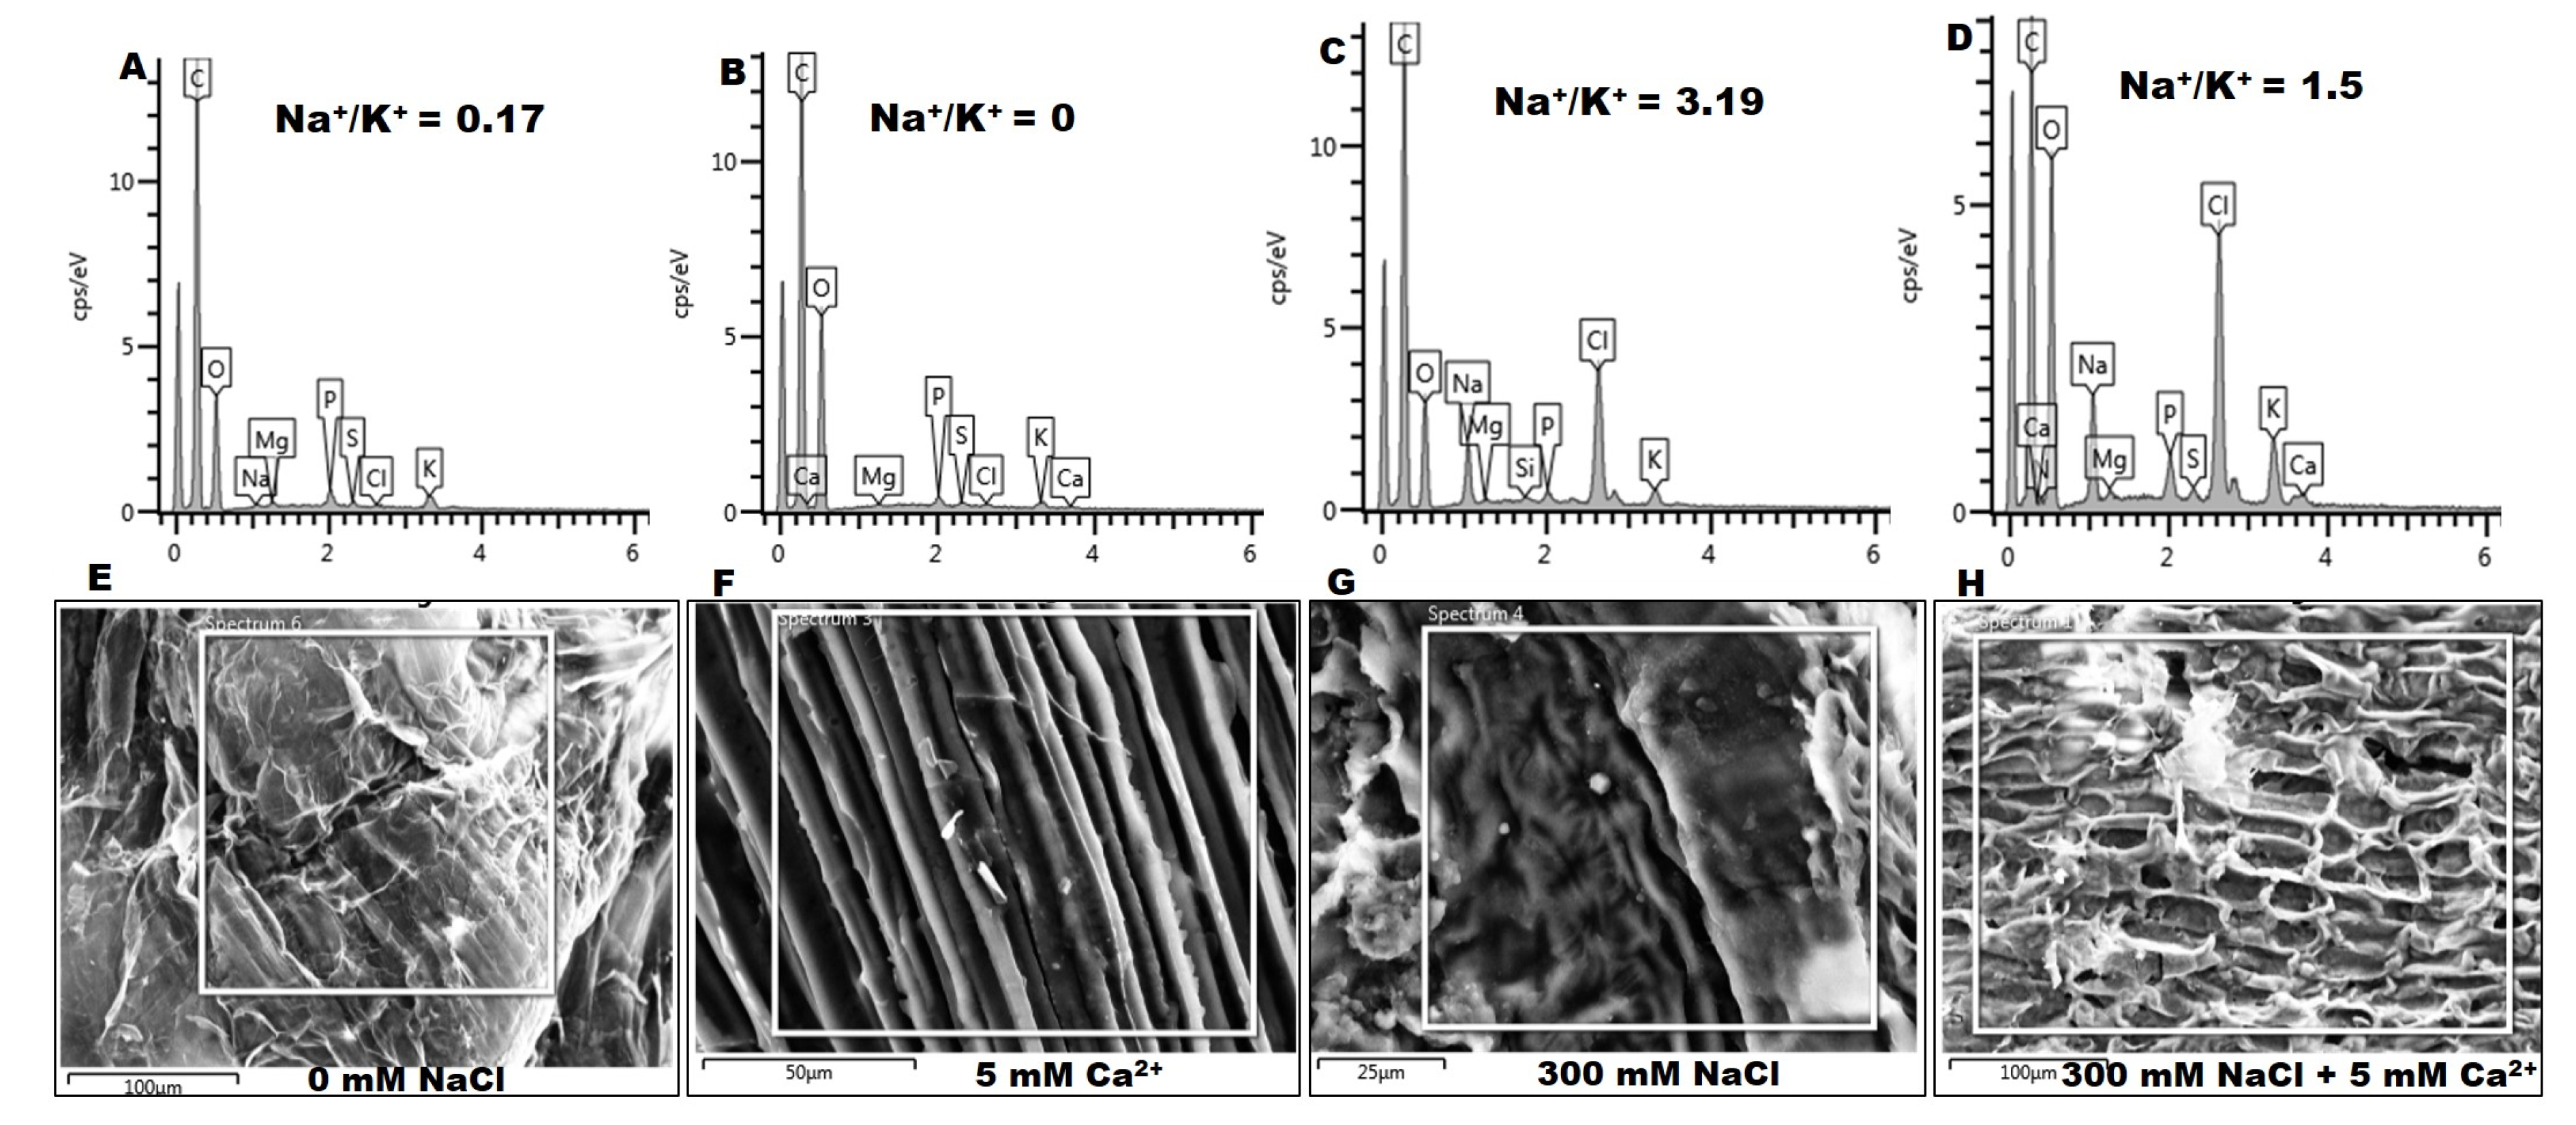
2.2.3. Membrane Structure

The anatomical structure (epidermis and xylem layers) of sorghum seedlings was examined to determine the effect of NaCl and Ca2+ on oxidative stress using Scanning Electron Microscopy (SEM). The epidermis of seedlings treated with 5 mM Ca2+ revealed a smooth epidermal layer (Figure 5B) as compared to the control (Figure 5A). Under 300 mM NaCl, the epidermis showed changes associated with shrinkage and the formation of several additional features (Figure 5C). The application of 5 mM Ca2+ improved the epidermis structure (Figure 5D). Xylem walls of control seedlings in the presence of Ca2+ only, showed slight changes (thin layers) (Figure 5F) as compared to the control (Figure 5E). In the presence of NaCl, damage to the xylem is clearly evident as shown by shrinkage and thinning of the walls (Figure 5G). Seedlings under 300 mM NaCl that were treated with 5 mM Ca2+ showed improvements e.g., thickened xylem walls (Figure 5H).

2.2.4. Na+ and K+ Content

Ion content, particularly Na+ and K+ (Figure 6; Table S3), was analyzed using Scanning Electron Microscopy-Energy dispersive X-ray spectroscopy (SEM-EDX) after treatment with 0 and 300 mM NaCl in the absence and presence of 5 mM Ca2+. Na+/K+ ratio was calculated based on the Weight %, however, the Weight Sigma and Atomic % values are provided in Table S3. Na+ concentration in seedlings treated with 300 mM NaCl increased by 13.5-fold, whereas K+ concentration decreased by 1.3-fold resulting in a high Na+/K+ ratio of 3.19 as compared to the control (Na+/K+ = 0.17). Treatment with 5 mM Ca2+ decreased Na+ concentration by 0.8-fold, whereas K+ increased by 2.4-fold resulting in a low Na+/K+ ratio of 1.5. The SEM images revealed significant changes in the morphology of the investigated surface area (Figure 6E–H). Seedlings treated with Ca2+ only (Figure 6F) showed a smooth surface area as compared to the control (Figure 6E). In the presence of NaCl, the surface area showed shrinkage (Figure 6G), whereas seedlings treated with both 300 mM NaCl and 5 mM Ca2+ showed an improved surface area, with less deformation (Figure 6H).

2.3. Transcriptional Analysis of the Effect of NaCl and Ca2+ on Germination

The expression of genes encoding the antioxidant, and the sodium/hydrogen exchanger enzymes was analyzed using quantitative real-time PCR (qRT-PCR) in seedlings germinating under 0 mM and 300 mM NaCl with a combination of different Ca2+ concentrations (5, 15 and 35 mM) (Figure 7). The antioxidant enzymes included the Sorghum bicolor APX2 annotated as the PREDICTED: Sorghum bicolor L-ascorbate peroxidase 2, cytosolic (Accession numbers: LOC8077530, mRNA; Sequence ID: XM_002463406.2), and the SbCAT3 annotated as PREDICTED: Sorghum bicolor catalase isozyme 3 (Accession numbers: LOC8068221, mRNA Sequence ID, XM 0214460018.1). The Na+/H+ exchanger antiporter enzymes included the plasma Na+/H+ exchanger antiporter, also known as the Salt Overly Sensitive (SOS1) annotated as PREDICTED: Sorghum bicolor sodium/hydrogen exchanger 8 (Accession numbers: LOC8074408, mRNA Sequence ID: XM 002443629.2), and the vacuolar Na+/H+ exchanger antiporter annotated as PREDICTED: Sorghum bicolor sodium/hydrogen exchanger 2 (Accession numbers: LOC8074408, mRNA Sequence ID: XM 002461123.2). These genes will be referred to as SbAPX2, SbCAT3, SbSOS1, and SbNHX2 in the rest of the document. cDNA amplicons of ascorbate peroxidase (SbAPX2), catalase (SbCAT3), salt overly sensitive 1 (SbSOS1), and vacuolar Na+/H+ exchanger antiporter (SbNHX2) genes, were amplified by qRT-PCR to produce amplicon sizes of 211 bp (SbAPX2), 199 bp (SbCAT3), 231 bp (SbSOS1), and 219 bp (SbNHX2) (see File S2).

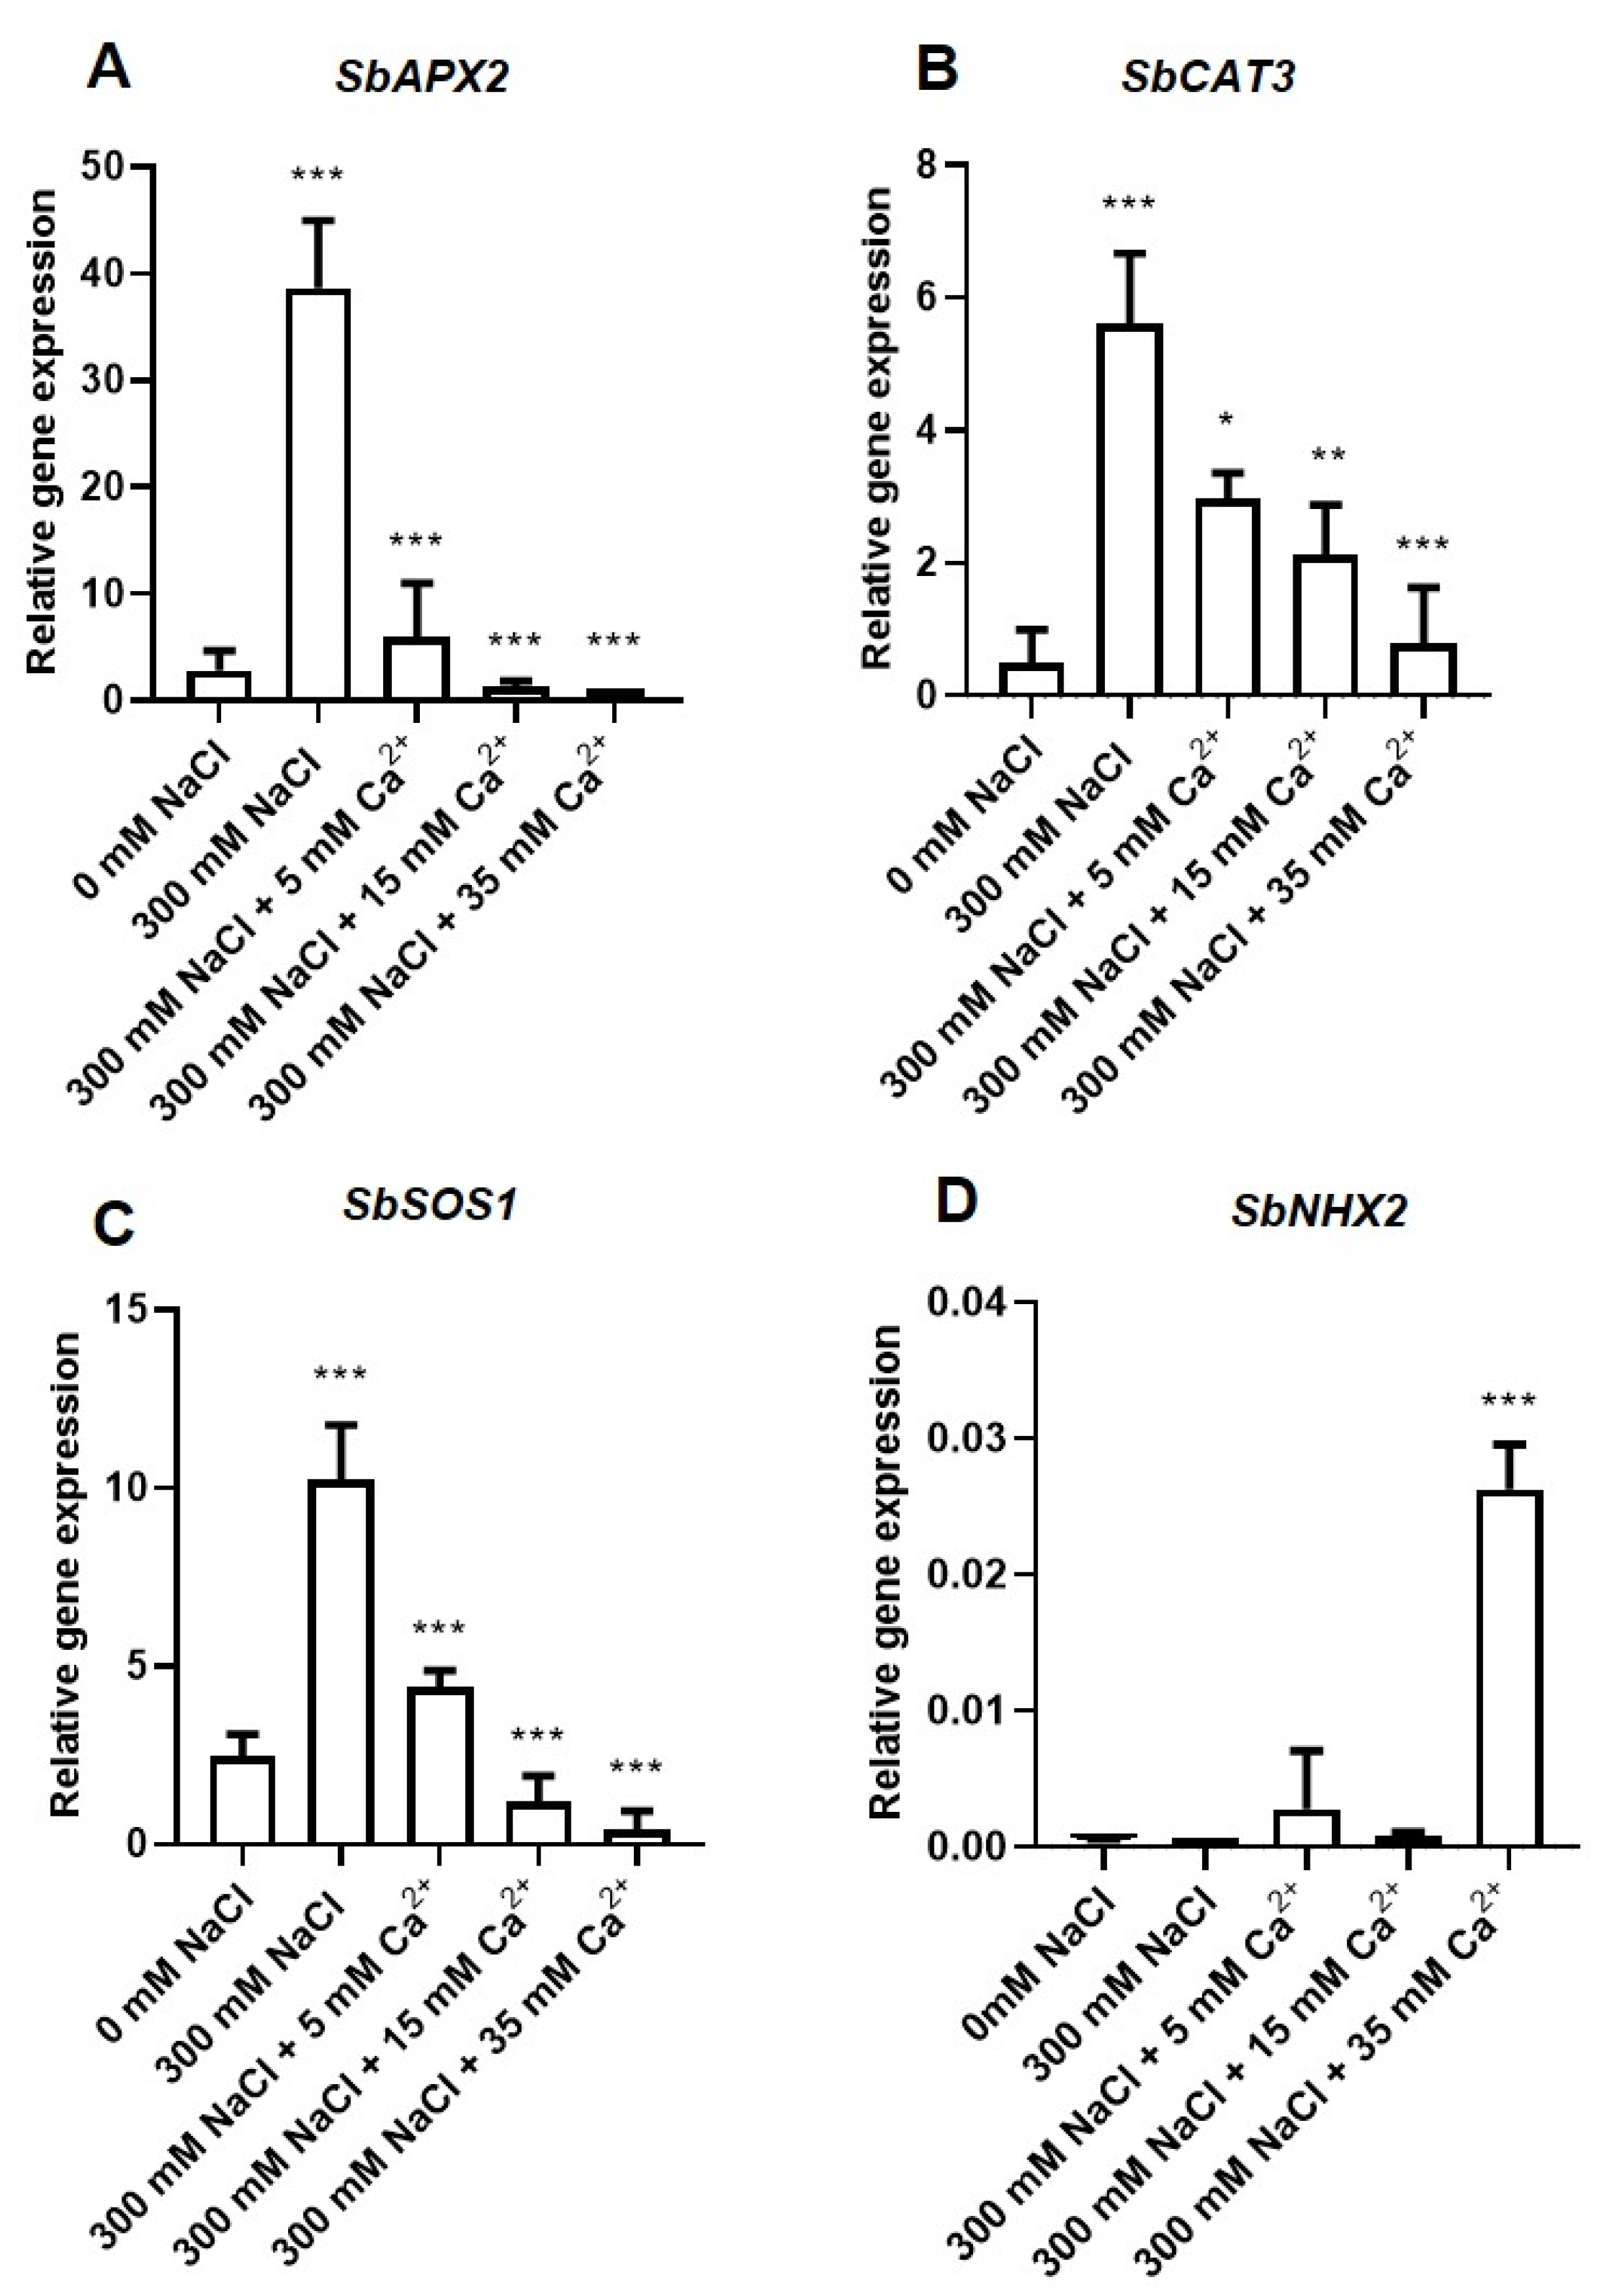
2.3.1. Transcription Analysis of the Antioxidant Genes

Two antioxidant enzymes including APX and CAT were selected based on their ability to detoxify H2O2 and, therefore, allow the study of effects of NaCl and Ca2+ responses by Sorghum bicolor. Both genes were constitutively expressed in sorghum seedlings at different levels, with SbAPX2 representing the highest transcript numbers followed by SbCAT3 (Figure 7A,B). Their transcript levels increased significantly (p ≤ 0.01) in seedlings under 300 mM NaCl (>10-fold relative to their controls) (Figure 7A,B). Treatment of NaCl-stressed seedlings with different Ca2+ concentrations reduced their transcripts in a concentration-dependent manner.

2.3.2. Transcription Analysis of the Na+/H+ (NHX) Antiporter Coding Genes

To understand the effect of NaCl and Ca2+ on the ion homeostasis of sorghum, the expression levels of the plasma membrane Na+/H+ (SbSOS1) and vacuolar SbNHX2 antiporter genes were determined. Both genes were constitutively expressed, with SbSOS1 representing the highest transcript level (Figure 7C,D). The SbSOS1 transcript was significantly (p ≤ 0.01) induced in seedlings treated with 300 mM NaCl (~4-fold) relative to the control. The presence of different Ca2+ concentrations decreased the expression of SbSOS1 transcript in a concentration-dependent manner (Figure 7C). The expression of the vacuolar SbNHX2 was not significantly affected by 300 mM NaCl, whereas treatment with different Ca2+ concentrations increased its expression significantly (p ≤ 0.01), with a 65-fold increase under 35 mM Ca2+ relative to the control (Figure 7D).

3. Discussion

Salt stress greatly affects many biological processes including seed germination by inducing a reduction in the germination rate and delayed initiation of germination and seedling establishment [31,32]. In this study, the effects of NaCl stress and Ca2+ on the germination of Sorghum bicolor were investigated. Salt stress reduced germination percentage and delayed germination of sorghum seeds with significant effects observed at 300 mM NaCl within the first 3 days (Figure 1A). Similar effects were reported in Festuca ovina L. [24], Cucumis sativus L. cv. [25], Brassica napus L. [33], Suaeda salsa [34], and even a halophyte, Halocnemum strobilaceum [35]. The germination percentage assays are supported by the germination index, which decreased from 136 to 95.66 under 300 mM NaCl, indicating a ~30% reduction (Table S1). Previous reports have also demonstrated that increasing NaCl concentrations can affect the germination index of crops as observed in Zea mays [36] and Capsicum annuum L. [37]. The decreased germination index might be due to osmotic stress, which causes impairment in nutrient uptake and ionic stress due to the accumulation of ions causing ion toxicity [20,38]. Application of Ca2+ was able to reverse the effects of salt stress on sorghum seed germination especially at low concentrations (5 mM Ca2+). Similarly, Ca2+ also improved seed germination of Festuca ovina L. [24], Phragmites karka [39], Triticum aestivum [40], Urochondra setulosa [41], Pisum sativum [42], Solanum lycopersicon [43,44], and Vigna radiata [45].
Sodium chloride also reduced root and shoot length of sorghum seedlings in a concentration-dependent manner and shoots showed more sensitivity to NaCl than roots (Figure 2). This is possibly due to excess salts in the roots causing ionic stress and a decrease in root osmotic potential that prevents the roots from absorbing water and water transport to the shoots. This would in turn affect embryo expansion and seedling emergence [46]. Similar effects were observed in Brassica juncea, which showed decreased growth and seedling emergence due to salt stress [38]. Ca2+ on its own decreased root length of seedlings grown in the absence (0 mM NaCl) and presence (200 mM NaCl) of salt with significant effects observed for higher Ca2+ (35 mM) concentrations. However, Ca2+ improved both root and shoot length of seedlings grown in the presence of 300 mM NaCl, and these responses are similar to those seen in Festuca ovina L. [24]. The highest root and shoot lengths were observed in seedlings that were treated with 5 or 15 mM Ca2+, followed by a decrease at high Ca2+ concentration (35 mM). Given these observations, it was important to determine the Ca2+ concentrations best suitable to improve growth without causing toxicity and inhibitory growth effects [47], thus 5 and 15 mM Ca2+ represent the best analyzed in this study. Increasing salt concentration decreased fresh and dry weights of sorghum seedlings indicating that cell division and elongation were inhibited [48,49]. Treatment with Ca2+ showed no significant improvement in the fresh and dry weight of seedlings germinated in the presence of NaCl (Table S2). Although the effect of Ca2+ on fresh and dry weights of NaCl-stressed sorghum seedlings was not significant, other studies reported positive effects [24,50].
Proline is an important osmolyte that helps to maintain the osmotic balance by increasing the osmotic potential during osmotic stress [13]. Sorghum seedlings accumulated high proline content under NaCl stress (Figure 3A). Although at different stages, these results are supported by other studies, which reported similar effects in sorghum [29,51,52] and other crops [53]. A high concentration of Ca2+ (15 and 35 mM) significantly increased proline content in control seedlings (Figure 3B), whereas in NaCl treated seedlings, there were no significant changes (Figure 3C). This suggests that the protective effect of Ca2+ on sorghum might be independent of proline regulation. Since proline also acts as a molecular chaperone, protects photosynthesis, antioxidant enzymes, and prevent membrane damage [13,54]. This might be the reason for its stable accumulation under NaCl stress and in combination with Ca2+ (Figure 3C), which can be linked to the induction of pyrroline-5-carboxlyate synthetase 1 (P5CS1), a key enzyme for proline biosynthesis that is dependent on Ca2+ signaling [55,56]. The results further suggest that sorghum seedlings adapt their osmotic potential under NaCl stress, consistent with the high accumulation of osmolytes.
Sodium chloride stress causes oxidative stress through the accumulation of ROS, which can affect membrane structure and function as well as enzyme activities and with it, metabolic processes [57]. A significant accumulation of H2O2 in seedlings treated with 300 mM NaCl was observed and these levels were reduced by supplementation with Ca2+ (Figure 4A,C). Salt causes membrane damage due to oxidative stress and does so by displacing Ca2+ from the phospholipid membrane binding sites [7]. However, this effect can be reversed, at least in parts, by the addition of Ca2+, which affects the uptake and transport of ions and helps to maintain membrane integrity [19,24,57]. In this study, NaCl triggered damage to the epidermis and xylem layers of sorghum seedlings as shown by the formation of structures and shrinkage on these layers (Figure 5C,G). Ca2+ partly stabilized the lipid bilayer of cellular membranes and provided structural integrity under these conditions (Figure 5H). This is supported by the smoothened epidermis and the thickened xylem layers of seedlings treated with both NaCl and Ca2+ (Figure 5D,H). These results indicate that Ca2+ can effectively alleviate NaCl-induced oxidative stress as previously reported [58,59].
Salt stress is also responsible for the ionic imbalance due to the accumulation of excess Na+ and a decrease of K+ and Ca2+ [19,60]. In this study, this was evident by the high Na+/K+ ratio of 3.19 under 300 mM NaCl, and this effect was reversed by the exogenous application of 5 mM Ca2+ resulting in a low Na+/K+ ratio of 1.5 (Figure 6C,D). This is consistent with the effective maintenance of ion homeostasis by Ca2+. Salt stress causes membrane damage due to oxidative stress by displacing Ca2+ from the phospholipid membrane binding sites [7]. This is true since seedlings treated with NaCl revealed shrinkage and some deformation as compared to the control (Figure 6G). However, this effect was reversed, at least in parts, by the addition of Ca2+ (Figure 6H), which affects the uptake and transport of ions and helps to maintain membrane integrity [19,24,57].
The antioxidant system responsible for scavenging ROS was activated (Figure 4A–C) as seen by the induced expression of antioxidant genes, ascorbate peroxidase (SbAPX2) and catalase (SbCAT3) under NaCl stress (Figure 7A,B). H2O2 is regulated by various antioxidant enzymes, which reduce it to water. APX and CAT are considered the most important enzymes in the detoxification of H2O2 [61,62]. SbAPX2 and SbCAT3 genes were constitutively expressed but their expression was highly induced under 300 mM NaCl (Figure 7A,B). Thus, the increased expression of APX and CAT indicates a protective mechanism since these genes are transcribed and translated into enzymes and hence, enable detoxification of excess H2O2. Additionally overexpression of the APX gene in plants is associated with improved protection against oxidative stress [63]. Similarly,, microarray data indicated an increase in the expression of CAT and APX in Arabidopsis thaliana under abiotic (salinity: 100 mmol/L NaCl, cold: 10 °C, heat: 38 °C and light: 800 μmol photons m−2s−1) stresses [64]. The expression of APX was also increased in Oryza sativa [65], whereas that of CAT was also increased in Lotus japonicus [66] and Cuminum cyminum L. [67] in response to 50, 100, and 150 mM NaCl. Although transcriptional levels do not necessarily always correlate with protein level or enzyme activity, other studies have reported on the increased activity of antioxidant enzymes under NaCl stress in germinating seeds [68,69]. This expression occurred concomitantly with effective ROS scavenging and reduction of oxidative stress in seedlings under stress. Ca2+ significantly decreased the transcript levels of SbAPX2 and SbCAT3 under salt conditions in a concentration-dependent manner (Figure 7A,B). The expression of SbAPX2 was decreased to the same magnitude as that of the control, indicative of significant stimulation of detoxification by Ca2+. APX has a higher affinity (µM range) for H2O2 than CAT (mM range) [70], which may explain why SbAPX2 transcript levels were about ~7-fold higher than those of SbCAT3 in seedlings treated with 300 mM NaCl, despite the fact that both enzymes are crucial for H2O2 detoxification.
The expression of the antiporter genes, SOS1, and vacuolar NHX2 that are responsible for maintaining ion homeostasis [71,72] were measured. SbSOS1 was upregulated under 300 mM NaCl stress in sorghum seedlings (Figure 7C). This may be explained by its role in the exclusion of toxic Na+ into the root apoplast region away from the cells delaying uptake into shoots and leaves [14,16]. Overexpression of SOS1 was associated with increased salt tolerance in different species [17], suggesting that expression of SbSOS1 in this study might have been sufficient to prevent ion toxicity and confer increased NaCl tolerance. Both, the constitutive and stress-inducible expression of the sorghum SOS1 in this study show a similar pattern to the expression of SOS1 in Brassica and wheat genotypes [73,74,75]. In the presence of Ca2+, the expression of SbSOS1 decreased in a concentration-dependent way. Thus, we propose that the application of exogenous Ca2+ induce tolerance maybe through binding of Ca2+ to the phospholipid bilayer of membranes to prevent the uptake and transport of Na+ into cells [76,77]. In turn, this may partly eliminate the need for strong SOS1 expression. The vacuolar SbNHX2 was constitutively expressed in germinating seedlings, but the transcript level was reduced by salt stress (Figure 7D). Incidentally, similar results were observed previously [78,79,80]. However, most studies reported an upregulation of other NHX genes under salt stress [72,81,82,83,84,85,86]. To our surprise, vacuolar SbNHX2 was significantly induced by a combination of 300 mM NaCl and 35 mM Ca2+. These results suggest that the sorghum vacuolar NHX2 has a role in stress responses that might be mediated by Ca2+. Overall gene expression of both the antioxidant and the SOS1 genes in sorghum showed a strong correlation with the alleviation of oxidative stress caused by ROS accumulation and this may be linked to Ca2+ signaling. The structural, physiological, and biochemical role of Ca2+ in Sorghum bicolor await further elucidation.

4. Conclusions

This study illustrated the detrimental effects of salt stress on Sorghum bicolor and the ability of Ca2+ to ameliorate these effects. Sorghum is known to be moderately tolerant to stress and this was further confirmed in this study since seeds reached up to 98% germination percentage under high salt (300 mM NaCl). This indicated that the crop has some level of tolerance, which is also due to osmolyte accumulation even in the presence of Ca2+. Sorghum has a strong antioxidant and ion homeostasis system, as suggested by the high H2O2 content, Na+/K+ ratio, and transcript levels (SbAPX2, SbCAT,3 and SbSOS1 genes), all of which were reduced by supplementation with Ca2+. This resulted in improved seedlings growth and protection of membrane structures. Therefore, the study proposes that 5 mM Ca2+ effectively alleviated the effects of salt stress without causing any severe negative effects. Finally, it will be necessary to conduct further analysis in the field in order to broaden our understanding of how to improve the growth of this important crop under salt stress with supplementation of Ca2+.

5. Materials and Methods

5.1. Seed Preparation and Growth Conditions

Red Sorghum (Sorghum bicolor) seeds were purchased from Agricol, Brackenfell Cape Town, South Africa. In order to maintain uniformity in the study, seeds were chosen based on possessing an identical size and color. After surface decontamination [87], seeds were imbibed overnight in distilled H2O at 25 °C with shaking at 600 rpm. Seeds were dried under the laminar flow and five seeds were sown on filter paper placed on sterilized Petri dishes containing 4 mL of solutions. The solutions included distilled H2O only (0 mM), 200 mM and 300 mM sodium chloride and different CaCl2 (Ca2+) concentrations (5 mM, 15 mM, and 35 mM). Petri dishes were placed at 25 °C and seeds germinated for 7 days in the dark. Seeds were inspected daily and the number of germinated seed (> 2 mm radicle) weascounted. On day 3 only, the roots were measured, whereas both roots and shoots were measured on day 7. Seedlings were harvested on day 7, rinsed thoroughly and used immediately or stored at −80 °C for future use.

5.2. Physiological analysis

Germination assays including germination percentage, mean germination time, germination index, and total germination were calculated according to the equations below:

5.2.1. Germination Assays

Four germination parameters including germination percentage, mean germination time, germination index and total germination were measured using formulas shown below:
Germination percentage (GP): n/N × 100, where n: total number of seeds germinated and N: the total number of seeds sown [38].
Mean Germination Time (MGT): ∑ f * x/ ∑ f, where f: number of seeds germinated on day x. [30].
Germination index (GI): ∑ (n1 × d7) + (n2 × d6) + (n3 × d5)……(n7 × d7) where n1: number of seeds germinated on day 1 and d7: number of seeds germinated on day 7. According to Kader 2005 where a heavier weight is given to seeds germinated on the first day and less weight given to those germinated on the last day.
Total germination (TG): d7/N × 100, where d7 total number of seeds germinated on the final day (day 7) and N: the number of seeds germinated [30].

5.2.2. Growth Attributes

Seedling lengths were measured with a ruler (mm scale), roots were measured at day 3, whereas both root and shoot length were measured at day 7. Dry weights were obtained after oven-drying seedlings at 80 °C overnight or until constant weight.

5.3. Biochemical Analysis

5.3.1. Proline Content

Proline content was determined as previously described [38], with slight modifications. About 0.5 g of grounded plant material was homogenized with 2 mL of sulfosalicylic acid. The homogenized samples were then centrifuged at 5000 rpm for 5 min and 0.5 mL of the supernatant was transferred to a clean tube containing 0.5 mL acetic acid and 0.5 mL ninhydrin acid reagent (1.25 g of ninhydrin in 30 mL of 99% acetic acid and 20 mL of 6 M H3PO4) and boiled for 45 min in a water bath. Samples were then allowed to cool on ice completely before adding equal volumes of toluene and reading the optical density of the samples at 520 nm using a spectrotometer Helios® Epsilon visible 8nm bandwidth (Thermo Fisher Scientific, USA).

5.3.2. Hydrogen Peroxide Content

Hydrogen peroxide (H2O2) was assayed following the optimized method by Junglee et al. [88]. About 0.15 g ground plant material was homogenized with 0.25 mL TCA (0.1% w/v), 0.5 mL potassium iodide (1 M), and 0.25 mL potassium phosphate buffer (10 mM, pH 6). Tubes were vortexed and centrifuged for 15 min at 10,000 rpm (4 °C). Samples were transferred to a 96 well microtiter plate and were allowed to incubate at room temperature for 20 min. Absorbance was read at 390 nm using the FLUOstar® Omega (BMG LABTECH, Ortenberg, Germany) microtiter plate reader. H2O2 was quantified by generating a standard curve with an H2O2 solution.

5.3.3. Anatomical and Element Analysis

Element and anatomical analysis were done using the Scanning Electron Microscopy-Energy dispersive X-ray spectroscopy (SEM-EDX) system that is located at the electron microscope unit, Physics Department, University of the Western Cape. Analysis was undertaken of Sorghum bicolor root seedlings that were grown in the absence (0 mM) and presence (300 mM) of NaCl and treated with 5 mM CaCl2. Samples were placed on aluminum stubs coated with conductive carbon tape. The samples were then coated with a thin layer of carbon using an EMITECH-K950x carbon coater. All EDX spectra were collected with an Oxford X-Max silicon solid-state drift detector at an accelerating voltage of 20 kV for 60 s to ensure proper x-ray detection. All spectra were analyzed using the build-in Oxford Aztec software suite. Samples were then imaged and images collected using a Zeiss Auriga field emission gun scanning electron microscope, operated at an accelerating voltage of 5 kV using an in-lens secondary electron detector.

5.4. Quantitative Real-Time PCR

The cDNA that was used as the template for the quantitative real-time PCR (qRT-PCR) experiment was synthesized as previously described [87]. Quantitative RT-PCR was used to analyze the expression profiles of sorghum antioxidants (SbAPX2 and SbCAT3) and the Na+/H+ exchanger antiporter (SbSOS1 and vacuolar SbNHX2) genes. Reference genes included Beta-actin and Ubiquitin as previously described [24], the sequences and accession numbers of the target genes can be found in Table S4. The reaction mixture contained 1 µL template cDNA, 5 µL 2x SYBR Green I Master Mix (Roche Applied Science, Upper Bavaria, Germany), varying concentrations of each primer, and ddH2O added to a final volume of 10 µL. The reactions were subjected to 95 °C for 10 min, 45 cycles at 95 °C for 10 s, 55 °C (SbAPX2; SbCAT3); 58 °C (SbSOS1) and 60 °C (SbNHX2); for 10 s, and 72 °C for 20 s. A melting curve analysis was also performed using default parameters on the LightCycler® 480 instrument (Roche Applied Science, Upper Bavaria, Germany). The expression levels of the target genes were normalized to the reference genes and analyzed using the LightCycler® 480 SW (version 1.5) data analysis software. The expression was quantified by the relative quantification method using a standard curve of serially diluted cDNA templates. Each qRT-PCR reaction was done in triplicate and three non-template controls were included. Data represent the average of three independent experiments.

5.5. Statistical Analysis

All experiments were repeated at least four times and data were statistically analyzed by the two-way ANOVA using GraphPad Prism 8.4.2 (https://www.graphpad.com). Data in Figures and Tables represent the mean ± standard deviation. Statistical significance between control and treated plants were determined by the Bonferroni’s multiple comparison test and represented as *** = p ≤ 0.001, ** = p ≤ 0.01, and * = p ≤ 0.05. Supplementary data for all analyses have been supplied including physiological and biochemical analysis raw data (File S1), Sequencing data (File S2) and gene expression data (File S3).

Supplementary Materials

The following are available online at https://www.mdpi.com/2223-7747/9/6/730/s1, Table S1: Effect of Ca2+ on the germination attributes of sorghum seedlings in the absence (0 mM) and presence of NaCl (200 and 300 mM). Data represented are mean ± S.D; Table S2: Effect of NaCl and Ca2+ on the fresh and dry weights of sorghum seedlings in the absence (0 mM) and presence of (200 and 300 mM) NaCl. Data represented are mean ± S.D; Table S3: Overall ion content measured by the SEM-Energy dispersive X-ray (EDX) spectroscopy in sorghum seedlings; Table S4: Accession numbers and primer sequence of genes used for gene expression analysis; Figure S1: Effect of salt and Ca2+ on root and shoot length of sorghum seedlings measured at day 3. (A) Root and shoot length of sorghum seedlings in the presence of different NaCl only. (B–C) Seedlings under different NaCl and Ca2+ (5, 15 and 35 mM) concentrations, (B) 0 mM NaCl, (C) 200 mM NaCl and 300 mM NaCl. Error bars represent the SD calculated from three biological replicates and statistical significance differences between control and treated plants were determined using two-way ANOVA conducted on GraphPad Prism 8.4.2 shown as *** p ≤ 0.001 = ** = p ≤ 0.01, and * = p ≤ 0.05 according to the Bonferroni’s multiple comparison test.; File S1 Physiological and biochemical raw data, File S2 Sequence analysis of the cDNA amplicons of SbAPX, SbCAT, SbSOS1, and vacuolar SbNHX2 genes; File S3 Gene expression analysis data.

Author Contributions

Conceptualization, T.M. (Takalani Mulaudzi), C.G. and E.I.; Data curation, T.M. (Takalani Mulaudzi); Formal analysis, K.H., T.M. (Takalani Mulaudzi) and M.M.; Funding acquisition, T.M. (Takalani Mulaudzi) and E.I.; Investigation, K.H.; Methodology, K.H., T.M. (Thembeka Mabiya) and N.M.; Project administration, T.M. (Takalani Mulaudzi), R.F.A. and N.M.; Resources, T.M. (Takalani Mulaudzi); Software, M.M.; Supervision, T.M. (Takalani Mulaudzi) and R.F.A.; Validation, T.M. (Takalani Mulaudzi), M.M., C.G. and E.I.; Writing—original draft, K.H.; Writing—review & editing, T.M. (Takalani Mulaudzi), T.M. (Thembeka Mabiya), M.M., R.F.A., C.G., N.M. and E.I. All authors have read and agreed to the published version of the manuscript.

Funding

This research was funded by National Research Foundation: Black Academics Advancement Programme (BAAP) of South Africa (UID: 112201).

Acknowledgments

We would like to acknowledge Andrew Faro for assisting with sequence analysis and Franscious Cummings, Electron Microscope Unit, the University of the Western Cape for assisting with the SEM and SEM-EDX experiments.

Conflicts of Interest

The authors declare no conflict of interest. The funders had no role in the design of the study; in the collection, analyses, or interpretation of data; in the writing of the manuscript, or in the decision to publish the results.

References

  1. Gan, V.; Stobbe, E.H.; Njue, C. Evaluation of selected nonlinear regression models in quantifying seedling emergence rate of spring wheat. Crop Sci. 1996, 36, 165–168. [Google Scholar] [CrossRef]
  2. Bewley, J.D. Seed germination and dormancy. Plant Cell 1997, 9, 1055–1066. [Google Scholar] [CrossRef] [PubMed] [Green Version]
  3. Mahajan, S.; Pandey, G.K.; Tuteja, N. Calcium and salt-stress signaling in plants: Shedding light on SOS pathway. Arch. Biochem. Biophys. 2008, 471, 146–158. [Google Scholar] [CrossRef] [PubMed]
  4. Shrivastava, P.; Kumar, R. Soil salinity: A serious environmental issue and plant growth promoting bacteria as one of the tools for its alleviation. Saudi J. Biol. Sci. 2015, 22, 123–131. [Google Scholar] [CrossRef] [PubMed] [Green Version]
  5. Houle, G.; Morel, L.; Reynolds, C.E.; Siegel, J. The Effect of salinity on different developmental stages of an endemic annual plant, Aster laurentianus (Asteraceae). Am. J. Bot. 2001, 88, 62–67. [Google Scholar] [CrossRef] [Green Version]
  6. Serrano, R.; Mulet, J.M.; Rios, G.; Marquez, J.A.; De Larrinoa, I.F.; Leube, M.P.; Mendizabal, I.; Pascual-Ahuir, A.; Proft, M.; Ros, R.; et al. A glimpse of the mechanisms of ion homeostasis during salt stress. J. Exp. Bot. 1999, 50, 1023–1036. [Google Scholar] [CrossRef]
  7. Yermiyahu, U.; Nir, S.; Ben-Hayyim, G.; Kafkafi, U.; Kinraide, T.B. Root elongation in saline solution related to calcium binding to root cell plasma membranes. Plant Soil 1997, 191, 67–76. [Google Scholar] [CrossRef]
  8. Wu, G.Q.; Wang, S.M. Calcium regulates K+/Na+ homeostasis in rice (Oryza sativa L.) under saline conditions. Plant Soil Environ. 2012, 58, 121–127. [Google Scholar] [CrossRef] [Green Version]
  9. Gupta, B.; Huang, B. Mechanism of salinity tolerance in plants: Physiological, biochemical, and molecular characterization. Int. J. Genom. 2014, 1–18. [Google Scholar] [CrossRef]
  10. Apel, K.; Hirt, H. Reactive oxygen species: Metabolism, oxidative stress and signal transduction. Annu. Rev. Plant Biol. 2004, 55, 373–399. [Google Scholar] [CrossRef] [Green Version]
  11. Gill, S.S.; Tuteja, N. Reactive oxygen species and antioxidant machinery in abiotic stress tolerance in crop plants. Plant Physiol. Biochem. 2010, 48, 909–930. [Google Scholar] [CrossRef] [PubMed]
  12. Foyer, C.H.; Noctor, G. Ascorbate and glutathione: The heart of the redox hub. Plant Physiol. 2011, 155, 2–18. [Google Scholar] [CrossRef] [PubMed] [Green Version]
  13. Surender, P.; Jogeswar, G.; Rasineni, G.K.; Maheswari, M.; Reddy, A.R.; Varshney, R.K.; Kishor, P.B.K. Proline over-accumulation alleviates salt stress and protects photosynthetic and antioxidant enzyme activities in transgenic sorghum [Sorghum bicolor (L.) Moench]. Plant Physiol. Biochem. 2015, 94, 104–113. [Google Scholar] [CrossRef] [PubMed] [Green Version]
  14. Shi, H.; Ishitani, M.; Kim, C.; Zhu, J.K. The Arabidopsis thaliana salt tolerance gene SOS1 encodes a putative Na+/H+ antiporter. Proc. Natl. Acad. Sci. USA 2000, 97, 6896–6901. [Google Scholar] [CrossRef] [PubMed] [Green Version]
  15. Tester, M.; Davenport, R. Na+ tolerance and Na+ transport in higher plants. Ann. Bot. 2003, 91, 503–527. [Google Scholar] [CrossRef]
  16. OlÍas, R.; Eljakaoui, Z.; Li, J.; De Morales, P.A.; Marin-Manzano, M.C.; Pardo, M.; Belver, A. The plasma membrane Na+/H+ antiporter SOS1 is essential for salt tolerance in tomato and affects the partitioning of Na+ between plant organs. Plant Cell Environ. 2009, 32, 904–916. [Google Scholar] [CrossRef]
  17. Apse, M.P.; Aharon, G.S.; Snedden, W.A.; Blumwald, E. Salt tolerance conferred by overexpression of a vacuolar Na+/H+ antiport in Arabidopsis. Science 1999, 285, 1256–1258. [Google Scholar] [CrossRef]
  18. White, P.J.; Broadley, M.R. Calcium in plants. Ann. Bot. 2003, 92, 487–511. [Google Scholar] [CrossRef]
  19. Munns, R.; Tester, M. Mechanisms of salinity tolerance. Annu. Rev. Plant Biol. 2008, 59, 651–681. [Google Scholar] [CrossRef] [Green Version]
  20. Rengel, Z. The role of calcium in salt toxicity. Plant Cell Environ. 1992, 15, 625–632. [Google Scholar] [CrossRef]
  21. Liu, B.; Luo, C.; Li, X.; Gray, L.; Zhang, F.; Liu, M.; Ju, J.; Lei, B. Research on the threshold of aluminum toxicity and the alleviation effects of exogenous calcium, phosphorus and nitrogen on the growth of Chinese fir seedlings under aluminum stress. Commun. Soil Sci. Plant Anal. 2014, 45, 126–139. [Google Scholar] [CrossRef]
  22. Demidchik, V.; Davenport, R.J.; Tester, M. Non-selective cation channels in plants. Annu. Rev. Plant Biol. 2002, 53, 67–107. [Google Scholar] [CrossRef] [PubMed]
  23. Shabala, S.; Shabala, L.; Van Volkenburgh, E.; Newman, I. Effect of divalent cations on ion fluxes and leaf photochemistry in salinized barley leaves. J. Exp. Bot. 2005, 56, 1369–1378. [Google Scholar] [CrossRef] [Green Version]
  24. Salahshoor, F.; Kazemi, F. Effect of calcium on reducing salt stress in seed germination and early growth stage of Festuca ovina L. Plant Soil Environ. 2016, 62, 460–466. [Google Scholar] [CrossRef] [Green Version]
  25. Fan, H.; Ding, L.; Xu, Y.; Du, C. Seed germination, seedling growth and antioxidant system responses in cucumber exposed to Ca (NO3)2. Hort. Environ. Biotechnol. 2017, 58, 548–559. [Google Scholar] [CrossRef]
  26. Boursier, P.; Läuchli, A. Growth responses and mineral nutrient relations of salt-stressed sorghum. Crop Sci. 1990, 30, 1226–1233. [Google Scholar] [CrossRef]
  27. Krishnamurthy, L.; Serraj, R.; Hash, C.T.; Dakheel, A.J.; Reddy, B.V.S. Screening sorghum genotypes for salinity tolerant biomass production. Euphytica 2007, 156, 15–24. [Google Scholar] [CrossRef] [Green Version]
  28. Alves Da Costa, P.H.; De Azevedo Neto, A.D.; Bezerra, M.A.; Prisco, J.T.; Gomes-Filho, E. Antioxidant-enzymatic system of two sorghum genotypes differing in salt tolerance. Braz. J. Plant Physiol. 2005, 17, 353–361. [Google Scholar] [CrossRef]
  29. El Omari, R.; Ben, R.; Mrid, R.; Chibi, F.; Nhiri, M. Involvement of phosphoenolpyruvate carboxylase and antioxidants enzymes in nitrogen nutrition tolerance in Sorghum bicolor plants. Russ. J. Plant Physiol. 2016, 63, 719–726. [Google Scholar] [CrossRef]
  30. Kader, M.A. A comparison of seed germination calculation formulae and the associated interpretation of resulting data. J. Proc. R. Soc. New South Wales 2005, 138, 65–75. [Google Scholar]
  31. Almansouri, M.; Kinet, J.M.; Lutts, S. Effect of salt and osmotic stresses on germination in durum wheat (Triticum durum Desf.). Plant Soil 2001, 231, 243–254. [Google Scholar] [CrossRef]
  32. Misra, N.; Dwivedi, U.N. Genotypic difference in salinity tolerance of green gram cultivars. Plant Sci. 2004, 166, 1135–1142. [Google Scholar] [CrossRef]
  33. Mohammadi, G.R. The influence of NaCl priming on seed germination and seedling growth of canola (Brassica napus L.) under salinity conditions. Am. Eurasian J. Agric. Environ. Sci. 2009, 5, 696–700. [Google Scholar]
  34. Duan, D.Y.; Li, W.R.; Liu, X.J.; Ouyang, H.; An, P. Seed germination and seedling growth of Suaeda salsa under salt stress. Ann. Bot. Fennici. 2007, 44, 161–169. [Google Scholar]
  35. Qu, X.X.; Huang, Z.Y.; Baskin, J.M.; Baskin, C.C. Effect of temperature, light and salinity on seed germination and radicle growth of the geographically widespread halophyte shrub Halocnemum strobilaceum. Ann. Bot. 2008, 101, 293–299. [Google Scholar] [CrossRef] [Green Version]
  36. Khayatnezhad, M.; Gholamin, R. Effects of salt stress levels on five maize (Zea mays L.) cultivars at germination stage. Afr. J. Biotechnol. 2011, 10, 12909–12915. [Google Scholar]
  37. Khan, H.A.; Ayub, C.M.; Pervez, M.A.; Bilal, R.M.; Shahid, M.A.; Ziaf, K. Effect of seed priming with NaCl on salinity tolerance of hot pepper (Capsicum annuum L.) at seedling stage. Soil Environ. 2009, 28, 81–87. [Google Scholar]
  38. Pandey, M.; Penna, S. Time course of physiological, biochemical and gene expression changes under short-term salt stress in Brassica juncea L. Crop J. 2017, 219–230. [Google Scholar] [CrossRef] [Green Version]
  39. Zehra, A.; Gul, B.; Ansari, R.; Khan, M.A. Role of calcium in alleviating effect of salinity on germination of Phragmites karka seeds. S. Afr. J. Bot. 2012, 78, 122–128. [Google Scholar] [CrossRef] [Green Version]
  40. Sewelam, N.; Dowidar, S.; Abo-Kassem, E.A.; Sobhy, S. Study of the interactive effects of calcium and abscisic acid on drought stressed Triticum aestivum seedlings. Egypt. J. Bot. 2017, 57, 215–232. [Google Scholar] [CrossRef] [Green Version]
  41. Faiza, S.; Bilquees, G.U.L.; Wei-qiang, L.I.; Xiao-jing, L.I.U.; Ajmal, K.M. Effect of calcium and light on the germination of Urochondra setulosa under different salts. J. Zhejiang Univ. Sci. B 2007, 8, 20–26. [Google Scholar]
  42. Bonilla, I.; Bolaños, L. Boron and calcium increase Pisum sativum seed germination and seedling development under salt stress. Plant Soil 2004, 267, 97–107. [Google Scholar] [CrossRef]
  43. Ahmad, P.; Allah, E.F.A.; Alyemeni, M.N.; Wijaya, L.; Alam, P.; Bhardwaj, R.; Siddique, K.H.M. Exogenous application of calcium to 24-epibrassinosteroid pretreated tomato seedlings mitigates NaCl toxicity by modifying ascorbate–glutathione cycle and secondary metabolites. Sci. Rep. 2018, 8, 13515. [Google Scholar] [CrossRef]
  44. Tanveer, K.; Gilani, S.; Hussain, Z.; Ishaq, R.; Adeel, M.; Ilyas, M. Effect of salt stress on tomato plant and the role of calcium. J. Plant Nutr. 2020, 43, 28–35. [Google Scholar] [CrossRef]
  45. Ashraf, M.Y.; Tariq, S.; Saleem, M.; Khan, M.A.; Hassan, S.W.U.; Sadef, Y. Calcium and zinc mediated growth and physio-biochemical changes in mungbean grown under saline conditions. J. Plant Nutr. 2020, 43, 512–525. [Google Scholar] [CrossRef]
  46. Aroca, R.; Porcel, R.; Ruiz-Lozano, J.M. Regulation of root water uptake under abiotic stress conditions. J. Exp. Bot. 2012, 63, 43–57. [Google Scholar] [CrossRef]
  47. Cramer, G.R. Sodium-calcium interactions under salinity stress. In Salinity: Environment-Plants-Molecules, 2nd ed.; Läuchli, A., Lüttge, U., Eds.; Springer: Dordrecht, The Netherlands, 2002; pp. 205–227. [Google Scholar]
  48. Takemura, T.; Hanagata, N.; Sugihara, K.; Baba, S.; Karube, I.; Dubinsky, Z. Physiological and biochemical responses to salt stress in the mangrove, Bruguiera gymnorrhiza. Aquat. Bot. 2000, 68, 15–28. [Google Scholar] [CrossRef]
  49. Li, R.; Shi, F.; Fukuda, K. Interactive effects of salt and alkali stresses on seed germination, germination recovery, and seedling growth of a halophyte Spartina alterniflora (Poaceae). S. Afr. J. Bot. 2010, 76, 380–387. [Google Scholar] [CrossRef] [Green Version]
  50. Zaman, S.; Saleh, M.A. Mutagenic effect of ethylene glycol on somatic cells of wheat (Triticum Aestivum L.). Life Earth Sci. 2005, 1, 43–49. [Google Scholar]
  51. El-Haddad, E.S.H.M.; O’Leary, J.W. Effect of salinity and K/Na ratio of irrigation water on growth and solute content of Atriplex amnicola and Sorghum bicolor. Irrig. Sci. 1994, 14, 127–133. [Google Scholar] [CrossRef]
  52. Heidari, M. Antioxidant activity and osmolyte concentration of sorghum (Sorghum bicolor) Asiana and wheat (Triticum aestivum) genotypes under salinity stress. Asian J. Plant Sci. 2009, 8, 240–244. [Google Scholar] [CrossRef]
  53. Watanabe, S.; Kojima, K.; Ide, Y.; Sasaki, S. Effects of saline and osmotic stress on proline and sugar accumulation in Populus euphratica in vitro. Plant Cell. Tiss. Org. 2000, 63, 199–206. [Google Scholar] [CrossRef]
  54. Szabados, L.; Savouré, A. Proline: A multifunctional amino acid. Trends Plant Sci. 2010, 15, 89–97. [Google Scholar] [CrossRef] [PubMed]
  55. Delauney, A.J.; Verma, D.P.S. Proline biosynthesis and osmoregulation in plants. Plant J. 1993, 215–223. [Google Scholar] [CrossRef]
  56. Verslues, P.E.; Sharma, S. Proline metabolism and its implications for plant-environment interaction. Arab. Book Am. Soc. Plant Biol. 2010, 8, 140. [Google Scholar] [CrossRef] [Green Version]
  57. Rahman, A.; Nahar, K.; Hasanuzzaman, M.; Fujita, M. Calcium supplementation improves Na+/K+ ratio, antioxidant defense and glyoxalase systems in salt-stressed rice seedlings. Front. Plant Sci. 2016, 7, 609. [Google Scholar] [CrossRef] [PubMed] [Green Version]
  58. Cha-um, S.; Singh, H.P.; Samphumphuang, T.; Kirdmanee, C. Calcium-alleviated salt tolerance in indica rice (Oryza sativa L. spp. indica): Physiological and morphological changes. Aust. J. Crop. Sci. 2012, 6, 176–182. [Google Scholar]
  59. Tahjib-Ul-Arif, M.; Roy, P.R.; Sohag, A.M.M.; Afrin, S.; Rady, M.M.; Hossain, M.A. Exogenous calcium supplementation improves salinity tolerance in BRRI Dhan28; a salt-susceptible high-yielding Oryza Sativa cultivar. J. Crop Sci. Biotechnol. 2018, 21, 383–394. [Google Scholar] [CrossRef]
  60. Morgan, S.H.; Maity, P.J.; Geilfus, C.M.; Lindberg, S.; Muhling, K.H. Leaf ion homeostasis and plasma membrane H+-ATPase activity in Vicia faba change after extra calcium and potassium supply under salinity. Plant Physiol. Biochem. 2014, 82, 244–253. [Google Scholar] [CrossRef]
  61. Gill, S.S.; Anjum, N.A.; Gill, R.; Yadav, S.; Hasanuzzaman, M.; Fujita, M.; Mishra, P.; Sabat, S.C.; Tuteja, N. Superoxide dismutase—mentor of abiotic stress tolerance in crop plants. Environ. Sci. Pollut. Res. 2015, 22, 10375–10394. [Google Scholar] [CrossRef]
  62. Parida, A.K.; Das, A.B. Salt tolerance and salinity effects on plants: A review. Ecotoxicol. Environ. Saf. 2005, 60, 324–349. [Google Scholar] [CrossRef] [PubMed]
  63. Wang, J.; Zhang, H.; Allen, R.D. Overexpression of an Arabidopsis peroxisomal ascorbate peroxidase gene in tobacco increases protection against oxidative stress. Plant Cell Physiol. 1999, 40, 725–732. [Google Scholar] [CrossRef] [PubMed] [Green Version]
  64. Filiz, E.; Ozyigit, I.I.; Saracoglu, I.A.; Uras, M.E.; Sen, U.; Yalcin, B. Abiotic stress-induced regulation of antioxidant genes in different Arabidopsis ecotypes: Microarray data evaluation. Biotechnol. Biotechnol. Equip. 2018, 33, 1–16. [Google Scholar] [CrossRef] [Green Version]
  65. Rossatto, T.; Do Amaral, M.N.; Benitez, L.C.; Vighi, I.L.; Braga, E.J.B.; Junior, A.M.D.M.; Maia, M.A.C.; Pinto, L.D.S. Gene expression and activity of antioxidant enzymes in rice plants, cv. BRS AG, under saline stress. Physiol. Mol. Biol. Plants 2017, 23, 865–875. [Google Scholar] [CrossRef] [PubMed] [Green Version]
  66. Rubio, M.C.; Becana, M.; Sato, S.; James, E.K.; Tabata, S.; Spaink, H.P. Characterization of genomic clones and expression analysis of the three types of superoxide dismutases during nodule development in Lotus japonicus. Mol. Plant Microbe Interact. 2007, 20, 262–275. [Google Scholar] [CrossRef] [Green Version]
  67. Soleimani, Z.; Afshar, A.S.; Nematpour, F.S. Responses of antioxidant gene and enzymes to salinity stress in the Cuminum cyminum L. Russ. J. Plant Physiol. 2017, 64, 361–367. [Google Scholar] [CrossRef]
  68. Xu, S.; Sa, Z.S.; Cao, Z.Y.; Xuan, W.; Huang, B.K.; Ling, T.F.; Hu, Q.Y.; Shen, W.B. Carbon monoxide alleviates wheat seed germination inhibition and counteracts lipid peroxidation mediated by salinity. J. Integr. Plant Biol. 2006, 48, 1168–1176. [Google Scholar] [CrossRef]
  69. Jabeen, N.; Ahmad, R. The activity of antioxidant enzymes in response to salt stress in safflower (Carthamus tinctorius L.) and sunflower (Helianthus annuus L.) seedlings raised from seed treated with chitosan. J. Sci. Food Agric. 2013, 93, 1699–1705. [Google Scholar] [CrossRef] [PubMed]
  70. Mittler, R. Oxidative stress, antioxidants and stress tolerance. Trends Plant Sci. 2002, 7, 405–410. [Google Scholar] [CrossRef]
  71. Zhu, J.K. Regulation of ion homeostasis under salt stress. Curr. Opin. Plant Biol. 2003, 6, 441–445. [Google Scholar] [CrossRef]
  72. Moshaei, M.R.; Nematzadeh, G.A.; Askari, H.; Nejad, A.S.M.; Pakdin, A. Quantitative gene expression analysis of some sodium ion transporters under salinity stress in Aeluropus littoralis. Saudi J. Biol. Sci. 2014, 21, 394–399. [Google Scholar] [CrossRef] [PubMed] [Green Version]
  73. Kumar, G.; Purty, R.S.; Sharma, M.P.; Singla-Pareek, S.L.; Pareek, A. Physiological responses among Brassica species under salinity stress show strong correlation with transcript abundance for SOS pathway-related genes. J. Plant Physiol. 2009, 166, 507–520. [Google Scholar] [CrossRef] [PubMed]
  74. Chakraborty, K.; Sairam, R.K.; Bhattacharya, R.C. Differential expression of salt overly sensitive pathway genes determines salinity stress tolerance in Brassica genotypes. Plant Physiol. Biochem. 2012, 51, 90–101. [Google Scholar] [CrossRef] [PubMed]
  75. Sathee, L.; Sairam, R.K.; Chinnusamy, V.; Jha, S.K. Differential transcript abundance of salt overly sensitive (SOS) pathway genes is a determinant of salinity stress tolerance of wheat. Acta Physiol. Plant 2015, 37, 1–10. [Google Scholar]
  76. Liu, J.; Zhu, J.K. An Arabidopsis mutant that requires increased calcium for potassium nutrition and salt tolerance. Proc. Natl. Acad. Sci. USA 1997, 94, 14960–14964. [Google Scholar] [CrossRef] [PubMed] [Green Version]
  77. Rubio, F.; Flores, P.; Navarro, J.M.; Martínez, V. Effects of Ca2+, K+ and cGMP on Na+ uptake in pepper plants. Plant Sci. 2003, 165, 1043–1049. [Google Scholar] [CrossRef]
  78. Kumari, P.H.; Kumar, S.A.; Ramesh, K.; Reddy, P.S.; Nagaraju, M.; Prakash, A.B.; Shah, T.; Henderson, A.; Srivastava, R.K.; Rajasheker, G.; et al. Genome-Wide Identification and Analysis of Arabidopsis Sodium Proton Antiporter (NHX) and Human Sodium Proton Exchanger (NHE) Homologs in Sorghum bicolor. Genes (Basel) 2018, 9, 236. [Google Scholar] [CrossRef] [Green Version]
  79. Ohnishi, M.; Fukada-Tanaka, S.; Hoshino, A.; Takada, J.; Inagaki, Y.; Iida, S. Characterization of a novel Na+/H+ antiporter gene InNHX2 and comparison of InNHX2 with InNHX1, which is responsible for blue flower coloration by increasing the vacuolar pH in the Japanese morning glory. Plant Cell Physiol. 2005, 46, 259–267. [Google Scholar] [CrossRef] [Green Version]
  80. Hanana, M.; Cagnac, O.; Yamaguchi, T.; Hamdi, S.; Ghorbel, A.; Blumwald, E. A grape berry (Vitis vinifera L.) cation/proton antiporter is associated with berry ripening. Plant Cell Physiol. 2007, 48, 804–911. [Google Scholar] [CrossRef] [Green Version]
  81. Yokoi, S.; Quintero, F.J.; Cubero, B.; Ruiz, M.T.; Bressan, R.A.; Hasegawa, P.M.; Pardo, J.M. Differential expression and function of Arabidopsis thaliana NHX Na+/H+ antiporters in the salt stress response. Plant J. 2002, 30, 529–539. [Google Scholar] [CrossRef] [PubMed] [Green Version]
  82. Fukuda, A.; Nakamura, A.; Tagiri, A.; Tanaka, H.; Miyao, A.; Hirochika, H.; Tanaka, Y. Function, Intracellullar Localization and the Importance in Salt Tolerance of a Vascuolar Na+/H+ Antiporter from Rice. Plant Cell Physiol. 2004, 45, 146–159. [Google Scholar] [CrossRef] [PubMed] [Green Version]
  83. Zhang, G.H.; Su, Q.; An, L.J.; Wu, S. Characterization and expression of a vacuolar Na+/H+ antiporter gene from the monocot halophyte Aeluropus littoralis. Plant Physiol. Biochem. 2008, 46, 117–126. [Google Scholar] [CrossRef] [PubMed]
  84. Jha, A.; Joshi, M.; Yadav, N.S.; Jha, B. Cloning and characterization of the Salicornia brachiata Na+/H+ antiporter gene SbNHX1 and its expression by abiotic stress. Mol. Biol. Rep. 2011, 38, 1965–1973. [Google Scholar] [CrossRef] [PubMed]
  85. Wang, S.; Zhang, Y.D.; Perez, P.G.; Deng, Y.W.; Li, Z.Z.; Huang, D.F. Isolation and characterization of a vacuolar Na+/H+ antiporter gene from Cucumis melo L. Afr. J. Biotechnol. 2011, 10, 1752–1759. [Google Scholar]
  86. Adabnejad, H.; Kavousi, H.R.; Hamidi, H.; Tavassolian, I. Assessment of the vacuolar Na+/H+ antiporter (NHX1) transcriptional changes in Leptochloa fusca L. in response to salt and cadmium stresses. Mol. Biol. Res. Commun. 2015, 4, 133–142. [Google Scholar]
  87. Mulaudzi-Masuku, T.; Mutepe, R.D.; Mukhoro, O.C.; Faro, A.; Ndimba, B. Identification and characterization of a heat-inducible Hsp70 gene from Sorghum bicolor which confers tolerance to thermal stress. Cell Stress Chaperons 2015, 7, 793–804. [Google Scholar] [CrossRef] [Green Version]
  88. Junglee, S.; Urban, L.; Sallanon, H.; Lopez-Lauri, F. Optimized assay for hydrogen peroxide determination in plant tissue using potassium iodide. Am. J. Anal. Chem. 2014, 5, 730–736. [Google Scholar] [CrossRef] [Green Version]
Figure 1. Effect of NaCl stress and Ca2+ on the germination percentage of sorghum seedlings. (A) Seedlings germinated under different NaCl concentrations only. (BD) Seedlings germinated under different NaCl and Ca2+ (5, 15 and 35 mM) concentrations, (B) 0 mM, (C) 200 mM NaCl and (D) 300 mM NaCl. Error bars represent the SD calculated from three biological replicates. Statistical significance between control and treated plants was determined using two-way ANOVA conducted on GraphPad Prism 8.4.2, shown as *** = p ≤ 0.01, ** = p ≤ 0.01, and * = p ≤ 0.05 according to the Bonferroni’s multiple comparison test.
Plants 09 00730 g001
Figure 2. Effect of NaCl and Ca2+ on root and shoot length of sorghum seedlings measured on day 7. (A) Seedlings germinated in the presence of different NaCl concentrations only. (BD) Seedlings germinated under different NaCl and Ca2+ (5, 15 and 35 mM) concentrations; (B) 0 mM, (C) 200 mM and (D) 300 mM NaCl. Error bars represent the SD calculated from three biological replicates. Statistical significance between control and treated plants was determined using two-way ANOVA conducted on GraphPad Prism 8.4.2, shown as ** = p ≤ 0.01, and * = p ≤ 0.05 according to the Bonferroni’s multiple comparison test.
Plants 09 00730 g002
Figure 3. Effect of NaCl and Ca2+ on proline accumulation in sorghum seedlings. Proline content measured on (A) seedlings germinated in the presence of different NaCl concentrations only. (B,C) Seedlings germinated under different NaCl and Ca2+ (5, 15 and 35 mM) concentrations; (B) 0 mM, (C) 200 mM and 300 mM NaCl. Error bars represent the SD calculated from three biological replicates. Statistical significance between control and treated plants was determined using two-way ANOVA conducted on GraphPad Prism 8.4.2, shown as *** = p ≤ 0.001, ** = p ≤ 0.01, and * = p ≤ 0.05 according to the Bonferroni’s multiple comparison test.
Plants 09 00730 g003
Figure 4. Effect of NaCl and Ca2+ on H2O2 content of sorghum seedlings. (A) H2O2 content measured from seedlings germinated in the presence of different NaCl concentrations only. (B,C), Seedlings under different NaCl and Ca2+ (5, 15 and 35mM) concentrations; (B) 0 mM, (C) 200 and 300 mM NaCl. Error bars represent the SD calculated from three biological replicates. Statistical significance between control and treated plants was determined using two-way ANOVA conducted on GraphPad Prism 8.4.2, shown as *** = p ≤ 0.001 and * = p ≤ 0.05 according to the Bonferroni’s multiple comparison test.
Plants 09 00730 g004
Figure 5. Anatomical image showing the epidermis and xylem layers of Sorghum bicolor analyzed using Scanning Electron Microscopy. Cross section of epidermis layer of seedlings under (A) 0 mM NaCl, (B) 0 mM NaCl + 5 mM Ca2+, (C) 300 mM NaCl, (D) 300 mM + 5 mM Ca2+. Cross section of the xylem layers of seedlings under (E) 0 mM NaCl, (F) 0 mM NaCl + 5 mM Ca2+, (G) 300 mM NaCl, (H) 300 mM + 5 mM Ca2+.
Plants 09 00730 g005
Figure 6. Energy dispersive X-ray (EDX) spectroscopy and SEM images of the effect of NaCl and Ca2+ on the concentration of Na+ and K+ of sorghum seedlings. (AD) Spectra showing concentration of different elements, (EH) Sorghum surface for mapped elements. (A,E) Na+ and K+ content in the absence of NaCl (0 mM), (B,F) presence of 5 mM Ca2+ only, (C,G) 300 mM NaCl only, (D,H) and 300 mM + 5 mM Ca2+.
Plants 09 00730 g006
Figure 7. Transcript analysis of Sorghum bicolor antioxidant and Na+/H+ exchanger antiporter genes in the absence (0 mM) and presence (300 mM) of NaCl treated with different Ca2+ (5, 15, and 35 mM) concentrations. Relative gene expression of (A) SbAPX2, (B) SbCAT3, (C) SbSOS1 and (D) vacuolar SbNHX2. Error bars represent the SD calculated from three biological replicates. Statistical significance between control and treated plants were determined by two-way ANOVA conducted on GraphPad Prism 8.4.2, shown as ** = p ≤ 0.01, and * = p ≤ 0.05 according to the Bonferroni’s multiple comparison test.
Plants 09 00730 g007

