Article

Comparative Analysis of the Complete Plastid Genome of Five Bupleurum Species and New Insights into DNA Barcoding and Phylogenetic Relationship

Key Laboratory of Bio-Resources and Eco-Environment of Ministry of Education, College of Life Sciences, Sichuan University, Chengdu 610065, China
*
Authors to whom correspondence should be addressed.
Plants 2020, 9(4), 543; https://doi.org/10.3390/plants9040543
Submission received: 15 March 2020 / Revised: 18 April 2020 / Accepted: 19 April 2020 / Published: 22 April 2020
(This article belongs to the Special Issue Plant Molecular Phylogenetics and Evolutionary Genomics)

Abstract

:
Bupleurum L. (Apiaceae) is a perennial and herbal genus, most species of which have high medicinal value. However, few studies have been performed using plastome data in this genus, and the phylogenetic relationships have always been controversial. In this study, the plastid genomes of Bupleurum chinense and Bupleurum commelynoideum were sequenced, and their gene content, order, and structure were counted and analyzed. The only three published Bupleurum species (B. boissieuanum, B. falcatum, and B. latissimum) and other fifteen allied species were selected to conduct a series of comparative and phylogenetic analyses. The genomes of B. chinense and B. commelynoideum were 155,869 and 155,629 bp in length, respectively, both of which had a typical quadripartite structure. The genome length, structure, guanine and cytosine (GC) content, and gene distribution were highly similar to the other three Bupleurum species. The five Bupleurum species had nearly the same codon usages, and eight regions (petN-psbM, rbcL-accD, ccsA-ndhD, trnK(UUU)-rps16, rpl32-trnL(UAG)-ccsA, petA-psbJ, ndhF-rpl32, and trnP(UGG)-psaJ-rpl33) were found to possess relatively higher nucleotide diversity, which may be the promising DNA barcodes in Bupleurum. Phylogenetic analysis revealed that all Bupleurum species clustered into a monophyletic clade with high bootstrap support and diverged after the Chamaesium clade. Overall, our study provides new insights into DNA barcoding and phylogenetic relationship between Bupleurum and its related genera, and will facilitate the population genomics, conservation genetics, and phylogenetics of Bupleurum in Apiaceae.

1. Introduction

Bupleurum L. (Apiaceae) is a large genus in Apiaceae, most species of which are perennial herbs. The genus contains about 180 species widely distributed in temperate and subtropical of the northern hemisphere, with 42 species (22 endemics) in China [1]. Most Bupleurum plants have high medicinal value and are widely used as a traditional medicine in Asia, Europe, and northern Africa [2]. Bupleurum chinense and Bupleurum scorzonerifolium are used as bupleuri radix to treat cold, chills and fever alternate, chest coerces bloated pain, etc. [3]. There are many studies focused on chemical components [4,5] and pharmacognosy [6,7], but those involved in the systematics analyses are relatively few. Meanwhile, the mixed usage of different Bupleurum species may bring adverse reactions due to the unawareness of the chemical component [8,9]. Molecular phylogenetic studies based on nuclear ribosomal internal transcribed spacer (nrITS) and plastid DNA introns (rpl16 and rps16) supported a basal position of the genus Bupleurum within subfamily Apioideae, and considered this genus a distinct tribe [10,11]. However, the phylogenetic relationships within Bupleurum have always been controversial. Studies based on morphology, chromosome counts, nrDNA ITS sequences, and plastid DNA markers laid the theoretical basis for the speciation and phylogenetic relationship analyses among Bupleurum species [12,13,14]. However, there still needs to be more molecular information to determine the interspecific phylogeny more accurately. In recent years, comparative analysis of the complete plastid genome has become a promising method for population genetics, conservation genetics and phylogenetic studies [15,16]. However, only three Bupleurum species’ complete plastid genomes (Bupleurum boissieuanum, Bupleurum falcatum, and Bupleurum latissimum) have been reported until now [17,18].
The typical plastid genome in angiosperms is a circular molecule of double-stranded DNA, which ranges from 120 kb to 170 kb in length and usually encodes 120 to 130 genes [19]. Typical plastid genomes have a quadripartite structure consisting of a small single-copy region (SSC) and a large single-copy (LSC) region jointed by a pair of inverted repeats (IRa and IRb). The gene content, order and structure are highly conserved at low taxonomic levels [20], but there are still variations especially in the intergenic regions and IR boundaries. Some hotspot regions with much nucleotide information have been applied to species identification [21,22]. The evolutionary rates of conserved coding regions are low, which are high in non-coding regions. The former is suitable for phylogenetic studies of high taxonomic levels such as orders and families, and the latter is suitable for taxa that differentiated recently. Moreover, the genetic pattern of plastid is matrilineal, thus making plastid DNA easier to track individual lineages in time and space than nuclear DNA that constantly merge and recombine genes from two parents [23]. Compared with nuclear genomes, plastid genomes are small but contain a lot of information, and they are easier to sequence. Due to these advantages, plastid genomes have been widely applied to molecular identification, divergence dating and phylogenetic analysis [20,24,25,26,27].
The rapid development of high-throughput sequencing technology has greatly facilitated the acquisition of genome data. With the advantages of high-throughput and low cost-effectiveness, an increasing number of plastid genomes of plants have been sequenced and assembled in recent years, and more genetic resources are analyzed via different bioinformatics approaches [28,29]. The high-throughput sequencing technology and vast information of plastid genomes mark a new era of population genomics and phylogenetic studies.
In our study, we used the NGS to obtain the complete plastid DNA sequences of two Bupleurum species (B. chinense and B. commelynoideum), then counted and analyzed their gene content, order and structure. We also combined the only three published Bupleurum species (B. boissieuanum, B. falcatum and B. latissimum) and allied plastid genome sequences to perform a series of comparative analyses including codon usage bias, repetitive sequences, nucleotide diversity, selective pressure and IR boundary comparative analysis, also phylogenetic analyses were conducted to infer their relationship. Our findings provide new insights into DNA barcoding and phylogenetic relationships of the genus Bupleurum, and will provide genetic resources for population genomics, conservation genetics and phylogenetics of Bupleurum in Apiaceae.

2. Results and Discussion

2.1. Genome Features of B. chinense and B. commelynoideum

The sequences of B. chinense and B. commelynoideum were 155,869 bp and 155,629 bp, respectively, both of which were found to have a typical quadripartite structure comprising a small single-copy region (SSC) and a large single-copy (LSC) region jointed by a pair of inverted repeats (IRa and IRb) (Figure 1). This was a conserved structure in most plastid genomes of higher plants [30,31]. The two plastid genomes showed the same overall GC content, which was 37.7%, and the same values of the LSC, SSC and IR regions which were 35.8%, 31.4%, and 42.8%, respectively, near to other three Bupleurum species (B. boissieuanum, B. falcatum and B. latissimum) plastid genome levels [17,18]. Like other species, GC contents in IRs are higher than in other regions, and this might result from rRNAs with high GC in the IRs [32,33,34]. Some other related data were very close to the other three species in Bupleurum (Table 1).
Both of the B. chinense and B. commelynoideum plastid genome contained 114 unique genes (Table 2) including 80 protein-coding genes (PCGs), 30 transfer RNA genes (tRNAs) and 4 ribosomal RNA genes (rRNAs). The SSC region contained 11 PCGs (ndhF, rpl32, ccsA, ndhD, psaC, ndhE, ndhG, ndhI, ndhA, ndhH, and rps15) and 1 tRNA (trnL-UAG), while the LSC region contained 60 PCGs and 22 tRNAs. 17 genes were duplicated in the IR regions, including 7 tRNAs (trnA-UGC, trnI-CAU, trnI-GAU, trnL-CAA, trnN-GUU, trnR-ACG, and trnV-GAC), 6 PCGs (rps7, rpl2, rpl23, ndhB, ycf2 and ycf15), and 4 rRNAs (rrn4.5, rrn5, rrn16 and rrn23). The genes rps12 and rps19 straddled the LSC and IR region, while gene ycf1 straddled the SSC and IR region. 15 genes (trnA-UGC, trnG-GCC, trnI-GAU, trnK-UUU, trnL-UAA, trnV-UAC, rpoC1, rps16, rpl2, rpl16, ndhA, ndhB, petB, petD and atpF) harbored a single intron, and 3 genes (rps12, ycf3 and clpP) contained two introns. In our study, the infA, ycf15 and the incomplete copy of ycf1 and rps19 in the IR regions were regarded as pseudogenes. The gene ycf68 was lost in the five Bupleurum species and most Apiaceae species [17,18,35,36,37], but existed in other families and was identified as a pseudogene [38,39]. Pseudogenization and pseudogene loss occurred in different plant taxa, and this may be caused by multiple genetic lesions and transfer to the nucleus [40,41].

2.2. Codon Usage Bias Analysis

In the plastid genomes of the five Bupleurum species (B. chinense, B. commelynoideum, B. boissieuanum, B. falcatum, and B. latissimum), the 20 amino acids were also encoded by 64 codons (Figure 2), among which only methionine (Met) and tryptophan (Trp) were encoded by single codon, while arginine (Arg), leucine (Leu) and serine (Ser) had the maximum codons of six. Most of the amino acids had codon preferences except Met and Trp. The total number of codons in the five Bupleurum species ranged from 21,188 to 21,195 (Table S1 in Supplementary Material). Leucine (Leu) and cysteine (Cys) were the most and least abundant amino acids, respectively. The relative synonymous codon usage (RSCU) values of the same codon were subequal, with a maximum difference of 0.2 for very few. 30 codons preferences were identified, including 24 high preference (RSCU > 1.3), 2 moderate preference (1.2 ≤ RSCU ≤ 1.3) and 4 low preference (1.0 < RSCU < 1.2). These codons were from 18 amino acids and 1 stop codon. Preferences between codons may result from mutation, selection, and random genetic drift, and be affected by translation efficiency, which may be an adaptive factor [42,43]. The ENC, CAI, CBI and FOP values ranged from 49.83 to 49.90, 0.166 to 0.167, −0.102 to −0.100 and 0.353 to 0.354, respectively, which meant there was no obvious preference in the five Bupleurum species’ plastid genomes (Table 3). All the GC3 content values were 0.269%, indicating that these genes preferred the codons ended with A/T, which is a universal phenomenon in the plastid genome of higher plants [44,45,46].
The five Bupleurum species and their allied species in Apiaceae had similar codon usages, of which UAA, AGA, GCU, UCU and ACU had the highest frequency, while AGC, CUG, CUC, CGC and UAC had the lowest frequency (Figure 3). This indicated that codons preferred to end with A/T, which was consistent with the conclusion of GC3 content above. Notably, the five Bupleurum species exhibited lower usages in the stop codon UAA (light red) and higher usages in the stop codon UGA (light blue). On the contrary, Daucus carota, Pleurospermum camtschaticum and Chamaesium viridiflorum showed higher usages in UAA (deep red) and lower usages in UGA (deep blue). These differences in the use of stop codons suggest that stop codons may not undergo the same strict selection as other codons. In addition, the codon CGU, CUU, and CAC had slightly higher usages, and CGA, AGG, UUC, and AUC had slightly lower usages than other allied species. The synonymous codons are generated by mutations, and the evolutionary pressures cause the use of these synonymous codons to vary in frequency [42,47]. Codon preference is the result of long-term adaption of species to their base composition, tRNA abundance, and environmental selection pressure. Moreover, the preference can affect the initiation, elongation, and accuracy of the translation, the shearing of mRNA, and the folding of proteins [48,49,50]. These preferences will contribute to the plastid gene engineering of Bupleurum species and lay a theoretical foundation for modification and efficient expression of exogenous genes.

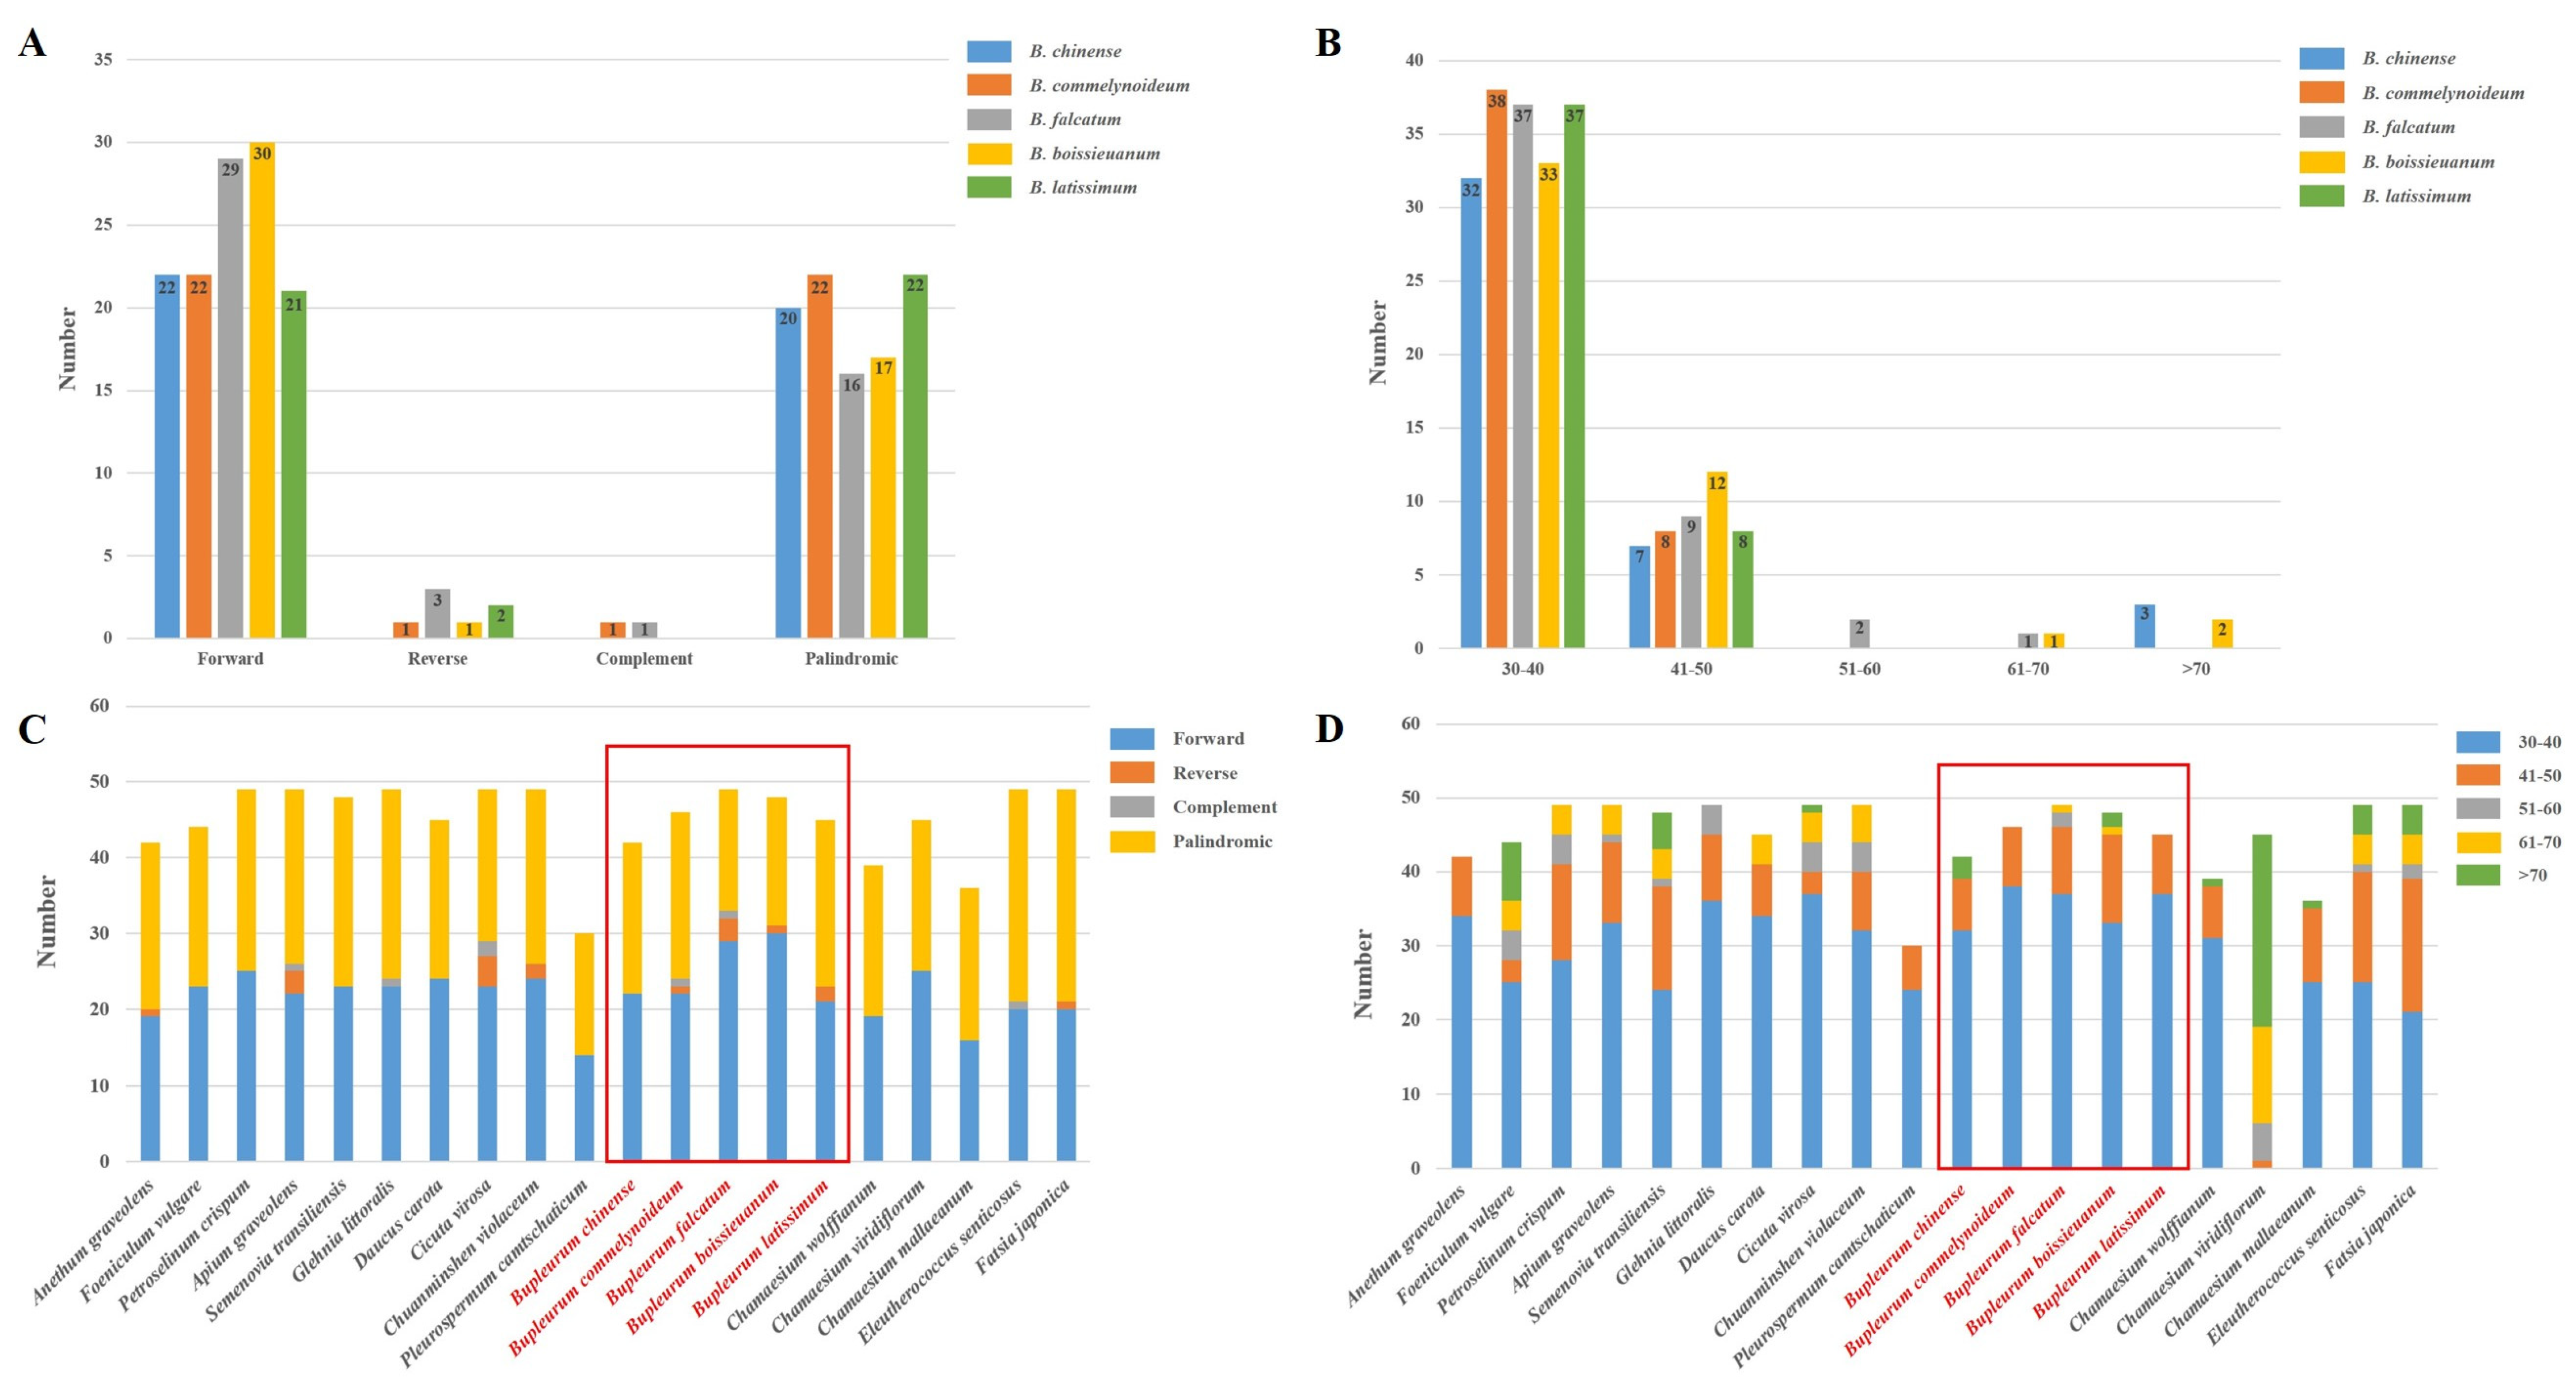
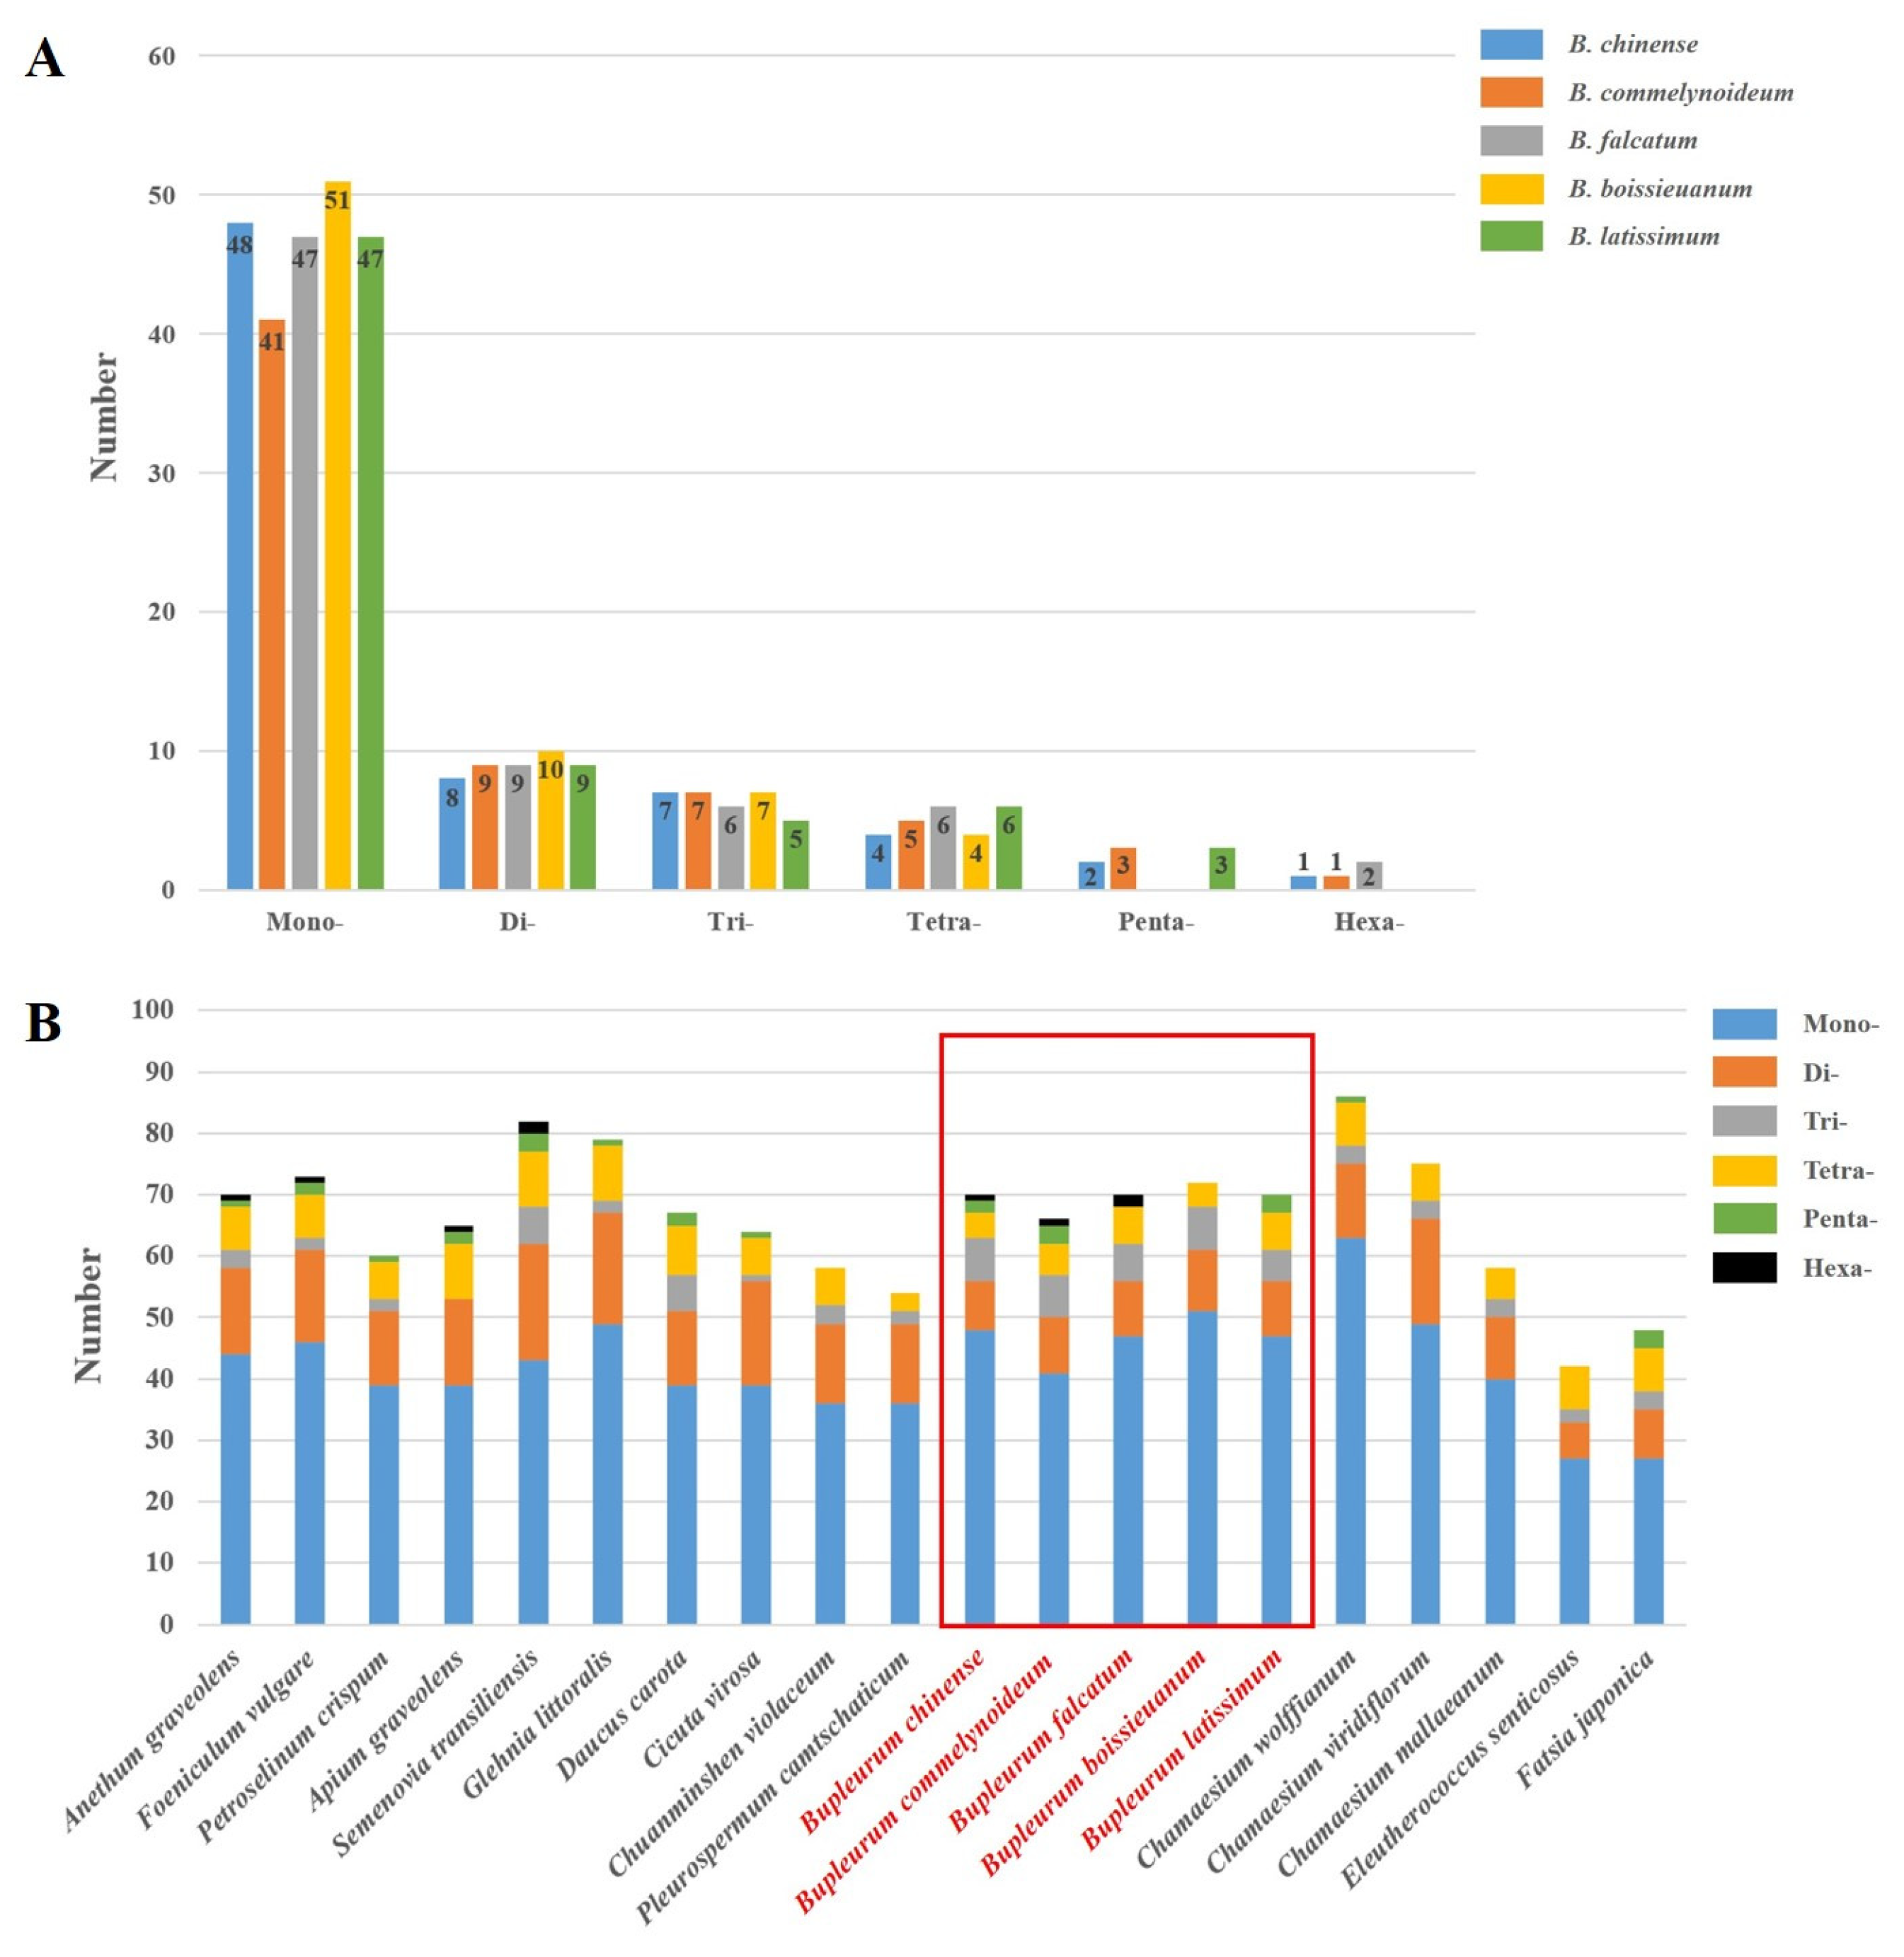
2.3. Repetitive Sequences Analysis

Repetitive sequences in plastid genomes play an essential role in population genetics and biogeography studies [51,52], and these repeats may result from slipped-strand mispairing and improper recombination [53]. In this study, short dispersed repeats (SDRs) analysis found 22 forward, 0 reverse, 0 complement and 20 palindromic repeats in the plastid genome of B. chinense (Figure 4A), of which 32 were 30–40 bp in length, 7 were 41–50 bp in length, and 3 exceeded 70 bp in length (Figure 4B). Similarly, 22 forward, 1 reverse, 1 complement and 22 palindromic repeats were found in B. commelynoideum, of which 38 were 30–40 bp in length and 8 were 41–50 bp in length. Together with the other three Bupleurum species (B. boissieuanum, B. falcatum, and B. latissimum), they tended to generate more forward and palindromic repeats rather than reverse and complement repeats (Figure 4C). Comparing to the repeats with length more than 50 bp, the repeats with 30–40 bp in length more widely existed in the plastid genomes (Figure 4D). Additionally, repeat numbers are also obviously different. All the tendencies were the same in the allied species of the Apiaceae except that Chamaesium viridiflorum had a reversed length distribution in SDRs (Figure 4D). To figure out whether the abnormal SDRs distribution appears in a single species, a population or the whole genus, more comparative analysis needs to be performed on different levels in the future.
Simple sequence repeats (SSRs) analysis showed 48 mono-, 8 di-, 7 tri-, 4 tetra-, 2 penta- and 1 hexa-nucleotides in B. chinense, and the corresponding values of B. commelynoideum were 41, 9, 7, 5, 3 and 1, respectively (Figure 5A). Among these sorts of SSRs, the number of mono-nucleotides was largest, and the number of di-, tri- and tetra-nucleotides were far less than the mono-nucleotides. Penta- and hexa-nucleotides had the least number, even some species existed no penta- and hexa-nucleotides. This tendency was also found in allied species (Figure 5B). Furthermore, the size distribution of SSRs varies in different species. In most species such as Lilium [54], Primula [55], Allium [56] and Quercus [57], the most abundant repeats are the mono-nucleotide repeats, but in Forthysia [58] are di-nucleotide repeats, and in Nitotiana [59] are tri-nucleotide repeats. This indicates that SSR variations will devote to genetic diversity in different species. Previous studies suggested that repeats diversity in plastid genomes are highly related in the rearrangement of the genome, and are generated by slipped-strand mispairing and abnormal recombination [53,60] in the process of DNA replication. Thus, SSRs have been widely used as molecular markers in population genetics and evolutionary studies [61,62].

2.4. Nucleotide Diversity Analysis

Nucleotide diversity (Pi) of the plastid genomes in the five Bupleurum species was calculated to assess the sequence divergence level in the genus Bupleurum. In the LSC region, Pi values ranged from 0 to 0.02250, with an average of 0.00358, and in the SSC region, they ranged from 0.00067 to 0.01350, with an average value of 0.00505, while the IR region had the least average value of 0.00059, of which the Pi values ranged from 0 to only 0.00467 (Figure 6A). Low Pi values in the IR region indicated that the IR region existed fewer mutations and was highly conserved at the genus level. Sequences with high Pi values were all spacer regions between genes. Among these spacer regions, petN-psbM, rbcL-accD, ccsA-ndhD, trnK(UUU)-rps16, rpl32-trnL(UAG)-ccsA, petA-psbJ, ndhF-rpl32, and trnP(UGG)-psaJ-rpl33 were the only eight regions which had >0.01000 Pi values. Intergenic regions are under weaker selection pressure and possess a higher evolutionary rate than genes. They are more suitable for the study of the classification and evolution of low taxonomic levels [22,63]. Most of the Bupleurum species have high medicine values, such as B chinense and B. scorzonerifolium [2], so identifying these species becomes important and necessary. Therefore, these eight hotspot sequences may be the promising DNA barcodes for identification, classification and genetic divergence of the Bupleurum taxa, and some of these have been used in other species [64].
Also, Pi values together within the other 13 allied species were calculated, and the same tendency was observed over the Pi variations (Figure 6B). The Pi values of LSC, SSC and IR region ranged from 0.00897 to 0.10574, 0.02639 to 0.10867 and 0.00037 to 0.05375, respectively, and the corresponding averages were 0.03831, 0.05282 and 0.01058, respectively. The averages of LSC and SSC region were nearly ten times as large as those in the five Bupleurum species. Furthermore, more than half of the higher diversity regions were different from those in the five Bupleurum species, which indicated a great difference in the sequence differentiation among the genus. The three highest diversity regions were ycf1, ndhF-rpl32 and trnE(UUC)-trnT(GGU), and the Pi values were 0.10867, 0.10576 and 0.10574, respectively, which were the only three regions whose Pi values were over 0.10000. These regions are more suitable for the study of genus levels, and have been widely used as molecular markers in previous phylogenetic studies [65,66,67], and easier to align than nrITS. In addition, we chose the ten regions with the highest Pi values for the phylogenetic analysis.

2.5. Selective Pressure Analysis

The ω (Ka/Ks) of 80 protein-coding genes were calculated to assess the selection pressure among the five Bupleurum species and allied species in Apiaceae. Genes perform important biological functions, and the mutations will undergo rigorous selection. When the ratio of non-synonymous mutation rate (Ka) to synonymous mutation rate (Ks) is greater than 1, the gene is under positive selection. The Ka/Ks < 1 illustrates purifying selection and Ka/Ks close to 1 illustrates neutral evolution [68,69]. The result showed that there were no genes with Ka/Ks > 1, indicating that no genes were under positive selection (Figure 7). The gene ycf15 had the highest Ka/Ks value of 0.94785, while the gene ycf2 with the Ka/Ks value of 0.84184 ranked second. Both of them had values close to 1, which indicated that there could be as many non-synonymous mutations as synonymous mutations, and they might be in the process of neutral evolution, especially ycf15. However, the gene ycf15 is regarded as a pseudogene that had lost its function (Table 2), which indicates that mutations will not undergo selection. Also, the gene ycf2 is one of the Hypothetical Chloroplast Reading Frames (YCF) (Table 2), so it is controversial whether ycf2 encodes a protein [70]. This may be the reason why ycf15 and ycf2 underwent a neutral evolution. The remaining genes with Ka/Ks away from 1 were regarded under purifying selection. We found the Ka values of atpH, psbJ, psbF, rpl36 and rpl23 were 0, and thereby the Ka/Ks values were all 0 in Figure 7. Among them, genes atpH, psbJ and psbF are related to photosynthesis, and genes rpl36 and rpl23 are for the synthesis of large ribosome subunits (Table 2). All these genes are crucial to the plant, and non-synonymous mutations that occurred can affect survival and, thus, being eliminated.

2.6. IR Boundary Comparative Analysis

The IR/LSC and IR/SSC junction of the five Bupleurum species and their allied species were compared to assess the expansion and contraction of the IR regions. Among the five Bupleurum species, the genes rpl22 and rpl2 flanked the LSC/IRb junction, and gene rps19 traversed the LSC and the IRb region (JLB line), with 49–84 bp located in the IR region (Figure 8). Therefore, the portions of the rps19 located in the IRb were also duplicated in the IRa/LSC junction, which was identified as pseudogenes (marked with ‘ψ’). The ycf1 gene, which was the second-largest gene of the plastid genome in higher plants [30], traversed the SSC and IRa region, with the same length of 1877 bp in IR region, thus in the junction of the IRb/SSC lying the ψycf1 with 1877 bp, too. On the other side of the IRb/SSC lied the gene ndhF, which was the same length of 26 bp away from the IRb/SSC junction. No obvious expansion or contraction was observed within the five Bupleurum species, but an obvious shift of JLB was observed in other species in Apiaceae, which indicated they were undergoing a contraction in IR regions. It’s worth noting that the gene ndhF traversed the IRb and SSC region, which indicated that there might also be a tendency of expansion in gene ndhF. Among Apiaceae species, the size variation of the plastid genome in the process of evolution mainly results from the expansion and contraction of the IR regions [71,72], and double-strand break (DSB) events may be the main reason of expansions [73].

2.7. Phylogenetic Analysis

Plastid genomes of plants have been widely used to investigate the phylogenetic and evolutionary relationships among families [27], genera [74], species [75], and even within species [76]. To investigate the phylogenetic position of the B. chinense and B. commelynoideum in Apiaceae, six partitions datasets including the complete plastid genomes, LSC regions, SSC regions, IR regions, single-copy CDS sequences and ten high-variation regions of 18 Apiaceae and 2 Araliaceae species plastid genomes were used to construct the maximum likelihood (ML) tree. All six datasets produced the same topology trees with a slight difference in bootstrap support (Figure S1). Among them, the trees based on SSC regions, single-copy CDS sequences and ten high-variation regions possessed higher bootstrap support values (>90), which suggested that these three datasets can better show species differentiation. All the phylogenetic trees revealed that B. chinense was most related to B. commelynoideum, and they were gathered within a clade (Figure 9). Also, B. falcatum and B. boissieuanum were gathered within a clade. These two clades were sister groups. B. latissimum was the first to speciate and was at the base among the five Bupleurum species in phylogenetic trees. The five Bupleurum species clustered into a monophyletic clade with strong support in all trees. The phylogenetic relationship in the genus Bupleurum was similar to previous studies based on nrITS and plastid DNA markers (trnH-psbA and matK) [14]. In our study, the Bupleurum clade was differentiated after the Chamaesium clade, and Chamaesium clade was at the base representing the basal taxa in Apioideae. However, in previous studies based on nrITS and plastid DNA markers, the Bupleurum clade was earlier differentiated than the Chamaesium and was at the base [10,11,77]. The inconsistent results indicated that the nrITS may be affected by hybridization and incomplete lineage sorting. Plastid DNA, which is maternally inherited, is longer and has less mutation than the nuclear ITS region, so it will provide more phylogenetic information and not be interfered with by paralogous genes in the phylogenetic studies [23,78]. Therefore, plastid DNA can better reflect the evolutionary relationship. This may be the main reason for the discrepancy in the phylogenetic analyses based on nrITS, plastid DNA markers, and plastid genomes. Anyway, the genus Bupleurum is still the relatively basal taxa in the Apiaceae. In addition, the genus Daucus, Semenovia, etc. are the crown groups, which is consistent with their external morphology and fruit characteristics [1,79]. Our study may provide information for population genomics and taxonomy in Bupleurum, and a new insight for phylogenetic reconstruction in Apiaceae.

3. Materials and Methods

3.1. Plant Materials and DNA Extraction

Mature and healthy leaves of single individuals of B. chinense and B. commelynoideum were collected from Mao county (Sichuan province, China; coordinates: 31°41′28.94″ N, 103°49′32.41″ E) and LuHuo county (Sichuan province, China; coordinates: 31°38′29 N, 100°15′05″ E), respectively. All voucher specimens were deposited in the Sichuan University Herbarium (SZ). The fresh leaves above were immediately dried with silica gel for further DNA extraction. The total genomic DNA was extracted from the dried leaves using the modified cetyltrimethyl ammonium bromide (CTAB) method [80].

3.2. Genome Sequencing, Assembly and Annotation

The total genomic DNA was sequenced at Novogene (Novogene BioTech, Inc. Beijing, China) by Illumina NovaSeq 6000 Platform (Illumina, San Diego, CA). Libraries with an average length of 350 bp were constructed, and the average length of generated reads was 150 bp. Deep coverage of plastid genomes was obtained from the total genomic DNA via genome skimming sequencing strategy [81]. The clean data were used to assemble the complete plastid genome via NOVOplasty [82] with the complete plastid genome of B. boissieuanum as the reference (GenBank accession No. MF663725). The assembled plastid genomes were annotated via Geneious v9.0.2 [83] with the sequence of B. boissieuanum as the reference, and the annotation result was revised according to the B. latissimum, B. falcatum and allied genus including Angelica, Chamaesium, Chuanminshen, and Pleurospermum manually. Finally, the physical maps of the genome were generated using OGDraw v1.3.1 [84] (http://ogdraw.mpimp-golm.mpg.de/). The annotated plastid genomes of B. chinense and B. commelynoideum had been submitted to GenBank under the Accession Number MN893666 and MT162552, respectively.

3.3. Codon Usage Bias Analysis

Codon usage analysis was conducted via the program codon W [85]. 53 protein-coding genes (CDS) (Table S2) were filtered from the five Bupleurum species (other three were downloaded from NCBI) after removing the CDS less than 300 bp and the repeat sequences. Five important indices were calculated to assess the extent of the codon usage bias including the codon adaptation index (CAI), codon bias index (CBI), frequency of optimal codons (Fop), GC content of the synonymous third codons positions (GC3s) and the effective number of codons (ENC). The relative synonymous codon usage values (RSCU) [86] of 15 allied species and 2 outgroup species (also downloaded from NCBI) were calculated to assess the difference of the codon usages (Table S3).

3.4. Repetitive Sequences Analysis

Short dispersed repeats (SDRs) were identified via REPuter [87], including forward, reverse, complement and palindromic. The parameters were set as follows: (1) Hamming distance of 3; (2) 90% or greater sequence identity; (3) minimal repeat size of 30 bp. Simple sequence repeats (SSRs) were also identified via perl script MISA [88], including mono-, di-, tri-, tetra-, penta- and hexa-nucleotides. The minimum numbers of the SSRs were set 10, 5, 4, 3, 3 and 3 for mono-, di-, tri-, tetra-, penta- and hexa-nucleotides, respectively.

3.5. Nucleotide Diversity Analysis

The plastid genome sequences were aligned using MAFFT [89] and adjusted manually. Then a slide window analysis was conducted to calculate the nucleotide diversity (Pi) in DnaSP v5 [90]. The parameters were set as follows: (1) windows size of 600 bp; (2) step size of 200 bp. Ten high-variation regions of the allied species were selected to conduct the phylogenetic analysis.

3.6. Selective Pressure Analysis

80 single-copy CDS sequences were extracted from the aligned plastid genome sequences after removing the repeat sequences. All the CDS sequences of the 18 species were aligned using MAFFT [89], then all the termination codons were removed. The final alignments were used to conduct the selective pressure analysis using DnaSP v5 [90]. The ratio (ω) of the non-synonymous substitution rate (Ka) to the synonymous substitution rate (Ks) was calculated to measure the selective pressure.

3.7. IR Boundary Comparative Analysis

All the plastid genome sequences were aligned using MAFFT [89] and adjusted manually. The plugin repeat finder in Geneious v9.0.2 was used to find the inverted repeats of some species without IR annotation. The genes and pseudogenes (marked with ‘ψ’) located in and beside the junctions of the boundaries were drawn manually to show the expansion and contraction of the IR region.

3.8. Phylogenetic Analysis

Phylogenetic analysis was conducted to investigate the relationship between the five Bupleurum species. Sixteen complete genome sequences of allied species were downloaded from NCBI, including other 3 species in Bupleurum, 3 species in Chamaesium, and 1 species in Anethum, Foeniculum, Petroselinum, Apium, Semenovia, Glehnia, Daucus, Cicuta, Chuanminshen and Pleurospermum. Two Araliaceae species (Eleutherococcus senticosus and Fatsia japonica) were added as outgroups (Table S3). The following six partitions datasets were used to conduct a phylogenetic analysis: (A) the complete plastid genomes; (B) the LSC regions; (C) the SSC regions; (D) the IR regions; (E) the single-copy CDS sequences; (F) ten high-variation region sequences. All the datasets were aligned and trimmed via MAFFT [89], and manually adjusted in MEGA7 if necessary. Maximum likelihood (ML) analysis was performed using RAxML v8.2.4 [91] with GTR + G model and 1000 bootstrap replicates.

4. Conclusions

In this study, we sequenced the complete plastid genomes of two Bupleurum species, B. chinense and B. commelynoideum, and compared their genome structure with the only three published Bupleurum species (B. boissieuanum, B. falcatum, and B. latissimum). All the five Bupleurum species plastid genomes exhibited a typical quadripartite and circular structure with very similar length, and the gene contents and orders were highly conserved. They also had very similar codon usage preferences but differed in two stop codon UAA and UGA from allied species. Repetitive sequences analysis showed they had the same tendency and certain diversity in numbers and distributions of SDRs and SSRs. The spacer regions petN-psbM, rbcL-accD, ccsA-ndhD, trnK(UUU)-rps16, rpl32-trnL(UAG)-ccsA, petA-psbJ, ndhF-rpl32, and trnP(UGG)-psaJ-rpl33 had relative higher nucleotide diversity in five Bupleurum species, which could be the promising DNA barcodes in Bupleurum taxa, while ycf1, ndhF-rpl32, and trnE(UUC)-trnT(GGU) were the three highest regions with Pi values over 0.10000 compared with allied species, which have been widely used as molecular markers. No genes were under positive selection, but obvious shifts of JLB and traversing ndhF was observed in other species in Apiaceae. Phylogenetic analysis based on plastid genome datasets produced the same topology trees with high support. The five Bupleurum species clustered into a monophyletic clade and were later differentiated from the Chamaesium clade. This study will enrich the plastid genome data and genetic resources of the genus Bupleurum and provide new insights into DNA barcoding of Bupleurum and phylogenetic reconstruction of the family Apiaceae.

Supplementary Materials

The following are available online at https://www.mdpi.com/2223-7747/9/4/543/s1, Table S1: The RSCU values of 64 codons in the five Bupleurum species, Table S2: 53 protein-coding genes (CDS) used in codon usage bias analysis and corresponding alignment length and GC content, Table S3: Complete plastid genomes of sixteen Apiaceae species and two Araliaceae species from GenBank, Figure S1: Molecular phylogenetic trees of 18 Apiaceae and 2 Araliaceae based on (A) complete plastid genomes; (B) LSC regions; (C) SSC regions; (D) IR regions; (E) single-copy CDS sequences; (F) ten high-variation regions.

Author Contributions

Conceptualization, J.L., X.-J.H. and S.-D.Z.; methodology, D.-F.X. and X.-L.G.; formal analysis, J.L.; resources, D.-F.X. and Z.-Y.Z.; data curation, J.L.; writing—original draft preparation, J.L.; writing—review and editing, D.-F.X., X.-L.G. and S.-D.Z.; supervision, X.-J.H. and S.-D.Z. All authors have read and agreed to the published version of the manuscript.

Funding

This research was funded by the National Natural Science Foundation of China (Grant Nos. 31872647, 31570198), the Chinese Ministry of Science and Technology through the “National Science and Technology Infrastructure Platform” project (Grant No. 2005DKA21403-JK), and the fourth national survey of traditional Chinese medicine resources (Grant No. 2019PC002).

Acknowledgments

We acknowledge Dan-Mei Su, Yan-Ping Xiao and Fu-Min Xie for their help in analysis tools.

Conflicts of Interest

The authors declare no conflict of interest.

References

  1. She, M.L.; Watson, M.F. Apiaceae (Umbelliferae). In Flora of China; Science Press: Beijing, China, 2005; Volume 14, pp. 60–74. [Google Scholar]
  2. Pan, S.L. Bupleurum Species: Scientific Evaluation and Clinical Applications. In Traditional Herbal Medicines for Modern Times; CRC Press: Boca Raton, FL, USA, 2006; Volume 107, pp. 13–16. [Google Scholar]
  3. Chinese Pharmacopoeia Commission. Bupleuri Radix. In Pharmacopoeia of People’s Republic of China; China Medical Science Press: Beijing, China, 2015; Volume 5, pp. 280–281. [Google Scholar]
  4. Guo, M.N.; Liu, S.X.; Zhao, Y.M.; Zhang, T.J.; Liu, D.L. Analysis on chemical constituents in Bupleuri Radix by HPLC-Q-TOF-MS. Chin. Tradit. Herb. Drugs 2016, 47, 2044–2052. [Google Scholar]
  5. Huang, H.Q.; Wang, X.H.; Fu, H.; Wang, Y.; Yang, S.H. Research progress on medicinal plant resources of Bupleurum L. Chin. Tradit. Herb. Drugs 2017, 48, 2989–2996. [Google Scholar]
  6. Cholet, J.; Decombat, C.; Vareille-Delarbre, M.; Gainche, M.; Berry, A.; Senejoux, F.; Ripoche, I.; Delort, L.; Vermerie, M.; Fraisse, D.; et al. In vitro anti-inflammatory and immunomodulatory activities of an extract from the roots of Bupleurum rotundifolium. Medicines 2019, 6, 101. [Google Scholar] [CrossRef] [PubMed] [Green Version]
  7. Lee, W.P.; Lan, K.L.; Liao, S.X.; Huang, Y.H.; Hou, M.C.; Lan, K.H. Antiviral effect of saikosaponin B2 in combination with daclatasvir on NS5A resistance-associated substitutions of hepatitis C virus. J. Chin. Med. Assoc. 2019, 82, 368–374. [Google Scholar] [CrossRef]
  8. Zhao, J.F.; Guo, Y.Z.; Meng, X.S. The toxic principles of Bupleurum longiradiatum. Acta Pharm. Sinica 1987, 22, 507–511. [Google Scholar]
  9. Liu, X.J.; Hu, J.; Li, Z.Y.; Qin, X.M.; Zhang, L.Z.; Guo, X.Q. Species classification and quality assessment of Chaihu (Radix Bupleuri) based on high-performance liquid chromatographic fingerprint and combined chemometrics methods. Arch. Pharm. Res. 2011, 34, 961–969. [Google Scholar] [CrossRef]
  10. Downie, S.R.; Spalik, K.; Katz-Downie, D.S.; Reduron, J. Major clades within Apiaceae subfamily Apioideae as inferred by phylogenetic analysis of nrDNA ITS sequences. Plant. Div. Evol. 2010, 128, 111–136. [Google Scholar] [CrossRef] [Green Version]
  11. Zhou, J.; Gong, X.; Downie, S.R.; Peng, H. Towards a more robust molecular phylogeny of Chinese Apiaceae subfamily Apioideae: Additional evidence from nrDNA ITS and cpDNA intron (rpl16 and rps16) sequences. Mol. Phylogenet. Evol. 2009, 53, 56–68. [Google Scholar] [CrossRef]
  12. Neves, S.S.; Watson, M.F. Phylogenetic relationships in Bupleurum (Apiaceae) based on nuclear ribosomal DNA ITS sequence data. Ann. Bot. 2004, 93, 379–398. [Google Scholar] [CrossRef] [Green Version]
  13. Wang, Q.Z.; He, X.J.; Zhou, S.D.; Wu, Y.K.; Yu, Y.; Pang, Y.L. Phylogenetic inference of the genus Bupleurum (Apiaceae) in Hengduan Mountains based on chromosome counts and nuclear ribosomal DNA ITS sequences. J. Syst. Evol. 2008, 46, 142–154. [Google Scholar]
  14. Wang, C.B.; Ma, X.G.; He, X.J. A taxonomic re-ssessment in the Chinese Bupleurum (Apiaceae): Insights from morphology, nuclear ribosomal internal transcribed spacer, and chloroplast (trnH-psbA, matK) sequences. J. Syst. Evol. 2011, 49, 558–589. [Google Scholar] [CrossRef]
  15. Shaw, J.; Shafer, H.L.; Leonard, O.R.; Kovach, M.J.; Schorr, M.; Morris, A.B. Chloroplast DNA sequence utility for the lowest phylogenetic and phylogeographic inferences in angiosperms: The tortoise and the hare IV. Am. J. Bot. 2014, 101, 1987–2004. [Google Scholar] [CrossRef] [PubMed] [Green Version]
  16. Moore, M.J.; Soltis, P.S.; Bell, C.D.; Burleigh, J.G.; Soltis, D.E. Phylogenetic analysis of 83 plastid genes further resolves the early diversification of eudicots. Proc. Natl. Acad. Sci. USA 2010, 107, 4623–4628. [Google Scholar] [CrossRef] [PubMed] [Green Version]
  17. Shin, D.H.; Lee, J.H.; Kang, S.H.; Ahn, B.O.; Kim, C.K. The complete chloroplast genome of the hare’s ear root, Bupleurum falcatum: Its molecular features. Genes 2016, 7, 20. [Google Scholar] [CrossRef] [Green Version]
  18. Wu, Y.; Zhang, T.Z.; Qiu, D.Y.; Chai, Q.; Fan, W.B.; Li, Z.H.; Fang, M.F. Complete plastid genome of Bupleurum boissieuanum, an endemic herb plant in western China. Conserv. Genet. Resour. 2018, 10, 635–637. [Google Scholar] [CrossRef]
  19. Sugiura, M. The chloroplast genome. Plant Mol. Biol. 1992, 19, 149–168. [Google Scholar] [CrossRef]
  20. Dong, W.P.; Liu, H.; Xu, C.; Zuo, Y.J.; Chen, Z.J.; Zhou, S.L. A chloroplast genomic strategy for designing taxon specific DNA mini-barcodes: A case study on ginsengs. BMC Genet. 2014, 15, 138. [Google Scholar] [CrossRef] [Green Version]
  21. Zhou, T.; Wang, J.; Jia, Y.; Li, W.L.; Xu, F.S.; Wang, X.M. Comparative chloroplast genome analyses of species in Gentiana section Cruciata (Gentianaceae) and the development of authentication markers. Int. J. Mol. Sci. 2018, 19, 1962. [Google Scholar] [CrossRef] [Green Version]
  22. Dong, W.P.; Liu, J.; Yu, J.; Wang, L.; Zhou, S.L. Highly variable chloroplast markers for evaluating plant phylogeny at low taxonomic levels and for DNA barcoding. PLoS ONE 2012, 7, e35071. [Google Scholar] [CrossRef]
  23. Zhang, Y.J.; Li, D.Z. Advances in phylogenomics based on complete chloroplast genomes. Plant Divers. Resour. 2011, 33, 365–375. [Google Scholar]
  24. Krak, K.; Vít, P.; Belyayev, A.; Douda, J.; Hreusová, L.; Mandák, B. Allopolyploid origin of Chenopodium album s. str. (Chenopodiaceae): A molecular and cytogenetic insight. PLoS ONE 2016, 11, e0161063. [Google Scholar] [CrossRef] [PubMed]
  25. Dong, W.L.; Wang, R.N.; Zhang, N.Y.; Fan, W.B.; Fang, M.F.; Li, Z.H. Molecular evolution of chloroplast genomes of orchid species: Insights into phylogenetic relationship and adaptive evolution. Int. J. Mol. Sci. 2018, 19, 716. [Google Scholar] [CrossRef] [PubMed] [Green Version]
  26. Huang, J.; Yu, Y.; Liu, Y.M.; Xie, D.F.; He, X.J.; Zhou, S.D. Comparative chloroplast genomics of Fritillaria (Liliaceae), inferences for phylogenetic relationships between Fritillaria and Lilium and plastome evolution. Plants 2020, 9, 133. [Google Scholar] [CrossRef] [PubMed] [Green Version]
  27. Leebens-Mack, J.; Raubeson, L.A.; Cui, L.Y.; Kuehl, J.V.; Fourcade, M.H.; Chumley, T.W.; Boore, J.L.; Jansen, R.K.; dePamphilis, C.W. Identifying the basal angiosperm node in chloroplast genome phylogenies: Sampling one’s way out of the Felsenstein Zone. Mol. Biol. Evol. 2005, 22, 1948–1963. [Google Scholar] [CrossRef]
  28. Huang, H.; Shi, C.; Liu, Y.; Mao, S.Y.; Gao, L.Z. Thirteen Camellia chloroplast genome sequences determined by high-throughput sequencing: Genome structure and phylogenetic relationships. BMC Evol. Biol. 2014, 14, 151. [Google Scholar] [CrossRef] [Green Version]
  29. Xie, D.F.; Yu, Y.; Deng, Y.Q.; Li, J.; Liu, H.Y.; Zhou, S.D.; He, X.J. Comparative analysis of the chloroplast genomes of the Chinese endemic genus Urophysa and their contribution to chloroplast phylogeny and adaptive evolution. Int. J. Mol. Sci. 2018, 19, 1847. [Google Scholar] [CrossRef] [Green Version]
  30. Wicke, S.; Schneeweiss, G.M.; Depamphilis, C.W.; Müller, K.F.; Quandt, D. The evolution of the plastid chromosome in land plants: Gene content, gene order, gene function. Plant Mol. Biol. 2011, 76, 273–297. [Google Scholar] [CrossRef] [Green Version]
  31. Zhu, A.D.; Guo, W.H.; Gupta, S.; Fan, W.S.; Mower, J.P. Evolutionary dynamics of the plastid inverted repeat: The effects of expansion, contraction, and loss on substitution rates. New Phytol. 2016, 209, 1747–1756. [Google Scholar] [CrossRef] [Green Version]
  32. Qian, J.; Song, J.Y.; Gao, H.H.; Zhu, Y.J.; Xu, J.; Pang, X.H.; Yao, H.; Sun, C.; Li, X.E.; Li, C.Y.; et al. The complete chloroplast genome sequence of the medicinal plant Salvia miltiorrhiza. PLoS ONE 2013, 8, e57607. [Google Scholar] [CrossRef]
  33. Asaf, S.; Waqas, M.; Khan, A.L.; Khan, M.A.; Kang, S.M.; Imran, Q.M.; Shahzad, R.; Bilal, S.; Yun, B.W.; Lee, I.J. The complete chloroplast genome of wild rice (Oryza minuta) and its comparison to related species. Front. Plant Sci. 2017, 8, 304. [Google Scholar] [CrossRef] [Green Version]
  34. Gu, C.H.; Tembrock, L.R.; Zheng, S.Y.; Wu, Z.Q. The complete chloroplast genome of Catha edulis: A comparative analysis of genome features with related species. Int. J. Mol. Sci. 2018, 19, 525. [Google Scholar] [CrossRef] [PubMed] [Green Version]
  35. Tian, E.W.; Liu, Q.Q.; Chen, W.N.; Li, F.; Chen, A.M.; Li, C.; Chao, Z. Characterization of complete chloroplast genome of Angelica sinensis (Apiaceae), an endemic medical plant to China. Mitochondrial DNA B Resour. 2019, 4, 158–159. [Google Scholar] [CrossRef] [Green Version]
  36. Zhu, Q.L.; Guang, Y.L.; Xiao, X.F.; Shan, N.; Wan, C.P.; Yang, Y.X. The complete chloroplast genome sequence of the Apium graveolens L. (Apiaceae). Mitochondrial DNA B Resour. 2019, 4, 463–464. [Google Scholar] [CrossRef] [Green Version]
  37. Zheng, H.Y.; Guo, X.L.; He, X.J.; Yu, Y.; Zhou, S.D. The complete chloroplast genome of Chamaesium paradoxum. Mitochondrial DNA B Resour. 2019, 4, 2069–2070. [Google Scholar] [CrossRef] [Green Version]
  38. Huang, Y.Y.; Cho, S.T.; Haryono, M.; Kuo, C.H. Complete chloroplast genome sequence of common bermudagrass (Cynodon dactylon (L.) Pers.) and comparative analysis within the family Poaceae. PLoS ONE 2017, 12, e0179055. [Google Scholar]
  39. Logacheva, M.D.; Shipunov, A.B. Phylogenomic analysis of Picramnia, Alvaradoa, and Leitneria supports the independent Picramniales. J. Syst. Evol. 2017, 55, 171–176. [Google Scholar] [CrossRef]
  40. Vanin, E.F. Processed pseudogenes: Characteristics and evolution. Ann. Rev. Genet. 1985, 19, 253–272. [Google Scholar] [CrossRef]
  41. Millen, R.S.; Olmstead, R.G.; Adams, K.L.; Palmer, J.D.; Lao, N.T.; Heggie, L.; Kavanagh, T.A.; Hibberd, J.M.; Gray, J.C.; Morden, C.W.; et al. Many parallel losses of infA from chloroplast DNA during angiosperm evolution with multiple independent transfers to the nucleus. Plant Cell 2001, 13, 645–658. [Google Scholar] [CrossRef] [Green Version]
  42. Morton, B.R. The role of context-dependent mutations in generating compositional and codon usage bias in grass chloroplast DNA. J. Mol. Evol. 2003, 56, 616–629. [Google Scholar] [CrossRef]
  43. Bulmer, M. The selection-mutation-drift theory of synonymous codon usage. Genetics 1991, 129, 897–907. [Google Scholar]
  44. Nie, X.J.; Lv, S.Z.; Zhang, Y.X.; Du, X.H.; Wang, L.; Biradar, S.S.; Tan, X.F.; Wan, F.H.; Song, W.N. Complete chloroplast genome sequence of a major invasive species, crofton weed (Ageratina adenophora). PLoS ONE 2012, 7, e36869. [Google Scholar] [CrossRef] [PubMed] [Green Version]
  45. Yi, D.K.; Kim, K.J. Complete chloroplast genome sequences of important oilseed crop Sesamum indicum L. PLoS ONE 2012, 7, e35872. [Google Scholar] [CrossRef] [PubMed] [Green Version]
  46. Zuo, L.H.; Shang, A.Q.; Zhang, S.; Yu, X.Y.; Ren, Y.C.; Yang, M.S.; Wang, J.M. The first complete chloroplast genome sequences of Ulmus species by de novo sequencing: Genome comparative and taxonomic position analysis. PLoS ONE 2017, 12, e0171264. [Google Scholar] [CrossRef] [PubMed] [Green Version]
  47. Hanson, G.; Coller, J. Codon optimality, bias and usage in translation and mRNA decay. Nat. Rev. Mol. Cell Bio. 2017, 19, 20–30. [Google Scholar] [CrossRef] [PubMed]
  48. Behura, S.K.; Severson, D.W. Codon usage bias: Causative factors, quantification methods and genome-wide patterns: With emphasis on insect genomes. Biol. Rev. 2012, 88, 49–61. [Google Scholar] [CrossRef] [PubMed]
  49. Novoa, E.M.; de Pouplana, L.R. Speeding with control: Codon usage, tRNAs, and ribosomes. Trends Genet. 2012, 28, 574–581. [Google Scholar] [CrossRef]
  50. Ren, G.P.; Dong, Y.Y.; Dang, Y.K. Codon codes: Codon usage bias influences many levels of gene expression. Sci. Chine Life Sci. 2019, 49, 839–847. [Google Scholar]
  51. Khan, A.; Asaf, S.; Khan, A.L.; Shehzad, T.; Al-Rawahi, A.; Al-Harrasi, A. Comparative chloroplast genomics of endangered Euphorbia species: Insights into hotspot divergence, repetitive sequence variation, and phylogeny. Plants 2020, 9, 199. [Google Scholar] [CrossRef] [Green Version]
  52. Huang, J.; Chen, R.H.; Li, X.G. Comparative analysis of the complete chloroplast genome of four known Ziziphus species. Genes 2017, 8, 340. [Google Scholar] [CrossRef] [Green Version]
  53. Cavalier-Smith, T. Chloroplast evolution: Secondary dispatch symbiogenesis and multiple losses. Curr. Biol. 2002, 12, R62–R64. [Google Scholar] [CrossRef] [Green Version]
  54. Liu, H.Y.; Yu, Y.; Deng, Y.Q.; Li, J.; Huang, Z.X.; Zhou, S.D. The chloroplast genome of Lilium henrici: Genome structure and comparative analysis. Molecules 2018, 23, 1276. [Google Scholar] [CrossRef] [PubMed] [Green Version]
  55. Ren, T.; Yang, Y.C.; Zhou, T.; Liu, Z.L. Comparative plastid genomes of Primula species: Sequence divergence and phylogenetic relationships. Int. J. Mol. Sci. 2018, 19, 1050. [Google Scholar] [CrossRef] [PubMed] [Green Version]
  56. Xie, D.F.; Yu, H.X.; Price, M.; Xie, C.; Deng, Y.Q.; Chen, J.P.; Yu, Y.; Zhou, S.D.; He, X.J. Phylogeny of Chinese Allium species in section Daghestanica and adaptive evolution of Allium (Amaryllidaceae, Allioideae) species revealed by the chloroplast complete genome. Front. Plant Sci. 2019, 10, 460. [Google Scholar] [CrossRef] [PubMed] [Green Version]
  57. Yang, Y.C.; Zhou, T.; Duan, D.; Yang, J.; Feng, L.; Zhao, G.F. Comparative analysis of the complete chloroplast genomes of five Quercus species. Front. Plant Sci. 2016, 7, 959. [Google Scholar] [CrossRef] [Green Version]
  58. Wang, W.B.; Yu, H.; Wang, J.H.; Lei, W.J.; Gao, J.H.; Qiu, X.P.; Wang, J.S. The complete chloroplast genome sequences of the medicinal plant Forsythia suspensa (Oleaceae). Int. J. Mol. Sci. 2017, 18, 2288. [Google Scholar] [CrossRef] [PubMed] [Green Version]
  59. Asaf, S.; Khan, A.L.; Khan, A.R.; Waqas, M.; Kang, S.M.; Khan, M.A.; Lee, S.M.; Lee, I.J. Complete chloroplast genome of Nicotiana otophora and its comparison with related species. Front. Plant Sci. 2016, 7, 447. [Google Scholar] [CrossRef] [Green Version]
  60. Rose, O.; Falush, D. A threshold size for microsatellite expansion. Mol. Biol. Evol. 1998, 15, 613–615. [Google Scholar] [CrossRef] [Green Version]
  61. Kaur, S.; Panesar, P.S.; Bera, M.B.; Kaur, V. Simple sequence repeat markers in genetic divergence and marker-assisted selection of rice cultivars: A review. Crit. Rev. Food Sci. Nutr. 2015, 55, 41–49. [Google Scholar] [CrossRef]
  62. Chung, S.M.; Staub, J.E.; Chen, J.F. Molecular phylogeny of Cucumis species as revealed by consensus chloroplast SSR marker length and sequence variation. Genome 2006, 49, 219–229. [Google Scholar] [CrossRef] [Green Version]
  63. Chen, S.L.; Song, J.Y.; Yao, H.; Shi, L.C.; Luo, K.; Han, J.P. Strategy and key technique of identification of Chinese herbal medicine using DNA barcoding. Chin. J. Nat. Med. 2009, 7, 322–327. [Google Scholar] [CrossRef]
  64. Song, C.F.; Wu, B.C.; Zhou, W.; Liu, Q.X. Analyses on relationship and taxonomic position of Chuanminshen Sheh et Shan (Apiaceae) based on variation of psbA-trnH sequence. J. Plant Resour. Environ. 2014, 23, 19–26. [Google Scholar]
  65. Neubig, K.M.; Whitten, W.M.; Carlsward, B.S.; Blanco, M.A.; Endara, L.; Williams, N.H.; Moore, M. Phylogenetic utility of ycf1 in orchids: A plastid gene more variable than matK. Plant. Syst. Evol. 2008, 277, 75–84. [Google Scholar] [CrossRef] [Green Version]
  66. Saslis-Lagoudakis, C.H.; Klitgaard, B.B.; Forest, F.; Francis, L.; Savolainen, V.; Williamson, E.M.; Hawkins, J.A. The use of phylogeny to interpret cross-cultural patterns in plant use and guide medicinal plant discovery: An example from Pterocarpus (Leguminosae). PLoS ONE 2011, 6, e22275. [Google Scholar] [CrossRef] [Green Version]
  67. Ye, M.R.; Liu, W.; Xue, Q.Y.; Hou, B.E.; Luo, J.; Ding, X.Y. Phylogeography of the endangered orchid Dendrobium moniliforme in East Asia inferred from chloroplast DNA sequences. Mitochondrial DNA A DNA Mapp. Seq. Anal. 2017, 28, 880–891. [Google Scholar] [PubMed]
  68. Yang, Z.H.; Bielawski, J.P. Statistical methods for detecting molecular adaptation. Trends Ecol. Evol. 2000, 15, 496–503. [Google Scholar] [CrossRef]
  69. Yang, Z.H.; Nielsen, R. Codon-substitution models for detecting molecular adaptation at individual sites along specific lineages. Mol. Biol. Evol. 2002, 19, 908–917. [Google Scholar] [CrossRef] [Green Version]
  70. Gao, N.N.; Zhao, Z.L.; Ni, L.H. Prospect: Identification of medicinal plant based on chloroplast gene ycf15. Chin. Tradit. Herb. Drugs. 2017, 48, 3210–3217. [Google Scholar]
  71. Kang, L.; Xie, D.F.; Xiao, Q.Y.; Peng, C.; Yu, Y.; He, X.J. Sequencing and analyses on chloroplast genomes of Tetrataenium candicans and two allies give new insights on structural variants, DNA barcoding and phylogeny in Apiaceae subfamily Apioideae. PeerJ 2019, 7, e8063. [Google Scholar] [CrossRef] [Green Version]
  72. Mustafina, F.U.; Yi, D.K.; Choi, K.; Shin, C.H.; Tojibaev, K.S.; Downie, S.R. A comparative analysis of complete plastid genomes from Prangos fedtschenkoi and Prangos lipskyi (Apiaceae). Ecol. Evol. 2019, 9, 364–377. [Google Scholar] [CrossRef]
  73. Wang, R.J.; Cheng, C.L.; Chang, C.C.; Wu, C.L.; Su, T.M.; Chaw, S.M. Dynamics and evolution of the inverted repeat-large single copy junctions in the chloroplast genomes of monocots. BMC Evol. Biol. 2008, 8, 36. [Google Scholar] [CrossRef] [Green Version]
  74. Wang, Y.H.; Qu, X.J.; Chen, S.Y.; Li, D.Z.; Yi, T.S. Plastomes of Mimosoideae: Structural and size variation, sequence divergence, and phylogenetic implication. Tree Genet. Genomes 2017, 13, 41. [Google Scholar] [CrossRef]
  75. Carbonell-Caballero, J.; Alonso, R.; Ibañez, V.; Terol, J.; Talon, M.; Dopazo, J. A phylogenetic analysis of 34 chloroplast genomes elucidates the relationships between wild and domestic species within the genus Citrus. Mol. Biol. Evol. 2015, 32, 2015–2035. [Google Scholar] [CrossRef] [PubMed] [Green Version]
  76. Wang, J.; Li, C.J.; Yan, C.X.; Zhao, X.B.; Shan, S.H. A comparative analysis of the complete chloroplast genome sequences of four peanut botanical varieties. PeerJ 2018, 6, e5349. [Google Scholar] [CrossRef] [PubMed] [Green Version]
  77. Guo, X.L.; Wang, C.B.; Wen, J.; Zhou, S.D.; He, X.J. Phylogeny of Chinese Chamaesium (Apiaceae: Apioideae) inferred from ITS, cpDNA and morphological characters. Phytotaxa 2018, 376, 001–016. [Google Scholar] [CrossRef]
  78. Yang, J.; Yue, M.; Niu, C.; Ma, X.F.; Li, Z.H. Comparative analysis of the complete chloroplast genome of four endangered herbals of Notopterygium. Genes 2017, 8, 124. [Google Scholar] [CrossRef]
  79. Zhang, L.; Li, M.; Zhao, J.C. Fruit morphology of 23 species in Umbelliferae and its taxonomic significance. Acta Bot. Boreal. Occident. Sin. 2015, 35, 2428–2438. [Google Scholar]
  80. Doyle, J.J.; Doyle, J.L. A rapid DNA isolation procedure for small quantities of fresh leaf tissue. Phytochem. Bull. 1987, 19, 11–15. [Google Scholar]
  81. Dodsworth, S. Genome skimming for next-generation biodiversity analysis. Trends Plant Sci. 2015, 20, 525–527. [Google Scholar] [CrossRef]
  82. Dierckxsens, N.; Mardulyn, P.; Smits, G. NOVOPlasty: De novo assembly of organelle genomes from whole genome data. Nucleic Acids Res. 2017, 45, e18. [Google Scholar]
  83. Kearse, M.; Moir, R.; Wilson, A.; Stones-Havas, S.; Cheung, M.; Sturrock, S.; Buxton, S.; Cooper, A.; Markowitz, S.; Duran, C.; et al. Geneious Basic: An integrated and extendable desktop software platform for the organization and analysis of sequence data. Bioinformatics 2012, 28, 1647–1649. [Google Scholar] [CrossRef] [PubMed]
  84. Greiner, S.; Lehwark, P.; Bock, R. OrganellarGenomeDRAW (OGDRAW) version 1.3.1: Expanded toolkit for the graphical visualization of organellar genomes. Nucleic Acids Res. 2019, 47, W59–W64. [Google Scholar] [CrossRef] [PubMed] [Green Version]
  85. Peden, J.F. CodonW. Ph.D. Thesis, University of Nottingham, Nottinghamshire, UK, 1999. [Google Scholar]
  86. Sharp, P.M.; Li, W.H. An evolutionary perspective on synonymous codon usage in unicellular organisms. J. Mol. Evol. 1986, 24, 28–38. [Google Scholar] [CrossRef] [PubMed]
  87. Kurtz, S.; Choudhuri, J.V.; Ohlebusch, E.; Schleiermacher, C.; Stoye, J.; Giegerich, R. REPuter: The manifold applications of repeat analysis on a genomic scale. Nucleic Acids Res. 2001, 29, 4633–4642. [Google Scholar] [CrossRef] [PubMed] [Green Version]
  88. Thiel, T.; Michalek, W.; Varshney, R.K.; Graner, A. Exploiting EST databases for the development and characterization of gene derived SSR-markers in barley (Hordeum vulgare L.). Theor. Appl. Genet. 2003, 106, 411–422. [Google Scholar] [CrossRef] [PubMed]
  89. Katoh, K.; Standley, D.M. MAFFT multiple sequence alignment software version 7: Improvements in performance and usability. Mol. Biol. Evol. 2013, 30, 772–780. [Google Scholar] [CrossRef] [Green Version]
  90. Librado, P.; Rozas, J. DnaSP v5: A software for comprehensive analysis of DNA polymorphism data. Bioinformatics 2009, 25, 1451–1452. [Google Scholar] [CrossRef] [Green Version]
  91. Stamatakis, A. RAxML-VI-HPC: Maximum likelihood-based phylogenetic analyses with thousands of taxa and mixed models. Bioinformatics 2006, 22, 2688–2690. [Google Scholar] [CrossRef]
Figure 1. Plastid genome map of B. chinense and B. commelynoideum. Genes shown outside the outer circle are transcribed counterclockwise, while genes inside are transcribed clockwise. The colored bars indicate different functional groups. The darker gray area in the inner circle denotes GC content, while the lighter gray corresponds to AT content of the genome. LSC: large single-copy region; SSC: small single-copy region; IR: inverted repeat region.
Plants 09 00543 g001
Figure 2. Codon content of 20 amino acids and stop codons in the five Bupleurum species.
Plants 09 00543 g002
Figure 3. The codon distribution of the allied species in Apiaceae and outgroups. Red and blue indicate higher and lower RSCU values, respectively. The left of the figure shows the phylogenetic relationship among species. Eleutherococcus senticosus and Fatsia japonica are the outgroups from Araliaceae.
Plants 09 00543 g003
Figure 4. Analysis of short dispersed repeats (SDRs) in the five Bupleurum and allied species. (A) Numbers of four types SDRs in Bupleurum. (B) Numbers of different lengths of SDRs in Bupleurum. (C) Comparison of SDR types of allied species. (D) Comparison of SDR lengths of allied species. The five Bupleurum species were framed red.
Plants 09 00543 g004
Figure 5. Analysis of simple sequence repeats (SSRs) in the five Bupleurum and allied species. (A) Numbers of six types SSRs in Bupleurum. (B) Comparison of SSR types of allied species. The five Bupleurum species were framed red.
Plants 09 00543 g005
Figure 6. The nucleotide diversity of the plastid genome of (A) the 5 Bupleurum species and (B) 18 allied species in Apiaceae. Ten regions with the highest Pi values were marked out. LSC: large single-copy region; IR: inverted repeats region; SSC: small single-copy region.
Plants 09 00543 g006
Figure 7. Selective pressure of 80 protein-coding genes in the 5 Bupleurum species and 13 allied species in Apiaceae. Ka: rate of non-synonymous substitution; Ks: rate of synonymous substitution.
Plants 09 00543 g007
Figure 8. Comparison of the LSC, SSC and IR junction among the five Bupleurum and allied species plastid genomes. JLB: junction line between LSC and IRb; JSB: junction line between SSC and IRb; JSA: junction line between SSC and IRa; JLA: junction line between LSC and IRa.
Plants 09 00543 g008
Figure 9. Molecular phylogenetic trees of 18 Apiaceae and 2 Araliaceae based on complete plastid genomes. The trees were constructed using maximum likelihood (ML) algorithm with GTR + G model and 1000 bootstrap replicates. The numbers above node are bootstrap support values.
Plants 09 00543 g009
Table 1. Summary of the genome features of the five Bupleurum species.
RegionB. chinenseB. commelynoideumB. falcatumB. boissieuanumB. latissimum
Genome length (bp)155,869155,629155,989156,108155,621
LSC length (bp)85,77285,54285,91286,00785,471
SSC length (bp)17,50117,49517,51717,49517,548
IR length (bp)26,29826,29626,28026,30326,300
CDS length (bp)78,24978,25578,26178,27078,264
Overall GC content (%)37.737.737.737.737.6
LSC GC content (%)35.835.835.835.835.8
SSC GC content (%)31.431.431.431.431.3
IR GC content (%)42.842.842.842.842.8
CDS GC content (%)38.338.238.338.338.2
Table 2. List of genes present in B. chinense and B. commelynoideum plastid genome.
GroupsCategoriesName of GenesNumber
Self-replicationrRNAsrrn4.5(×2); rrn5(×2); rrn16(×2); rrn23(×2)8
tRNAstrnA-UGC(×2); trnC-GCA; trnD-GUC; trnE-UUC; trnF-GAA; trnfM-CAU;
trnG-GCC; trnG-UCC; trnH-GUG;
trnI-CAU(×2); trnI-GAU(×2); trnK-UUU; trnL-CAA(×2); trnL-UAA; trnL-UAG;
trnM-CAU; trnN-GUU(×2); trnP-UGG;
trnQ-UUG; trnR-ACG(×2); trnR-UCU;
trnS-GCU; trnS-GGA; trnS-UGA;
trnT-GGU; trnT-UGU; trnV-GAC(×2); trnV-UAC; trnW-CCA; trnY-GUA
37
DNA-dependent RNA polymeraserpoA; rpoB; rpoC1; rpoC24
Small subunit of ribosomal proteinsrps2; rps3; rps4; rps7(×2); rps8; rps11; rps12(×2); rps14; rps15; rps16; rps18; rps1914
Large subunit of ribosomal proteinsrpl2(×2); rpl14; rpl16; rpl20; rpl22; rpl23(×2); rpl3; rpl33; rpl3611
Genes for photosynthesisSubunits of NADH dehydrogenasendhA; ndhB(×2); ndhC; ndhD; ndhE; ndhF; ndhG; ndhH; ndhI; ndhJ; ndhK12
Subunits of photosystem ⅠpsaA; psaB; psaC; psaI; psaJ; ycf3; ycf47
Subunits of photosystem ⅡpsbA; psbB; psbC; psbD; psbE; psbF; psbH; psbI; psbJ; psbK; psbL; psbM; psbN; psbT; psbZ15
Subunits of cytochrome b/f complexpetA; petB; petD; petG; petL; petN6
Subunits of ATP synthaseatpA; atpB; atpE; atpF; atpH; atpI6
Large subunit of rubiscorbcL1
Other genesATP-dependent protease subunit PclpP1
MaturasematK1
Subunits of Acetyl-CoA-carboxylaseaccD1
Envelop membrane proteincemA1
C-type cytochrome synthesis geneccsA1
Genes of unknown functionHypothetical chloroplast reading framesycf1; ycf2(×2)3
PseudogenesinfA; ycf15; ycf1*; rps19 *4
Total114 single-copy genes, 133 in total.
(×2) means the gene with two copies; * means the incomplete copy located in the IR of the gene straddling the IR and LSC/SSC regions.
Table 3. The indexes of the codon usage bias in the five Bupleurum species.
IndexB. chinenseB. commelynoideumB. falcatumB. boissieuanumB. latissimum
Length (bp)63,56463,57063,57663,58563,579
Codon No.21,18821,19021,19221,19521,193
Amino acid No.21,13521,13721,13921,14221,140
SC No.20,27320,27420,27520,27920,276
ENC49.9049.8749.8649.8849.83
CAI0.1660.1660.1670.1670.166
CBI−0.100−0.101−0.100−0.100−0.102
FOP0.3540.3540.3540.3540.353
GC content (%)0.3820.3820.3820.3820.382
GC3 content (%)0.2690.2690.2690.2690.269
SC: synonymous codons; ENC: effective number of codons; CAI: codon adaptation index; CBI: codon bias index; FOP: frequency of optimal codons; GC content: G+C content of the genes; GC3 content: G+C content of synonymous third codons positions.

