Article

The First Glimpse of Streptocarpus ionanthus (Gesneriaceae) Phylogenomics: Analysis of Five Subspecies’ Chloroplast Genomes

1
Key Laboratory of Plant Germplasm Enhancement and Specialty Agriculture, Wuhan Botanical Garden, Chinese Academy of Sciences, Wuhan 430074, China
2
University of Chinese Academy of Sciences, Beijing 100049, China
3
Sino-Africa Joint Research Center, Chinese Academy of Sciences, Wuhan 430074, China
4
East African Herbarium, National Museums of Kenya, P.O. Box 45166-00100 Nairobi, Kenya
*
Author to whom correspondence should be addressed.
Plants 2020, 9(4), 456; https://doi.org/10.3390/plants9040456
Submission received: 2 March 2020 / Revised: 29 March 2020 / Accepted: 2 April 2020 / Published: 4 April 2020
(This article belongs to the Special Issue Plant Molecular Phylogenetics and Evolutionary Genomics)

Abstract

:
Streptocarpus ionanthus (Gesneriaceae) comprise nine herbaceous subspecies, endemic to Kenya and Tanzania. The evolution of Str. ionanthus is perceived as complex due to morphological heterogeneity and unresolved phylogenetic relationships. Our study seeks to understand the molecular variation within Str. ionanthus using a phylogenomic approach. We sequence the chloroplast genomes of five subspecies of Str. ionanthus, compare their structural features and identify divergent regions. The five genomes are identical, with a conserved structure, a narrow size range (170 base pairs (bp)) and 115 unique genes (80 protein-coding, 31 tRNAs and 4 rRNAs). Genome alignment exhibits high synteny while the number of Simple Sequence Repeats (SSRs) are observed to be low (varying from 37 to 41), indicating high similarity. We identify ten divergent regions, including five variable regions (psbM, rps3, atpF-atpH, psbC-psbZ and psaA-ycf3) and five genes with a high number of polymorphic sites (rps16, rpoC2, rpoB, ycf1 and ndhA) which could be investigated further for phylogenetic utility in Str. ionanthus. Phylogenomic analyses here exhibit low polymorphism within Str. ionanthus and poor phylogenetic separation, which might be attributed to recent divergence. The complete chloroplast genome sequence data concerning the five subspecies provides genomic resources which can be expanded for future elucidation of Str. ionanthus phylogenetic relationships.

1. Introduction

Streptocarpus ionanthus (H. Wendl.) Christenhusz (Gesneriaceae) is a complex species, within Str. section Saintpaulia [1], characterized by morphological heterogeneity among the constituent nine subspecies. The species is largely traded across America and Europe for its ornamental value, as crosses among the subspecies have produced extensive flower colors [2] after a century of intensive breeding [3]. The distribution of Str. ionanthus extends from coastal Kenya to Tanga and Morogoro regions in Tanzania [4], regions experiencing habitat degradation due to both human and climate change effects [5]. Str. ionanthus is the only member of sect. Saintpaulia which has been recorded to occur in exposed habitats outside dense and closed canopy forests, environs which are prone to human activities. This has led to diminishing of population sizes and even the disappearance of most populations, leading to endangered status in taxa such as Str. ionanthus subspecies rupicola, velutinus, grandifolius and orbicularis according to the International Union for Conservation of Nature (IUCN) Red List of Threatened Species [6].
The former genus Saintpaulia H. Wendl. has attracted research attention over the last two decades, witnessing inconsistent taxon classification for both molecular and morphological studies. Previous phylogenetic studies have applied few markers, both nuclear [7,8,9] and chloroplast regions [1], aiming to understand the evolutionary relationship, but without satisfactory findings. The Internal Transcribed Spacer (ITS) phylogeny [7], for instance, could not separate taxa of the Str. ionanthus group. Further, the 5S nuclear ribosomal DNA non-transcribed spacer (5S-NTS) data [9] displayed mixed phylogenetic signals, especially for the lower taxonomic units of Str. ionanthus. These observations challenge the narrow species concept used by Burtt [10,11] to describe most Usambara and adjacent populations as species, although this concept was reviewed and updated by Darbyshire [12]. Although the chloroplast phylogeny [1] also observed similar taxonomic challenges in Str. ionanthus, this study made tremendous progress in Saintpaulia research by recognizing ten species under sect. Saintpaulia.
Recently, the amount of sequence data available has increased due to the advent of Next-Generation Sequencing (NGS) and relatively lower sequencing costs [13,14]. Presently, more than 4000 complete chloroplast genome sequences are available in the National Center for Biotechnology Information (NCBI) database (https://www.ncbi.nlm.nih.gov/genomes). The chloroplast sequence is characterized by uniparental inheritance and a substitution rate approximately half that of the nuclear genome [15]. This low nucleotide substitution, coupled with a maternal inheritance and non-recombinant nature, makes plant chloroplast genomes appreciated sources of molecular markers for evolutionary studies [16]. Further, chloroplast genomes have demonstrated to be effective in resolving tough phylogenetic relationships, especially at lower taxonomic levels of recent divergence [17,18].
The poor resolutions and low bootstrap support values observed previously in Str. ionanthus suggests a case of a recently divergent group which needs to be investigated with methods other than gene-based approaches. Understanding the evolutionary relationship among such recently divergent lineages has been achieved using massive DNA data as opposed to a few genes [19,20]. Thus, chloroplast genomic analyses of Str. ionanthus constituent taxa could elucidate its evolutionary relationship. Presently, only one chloroplast genome exists in sect. Saintpaulia and none in Str. ionanthus. Here, we sequence chloroplast genomes of five subspecies of Str. ionanthus aimed at (1) reporting the annotation and sequence variation, (2) screening for divergence hotspots, and (3) providing new genomic resources for future Str. ionanthus research.

2. Results

2.1. Overall Features of Str. ionanthus Chloroplast Genome

A linear visualization of six sect. Saintpaulia taxa is presented in Figure 1. The chloroplast genome sizes within Str. ionanthus extended from 153,208 base pairs (bp) (Str. ionanthus subsp. grandifolius) to 153,377 bp (Str. ionanthus subsp. orbicularis) (Table 1), exhibiting closeness to Str. teitensis with 153,207 bp [21]. Similar to other angiosperms, the five chloroplast genomes exhibited a four-partitioned structure made of a large single copy region (LSC), two inverted repeat regions (IRA and IRB) and a small single copy region (SSC) located between the Inverted Repeat (IR) regions. The length of the LSC region ranged from 84,010 bp (Str. ionanthus subsp. grotei) to 84,115 bp (Str. ionanthus subsp. velutinus), while the SSC size exhibited a variation from 18,316 bp (Str. ionanthus subsp. grotei) to 18,332 bp in two subspecies (Str. ionanthus subsp. velutinus and Str. ionanthus subsp. grandifolius). The IR regions varied from 25,431 bp (Str. ionanthus subsp. velutinus and Str. ionanthus subsp. grandifolius) to 25,464 bp (Str. ionanthus subsp. orbicularis) (Table 1). The five genomes had a total of 115 unique genes (each) including 80 protein-coding (PCGs), four ribosomal RNA (rRNAs) and 31 transfer RNA genes (tRNAs) (outlined in Table 2).
All five subspecies exhibited a duplication of 18 genes, including seven tRNAs (trnM-CAU, trnL-CAA, trnV-GAC, trnE-UUC, trnA-UGC, trnR-ACG and trnN-GUU), the four rRNAs, and seven PCGs (rpl2, rpl23, ycf2, ycf15, ndhB, rps7 and rps12). A total of 15 genes (ndhA, ndhB, petB, petD, rpl2, rpl16, rpoC1, rps12, rps16, trnA-UGC, trnG-UCC, trnI-GAU, trnK-UUU, trnL-UAA, and trnV-UAC) contained a single intron, whereas two genes (clpP and ycf3) contained two introns each. Compared to the congeneric Str. teitensis [21], the six genomes generally had a high similarity, although Str. teitensis had 114 genes due to the absence of the gene ycf15.

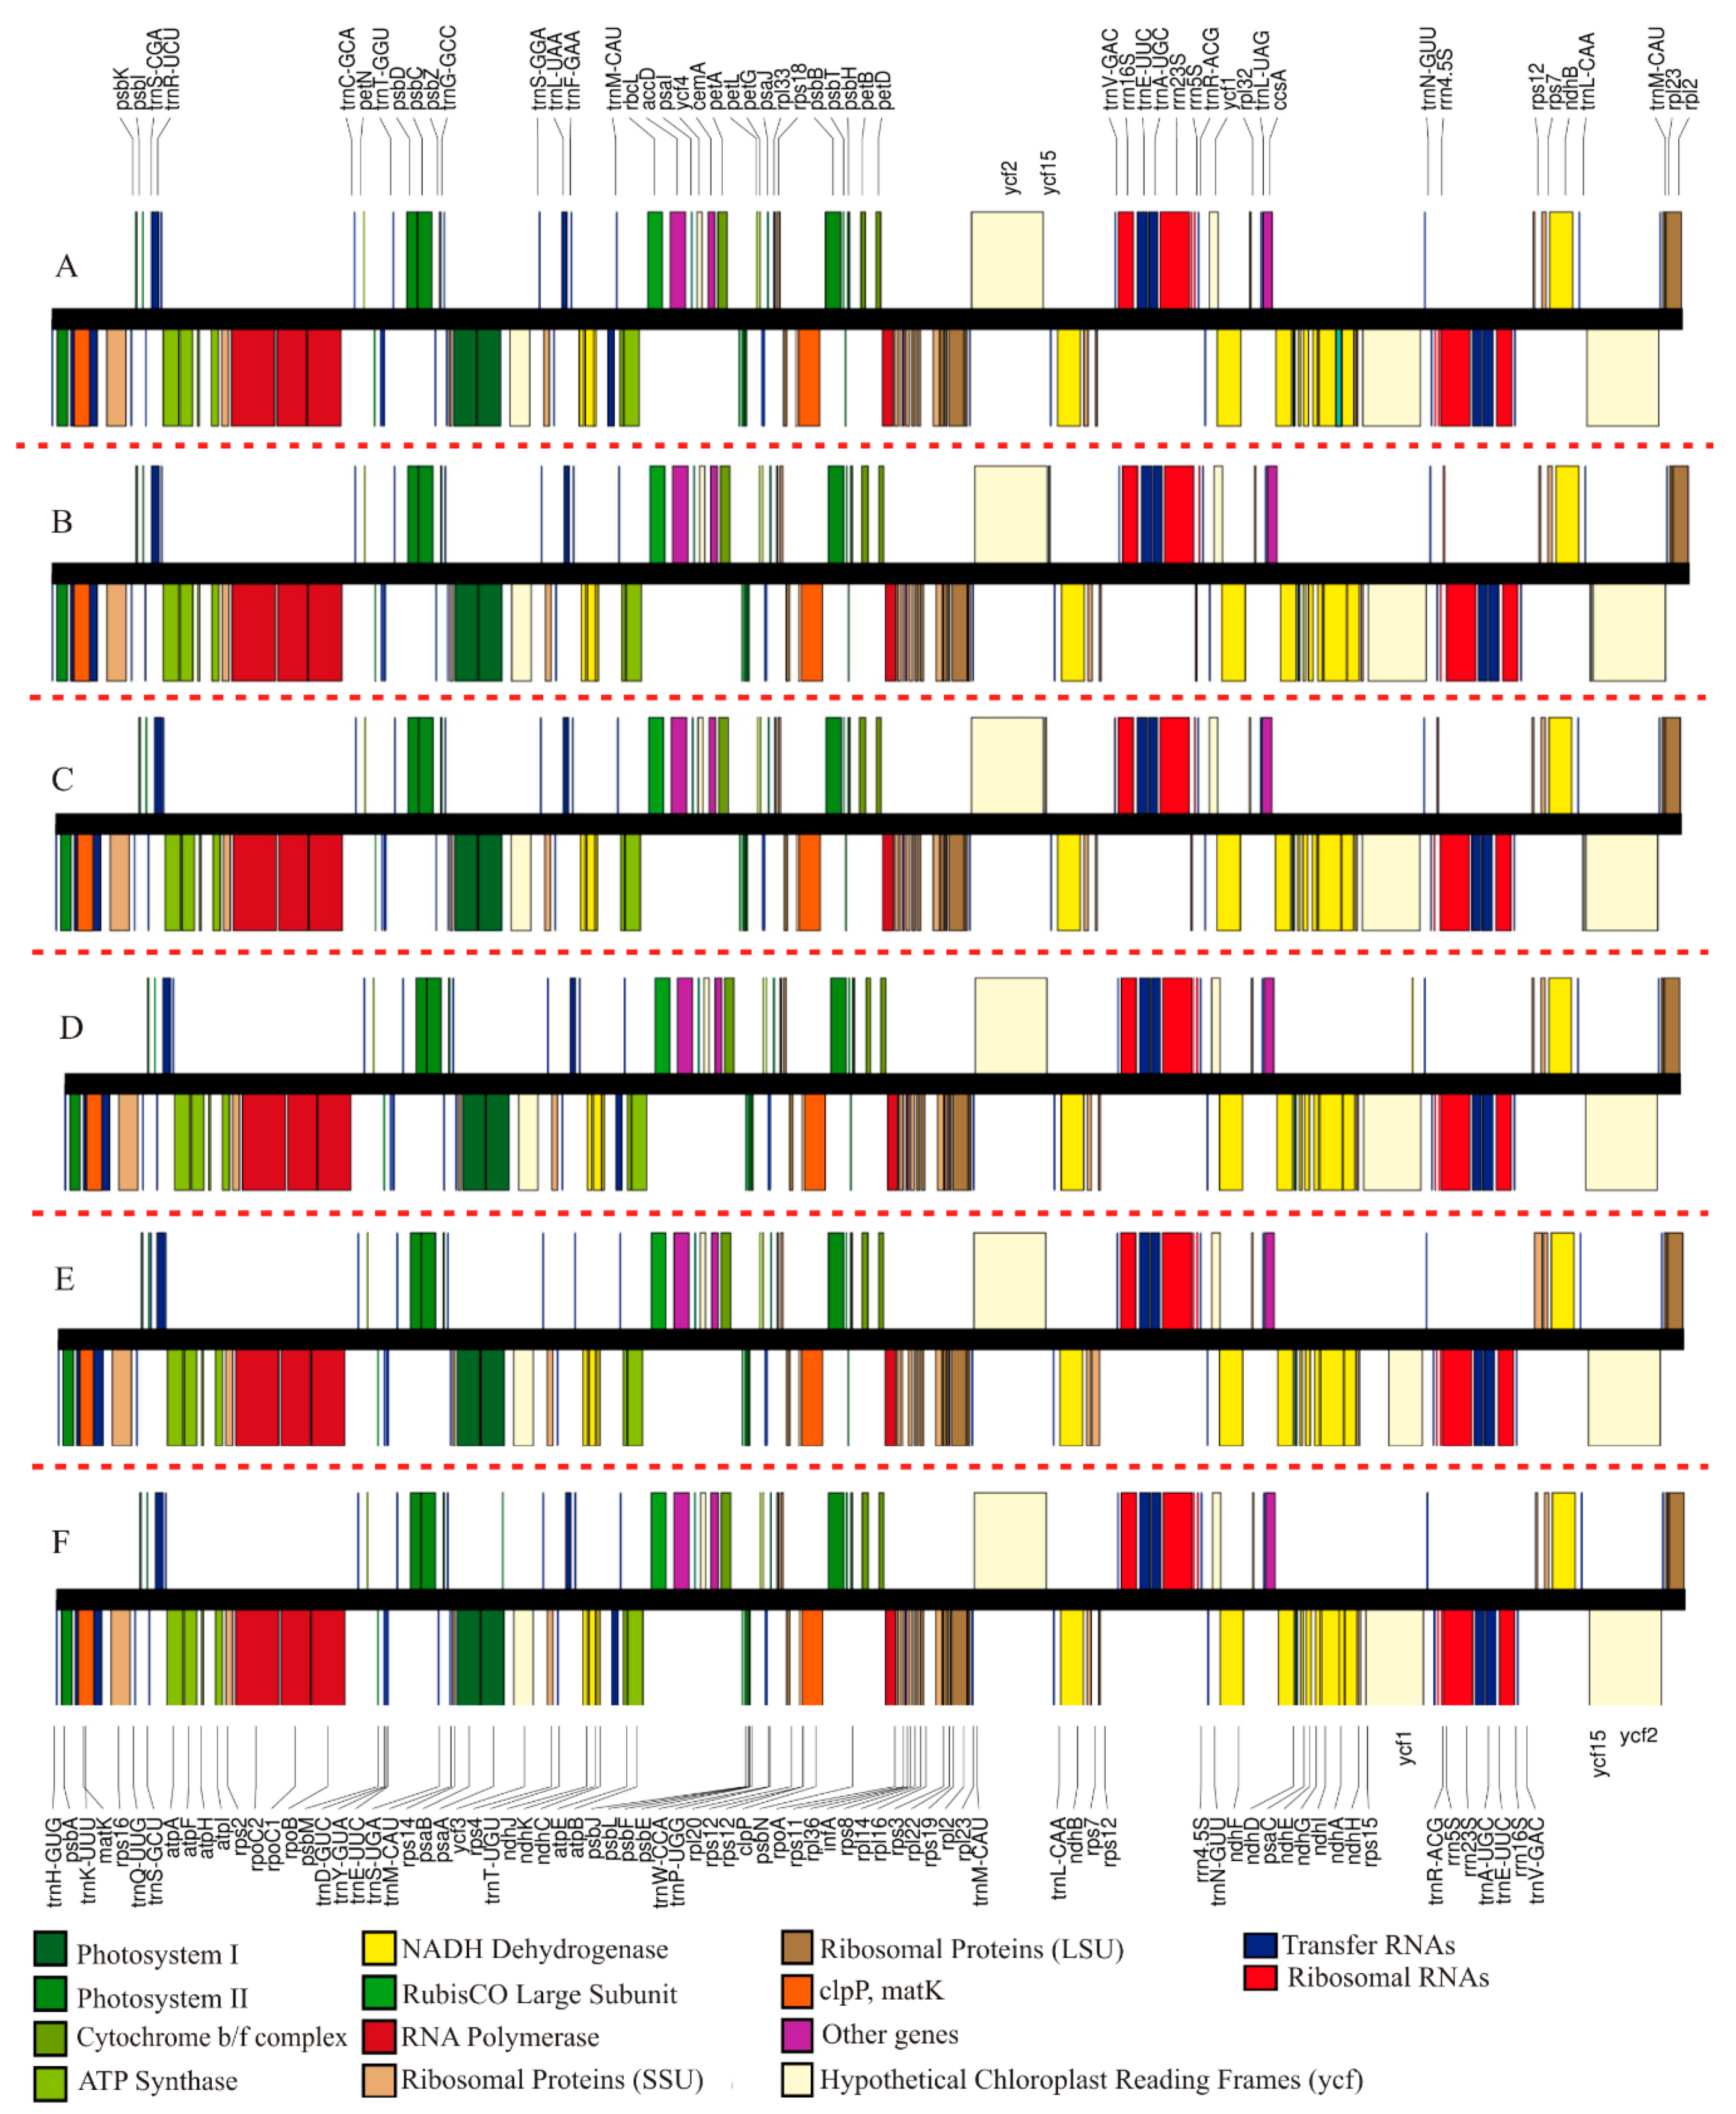
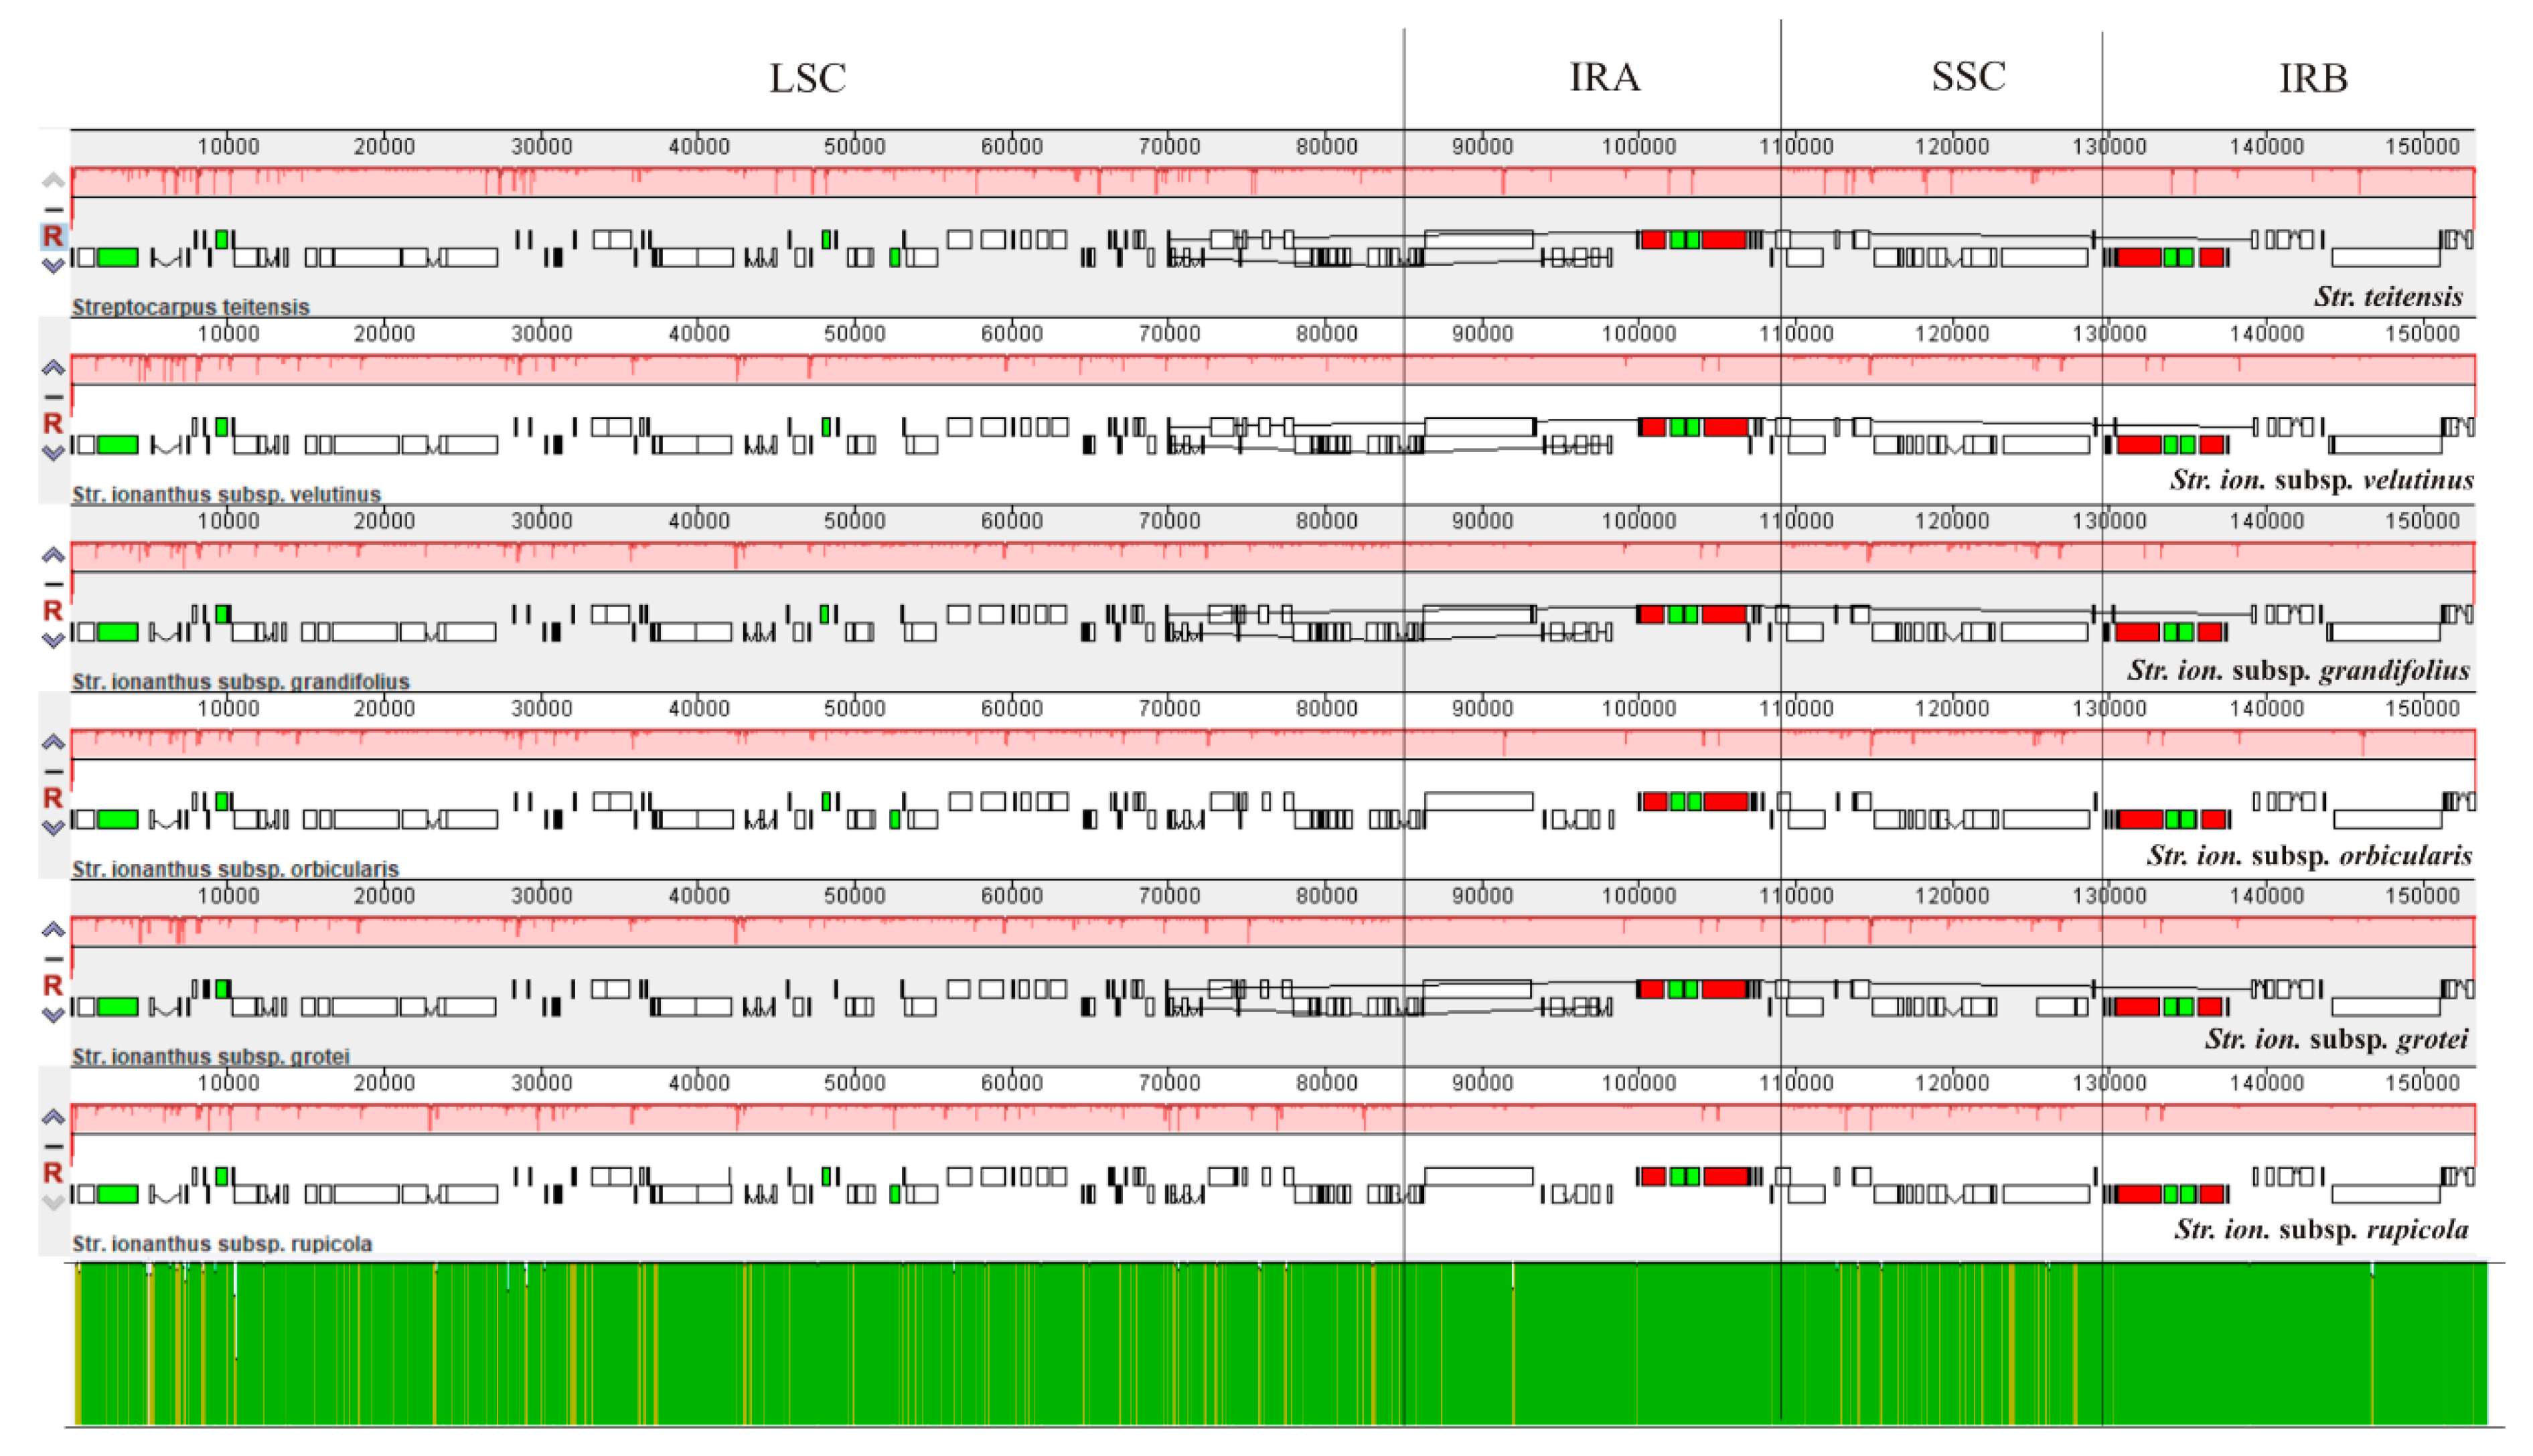
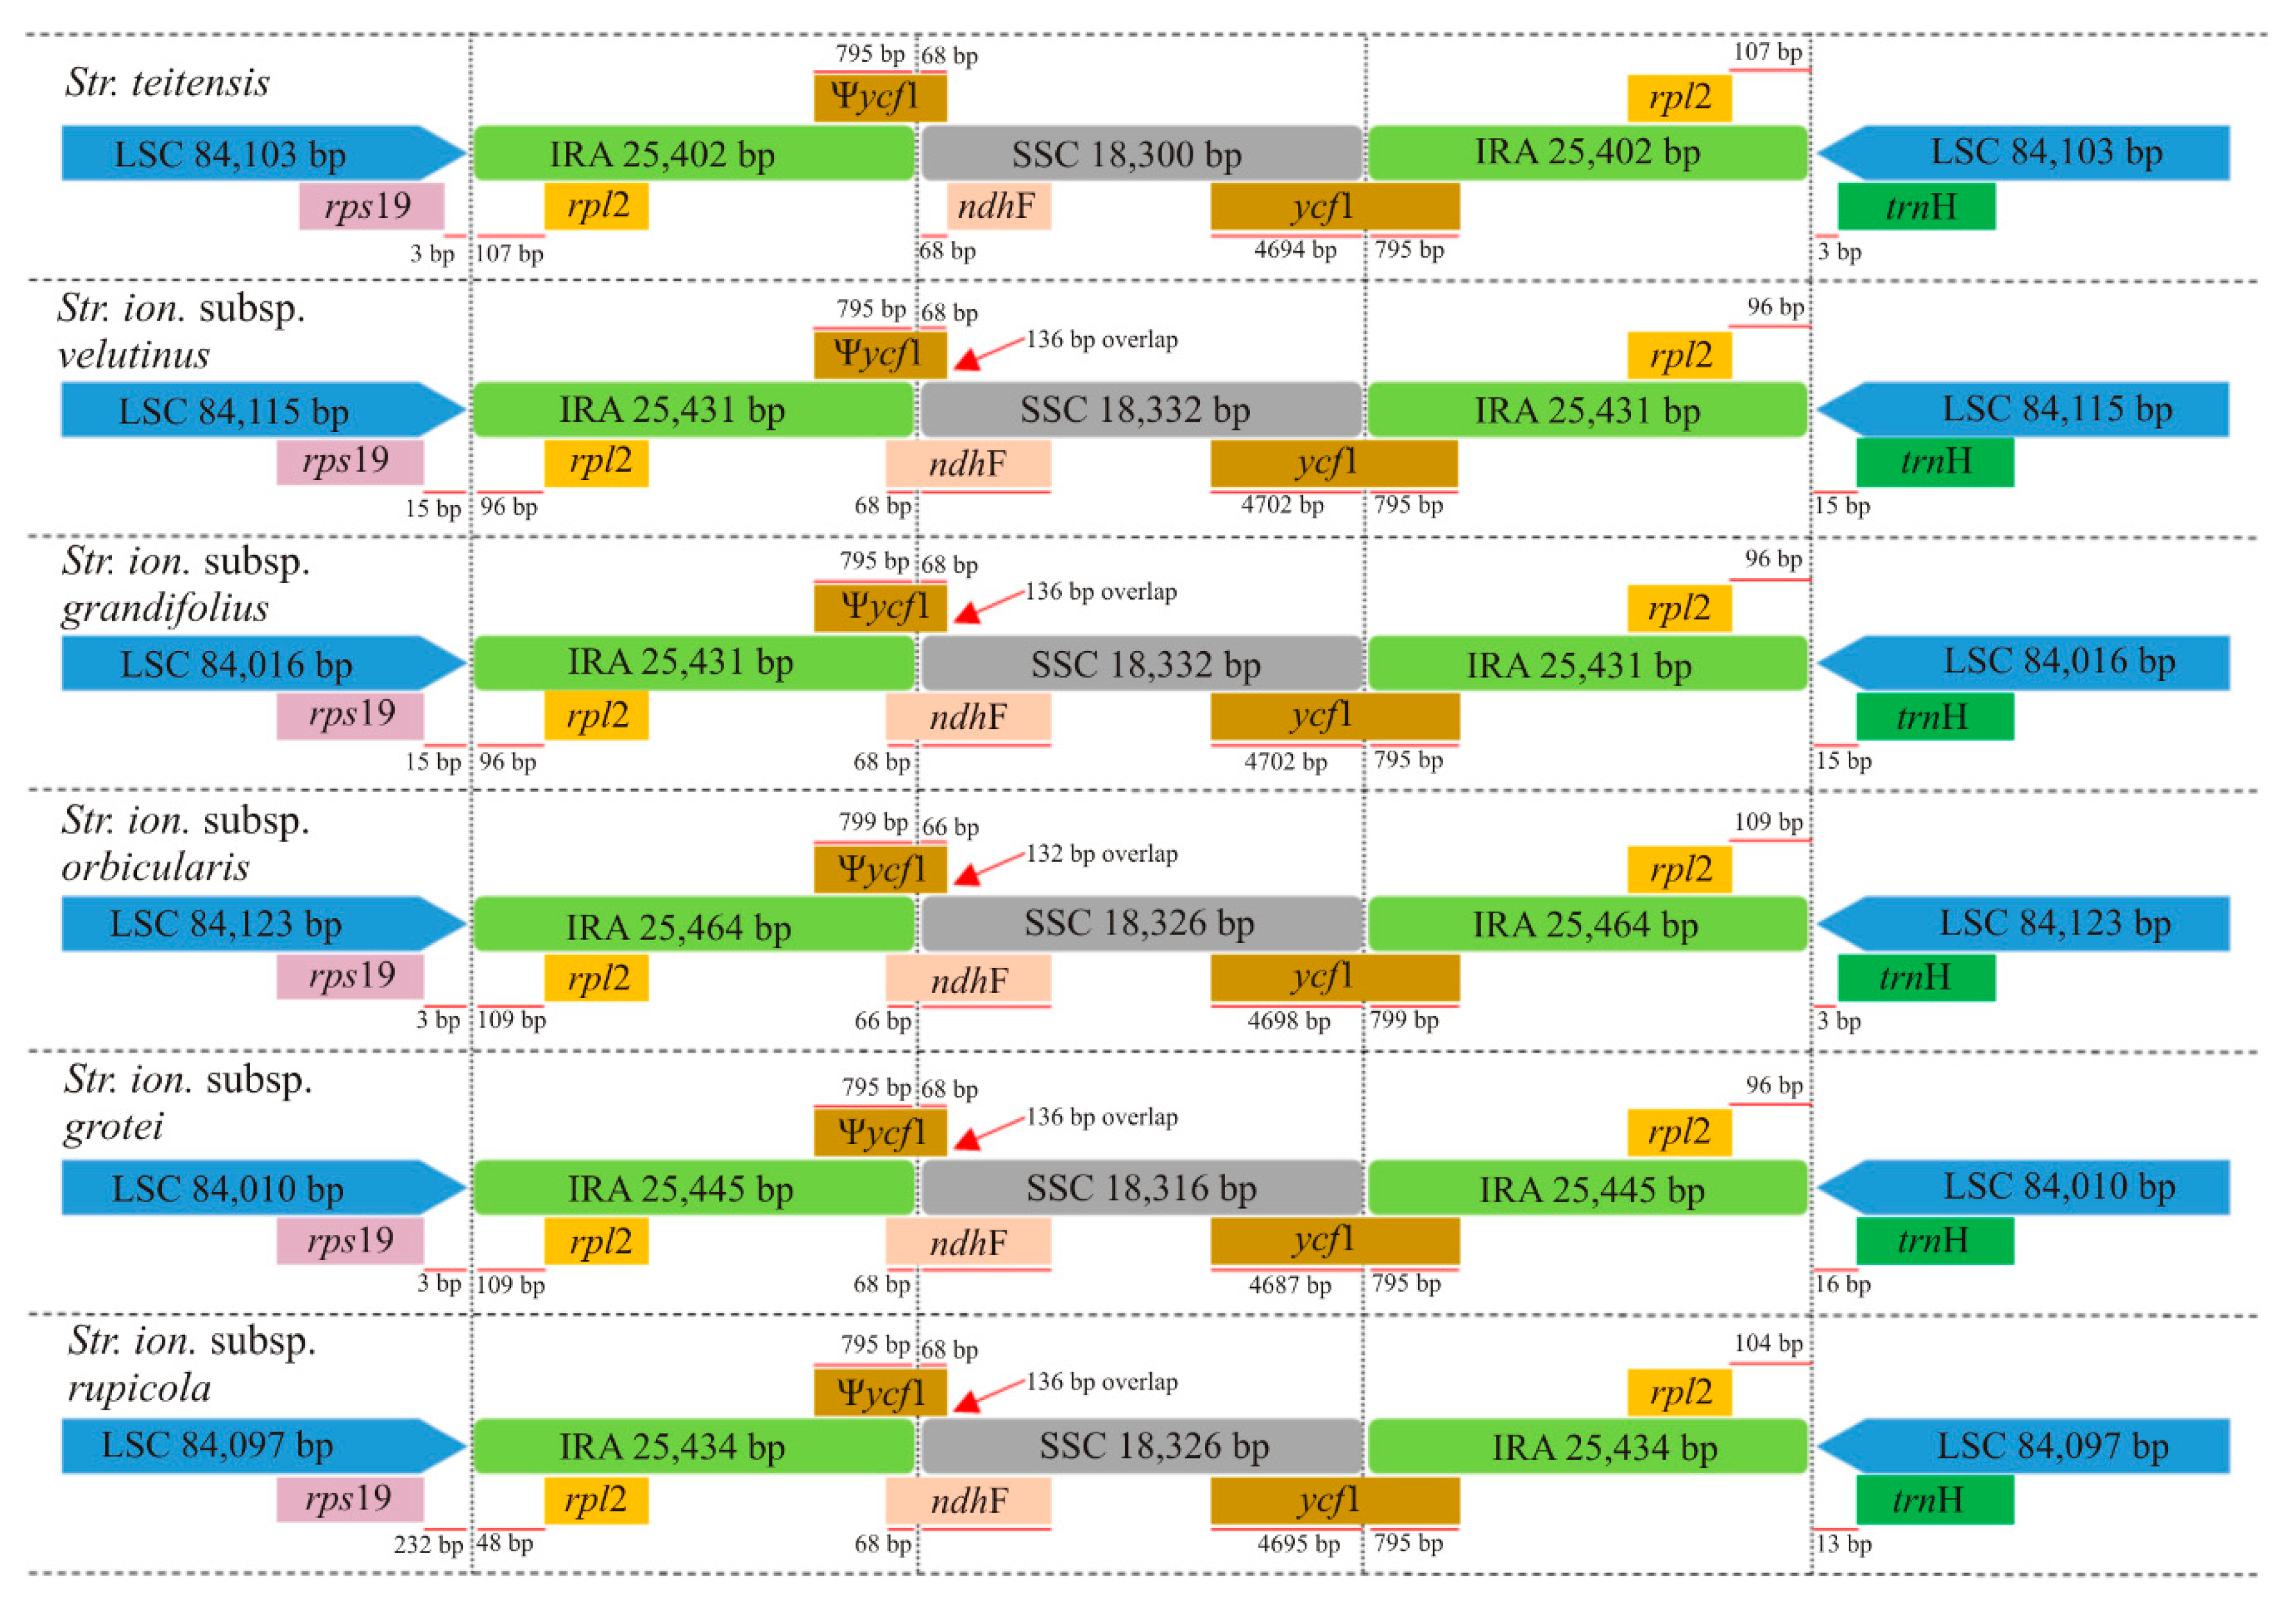
2.2. Comparison of Chloroplast Genome Structure in Sect. Saintpaulia

The structural alignment in Mauve revealed one synteny block (in red) with a conserved gene order, minimal structural disparity and no rearrangements among the six genomes (Figure 2). Further, within the Large and Small single copy regions (LSC and SSC), very minor sequence variations were observed, as exhibited by the red vertical lines in the genome blocks and the yellow vertical lines in the consensus sequence identity (green block). However, the Inverted Repeat (IR) regions were relatively more conserved, as displayed by the green block. Comparison of the genes present at the Inverted Repeat/ Single Copy (IR/SC) junctions (Figure 3) revealed that the Large Single Copy/ Inverted Repeat A (LSC/IRA) junction occurred between the rps19 and rpl2 genes for all species while the IRA/SSC was characterized by an overlap of the ycf1-ndhF genes, except in Str. teitensis in which the genes were next to each other. Further, the Small Single Copy/ Inverted Repeat B (SSC/IRB) junction was characterized by the ycf1 gene while the IRB/LSC junction occurred between the genes rpl2 and trnH. The SSC/IRB junction extended into the ycf1 gene creating a ycf1 pseudogene with a conserved length (795–799 bp) in the IRA/SSC junction. To conclude, all junctions had similar genes with only slight variations in the distance between the junctions and adjacent genes.

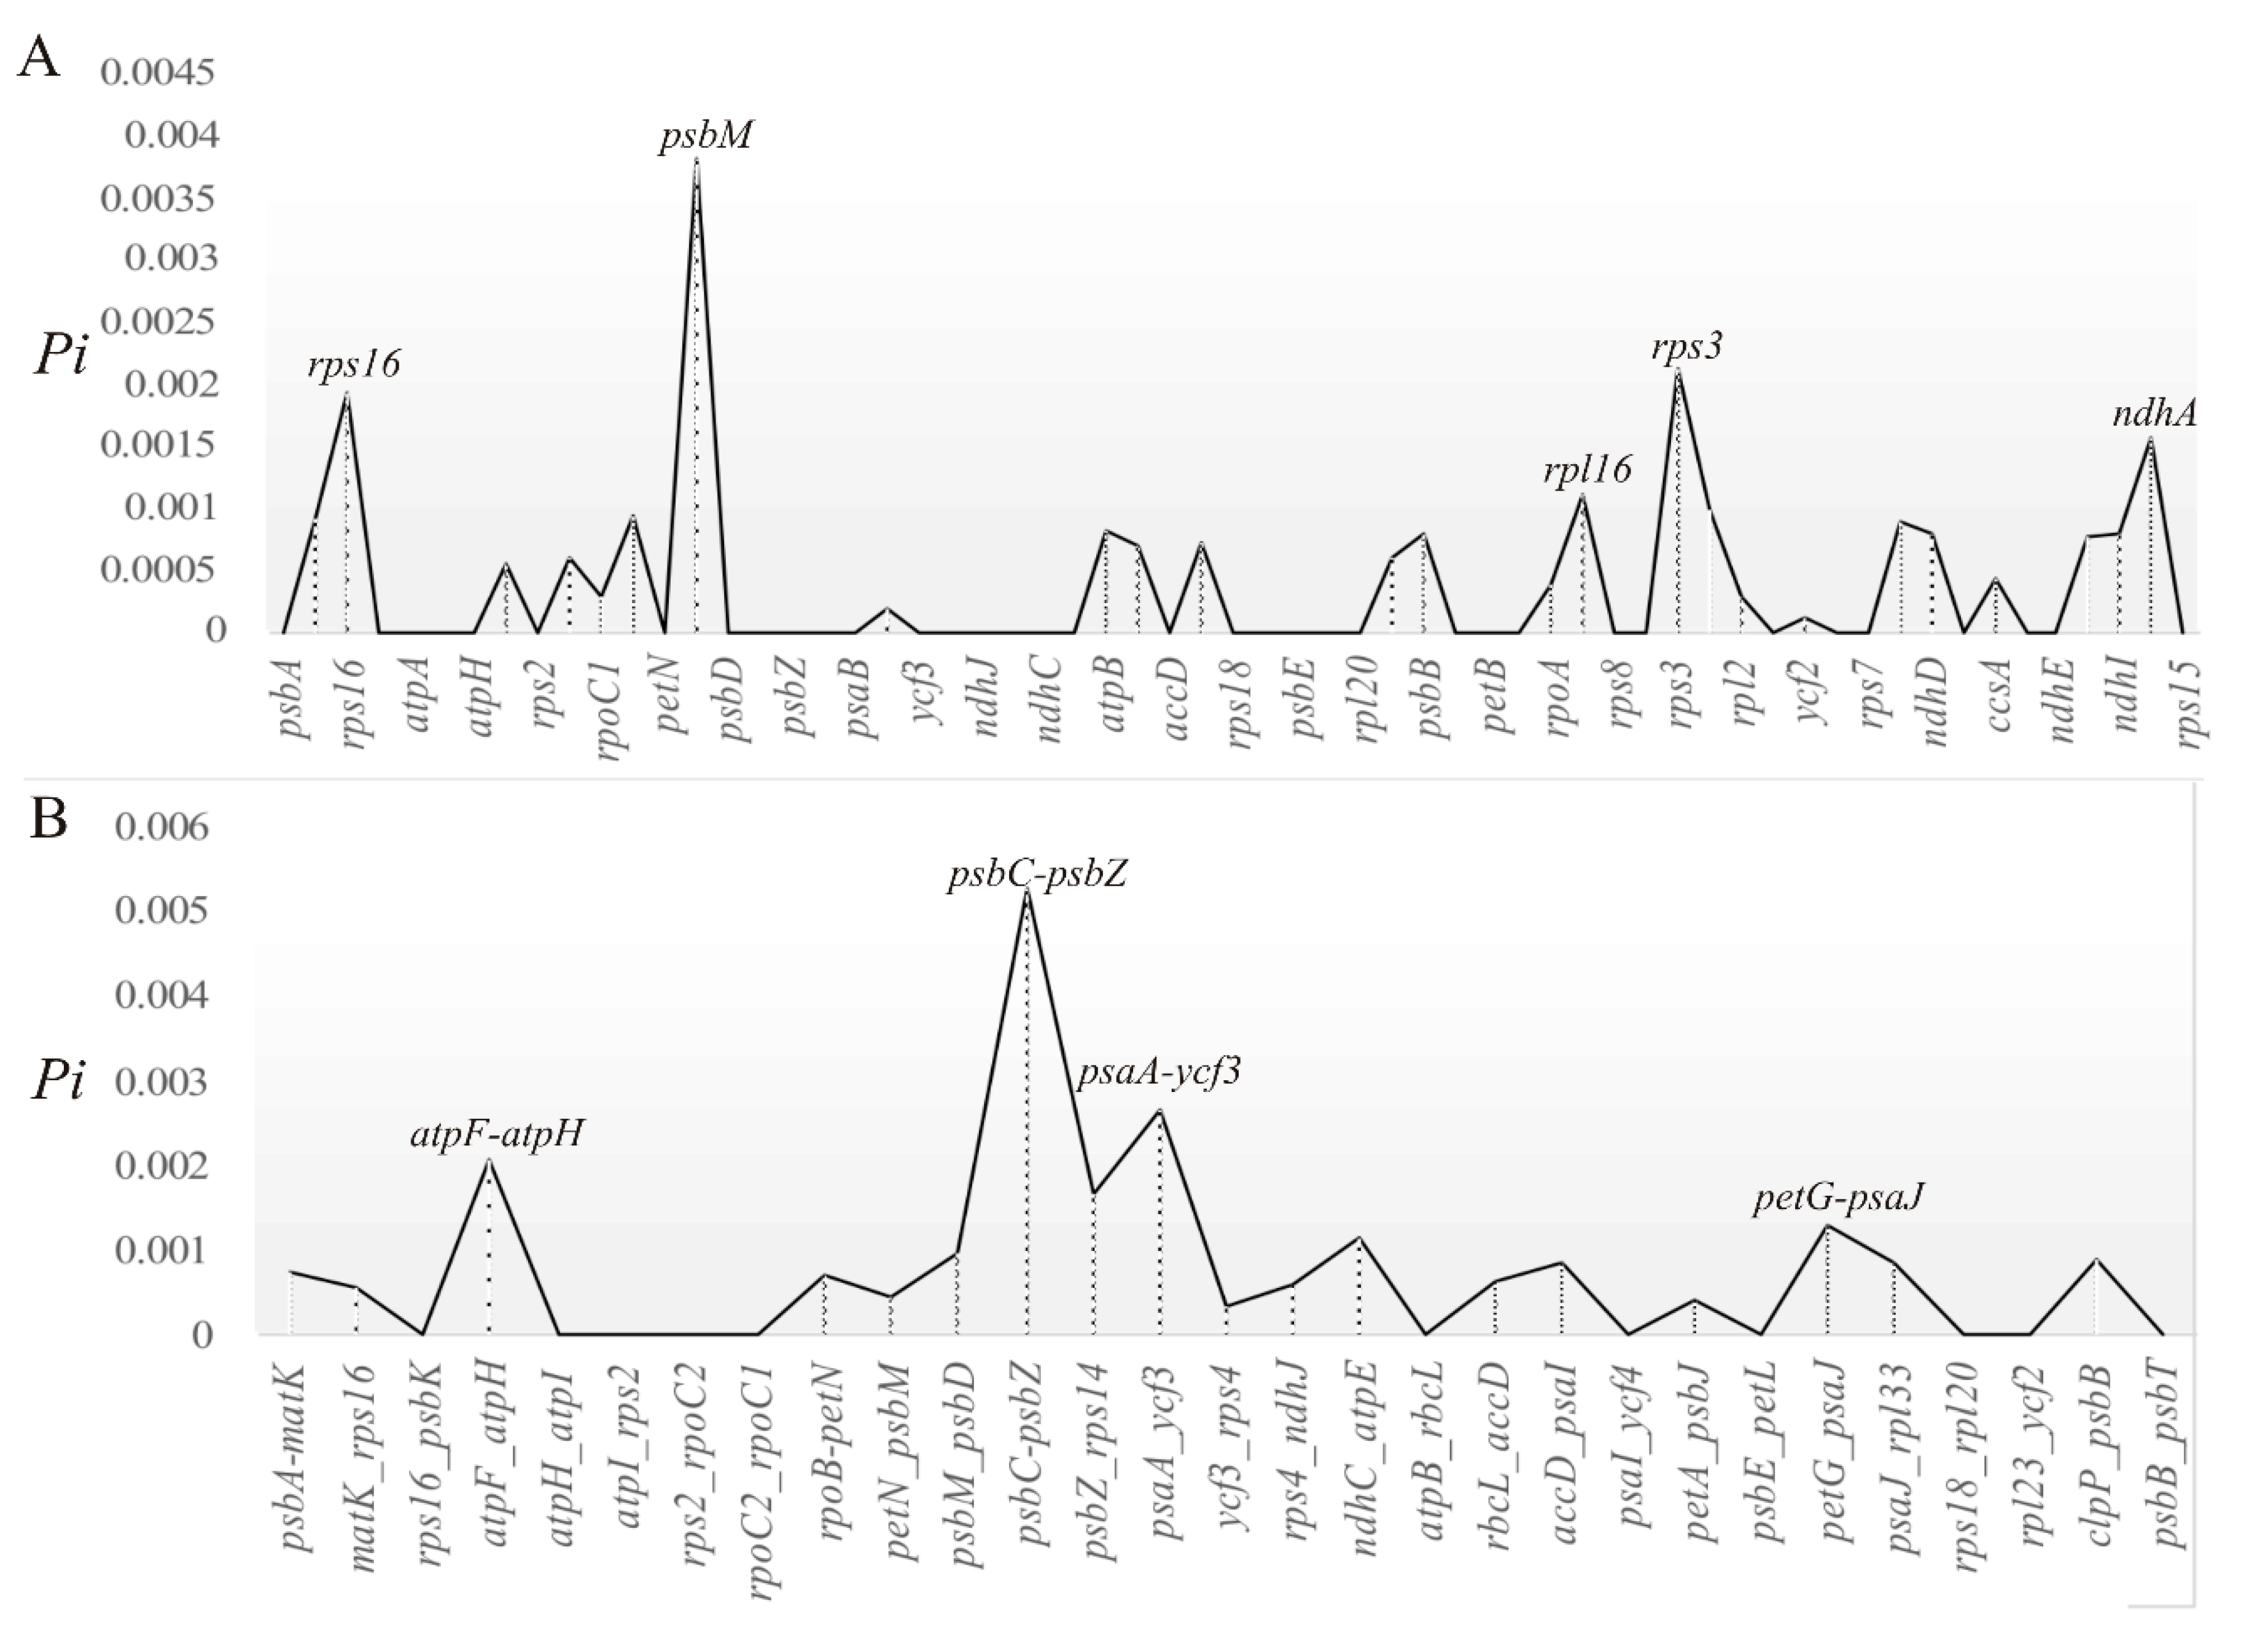
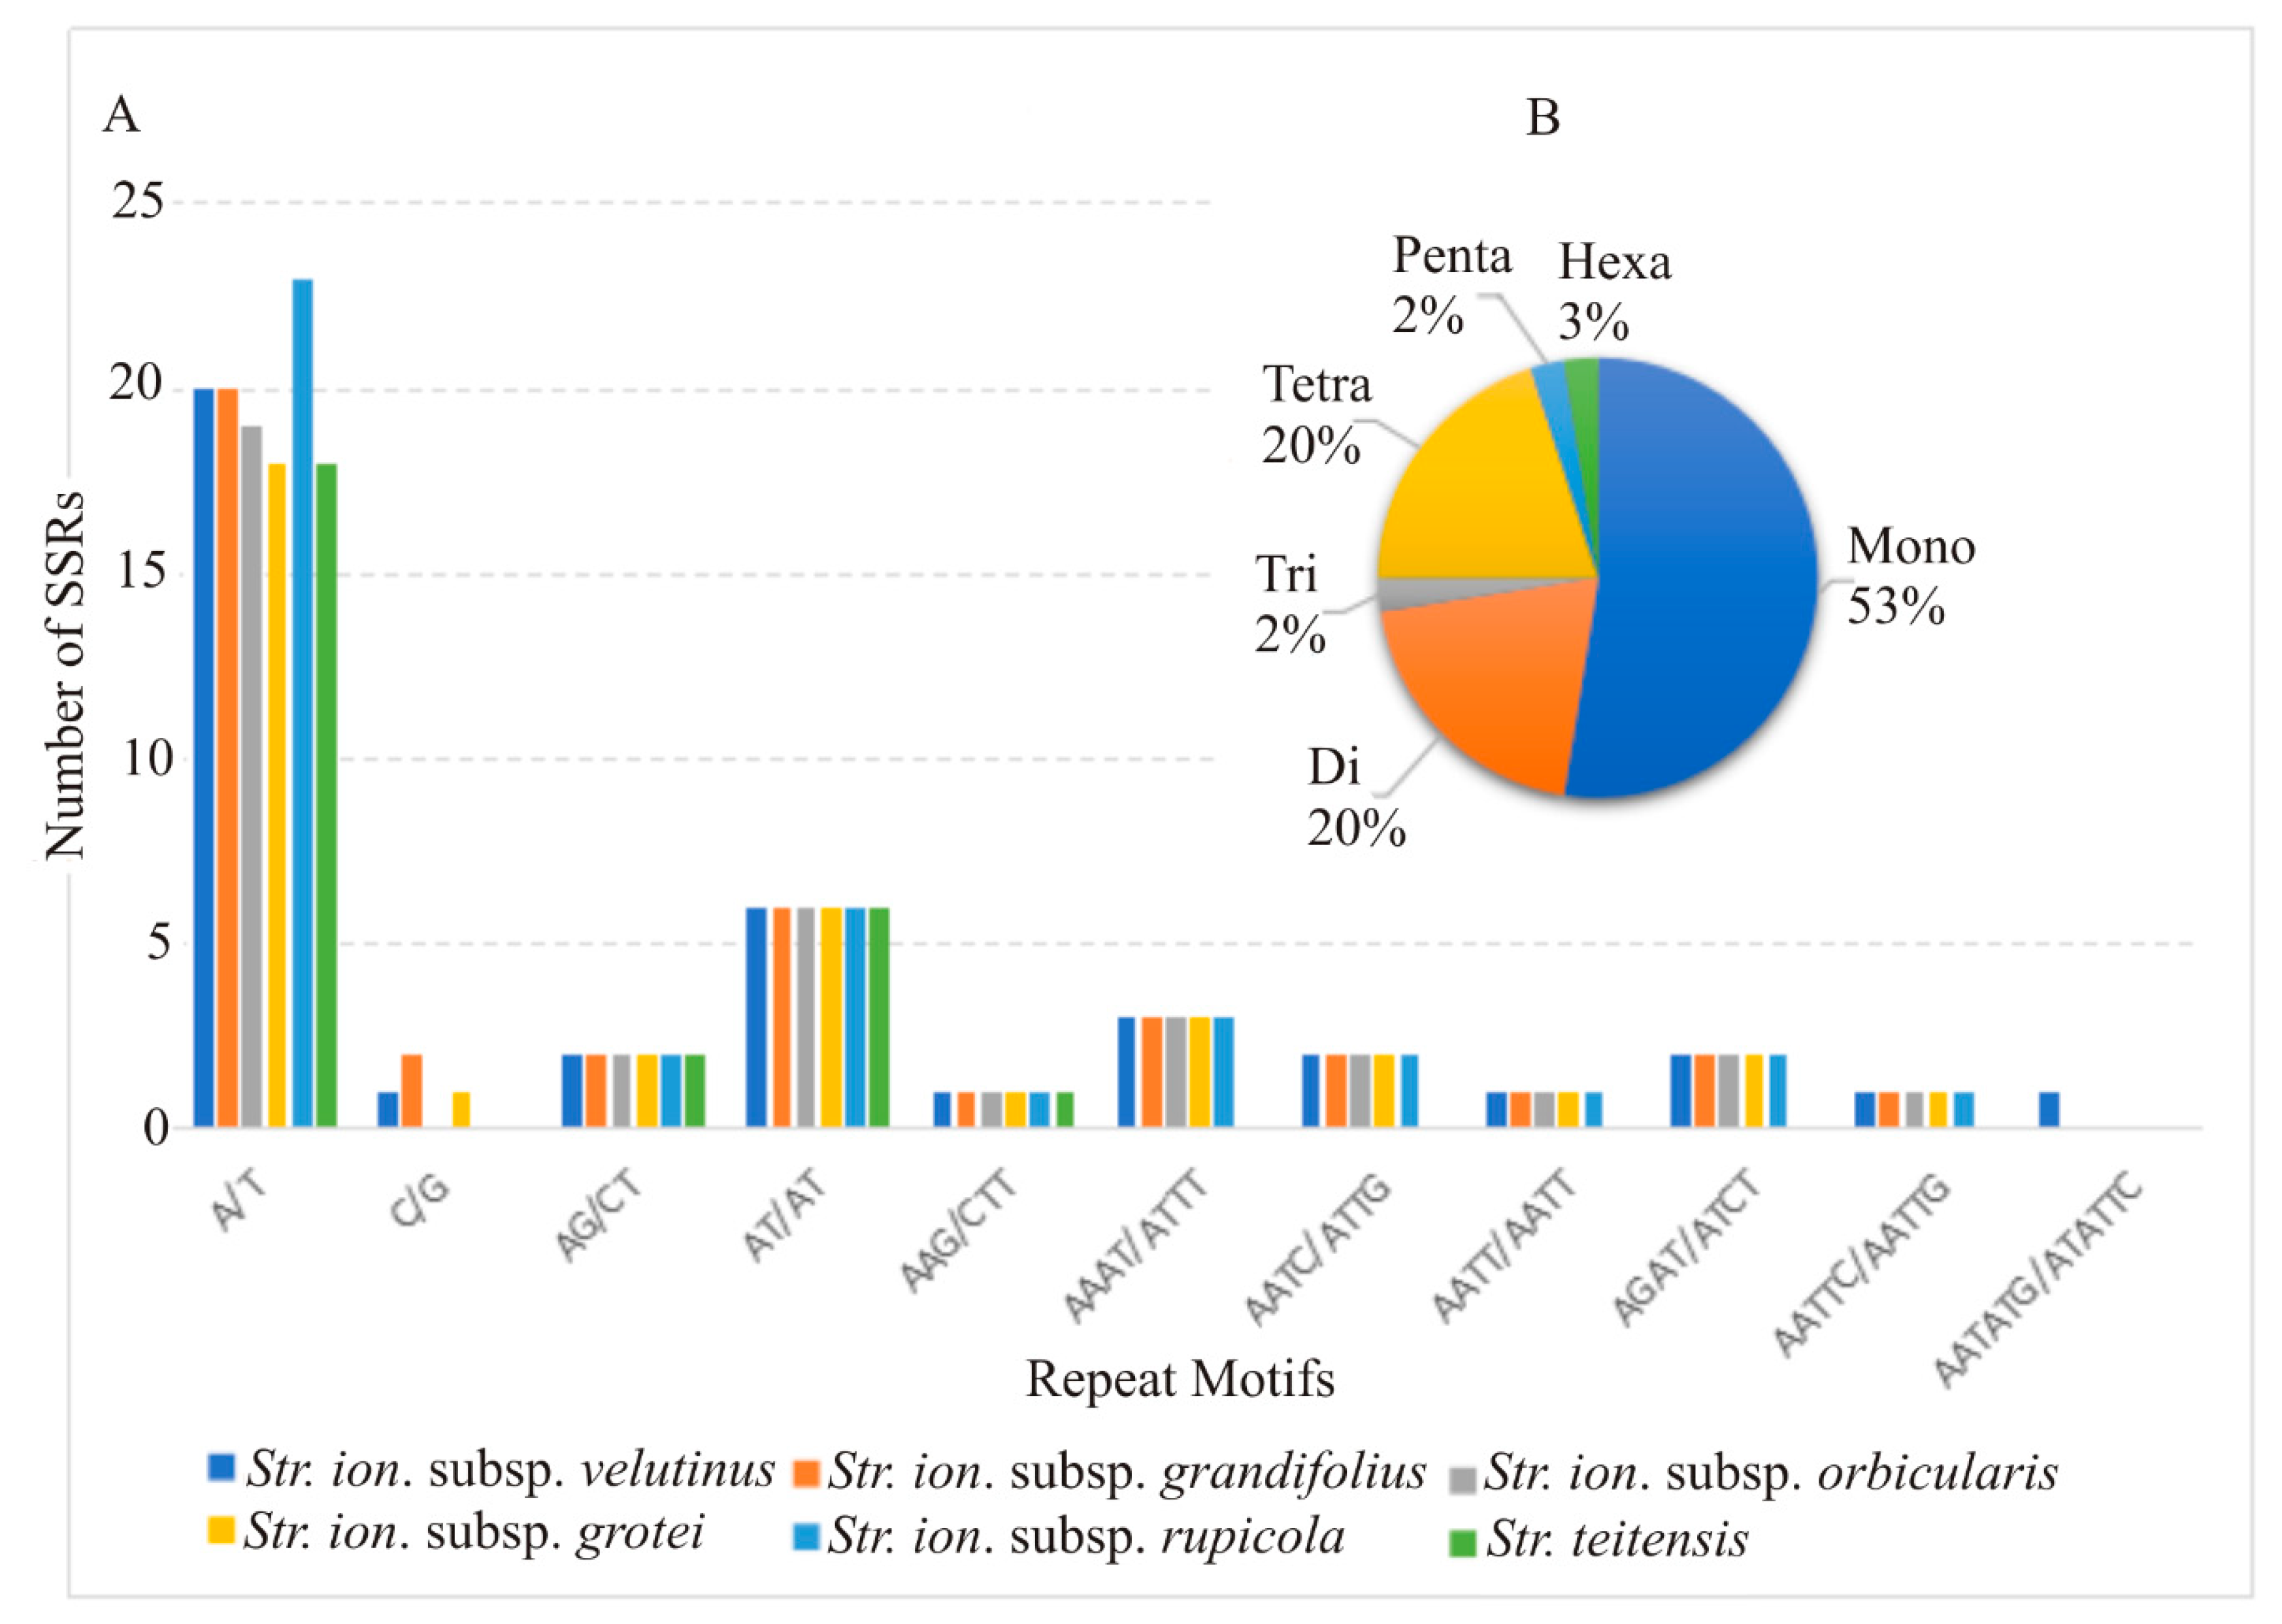
2.3. Divergent Hotspots and Simple Sequence Repeats (SSRs) in Str. ionanthus

The values of nucleotide variability (Pi) across the analyzed coding and intergenic sequences of the five subspecies ranged from 0 (majority) to 0.00526 (psbC-psbZ) (Figure 4), with a low average value (Pi = 0.00050). The total alignment file was 153,533 bp, with 152,813 sites (99.53%) being monomorphic while only 184 sites were polymorphic of which subsp. rupicola had the majority of Insertion and Deletions (InDels). Twenty-six Protein-Coding genes (PCGs) were observed to contain polymorphic sites, with only five genes having more than five sites (rps16_9, rpoC2_6, rpoB_6, ycf1_8 and ndhA_7). The majority of the polymorphic sites (169) were singleton variable sites and there were only 15 parsimony informative sites, representing a relatively low variation among the subspecies. Despite the low variation, ten regions exhibited some polymorphism (hereafter termed as divergence hotspots), including five regions with Pi > 0.002 (psbC-psbZ, psbM, psaA-ycf3, rps3 and atpF-atpH) and five PCGs with more than five polymorphic sites.
SSRs range from mono-to hexa-nucleotide repeat units which exhibit polymorphism even within one species and occur widely in plant genomes. Sect. Saintpaulia cp genomes exhibited small variation in the number of SSRs with two subspecies (Str. ionanthus subsp. velutinus and Str. ionanthus subsp. grandifolius) having 40 SSRs, two subspecies (Str. ionanthus subsp. orbicularis and Str. ionanthus subsp. grotei) having 37 SSRs while Str. ionanthus subsp. rupicola and Str. teitensis have 41 and 28 SSRs, respectively (Figure 5A). Further, the mononucleotides dominated, followed by both dinucleotides and tetranucleotides. while the Trinucleotides (2%), pentanucleotides (2%) and hexanucleotides (3%) were the minority (Figure 5B). The intergenic regions housed the majority (55–60%) of the SSRs, while the intron and coding sequences accounted for the approximately 40% remaining. The coding genes having SSRs included rpoC2, psbC, atpB, rpl22, ndhA and ycf1.

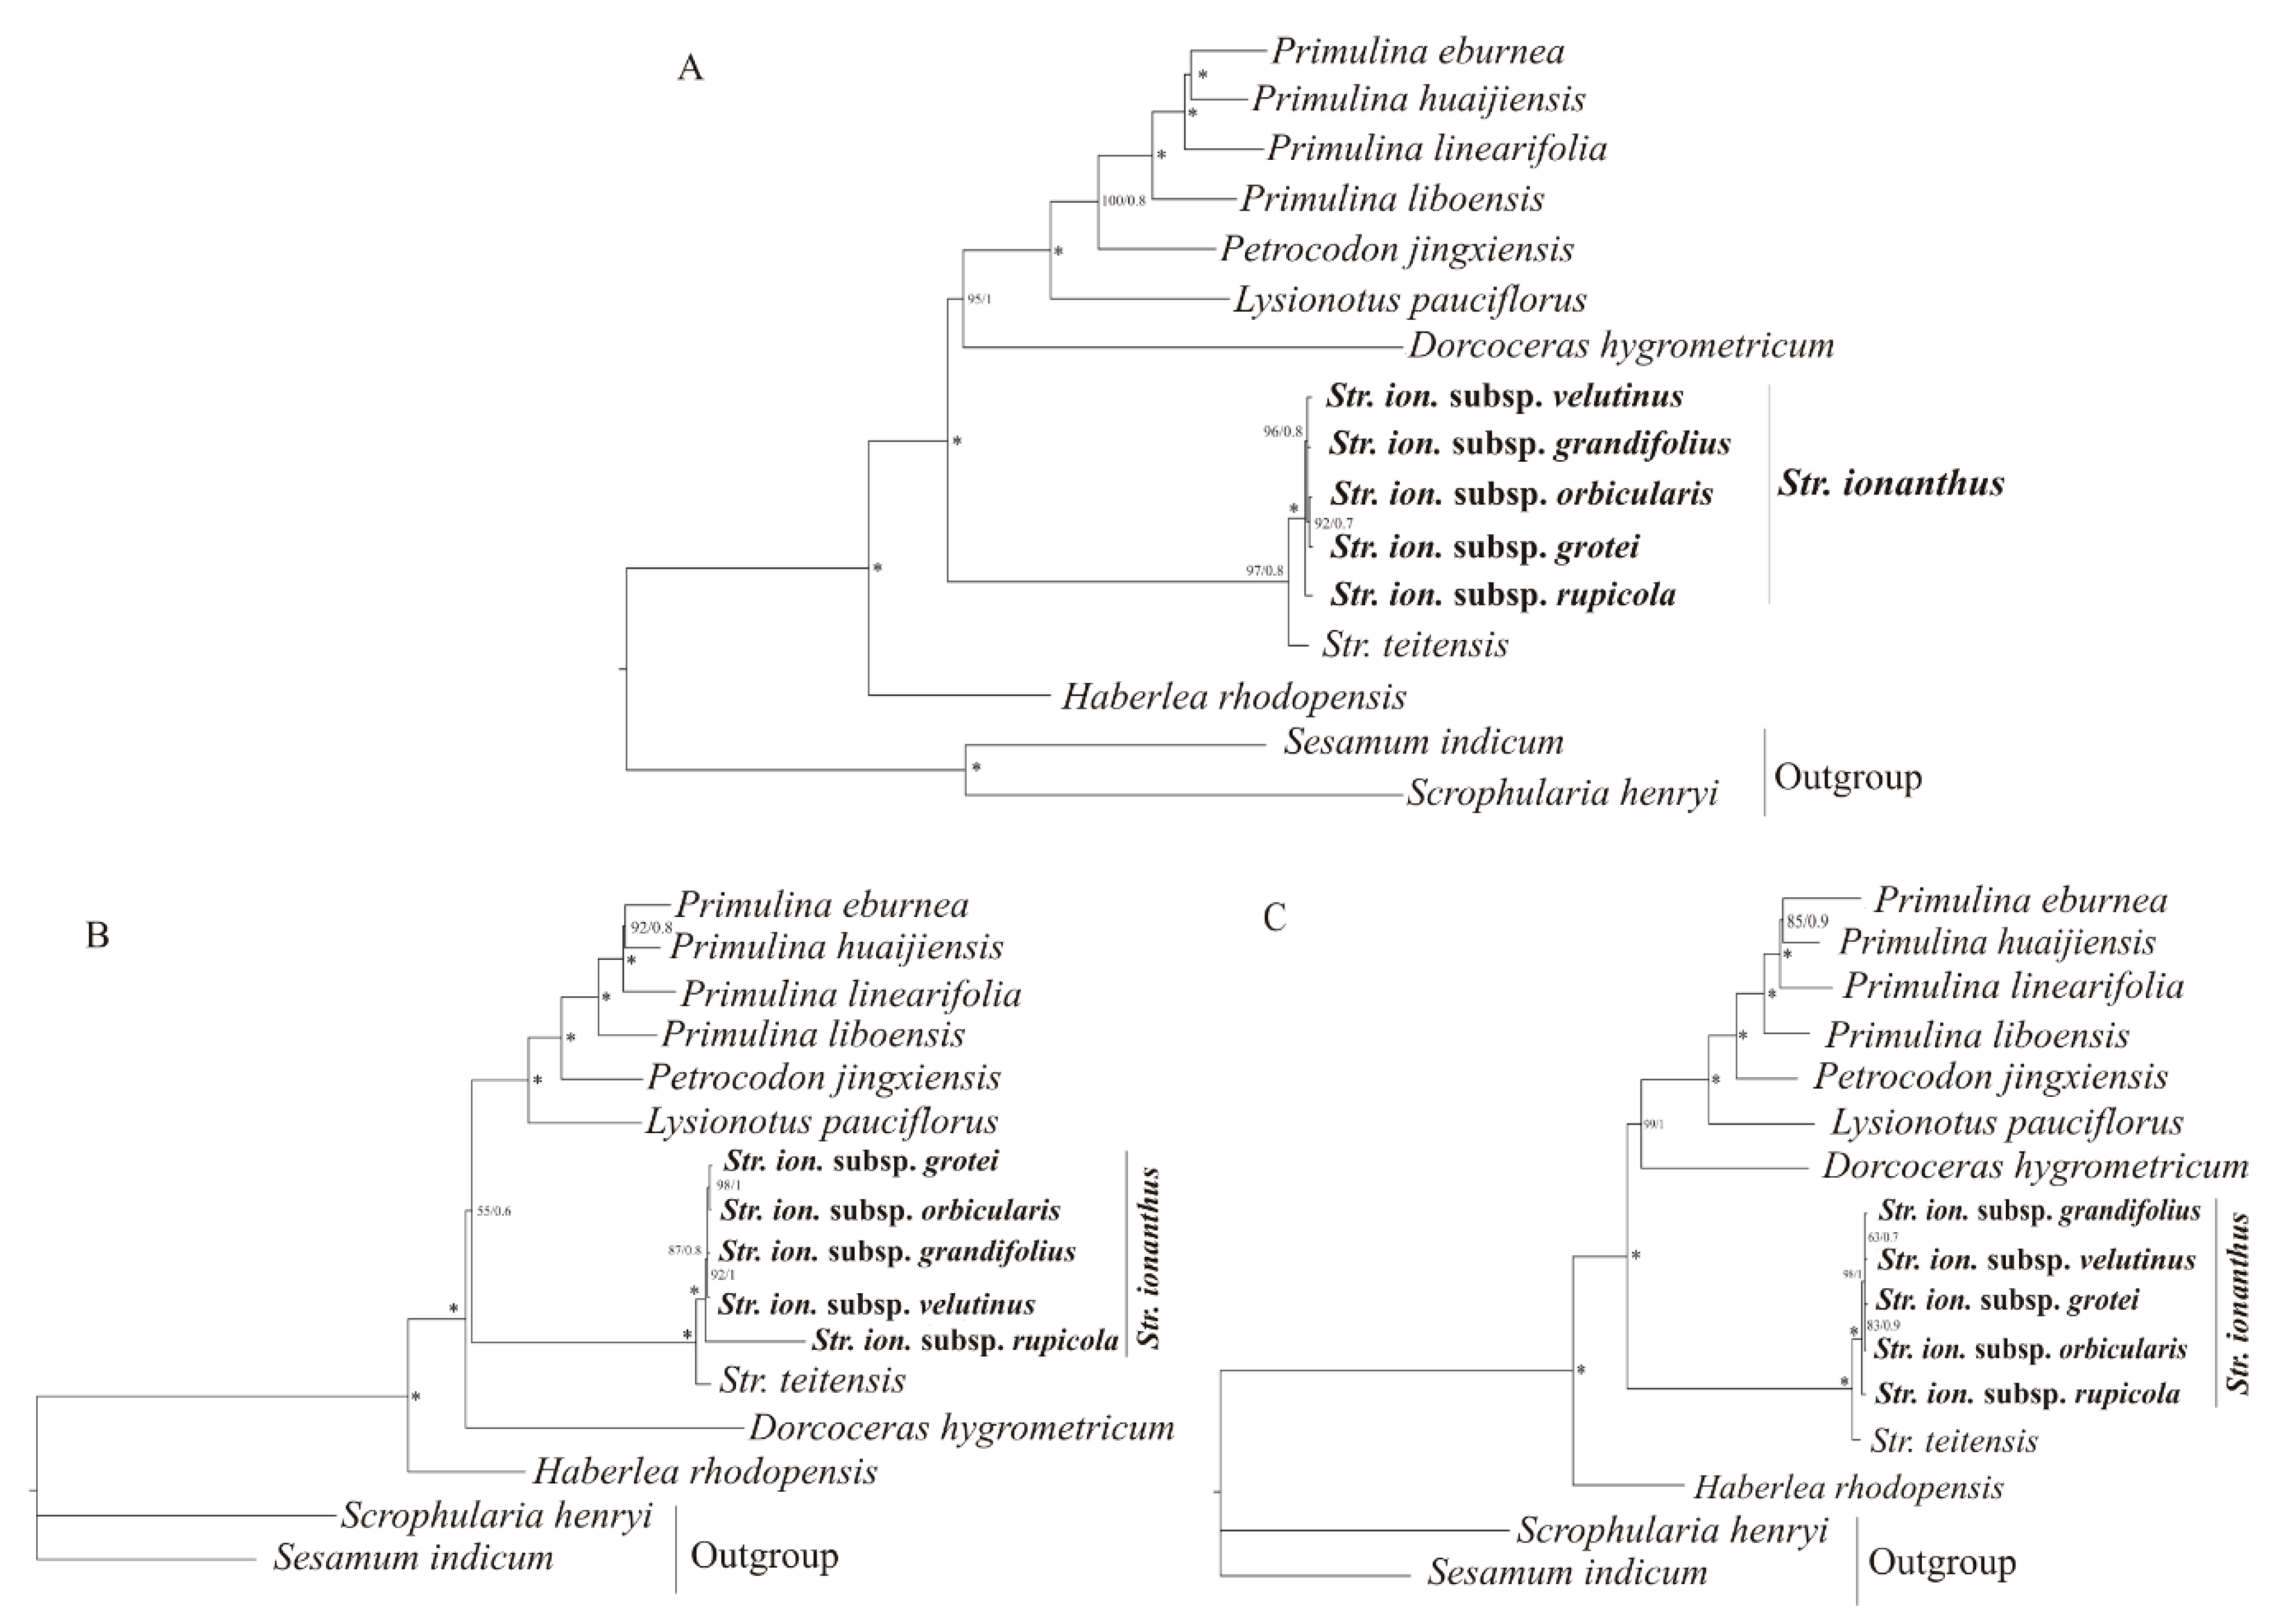
2.4. Phylogenetic Analysis

The phylogenetic relationship presented identical topology for both Maximum Likelihood (ML) and Bayesian Inference (BI) tree approaches, as shown in Figure 6. Regarding Gesneriaceae, Streptocarpus was closer to Dorcoceras and Lysionotus, while Petrocodon was closer to Primulina and Haberlea was distantly placed. The four species of Primulina displayed a close relationship with each other while Str. ionanthus genomes used here exhibited monophyly from Str. teitensis. Concerning the Str. ionanthus, subspecies rupicola exhibited a relative distinction from the other four, subsp. velutinus and subsp. grandifolius grouped together and were sistered to the grouping of subsp. orbicularis and subsp. grotei. Our data report a poor phylogenetic structure within Str. ionanthus, findings in line with some previous studies.

3. Discussion

3.1. Analysis of Genome Features

During this study, we sequence and compare the major features of five Str. ionanthus subspecies chloroplast genomes. Generally, the angiosperm chloroplast genome is considered to be conserved [15]. The Str. ionanthus taxa used here reveal the typical angiosperm structure with identical genes, gene order and no structural reconfigurations. The genomes exhibit a narrow size range (170 bp) and do not deviate from the first reported chloroplast genome in sect. Saintpaulia [21]. However, much lower size ranges have been reported in the Hosta (<85 bp) [22] and Pyrus hopeiensis (46 bp) [23] species and, thus, Str. ionanthus cp genomes can be termed as relatively variable.
Seen in the chloroplast genome, the Inverted Repeat (IR) region is reported to be stable [24] with border shifts contributing to the evolution of species, including variation in genome sizes [23,25]. Our study supports this, with Str. ionanthus subsp. orbicularis having the longest IR region and also being the largest of the five genomes in terms of complete genome size. The representative Str. ionanthus cp genomes in this study are characterized by similar genes in the Inverted Repeat/ Single Copy (IR/SC) boundaries, with slight variations in the length flanking or drifting away from the boundaries. Nonetheless, other reported Gesneriaceae genomes vary from Str. ionanthus in some junctions. The Large Single Copy/ Inverted Repeat A (LSC/IRA) occurs between rps19–rpl2 in sect. Saintpaulia and Harbelea [26], rpl22–rpl2 in Petrocodon [27] and inside rps19 in Primulina [28], Dorcoceras [29] and Lysionotus [30] genomes. Diversity within Gesneriaceae also is noted in the IRA/SSC junction with Str. ionanthus genomes being similar to Petrocodon, Dorcoceras and Lysionotus, by having an overlap of ycf1 and ndhF genes, and different from Str. teitensis, Haberlea and Primulina which have ycf1. However, the other two junctions are similar within Gesneriaceae.
Besides the similarity in the IR/SC junctions, the high genome synteny with minor variations reported in the Mauve alignment portray a conserved cp genome in Str. ionanthus. Accompanying the absence of observable structural variations, the minor variations exhibited by the red/yellow lines in the single copy regions could be attributed to the presence of Insertions and Deletions (InDels) in those regions, especially the non-coding regions, as reported in another study [31]. Mixed observations have been reported in angiosperm chloroplast genomes, with some exhibiting high variation and others being relatively conserved. Previous genomic analyses involving higher taxonomic ranks such as the order Dipsacales [32] or family Ranunculaceae [33] have reported substantially higher genome variations in terms of gene content, arrangement and structural rearrangements such as inversed regions. However, genomic exploration at the genera levels in Notopterygium [34], Camellia [24], Prunus [35], Meconopsis [36], just to mention a few, have demonstrated highly conserved chloroplast genomes among constituent species. Found in much lower taxonomic levels, studies involving four varieties of Arachis hypogaea (peanut) [31], seventeen individuals of Jacobaea vulgaris [37], two Ulmus americana (elm) genotypes among others, reveal very high cp genome similarities. Thus, the high genome similarity among Str. ionanthus subspecies is expected. Interestingly, some studies such as Pyrus cultivars [38] report a relatively high variability among low taxonomic ranks.

3.2. Divergence Hotspots in Str. ionanthus

Simple Sequence Repeats (SSRs) are important sources of information for genetic diversity and polymorphism testing [24] due to motif variations, a high number of repetitions, and genome-wide distribution [39]. The distribution of SSRs in cp genomes is mostly concentrated in the intergenic spacers and intron regions rather than in the genes [40]. This is the case in our study where the number of SSRs in the intergenic regions are the majority (55–60%), while the introns and coding sequences contribute approximately 20% each. Since the chloroplast is conserved in angiosperms, chloroplast SSRs are transferrable across species and genera [24] and, thus, the SSR data explored in the present study provide useful information for the design of phylogenetic markers for future use. Though the number of SSRs is low, the Adenine/ Thymine (A/T) motifs vary within Str. ionanthus, with the subspecies rupicola having the highest quantity.
The overall nucleotide variability in Str. ionanthus cp genomes is comparatively lower (Pi = 0.0006) than in some other reported taxa (Cardiocrinum: Pi = 0.003; Papaver: Pi = 0.009) [41,42], an expected result in this case of a lower taxonomic level. Insertions and Deletions (InDels) are known to contribute the most microstructural variation in chloroplast genomes [23]. Here, InDels are attributed to the polymorphic sites detected in the ten divergent regions (psbC-psbZ, psaA-ycf3, atpF-atpH, psbM, rps3, rps16, rpoC2, rpoB, ycf1 and ndhA). Although these divergence regions were discovered in Str. ionanthus, the majority of them occur in Str. ionanthus subsp. rupicola which limits their ability to separate the Usambara taxa. However, this result should be interpreted with caution and more sampling could reveal interesting details about the variation of these genome regions. The extremely high polymorphism of Str. ionanthus subsp. rupicola may be partly due to long-term isolation of the subspecies from the others.
The observed low variability means that a majority of the genome regions are of limited capacity for phylogenetic studies, thus previously applied chloroplast regions could not resolve Str. ionanthus classification. The coding and non-coding sequences have varied substitution rates [23]. Non- coding regions are less controlled by function and have relatively higher nucleotide substitution rates causing rapid evolution, thus, are more preferred for phylogenetic studies in lower taxonomic level taxa [23,43]. Similar to reports in most angiosperms [44], the intergenic regions in Str. ionanthus exhibit higher nucleotide diversity than the coding regions, with the most variable region being psbC-psbZ. Studies in higher plants have reported a high variability of matK, rps16 and rbcL [45] and other non-coding regions [46,47], thus are proposed for phylogenetic studies. Analysis of three Pyrus specie chloroplast genomes [48] identify four divergence hotspots (petN-psbM, psbM-trnD, rps4-trnT-trnL, and psaI-ycf4) having an average variation of Pi = 0.00054. However, in our study, most of these regions exhibit very low or no polymorphism. The divergence hotspots detected here could be tested further for utility in the phylogenetic analyses using all subspecies and more samples. Our results are valuable for future studies on estimating the variation within Str. ionanthus.

3.3. Phylogenetic Relationship within Str. ionanthus

The relative stability of molecular data makes them useful in estimating phylogenetic relationships among species [24]. Despite making great milestones in sect. Saintpaulia phylogenetics, previous phylogenetic studies [1,7] were unable to obtain a high-resolution and strongly-supported phylogeny in Str. ionanthus, although these studies applied few markers. Here, we report the first genome-scale phylogenetic analysis in sect. Saintpaulia by comparing the phylogenetic relationship among the six sequenced taxa and within Gesneriaceae. However, we admit the fact that our study might not make entirely conclusive remarks on Str. ionanthus phylogeny due to the limited number of genomes. Nevertheless, our observations are consistent with most earlier studies and sets the blueprint for future phylogenomic analyses in understanding Str. ionanthus.
Rapid evolution leads to poorly-resolved phylogenies [49] and produce short branches with little nucleotide polymorphism observed, which imply a recent divergence. Previously, molecular dating studies on Str. ionanthus using both nuclear [4] and chloroplast (Kyalo, unpublished) genes have demonstrated a case of recent diversification (<2 million years ago). This could explain the short branches observed in our study. However, the high bootstrap support in the present study shows the ability of complete genomes to improve the phylogenetic resolutions in plant evolution [50,51] and adding more genomes to this complex can produce a conclusive phylogeny of Str. ionanthus. Str. ionanthus subsp. rupicola is presented as distinct from the other four subspecies in all datasets used here, although this is not a new finding as similar outcomes have been reported in previous studies. This can be geographically explained in that Str. ionanthus subsp. rupicola occurs in Kenya while the other four subspecies are distributed in the Usambara mountains (Tanzania).

4. Materials and Methods

4.1. Sampling, Laboratory Experiments and Sequencing

We collected leaf samples of five subspecies of Str. ionanthus (illustrated in Figure 7) from the Usambara mountains (Tanzania) and Kilifi (Kenya) based on the countries’ laws governing collection and exportation of biological samples for research purposes. The samples were dried in silica gel for further laboratory experiments. Genomic DNA was extracted from each leaf sample using Plant DNAzol Reagent (Life Feng, Shanghai) following the manufacturer’s instructions. Sequencing was done using the Illumina HiSeq 2000 platform from the Tsingke company (Wuhan, China), obtaining raw reads.

4.2. Assembly and Gene Annotation

Filtration was performed on the raw Illumina reads using an NGS QC tool kit [52] to eliminate low-quality reads. The resultant clean reads of the five subspecies were mapped alongside the reference chloroplast genome of Str. teitensis (GenBank Accession: MF596485) using the program Bowtie ver. 2.2.6 [53], following the default settings. Assembly of the chloroplast genome reads into contigs was done by Velvet ver. 1.2.10 [54] set at k-mer of 75, 85, 95 and 105. The verified contigs were subjected to BLAST and library searches and connected into complete genomes in SPAdes ver. 3.10.1 [55] with parameters set to default. The products of the Assembly were visualized and manually corrected in Bandage ver. 8.0 [56].
Genome annotation was done using the GeSeq application [57], an online tool in the Chlorobox database (https://chlorobox.mpimp-golm.mpg.de/index.html), combined with manual corrections to confirm the start and stop codons. The program tRNAscan-SE ver. 1.21 [58] was used to verify the identified tRNA genes. The genome maps were developed in the Organellar Genome Draw program (OGDRAW) ver. 1.3.1 [59]. Classification of the annotated genes according to functionality was conducted with reference to the online CpBase database (https://rocaplab.ocean.washington.edu/tools/cpbase/). The annotated genomes were submitted to the National Center for Biotechnology Information (NCBI) GenBank database (Accession numbers provided in Table 1).

4.3. Genome Comparison

Genome features such as the expansion or contraction in the Inverted Repeat/ Single Copy (IR/SC) junctions, structural re-organization and the loss or pseudogenization of genes have been used in previous studies to inform an evolutionary history of species [60]. Comparison of these features was performed among the available six sect. Saintpaulia cp genomes (Table 1). The IR/SC junctions were analyzed to detect possible expansion or contraction through identification of the genes present or adjacent to the junctions. To determine the gene order and identify possible structural re-arrangements among the six cp genomes, multiple alignment of the genomes was done using the program Mauve [61]. During this analysis, progressiveMauve was set as the alignment algorithm, full alignment was automatically calculated, and the genomes were assumed to be non-collinear.

4.4. Identification of Divergent Hotspots and Simple Sequence Repeats (SSRs)

Intraspecific variations within the five Str. ionanthus genomes were identified using nucleotide diversity values (Pi) of the aligned sequence, executed in DNA Sequence Polymorphism (DnaSP) ver. 6.0 [62]. The settings for DNA polymorphism analysis were a window length of 800 bp and the step size set to 200 bp. Further, this analysis narrowed to check the variability of coding genes and the intergenic regions. The results indicated similar variable peaks and, thus, the graphs for coding genes and intergenic regions are presented here. We also estimated the number of polymorphic sites in each of the 62 protein coding genes with DnaSP ver. 6.0. Mutations are key variants which can lead to polymorphism among taxa. Here, mutations among the five genomes of Str. ionanthus were evaluated by analyzing the number of Insertions and Deletions (InDels) using DnaSP and, eventually, confirmed manually from the aligned sequences.
Simple Sequence Repeats (SSRs) were identified from the six sect. Saintpaulia genomes using MISA (Microsatellite Identification tool) on the web version [63]. The selection criteria were minimum repeat thresholds of 10, 5, 4, 3, 3 and 3 for mononucleotide, dinucleotide, trinucleotide, tetranucleotide, pentanucleotide and hexanucleotide repeats, respectively.

4.5. Phylogenetic Analysis

Since the focus of this study was on understanding Str. ionanthus, the phylogenetic relationship was explored at the family level using the other nine Gesneriaceae chloroplast genomes and two outgroups already deposited in the National Center for Biotechnology Information (NCBI) (Table S1). We applied both Maximum Likelihood (ML) and Bayesian Inference (BI) approaches using three datasets—the complete genome sequences, 62 protein coding gene sequences and 30 intergenic spacer sequences. The sequences were aligned in Multiple Alignment using Fast Fourier Transform (MAFFT) [64]. The ML analysis was implemented in IQ-TREE ver. 1.6.1 [65], with the substitution model chosen by ModelFinder [66]. Based on the Bayesian Information Criterion (BIC), the best-fitting models for the ML analyses were TVM + F + R2 for both complete genomes and intergenic spacers, and GTR + F + R2 for coding genes. The branch supports were estimated with 5000 bootstrap replicates and 1000 maximum iterations via the UltraFast Bootstrap approximation [67]. The BI analysis was conducted in MrBayes ver. 3.2.6 [68] by running four chains for two million generations. Sampling of the trees was done every 1000 generations, with the first 25% of the sampling being discarded as burn-in while the remaining were used to construct a 50% majority rule consensus tree. The best-fitting substitution models were GTR + F + I + G4 for complete genomes, intergenic spacers and GTR + F + G4 coding genes, respectively. The output trees were visualized in FigTree ver. 1.4.2 (http://tree.bio.ed.ac.uk/software/figtree/).

5. Perspectives on Streptocarpus ionanthus Research

It is undoubtedly crucial to expound on the genetic relationships within Str. ionanthus to understand the species evolution and inform development of horticultural cultivars. We performed comparative analysis to estimate the level of variation in gene arrangement, mutation spots, repeat sequences and phylogenetic relationships among five Str. ionanthus taxa and other Gesneriaceae. The majority of the phylogenetic markers developed as barcodes for angiosperm classification have proven useful in resolving phylogenetic relationships in higher taxonomic levels but are rarely informative at lower levels. Seen in Str. ionanthus, the nine subspecies exhibited poor resolutions and mixed signals in previous phylogenies which used few molecular markers. No clear phylogenetic distinction has been reported among the subspecies, except subspecies rupicola which exhibits a clear monophyly within the complex. This implies a case of recent divergence in Str. ionanthus, especially in the Usambara mountains taxa. To the best of our knowledge, this study presents the first genome-scale analysis in the group and the findings exhibit a close phylogenetic relationship and low sequence variation among the five subspecies investigated. However, our study identified some divergent hotspots which could be explored for polymorphism with more sampling and applied to shed more light on the evolution of Str. ionanthus. Our work can be a blueprint for progressive molecular research in Str. ionanthus, especially phylogenomic analysis which should incorporate the entire species’ taxon representation and increased sampling for each taxon. To conclude, this study provided a first glimpse into the evolution of Str. ionanthus complex using a phylogenomic approach and opened the species to more research opportunities.

Supplementary Materials

The following are available online at https://www.mdpi.com/2223-7747/9/4/456/s1, Table S1: Species used in the phylogenetic analysis.

Author Contributions

Conceptualization, C.M.K., G.-W.H., I.M. & Q.-F.W.; funding acquisition, G.-W.H. and Q.-F.W.; methodology, C.M.K, G.-W.H. and Q.-F.W.; supervision, G.-W.H., I.M. & Q.-F.W.; formal analysis, C.M.K., E.M.M. and Z.-Z.L.; writing—original draft preparation, C.M.K; writing—review and editing, C.M.K. and E.M.M. All authors have read and agreed to the published version of the manuscript.

Funding

This research was funded by National Natural Science Foundation of China (31970211), the Backbone Talents Project of Wuhan Botanical Garden, CAS (Y655301M01) and Sino-Africa Joint Research Center, CAS (SAJC201614).

Acknowledgments

We acknowledge one anonymous reviewer for his supportive ideas and comments to make this work better. We acknowledge the support of Tanzania Commission for Science and Technology (COSTECH), Tanzania Forest Services (TFS) Agency, Kenya Wildlife Service (KWS) and Kenya Forest Service (KFS) by offering the research permits.

Conflicts of Interest

The authors declare no conflict of interest. The funders had no role in the design of the study; in the collection, analyses, or interpretation of data; in the writing of the manuscript, or in the decision to publish the results.

References

  1. Nishii, K.; Hughes, M.; Briggs, M.; Haston, E.; Christie, F.; DeVilliers, M.J.; Hanekom, T.; Roos, W.G.; Bellstedt, D.U.; Möller, M. Streptocarpus redefined to include all Afro-Malagasy Gesneriaceae: Molecular phylogenies prove congruent with geographical distribution and basic chromosome numbers and uncover remarkable morphological homoplasies. Taxon 2015, 64, 1243–1274. [Google Scholar] [CrossRef]
  2. Afkhami-Sarvestani, R.; Serek, M.; Winkelmann, T. Interspecific crosses within the Streptocarpus subgenus Streptocarpella and intergeneric crosses between Streptocarpella and Saintpaulia ionantha genotypes. Sci. Hortic. 2012, 148, 215–222. [Google Scholar] [CrossRef]
  3. Kolehmainen, J.; Korpelainen, H. Morphotypes, varieties, or subspecies?: Genetic diversity and differentiation of four Saintpaulia (Gesneriaceae) morphotypes from the East Usambara Mountains, Tanzania. Bot. J. Linn. Soc. 2008, 157, 347–355. [Google Scholar] [CrossRef]
  4. Dimitrov, D.; Nogues-Bravo, D.; Scharff, N. Why do tropical mountains support exceptionally high biodiversity? The Eastern Arc mountains and the drivers of Saintpaulia diversity. PLoS ONE 2012, 7, e48908. [Google Scholar] [CrossRef] [PubMed] [Green Version]
  5. Martins, D.J. Pollination Observations of the African Violet In the Taita Hills, Kenya. J. East Afr. Nat. Hist. 2008, 97, 33–42. [Google Scholar] [CrossRef]
  6. IUCN SSC East African Plants Red List Authority 2014. Saintpaulia ionantha. The IUCN Red List of Threatened Species 2014: e.T158153A763135. https://dx.doi.org/10.2305/IUCN.UK.2014-1.RLTS.T158153A763135.en. Downloaded on 07 April 2020. Available online: https://www.iucnredlist.org/species/158153/763135(accessed on 3 April 2020).
  7. Moller, M.; Cronk, Q.C. Phylogeny and disjunct distribution: Evolution of Saintpaulia (Gesneriaceae). Proc. Biol. Sci 1997, 264, 1827–1836. [Google Scholar] [CrossRef]
  8. Moller, M.; Cronk, Q.C.B. Origin and relationships of Saintpaulia (Gesneriaceae) based on Ribosomal DNA Internal Transcribed Spacer (ITS) sequences. Am. J. Bot. 1997, 84, 956–965. [Google Scholar] [CrossRef]
  9. Lindqvist, C.; Albert, V.A. A High Elevation Ancestry for the Usambara Mountains and Lowland Populations of African Violets (Saintpaulia, Gesneriaceae). Syst. Geogr. Plants 2001, 71, 37–44. [Google Scholar] [CrossRef]
  10. Burtt, B.L. Studies in the Gesneriaceae of the old world. XV. The genus Saintpaulia. R. Bot. Gard. Edinb. 1958, 22, 547–568. [Google Scholar]
  11. Burtt, B.L. Studies in the Gesneriaceae of the Old World 25: Additional notes on Saintpaulia. Notes R. Bot. Gard. Edinb. 1964, 25, 191–195. [Google Scholar]
  12. Darbyshire, I. Gesneriaceae. In Flora of Tropical East Africa; Beentje, H.J., Ghazanfar, S.A., Eds.; Royal Botanic Gardens: Kew, UK, 2006. [Google Scholar]
  13. Qiao, J.; Cai, M.; Yan, G.; Wang, N.; Li, F.; Chen, B.; Gao, G.; Xu, K.; Li, J.; Wu, X. High-throughput multiplex cpDNA resequencing clarifies the genetic diversity and genetic relationships among Brassica napus, Brassica rapa and Brassica oleracea. Plant Biotechnol. J. 2016, 14, 409–418. [Google Scholar] [CrossRef] [PubMed]
  14. Huang, J.; Yu, Y.; Liu, Y.-M.; Xie, D.-F.; He, X.-J.; Zhou, S.-D. Comparative Chloroplast Genomics of Fritillaria (Liliaceae), Inferences for Phylogenetic Relationships between Fritillaria and Lilium and Plastome Evolution. Plants 2020, 9, 133. [Google Scholar] [CrossRef] [PubMed] [Green Version]
  15. Song, Y.; Chen, Y.; Lv, J.; Xu, J.; Zhu, S.; Li, M. Comparative Chloroplast Genomes of Sorghum Species: Sequence Divergence and Phylogenetic Relationships. Biomed Res. Int. 2019, 2019, 1–11. [Google Scholar] [CrossRef] [PubMed] [Green Version]
  16. De Souza, U.J.; Nunes, R.; Targueta, C.P.; Diniz-Filho, J.A.; de Campos Telles, M.P. The complete chloroplast genome of Stryphnodendron adstringens (Leguminosae - caesalpinioideae): Comparative analysis with related Mimosoid species. Sci. Rep. 2019, 9, 1–12. [Google Scholar] [CrossRef]
  17. Parks, M.; Cronn, R.; Liston, A. Increasing phylogenetic resolution at low taxonomic levels using massively parallel sequencing of chloroplast genomes. BMC Biol. 2009, 7, 84. [Google Scholar] [CrossRef] [Green Version]
  18. Cai, J.; Ma, P.F.; Li, H.T.; Li, D.Z. Complete Plastid Genome Sequencing of Four Tilia Species (Malvaceae): A Comparative Analysis and Phylogenetic Implications. PLoS ONE 2015, 10, e0142705. [Google Scholar] [CrossRef] [Green Version]
  19. Pyron, R.A.; Hendry, C.R.; Chou, V.M.; Lemmon, E.M.; Lemmon, A.R.; Burbrink, F.T. Effectiveness of phylogenomic data and coalescent species-tree methods for resolving difficult nodes in the phylogeny of advanced snakes (Serpentes: Caenophidia). Mol. Phylogenetics Evol. 2014, 81, 221–231. [Google Scholar] [CrossRef]
  20. Mitchell, N.; Lewis, P.O.; Lemmon, E.M.; Lemmon, A.R.; Holsinger, K.E. Anchored phylogenomics improves the resolution of evolutionary relationships in the rapid radiation of Protea L. Am. J. Bot. 2017, 104, 102–115. [Google Scholar] [CrossRef] [Green Version]
  21. Kyalo, C.M.; Gichira, A.W.; Li, Z.Z.; Saina, J.K.; Malombe, I.; Hu, G.W.; Wang, Q.F. Characterization and Comparative Analysis of the Complete Chloroplast Genome of the Critically Endangered Species Streptocarpus teitensis (Gesneriaceae). Biomed. Res. Int. 2018, 2018, 1507847. [Google Scholar] [CrossRef] [Green Version]
  22. Lee, S.-R.; Kim, K.; Lee, B.-Y.; Lim, C.E. Complete chloroplast genomes of all six Hosta species occurring in Korea: Molecular structures, comparative, and phylogenetic analyses. BMC Genom. 2019, 20, 833. [Google Scholar] [CrossRef]
  23. Li, Y.; Zhang, J.; Li, L.; Gao, L.; Xu, J.; Yang, M. Structural and Comparative Analysis of the Complete Chloroplast Genome of Pyrus hopeiensis—“Wild Plants with a Tiny Population”—and Three Other Pyrus Species. Int. J. Mol. Sci. 2018, 10, 3262. [Google Scholar] [CrossRef] [Green Version]
  24. Li, W.; Zhang, C.; Guo, X.; Liu, Q.; Wang, K. Complete chloroplast genome of Camellia japonica genome structures, comparative and phylogenetic analysis. PLoS ONE 2019, 14, e0216645. [Google Scholar] [CrossRef] [PubMed] [Green Version]
  25. Dugas, D.V.; Hernandez, D.; Koenen, E.J.; Schwarz, E.; Straub, S.; Hughes, C.E.; Jansen, R.K.; Nageswara-Rao, M.; Staats, M.; Trujillo, J.T.; et al. Mimosoid legume plastome evolution: IR expansion, tandem repeat expansions, and accelerated rate of evolution in clpP. Sci. Rep. 2015, 5, 16958. [Google Scholar] [CrossRef] [PubMed] [Green Version]
  26. Ivanova, Z.; Sablok, G.; Daskalova, E.; Zahmanova, G.; Apostolova, E.; Yahubyan, G.; Baev, V. Chloroplast Genome Analysis of Resurrection Tertiary Relict Haberlea rhodopensis Highlights Genes Important for Desiccation Stress Response. Front. Plant Sci. 2017, 8, 204. [Google Scholar] [CrossRef] [PubMed] [Green Version]
  27. Xin, Z.-B.; Fu, L.-F.; Fu, Z.-X.; Li, S.; Wei, Y.-G.; Wen, F. Complete chloroplast genome sequence of Petrocodon jingxiensis (Gesneriaceae). Mitochondrial DNA Part B 2019, 4, 2771–2772. [Google Scholar] [CrossRef] [Green Version]
  28. Feng, C.; Xu, M.; Feng, C.; von Wettberg, E.J.B.; Kang, M. The complete chloroplast genome of Primulina and two novel strategies for development of high polymorphic loci for population genetic and phylogenetic studies. BMC Evol. Biol. 2017, 17, 224. [Google Scholar] [CrossRef] [Green Version]
  29. Badger, J.H.; Zhang, T.; Fang, Y.; Wang, X.; Deng, X.; Zhang, X.; Hu, S.; Yu, J. The Complete Chloroplast and Mitochondrial Genome Sequences of Boea hygrometrica: Insights into the Evolution of Plant Organellar Genomes. PLoS ONE 2012, 7, e30531. [Google Scholar]
  30. Ren, T.; Zheng, W.; Han, K.; Zeng, S.; Zhao, J.; Liu, Z.-L. Characterization of the complete chloroplast genome sequence of Lysionotus pauciflorus (Gesneriaceae). Conserv. Genet. Resour. 2016, 9, 185–187. [Google Scholar] [CrossRef]
  31. Wang, J.; Li, C.; Yan, C.; Zhao, X.; Shan, S. A comparative analysis of the complete chloroplast genome sequences of four peanut botanical varieties. PeerJ 2018, 6, e5349. [Google Scholar] [CrossRef] [Green Version]
  32. Fan, W.B.; Wu, Y.; Yang, J.; Shahzad, K.; Li, Z.H. Comparative Chloroplast Genomics of Dipsacales Species: Insights Into Sequence Variation, Adaptive Evolution, and Phylogenetic Relationships. Front. Plant Sci. 2018, 9, 689. [Google Scholar] [CrossRef] [Green Version]
  33. Liu, H.; He, J.; Ding, C.; Lyu, R.; Pei, L.; Cheng, J.; Xie, L. Comparative Analysis of Complete Chloroplast Genomes of Anemoclema, Anemone, Pulsatilla, and Hepatica Revealing Structural Variations Among Genera in Tribe Anemoneae (Ranunculaceae). Front. Plant Sci. 2018, 9, 1097. [Google Scholar] [CrossRef] [PubMed] [Green Version]
  34. Yang, J.; Yue, M.; Niu, C.; Ma, X.F.; Li, Z.H. Comparative Analysis of the Complete Chloroplast Genome of Four Endangered Herbals of Notopterygium. Genes 2017, 8, 124. [Google Scholar] [CrossRef] [PubMed]
  35. Xue, S.; Shi, T.; Luo, W.; Ni, X.; Iqbal, S.; Ni, Z.; Huang, X.; Yao, D.; Shen, Z.; Gao, Z. Comparative analysis of the complete chloroplast genome among Prunus mume, P. armeniaca, and P. salicina. Hortic. Res. 2019, 6, 89. [Google Scholar] [CrossRef] [PubMed] [Green Version]
  36. Li, X.; Tan, W.; Sun, J.; Du, J.; Zheng, C.; Tian, X.; Zheng, M.; Xiang, B.; Wang, Y. Comparison of Four Complete Chloroplast Genomes of Medicinal and Ornamental Meconopsis Species: Genome Organization and Species Discrimination. Sci. Rep. 2019, 9, 10567. [Google Scholar] [CrossRef] [Green Version]
  37. Doorduin, L.; Gravendeel, B.; Lammers, Y.; Ariyurek, Y.; Chin, A.W.T.; Vrieling, K. The complete chloroplast genome of 17 individuals of pest species Jacobaea vulgaris: SNPs, microsatellites and barcoding markers for population and phylogenetic studies. DNA Res. 2011, 18, 93–105. [Google Scholar] [CrossRef]
  38. Chung, H.Y.; Won, S.Y.; Kim, Y.-K.; Kim, J.S. Development of the chloroplast genome-based InDel markers in Niitaka (Pyrus pyrifolia) and its application. Plant Biotechnol. Rep. 2019, 13, 51–61. [Google Scholar] [CrossRef] [Green Version]
  39. Cho, M.S.; Kim, J.H.; Kim, C.S.; Mejías, J.A.; Kim, S.C. Sow Thistle Chloroplast Genomes: Insights into the Plastome Evolution and Relationship of Two Weedy Species, Sonchus asper and Sonchus oleraceus (Asteraceae). Genes 2019, 10, 181. [Google Scholar] [CrossRef] [Green Version]
  40. Zhou, J.; Chen, X.; Cui, Y.; Sun, W.; Li, Y.; Wang, Y.; Song, J.; Yao, H. Molecular Structure and Phylogenetic Analyses of Complete Chloroplast Genomes of Two Aristolochia Medicinal Species. Int. J. Mol. Sci. 2017, 18, 1829. [Google Scholar] [CrossRef]
  41. Lu, R.-S.; Li, P.; Qiu, Y.-X. The Complete Chloroplast Genomes of Three Cardiocrinum (Liliaceae) Species: Comparative Genomic and Phylogenetic Analyses. Front. Plant Sci. 2016, 7, 2054. [Google Scholar] [CrossRef]
  42. Zhou, J.; Cui, Y.; Chen, X.; Li, Y.; Xu, Z.; Duan, B.; Li, Y.; Song, J.; Yao, H. Complete Chloroplast Genomes of Papaver rhoeas and Papaver orientale: Molecular Structures, Comparative Analysis, and Phylogenetic Analysis. Molecules 2018, 23, 437. [Google Scholar] [CrossRef] [Green Version]
  43. Clegg, M.T.; Gaut, B.S.; Learn, G.H.; Morton, B.R. Rates and patterns of chloroplast DNA evolution. Proc. Natl. Acad. Sci. USA 1994, 91, 6795–6801. [Google Scholar] [CrossRef] [PubMed] [Green Version]
  44. Choi, K.S.; Chung, M.G.; Park, S. The Complete Chloroplast Genome Sequences of Three Veroniceae Species (Plantaginaceae): Comparative Analysis and Highly Divergent Regions. Front. Plant Sci. 2016, 7, 355. [Google Scholar] [CrossRef] [PubMed] [Green Version]
  45. Ngo Ngwe, M.F.; Omokolo, D.N.; Joly, S. Evolution and Phylogenetic Diversity of Yam Species (Dioscorea spp.): Implication for Conservation and Agricultural Practices. PLoS ONE 2015, 10, e0145364. [Google Scholar] [CrossRef] [PubMed] [Green Version]
  46. Dong, W.; Liu, J.; Yu, J.; Wang, L.; Zhou, S. Highly variable chloroplast markers for evaluating plant phylogeny at low taxonomic levels and for DNA barcoding. PLoS ONE 2012, 7, e35071. [Google Scholar] [CrossRef] [PubMed]
  47. Keller, J.; Rousseau-Gueutin, M.; Martin, G.E.; Morice, J.; Boutte, J.; Coissac, E.; Ourari, M.; Aïnouche, M.; Salmon, A.; Cabello-Hurtado, F.; et al. The evolutionary fate of the chloroplast and nuclear rps16 genes as revealed through the sequencing and comparative analyses of four novel legume chloroplast genomes from Lupinus. DNA Res. 2017, 24, 343–358. [Google Scholar] [CrossRef] [PubMed] [Green Version]
  48. Li, W.; Lu, Y.; Xie, X.; Li, B.; Han, Y.; Sun, T.; Xian, Y.; Yang, H.; Liu, K. Development of chloroplast genomic resources for Pyrus hopeiensis (Rosaceae). Conserv. Genet. Resour. 2017, 10, 511–513. [Google Scholar] [CrossRef]
  49. Knowles, L.L.; Chan, Y.-H. Resolving Species Phylogenies of Recent Evolutionary Radiations. Ann. Mo. Bot. Gard. 2008, 95, 224–231. [Google Scholar] [CrossRef]
  50. Moore, M.J.; Bell, C.D.; Soltis, P.S.; Soltis, D.E. Using plastid genome-scale data to resolve enigmatic relationships among basal angiosperms. Proc. Natl. Acad. Sci. USA 2007, 104, 19363–19368. [Google Scholar] [CrossRef] [Green Version]
  51. Moore, M.J.; Soltis, P.S.; Bell, C.D.; Burleigh, J.G.; Soltis, D.E. Phylogenetic analysis of 83 plastid genes further resolves the early diversification of eudicots. Proc. Natl. Acad. Sci. USA 2010, 107, 4623–4628. [Google Scholar] [CrossRef] [Green Version]
  52. Patel, R.K.; Jain, M. NGS QC Toolkit: A toolkit for quality control of next generation sequencing data. PLoS ONE 2012, 7, e30619. [Google Scholar] [CrossRef]
  53. Langmead, B.; Salzberg, S.L. Fast gapped-read alignment with Bowtie 2. Nat. Methods 2012, 9, 357–359. [Google Scholar] [CrossRef] [PubMed] [Green Version]
  54. Zerbino, D.R.; Birney, E. Velvet: Algorithms for de novo short read assembly using de Bruijn graphs. Genome Res. 2008, 18, 821–829. [Google Scholar] [CrossRef] [PubMed] [Green Version]
  55. Bankevich, A.; Nurk, S.; Antipov, D.; Gurevich, A.A.; Dvorkin, M.; Kulikov, A.S.; Lesin, V.M.; Nikolenko, S.I.; Pham, S.; Prjibelski, A.D.; et al. A new genome assembly algorithm and its applications to single-cell sequencing. J. Comput. Biol. 2012, 19, 455–477. [Google Scholar] [CrossRef] [PubMed] [Green Version]
  56. Wick, R.R.; Schultz, M.B.; Zobel, J.; Holt, K.E. Bandage: Interactive visualization of de novo genome assemblies. Bioinformatics 2015, 31, 3350–3352. [Google Scholar] [CrossRef] [PubMed] [Green Version]
  57. Tillich, M.; Lehwark, P.; Pellizzer, T.; Ulbricht-Jones, E.S.; Fischer, A.; Bock, R.; Greiner, S. GeSeq—Versatile and accurate annotation of organelle genomes. Nucleic Acids Res. 2017, 4, W6–W11. [Google Scholar] [CrossRef] [PubMed]
  58. Lowe, T.M.; Chan, P.P. tRNAscan-SE On-line: Integrating search and context for analysis of transfer RNA genes. Nucleic Acids Res. 2016, 44, W54–W57. [Google Scholar] [CrossRef] [PubMed]
  59. Greiner, S.; Lehwark, P.; Bock, R. OrganellarGenomeDRAW (OGDRAW) version 1.3.1: Expanded toolkit for the graphical visualization of organellar genomes. Nucleic Acids Res. 2019, 47, W59–W64. [Google Scholar] [CrossRef] [Green Version]
  60. Yang, L.; Yang, Z.; Liu, C.; He, Z.; Zhang, Z.; Yang, J.; Liu, H.; Yang, J.; Ji, Y. Chloroplast phylogenomic analysis provides insights into the evolution of the largest eukaryotic genome holder, Paris japonica (Melanthiaceae). BMC Plant Biol. 2019, 19, 293. [Google Scholar] [CrossRef] [Green Version]
  61. Darling, A.E.; Mau, B.; Perna, N.T. progressiveMauve: Multiple genome alignment with gene gain, loss and rearrangement. PLoS ONE 2010, 5, e11147. [Google Scholar] [CrossRef] [Green Version]
  62. Rozas, J.; Ferrer-Mata, A.; Sanchez-DelBarrio, J.C.; Guirao-Rico, S.; Librado, P.; Ramos-Onsins, S.E.; Sanchez-Gracia, A. DnaSP 6: DNA Sequence Polymorphism Analysis of Large Data Sets. Mol. Biol. Evol. 2017, 34, 3299–3302. [Google Scholar] [CrossRef]
  63. Beier, S.; Thomas, T.; Münch, T.; Scholz, U.; Mascher, M. MISA-web: A web server for microsatellite prediction. Bioinformatics 2017, 33, 2583–2585. [Google Scholar] [CrossRef] [PubMed] [Green Version]
  64. Katoh, K.; Rozewicki, J.; Yamada, K.D. MAFFT online service: Multiple sequence alignment, interactive sequence choice and visualization. Brief. Bioinform. 2019, 20, 1160–1166. [Google Scholar] [CrossRef] [PubMed] [Green Version]
  65. Nguyen, L.T.; Schmidt, H.A.; von Haeseler, A.; Minh, B.Q. IQ-TREE: A fast and effective stochastic algorithm for estimating maximum-likelihood phylogenies. Mol. Biol. Evol. 2015, 32, 268–274. [Google Scholar] [CrossRef] [PubMed]
  66. Kalyaanamoorthy, S.; Bui, Q.M.; Wong, T.K.F.; Haeseler, A.V.; Jermiin, L.S. ModelFinder: Fast model selection for accurate phylogenetic estimates. Nat. Methods 2017, 14, 587–589. [Google Scholar] [CrossRef] [Green Version]
  67. Hoang, D.T.; Chernomor, O.; von Haeseler, A.; Minh, B.Q.; Vinh, L.S. UFBoot2: Improving the Ultrafast Bootstrap Approximation. Mol. Biol. Evol. 2018, 35, 518–522. [Google Scholar] [CrossRef]
  68. Ronquist, F.; Teslenko, M.; van der Mark, P.; Ayres, D.L.; Darling, A.; Hohna, S.; Larget, B.; Liu, L.; Suchard, M.A. MrBayes 3.2: Efficient Bayesian Phylogenetic Inference and Model Choice Across a Large Model Space. Syst. Biol. 2012, 61, 539–542. [Google Scholar] [CrossRef] [Green Version]
Figure 1. Linear chloroplast genome maps of six taxa of sect. Saintpaulia ((A) Str. teitensis; (B) subsp. velutinus; (C) subsp. grandifolius; (D) subsp. orbicularis; (E) subsp. grotei and (F) subsp. rupicola). The genes above the black line (names on top of the figure) represent clockwise transcription while genes below (names at the bottom) are transcribed counter-clockwise. Genes of different functional categories are colored according to the legend at the bottom.
Plants 09 00456 g001
Figure 2. Multiple genome alignment of six sect. Saintpaulia taxa. The red bars represent sequence similarity among different genomes. The bottom bar is a visualization of the sequences’ consensus identities with the green color symbolizing homology while the yellow vertical lines signify variation spots. LSC: Large Single Copy region; IRA: Inverted Repeat A; SSC: Small Single Copy region and IRB: Inverted Repeat B.
Plants 09 00456 g002
Figure 3. Comparison of the Inverted Repeat/ Single Copy (IR/SC) junctions’ characteristics among the six sect. Saintpaulia genomes. The genes below and above are transcribed in clockwise and counter-clockwise directions, respectively. The setting is not to scale.
Plants 09 00456 g003
Figure 4. Nucleotide variability (Pi) values among chloroplast genomes of the five Str. ionanthus subspecies for (A) Coding sequences and (B) Intergenic spacer regions.
Plants 09 00456 g004
Figure 5. Simple Sequence Repeats (SSRs) in six sect. Saintpaulia chloroplast genomes. (A) Number of identified SSRs at different repeat motifs, (B) Percentage contribution of each repeat type.
Plants 09 00456 g005
Figure 6. The phylogenetic relationship within five Str. ionanthus subspecies and the relationship with other Gesneriaceae based on (A) complete genome sequence and (B) coding genes and (C) intergenic regions. The bootstrap support values are given for both Maximum Likelihood (ML) and Bayesian Inference (BI) trees (ML/BI) and * denote maximum support values for both ML/BI.
Plants 09 00456 g006
Figure 7. Morphological heterogeneity in Streptocarpus ionanthus; (A) Str. ionanthus subsp. velutinus, (B) Str. ionanthus subsp. orbicularis, (C) Str. ionanthus subsp. grandifolius, (D) Str. ionanthus subsp. rupicola, (E) Str. ionanthus subsp. grotei (trailing habit) and (F) Str. ionanthus subsp. grotei (rosulate habit).
Plants 09 00456 g007
Table 1. Characteristics of major features of six sect. Saintpaulia chloroplast genomes.
TaxaStr. teitensisStr. ionanthus subsp. velutinusStr. ionanthus subsp. grandifoliusStr. ionanthus subsp. orbicularisStr. ionanthus subsp. grotei Str. ionanthus subsp. rupicola
Accession NumberMF596485MN935472MN935471MN935470MN935469 MN935473
Total size (bp)153,207153,307153,208153,377153,215153,290
LSC size (bp)84,10384,11584,01684,12384,01084,097
SSC size (bp)18,30018,33218,33218,32618,31618,326
IR size (bp)25,40225,43125,43125,46425,44525,434
Number of genes114115115115115115
Number of PCGs798080808080
Number of tRNAs313131313131
Number of rRNAs444444
LSC: Large Single Copy region; SSC: Small Single Copy region; IR: Inverted Repeat region; PCGs: Protein Coding genes; tRNAs: transfer RNA genes; rRNAs: ribosomal RNA genes.
Table 2. Genes present in the chloroplast genomes of five Str. ionanthus subspecies.
CategoryGene Names
Photosystem 1psaA, psaB, psaC, psaI, psaJ
Photosystem 11psbA, psbB, psbC, psbD, psbE, psbF, psbH, psbI, psbJ, psbK, psbL, psbM, psbN, psbT, psbZ
NADH DehydrogenasendhA a, ndhB a,c, ndhC, ndhD, ndhE, ndhF, ndhG, ndhH, ndhI, ndhJ, ndhK
ATP SynthaseatpA, atpB, atpE, atpF a, atpH, atpI
Cytochrome b/f complexpetA, petB, petD, petG, petL, petN
RubisCO large subunitrbcL
RNA PolymeraserpoA, rpoB, rpoC1 a, rpoC2
Ribosomal proteins (Large)rpl2 a, rpl14, rpl16, rpl20, rpl22, rpl23 c, rpl32, rpl33, rpl36
Ribosomal proteins (Small)rps2, rps3, rps4, rps7 c, rps8, rps11, rps12 b,c,d, rps14, rps15, rps16 a, rps18, rps19
Ribosomal RNAsrrn4.5 c, rrn5 c, rrn16 c, rrn23 c
Transfer RNAstrnA-UGC a,c, trnC-GCA, trnD-GUC, trnE-UUC, trnF-GAA, trnG-GCC, trnG-UCC, trnH-GUG,
trnI-CAU c, trnI-GAU a,c, trnK-UUU, trnL-CAA c, trnL-UAA a, trnL-UAG, trnfM-CAU,
trnN-GUU c, trnP-UGG, trnQ-UUG, trnR-ACG c, trnR-UCU, trnS-GCU, trnS-GGA, trnS-UGA, trnS-CGA
trnT-GGU, trnT-UGU, trnV-GAC c, trnV-UAC a, trnW-CCA, trnY-GUA, trnM-CAU
ycf1 c, ycf2 c, ycf3 b, ycf4, ycf15 a,c
ProteaseclpP b
MaturasematK
Translational initiation factorinfA
Envelope membrane proteincemA
Subunit of acetyl-CoA-carboxylaseaccD
c-type cytochrome synthesisccsA
a Gene with one intron. b Gene with two introns. c Duplicated genes in the IR regions. d Trans-splicing gene.

