Genetic Diversity and Population Structure of Rhododendron rex Subsp. rex Inferred from Microsatellite Markers and Chloroplast DNA Sequences


Abstract
1. Introduction
2. Materials and Methods
2.1. Plant Material Sampling
2.2. DNA Extraction, PCR Amplification, and Sequencing
2.3. Data Analysis
2.3.1. Data Analysis of Microsatellite Markers
2.3.2. Data Analysis of cpDNA Sequences
2.3.3. Analysis of Species Distribution Model
3. Results
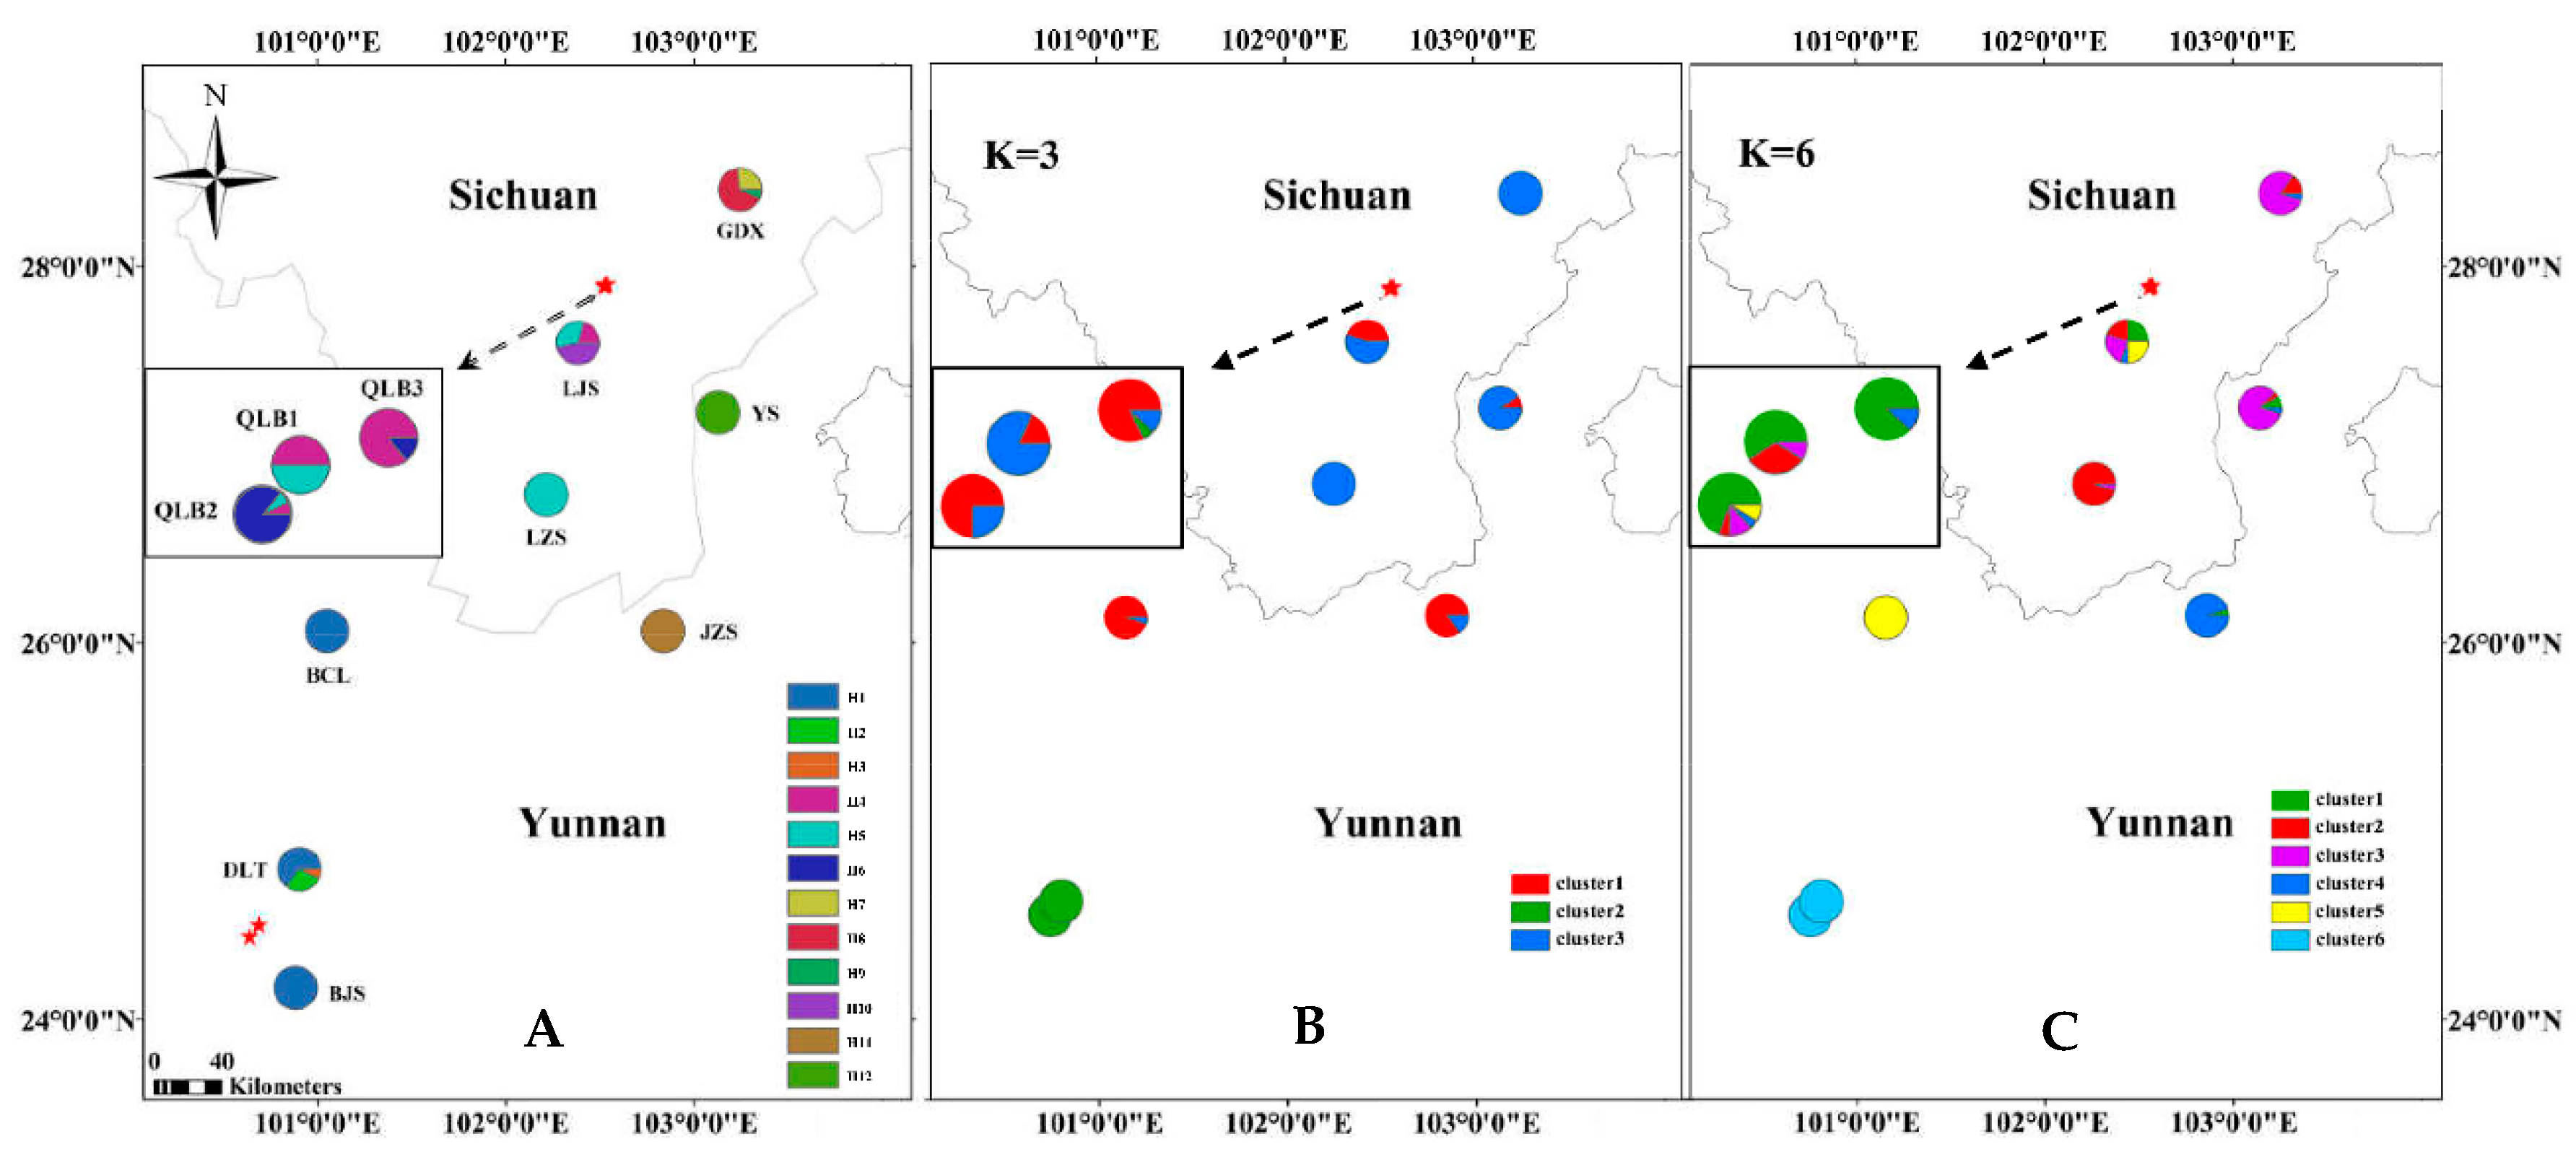
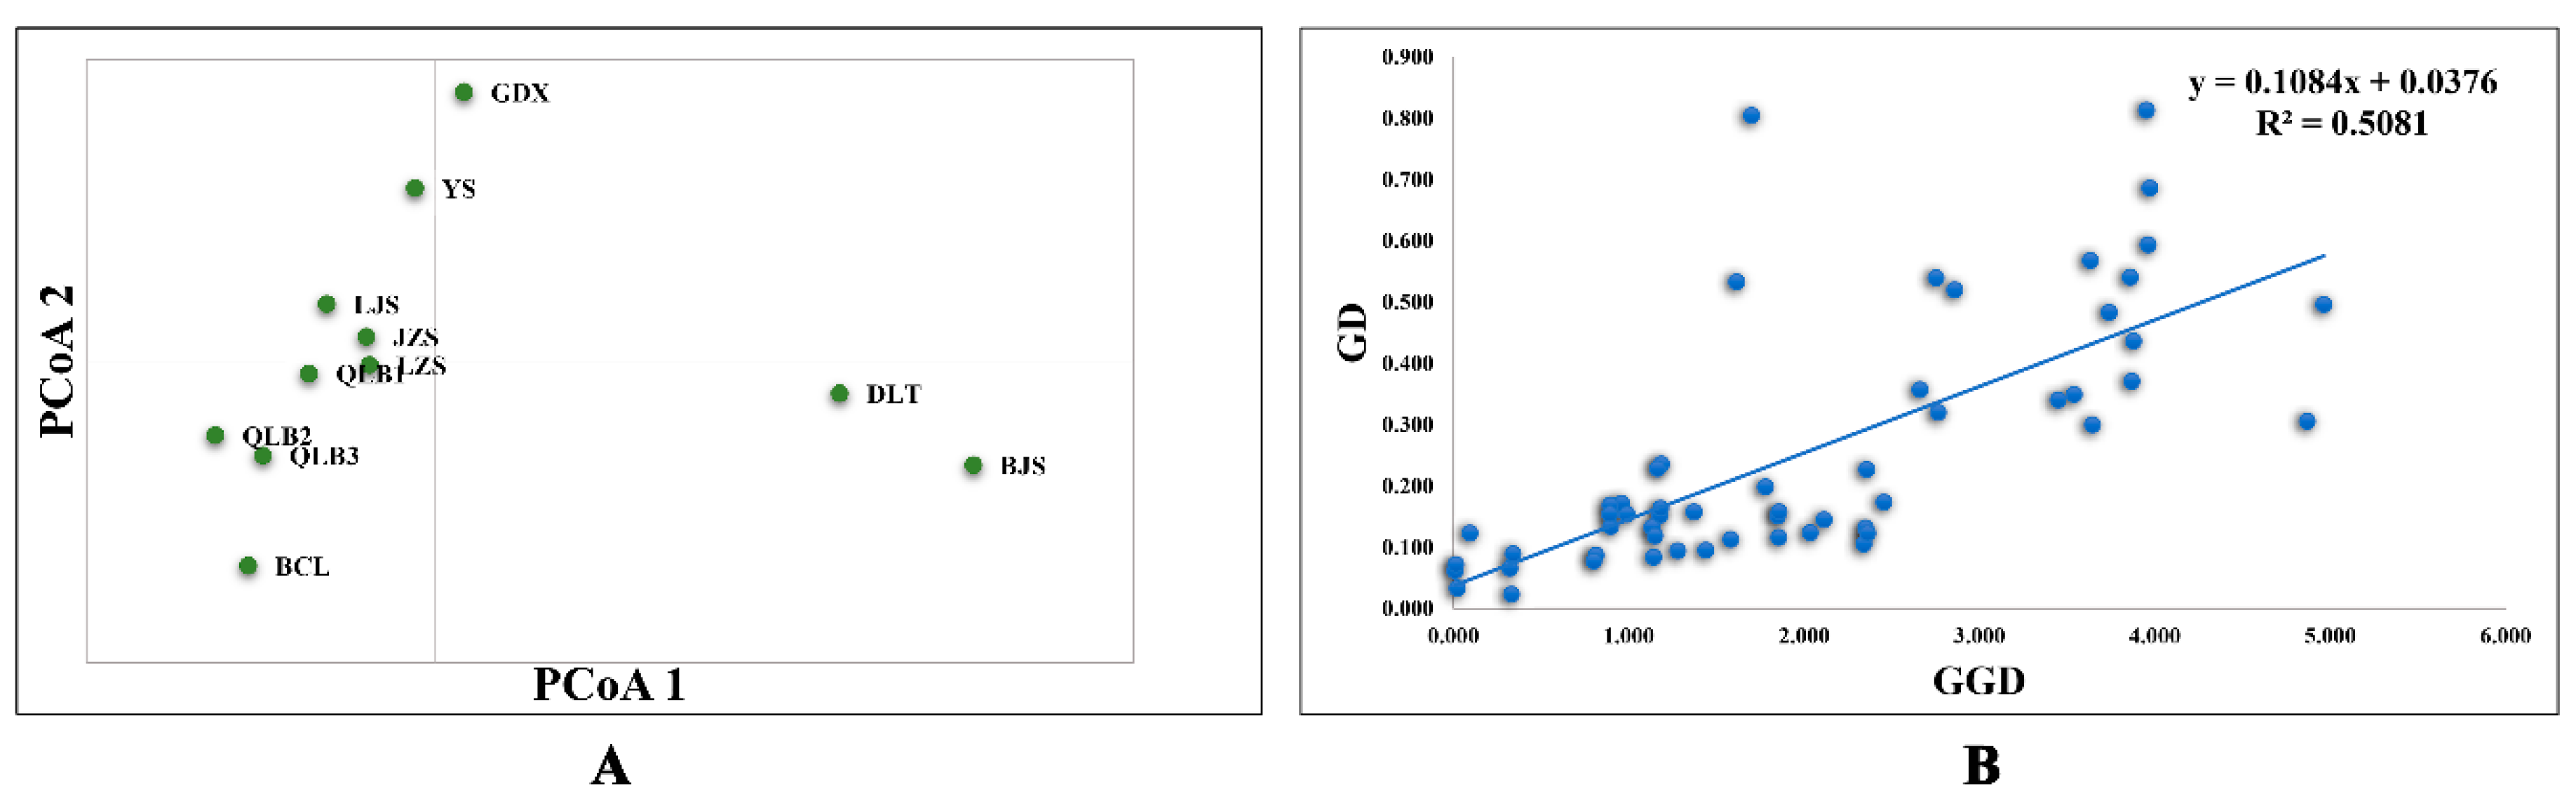
3.1. SSR Data
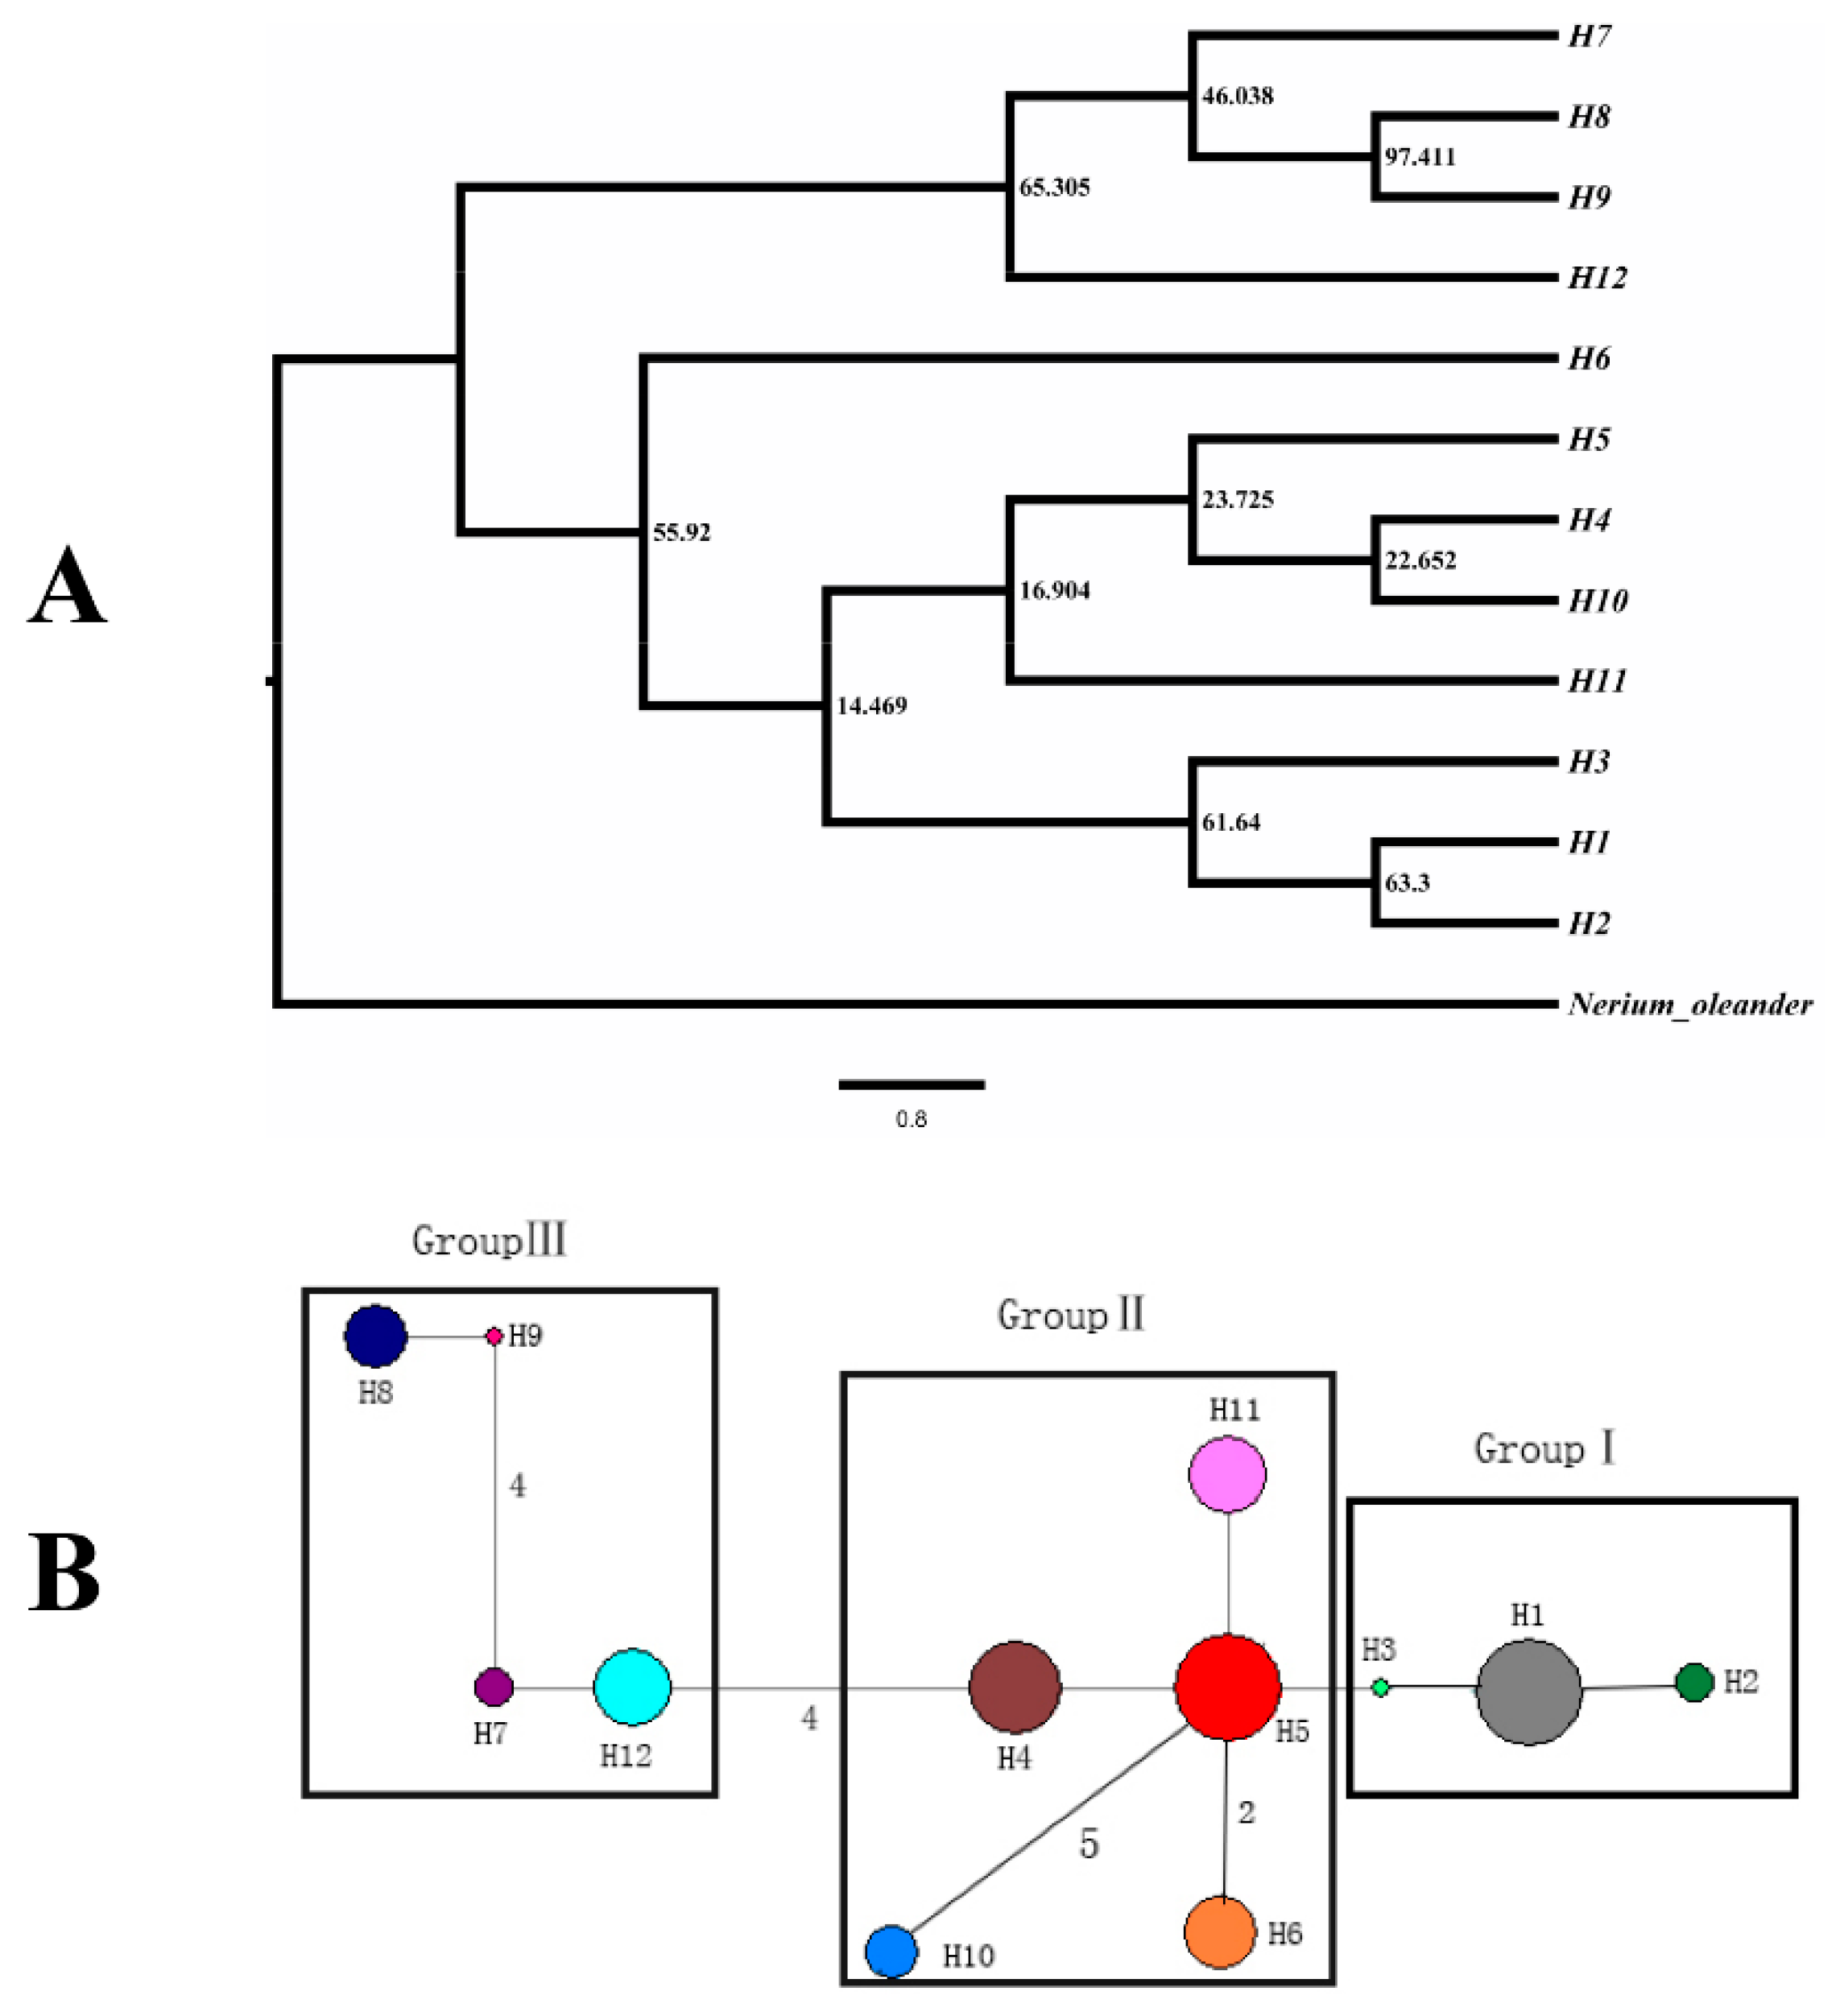
3.2. cpDNA Sequence
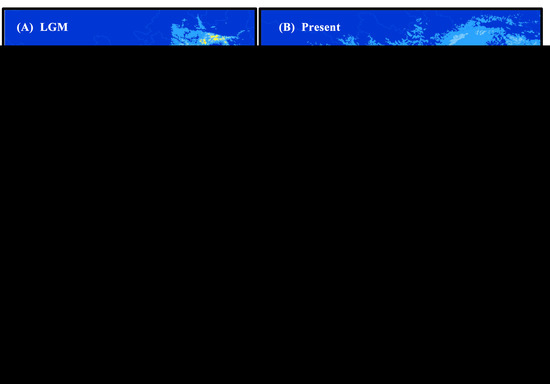
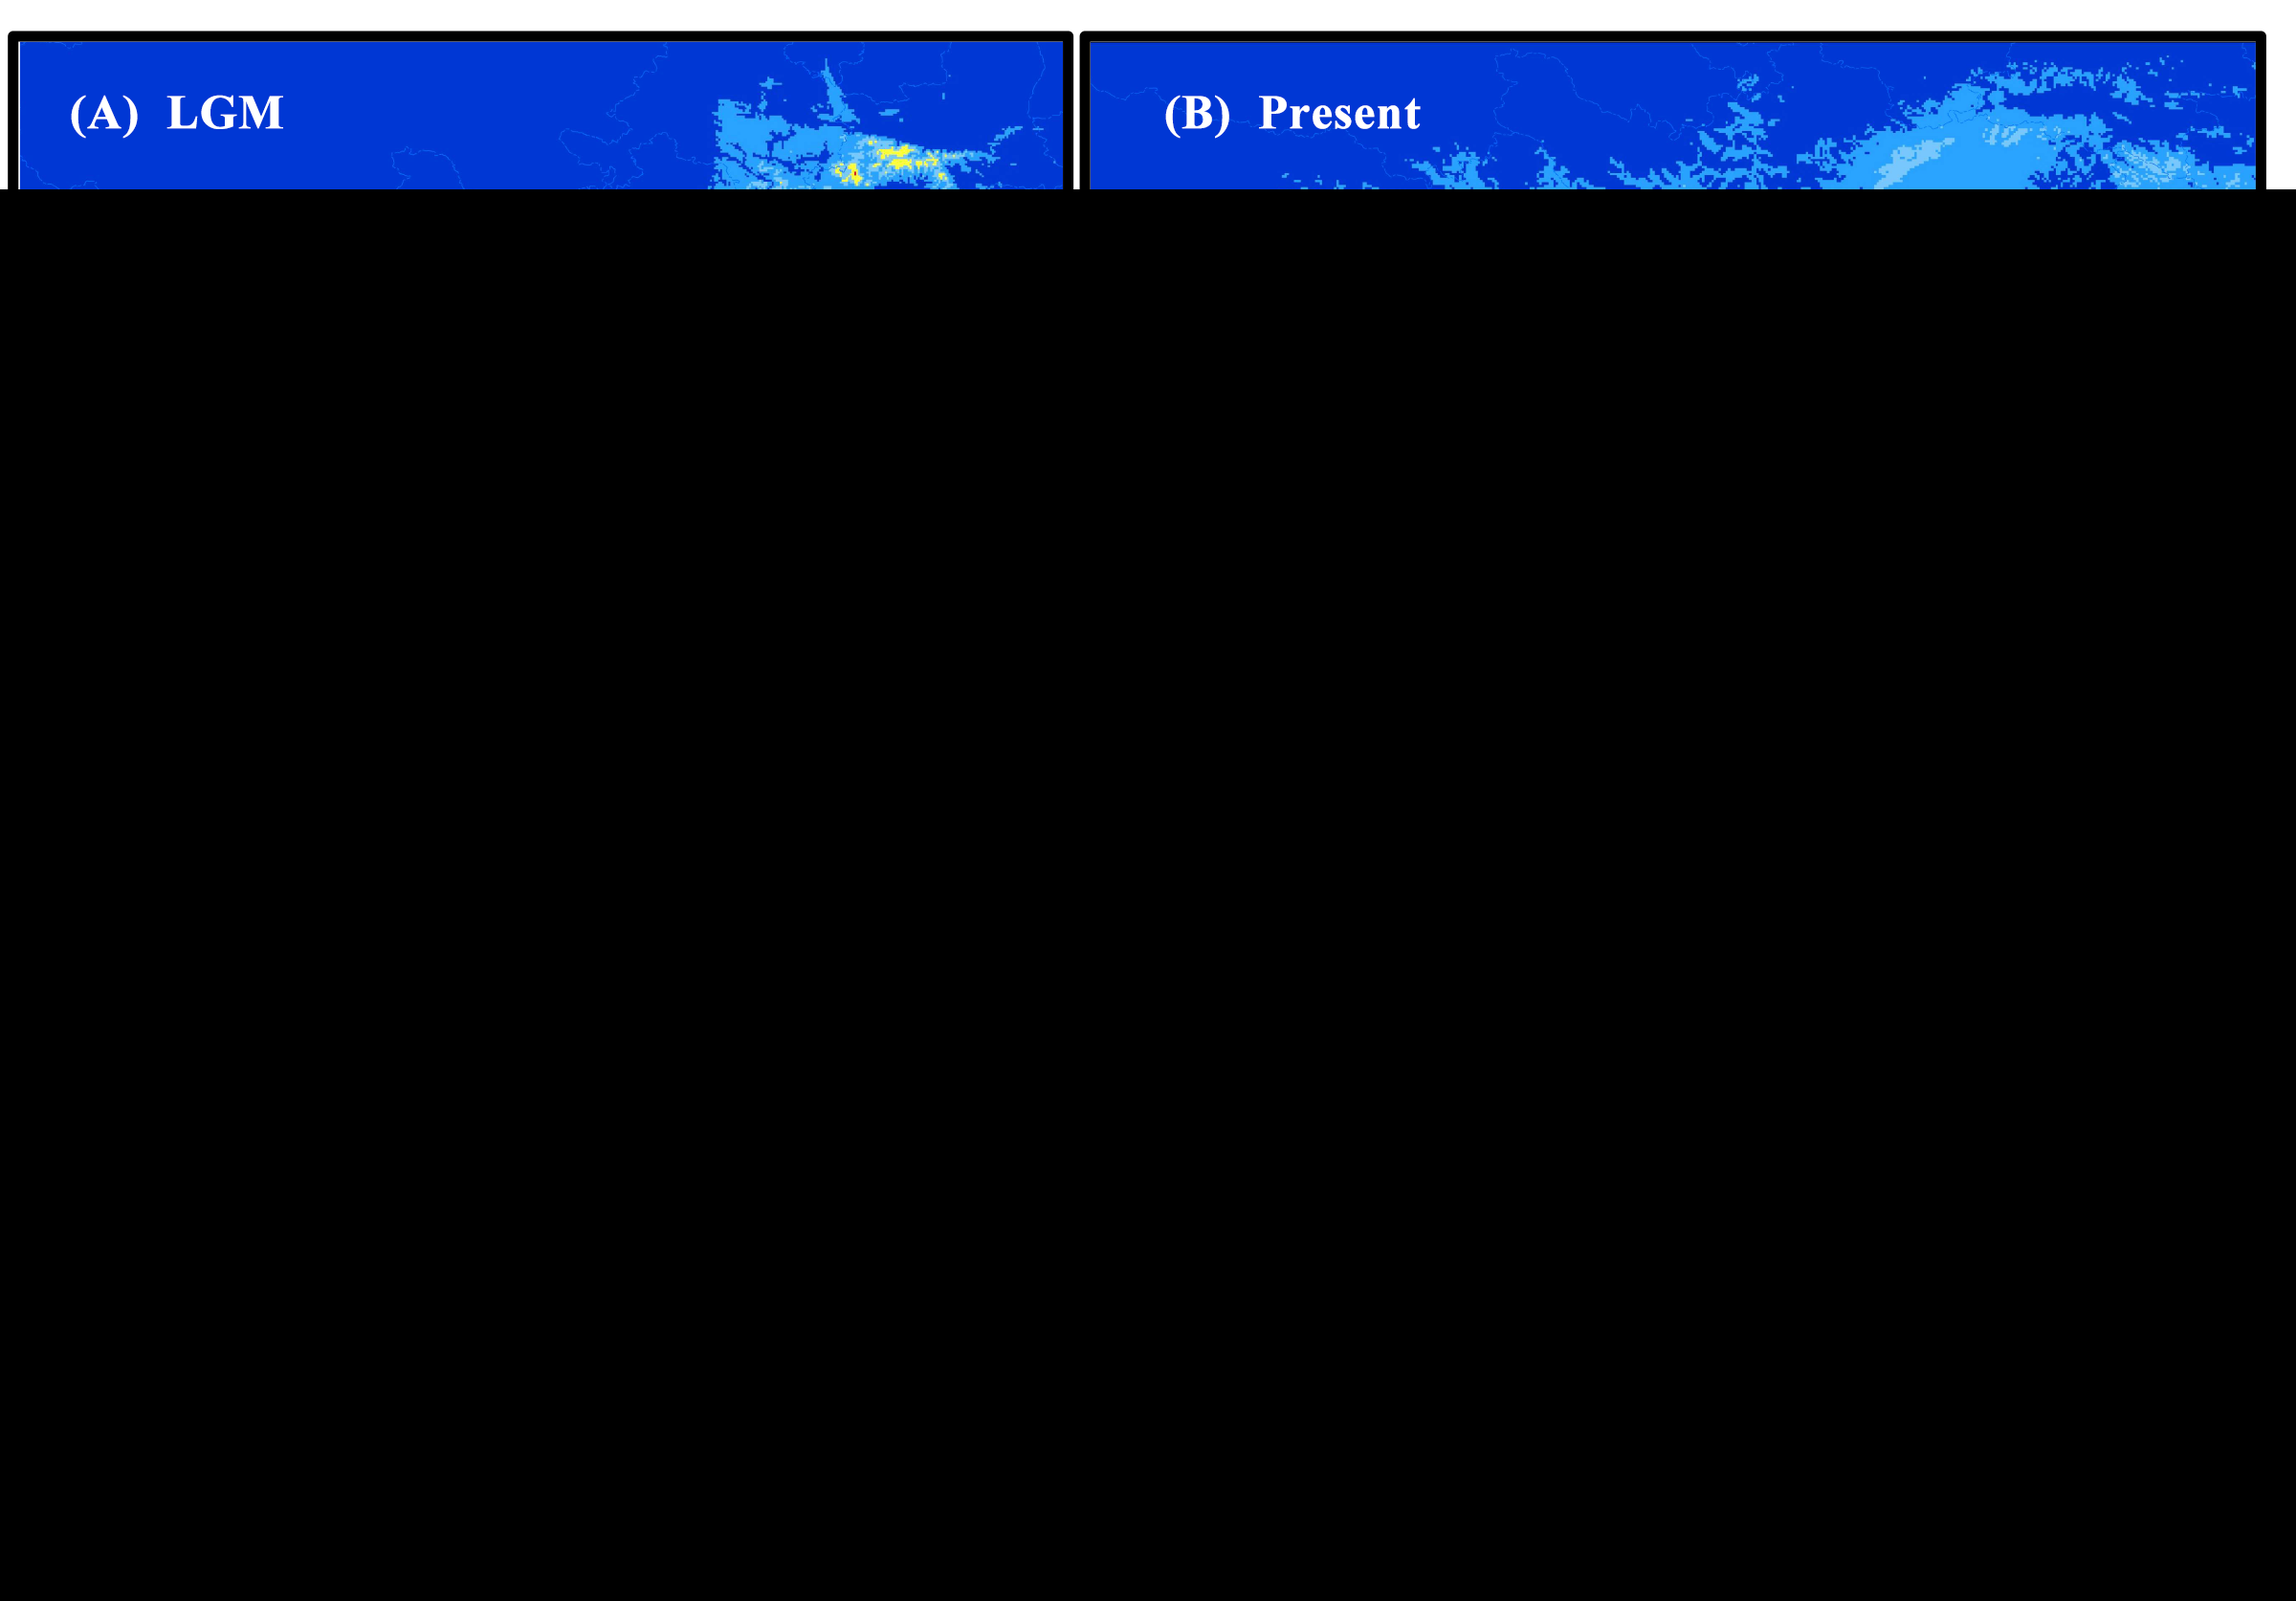
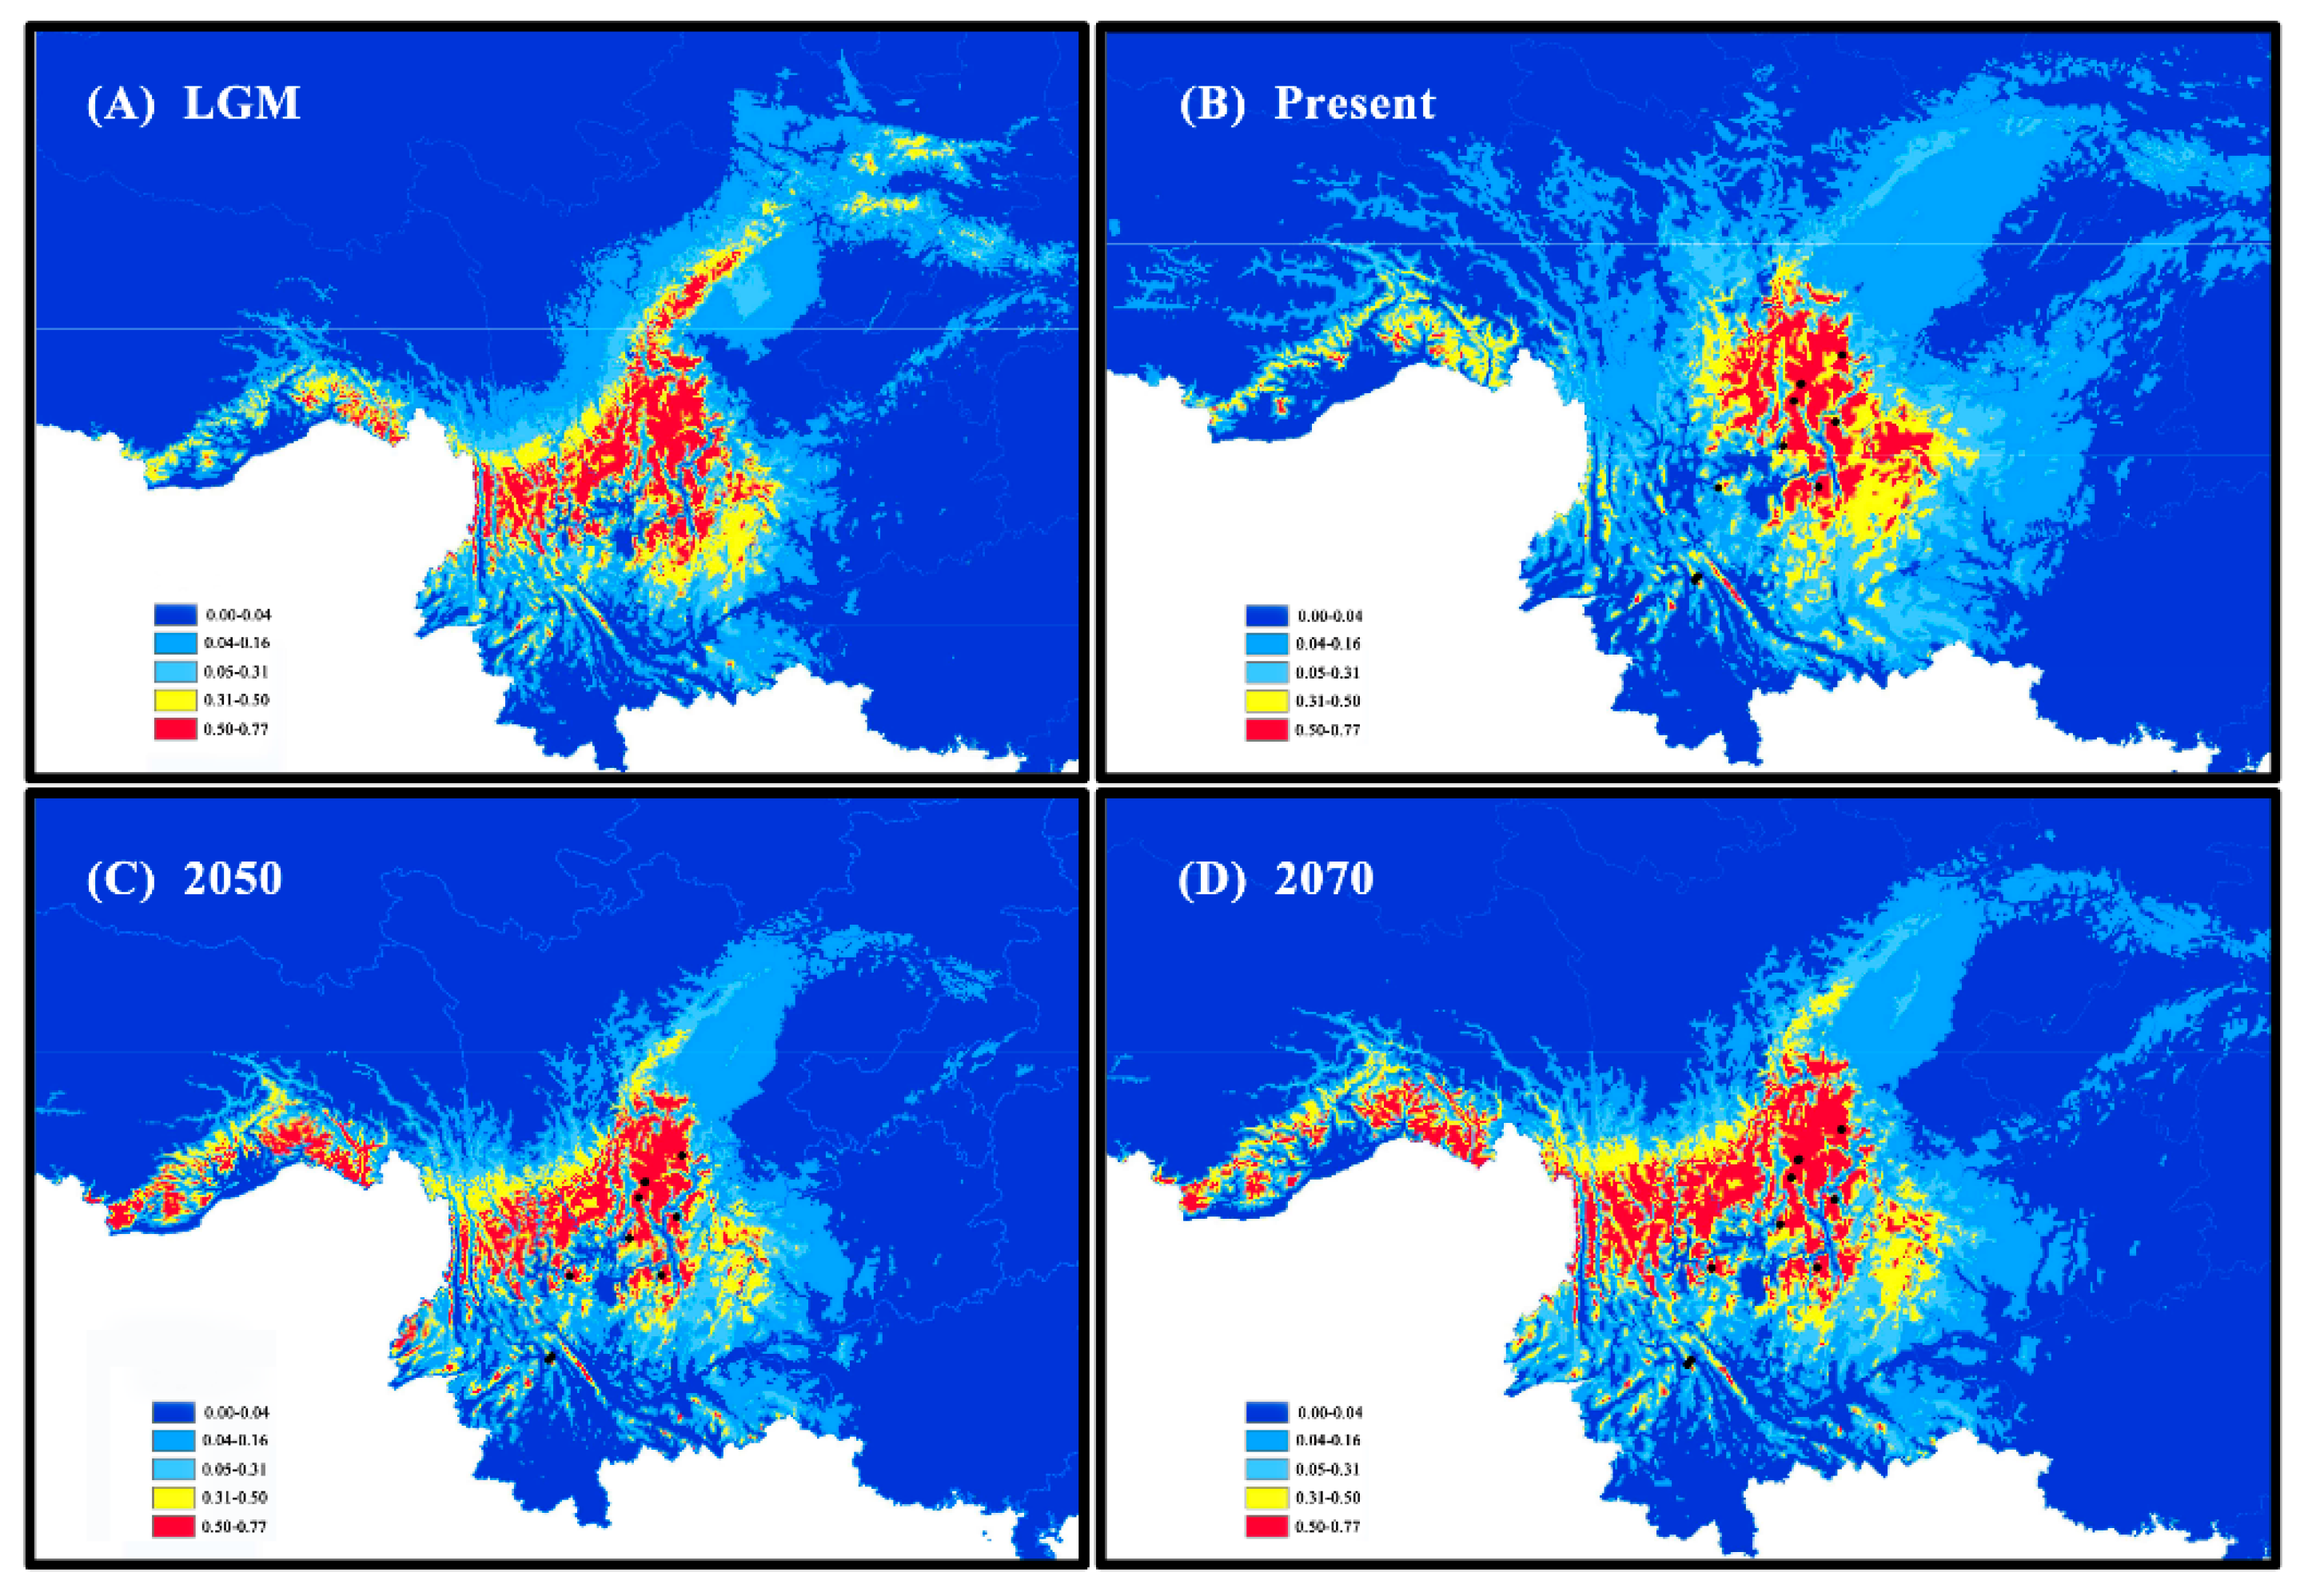
3.3. Species Distribution Model
4. Discussion
4.1. Genetic Diversity in R. rex Subsp. rex Populations
4.2. Genetic Differentiation and Structure among R. rex Subsp. rex Populations
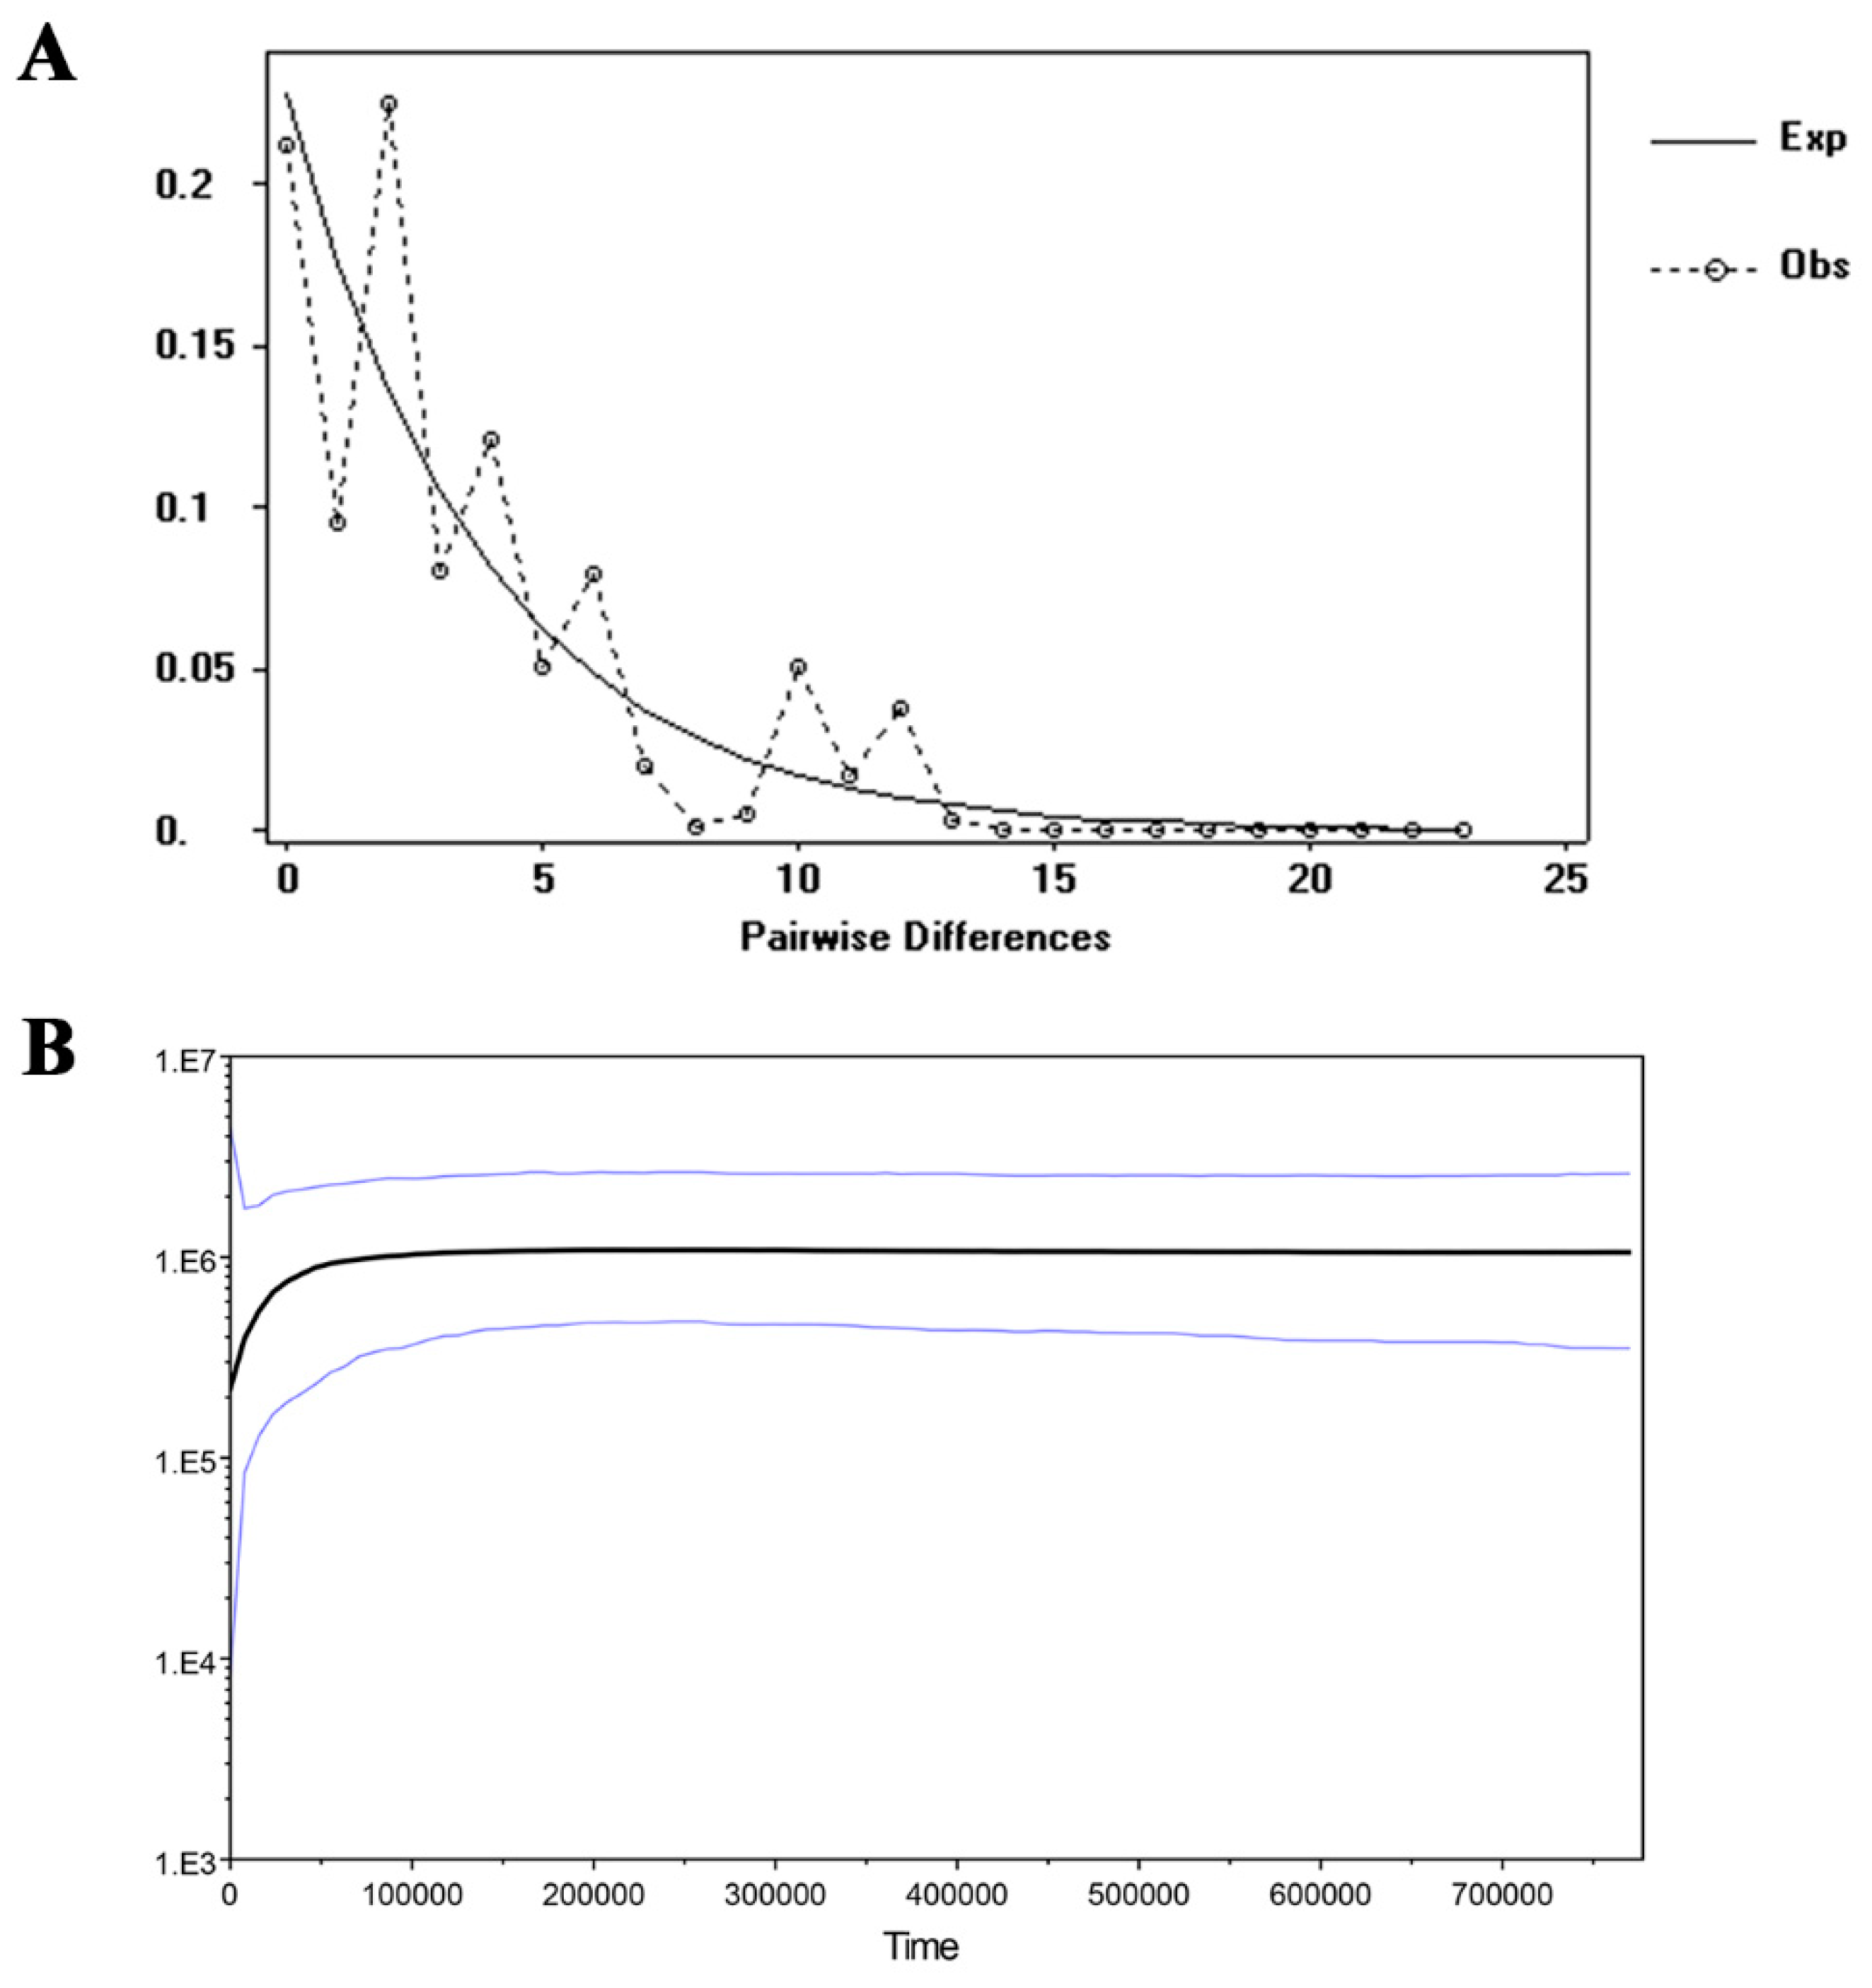
4.3. Population Demographic History of the R. rex Subsp. rex
5. Conclusions
Supplementary Materials
Author Contributions
Funding
Acknowledgments
Conflicts of Interest
References
- Zhang, Y.; Zhang, X.; Wang, Y.H.; Shen, S.K. De Novo Assembly of transcriptome and development of novel EST-SSR markers in Rhododendron rex Lévl. through illumina sequencing. Front. Plant Sci. 2017, 8, 1664. [Google Scholar] [CrossRef]
- Yoichi, W.; Jin, X.F.; Peng, C.I.; Tamaki, I.; Tomaru, N. Contrasting diversification history between insular and continental species of three-leaved azaleas (Rhododendron sect. Brachycalyx) in East Asia. J. Biogeogr. 2017, 44, 1065–1076. [Google Scholar] [CrossRef]
- Xing, W.; Liao, J.; Cai, M.; Xia, Q.; Liu, Y.; Zeng, W.; Jin, X. De novo assembly of transcriptome from Rhododendron latoucheae Franch. using illumina sequencing and development of new EST-SSR markers for genetic diversity analysis in Rhododendron. Tree Genet. Genomes 2017, 13, 53. [Google Scholar] [CrossRef]
- Wei, H.; Dhanaraj, A.L.; Rowland, L.J.; Fu, Y.; Krebs, S.L.; Arora, R. Comparative analysis of expressed sequence tags from cold-acclimated and non-acclimated leaves of Rhododendron catawbiense Michx. Planta 2005, 221, 406–416. [Google Scholar] [CrossRef]
- Qiang, Y.; Zhou, B.; Gao, K. Chemical constituents of plants from the genus. Rhododendron 2011, 8, 792–815. [Google Scholar]
- Wu, F.Q.; Shen, S.K.; Zhang, X.J.; Wang, Y.H.; Sun, W.B. Genetic diversity and population structure of an extremely endangered species: The world’s largest Rhododendron. AoB Plants 2015, 7, 10696–10700. [Google Scholar] [CrossRef] [PubMed]
- Scheiber, S.M.; Robacker, C.D.; Lindstrom, O.M. Evaluation of deciduous azaleas for cold hardiness potential in the southeastern united states. J. Environ. Hortic. 2000, 18, 230–233. [Google Scholar]
- Scariot, V.; De, K.E.; Handa, T.; De, R.J. Comparative study of the discriminating capacity and effectiveness of AFLP, STMS and EST markers in assessing genetic relationships among evergreen azaleas. Plant Breed. 2010, 126, 207–212. [Google Scholar] [CrossRef]
- Wu, F.Q.; Shen, S.K.; Zhang, X.; Yang, G.S.; Wang, Y.H. Inferences of genetic structure and demographic history of Rhododendron protistum var. giganteum—The world’s largest Rhododendron using microsatellite markers. Flora 2017, 233, 1–6. [Google Scholar] [CrossRef]
- Frankham, R. Genetics and extinction. Biol. Conserv. 2005, 126, 131–140. [Google Scholar] [CrossRef]
- Divakara, B.N.; Upadhyaya, H.D.; Wani, S.P.; Gowda, C.L.L. Biology and genetic improvement of Jatropha curcas L.: A review. Appl. Energy 2010, 87, 732–742. [Google Scholar] [CrossRef]
- Han, Y.C.; Teng, C.Z.; Chang, F.H.; Robert, G.W.; Zhou, M.Q.; Hu, Z.L.; Song, Y.C. Analyses of genetic relationships in Nelumbo nucifera using nuclear ribosomal ITS sequence data, ISSR and RAPD markers. Aquat. Bot. 2007, 87, 141–146. [Google Scholar] [CrossRef]
- Zhang, J.J.; Ye, Q.G.; Gao, P.X.; Yao, X.H. Genetic footprints of habitat fragmentation in the extant populations of Sinojackia (Styraceaceae): Implications for conservation. Bot. J. Linn. Soc. 2012, 170, 232–242. [Google Scholar] [CrossRef][Green Version]
- Mutegi, S.M.; Muchugi, A.; Carsan, S.; Kariba, R.; Jamnadass, R.; Oballa, P.; Brunner, A.M.; Runo, S. Genetic diversity of the African poplar (Populus ilicifolia) populations in Kenya. Tree Genet. Genomes 2016, 12, 1–7. [Google Scholar] [CrossRef]
- Wambulwa, M.C.; Meegahakumbura, M.K.; Chalo, R.; Kamunya, S.; Muchugi, A.; Xu, J.C.; Liu, J.; Li, D.Z.; Gao, L.M. Nuclear microsatellites reveal the genetic architecture and breeding history of tea germplasm of east Africa. Tree Genet. Genomes 2016, 12, 1–10. [Google Scholar] [CrossRef]
- Pervaiz, T.; Sun, X.; Zhang, Y.; Tao, R.; Zhang, J.; Fang, J. Association between chloroplast and mitochondrial dna sequences in Chinese Prunus genotypes (Prunus persica, Prunus domestica, and Prunus avium). BMC Plant Biol. 2015, 15, 4. [Google Scholar] [CrossRef]
- Yuan, Q.J.; Zhang, Z.Y.; Peng, H.; Ge, S. Chloroplast phylogeography of dipentodon (dipentodontaceae) in southwest china and northern Vietnam. Mol. Ecol. 2008, 17, 1054–1065. [Google Scholar] [CrossRef]
- Hewitt, G. The genetic legacy of the Quaternary ice ages. Nature 2000, 405, 907–913. [Google Scholar] [CrossRef]
- Petit, R.J.; Duminil, J.; Fineschi, S.; Hampe, A.; Salvini, D.; Vendramin, G.G. Comparative organization of chloroplast, mitochondrial and nuclear diversity in plant populations. Mol. Ecol. 2005, 14, 689–701. [Google Scholar] [CrossRef]
- Garcia-Lor., A.; Luro, F.; Ollitrault, P.; Navarro, L. Genetic diversity and population structure analysis of mandarin germplasm by nuclear, chloroplastic and mitochondrial markers. Tree Genet. Genomes 2015, 11, 1–15. [Google Scholar] [CrossRef]
- Mingeot, D.; Husson, C.; Mertens, P.; Watillon, B.; Bertin, P.; Druart, P. Genetic diversity and genetic structure of black alder (Alnus glutinosa [L.] Gaertn) in the Belgium-Luxembourg-France cross-border area. Tree Genet. Genomes 2016, 12, 1–12. [Google Scholar] [CrossRef]
- Zhang, X.; Shen, S.K.; Wu, F.Q.; Wang, Y.H. Inferring genetic variation and demographic history of Michelia yunnanensis Franch. (Magnoliaceae) from chloroplast DNA sequences and microsatellite markers. Front. Plant Sci. 2017, 8, 583. [Google Scholar] [CrossRef] [PubMed]
- Breed, M.; Ottewell, K.; Gardner, M.; Marklund, M.H.K.; Dormontt, E.E.; Lowe, A.J. Mating patterns and pollinator mobility are critical traits in forest fragmentation genetics. Heredity 2015, 115, 108–114. [Google Scholar] [CrossRef] [PubMed]
- Aguilar, R.; Cristóbal-Pérez, E.J.; Balvino-Olvera, F.J.; Aguilar-Aguilar, M.; Aguirre-Acosta, N.; Ashworth, L.; Lobo, J.A.; Martén-Rodríguez, S.; Fuchs, E.J.; Sanchez-Montoya, G.; et al. Habitat fragmentation reduces plant progeny quality: A global synthesis. Ecol. Lett. 2019, 22, 1163–1173. [Google Scholar] [CrossRef]
- Sáyago, R.; Quesada, M.; Aguilar, R.; Ashworth, L.; Lopezaraiza-Mikel, M.; Martén-Rodríguez, S. Consequences of habitat fragmentation on the reproductive success of two Tillandsia species with contrasting life history strategies. AoB Plants 2018, 10. [Google Scholar] [CrossRef]
- Hamrick, J.L. Response of forest trees to global environmental changes. For. Ecol. Manag. 2004, 197, 323–335. [Google Scholar] [CrossRef]
- Vranckx, G.; Jacquemyn, H.; Muys, B.; Honnay, O. Meta-analysis of susceptibility of woody plants to loss of genetic diversity through habitat fragmentation. Conserv. Biol. 2011, 26, 228–237. [Google Scholar] [CrossRef]
- Doyle, J. DNA protocols for plants—CTAB total DNA isolation. In Molecular Techniques in Taxonomy; Hewitt, G.M., Ed.; Springer: Berlin, Germany, 1991. [Google Scholar]
- Wang, X.; Huang, Y.; Long, C.L. Isolation and characterization of twenty-four microsatellite loci or Rhododendron decorum Franch (Ericaceae). Hortscience 2009, 44, 2028–2030. [Google Scholar] [CrossRef]
- Wang, N.; Qin, Z.C.; Yang, J.B.; Zhang, J. Development and characterization of 15 microsatellite loci for Rhododendron delavayi Franch. (Ericaceae). Hortscience 2010, 45, 457–459. [Google Scholar] [CrossRef]
- Li, L.F.; Yin, D.X.; Song, N. Genomic and EST microsatellites for Rhododendron aureum (Ericaceae) and cross-amplification in other congeneric species. Am. J. Bot. 2011, 98, 250–252. [Google Scholar] [CrossRef]
- Dakin, E.E.; Avise, J.C. Microsatellite null alleles in parentage analysis. Heredity 2004, 93, 504–509. [Google Scholar] [CrossRef] [PubMed]
- Fan, L.; Zheng, H.; Milne, R.I.; Zhang, L.; Mao, K. Strong population bottleneck and repeated demographic expansions of Populus adenopoda (salicaceae) in subtropical China. Ann. Bot. 2018, 121, 665–679. [Google Scholar] [CrossRef] [PubMed]
- Peakall, R.; Smouse, P.E. GENALEX 6: Genetic analysis in excel. Population genetic software for teaching and research. Mol. Ecol. Notes 2006, 6, 288–295. [Google Scholar] [CrossRef]
- Yeh, F.C.; Yang, R.; Boyle, T.B.; Ye, Z.; Mao, J.X. POPGENE, the User-Friendly Shareware for Population Genetic Analysis; University of Alberta: Edmonton, AB, Canada, 1997; Available online: http://www.ualberta.ca/~fyeh/ (accessed on 5 February 2020).
- Goudet, J. FSTAT (Version 1.2): A computer program to calculate F-statistics. J. Hered. 1995, 86, 485–486. [Google Scholar] [CrossRef]
- Excoffier, L.; Smouse, P.E.; Quattro, J.M. Analysis of molecular variance inferred from metric distances among DNA haplotypes: Application to human mitochondrial DNA restriction data. Genetics 1992, 131, 479–491. [Google Scholar]
- Excoffier, L.; Laval, G.; Schneider, S. Arlequin (Version 3.0): An integrated software package for population genetics data analysis. Evol. Bioinform. 2005, 1, 47. [Google Scholar] [CrossRef]
- Wright, S. Evolution in Mendelian populations. Genetics 1931, 16, 97. [Google Scholar]
- Ennos, R.A. Estimating the relative rates of pollen and seed migration among plant populations. Heredity 1994, 72, 250–259. [Google Scholar] [CrossRef]
- Abbott, R.J.; Brochmann, C. History and evolution of the arctic flora: In the footsteps of eric hultén. Mol. Ecol. 2003, 12, 299–313. [Google Scholar] [CrossRef]
- Wilson, G.A.; Rannala, B. Bayesian inference of recent migration rates using multilocus genotypes. Genetics 2003, 163, 1177–1191. [Google Scholar]
- Meirmans, P.G. Nonconvergence in Bayesian estimation of migration rates. Mol. Ecol. Resour. 2014, 14, 726–733. [Google Scholar] [CrossRef] [PubMed]
- Miller, M.P. Tools for population genetic analyses (TFPGA) 1.3: A Windows program for the analysis of allozyme and molecular population genetic data. Comput. Softw. 1997, 4, 157. [Google Scholar]
- Pritchard, J.K.; Stephens, M.; Donnelly, P. Inference of population structure using multilocus genotype data. Genetics 2000, 155, 945–959. [Google Scholar] [PubMed]
- Evanno, G.; Regnaut, S.; Goudet, J. Detecting the number of clusters of individuals using the software STRUCTURE: A simulation study. Mol. Ecol. 2005, 14, 2611–2620. [Google Scholar] [CrossRef] [PubMed]
- Earl, D.A. STRUCTURE HARVESTER: A website and program for visualizing STRUCTURE output and implementing the Evanno method. Conserv. Genet. Resour. 2012, 4, 359–361. [Google Scholar] [CrossRef]
- Piry, S.; Luikart, G.; Cornuet, J. BOTTLENECK: A computer program for detecting recent reductions in the effective size using allele frequency data. J. Hered. 1999, 90, 502–503. [Google Scholar] [CrossRef]
- Garza, J.C.; Williamson, E.G. Detection of reduction in population size using data from microsatellite loci. Mol. Ecol. 2001, 10, 305–318. [Google Scholar] [CrossRef]
- Swindell, S.R.; Plasterer, T.N. Sequence Data Analysis Guidebook; Humana Press: New York, NY, USA, 1997; pp. 75–89. [Google Scholar]
- Hall, T.A. BioEdit: A user-friendly biological sequence alignment editor and analysis program for Windows 95/98/NT. Nucleic Acids Symp. Ser. 1999, 41, 95–98. [Google Scholar]
- Swofford, D.L. PAUP*: Phylogenetic Analysis Using Parsimony (and Other Methods); Version 4.0b10; Sinauer Associates, Inc.: Sunderland, MA, USA, 2002. [Google Scholar]
- Librado, P.; Rozas, J. DnaSP v5: A software for comprehensive analysis of DNA polymorphism data. Bioinformatics 2009, 25, 1451–1452. [Google Scholar] [CrossRef]
- Pons, O.; Petit, R.J. Measuring and testing genetic differentiation with ordered versus unordered alleles. Genetics 1996, 144, 1237–1245. [Google Scholar]
- Bandelt, H.J.; Forster, P.; Röhl, A. Median-joining networks for inferring intraspecifc phylogenies. Mol. Biol. Evol. 1999, 16, 37–48. [Google Scholar] [CrossRef] [PubMed]
- Ronquist, F.; Huelsenbeck, J.P. MrBayes 3: Bayesian phylogenetic inference under mixed models. Bioinformatics 2003, 19, 1572–1574. Available online: http://tree.bio.ed.ac.uk/software/figtree/ (accessed on 5 February 2020). [CrossRef] [PubMed]
- Batalha-Filho, H.; Cabanne, G.S.; Miyaki, C.Y. Phylogeography of an Atlantic forest passerine reveals demographic stability through the last glacial maximum. Mol. Phylogenet. Evol. 2012, 65, 892–902. [Google Scholar] [CrossRef] [PubMed]
- Graur, D.; Li, W.H. Fundamentals of Molecular Evolution; Sinauer Associates: Sunderland, MA, USA, 2000. [Google Scholar]
- Drummond, A.J.; Rambaut, A. BEAST: Bayesian evolutionary analysis by sampling trees. BMC Evol. Biol. 2007, 7, 214. [Google Scholar] [CrossRef]
- Tamura, K.; Stecher, G.; Peterson, D.; Filipski, A.; Kumar, S. MEGA6: Molecular evolutionary genetics analysis version 6.0. Mol. Boil. Evol. 2013, 30, 2725–2729. [Google Scholar] [CrossRef]
- Phillips, S.J.; Anderson, R.P.; Schapire, R.E. Maximum entropy modeling of species geographic distributions. Ecol. Model. 2006, 190, 231–259. [Google Scholar] [CrossRef]
- Hijmans, R.J.; Cameron, S.E.; Parra, J.L.; Jones, P.G.; Jarvis, A. Very high resolution interpolated climate surfaces for global land areas. Int. J. Clim. 2005, 25, 1965–1978. Available online: http://www.worldclim.org (accessed on 5 February 2020). [CrossRef]
- Feng, X.Y.; Wang, Y.; Gong, X. Genetic diversity, genetic structure and demographic history of Cycas simplicipinna (Cycadaceae) assessed by DNA sequences and SSR markers. BMC Plant Biol. 2014, 14, 187. [Google Scholar] [CrossRef]
- Li, M.W.; Chen, S.F.; Shi, S.; Zhang, Z.; Liao, W.B.; Wu, W.; Zhou, R.C.; Fan, Q. High genetic diversity and weak population structure of Rhododendron jinggangshanicum, a threatened endemic species in Mount Jinggangshan of China. Biochem. Syst. Ecol. 2015, 58, 178–186. [Google Scholar] [CrossRef]
- Tan, X.X.; Li, Y.; Ge, X.J. Development and characterization of eight polymorphic microsatellites for Rhododendron simsii Planch (Ericaceae). Conserv. Genet. 2009, 10, 1553–1555. [Google Scholar] [CrossRef]
- Kondo, T.; Nakagishi, N.; Isagi, Y. Shaping of genetic structure along Pleistocene and modern river systems in the hydrochorous riparian azalea, Rhododendron ripense (Ericaceae). Am. J. Bot. 2009, 96, 1532–1543. [Google Scholar] [CrossRef] [PubMed]
- Hirao, A.S. Kinship between parents reduces offspring fitness in a natural population of Rhododendron brachycarpum. Ann. Bot. 2010, 105, 637–646. [Google Scholar] [CrossRef]
- Bruni, I.; De Mattia, F.; Labra, M.; Grassi, F.; Fluch, S.; Berenyi, M.; Ferrari, C. Genetic variability of relict Rhododendron ferrugineum L. populations in the Northern Apennines with some inferences for a conservation strategy. Plant Biosyst. 2012, 146, 24–32. [Google Scholar] [CrossRef]
- Nybom, H. Comparison of different nuclear DNA markers for estimating intraspecific genetic diversity in plants. Mol. Ecol. 2004, 13, 1143–1155. [Google Scholar] [CrossRef] [PubMed]
- Yoichi, W.; Sakaguchi, S.; Ueno, S.; Tomaru, N.; Uehara, K. Development and characterization of EST-SSR markers for the genus Rhododendron section Brachycalyx (Ericaceae). Plant Species Biol. 2017, 32, 455–459. [Google Scholar] [CrossRef]
- Ikeda, H.; Yoneta, Y.; Higashi, H.; Eidesen, P.B.; Barkalov, V.; Yakubov, V.; Brochmann, C.; Setoguchi, H. Persistent history of the bird-dispersed arctic-alpine plant Vaccinium vitis-idaea L. (Ericaceae) in Japan. J. Plant Res. 2015, 128, 437–444. [Google Scholar] [CrossRef] [PubMed]
- Hamrick, J.L.; Godt, M.J.W. Allozyme diversity in plant species. In Plant Population Genetics, Breeding, and Genetic Resources; Brown, A.H.D., Clegg, M.T., Kahler, A.L., Weir, B.S., Eds.; Sinauer: Sunderland, MA, USA, 1989; pp. 43–63. [Google Scholar]
- Setoguchi, H.; Mitsui, Y.; Ikeda, H.; Nomura, N.; Tamura, A. Genetic structure of the critically endangered plant Tricyrtis ishiiana (Convallariaceae) in relict populations of Japan. Conserv. Genet. 2011, 12, 491–501. [Google Scholar] [CrossRef]
- Escaravage, N.; Wagner, J. Pollination effectiveness and pollen dispersal in a Rhododendron ferrugineum (Ericaceae) population. Plant Biol. 2004, 6, 606–615. [Google Scholar] [CrossRef]
- Stephenson, C.M.; Kohn, D.; Park, K.; Atkinson, R.J.; Edwards, C.; Travis, J.M.J. Testing mechanistic models of seed dispersal for the invasive Rhododendron ponticum (L.). Perspect. Plant Ecol. Evol. Syst. 2007, 9, 15–28. [Google Scholar] [CrossRef]
- Han, Q.X.; Higashi, H.; Mitsui, Y.; Setoguchi, H. Distinct phylogeographic structures of wild radish (Raphanus sativus L. var. raphanistroides Makino) in Japan. PLoS ONE 2015, 10, e0135132. [Google Scholar] [CrossRef]
- Cheng, B.B.; Zheng, Y.Q.; Sun, Q.W. Genetic diversity and population structure of Taxus cuspidata in the Changbai mountains assessed by chloroplast DNA sequences and microsatellite markers. Biochem. Syst. Ecol. 2015, 63, 157–164. [Google Scholar] [CrossRef]
- Yao, X.H.; Ye, Q.G.; Kang, M.; Huang, H.W. Microsatellites analysis reveals interpopulation differention and gene flow in endangered tree Changiostyrax dolichocarpa (Styracaceae) with fragmented distribution in central China. New Phytol. 2007, 176, 472–480. [Google Scholar] [CrossRef] [PubMed]
- Côté, C.L.; Gagnaire, P.A.; Bourret, V.; Verreault, G.; Castonguay, M.; Bernatchez, L. Population genetics of the American eel (Anguilla rostrata): Fst = 0 and North Atlantic Oscillation effects on demographic fluctuations of a panmictic species. Mol. Ecol. 2013, 22, 1763–1776. [Google Scholar] [CrossRef] [PubMed]
- Escaravage, N.; Pornon, A.; Doche, B.; Till-Bottraud, I. Breeding system in an alpine species: Rhododendron ferrugineum (Ericaceae) in the French northern Alps. Can. J. Bot. 1997, 75, 736–743. [Google Scholar] [CrossRef]
- Hahn, C.Z.; Michalski, S.G.; Durka, W. Gene flow in, and mating system of, Rhododendron simsii in a nature reserve in subtropical china. Nord. J. Bot. 2017, 35, 1–7. [Google Scholar] [CrossRef]
- Harrison, S.P.; Yu, G.; Takahara, H.; Prentice, I.C. Diversity of temperate plants in East Asia. Nature 2001, 413, 129–130. [Google Scholar] [CrossRef]
- Bisconti, R.; Canestrelli, D.; Colangelo, P.; Nascetti, G. Multiple lines of evidence for demographic and range expansion of a temperate species (Hyla sarda) during the last glaciation. Mol. Ecol. 2011, 20, 5313–5327. [Google Scholar] [CrossRef]
- Pinheiro, F.; De Barros, F.; Palma‒Silva, C.; Fay, M.F.; Lexer, C.; Cozzolino, S. Phylogeography and genetic differentiation along the distributional range of the orchid Epidendrum fulgens: A Neotropical coastal species not restricted to glacial refugia. J. Biogeogr. 2011, 38, 1923–1935. [Google Scholar] [CrossRef]
- Gao, Y.D.; Zhang, Y.; Gao, X.F.; Zhu, Z.M. Pleistocene glaciations, demographic expansion and subsequent isolation promoted morphological heterogeneity: A phylogeographic study of the alpine Rosa sericea complex (Rosaceae). Sci. Rep. 2015, 5, 11698. [Google Scholar] [CrossRef]
- Zhao, Y.J.; Gong, X. Genetic structure of the endangered Leucomeris decora (Asteraceae) in China inferred from chloroplast and nuclear DNA markers. Conserv. Genet. 2014, 13, 271–281. [Google Scholar] [CrossRef]


| Location | Population Code | Latitude | Longitude | Altitude (m) | N (cpDNA/SSR) | Haplotypes (No.) | cpDNA | |
|---|---|---|---|---|---|---|---|---|
| Hd | Pi | |||||||
| Yunnan | BJS | 24°24′31″ | 100°38’15″ | 2670 | 6/6 | H1 | 0 | 0 |
| DLT | 24°28′57″ | 100°41’47″ | 2660 | 14/15 | H1, H2, H3 | 0.538 | 0.00031 | |
| BCL | 26°3′26″ | 101°03’11″ | 2950 | 15/21 | H1 | 0 | 0 | |
| YS | 27°13′09″ | 103°07’43″ | 2887 | 16/23 | H12 | 0 | 0 | |
| JZS | 26°04′07″ | 102°49’56″ | 3250 | 16/21 | H11 | 0 | 0 | |
| Sichuan | QLB1 | 27°53′46″ | 102°30’56″ | 3250 | 14/22 | H4, H5 | 0 | 0 |
| QLB2 | 27°53′19″ | 102°30’36″ | 3303 | 14/23 | H4, H5, H6 | 0.264 | 0.00028 | |
| QLB3 | 27°54′0.4″ | 102°31’44″ | 3332 | 14/17 | H4, H6 | 0.264 | 0.00028 | |
| GDX | 28°24′29″ | 103°14’33″ | 2966 | 15/20 | H7, H8, H9 | 0.514 | 0.00115 | |
| LJS | 27°35′19″ | 102°23’34″ | 2833 | 15/20 | H4, H5, H10 | 0 | 0 | |
| LZS | 26°47′48″ | 102°12’30″ | 3335 | 16/24 | H5 | 0 | 0 | |
| Total | 11 | 155/212 | H1–H12 | 0.788 | 0.0018 | |||
| Population | NP | Ra | NA | AE | I | HO | HE | Fis | PPB (%) |
|---|---|---|---|---|---|---|---|---|---|
| BCL | 10 | 3.574 | 5.800 | 3.215 | 1.061 | 0.429 | 0.474 | 0.119 | 100.00% |
| BJS | 2 | 3.071 | 3.100 | 2.011 | 0.740 | 0.300 | 0.399 | 0.331 | 90.00% |
| DLT | 12 | 4.178 | 6.100 | 3.804 | 1.281 | 0.513 | 0.578 | 0.148 | 90.00% |
| GDX | 3 | 3.681 | 5.800 | 3.479 | 1.183 | 0.452 | 0.547 | 0.200 | 100.00% |
| JZS | 12 | 4.231 | 6.100 | 3.085 | 1.252 | 0.401 | 0.605 | 0.357 | 100.00% |
| LJS | 8 | 3.841 | 6.700 | 3.169 | 1.228 | 0.478 | 0.561 | 0.167 | 100.00% |
| LZS | 7 | 3.676 | 6.200 | 3.114 | 1.230 | 0.558 | 0.585 | 0.068 | 90.00% |
| QLB1 | 4 | 3.689 | 5.800 | 3.213 | 1.183 | 0.515 | 0.556 | 0.098 | 100.00% |
| QLB2 | 3 | 3.618 | 6.200 | 2.994 | 1.086 | 0.417 | 0.486 | 0.165 | 100.00% |
| QLB3 | 5 | 3.718 | 5.900 | 3.118 | 1.187 | 0.498 | 0.541 | 0.111 | 90.00% |
| YS | 11 | 3.937 | 6.900 | 3.954 | 1.319 | 0.547 | 0.605 | 0.119 | 100.00% |
| Mean | 7 | 3.747 | 5.873 | 3.196 | 1.159 | 0.464 | 0.540 | 0.171 | 96.36% |
| Source of Variation | d.f. | Sum of Squares | Variance Components | Percentage of Variation (%) | ||
|---|---|---|---|---|---|---|
| SSR data | Among populations | 10 | 237.748 | 0.548 | 16.47 | FST = 0.165 *** |
| Within populations | 413 | 1148.398 | 2.781 | 83.53 | ||
| Total | 423 | 1386.146 | 3.329 | |||
| cpDNA sequences | Among populations | 10 | 276.023 | 1.940 | 84.07 | FST = 0.841 *** |
| Within populations | 144 | 52.919 | 0.367 | 15.93 | ||
| Total | 154 | 328.942 | 2.314 |
| Population | BCL | BJS | DLT | GDX | JZS | LJS | LZS | QLB1 | QLB2 | QLB3 | YS |
|---|---|---|---|---|---|---|---|---|---|---|---|
| BCL | 0 | ||||||||||
| BJS | 0.311 | 0 | |||||||||
| DLT | 0.469 | 2.024 | 0 | ||||||||
| GDX | 0.734 | 0.504 | 0.817 | 0 | |||||||
| JZS | 1.257 | 0.463 | 0.699 | 1.439 | 0 | ||||||
| LJS | 2.013 | 0.439 | 0.715 | 2.62 | 2.208 | 0 | |||||
| LZS | 1.582 | 0.481 | 0.781 | 1.721 | 1.454 | 2.86 | 0 | ||||
| QLB1 | 1.895 | 0.421 | 0.674 | 1.636 | 2.146 | 10.591 | 2.97 | 0 | |||
| QLB2 | 2.363 | 0.307 | 0.462 | 1.059 | 1.649 | 3.782 | 1.882 | 4.021 | 0 | ||
| QLB3 | 2.029 | 0.365 | 0.572 | 1.093 | 1.582 | 2.785 | 2.099 | 3.461 | 7.452 | 0 | |
| YS | 1.100 | 0.517 | 0.833 | 2.642 | 1.525 | 3.207 | 1.621 | 1.862 | 1.479 | 1.617 | 0 |
| Population-> | BCL | BJS | DLT | GDX | JZS | LJS | LZS | QLB1 | QLB2 | QLB3 | YS |
|---|---|---|---|---|---|---|---|---|---|---|---|
| BCL | 0.695 | 0.029 | 0.029 | 0.028 | 0.027 | 0.055 | 0.028 | 0.028 | 0.027 | 0.028 | 0.028 |
| BJS | 0.029 | 0.696 | 0.028 | 0.028 | 0.028 | 0.051 | 0.028 | 0.028 | 0.029 | 0.027 | 0.029 |
| DLT | 0.029 | 0.027 | 0.695 | 0.028 | 0.028 | 0.053 | 0.027 | 0.027 | 0.029 | 0.028 | 0.029 |
| GDX | 0.028 | 0.027 | 0.027 | 0.697 | 0.029 | 0.052 | 0.027 | 0.028 | 0.028 | 0.028 | 0.028 |
| JZS | 0.027 | 0.028 | 0.028 | 0.026 | 0.695 | 0.057 | 0.027 | 0.028 | 0.028 | 0.029 | 0.027 |
| LJS | 0.030 | 0.028 | 0.027 | 0.029 | 0.028 | 0.719 | 0.027 | 0.028 | 0.029 | 0.027 | 0.029 |
| LZS | 0.028 | 0.028 | 0.029 | 0.028 | 0.028 | 0.057 | 0.694 | 0.027 | 0.026 | 0.028 | 0.027 |
| QLB1 | 0.029 | 0.027 | 0.027 | 0.028 | 0.027 | 0.055 | 0.027 | 0.694 | 0.028 | 0.029 | 0.028 |
| QLB2 | 0.029 | 0.028 | 0.026 | 0.029 | 0.027 | 0.055 | 0.028 | 0.029 | 0.695 | 0.027 | 0.027 |
| QLB3 | 0.028 | 0.029 | 0.028 | 0.028 | 0.027 | 0.055 | 0.027 | 0.028 | 0.028 | 0.695 | 0.028 |
| YS | 0.028 | 0.028 | 0.026 | 0.028 | 0.027 | 0.056 | 0.028 | 0.026 | 0.029 | 0.028 | 0.695 |
| Population | Two Phased Model (T.P.M) | Step Mutation Model (S.M.M) | Mode Shift | Garza–Williamson Index | ||
|---|---|---|---|---|---|---|
| Sign Test | Wilcoxon Test | Sign Test | Wilcoxon Test | |||
| BCL | 0.614 | 0.539 | 0.170 | 0.813 | L | 0.336 |
| BJS | 0.211 | 0.410 | 0.068 | 0.545 | L | 0.399 |
| DLT | 0.399 | 0.652 | 0.183 | 0.839 | L | 0.329 |
| GDX | 0.158 | 0.862 | 0.002 ** | 0.998 | L | 0.492 |
| JZS | 0.176 | 0.813 | 0.183 | 0.958 | L | 0.361 |
| LJS | 0.178 | 0.862 | 0.169 | 0.958 | L | 0.278 |
| LZS | 0.074 | 0.947 | 0.003 ** | 0.995 | L | 0.297 |
| QLB1 | 0.370 | 0.423 | 0.181 | 0.947 | L | 0.284 |
| QLB2 | 0.371 | 0.461 | 0.058 | 0.984 | L | 0.323 |
| QLB3 | 0.065 | 0.862 | 0.074 | 0.984 | L | 0.333 |
| YS | 0.612 | 0.461 | 0.389 | 0.722 | L | 0.349 |
© 2020 by the authors. Licensee MDPI, Basel, Switzerland. This article is an open access article distributed under the terms and conditions of the Creative Commons Attribution (CC BY) license (http://creativecommons.org/licenses/by/4.0/).
Share and Cite
Zhang, X.; Liu, Y.-H.; Wang, Y.-H.; Shen, S.-K. Genetic Diversity and Population Structure of Rhododendron rex Subsp. rex Inferred from Microsatellite Markers and Chloroplast DNA Sequences. Plants 2020, 9, 338. https://doi.org/10.3390/plants9030338
Zhang X, Liu Y-H, Wang Y-H, Shen S-K. Genetic Diversity and Population Structure of Rhododendron rex Subsp. rex Inferred from Microsatellite Markers and Chloroplast DNA Sequences. Plants. 2020; 9(3):338. https://doi.org/10.3390/plants9030338
Chicago/Turabian StyleZhang, Xue, Yuan-Huan Liu, Yue-Hua Wang, and Shi-Kang Shen. 2020. "Genetic Diversity and Population Structure of Rhododendron rex Subsp. rex Inferred from Microsatellite Markers and Chloroplast DNA Sequences" Plants 9, no. 3: 338. https://doi.org/10.3390/plants9030338
APA StyleZhang, X., Liu, Y.-H., Wang, Y.-H., & Shen, S.-K. (2020). Genetic Diversity and Population Structure of Rhododendron rex Subsp. rex Inferred from Microsatellite Markers and Chloroplast DNA Sequences. Plants, 9(3), 338. https://doi.org/10.3390/plants9030338