Article

Sugar and Hormone Dynamics and the Expression Profiles of SUT/SUC and SWEET Sugar Transporters during Flower Development in Petunia axillaris

1
College of Horticulture and the Fujian Provincial Key Laboratory of Plant Functional Biology, Fujian Agriculture and Forestry University, Fuzhou 350002, China
2
Institute of Horticultural Biotechnology, Fujian Agriculture and Forestry University, Fuzhou 350002, China
3
College of Plant Protection, Fujian Agriculture and Forestry University, Fuzhou 350002, China
4
College of life Sciences, Joint International Research Laboratory of Water and Nutrition in Crops, Fujian Agriculture and Forestry University, Fuzhou 350002, China
*
Author to whom correspondence should be addressed.
Co-first author, these authors contributed equally to this work.
Current address: Plant Production Department, Faculty of Agriculture (Saba Basha), Alexandria University, Alexandria 21531, Egypt
Plants 2020, 9(12), 1770; https://doi.org/10.3390/plants9121770
Submission received: 16 November 2020 / Revised: 10 December 2020 / Accepted: 11 December 2020 / Published: 14 December 2020
(This article belongs to the Special Issue Plant Development)

Abstract

:
Flowering is the first committed step of plant sexual reproduction. While the developing flower is a strong sink requiring large quantity of sugars from photosynthetic source tissues, this process is under-temper-spatially controlled via hormone signaling pathway and nutrient availability. Sugar transporters SUT/SUC and SWEET mediate sugars movement across membranes and play a significant role in various physiological processes, including reproductive organ development. In Petunia axillaris, a model ornamental plant, 5 SUT/SUC and 36 SWEET genes are identified in the current version of the genome. Analysis of their gene structure and chromosomal locations reveal that SWEET family is moderately expanded. Most of the transporter genes are abundantly expressed in the flower than in other organs. During the five flower developmental stages, transcript levels of PaSUT1, PaSUT3, PaSWEET13c, PaSWEET9a, PaSWEET1d, PaSWEET5a and PaSWEET14a increase with the maturation of the flower and reach their maximum in the fully open flowers. PaSWEET9c, the nectar-specific PhNEC1 orthologous, is expressed in matured and fully opened flowers. Moreover, determination of sugar concentrations and phytohormone dynamics in flowers at the five developmental stages shows that glucose is the predominant form of sugar in young flowers at the early stage but depletes at the later stage, whereas sucrose accumulates only in maturated flowers prior to the corolla opening. On the other hand, GA3 content and to a less extent IAA and zeatin decreases with the flower development; however, JA, SA and ABA display a remarkable peak at mid- or later flower developmental stage.

1. Introduction

Being the principal product of photosynthesis, sugars in the form of sucrose are translocated from source organs (leaves) to sink organs (modified leaves, roots, seeds, and reproductive organs) via phloem sap [1,2,3]. The availability of sugars for various mechanisms in plants has profound impacts on plant growth and development [4,5,6]. Evidence emerging in recent years implies that sugars can also act as signaling molecules that control distinct aspects of plant development and the cross-talk between sugar-based signaling pathways and various phytohormones play important roles in modulating plant growth and development [7]. Flowering is a major reproductive-development event in higher plants that under strictly controlled by endogenous signaling pathways influenced by sugars availability and phytohormones interactions [8]. After the floral initiation or vegetative-to-reproductive transition, the floral bud undergoes differentiation and ontogeny to build up a flower or an inflorescence and becomes an active sink that requires large net influx of sugars from the photosynthetic leaves.
Efflux and influx of sugars across the cellular and subcellular compartments are facilitated by sugar transport proteins. Plant genome encodes at least three families of sugar transporters: monosaccharide/polyol transporters (MSTs), sucrose transporters (SUTs or SUCs), and SWEETs [9] [10]. MSTs are associated with sugar influx and transport glucose and other substrates [11], while SUTs and SWEETs play a significant role in phloem loading and unloading [2]. However, SWEETs are bidirectional sugar transporters and mainly involved in sugar efflux [12,13].
The SUTs in plants are related to the glycoside-pentoside-hexuronide (GPH) cation symporter family that belongs to the major facilitator superfamily (MFS) and are typically encoded by three to nine SUT/SUC genes, e.g., in Arabidopsis 7 SUC-like genes and two pseudogenes, which are clustered into three types [3,14]. While type I SUTs, the eudicot-specific transporters, are mainly found in the plasma membrane of sieve element and companion cells to facilitate phloem loading, at least one of the members AtSUC1 is required for pollen germination [15,16,17,18]. Type II SUTs are phylogenetically separated between dicot (IIA) and monocot (IIB) proteins and have demonstrated roles in phloem loading or unloading in both sink and source tissues [9]. Although most SUTs studied are plasma membrane-localized, some transporters from the type III SUTs are tonoplast proteins, for example the PtaSUT4 in Populus transport sucrose to vacuole for storage to control the cytosolic sucrose concentration [19,20]. Plasma membrane-localized type III SUTs proteins have also been implicated in sucrose signaling, in addition to the type II protein LeSUT2 and AtSUT2 [21,22,23].
The SWEETs transporter family is the newest identified class of sugar transporters previously recognized as Medicago truncatula nodulin 3 (MtN3)/saliva [24]. SWEETs belong to a superfamily of transporters containing seven transmembrane helices and they show a pair of structural repeats that folds into two transmembrane domains connected by a loop [13,25,26]. SWEETs are localized in cellular and organelle membranes [4,27,28], and are widely expressed in plant tissues [12,29]. Recent developments in whole-genome sequencing have resulted in genome-wide identification of SWEETs in an increasing number of plant species including cultivated crops, and fruits and vegetables of immense agricultural importance, such as rice (Oryza sativa) [30], wheat (Triticum aestivum) [31], soybean (Glycine max) [32], sorghum (Sorghum bicolor) [33], oilseed rape (Brassica napus) [1], grape (Vitus vinifera) [34], apple (Malus domestica) [35], banana (Musa acuminate) [36], cabbage (Brassica oleracea) [37], tomato (Solanum lycopersicum) [38] and potato (Solanum tuberosum) [39]. Typically, SWEET gene families in angiosperms contain 15 to 25 members, for example, 17 and 21 in arabidopsis and rice, respectively [40]. However, evolution in various plant species resulted in duplication of SWEET genes such as 30 in cabbage, 52 in soybean, 68 in oilseed rape and 121 in wheat. Functional characterization and biochemical analysis of SWEET sugar transporters have revealed their important roles in diverse physiological processes in plants, such as leaf senescence [41], plant nectar secretion [42,43], response to biotic, abiotic and hormonal stress [34,44,45,46,47,48], seed germination [49], and pollen, seed (filling) and fruit development [28,50,51,52,53,54]. The expression of SWEETs in the contest of regulation of source-to-sink sucrose transport is also modulated under different physiological conditions [55].
Once imported into the developing flower, sucrose is cleaved to glucose and fructose or otherwise storage intracellularly. The conversion and utilization of sugar molecules is dynamically controlled by the feedback of metabolism and morphogenesis processes [56]. The development from a tiny bud to a fully expanded flora organ, the mature flower, involves not only the cell division and proliferation but also the gain of specialized traits like color, scent and taste which are vital for the success in pollination and fertilization [57]. Given the complexity in the development of the flower, the regulatory network of sugar metabolism in this process is far from fully explored. While extensive functional studies of transporters in floral tissues is carried out in the model plants Arabidopsis and rice, fewer investigation in other species with agricultural or horticultural importance are reported so far.
Petunia is an important ornamental plant world-wide and is emerging also as an ideal model for genetic study pertaining to ornamental traits [58]. Here we report the whole-genome identification of SUT and SWEET genes and their tissue-specific expression in the wild-type Petunia axillaris. We also analyze the flower development-associated transcript abundance of the transporters with respect to the soluble sugar content and the main plant hormone accumulation.

2. Results

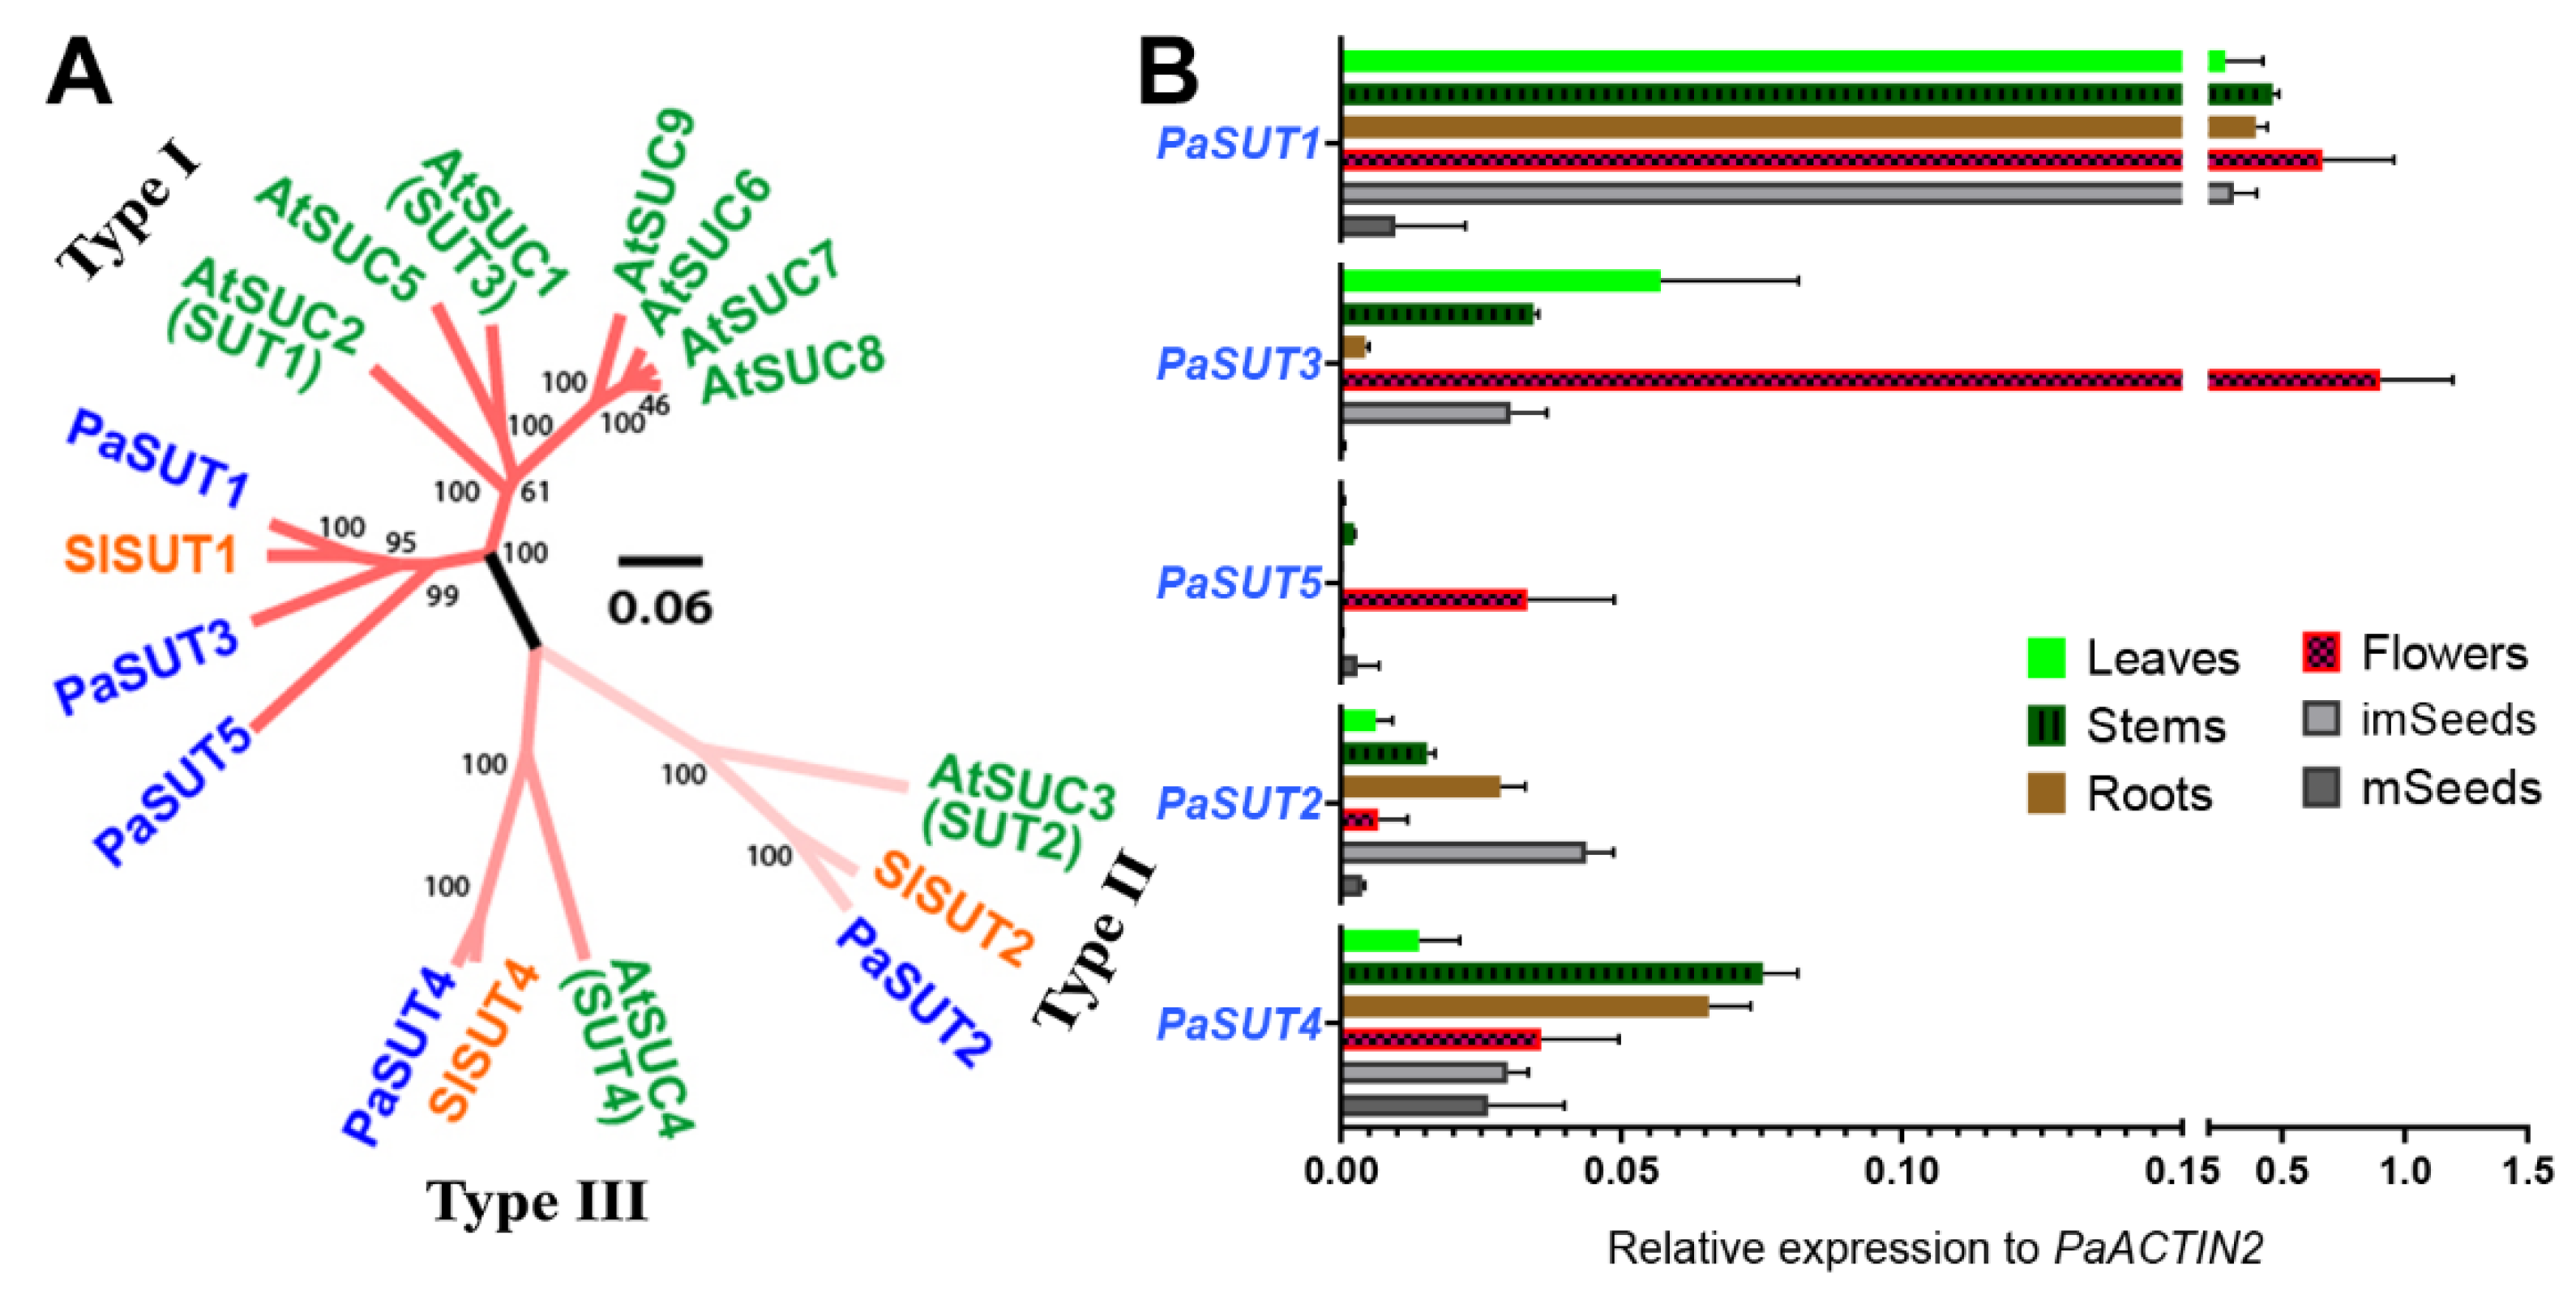
2.1. The Five-Gene Family of SUT/SUC Transporters in P. axillaris

The currently available genomic sequences in P. axillaris provide a base for searching the complete set of genes encoding sugar transporters. Through homologous search and manual curation, 5 SUT and 36 SWEET genes were identified in the P. axillaris genome version 1.62 [59]. These genes were then designated as PaSUT1 to PaSUT5 and PaSWEET1a to PaSWEET 17 based on Arabidopsis orthologous sequences, respectively (Table 1). Using three different bioinformatic prediction programs, the protein subcellular localization was also analyzed, which showed that the five SUTs were most likely localized to plasma membrane while considerable numbers of the SWEETs seemed to be endomembrane system-associated transporters, especially in the vacuolar membrane (tonoplast) (Table S1).
The small SUT/SUC gene family in P. axillaris consists of five members. Similar to the situation in Arabidopsis, both Type II and Type III SUT have only one single member, PaSUT2 and PaSUT4, respectively. The other three members, PaSUT1/3/5, belong to the Type I subfamily which has seven counterparts in Arabidopsis (Figure 1A). These 5 PaSUT genes are located at separated scaffolds of the current genome version (Figure S1A). The intron-exon structure of the SUT genes is somehow diverse, with the longest and shortest sequences being found for PaSUT4 (11907 bp) and PaSUT1 (4166 bp), respectively (Figure S2A).
With the whole-genome identification of the PaSUT genes, we were able to examine the mRNA abundance in different organs and tissues, including leaves, stems, roots, flowers (fully opened), immature seed and mature seeds.
Among the five members, PaSUT1 is the most highly expressed gene in almost all tissues tested, except in mature seeds, which contains very low detectable mRNA for all PaSUTs. Similar to PaSUT1, the other two Type I genes PaSUT3 and PaSUT5 also display a preferential expression in flowers. Yet quantitatively, expression of the PaSUT5 is much lower as compared to both PaSUT1 or PaSUT3. The PaSUT5 seems to be rarely expressed in most tissues except for flowers. On the other hand, PaSUT2 is preferentially expressed in immature seeds, roots and stems, whilst PaSUT4 is similarly expressed in most tissues (Figure 1B).

2.2. The Genome of P. axillaris Encode 36 Genes for the SWEET Transporters with Disparate Tissue Expression Profile

The SWEET family in P. axillaris is considerably expanded which includes 36 members, given that angiosperm species with known genome sequence normally contain between 15 and 30 SWEET genes [40]. The Petunia genes are well separated in the four clades each containing 9, 6, 18 and 3 genes, respectively, as supported by the phylogenetic relationships. For a comparison, clade-specific members in the 17-gene-family in A. thaliana are 3, 4, 7 and 2, respectively (Figure 2A). Analysis of the chromosomal location of the PaSWEET genes indicates that at least three tandem-gene-locus clusters exist for SWEETs. One three-gene cluster is found for PaSWEET1e/Peaxi162Scf00263g01423, PaSWEET1d/Peaxi162Scf00263g00156 and PaSWEET1a/ Peaxi162Scf00263g00161 within a ~20 kb region of the same scaffold, oriented in the same direction (Figure S1B). A second tandem gene array contains six SWEET sequences (PaSWEET12a, PaSWEET14c, PaSWEET13c, PaSWEET14d, PaSWEET14a and PaSWEET11a) located in a ~113kb region of the scaffold00516. Other tandem genes are PaSWEET16b and PaSWEET17 that together occupy a ~12 kb region (Figure S1B). It is likely that tandem gene duplication or triplication events may contribute to the expansion of SWEET family, especially in the clade I and III, in P. axillaris [59]. In the current version of the genome annotation, PaSWEET4/Peaxi162Scf00102g01855.1 and PaSWEET11a/Peaxi162Scf00516g00125 are incorrectly predicted resulting in short mRNAs. We made a new prediction by including the neighboring region to obtain the true full-length mRNA and protein sequences via web-based gene structure prediction tool FGENESH [60], yielding the corrected full-length PaSWEET sequences (Table 1).
Within each clade, the intron-exon structure of the PaSWEET genes seems to be similar among close orthologs. For example, genes PaSWEET2a, PaSWEET2b, and PaSWEET2c all have six exons. Again, such similarity in intron/exon structure may hints gene replication events during evolution, e.g., gene duplication or triplication. However, some closely related genes also display a significant difference in structural arrangements (Figure S2B). For instance, PaSWEET14b have only five exons, while its closely related PaSWEET14a, PaSWEET14c, and PaSWEET14d contain more than 15 exons. In addition, two PaSWEET genes have only one exon, namely PaSWEET6 and PaSWEET7. Finally, most of PaSWEETs contain five to six exons, except the six genes PaSWEET5a, PaSWEET12a, PASWEET12b, PaSWEET13c, PaSWEET14a, PaSWEET14c and PaSWEET14d, which contained 16, 23, 22, 19, 31, 20 and 17 exons, respectively (Figure S2B).
The organ-specific expression profiles of the 36 PaSWEET genes reveal that the flower organ remains a major site for active transcription of these bidirectional sugar transporters, in which the gene expression levels are relatively higher as compared with that in the other tissues (Figure 2B–D). Specifically, PaSWEET13c, PaSWEET9a, PaSWEET14a, PaSWEET15a and PaSWEET9c are among the highly expressed clade III genes, while PaSWEET1d, PaSWEET5a and PaSWEET17 are the most abundantly expressed genes from clade I, II and IV, respectively (Figure 2C). In the developing or mature seeds, mRNA of single or multiple members from each clade could be detected. During the maturation of the seeds, expression levels of clade I and clade IV members (PaSWEET1e, 2a, 2c and 17), as well as the PaSWEET6 from clade II and PaSWEET11a, 11b, 14b, 15a and 15b from clade III decrease considerably, while those of PaSWEET5a, 9c and 13c are significantly upregulated (Figure 2D). It is also noted that transcripts of the clade II genes PaSWEET5a and PaSWEET6 are only detected in reproductive tissues such as flowers and seeds (Figure 2C,D)
In the vegetative organs, transcripts of the clade II SWEET genes are hardly detected (Figure 2B,C). In leaves and stems, the expression profiles of SWEET genes are quite similar except those of PaSWEET1d, PaSWEET13a and PaSWEET13b, the former is expressed by ~ 7-fold more abundantly in stems while the latter two display higher mRNA levels in leaves than in stems by a factor of ~ 8-fold. Among all tissue tested, the root seems to express the lowest levels of SWEET genes (Figure 2B). However, the two clade IV members PaSWEET16a and PaSWEET16b are preferentially expressed in the root tissues and unmeasurable in all other tissues tested. Moreover, root tissues seem to express more single PaSWEET genes but the overall level of the transcripts is the lowest comparing to the other tissues (Figure 2C).

2.3. Expression Profiles of PaSUTs and PaSWEETs during Flower Development

The tissue-expression profiles of the two sugar transporter families indicated that the Petunia flowers are among the organs with highly transcribed sugar transporters. To refine the developmental effect on transporter gene expression, we further analyzed the stage-specific transcript accumulations. We divided the Petunia flower development into 5 stages after visible bud emergence (Figure 3A). Stage 1 of development is a green and close bud with a typical heigh of >9 mm. Stage 2 to 3 represent the elongating growth the Petunia corolla and stage 4 to 5 are characteristic of flower maturation and physiological shifts to pollinator attraction and fertilization. These stages are corresponded to the developmental stage 1 through 7 described in Petunia hybrida [61,62].
The five PaSUTs display a somehow similar expression pattern during the flower developmental stages, achieving maximal transcript level at corolla opening followed by a second higher peak of expression when the corolla starts to elongate at stage 3 (Figure 3B). However, PaSUT5 is expressed only at stage 5, and together with PaSUT2 and PaSUT4, these three have relatively lower transcript abundance in all stages of flower development. The remarkable upregulation of PaSUT1 and PaSUT3 during the initiation of corolla elongation and opening is a possible hint of large demands on sucrose import in these periods (Figure 3B).
Two of the Clade IV SWEET genes, namely PaSWEET16a and 16b, are hardly expressed in flowers of all stages, while only PaSWEET17 shows detectable yet low level of transcript mainly at later stage of development. Among the six genes in the Clade II, PaSWEET5a is the highest expressed gene which is upregulated in the later stages, being 5- and 6.8-fold increases in stage 5 than in stage 4 and 3, respectively (Figure 4). Interestingly, PaSWEET6 reaches its maximum expression at stage 3 significantly, whereas PaSWEET7 shows a small expression peak in close buds at stage 1. Upregulation of transcription is also evident in Clade 1 SWEET genes, at least for PaSWEET1d and PaSWEET2c-both of which display highest transcript level at stage 5 (Figure 4).
The Clade III genes of SWEET family are probably among the most actively transcribed during Petunia flower development. PaSWEET13c and PaSWEET9a represent the two most highly expressed members of the whole family and are upregulated during development, reaching their maximum levels at the corolla opening stage 5 (Figure 4). The other Clade III members also show more or less upregulation during flower opening, except for PaSWEET10a and PaSWEET10b which exhibit higher expression at the early stages (Figure 4).
Taken together, these results indicate that genes of the sugar transporter families are actively transcribed during flower development in petunia, notably at the fully maturation stage ready for pollination and fertilization, but the abundance of mRNA levels does not necessarily correspond to the protein functions.

2.4. Phytohormone Dynamics and Sugar Contents during Flower Development

In stage 1 through stage 5 of the flower development, JA, ABA, SA, GA3, IAA and Zeatin were detected by a liquid chromatography-tandem mass spectrometry (LC/MS) analysis. Both IAA and GA3 show a declining trend, the concentrations of which in the green close buds are 2.75 and 16.60 ng g−1 DW but decrease to 1.64 and 0 ng g−1 DW in the open flowers at the stage 5, respectively (Figure 5A). In contrast, ABA content increase from stage 1 to stage 4 by ~2.6 folds and then drops significantly after the corolla is open. JA and SA are found to accumulate dramatically at stage 3 when the corolla just start to elongate and expend, although the SA concentration has another similar peak in the close bud of stage 1. Zeatin is detected in the Petunia flowers at relatively lower concentrations throughout the development, with a decline tendance after corolla elongation at stage 3. The maximal concentrations of JA, ABA and SA in the Petunia flowers are 127.41, 43.98 and 21.04 ng g−1 DW, being the three most abundant hormones (Figure 5A). These results highlight a dynamic feature of hormonal control in flower development.
To monitor the sugar content variation during Petunia flower development, a gas chromatography–quadruple time-of-flight mass spectrometry (GC-qToF-MS) approach was employed to analyze the nontargeted metabolome in the floral tissues. Soluble sugars (sucrose, fructose, glucose, trehalose and maltose), phosphorylated sugar intermediates (glucose-6-phosphate and fructose-6-phosphate) and other aldose sugars (xylose, arabinose and fucose) were identified in the extracts from flower tissues at the five stages of development (Figure 5B).
During flower development from the close buds to the fully open flowers, accumulations of four sugars, namely xylose, maltose, arabinose and fucose, gradually increase to their maximum of 53.26, 2.88, 2.76 and 0.67 mg g-1 DW in the fully open flower of stage 5, respectively, while the contents of glucose, lactose, fructose-6-phosphate and to a less extent of trehalose decline from stage 1 through stage 5, and the maximal concentration of these four sugars in the close bud are 68.78, 5.62, 0.38 and 0.50 mg g−1 DW, respectively (Figure 5B). However, the concentrations of sucrose, fructose, and glucose-6-phosphate in the flower tissues fluctuate at different stages (Figure 5B). Sucrose, the major long-distant-translocated sugar, is found to accumulate slightly at stage 4 when the flower reaches its maturation, whereas glucose and fructose, the two important hexoses delivered from sucrose cleavage, are significantly accumulated in close bud at stage 1 (Figure 5B). Interestingly, glucose seems to be the predominant forms of soluble sugar during early stages (stage 1 to 3) of flower development with the concentrations ranging from 12.22 to 68.78 mg g−1 DW, although its content declines rapidly to almost undetectable level at the later stages after flower maturation (stage 4 and 5). Moreover, being an important sugar intermediate, the concentrations of glucose-6-phosphate are relatively stable during early stages before flower maturation (stage 1 to 3) (Figure 5B).

3. Discussion

Unlike in Arabidopsis [63,64,65], the cellular events of flower development in Petunia are less documented. During the development of the Petunia flower, stage 1 to 2 is morphologically characteristic of a green bud of slowly growth rate with either close or open calyx, and these young flowers are undergoing floral organ differentiation, especially the development of stamens and carpels (Figure S3). We found that the contents of GA and SA are negatively, while that of JA is positively correlated to these two stages. The soluble sugar, particularly in the form of glucose, is greatly accumulated at the stage 1 but reduced at the stage 2. In stage 3-4, the corolla tube starts to elongate along with increase in length of stamen filaments. At stage 4, stamen, pistil and corolla reach the maximum in size and the flower become maturated with a long corolla tube. The stage 5 is characterized as fully opened flower and recognized with volatile emission and pollinator attraction. In these mid-age flowers, GA level is continually declined, which seem not correlated with a role in stimulating organ elongation as reported in Arabidopsis [66]. In a recent study in P. hybrida line P720, it is demonstrated that GA is negatively associated with scent release by repressing transcript levels of genes involved in floral phenylpropanoid scent production, and its level decline with the flower maturation and opening [66,67]. In addition to GA, our data also indicate that JA and SA peak significantly at stage 3 but decline sharply thereafter, which coincides with the glucose depletion at the latter two stages (Figure 3B,C). Moreover, ABA is remarkedly high at the maturation stage 4. Given that various hormones are known to play diverse roles during flower development [68,69,70,71,72], it will be necessary to further determine the potential cross-talk among the hormone signaling pathways in the regulation of the flower development.
The later stages of flower development display a depletion in glucose level but an increased accumulation of the cell-wall related monosaccharides, xylose, fucose and arabinose, as well as the starch-breakdown product maltose (Figure 5B), a disaccharide known to be metabolized to form glucose and hexose phosphates [64,65,73]. These alterations in sugar concentration are possibly linked to pollen formation, biosynthesis of nectar and scent during flower maturation and corolla opening. However, the molecular regulation is still not known. Although genes that function in Petunia flower development have been reported, including several MADS-box type floral meristem/organ identity genes [74] and a sympetaly-regulating gene PhGATA19 [75], sugar transporter genes controlling the sugar dynamics in the flower are less studied. The hexose transporter PhSTP1 was earlier characterized in the growing Petunia pollen tubes [76] and the PhNEC1 (the SWEET9c in this study) was found to associate with nectar secretion phenotype, analog to the Arabidopsis AtSWEET9 [42,77]. Recently, a transcriptome analysis of P. axillaris flowers identified two SWEET homologs, termed as PaSWEET11 and PaSWEET15 by the authors, which were expressed differentially during the flower development [78]. However, their sequence identifies were not provided.
In the P. axillaris genome, 5 SUT and 36 SWEET homologous genes are identified (Figure 1 and Figure 2; Table 1). The tissue-specific expression pattern reveals that the flower expresses relatively high levels of members from both SUT and SWEET families, hinting the important function of sugar transport activity in the reproductive organ. Whereas the 5 SUT are expressed at the flower opening stage, PaSUT1 and PaSUT2 are notable for the most abundant mRNA at this stage. Evidence obtained by reverse genetic experiments from cucumber and tomato suggests that the orthologous of SUT1 and SUT2 are required for sugar availability to support pollen development and pollen tube growth, the loss-of function mutants of which are defeated in fertility [64,65]. On the other hand, although more SWEET genes are expressed abundantly in flower opening stage, variation in the expression patterning does exist, for example, PaSWEET10a in stage 1 and 2, PaSWEET6 and PaSWEET10b in stage 3. However, their specific roles and regulation are not known yet. Moreover, PaSWEET13c represents a constitutively active member during flower development and is the most expressed among the SWEET genes in root and reproductive tissues (Figure 2). At the flower opening stage, PaSWEET13c is ~10- and ~1.8-fold more abundant in transcript level than the nectar-specific PaSWEET9c and second high-abundance PaSWEET9a, respectively (Figure 4). Interestingly, PaSWEET9a is predicted as a tonoplast transporter based on similarity search (Table S1). The next step experiment would be to generate knock-out mutants of the individual transporter gene for further functional determination.

4. Conclusions

In summary, in the model ornamental plant P. axillaris, five SUT/SUC and thirty-six SWEET coding genes are identified in the genome which exhibit divergent expression profiles in tissue-specific and flower developmental stage-associated manners. Active transcriptional activities of several transporter genes are found in the developing flower, more or less correlating with the dynamic changes in soluble sugar contents and the main plant hormone variation. These results provide a starting information for further deciphering sugar-hormone interaction in the context of regulatory mechanism in Petunia flower development.

5. Materials and Methods

5.1. Plant Materials, Growth Conditions and Sample Collections

Seeds of P. axillaris (kindly provided by Dr. Hajirezaeiwere, Leibniz Institute of Plant Genetics and Crop Plant Research, Gatersleben, Germany) were surface-sterilized and sown on growing media (vermiculite) in a growth chamber under a photoperiod of 14/10 h of light/dark and 25 °C/22 °C temperature and 65% humidity. After the 7th week of seed germination, the young shoot cuttings were used for clone propagation in new pots. Cuttings were treated with rooting hormone NAA for successful root induction. The plants were further maintained in the chamber.
Samples were collected from various organs and tissues in adult plants propagated from cuttings for total RNA isolation. Pooled samples from 5 individual plants were quickly frozen in liquid nitrogen and stored at −80 °C until use. This sample collection was repeated three times for biological replications. For analysis of flower development, labeled floral buds were followed and sampled on a daily based until corolla was fully open. The collected samples were divided into five defined developmental stages, as specific in the Result Section, in a one-day interval during the flower development until the first day of corolla opening. Flowers from at least 5 plants were pooled and stored as above in −80 °C. Three sets of sampling were used as biological replications. Samples of these five stages of development were used for the analysis of phytohormone and sugar contents, as well as determination of gene expression via quantitative real-time PCR, respectively.

5.2. Gene Identification, Sequence Analysis, Phylogenetics and Protein Subcellular Prediction

Petunia sucrose transporters SUT and SWEET homologs were identified by performing a BLAST analysis with the P. axillaris v1.6.2 CDS database at Sol Genomics Network [79] using the A. thaliana and Solanum lycopersicum SUT amino acid sequences, and A. thaliana SWEET amino acid sequences as the query sequences, respectively. A. thaliana and S. lycopersicum SUT, and A. thaliana SWEET amino acid sequences were retrieved from the Phytozome database [80].
The exon/intron structure visualizations were generated using The Gene Structure Display Server (GSDS ver. 2.0) [81]. Motifs were identified using the MEME program [82] with the parameters: the maximum number of motifs -10 and optimum width of motifs was set from 6 to 50. Chromosomal locations were obtained using the Mapgene2chrom tool [83].
For phylogenetic analysis, multiple sequence alignments of the SUT and SWEET proteins of A. thaliana, S. lycopersicum and P. axillaris were performed using the default parameters of MUSCLE [84]. Dendrograms were generated by the MEGA X program using the neighbor-joining (NJ) method with a bootstrap number of 1000 replications. The molecular weight (MW) and isoelectric points (pI) of the presumed SUT and SWEET proteins of P. axillaris were predicted by the online ExPASy proteomics server [85].
For protein subcellular prediction, we used three different web-based programs, namely CELLO2GO [86], BUSCA [87] and WoLF PSORT [88] with their default parameter settings. The prediction results are provided in Table S1.

5.3. RNA Extraction and Quantitative Real-Time-PCR Analysis

For flower bud tissues, Total RNA was obtained using LabServe Universal RNA kit (Thermo-Fisher Scientific, Shanghai, China) with KingFisher magnetic manipulator (Thermo-Fisher Scientific) following the manufacturer’s instruction. For other plant tissues, RNA was extracted using TransZol UP (Transgen Biotech Co., Ltd., Beijing, China) following the manufacturer’s instruction. Briefly, 300 mg of liquid-nitrogen-ground fine powder was extracted in 800 µL TransZol UP. After adding 160 µL of chloroform, the aqueous phase was separated and precipitation of the RNA was done by mixing with 800 µL isopropanol and pellet was washed with 400 µL of 75% ethanol (prepared with DEPC treated water). After two washes, RNA pellet was air dried and dissolved in 30 µL of RNase-free water. One microgram of total RNA was used in one reaction of cDNA synthesis using TransScript® One-Step gDNA Removal and cDNA Synthesis SuperMix (Transgen Biotech Co., Ltd.) per protocol of the provider.
Quantitative real-time PCR was performed with SYBR Green Master (ROX) (Newbio Industry, China) in a total reaction volume of 15 µl. The PCR program in a Roche Light Cycler96 were set as: 95 °C for 3 min, 40 cycles of amplification (95 °C for 10 s, 60 or 58 °C for 30 s and 72 °C for 20 s) and a final extension at 65 °C for 1 min. Each reaction for every gene was conducted as three-technical replications and we repeated with 3 determinations of independently collected biological samples. Specific PCR primers for PaSUTs and PaSWEETs genes were designed using online Primer3Plus software [89]. The specificity of the primers was verified using RT-PCR to ensure a single band product and melting-curve detection confirming unique peak. Prior to quantification, annealing temperature optimization was conducted by testing Ta temperatures ranging from 55 to 70 °C. The PaACTIN2 was used as an endogenous reference gene for the calculation of the 2(targetCt-referenceCt). The primers used are listed in Table S3.

5.4. Quantification of Phytohormones Using 6410 Triple Quad LCMS

To quantify phytohormones, floral tissues of five distinct flower developmental stages of P. axillaris were thoroughly ground to a fine powder in liquid nitrogen with a cooled mortar and pestle, transferred to the sterilized plastic tubes wrapped in aluminum foil, and immediately kept in liquid nitrogen all the time during grinding of other samples and then stored at −80 °C. For the extraction of phytohormones, 100 mg ground powder was extracted with 900 µL methanol/water (80%, v/v), to which 100 µL internal standard (i-IAA, i-ABA, i-SA, i-GA1, i-GA4, 10 ng/mL) was added, ultrasonic half-hour at 4 °C, standing for overnight in −20 °C. Afterward, the sample was kept on ice, treated ultrasonically for half-hour at 4 °C, centrifuged at 4 °C and 14,000 rpm for 10 min. The supernatant was collected in a new tube and saved. The precipitate was further extracted by adding 500 µL methanol (80%, v/v), again with ultrasonic treatment for half-hour at 4 °C. This second extracted supernatant was combined to previously extracted supernatant. The pooled supernatant was reduced in a SpeedVac (Thermo Fisher) to a volume of ~300 µL. To this tube, 700 µL 1% formic acid (v/v) was added and applied vortex for 1 min, let standing for about 3 h in −20 °C to settle full extraction. For Solid-phase extraction using SPE (Oasis MCX extraction cartridge, 60mg 3mL), sample was activated in 2 mL 70% methanol, 2 mL 0.1M HCl and 2 mL 1% formic acid and then loaded into the column. Afterward, 2 mL of 1% formic acid was added for flushing interference. Acidic and basic fractions were collected separately. For acidic hormones, including IAA, ABA, JA, SA, GA, the elution target fraction was prepared with 2 mL of 70% methanol, while for basic hormone, Tz, the elution target fraction was prepared with 2 mL 5% ammonium hydroxide. After concentrating these fractions to dryness in a SpeedVac (Thermo Fisher), 200 µL methanol (70%, v/v) was added into both fractions, mixed by vortex, loaded into the glass tubes. Finally, acidic (IAA, ABA, JA, SA, GA1, and GA4) and basic hormones (Zeatin) in these fractions were analyzed by 6410 Triple Quad LCMS.

5.5. Quantification of Sugars Using Gas Chromatography—Quadruple Time of Flight Mass Spectrometry (GC-Q ToF MS)

Either fresh or liquid nitrogen-frozen samples were ground to a fine powder with a cooled mortar and pestle in liquid nitrogen. After vacuum drying at −85 °C for 48 h, the powders were stored at −80 °C. For determination of soluble sugars, an amount of 30 mg powdered (dried) sample was taken in a 2 mL centrifugal tube containing 500 μL 75% MeOH solvent (methanol/water, 3:1) and mixed by vortex slightly. Twenty microliters of vanillic acid (5 mg/mL) were added as an internal standard in each tube. The mixture was ultrasound for 30 min on ice and then centrifuged at 14,000 rpm for 10 min at room temperature. The maximum supernatant was then transferred to 1.5 mL tubes and then centrifuged again at 14,000 rpm for 10 min at room temperature. An amount of 150 μL supernatant was then transferred to 2 mL sample vial and placed in a SpeedVac (Thermo Fisher) for vacuum rotary evaporation for 4 h. 80 μL Methoxypyridine solution (42 mg methoxyamine hydrochloride in 2.1 mL pyrimidine, 20 mg/mL) was then added to the dried samples for derivatization and gasification and placed in oven at 80 °C for 20 min. Afterward, the vials were taken out from the oven and 80 μL BSTFA (N,O-Bis{trimethylsilyl}trifluoroacetamide) +1% TMCS (Trimethylchlorosilane) mixture was then added in derived solution of each sample and then placed in oven at 70 °C for 1 h. Extract (~0.2 mL) was then micro filtered and then subjected to nontargeted metabolites analysis with a LECO PegasusHT GC-Q ToF MS, equipped with a capillary tube (Type code: DB-5 MS, Size: 30 m × 0.25 mm × 0.25 μm). The running temperatures for injection was set at 280 °C, capillary temp at 275 °C. The split ratio and flow rate were 10:1 and 1.5 mL/min, respectively.

5.6. Statistical Analysis

Statistically significant difference was analyzed using a standard one-way ANVOA followed with a pair-wide Turkey t-test under 95% confidence interval, as implemented in Prism GraphPad ver. 8.3.

Supplementary Materials

The following are available online at https://www.mdpi.com/2223-7747/9/12/1770/s1, Figure S1: Genome location of the 5 PaSUT and the 36 PaSWEET genes in P. axillaris, Figure S2: The intron- exon structure of the PaSUT and PaSWEET genes, Figure S3: Transverse sectioning of the Petunia axillaris flowers in the five stages, Table S1: Prediction of subcellular localization of the sugar transporters, Table S2: Statistics of PaSWEET gene expression during flower development quantified via qRT-PCR, Table S3: List of primers used for qRT-PCR.

Author Contributions

B.W., M.L. and Y.Y. conceptualized and designed the experiment. J.I., M.L., Z.L., N.M. (Nasir Mehmood), N.M. (Nigarish Munir), M.A.A.A. and Y.Y. performed the laboratory experiments. J.I., N.M. (Nigarish Munir), M.A.A.A., W.B. and M.M.A. carried out bioinformatics analysis, J.I. and M.L. collected the data, B.W., J.I., N.M. (Nigarish Munir) and Y.Y. analyzed the data, M.L., N.M. (Nasir Mehmood), W.B., M.A.A.A. and M.M.A. visualized the data, B.W., M.L. and Y.Y. administrated and acquired funding for the project, J.I. wrote the original draft and B.W. reviewed and edited the final manuscript. All authors have read and agreed to the published version of the manuscript.

Funding

J.I. is supported by a Ph.D. scholarship from the Fujian Agriculture and Forestry University. M.L. is supported by a grant from Fujian Natural Science Foundation (2017J0106). Y.Y. is supported by a grant from Fujian Natural Science Foundation (2017J01430) and a grant from Fuzhou City-School (Institute) Scientific and technological Cooperation Project (2017-G-84).

Acknowledgments

We thank Mohammad Aslam (HAIXIA, Fujian Agriculture and Forestry University) for technical assistance, invaluable help and comments. We thank Mohammad-Reza Hajirezaei (Leibniz Institute of Plant Genetics and Crop Plant Research, Gatersleben, Germany) who provided seeds of P. axillaris used in the study and Yongyan Zhang and Wei Wang for excellent technical assistances.

Conflicts of Interest

The authors declare no conflict of interest. The funders had no role in the design of the study; in the collection, analyses, or interpretation of data; in the writing of the manuscript, or in the decision to publish the results.

References

  1. Jian, H.; Lu, K.; Yang, B.; Wang, T.; Zhang, L.; Zhang, A.; Wang, J.; Liu, L.; Qu, C.; Li, J. Genome-Wide Analysis and Expression Profiling of the SUC and SWEET Gene Families of Sucrose Transporters in Oilseed Rape (Brassica napus L.). Front. Plant Sci. 2016, 7. [Google Scholar] [CrossRef] [PubMed] [Green Version]
  2. Kühn, C.; Grof, C.P.L. Sucrose transporters of higher plants. Curr. Opin. Plant Biol. 2010, 13, 287–297. [Google Scholar] [CrossRef] [PubMed]
  3. Peng, D.; Gu, X.; Xue, L.J.; Leebens-Mack, J.H.; Tsai, C.J. Bayesian phylogeny of sucrose transporters: Ancient origins, differential expansion and convergent evolution in monocots and dicots. Front. Plant Sci. 2014, 5, 615. [Google Scholar] [CrossRef] [PubMed] [Green Version]
  4. Chen, L.Q.; Qu, X.Q.; Hou, B.H.; Sosso, D.; Osorio, S.; Fernie, A.R.; Frommer, W.B. Sucrose Efflux Mediated by SWEET Proteins as a Key Step for Phloem Transport. Science 2012, 335, 207–211. [Google Scholar] [CrossRef] [PubMed]
  5. Lemoine, R.; La Camera, S.; Atanassova, R.; Dédaldéchamp, F.; Allario, T.; Pourtau, N.; Bonnemain, J.L.; Laloi, M.; Coutos-Thévenot, P.; Maurousset, L.; et al. Source-to-sink transport of sugar and regulation by environmental factors. Front. Plant Sci. 2013, 4, 272. [Google Scholar] [CrossRef] [Green Version]
  6. Rennie, E.A.; Turgeon, R. A comprehensive picture of phloem loading strategies. Proc. Nat. Acad. Sci. USA 2009, 106, 14162–14167. [Google Scholar] [CrossRef] [Green Version]
  7. Eveland, A.L.; Jackson, D. Sugars, signalling, and plant development. J. Exp. Bot. 2012, 63, 3367–3377. [Google Scholar] [CrossRef] [Green Version]
  8. Matsoukas, I.G. Interplay between sugar and hormone signaling pathways modulate floral signal transduction. Front. Genet. 2014, 5, 218. [Google Scholar] [CrossRef] [Green Version]
  9. Julius, B.T.; Leach, K.A.; Tran, T.M.; Mertz, R.A.; Braun, D.M. Sugar Transporters in Plants: New Insights and Discoveries. Plant Cell Physiol. 2017, 58, 1442–1460. [Google Scholar] [CrossRef] [Green Version]
  10. Chen, L.Q.; Cheung, L.S.; Feng, L.; Tanner, W.; Frommer, W.B. Transport of Sugars. Annu. Rev. Biochem. 2015, 84, 865–894. [Google Scholar] [CrossRef] [PubMed]
  11. Büttner, M. The monosaccharide transporter(-like) gene family in Arabidopsis. FEBS Lett. 2007, 581, 2318–2324. [Google Scholar] [CrossRef] [PubMed] [Green Version]
  12. Chen, L.Q. SWEET sugar transporters for phloem transport and pathogen nutrition. New Phytol. 2013, 201, 1150–1155. [Google Scholar] [CrossRef] [PubMed]
  13. Feng, L.; Frommer, W.B. Structure and function of SemiSWEET and SWEET sugar transporters. Trends Biochem. Sci. 2015, 40, 480–486. [Google Scholar] [CrossRef] [PubMed] [Green Version]
  14. Reinders, A.; Sivitz, A.B.; Ward, J.M. Evolution of plant sucrose uptake transporters. Front. Plant Sci. 2012, 3, 22. [Google Scholar] [CrossRef] [Green Version]
  15. Gottwald, J.R.; Krysan, P.J.; Young, J.C.; Evert, R.F.; Sussman, M.R. Genetic evidence for the in planta role of phloem-specific plasma membrane sucrose transporters. Proc. Nat. Acad. Sci. USA 2000, 97, 13979–13984. [Google Scholar] [CrossRef] [Green Version]
  16. Riesmeier, J.; Willmitzer, L.; Frommer, W. Evidence for an essential role of the sucrose transporter in phloem loading and assimilate partitioning. EMBO J. 1994, 13, 1–7. [Google Scholar] [CrossRef]
  17. Sivitz, A.B.; Reinders, A.; Ward, J.M. Arabidopsis Sucrose Transporter AtSUC1 Is Important for Pollen Germination and Sucrose-Induced Anthocyanin Accumulation. Plant Physiol. 2008, 147, 92–100. [Google Scholar] [CrossRef]
  18. Slewinski, T.L.; Meeley, R.; Braun, D.M. Sucrose transporter1 functions in phloem loading in maize leaves. J. Exp. Bot. 2009, 60, 881–892. [Google Scholar] [CrossRef] [Green Version]
  19. Payyavula, R.S.; Tay, K.H.; Tsai, C.J.; Harding, S.A. The sucrose transporter family in Populus: The importance of a tonoplast PtaSUT4 to biomass and carbon partitioning. Plant J. 2011, 65, 757–770. [Google Scholar] [CrossRef]
  20. Schneider, S.; Hulpke, S.; Schulz, A.; Yaron, I.; Höll, J.; Imlau, A.; Schmitt, B.; Batz, S.; Wolf, S.; Hedrich, R.; et al. Vacuoles release sucrose via tonoplast-localised SUC4-type transporters. Plant Biol. 2011, 14, 325–336. [Google Scholar] [CrossRef]
  21. Barker, L.; Kühn, C.; Weise, A.; Schulz, A.; Gebhardt, C.; Hirner, B.; Hellmann, H.; Schulze, W.; Ward, J.M.; Frommer, W.B. SUT2, a Putative Sucrose Sensor in Sieve Elements. Plant Cell 2000, 12, 1153–1164. [Google Scholar] [CrossRef] [Green Version]
  22. Chincinska, I.; Gier, K.; Krügel, U.; Liesche, J.; He, H.; Grimm, B.; Harren, F.J.M.; Cristescu, S.M.; Kühn, C. Photoperiodic regulation of the sucrose transporter StSUT4 affects the expression of circadian-regulated genes and ethylene production. Front. Plant Sci. 2013, 4, 26. [Google Scholar] [CrossRef] [PubMed] [Green Version]
  23. Chincinska, I.A.; Liesche, J.; Krügel, U.; Michalska, J.; Geigenberger, P.; Grimm, B.; Kühn, C. Sucrose Transporter StSUT4 from Potato Affects Flowering, Tuberization, and Shade Avoidance Response. Plant Physiol. 2007, 146, 515–528. [Google Scholar] [CrossRef] [PubMed] [Green Version]
  24. Gamas, P. Use of a Subtractive Hybridization Approach to Identify NewMedicago truncatulaGenes Induced During Root Nodule Development. Mol. Plant-Microbe Interact. 1996, 9, 233–242. [Google Scholar] [CrossRef]
  25. Jaehme, M.; Guskov, A.; Slotboom, D.J. Crystal structure of the vitamin B3 transporter PnuC, a full-length SWEET homolog. Nat. Struct. Mol. Biol. 2014, 21, 1013–1015. [Google Scholar] [CrossRef] [PubMed]
  26. Tao, Y.; Cheung, L.S.; Li, S.; Eom, J.-S.; Chen, L.Q.; Xu, Y.; Perry, K.; Frommer, W.B.; Feng, L. Structure of a eukaryotic SWEET transporter in a homotrimeric complex. Nat. Cell Biol. 2015, 527, 259–263. [Google Scholar] [CrossRef] [Green Version]
  27. Chen, L.Q.; Hou, B.-H.; LaLonde, S.; Takanaga, H.; Hartung, M.L.; Qu, X.-Q.; Guo, W.-J.; Kim, J.-G.; Underwood, W.; Chaudhuri, B.; et al. Sugar transporters for intercellular exchange and nutrition of pathogens. Nat. Cell Biol. 2010, 468, 527–532. [Google Scholar] [CrossRef] [PubMed] [Green Version]
  28. Chen, L.Q.; Lin, I.W.; Qu, X.Q.; Sosso, D.; McFarlane, H.E.; Londoño, A.; Samuels, A.L.; Frommer, W.B. A Cascade of Sequentially Expressed Sucrose Transporters in the Seed Coat and Endosperm Provides Nutrition for the Arabidopsis Embryo. Plant Cell 2015, 27, 607–619. [Google Scholar] [CrossRef] [Green Version]
  29. Jeena, G.S.; Kumar, S.; Shukla, R.K. Structure, evolution and diverse physiological roles of SWEET sugar transporters in plants. Plant Mol. Biol. 2019, 100, 351–365. [Google Scholar] [CrossRef]
  30. Yuan, M.; Wang, S. Rice MtN3/Saliva/SWEET Family Genes and Their Homologs in Cellular Organisms. Mol. Plant 2013, 6, 665–674. [Google Scholar] [CrossRef] [Green Version]
  31. Gautam, T.; Saripalli, G.; Gahlaut, V.; Kumar, A.; Sharma, P.K.; Balyan, H.S.; Gupta, P.K. Further studies on sugar transporter (SWEET) genes in wheat (Triticum aestivum L.). Mol. Biol. Rep. 2019, 46, 2327–2353. [Google Scholar] [CrossRef] [PubMed]
  32. Patil, G.B.; Valliyodan, B.; Deshmukh, R.; Prince, S.; Nicander, B.; Zhao, M.-Z.; Sonah, H.; Song, L.; Lin, L.; Chaudhary, J.; et al. Soybean (Glycine max) SWEET gene family: Insights through comparative genomics, transcriptome profiling and whole genome re-sequence analysis. BMC Genom. 2015, 16, 520. [Google Scholar] [CrossRef] [PubMed] [Green Version]
  33. Mizuno, H.; Kasuga, S.; Kawahigashi, H. The sorghum SWEET gene family: Stem sucrose accumulation as revealed through transcriptome profiling. Biotechnol. Biofuels 2016, 9, 1–12. [Google Scholar] [CrossRef] [PubMed] [Green Version]
  34. Chong, J.; Piron, M.-C.; Meyer, S.; Merdinoglu, D.; Bertsch, C.; Mestre, P. The SWEET family of sugar transporters in grapevine: VvSWEET4 is involved in the interaction with Botrytis cinerea. J. Exp. Bot. 2014, 65, 6589–6601. [Google Scholar] [CrossRef] [PubMed] [Green Version]
  35. Wei, X.; Liu, F.; Chen, C.; Ma, F.; Li, M. The Malus domestica sugar transporter gene family: Identifications based on genome and expression profiling related to the accumulation of fruit sugars. Front. Plant Sci. 2014, 5, 569. [Google Scholar] [CrossRef] [PubMed] [Green Version]
  36. Miao, H.; Sun, P.; Liu, Q.; Miao, Y.; Liu, J.; Zhang, K.; Hu, W.; Zhang, J.; Wang, J.; Wang, Z.; et al. Genome-wide analyses of SWEET family proteins reveal involvement in fruit development and abiotic/biotic stress responses in banana. Sci. Rep. 2017, 7, 1–15. [Google Scholar] [CrossRef] [Green Version]
  37. Zhang, W.; Wang, S.; Yu, F.; Tang, J.; Shan, X.; Bao, K.; Yu, L.; Wang, H.; Fei, Z.; Li, J. Genome-wide characterization and expression profiling of SWEET genes in cabbage (Brassica oleracea var. capitata L.) reveal their roles in chilling and clubroot disease responses. BMC Genom. 2019, 20, 93. [Google Scholar] [CrossRef]
  38. Feng, C.Y.; Han, J.X.; Han, X.X.; Jiang, J. Genome-wide identification, phylogeny, and expression analysis of the SWEET gene family in tomato. Gene 2015, 573, 261–272. [Google Scholar] [CrossRef]
  39. Li, M.; Xie, H.; He, M.; Su, W.; Yang, Y.; Wang, J.; Ye, G.; Zhou, Y. Genome-wide identification and expression analysis of the StSWEET family genes in potato (Solanum tuberosum L.). Genes Genom. 2019, 42, 135–153. [Google Scholar] [CrossRef]
  40. Eom, J.S.; Chen, L.Q.; Sosso, D.; Julius, B.T.; Lin, I.W.; Qu, X.Q.; Braun, D.M.; Frommer, W.B. SWEETs, transporters for intracellular and intercellular sugar translocation. Curr. Opin. Plant Biol. 2015, 25, 53–62. [Google Scholar] [CrossRef] [Green Version]
  41. Quirino, B.F.; Normanly, J.; Amasino, R.M. Diverse range of gene activity during Arabidopsis thaliana leaf senescence includes pathogen-independent induction of defense-related genes. Plant Mol. Biol. 1999, 40, 267–278. [Google Scholar] [CrossRef] [PubMed]
  42. Ge, Y.X.; Angenent, G.C.; Wittich, P.E.; Peters, J.; Franken, J.; Busscher, M.; Zhang, L.M.; Dahlhaus, E.; Kater, M.M.; Wullems, G.J.; et al. NEC1, a novel gene, highly expressed in nectary tissue of Petunia hybrida. Plant J. 2000, 24, 725–734. [Google Scholar] [CrossRef] [PubMed]
  43. Lin, I.W.; Sosso, D.; Chen, L.Q.; Gase, K.; Kim, S.G.; Kessler, D.; Klinkenberg, P.M.; Gorder, M.K.; Hou, B.H.; Qu, X.Q.; et al. Nectar secretion requires sucrose phosphate synthases and the sugar transporter SWEET9. Nat. Cell Biol. 2014, 508, 546–549. [Google Scholar] [CrossRef] [PubMed]
  44. Chen, H.Y.; Huh, J.H.; Yu, Y.C.; Ho, L.H.; Chen, L.Q.; Tholl, D.; Frommer, W.B.; Guo, W.-J. The Arabidopsis vacuolar sugar transporter SWEET2 limits carbon sequestration from roots and restricts Pythium infection. Plant J. Cell Mol. Biol. 2015, 83, 1046–1058. [Google Scholar] [CrossRef] [Green Version]
  45. Cohn, M.; Bart, R.S.; Shybut, M.; Dahlbeck, D.; Gomez, M.; Morbitzer, R.; Hou, B.H.; Frommer, W.B.; Lahaye, T.; Staskawicz, B.J. Xanthomonas axonopodis virulence is promoted by a transcription activator like (TAL) effector mediated induction of a SWEET sugar transporter in cassava 3. Mol. Plant-Microbe Interact. MPMI 2014, 1186–1198. [Google Scholar] [CrossRef] [Green Version]
  46. Le Hir, R.; Spinner, L.; Klemens, P.A.; Chakraborti, D.; De Marco, F.; Vilaine, F.; Wolff, N.; Lemoine, R.; Porcheron, B.; Géry, C.; et al. Disruption of the Sugar Transporters AtSWEET11 and AtSWEET12 Affects Vascular Development and Freezing Tolerance in Arabidopsis. Mol. Plant 2015, 8, 1687–1690. [Google Scholar] [CrossRef] [PubMed] [Green Version]
  47. Li, Y.; Wang, Y.; Zhang, H.; Zhang, Q.; Zhai, H.; Liu, Q.; He, S. The Plasma Membrane-Localized Sucrose Transporter IbSWEET10 Contributes to the Resistance of Sweet Potato to Fusarium oxysporum. Front. Plant Sci. 2017, 8, 197. [Google Scholar] [CrossRef] [Green Version]
  48. Zhao, D.; You, Y.; Fan, H.; Zhu, X.; Wang, Y.; Duan, Y.; Xuan, Y.H.; Chen, L. The Role of Sugar Transporter Genes during Early Infection by Root-Knot Nematodes. Int. J. Mol. Sci. 2018, 19, 302. [Google Scholar] [CrossRef] [Green Version]
  49. Yuan, K. Phytohormone signalling pathways interact with sugars during seed germination and seedling development. J. Exp. Bot. 2006, 57, 3359–3367. [Google Scholar] [CrossRef]
  50. Guan, Y.F.; Huang, X.Y.; Zhu, J.; Gao, J.F.; Zhang, H.X.; Yang, Z.N. RUPTURED POLLEN GRAIN1, a Member of the MtN3/saliva Gene Family, Is Crucial for Exine Pattern Formation and Cell Integrity of Microspores in Arabidopsis. Plant Physiol. 2008, 147, 852–863. [Google Scholar] [CrossRef] [Green Version]
  51. Sosso, D.; Luo, D.; Li, Q.-B.; Sasse, J.; Yang, J.; Gendrot, G.; Suzuki, M.E.; Koch, K.; Mccarty, D.R.; Chourey, P.S.; et al. Seed filling in domesticated maize and rice depends on SWEET-mediated hexose transport. Nat. Genet. 2015, 47, 1489–1493. [Google Scholar] [CrossRef] [PubMed]
  52. Sun, M.X.; Huang, X.Y.; Yang, J.; Guan, Y.F.; Yang, Z.N. Arabidopsis RPG1 is important for primexine deposition and functions redundantly with RPG2 for plant fertility at the late reproductive stage. Plant Reprod. 2013, 26, 83–91. [Google Scholar] [CrossRef] [PubMed]
  53. Yang, J.; Luo, D.; Yang, B.; Frommer, W.B.; Eom, J.-S. SWEET11 and 15 as key players in seed filling in rice. New Phytol. 2018, 218, 604–615. [Google Scholar] [CrossRef] [PubMed] [Green Version]
  54. Zhang, Z.; Zou, L.; Ren, C.; Ren, F.; Wang, Y.; Fan, P.; Li, S.; Liang, Z. VvSWEET10 Mediates Sugar Accumulation in Grapes. Genes 2019, 10, 255. [Google Scholar] [CrossRef] [Green Version]
  55. Durand, M.; Mainson, D.; Porcheron, B.; Maurousset, L.; Lemoine, R.; Pourtau, N. Carbon source–sink relationship in Arabidopsis thaliana: The role of sucrose transporters. Planta 2018, 247, 587–611. [Google Scholar] [CrossRef] [Green Version]
  56. Borghi, M.; Fernie, A.R. Floral Metabolism of Sugars and Amino Acids: Implications for Pollinators’ Preferences and Seed and Fruit Set. Plant Physiol. 2017, 175, 1510–1524. [Google Scholar] [CrossRef] [Green Version]
  57. Shan, H.; Cheng, J.; Zhang, R.; Yao, X.; Kong, H. Developmental mechanisms involved in the diversification of flowers. Nat. Plants 2019, 5, 917–923. [Google Scholar] [CrossRef]
  58. Vandenbussche, M.; Echambrier, P.; Bento, S.E.; Emorel, P. Petunia, Your Next Supermodel? Front. Plant Sci. 2016, 7, 72. [Google Scholar] [CrossRef]
  59. Bombarely, A.; Moser, M.; Amrad, A.; Bao, M.; Bapaume, L.; Barry, C.S.; Bliek, M.; Boersma, M.R.; Borghi, L.; Bruggmann, R.; et al. Insight into the evolution of the Solanaceae from the parental genomes of Petunia hybrida. Nat. Plants 2016, 2, 16074. [Google Scholar] [CrossRef] [Green Version]
  60. Solovyev, V.; Kosarev, P.; Seledsov, I.; Vorobyev, D. Automatic annotation of eukaryotic genes, pseudogenes and promoters. Genome Biol. 2006, 7 (Suppl. 1), 10.1–10.12. Available online: http://www.softberry.com/ (accessed on 1 July 2019). [CrossRef] [Green Version]
  61. Colquhoun, T.A.; Verdonk, J.C.; Schimmel, B.C.J.; Tieman, D.M.; Underwood, B.A.; Clark, D.G. Petunia floral volatile benzenoid/phenylpropanoid genes are regulated in a similar manner. Phytochemistry 2010, 71, 158–167. [Google Scholar] [CrossRef] [PubMed]
  62. Weiss, D.; Schönfeld, M.; Halevy, A.H. Photosynthetic Activities in the Petunia Corolla. Plant Physiol. 1988, 87, 666–670. [Google Scholar] [CrossRef] [PubMed] [Green Version]
  63. Alvarez-Buylla, E.R.P.; Benítez, M.; Corvera-Poiré, A.; Cador, A.C.; De Folter, S.; De Buen, A.G.; Garay-Arroyo, A.; García-Ponce, B.; Jaimes-Miranda, F.; Pérez-Ruiz, R.V.; et al. Flower Development. Arab. Book 2010, 8, e0127. [Google Scholar] [CrossRef] [PubMed] [Green Version]
  64. Sun, L.; Sui, X.; Lucas, W.J.; Li, Y.; Feng, S.; Ma, S.; Fan, J.; Gao, L.; Zhang, Z.-X. Down-regulation of the Sucrose Transporter CsSUT1 Causes Male Sterility by Altering Carbohydrate Supply. Plant Physiol. 2019, 180, 986–997. [Google Scholar] [CrossRef] [Green Version]
  65. Hackel, A.; Schauer, N.; Carrari, F.; Fernie, A.R.; Grimm, B.; Kühn, C. Sucrose transporter LeSUT1 and LeSUT2 inhibition affects tomato fruit development in different ways. Plant J. 2006, 45, 180–192. [Google Scholar] [CrossRef]
  66. Cheng, H. Gibberellin regulates Arabidopsis floral development via suppression of DELLA protein function. Development 2004, 131, 1055–1064. [Google Scholar] [CrossRef] [Green Version]
  67. Ravid, J.; Spitzer-Rimon, B.; Takebayashi, Y.; Seo, M.; Cna’Ani, A.; Aravena-Calvo, J.; Masci, T.; Farhi, M.; Vainstein, A. GA as a regulatory link between the showy floral traits color and scent. New Phytol. 2017, 215, 411–422. [Google Scholar] [CrossRef] [Green Version]
  68. Ishiguro, S.; Kawai-Oda, A.; Ueda, J.; Nishida, I.; Okada, K. The DEFECTIVE IN ANTHER DEHISCENCE1 Gene Encodes a Novel Phospholipase A1 Catalyzing the Initial Step of Jasmonic Acid Biosynthesis, Which Synchronizes Pollen Maturation, Anther Dehiscence, and Flower Opening in Arabidopsis. Plant Cell 2001, 13, 2191–2209. [Google Scholar] [CrossRef] [Green Version]
  69. Kumar, M.; Singh, V.P.; Arora, A.; Singh, N. The role of abscisic acid (ABA) in ethylene insensitive Gladiolus (Gladiolus grandiflora Hort.) flower senescence. Acta Physiol. Plant 2013, 36, 151–159. [Google Scholar] [CrossRef]
  70. Sekhar, K.C.; Sawhney, V. Role of ABA in stamen and pistil development in the normal and solanifolia mutant of tomato (Lycopersicon esculentum). Sex. Plant Reprod. 1991, 4, 279–283. [Google Scholar] [CrossRef]
  71. Browse, J. Jasmonate Passes Muster: A Receptor and Targets for the Defense Hormone. Annu. Rev. Plant Biol. 2009, 60, 183–205. [Google Scholar] [CrossRef] [PubMed]
  72. Smeekens, S.; Ma, J.; Hanson, J.; Rolland, F. Sugar signals and molecular networks controlling plant growth. Curr. Opin. Plant Biol. 2010, 13, 273–278. [Google Scholar] [CrossRef] [PubMed]
  73. Zeeman, S.C.; Kossmann, J.; Smith, A.M. Starch: Its Metabolism, Evolution, and Biotechnological Modification in Plants. Annu. Rev. Plant Biol. 2010, 61, 209–234. [Google Scholar] [CrossRef] [PubMed] [Green Version]
  74. Ferrario, S.; Shchennikova, A.V.; Franken, J.; Immink, R.G.H.; Angenent, G.C. Control of Floral Meristem Determinacy in Petunia by MADS-Box Transcription Factors. Plant Physiol. 2006, 140, 890–898. [Google Scholar] [CrossRef] [Green Version]
  75. Preston, J.C.; Powers, B.; Kostyun, J.L.; Driscoll, H.; Zhang, F.; Zhong, J. Implications of region-specific gene expression for development of the partially fused petunia corolla. Plant J. 2019, 100, 158–175. [Google Scholar] [CrossRef]
  76. Ylstra, B.; Garrido, D.; Busscher, J.; Van Tunen, A.J. Hexose Transport in Growing Petunia Pollen Tubes and Characterization of a Pollen-Specific, Putative Monosaccharide Transporter. Plant Physiol. 1998, 118, 297–304. [Google Scholar] [CrossRef] [Green Version]
  77. Ge, Y.X.; Angenent, G.; Dahlhaus, E.; Franken, J.; Peters, J.; Wullens, G.; Creemers-Molenaar, J. Partial silencing of the NEC1 gene results in early opening of anthers in Petunia hybrida. Mol. Genet. Genom. 2001, 265, 414–423. [Google Scholar] [CrossRef]
  78. Amano, I.; Kitajima, S.; Suzuki, H.; Koeduka, T.; Shitan, N. Transcriptome analysis of Petunia axillaris flowers reveals genes involved in morphological differentiation and metabolite transport. PLoS ONE 2018, 13, e0198936. [Google Scholar] [CrossRef]
  79. Fernandez-Pozo, N.; Menda, N.; Edwards, J.D.; Saha, S.; Tecle, I.Y.; Strickler, S.R.; Bombarely, A.; Fisher-York, T.; Pujar, A.; Foerster, H.; et al. The Sol Genomics Network (SGN)—From genotype to phenotype to breeding. Nucleic Acids Res. 2015, 43, D1036–D1041. Available online: https://solgenomics.net/ (accessed on 1 October 2018). [CrossRef]
  80. Goodstein, D.M.; Shu, S.; Howson, R.; Neupane, R.; Hayes, R.D.; Fazo, J.; Mitros, T.; Dirks, W.; Hellsten, U.; Putnam, N.; et al. Phytozome: A comparative platform for green plant genomics. Nucleic Acids Res. 2012, 40, D1178–D1186. Available online: https://phytozome.jgi.doe.gov (accessed on 1 October 2018). [CrossRef]
  81. Hu, B.; Jin, J.; Guo, A.Y.; Zhang, H.; Luo, J.; Gao, G. GSDS 2.0: An upgraded gene feature visualization server. Bioinformatics 2015, 31, 1296–1297. Available online: http://gsds.cbi.pku.edu.cn (accessed on 1 January 2019). [CrossRef] [Green Version]
  82. Bailey, T.L.; Elkan, C. Fitting a mixture model by expectation maximization to discover motifs in biopolymers. Proc. Int. Conf. Intell. Syst. Mol. Biol. 1994, 2, 28–36. Available online: http://meme-suite.org/ (accessed on 1 January 2019). [PubMed]
  83. Chao, J.T.; Kong, Y.Z.; Wang, Q.; Sun, Y.H.; Gong, D.P.; Lv, J.; Liu, G.S. MapGene2Chrom, a tool to draw gene physical map based on Perl and SVG languages. Yi Chuan 2015, 37, 91–97. Available online: http://mg2c.iask.in/mg2c_v2.1/ (accessed on 1 January 2020). [CrossRef]
  84. Madeira, F.; Park, Y.M.; Lee, J.; Buso, N.; Gur, T.; Madhusoodanan, N.; Basutkar, P.; Tivey, A.R.N.; Potter, S.C.; Finn, R.D.; et al. The EMBL-EBI search and sequence analysis tools APIs in 2019. Nucleic Acids Res. 2019, 47, W636–W641. Available online: https://www.ebi.ac.uk/Tools/msa/muscle (accessed on 1 January 2019). [CrossRef] [PubMed] [Green Version]
  85. Artimo, P.; Jonnalagedda, M.; Arnold, K.; Baratin, D.; Csardi, G.; de Castro, E.; Duvaud, S.; Flegel, V.; Fortier, A.; Gasteiger, E.; et al. ExPASy: SIB bioinformatics resource portal. Nucleic Acids Res. 2012, 40, W597–W603. Available online: https://www.expasy.org/ (accessed on 1 January 2019). [CrossRef]
  86. Yu, C.S.; Cheng, C.W.; Su, W.C.; Chang, K.C.; Huang, S.W.; Hwang, J.K.; Lu, C.H. CELLO2GO: A Web Server for Protein subCELlular LOcalization Prediction with Functional Gene Ontology Annotation. PLoS ONE 2014, 9, e99368. [Google Scholar] [CrossRef] [Green Version]
  87. Savojardo, C.; Martelli, P.L.; Fariselli, P.; Profiti, G.; Casadio, R. BUSCA: An integrative web server to predict subcellular localization of proteins. Nucleic Acids Res. 2018, 46, W459–W466. [Google Scholar] [CrossRef]
  88. Horton, P.; Park, K.J.; Obayashi, T.; Fujita, N.; Harada, H.; Adams-Collier, C.; Nakai, K. WoLF PSORT: Protein localization predictor. Nucleic Acids Res. 2007, 35, W585–W587. [Google Scholar] [CrossRef] [Green Version]
  89. Untergasser, A.; Nijveen, H.; Rao, X.; Bisseling, T.; Geurts, R.; Leunissen, J.A.M. Primer3Plus, an enhanced web interface to Primer3. Nucleic Acids Res. 2007, 35, W71–W74. [Google Scholar] [CrossRef] [Green Version]
Figure 1. Phylogenetic analysis and tissue-specific expression profile of the P. axillaris SUT/SUC sugar transporters. (A) The 5 SUT/SUC sequences fall into three groups, representing the type I, Type II and Type III members. PaSUTs are shown in blue. Arabidopsis thaliana orthologs are in green: AtSUC1, At1g71880; AtSUC2, At1g22710; AtSUC3, At2g02860; AtSUC4, At1g09960; AtSUC5, AT1G71890; AtSUC6, AT5G43610; AtSUC7, AT1G66570; AtSUC8, AT2G14670; AtSUC9, At5g06170. Solanum lycopersicum orthologs are in orange: SlSUT1, NP_001289830.1; SlSUT2, NP_001234321.2; SlSUT4, NP_001234344.2. Sequence alignment and analysis are conducted using MUSCLE with default parameters, and the phylogenetic tree is constructed with MEGA X version 10.1.8 using the neighbor-joining (NJ) method with 1000 bootstrap replications. The tree is graphed via Figtree version 1.4.4, with bootstrap value greater than 50% shown. The scale bar represents the ammino acid substitution rate per site. (B) Tissue-specific gene expression analysis of the SUT/SUC genes via quantitative real-time PCR. Data are mean of 3 biological replications with the error bars representing SD.
Plants 09 01770 g001
Figure 2. Phylogenetic analysis and tissue-specific expression profile of the P. axillaris SWEET transporters. (A) The 36-gene family of SWEET proteins are grouped into four clades (depicted in colored branch lines) together with the well-annotated Arabidopsis transporters. Sequence alignment and analysis are conducted using MUSCLE with default parameters, and the neighbor-joining (NJ) tree is constructed using MEGA X with 1000 bootstrap replications and visualized via Figtree version 1.4.4, with bootstrap value greater than 50% shown. The scale bar represents the ammino acid substitution rate per site. (BD) Tissue-specific gene expression analysis of the SWEET genes via quantitative real-time PCR. Data are mean of 3 biological replications with the error bars representing SD.
Plants 09 01770 g002
Figure 3. The P. axillaris flower developmental stages (A) and expression profile of the five PaSUT genes (B). Data represent mean and SD of three independent determinations, each is a pooled sample with 2-5 flowers.
Plants 09 01770 g003
Figure 4. Quantification of 36 PaSWEET gene expression during flower development. Transcript abundance was determined via qRT-PCR using ACTIN as an endogenous reference gene. Data represent the average of three independent determinations. Each determination was run on pooled samples with 2–5 flowers. Values lower than 1.0 × 10⁻³ are depicted in grey for better visualization. The statistical parameters are provided in Table S2.
Plants 09 01770 g004
Figure 5. Phytohormone and sugar contents in the 5 stages during P. axillaris flower development. (A) Phytohormone dynamics during the flower development. Data are mean and SD of three independent experiments. (B) Sugar contents in the developmental stages. Date represent mean and SD of three independent experiments. Significant difference between group with variable letters above the line or bar are verified using two-way ANOVA and multiple T-test (p < 0.05) implemented in the Prism software version 7.04.
Plants 09 01770 g005
Table 1. Identity of 5 PaSUTs and 36 PaSWEETs in P. axillaris genome.
Gene ManeLocus IDGene LocationGene Length
(bp)
CDS Length (bp)Peptide ResiduespI
SUT/SUC Family
1PaSUT1Peaxi162Scf00495g00036.1354,487–359,931544415485165.0
2PaSUT2Peaxi162Scf00503g00419.1445,731–452,274654316805605.0
3PaSUT3Peaxi162Scf00481g00028.1281,749–287,120537115215075.0
4PaSUT4Peaxi162Scf00626g00416.1429,871–441,7781190715245085.0
5PaSUT5Peaxi162Scf00268g00137.11,330,847–1,335,013416615755255.0
SWEET Family
1PaSWEET1aPeaxi162Scf00263g00161.1 1,672,743–1,674,57318306962325.2
2PaSWEET1bPeaxi162Scf00033g00610.1 626,372–627,61112396992335.2
3PaSWEET1cPeaxi162Scf00051g00211.1 208,784–211,38826047742585.1
4PaSWEET1dPeaxi162Scf00263g00156.1 1,501,206–1,504,33231269273095.1
5PaSWEET1ePeaxi162Scf00263g01423.1 1,475,112–1,477,30021888912975.1
6PaSWEET2aPeaxi162Scf00111g01241.1 1,263,409–1,265,523211411943985.1
7PaSWEET2bPeaxi162Scf00899g00310.1 296,611–329,60032,9897052355.2
8PaSWEET2cPeaxi162Scf01337g00018.1 11,448–14,66832207052355.2
9PaSWEET3Peaxi162Scf00904g00131.1 169,563–171,96524027112375.2
10PaSWEET4 *Peaxi162Scf00102g01855.1 1,853,060–1,856,25920217502495.2
11PaSWEET5aPeaxi162Scf00689g00339.1 307,462–314,776731411673895.0
12PaSWEET5bPeaxi162Scf00017g02829.1 2,794,729–2,795,92411957142385.1
13PaSWEET6Peaxi162Scf00129g01027.1 1,045,179–1,046,43712586512175.2
14PaSWEET7Peaxi162Scf01051g00019.1 196,117–196,8217047052355.1
15PaSWEET8Peaxi162Scf00074g00434.1 462,439–465,22327846122045.2
16PaSWEET9aPeaxi162Scf00386g00924.1 926,235–928,35621217922645.2
17PaSWEET9bPeaxi162Scf00028g00063.1 675,430–685,04096106852285.2
18PaSWEET9c(NEC1)Peaxi162Scf00303g00004.1 55,308–57,41821108432815.2
19PaSWEET10aPeaxi162Scf01039g00027.1 73,727–75,23815118522845.1
20PaSWEET10bPeaxi162Scf00067g00107.1 995,051–996,84317928162725.1
21PaSWEET11a *Peaxi162Scf00516g00125.1_126 165,635–167,69919488792925.2
22PaSWEET11bPeaxi162Scf00909g00223.1 308,317–310,15018338252755.1
23PaSWEET12aPeaxi162Scf00516g00033.1 55,540–65,536999615995335.0
24PaSWEET12bPeaxi162Scf01064g00253.1 289,074–307,65718,58323047684.9
25PaSWEET13aPeaxi162Scf00502g00058.1 562,962–564,84318817502505.2
26PaSWEET13bPeaxi162Scf00358g01310.1 1,321,846–1,324,43225868672895.1
27PaSWEET13cPeaxi162Scf00516g00122.1 104,493–106,65521628522845.1
28PaSWEET14aPeaxi162Scf00516g00124.1 133,860–155,05621,19623557854.9
29PaSWEET14bPeaxi162Scf00647g00518.1 595,043–596,81817759843285.1
30PaSWEET14cPeaxi162Scf00516g00025.1 78,107–79,47413677172395.2
31PaSWEET14dPeaxi162Scf00516g00012.1 119,256–121,06618106902305.2
32PaSWEET15aPeaxi162Scf00128g01632.1 1,656,934–1,660,44435109663225.1
33PaSWEET15bPeaxi162Scf00255g00006.1 30,836–33,12122858162725.1
34PaSWEET16aPeaxi162Scf00471g01110.1 1,106,818–1,108,89120736182065.2
35PaSWEET16bPeaxi162Scf00037g01416.1 1,392,651–1,396,15835077232415.2
36PaSWEET17Peaxi162Scf00037g01417.1 1,401,046–1,404,18031348942985.1
* mRNA sequences of these two genes have been corrected via prediction with FGENESH [60], the corrected mRNA sequences differ from the current version of genome annotations.
Publisher’s Note: MDPI stays neutral with regard to jurisdictional claims in published maps and institutional affiliations.

