Structure and Biomechanics during Xylem Vessel Transdifferentiation in Arabidopsis thaliana

 , , , , ,
Abstract
1. Introduction
2. Results and Discussion
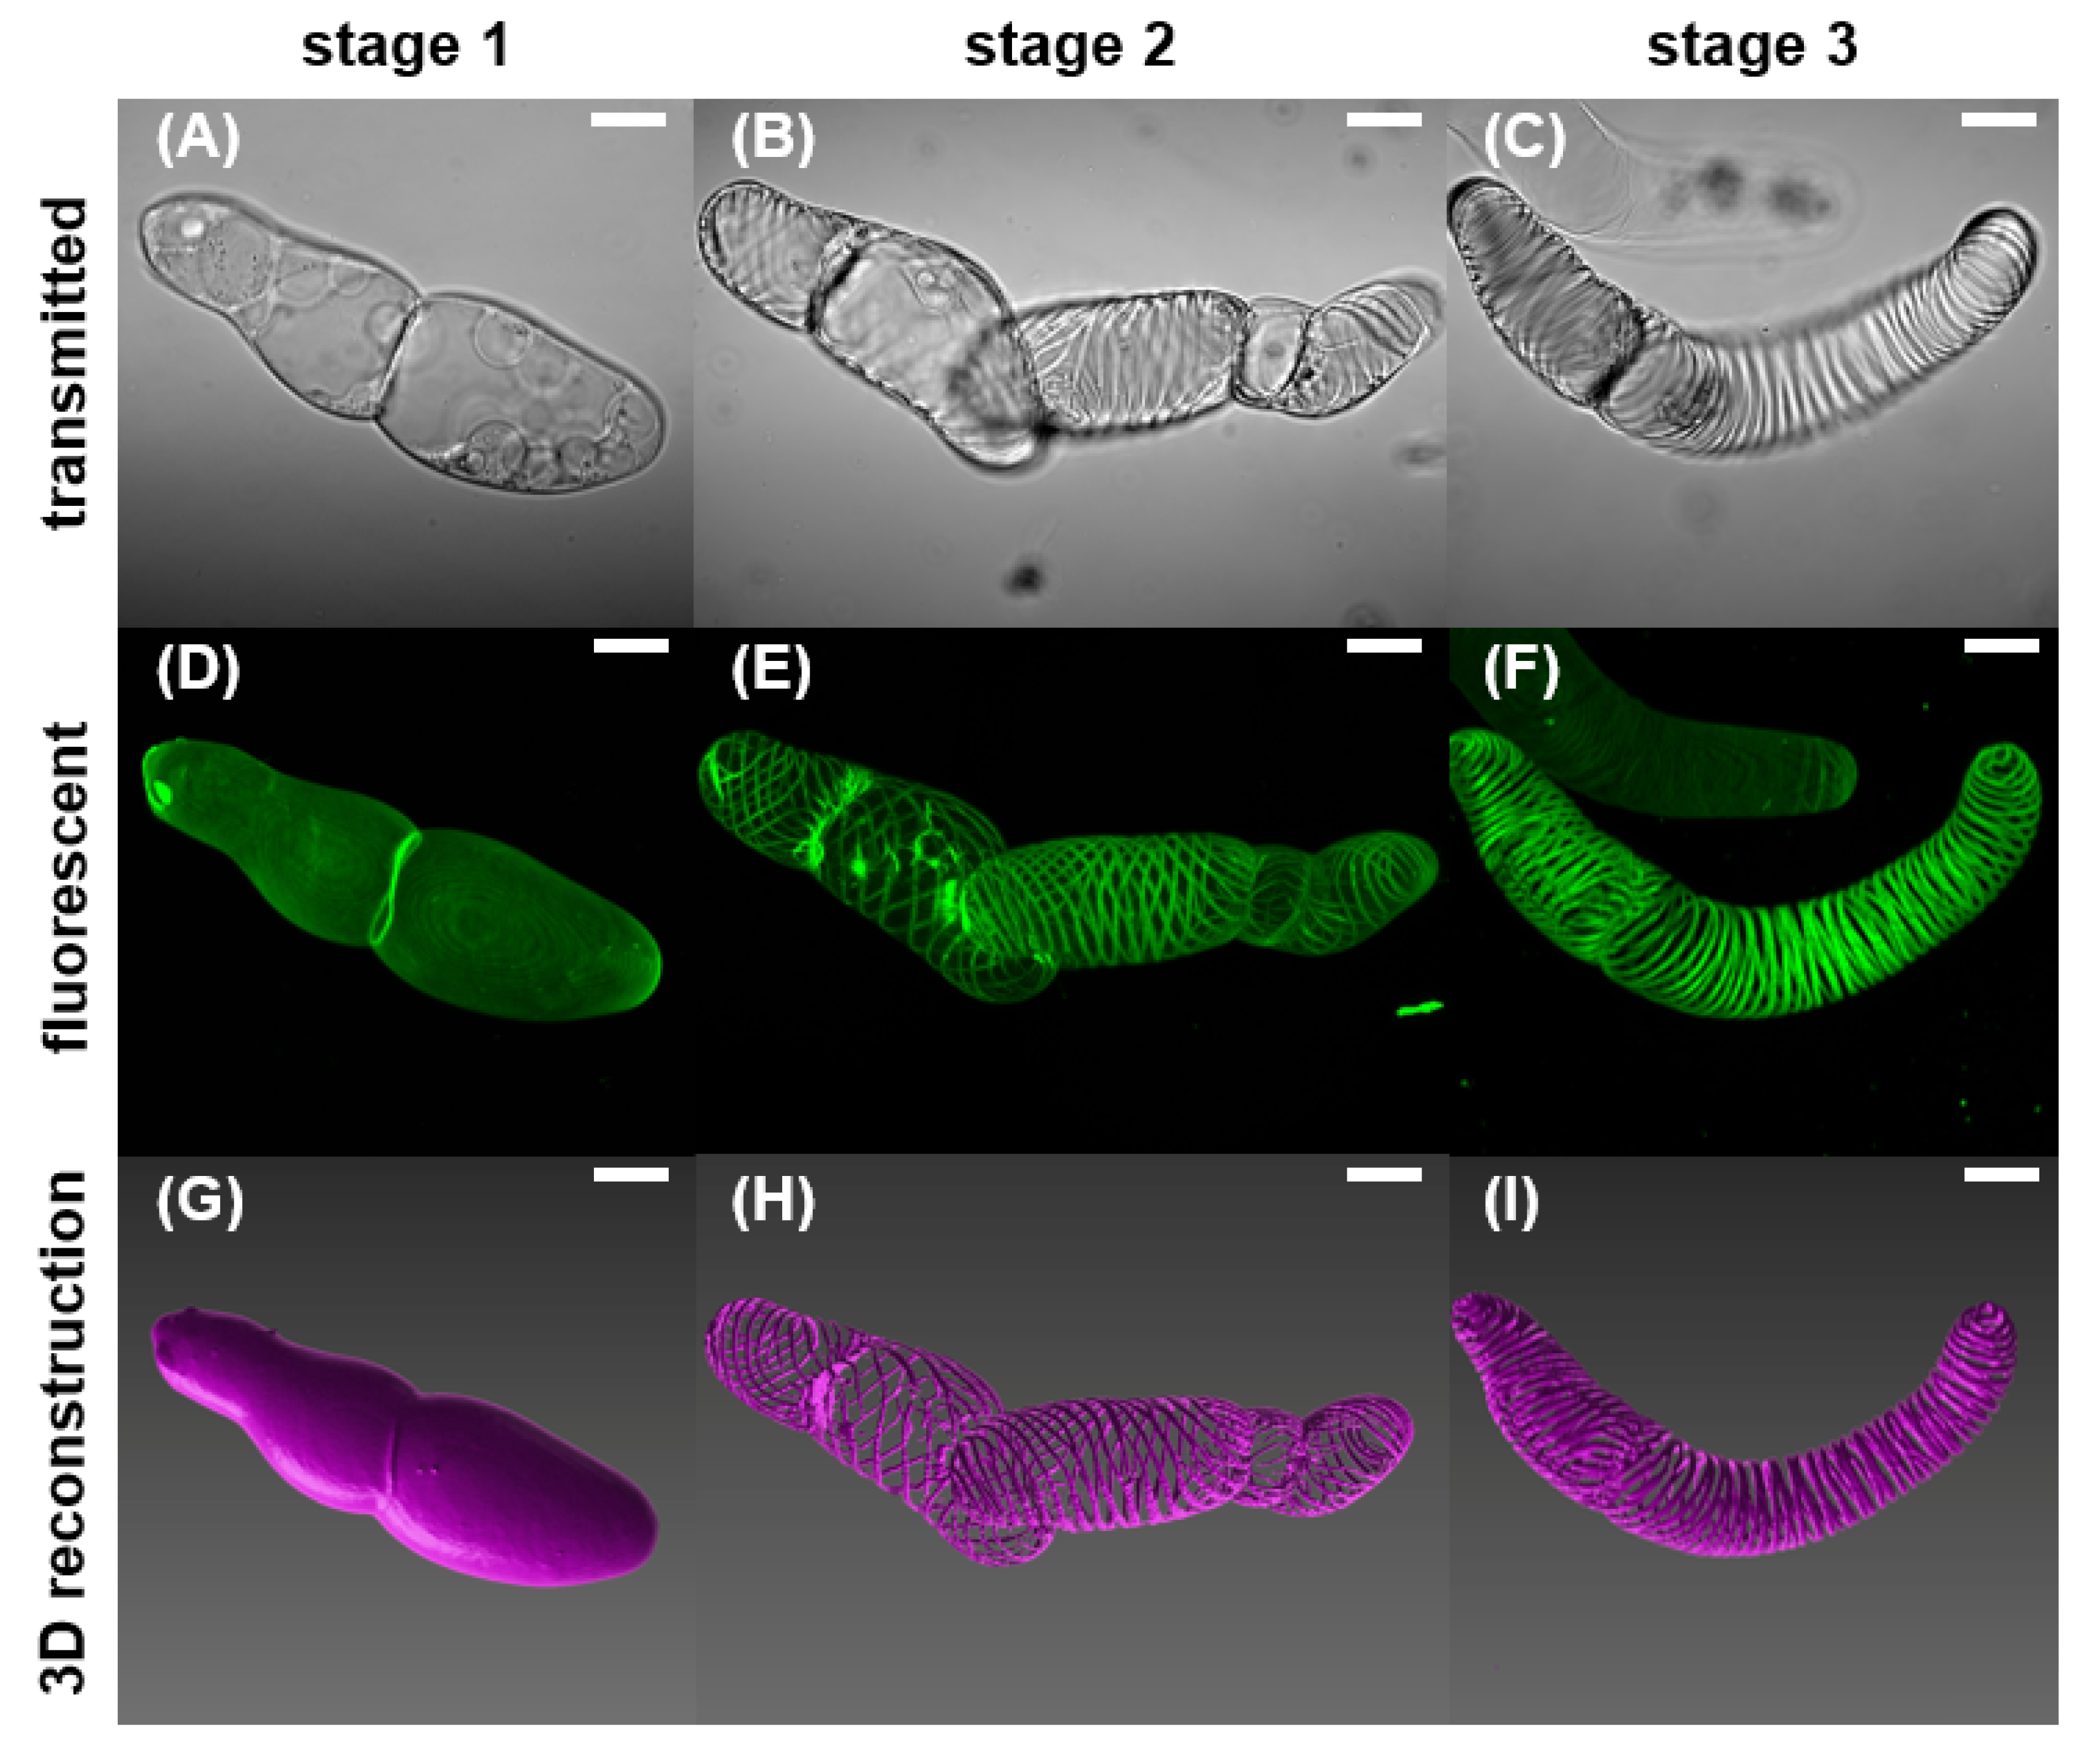
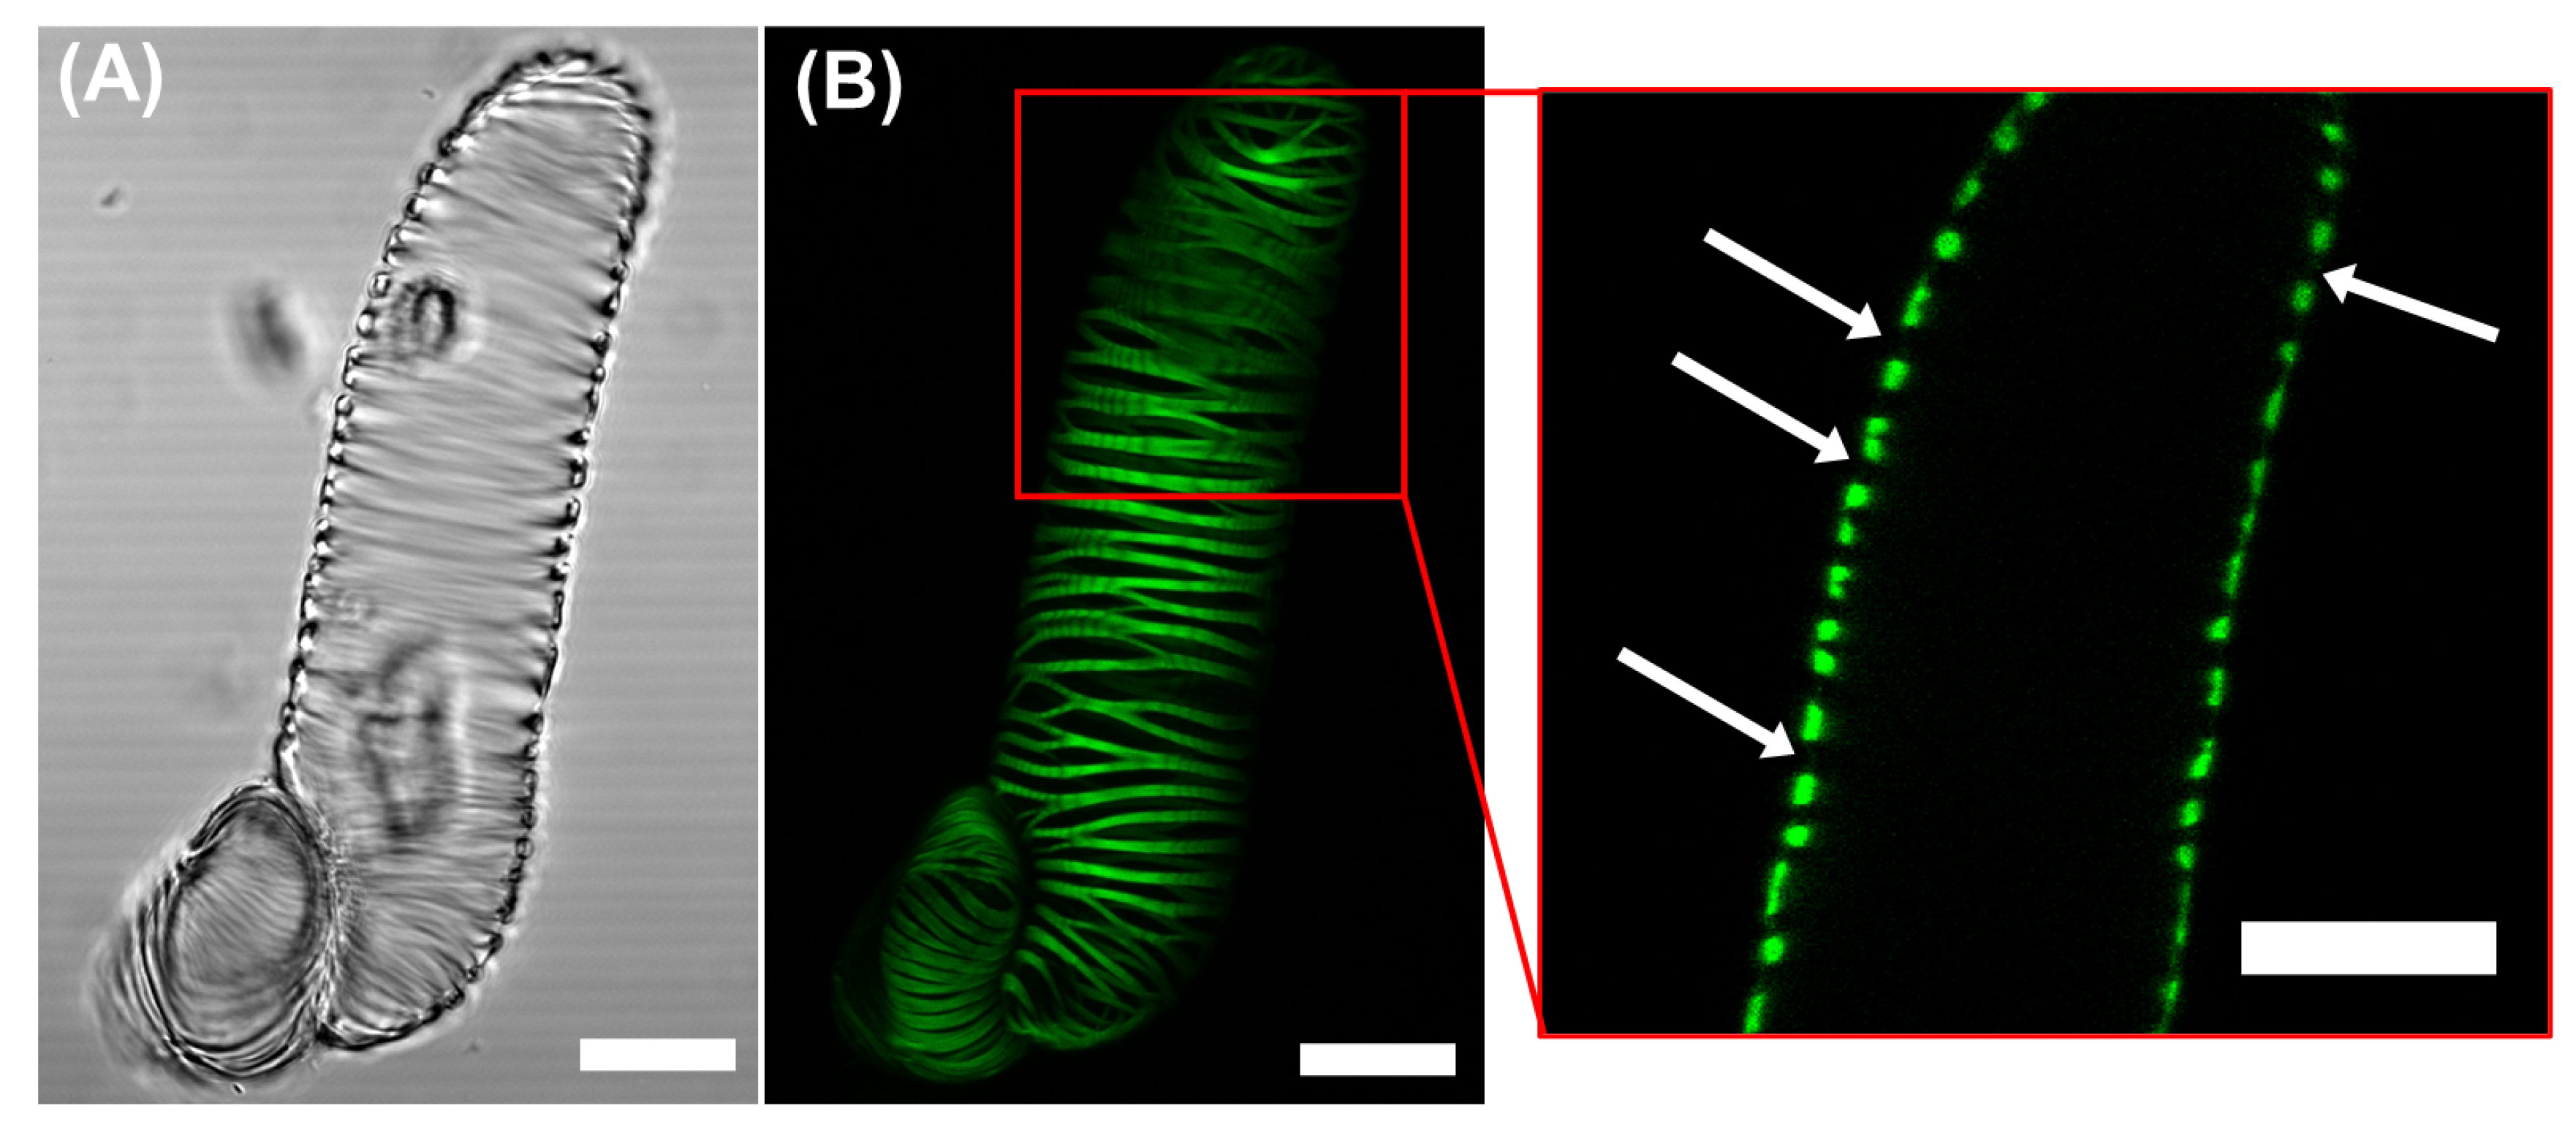
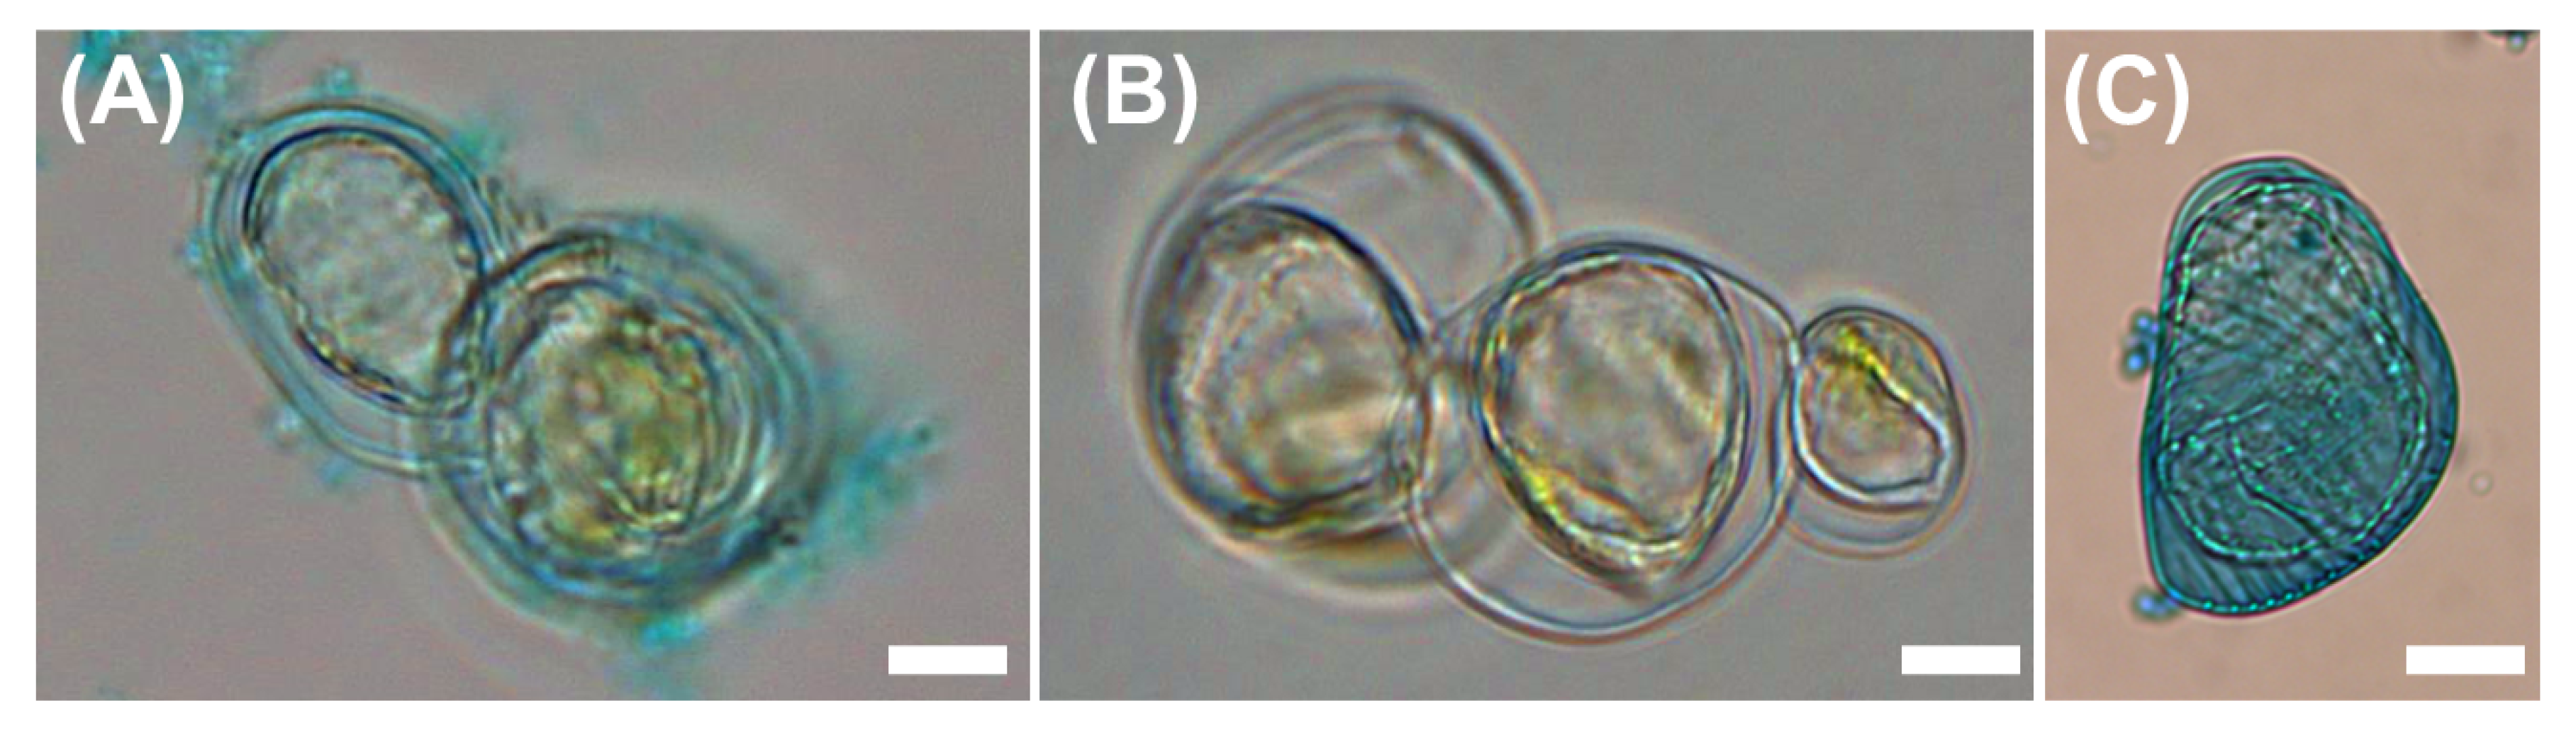
2.1. Morphological Observations of the VND7-Inducible Arabidopsis Cells
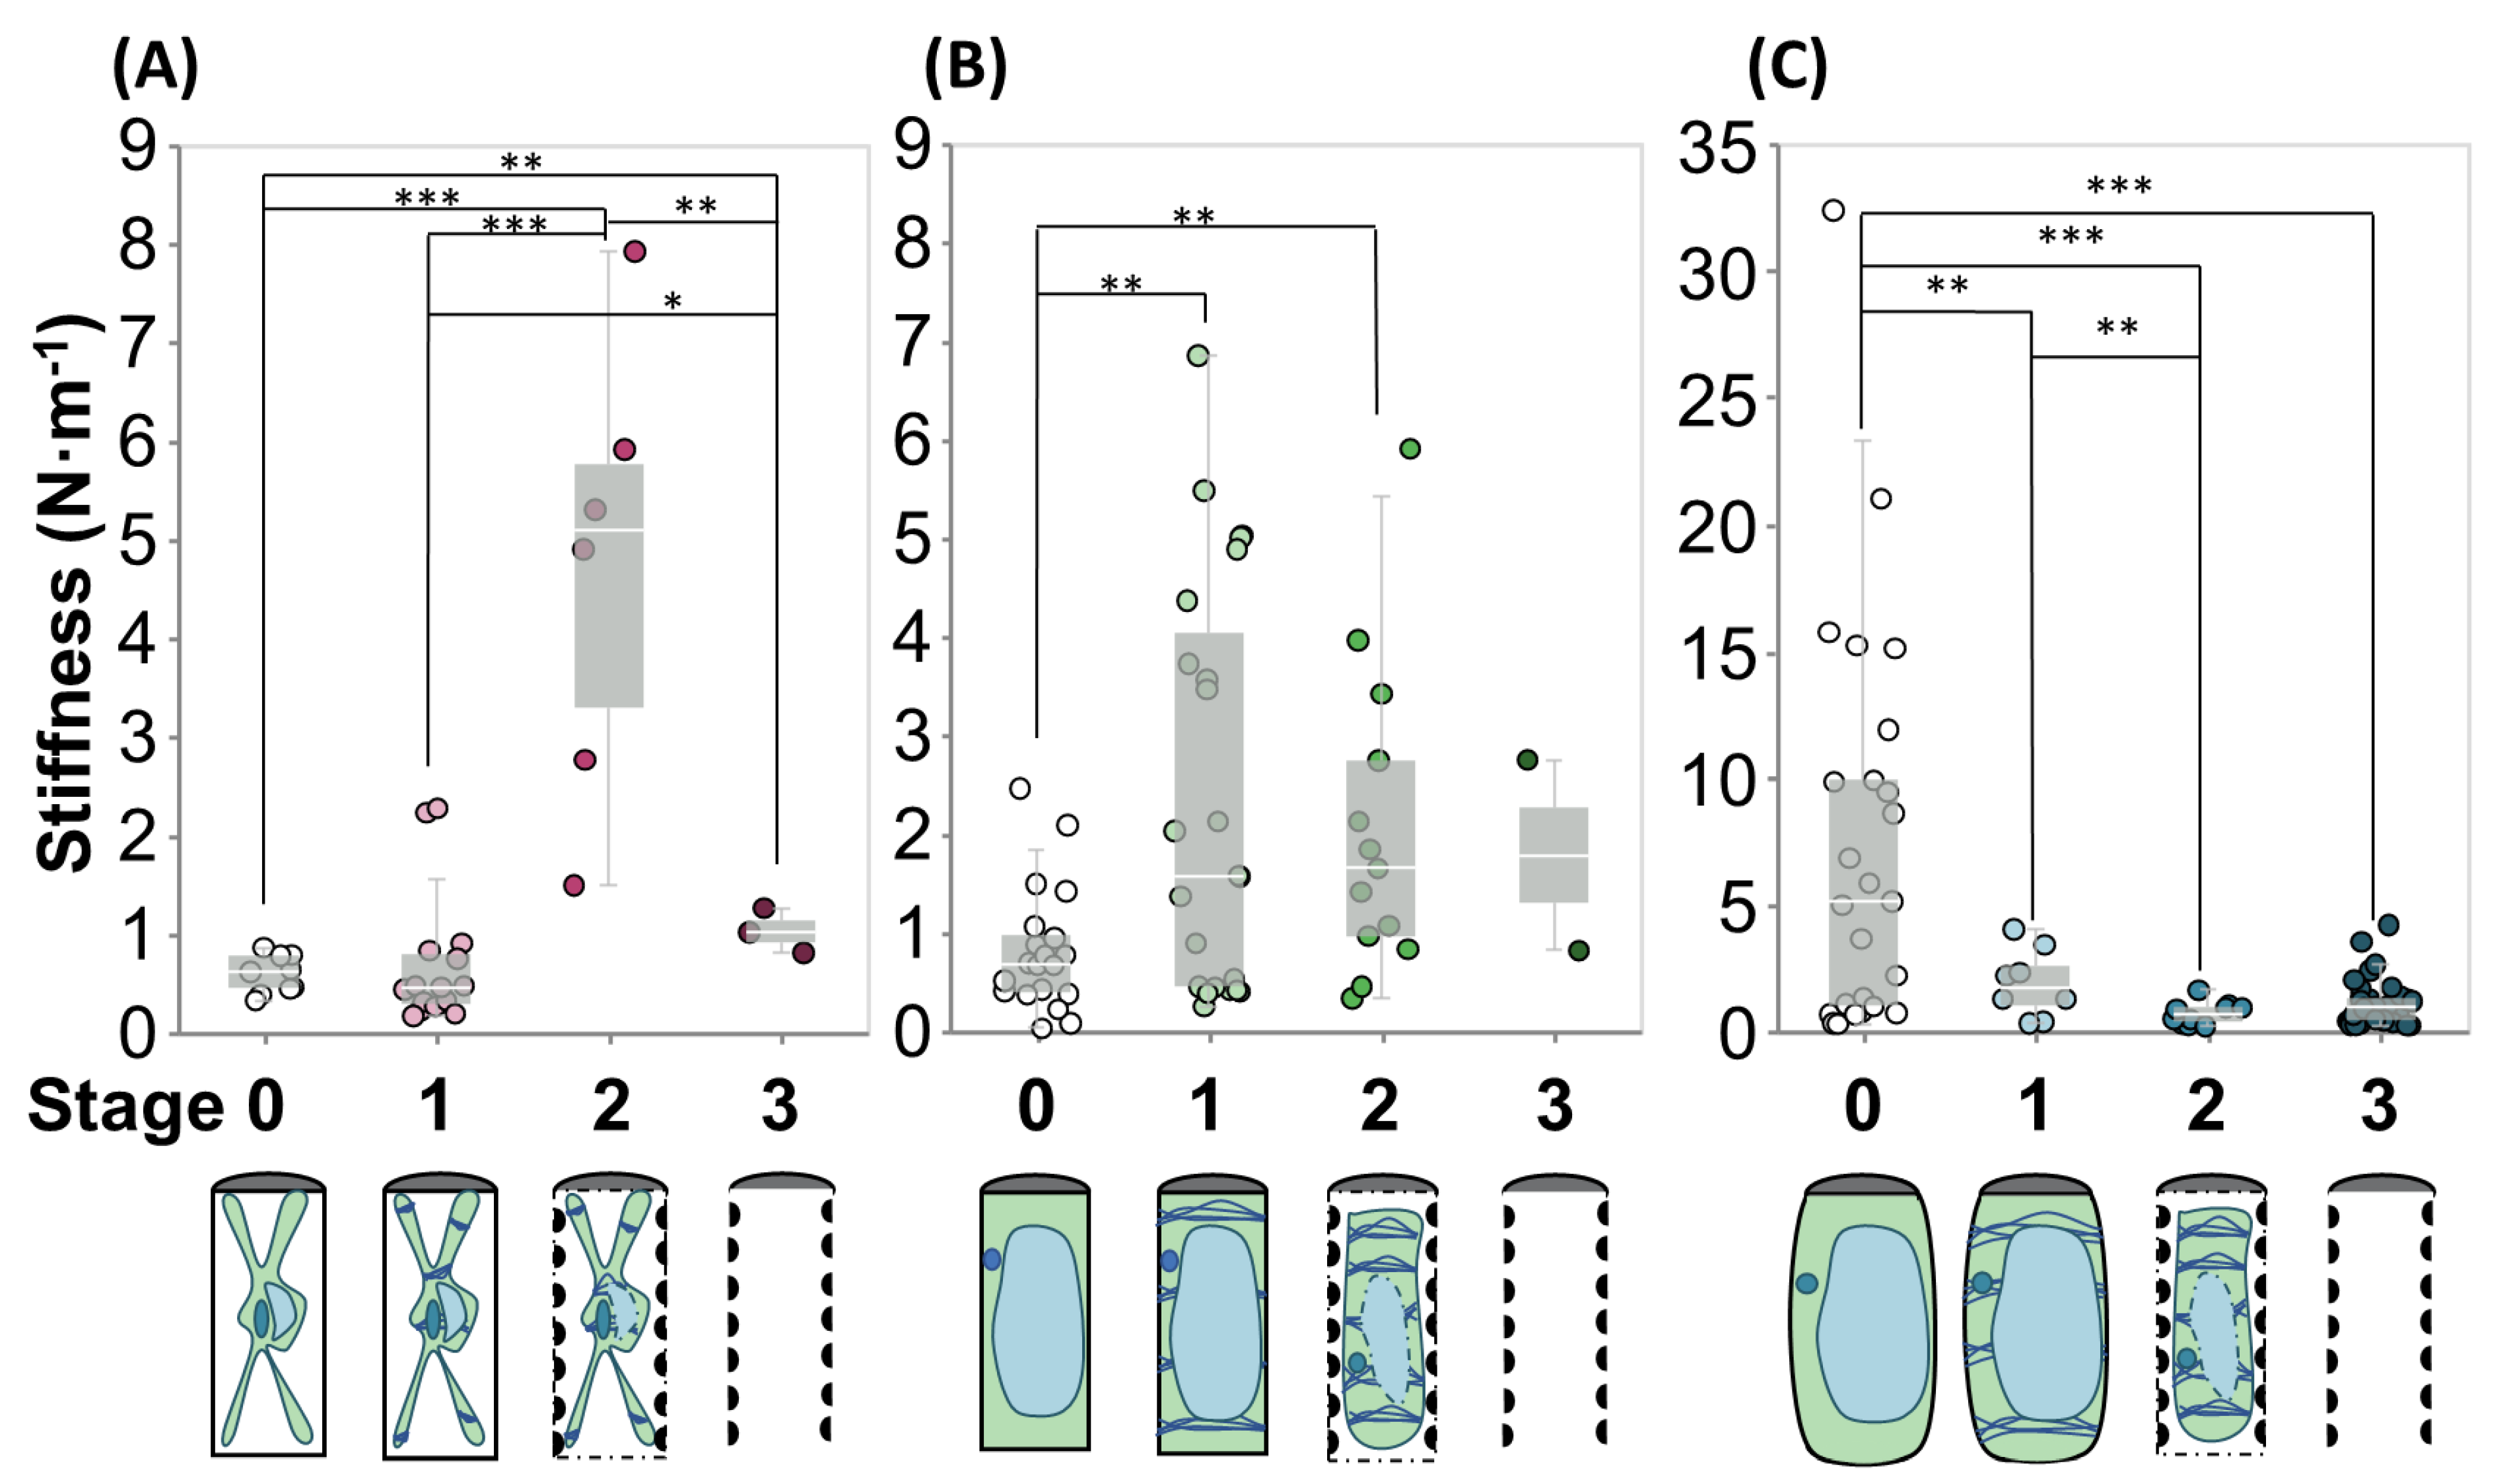
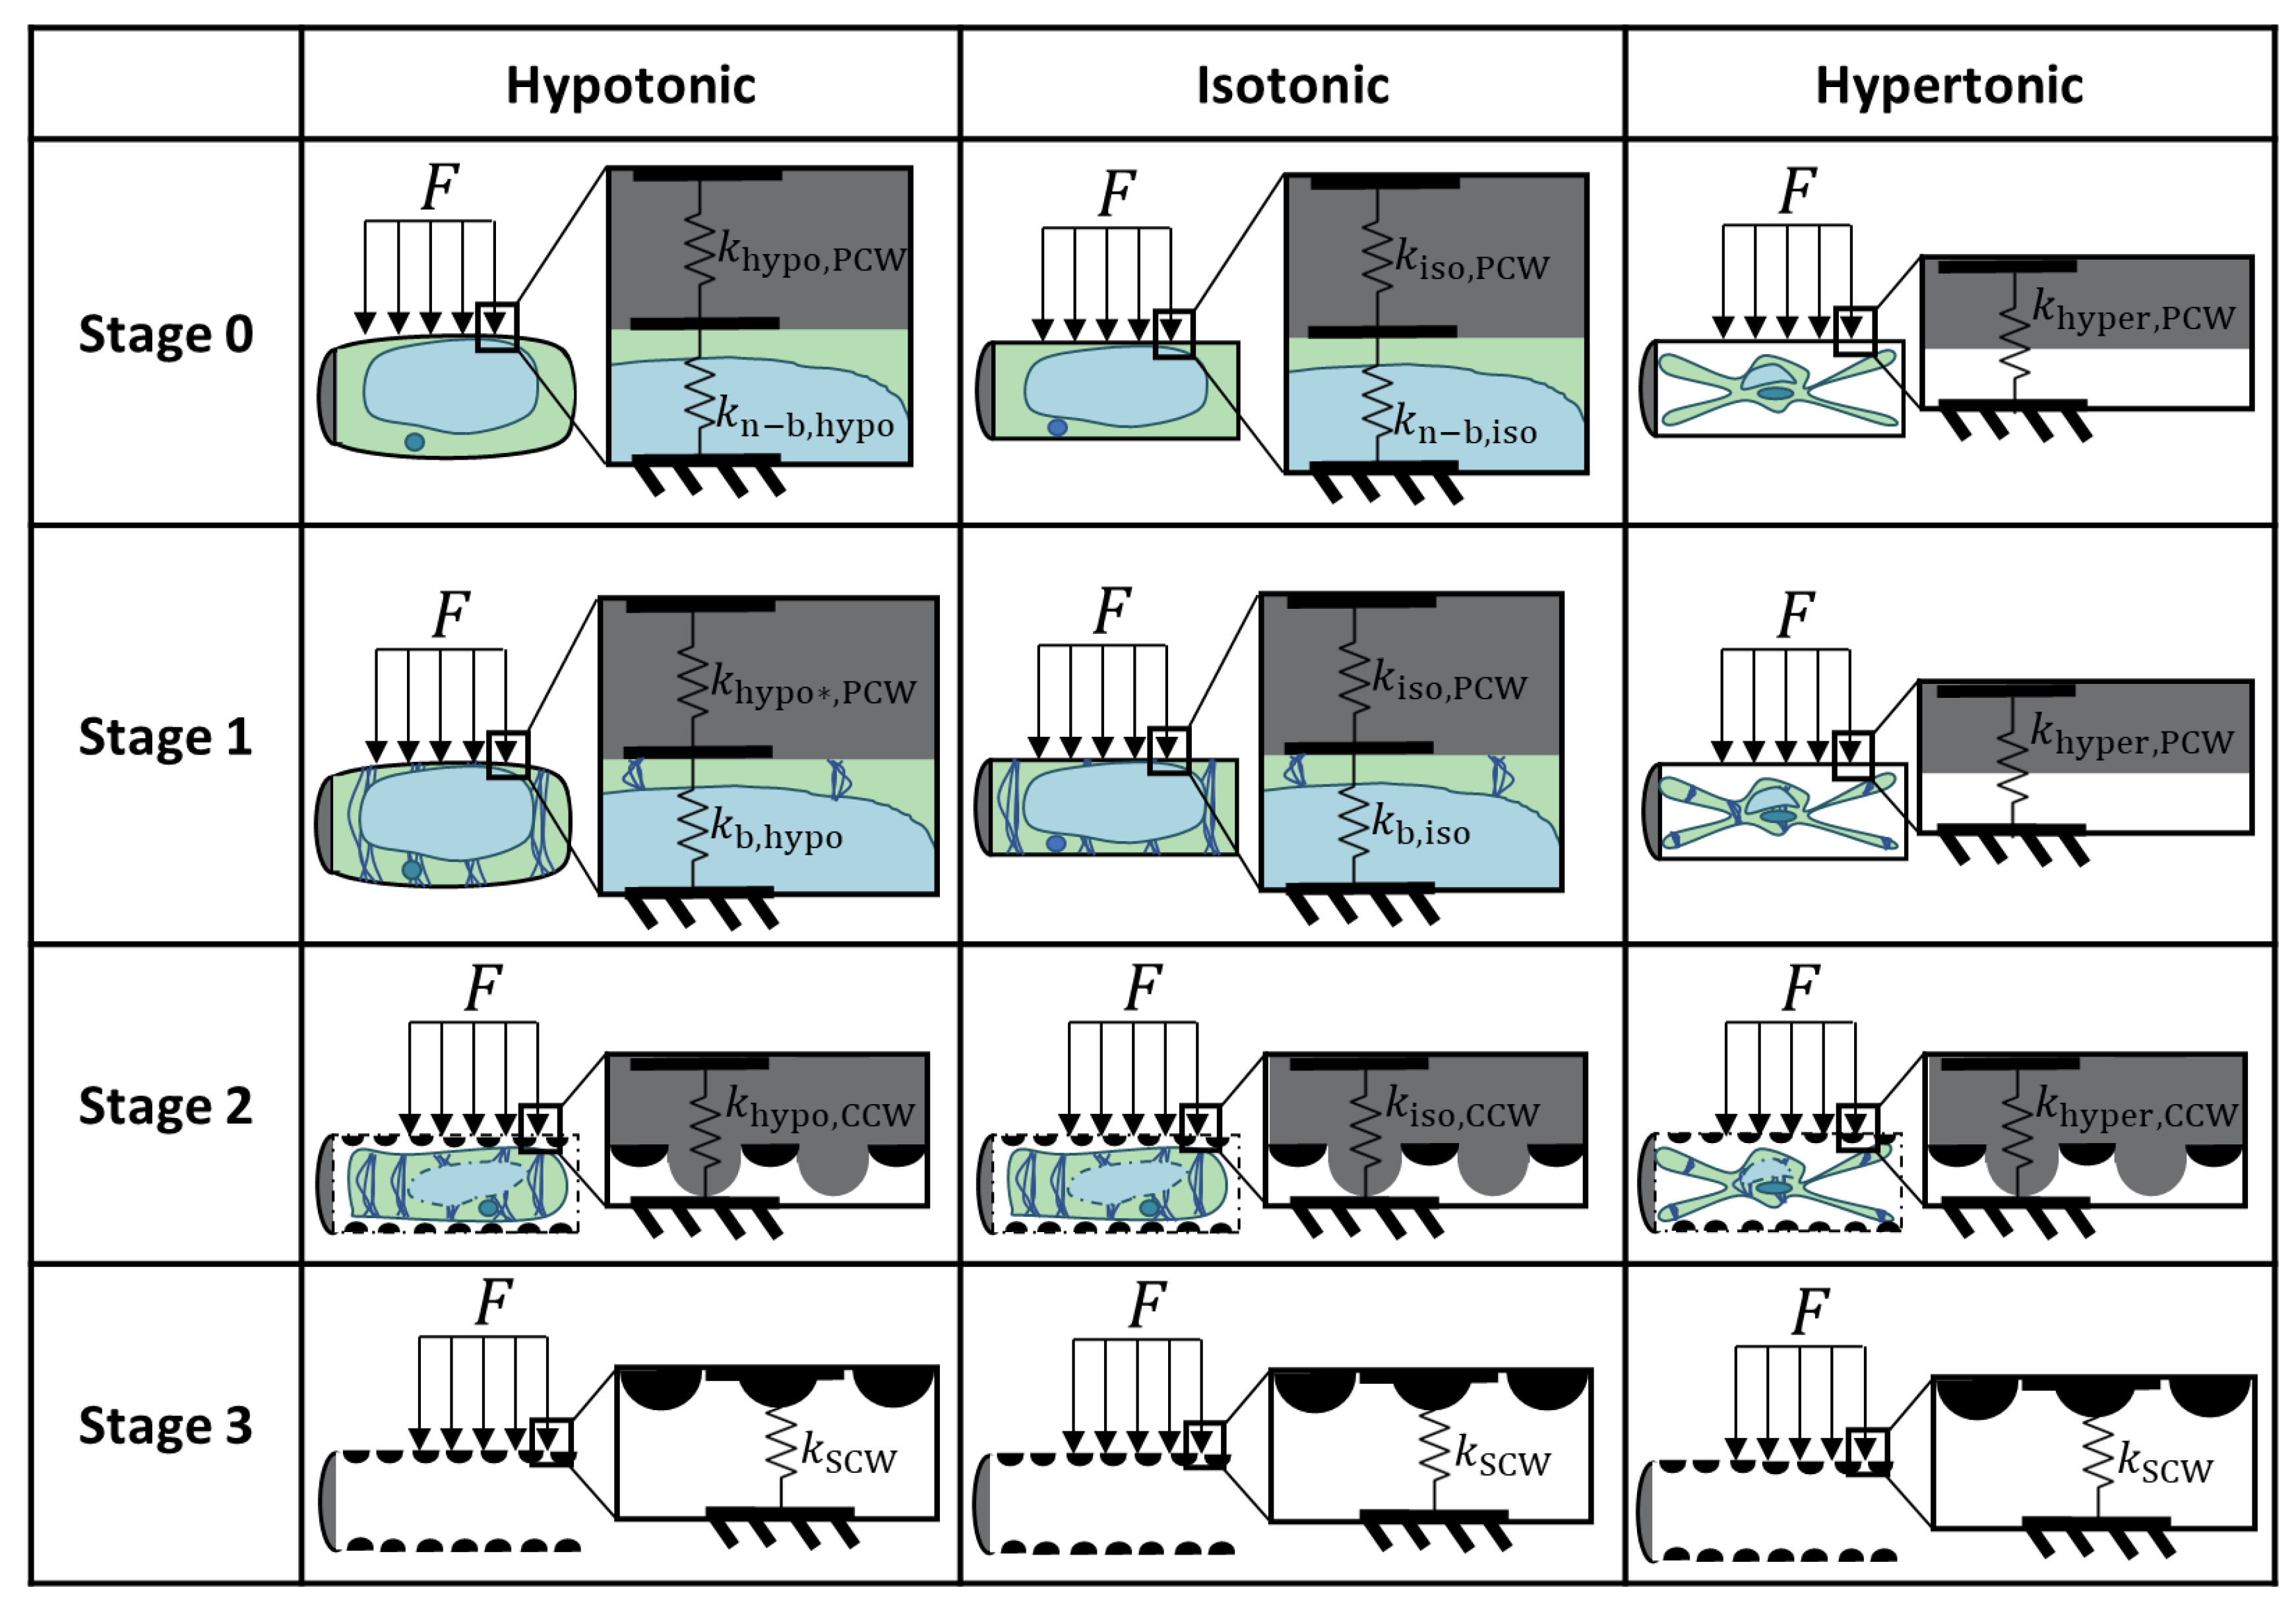
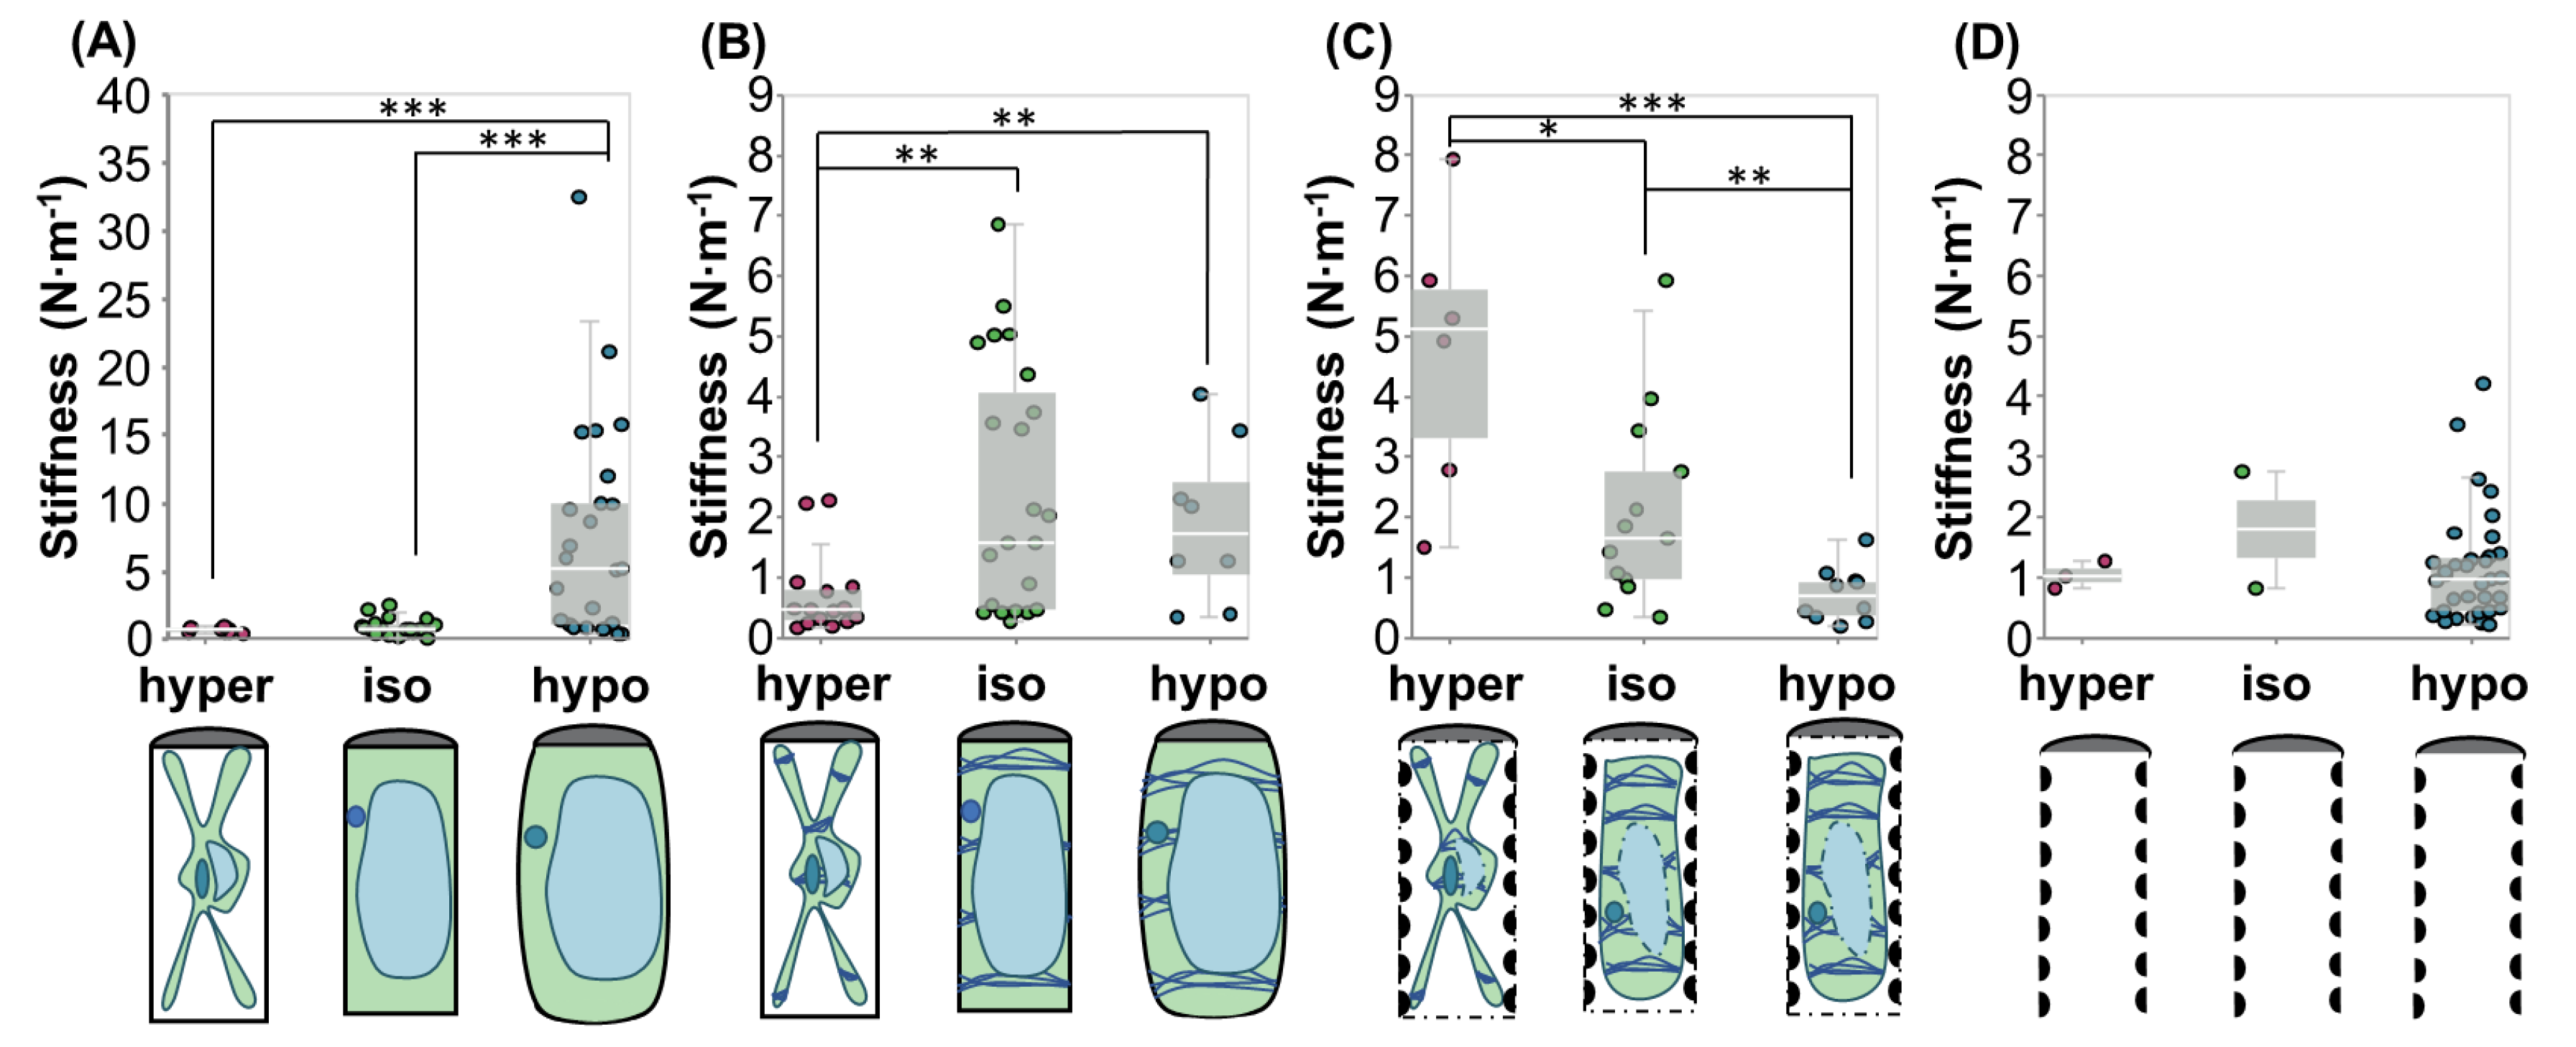
2.2. Biomechanics of Differentiating VND7-Inducible Arabidopsis Cells
2.2.1. Hypertonic Condition
2.2.2. Isotonic Condition
2.2.3. Hypotonic Condition
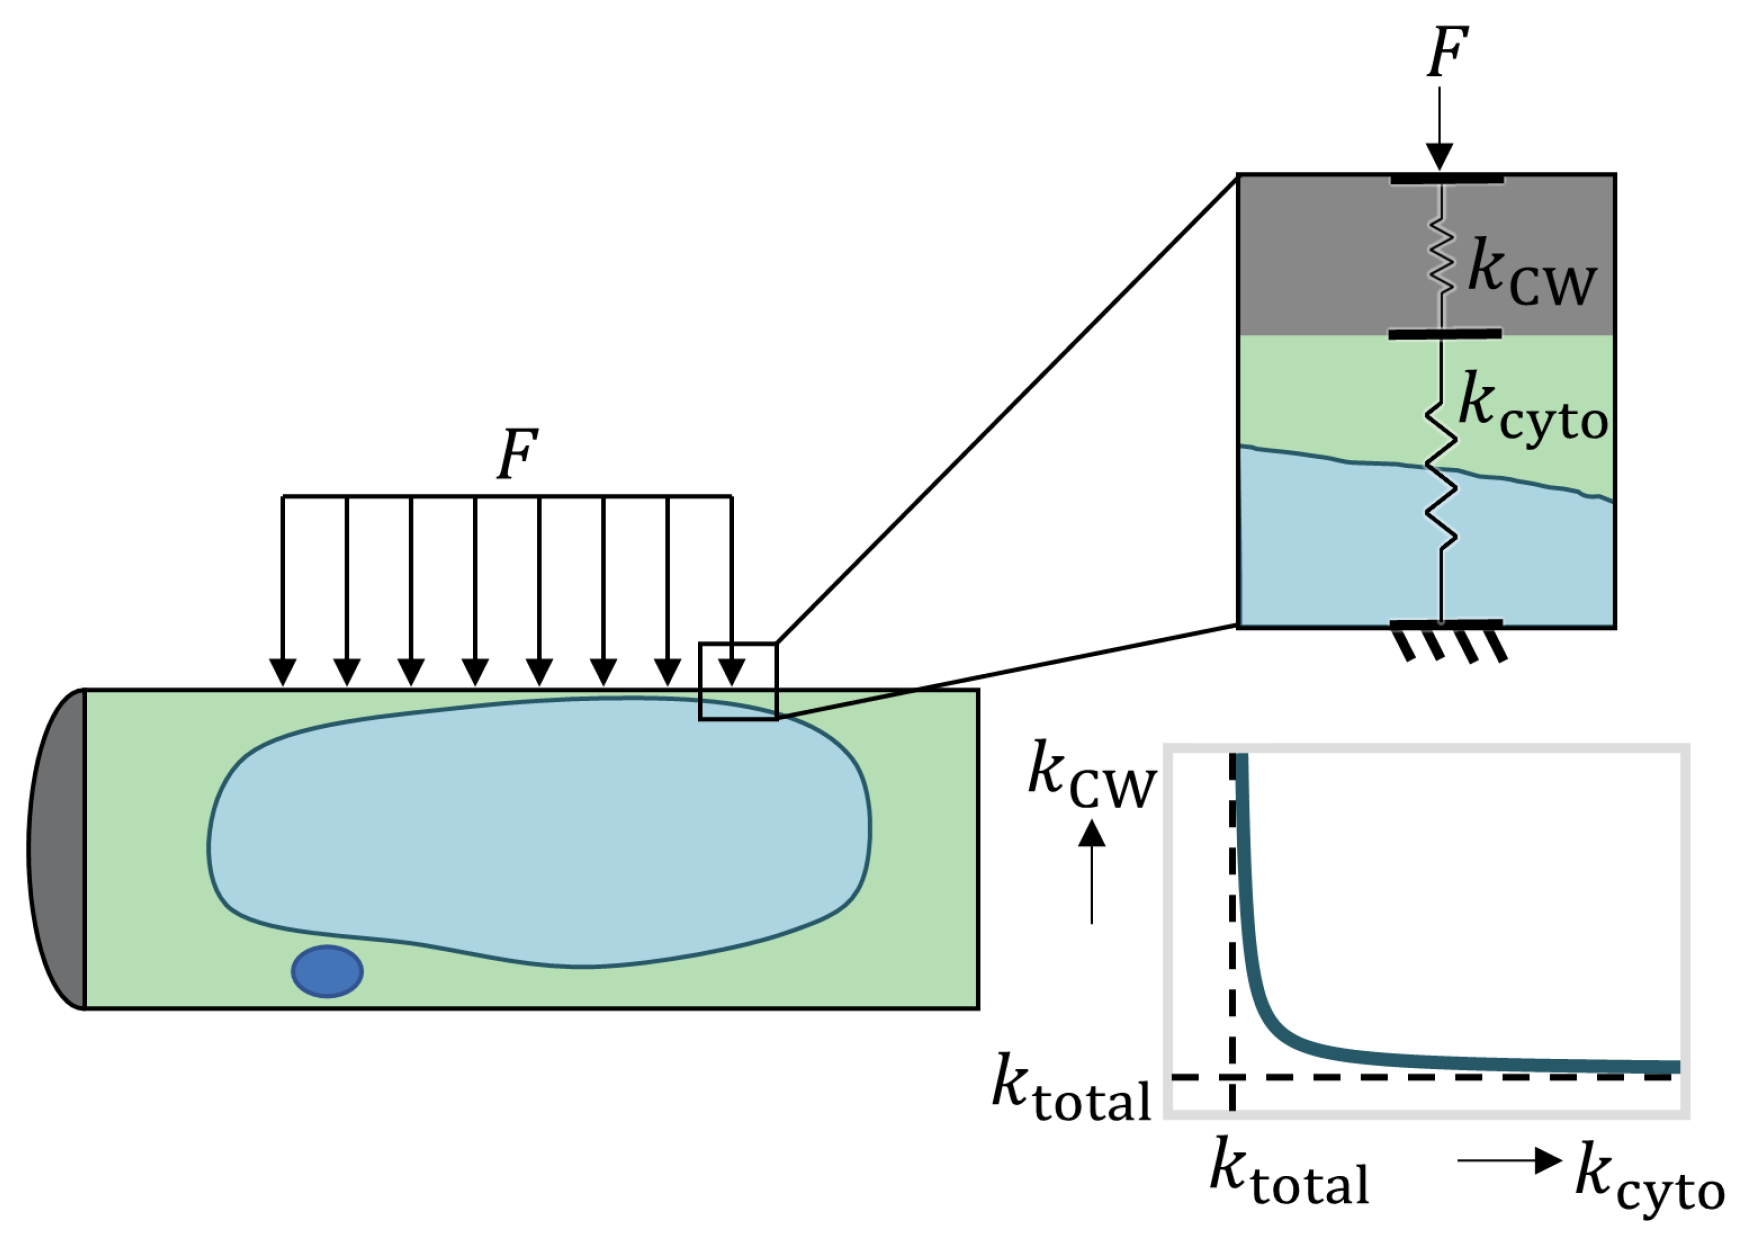
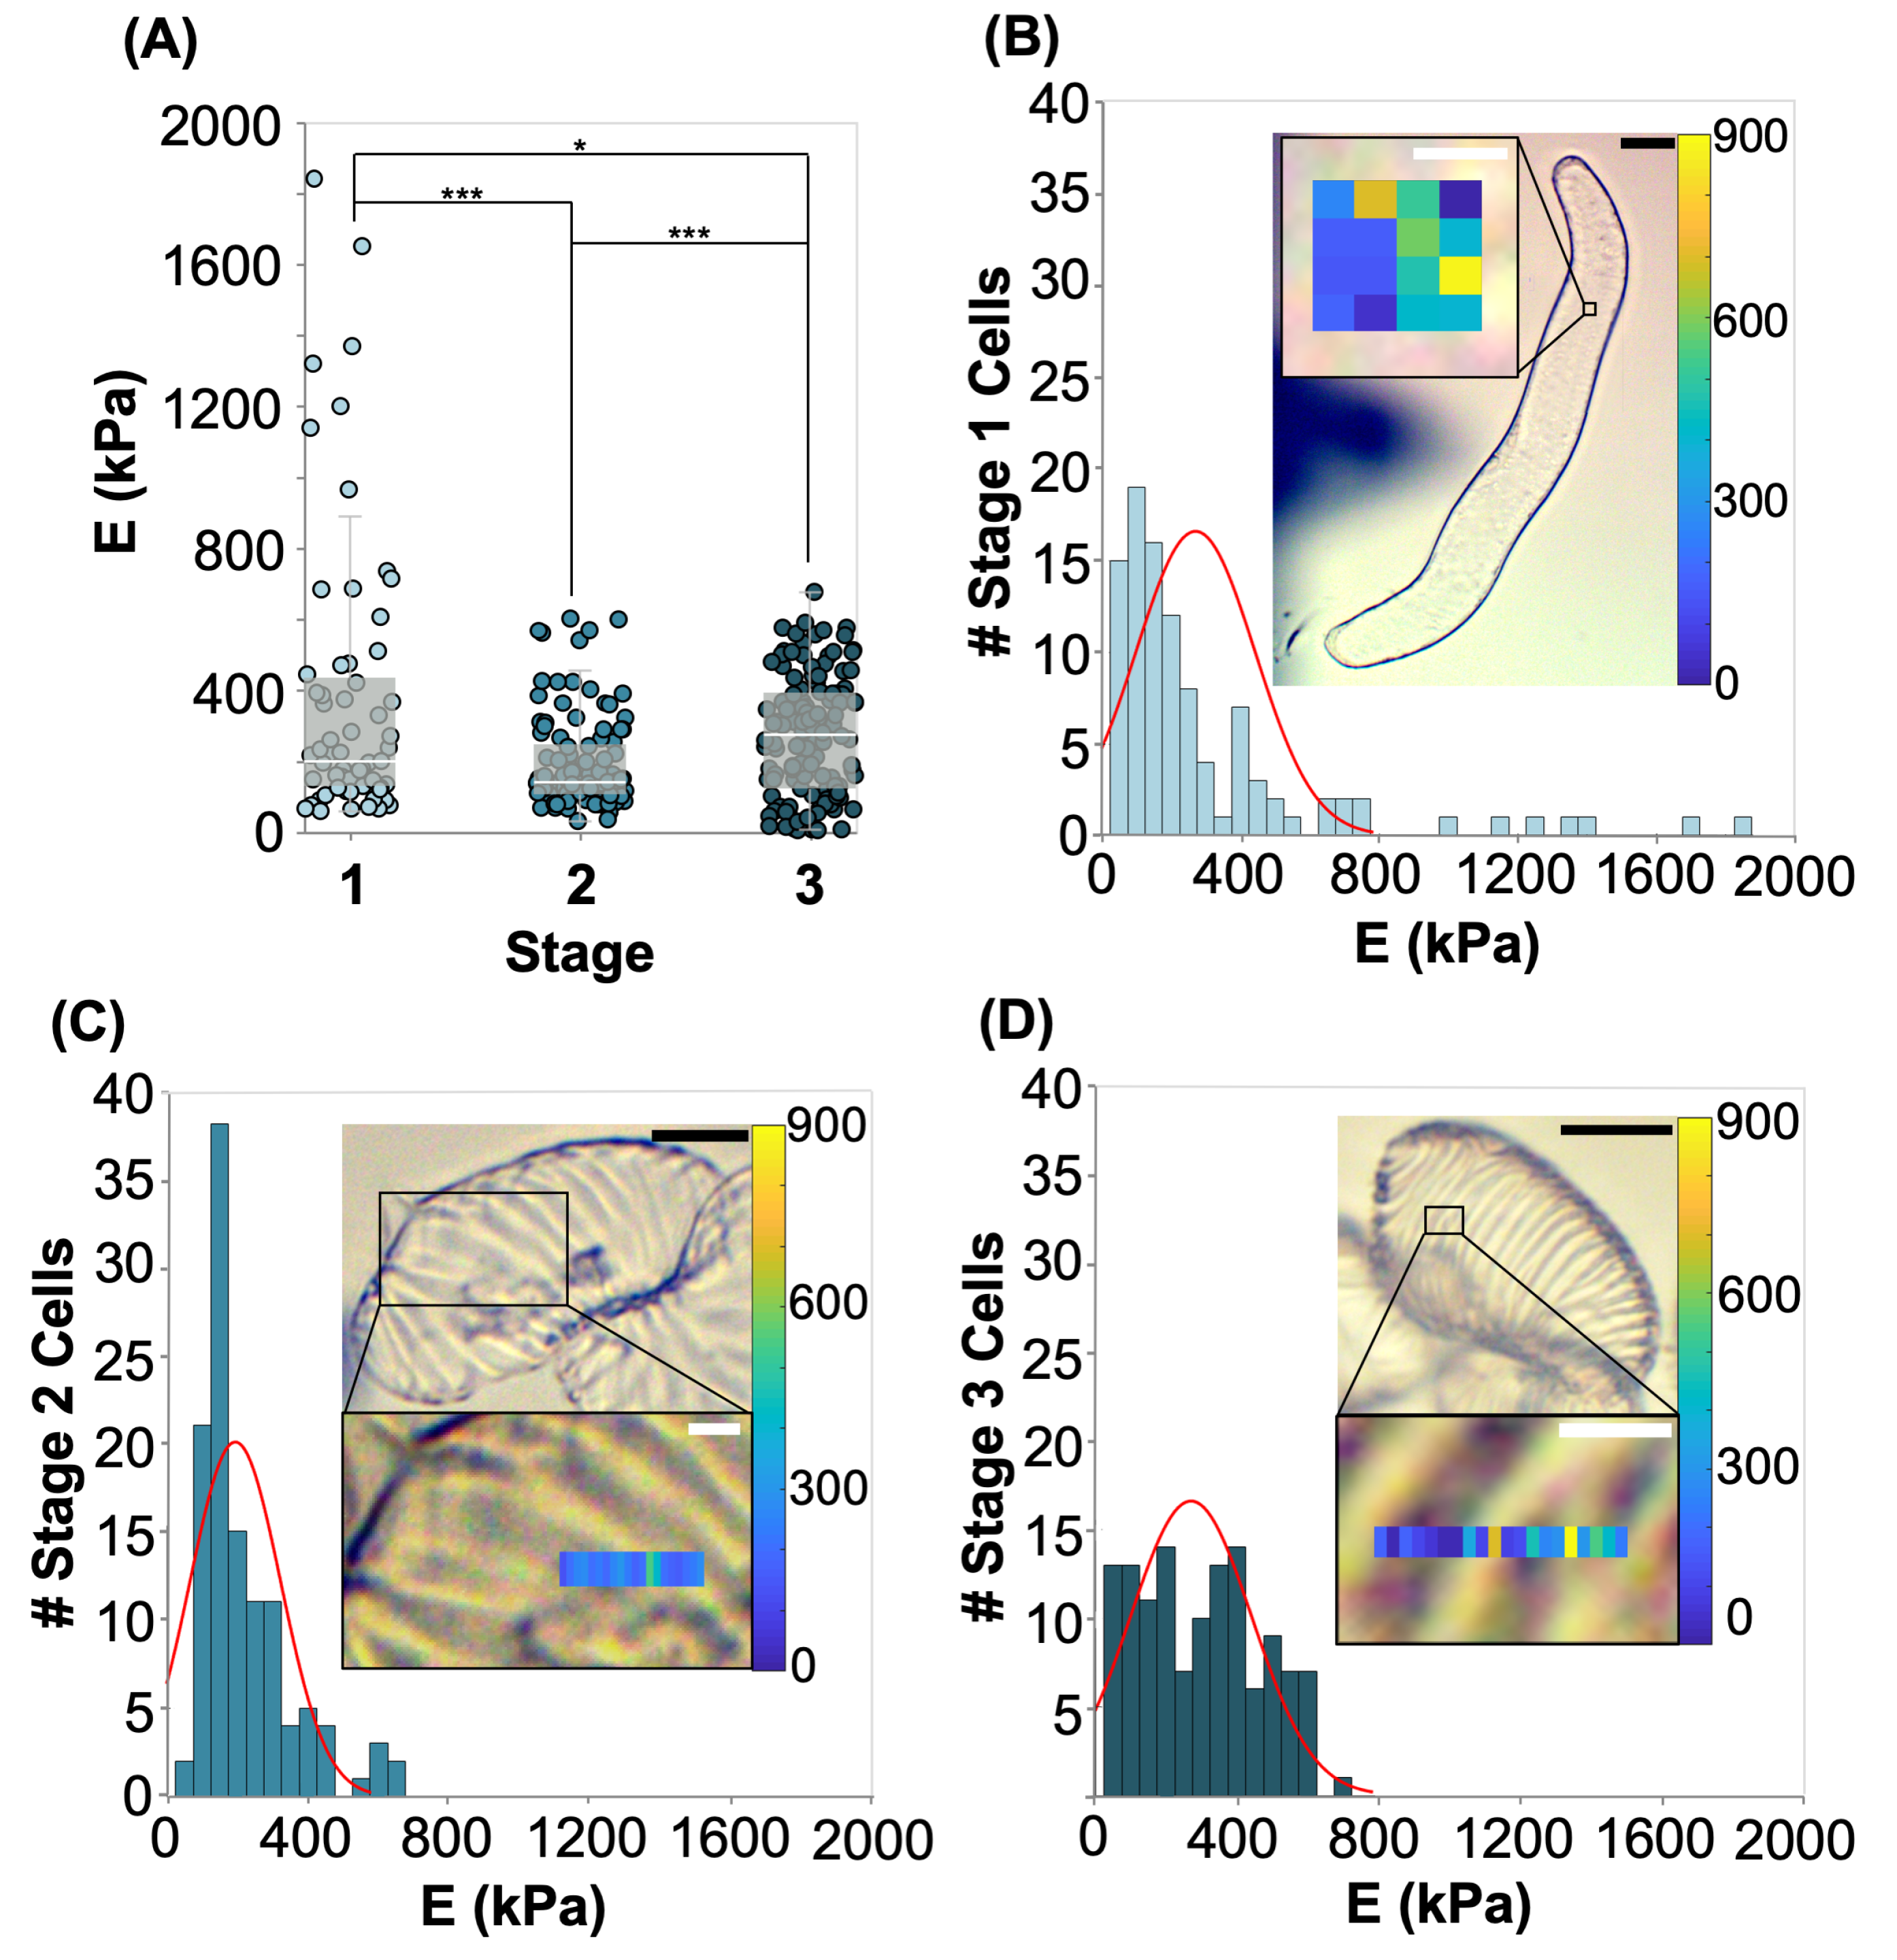
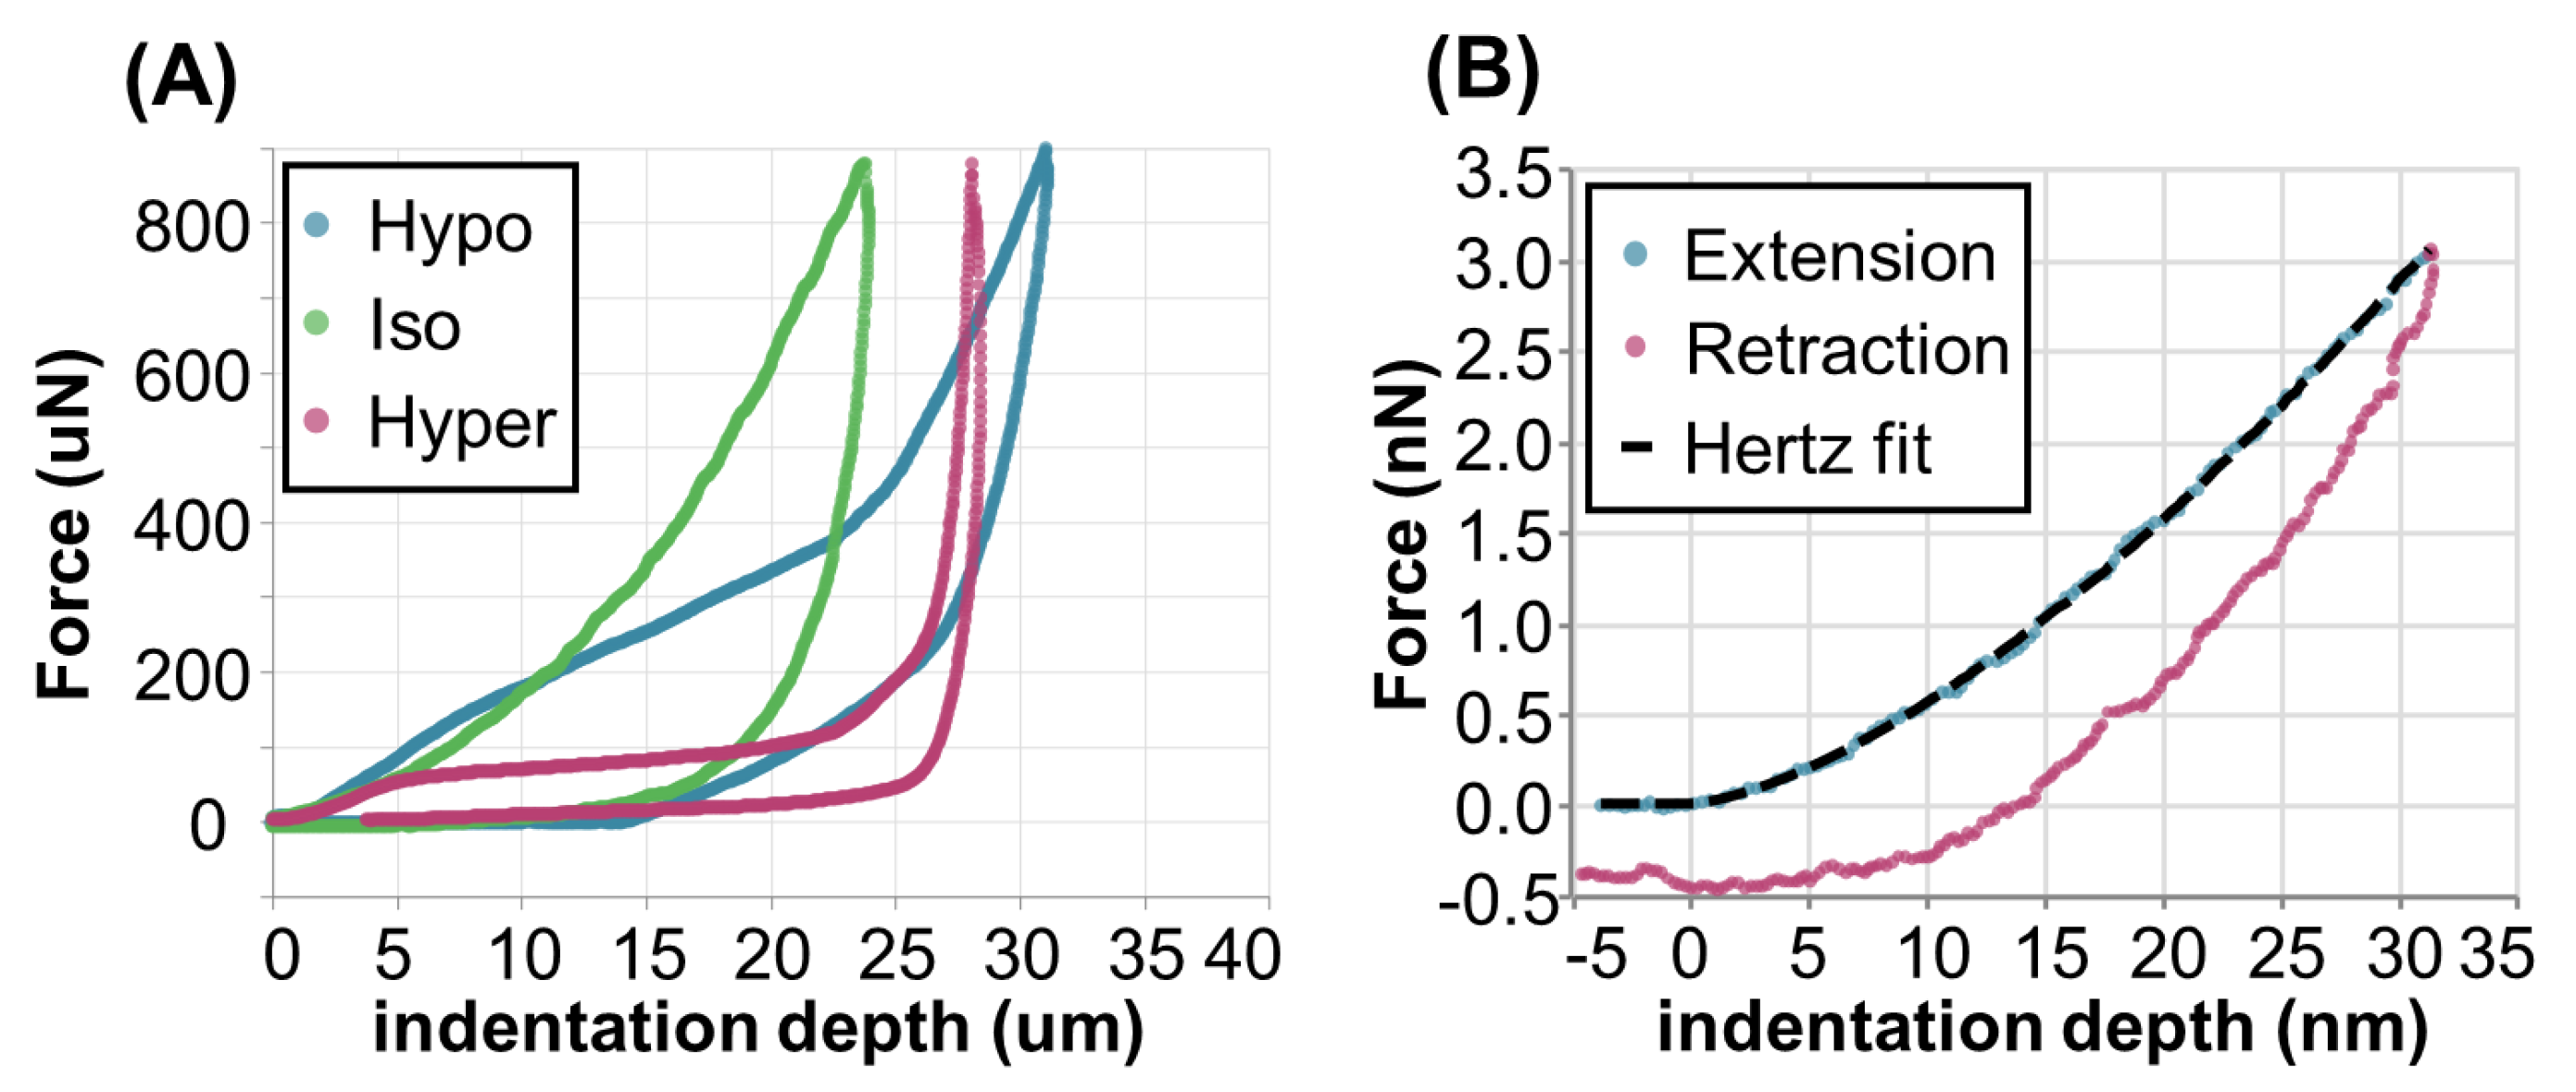
2.3. AFM Analysis of Differentiating VND7-Inducible Arabidopsis Cells
3. Materials and Methods
3.1. Cell Culture and Differentiation Induction
3.2. Microscopy Observations
3.3. Mechanical Testing
3.4. Analysis
4. Conclusions
Author Contributions
Funding
Acknowledgments
Conflicts of Interest
Abbreviations
| AFM | Atomic-force microscopy |
| DEX | dexamethasone |
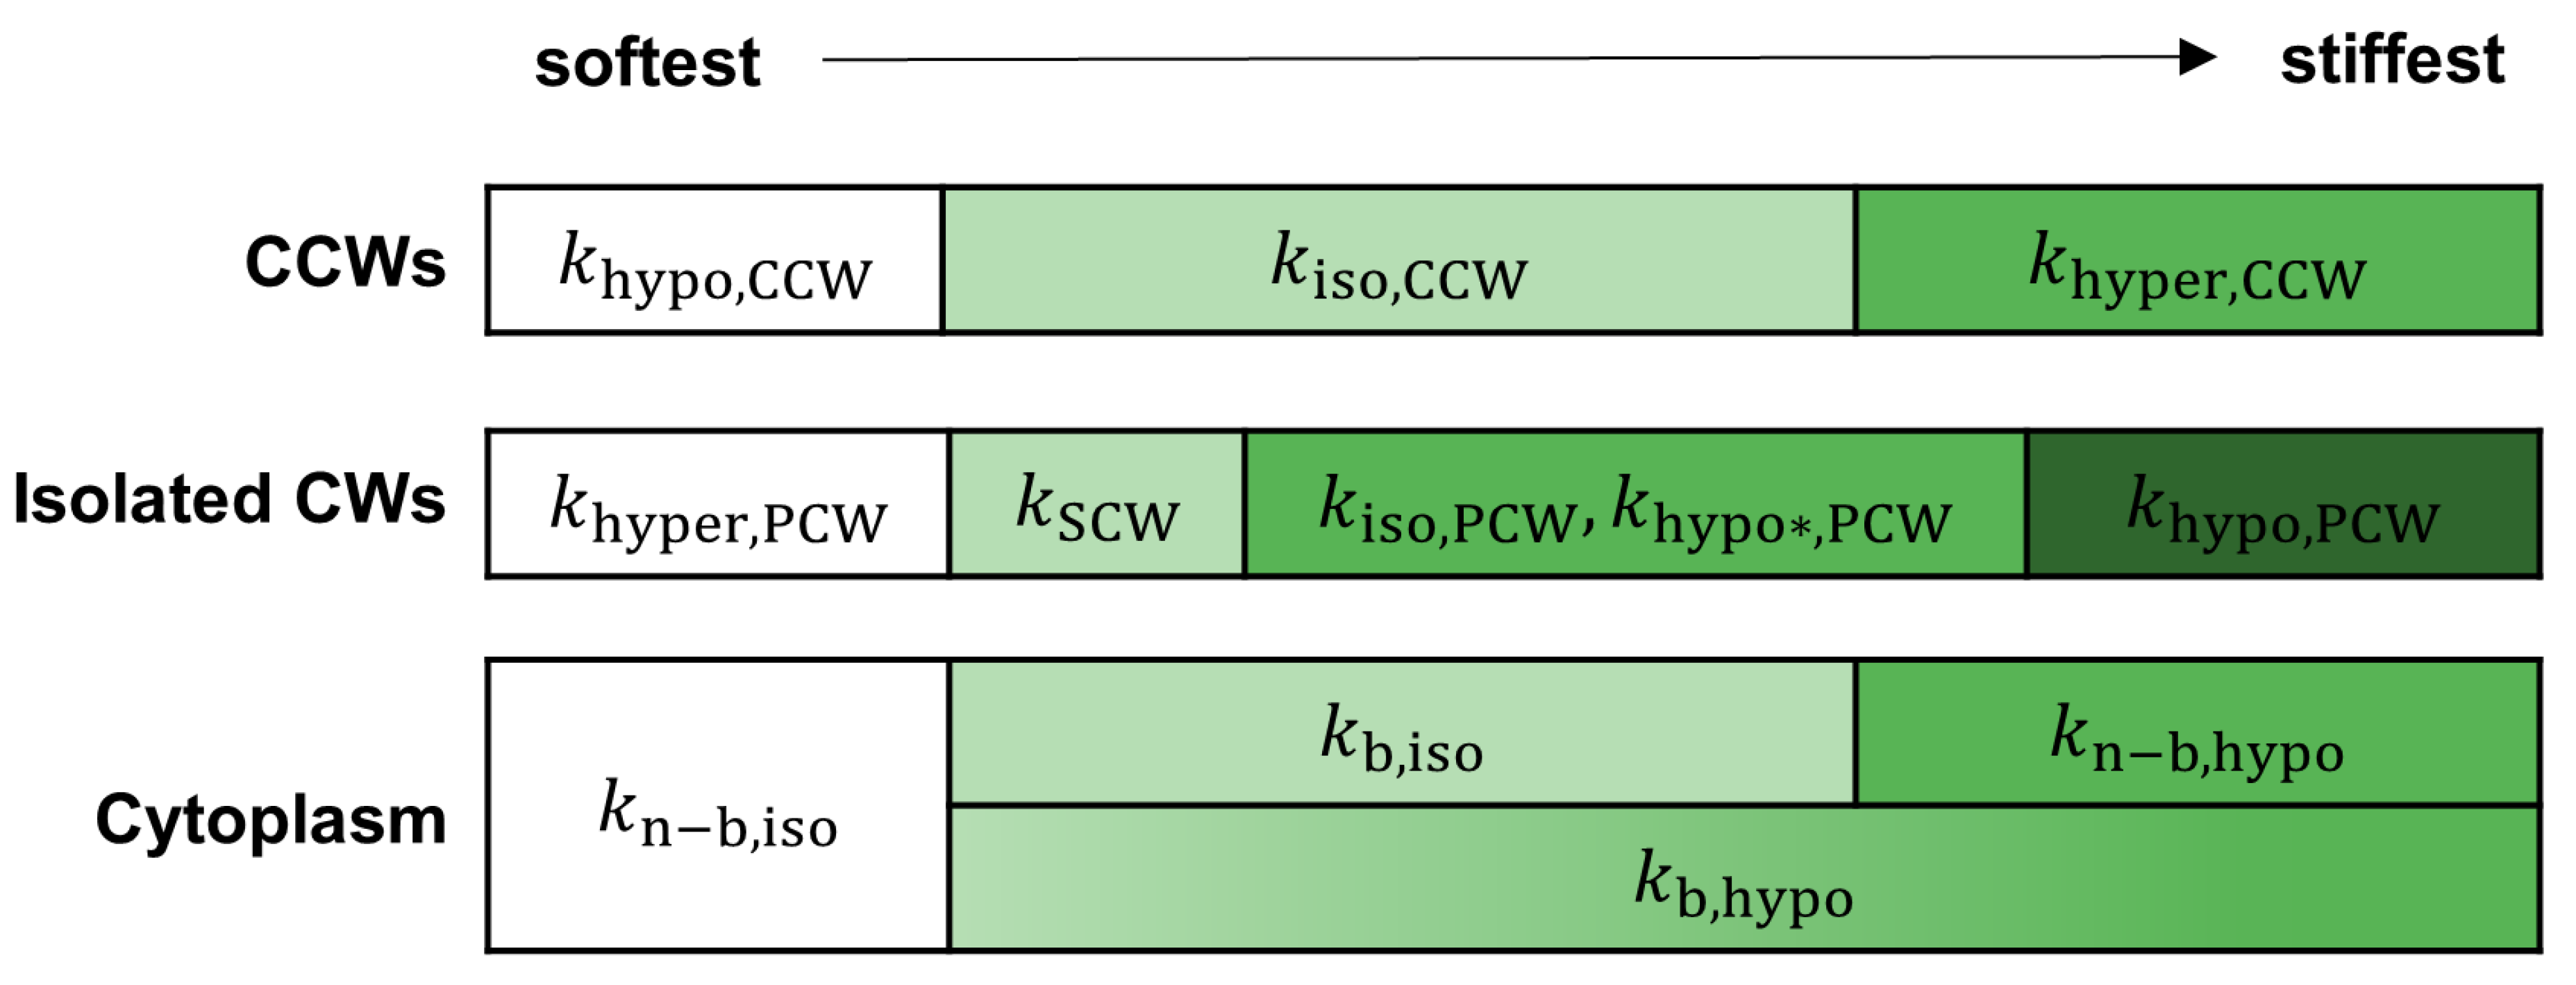
| overall stiffness of cell in hypotonic/isotonic/hypertonic solution in stage 0/1/2/3 | |
| stiffness of primary cell wall in hypotonic/isotonic/hypertonic solution | |
| stiffness of primary cell wall in hypotonic solution in stage 1, which is | |
| somehow weakened | |
| stiffness of combined cell walls in hypotonic/isotonic/hypertonic solution | |
| stiffness of secondary cell wall | |
| stiffness of non-bundled cytoplasm in hypotonic/isotonic solution | |
| stiffness of bundled cytoplasm in hypotonic/isotonic solution | |
| Young’s modulus from AFM indentations on cells in hypotonic solution in | |
| stage 1/2/3 | |
| PCW | Primary cell wall |
| CCW | combined cell walls |
| SCW | Secondary cell wall |
| TE | Tracheary element |
| PCD | Programmed cell death |
| SE | Standard error |
| VND7 | VASCULAR-RELATED NAC-DOMAIN7 |
| MT | Microtubule |
Appendix A

| Cell Shape & Stage | Dimension | Mean ± SE |
|---|---|---|
| Elongated Stage 1 | Length (m) | |
| Elongated Stage 2 | Length (m) | |
| Elongated Stage 3 | Length (m) | |
| Elongated Stage 1 | Width (m) | |
| Elongated Stage 2 | Width (m) | |
| Elongated Stage 3 | Width (m) | |
| Round Stage 1 | Diameter (m) | |
| Round Stage 2 | Diameter (m) | |
| Round Stage 3 | Diameter (m) | |
| Elongated Stage 1 | Volume () | 44,700 ± 2100 |
| Elongated Stage 2 | Volume () | |
| Elongated Stage 3 | Volume () | |
| Round Stage 1 | Volume () | |
| Round Stage 2 | Volume () | |
| Round Stage 3 | Volume () |
| Cell Shape & Stage | Dimension (m) | Mean ± SE |
|---|---|---|
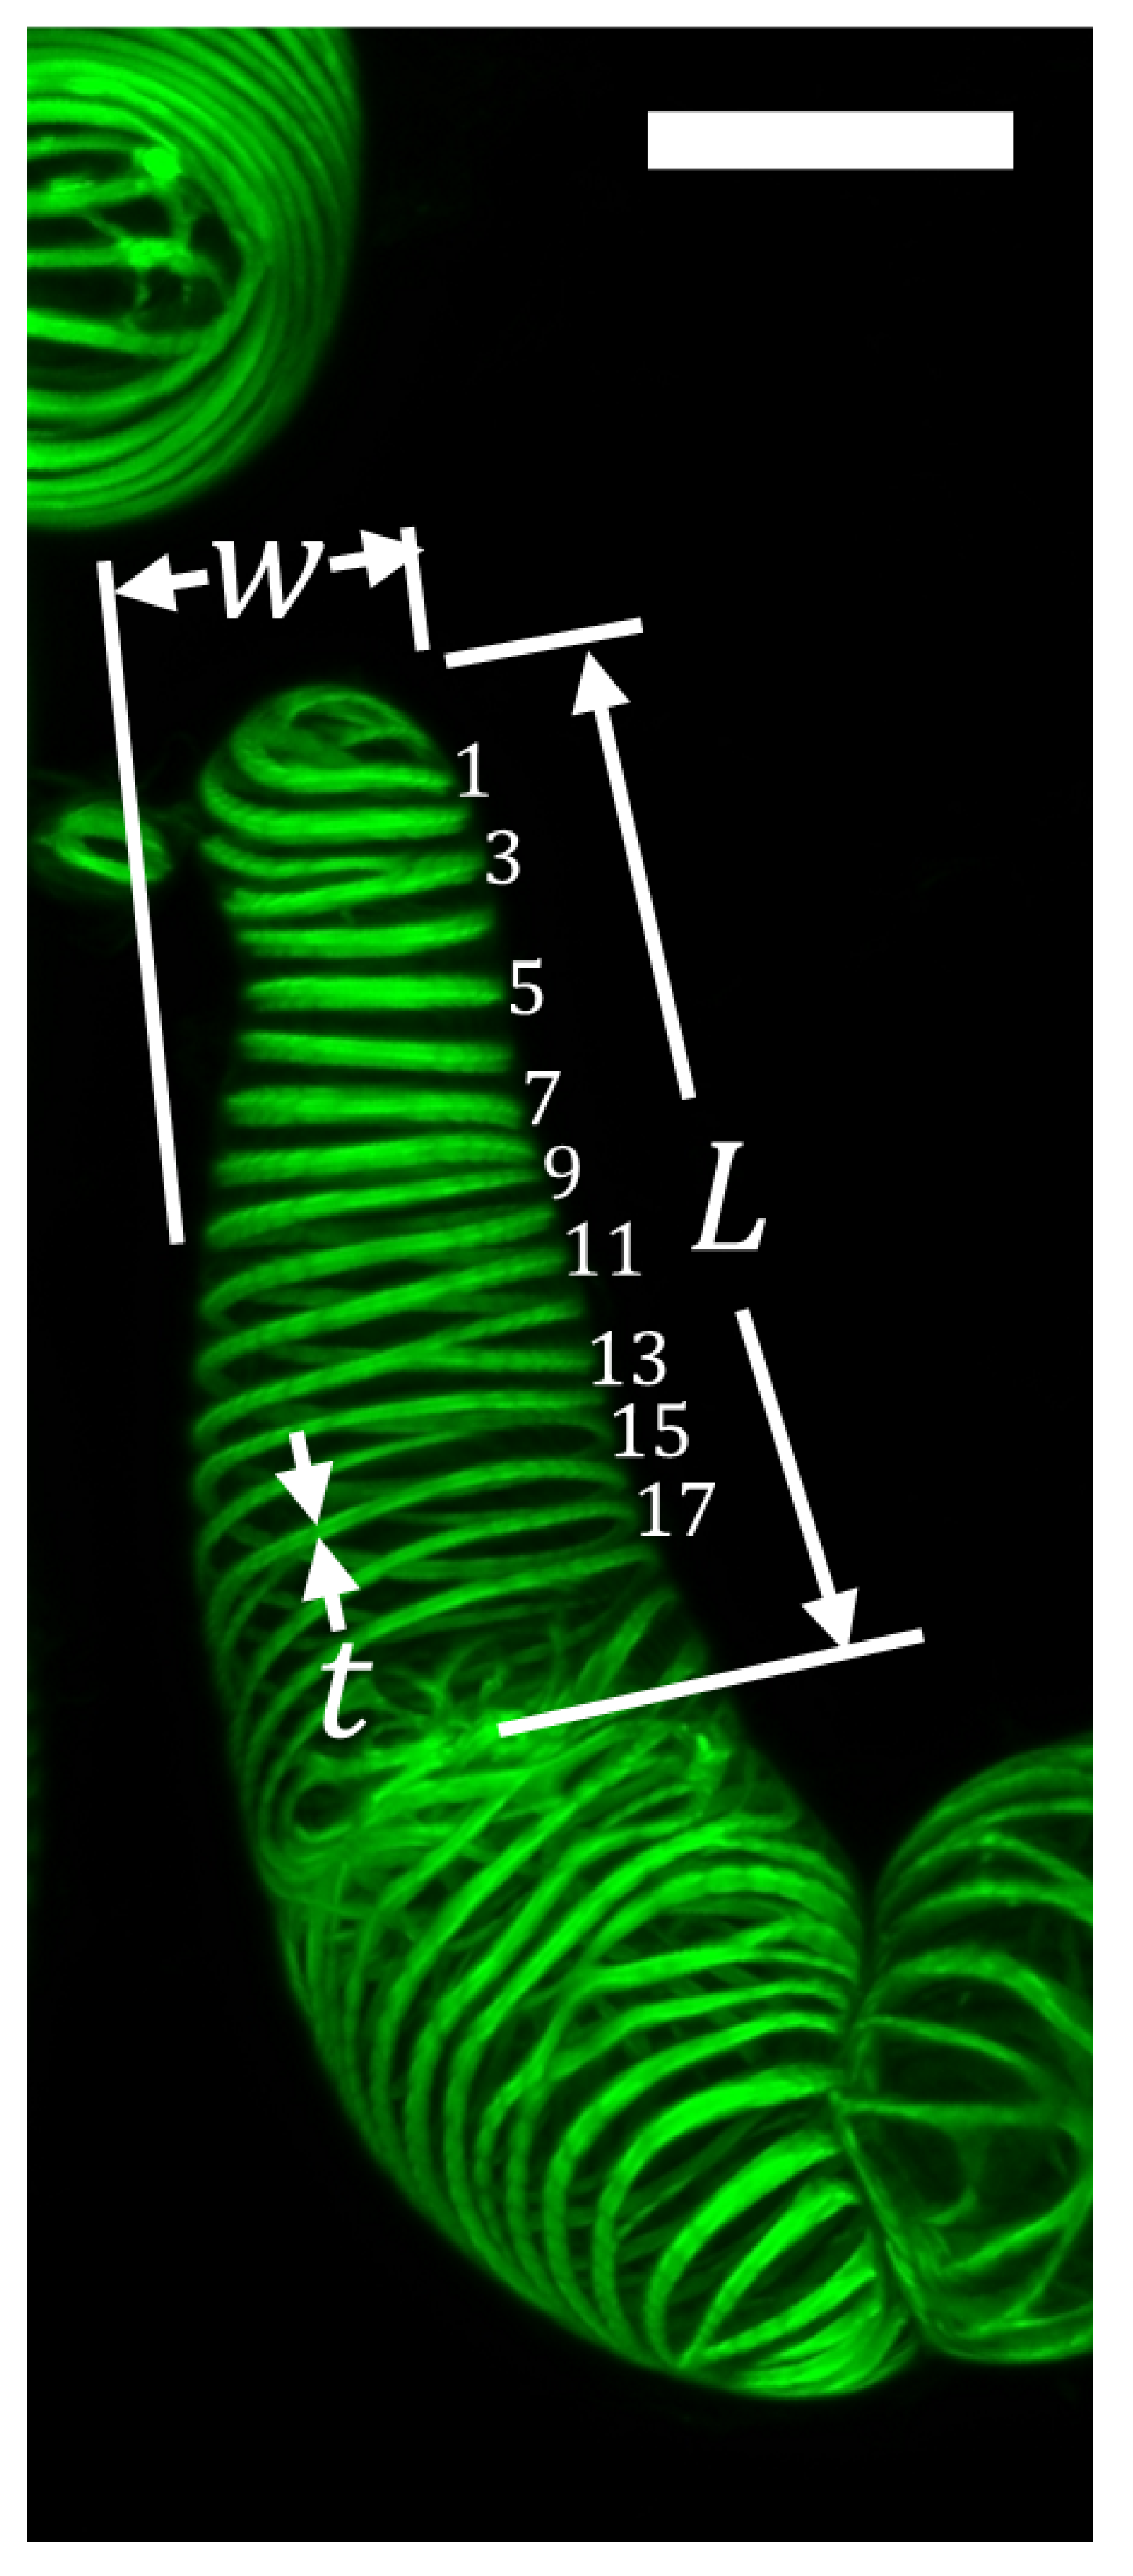
| Elongated Stage 2 | bundle density () | |
| Elongated Stage 3 | bundle density () | |
| Round Stage 2 | bundle density () | |
| Round Stage 3 | bundle density () | |
| Elongated Stage 2 | bundle thickness (m) | |
| Elongated Stage 3 | bundle thickness (m) | |
| Round Stage 2 | bundle thickness (m) | |
| Round Stage 3 | bundle thickness (m) |
| Solution | P (MPa) |
|---|---|
| water | 137.5 |
| T87 Growth Medium | 11.4 |
| sorbitol | 2.5 |


References
- Gibson, L.J. The hierarchical structure and mechanics of plant materials. J. R. Soc. Interface 2012, 9, 2749–2766. [Google Scholar] [CrossRef]
- Zhong, R.; Cui, D.; Ye, Z.H. Secondary cell wall biosynthesis. New Phytol. 2019, 221, 1703–1723. [Google Scholar] [CrossRef] [PubMed]
- Moon, R.J.; Martini, A.; Nairn, J.; Simonsen, J.; Youngblood, J. Cellulose nanomaterials review: Structure, properties and nanocomposites. Chem. Soc. Rev. 2011, 40, 3941–3994. [Google Scholar] [CrossRef] [PubMed]
- Cosgrove, D.J. Plant cell wall extensibility: Connecting plant cell growth with cell wall structure, mechanics, and the action of wall-modifying enzymes. J. Exp. Bot. 2015, 67, 463–476. [Google Scholar] [CrossRef] [PubMed]
- Cosgrove, D.J. Assembly and enlargement of the primary cell wall in plants. Annu. Rev. Cell Dev. Biol. 1997, 13, 171–201. [Google Scholar] [CrossRef] [PubMed]
- Chaudhuri, O.; Parekh, S.H.; Fletcher, D.A. Reversible stress softening of actin networks. Nature 2007, 445, 295–298. [Google Scholar] [CrossRef] [PubMed]
- Gittes, F.; Mickey, B.; Nettleton, J.; Howard, J. Flexural rigidity of microtubules and actin filaments measured from thermal fluctuations in shape. J. Cell Biol. 1993, 120, 923–934. [Google Scholar] [CrossRef] [PubMed]
- Durand-Smet, P.; Chastrette, N.; Guiroy, A.; Richert, A.; Berne-Dedieu, A.; Szecsi, J.; Boudaoud, A.; Frachisse, J.M.; Bendahmane, M.; Hamant, O.; et al. A Comparative Mechanical Analysis of Plant and Animal Cells Reveals Convergence across Kingdoms. Biophys. J. 2014, 107, 2237–2244. [Google Scholar] [CrossRef]
- Bidhendi, A.J.; Geitmann, A. Methods to quantify primary plant cell wall mechanics. J. Exp. Bot. 2019, 70, 3615–3648. [Google Scholar] [CrossRef]
- Geitmann, A. Experimental approaches used to quantify physical parameters at cellular and subcellular levels. Am. J. Bot. 2006, 93, 1380–1390. [Google Scholar] [CrossRef]
- Milani, P.; Braybrook, S.A.; Boudaoud, A. Shrinking the hammer: Micromechanical approaches to morphogenesis. J. Exp. Bot. 2013, 64, 4651–4662. [Google Scholar] [CrossRef] [PubMed]
- Routier-Kierzkowska, A.L.; Weber, A.; Kochova, P.; Felekis, D.; Nelson, B.J.; Kuhlemeier, C.; Smith, R.S. Cellular Force Microscopy for in Vivo Measurements of Plant Tissue Mechanics. Plant Physiol. 2012, 158, 1514–1522. [Google Scholar] [CrossRef] [PubMed]
- Braybrook, S.A.; Peaucelle, A. Mechano-Chemical Aspects of Organ Formation in Arabidopsis thaliana: The Relationship between Auxin and Pectin. PLoS ONE 2013, 8, e57813. [Google Scholar] [CrossRef] [PubMed]
- Radotic, K.; Roduit, C.; Simonovic, J.; Hornitschek, P.; Fankhauser, C.; Mutavdzic, D.; Steinbach, G.; Dietler, G.; Kasas, S. Atomic force microscopy stiffness tomography on living Arabidopsis thaliana cells reveals the mechanical properties of surface and deep cell-wall layers during growth. Biophys. J. 2012, 103, 386–394. [Google Scholar] [CrossRef] [PubMed]
- Sampathkumar, A.; Krupinski, P.; Wightman, R.; Milani, P.; Berquand, A.; Boudaoud, A.; Hamant, O.; Jönsson, H.; Meyerowitz, E.M. Subcellular and supracellular mechanical stress prescribes cytoskeleton behavior in Arabidopsis cotyledon pavement cells. eLife 2014, 3, e01967. [Google Scholar] [CrossRef] [PubMed]
- Yamaguchi, M.; Goué, N.; Igarashi, H.; Ohtani, M.; Nakano, Y.; Mortimer, J.C.; Nishikubo, N.; Kubo, M.; Katayama, Y.; Kakegawa, K.; et al. VASCULAR-RELATED NAC-DOMAIN6 and VASCULAR-RELATED NAC-DOMAIN7 Effectively Induce Transdifferentiation into Xylem Vessel Elements under Control of an Induction System. Plant Physiol. 2010, 153, 906–914. [Google Scholar] [CrossRef]
- Kubo, M.; Udagawa, M.; Nishikubo, N.; Horiguchi, G.; Yamaguchi, M.; Ito, J.; Mimura, T.; Fukuda, H.; Demura, T. Transcription switches for protoxylem and metaxylem vessel formation. Genes Dev. 2005, 19, 1855–1860. [Google Scholar] [CrossRef]
- Escamez, S.; Tuominen, H. Programmes of cell death and autolysis in tracheary elements: When a suicidal cell arranges its own corpse removal. J. Exp. Bot. 2014, 65, 1313–1321. [Google Scholar] [CrossRef]
- Fukuda, H. Tracheary Element Differentiation. Plant Cell 1997, 9, 1147–1156. [Google Scholar] [CrossRef]
- Iakimova, E.T.; Woltering, E.J. Xylogenesis in zinnia (Zinnia elegans) cell cultures: Unravelling the regulatory steps in a complex developmental programmed cell death event. Planta 2017, 245, 681–705. [Google Scholar] [CrossRef]
- Kákošová, A.; Digonnet, C.; Goffner, D.; Lišková, D. Galactoglucomannan oligosaccharides are assumed to affect tracheary element formation via interaction with auxin in Zinnia xylogenic cell culture. Plant Cell Rep. 2013, 32, 479–487. [Google Scholar] [CrossRef] [PubMed]
- Vogler, H.; Felekis, D.; Nelson, B.J.; Grossniklaus, U. Measuring the Mechanical Properties of Plant Cell Walls. Plants 2015, 4, 167–182. [Google Scholar] [CrossRef] [PubMed]
- Yin, Z.; Fan, R. Ultrastructural analysis of the differentiation process of secondary xylem vessel element in Popul Deltoides. Front. For. China 2009, 4. [Google Scholar] [CrossRef]
- Meents, M.J.; Watanabe, Y.; Samuels, A.L. The cell biology of secondary cell wall biosynthesis. Ann. Bot. 2018, 121, 1107–1125. [Google Scholar] [CrossRef] [PubMed]
- Bollhöner, B.; Prestele, J.; Tuominen, H. Xylem cell death: Emerging understanding of regulation and function. J. Exp. Bot. 2012, 63, 1081–1094. [Google Scholar] [CrossRef]
- Oda, Y.; Hasezawa, S. Cytoskeletal organization during xylem cell differentiation. J. Plant Res. 2006, 119, 167–177. [Google Scholar] [CrossRef]
- Sasaki, T.; Fukuda, H.; Oda, Y. Cortical Microtubule Disordering1 is Required for Secondary Cell Wall Patterning in Xylem Vessels. Plant Cell 2017, 29, 3123–3139. [Google Scholar] [CrossRef]
- Schneider, R.; Tang, L.; Lampugnani, E.R.; Barkwill, S.; Lathe, R.; Zhang, Y.; McFarlane, H.E.; Pesquet, E.; Niittyla, T.; Mansfield, S.D.; et al. Two Complementary Mechanisms Underpin Cell Wall Patterning during Xylem Vessel Development. Plant Cell 2017, 29, 2433–2449. [Google Scholar] [CrossRef]
- Boussinesq, J. Application Des Potentials al’Etude de l’Equilibre et des Mouvements des Solides Elastiques; Ganther-Villars: Paris, France, 1885. [Google Scholar]
- Beauzamy, L.; Nakayama, N.; Boudaoud, A. Flowers under pressure: Ins and outs of turgor regulation in development. Ann. Bot. 2014, 114, 1517–1533. [Google Scholar] [CrossRef]
- Braybrook, S.A. Chapter 13—Measuring the elasticity of plant cells with atomic force microscopy. In Biophysical Methods in Cell Biology; Methods in Cell Biology; Paluch, E.K., Ed.; Academic Press: London, UK, 2015; Volume 125, pp. 237–254. [Google Scholar] [CrossRef]
- Watanabe, Y.; Meents, M.J.; McDonnell, L.M.; Barkwill, S.; Sampathkumar, A.; Cartwright, H.N.; Demura, T.; Ehrhardt, D.W.; Samuels, A.L.; Mansfield, S.D. Visualization of cellulose synthases in Arabidopsis secondary cell walls. Science 2015, 350, 198–203. [Google Scholar] [CrossRef]
- Weber, A.; Braybrook, S.; Huflejt, M.; Mosca, G.; Routier-Kierzkowska, A.L.; Smith, R.S. Measuring the mechanical properties of plant cells by combining micro-indentation with osmotic treatments. J. Exp. Bot. 2015, 66, 3229–3241. [Google Scholar] [CrossRef] [PubMed]
- Milani, P.; Gholamirad, M.; Traas, J.; Arnéodo, A.; Boudaoud, A.; Argoul, F.; Hamant, O. In vivo analysis of local wall stiffness at the shoot apical meristem in Arabidopsis using atomic force microscopy. Plant J. 2011, 67, 1116–1123. [Google Scholar] [CrossRef] [PubMed]
- Hamant, O.; Haswell, E.S. Life behind the wall: Sensing mechanical cues in plants. BMC Biol. 2017, 15, 59. [Google Scholar] [CrossRef] [PubMed]
- Durand-Smet, P.; Gauquelin, E.; Chastrette, N.; Boudaoud, A.; Asnacios, A. Estimation of turgor pressure through comparison between single plant cell and pressurized shell mechanics. Phys. Biol. 2017, 14, 055002. [Google Scholar] [CrossRef]
- Beauzamy, L.; Derr, J.; Boudaoud, A. Quantifying hydrostatic pressure in plant cells by using indentation with an atomic force microscope. Biophys. J. 2015, 108, 2448–2456. [Google Scholar] [CrossRef]
- VanderPlas, J.; Granger, B.; Heer, J.; Moritz, D.; Wongsuphasawat, K.; Satyanarayan, A.; Lees, E.; Timofeev, I.; Welsh, B.; Sievert, S. Altair: Interactive Statistical Visualizations for Python. J. Open Source Softw. 2018. [Google Scholar] [CrossRef]


| Dimension | Mean ± SE |
|---|---|
| (m) | |
| (m) | |
| (m) | |
| (m) | |
| (m) | |
| (m) | |
| () | |
| () | |
| () | |
| () | |
| () | |
| (m) | |
| (m) |
Publisher’s Note: MDPI stays neutral with regard to jurisdictional claims in published maps and institutional affiliations. |
© 2020 by the authors. Licensee MDPI, Basel, Switzerland. This article is an open access article distributed under the terms and conditions of the Creative Commons Attribution (CC BY) license (http://creativecommons.org/licenses/by/4.0/).
Share and Cite
Roumeli, E.; Ginsberg, L.; McDonald, R.; Spigolon, G.; Hendrickx, R.; Ohtani, M.; Demura, T.; Ravichandran, G.; Daraio, C. Structure and Biomechanics during Xylem Vessel Transdifferentiation in Arabidopsis thaliana. Plants 2020, 9, 1715. https://doi.org/10.3390/plants9121715
Roumeli E, Ginsberg L, McDonald R, Spigolon G, Hendrickx R, Ohtani M, Demura T, Ravichandran G, Daraio C. Structure and Biomechanics during Xylem Vessel Transdifferentiation in Arabidopsis thaliana. Plants. 2020; 9(12):1715. https://doi.org/10.3390/plants9121715
Chicago/Turabian StyleRoumeli, Eleftheria, Leah Ginsberg, Robin McDonald, Giada Spigolon, Rodinde Hendrickx, Misato Ohtani, Taku Demura, Guruswami Ravichandran, and Chiara Daraio. 2020. "Structure and Biomechanics during Xylem Vessel Transdifferentiation in Arabidopsis thaliana" Plants 9, no. 12: 1715. https://doi.org/10.3390/plants9121715
APA StyleRoumeli, E., Ginsberg, L., McDonald, R., Spigolon, G., Hendrickx, R., Ohtani, M., Demura, T., Ravichandran, G., & Daraio, C. (2020). Structure and Biomechanics during Xylem Vessel Transdifferentiation in Arabidopsis thaliana. Plants, 9(12), 1715. https://doi.org/10.3390/plants9121715