Extreme Drought Affects Visitation and Seed Set in a Plant Species in the Central Chilean Andes Heavily Dependent on Hummingbird Pollination

 , ,
, ,  , , , , and
Abstract
1. Introduction
2. Results
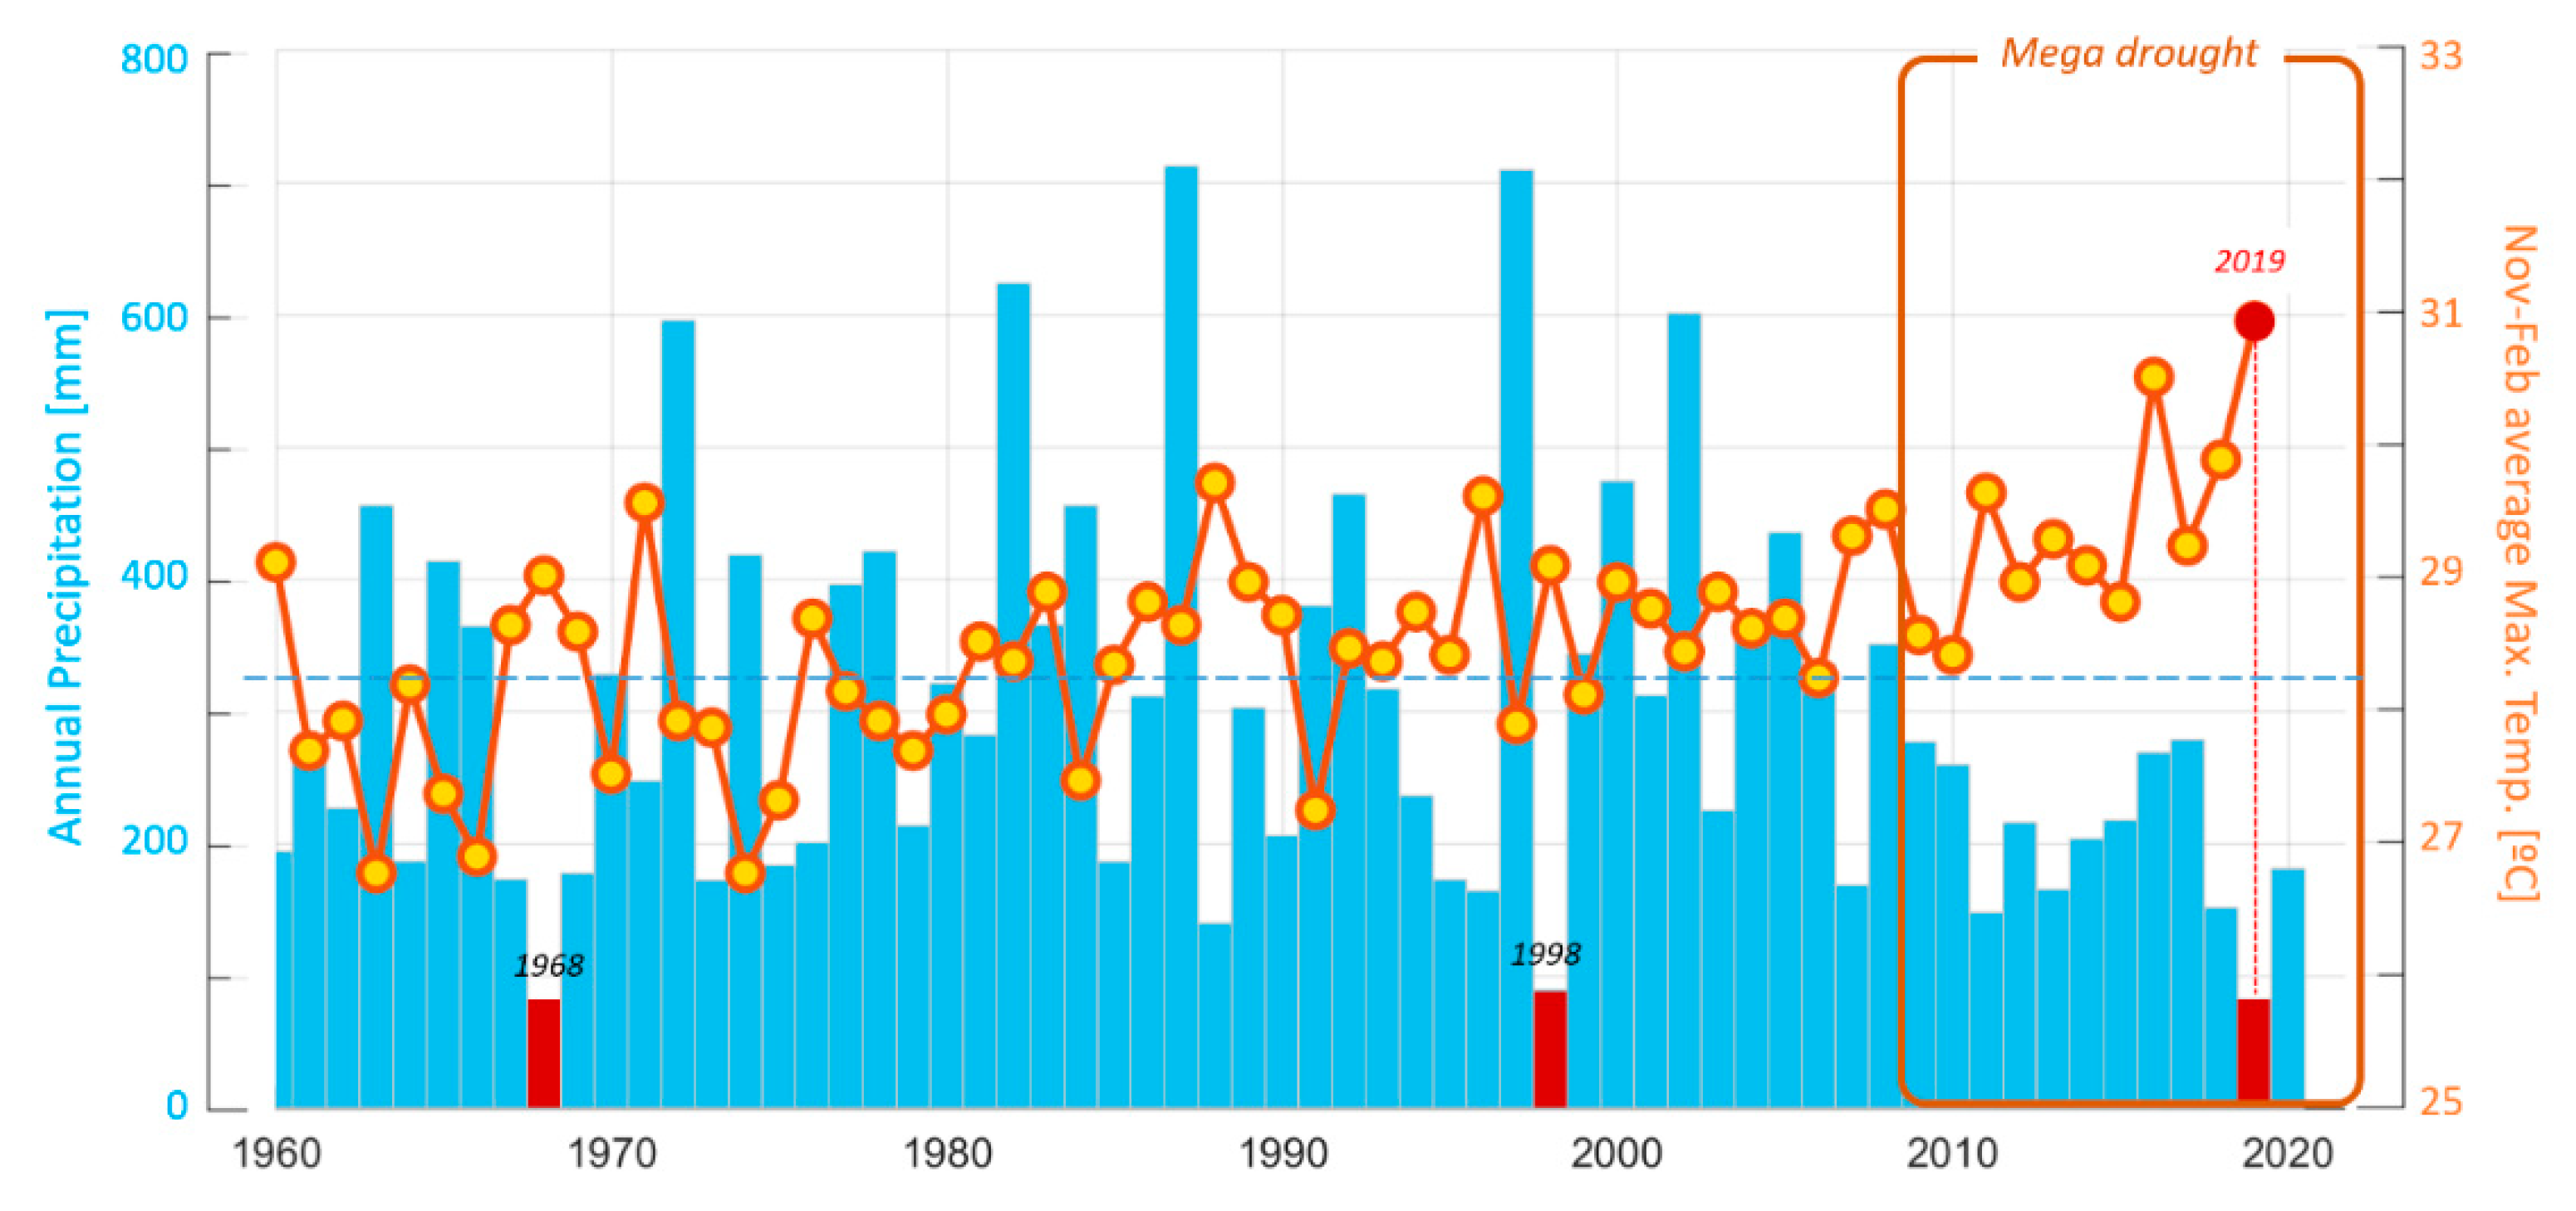
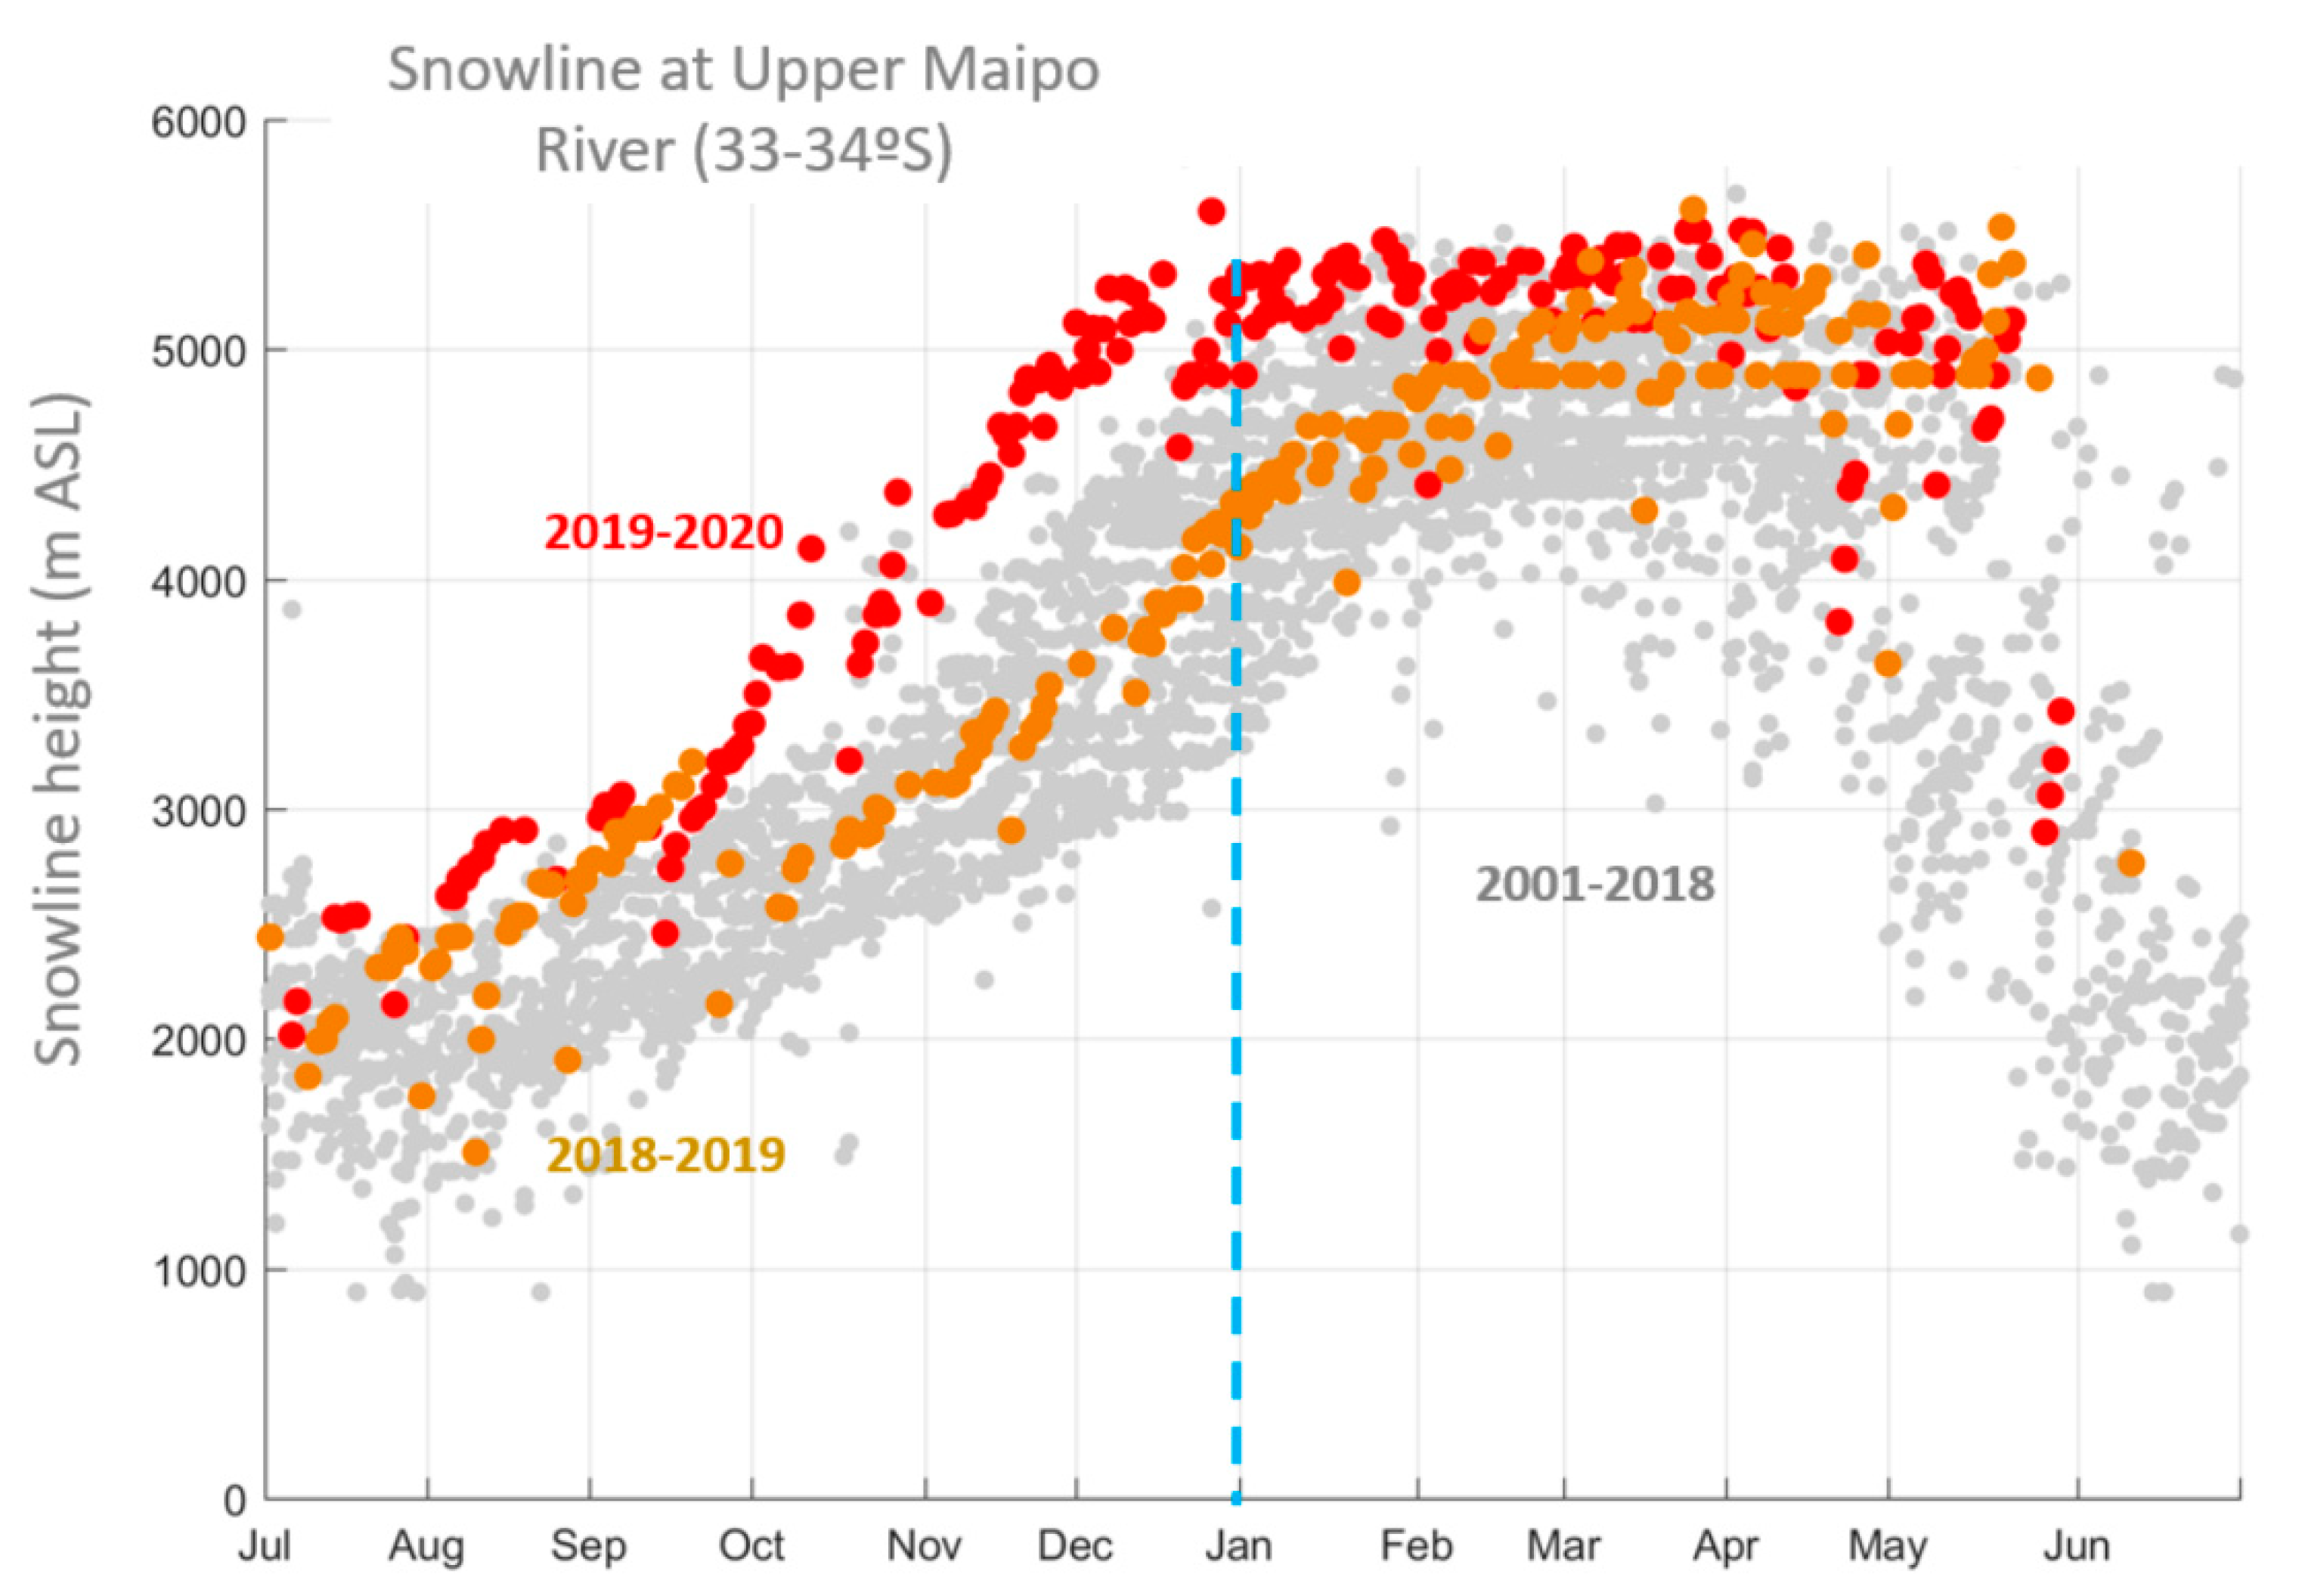
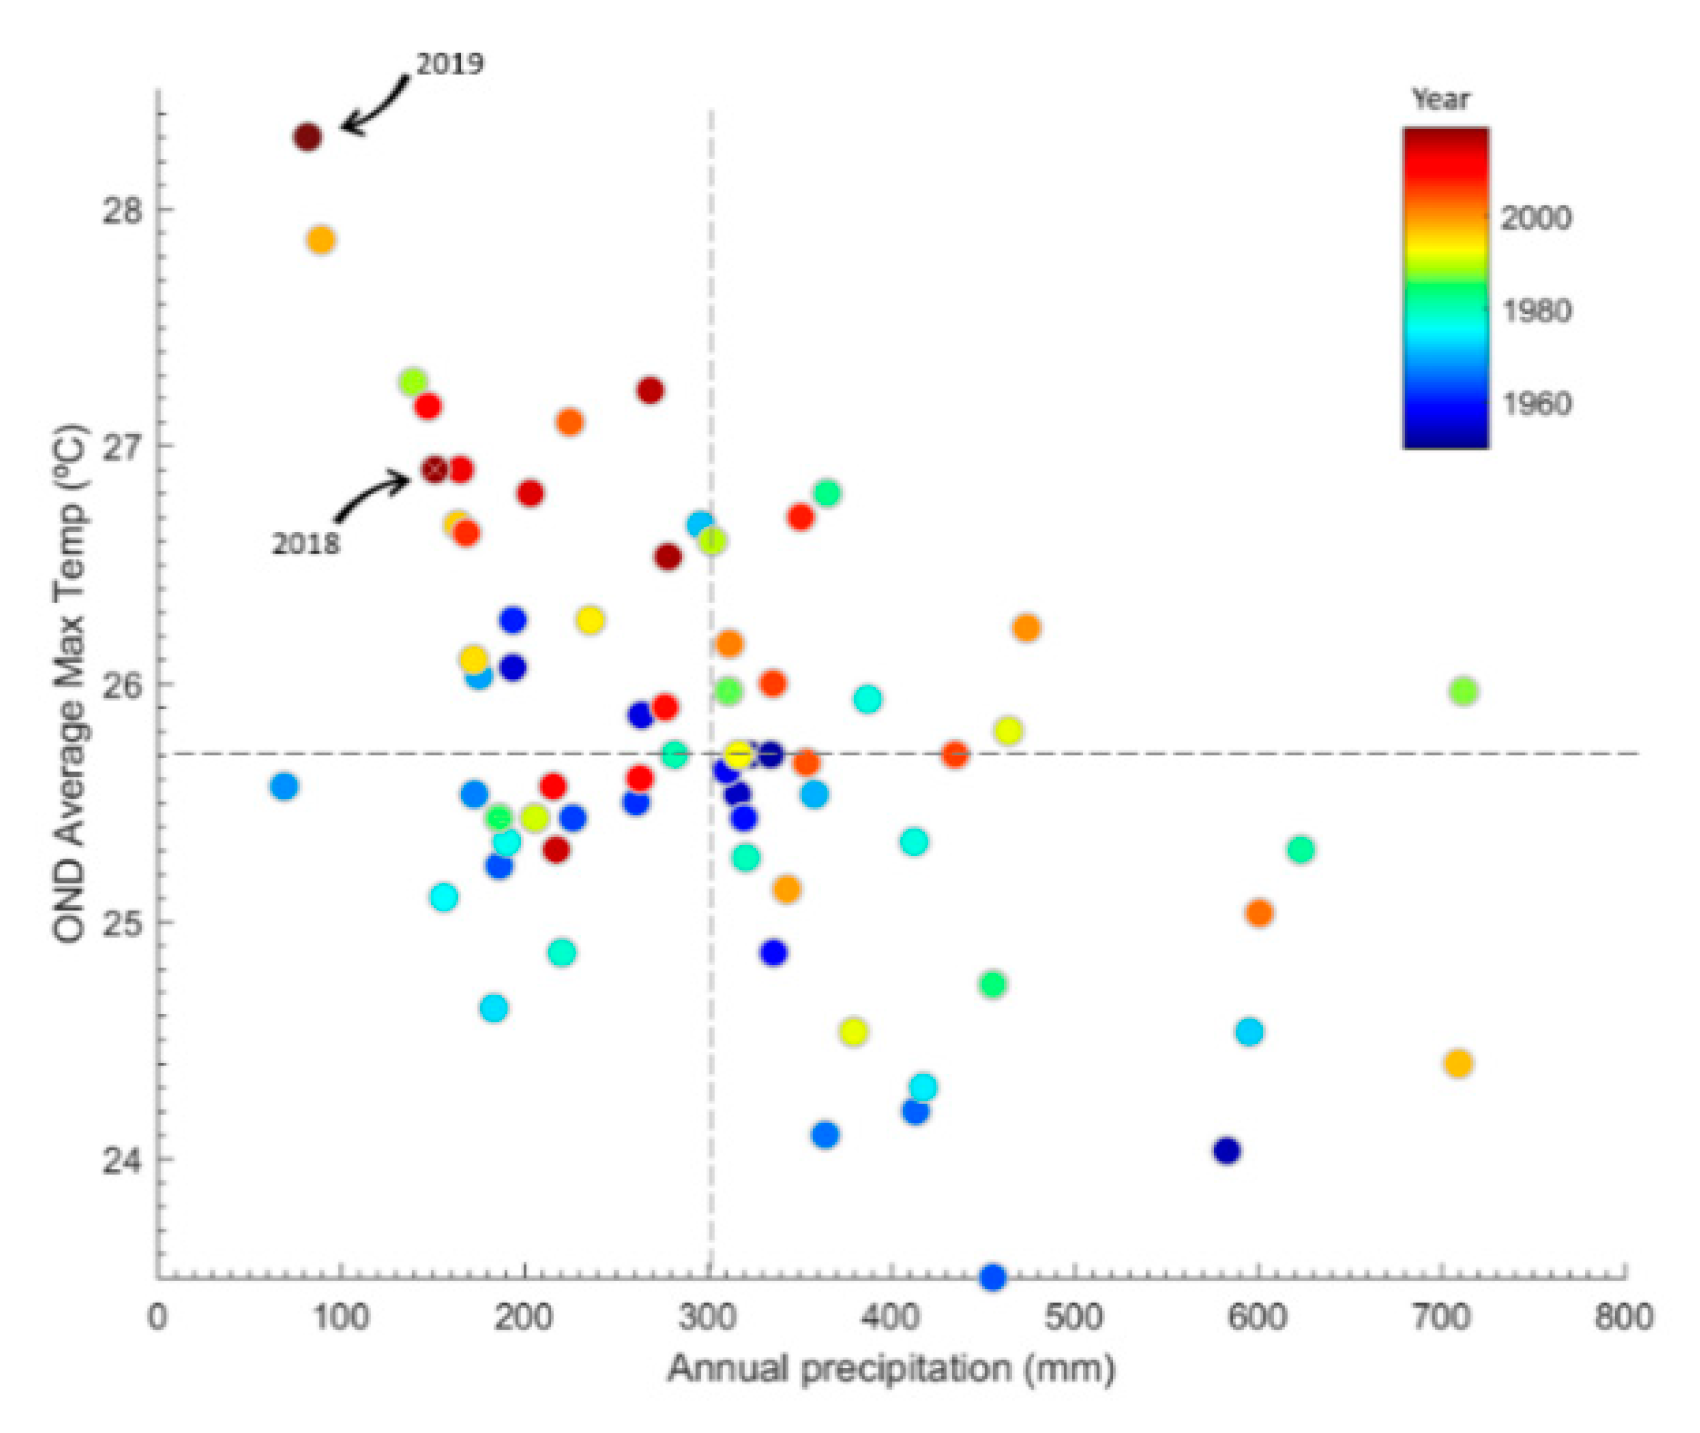
2.1. Characterization of the Central Chilean Mega-Drought and the Extreme Drought of 2019
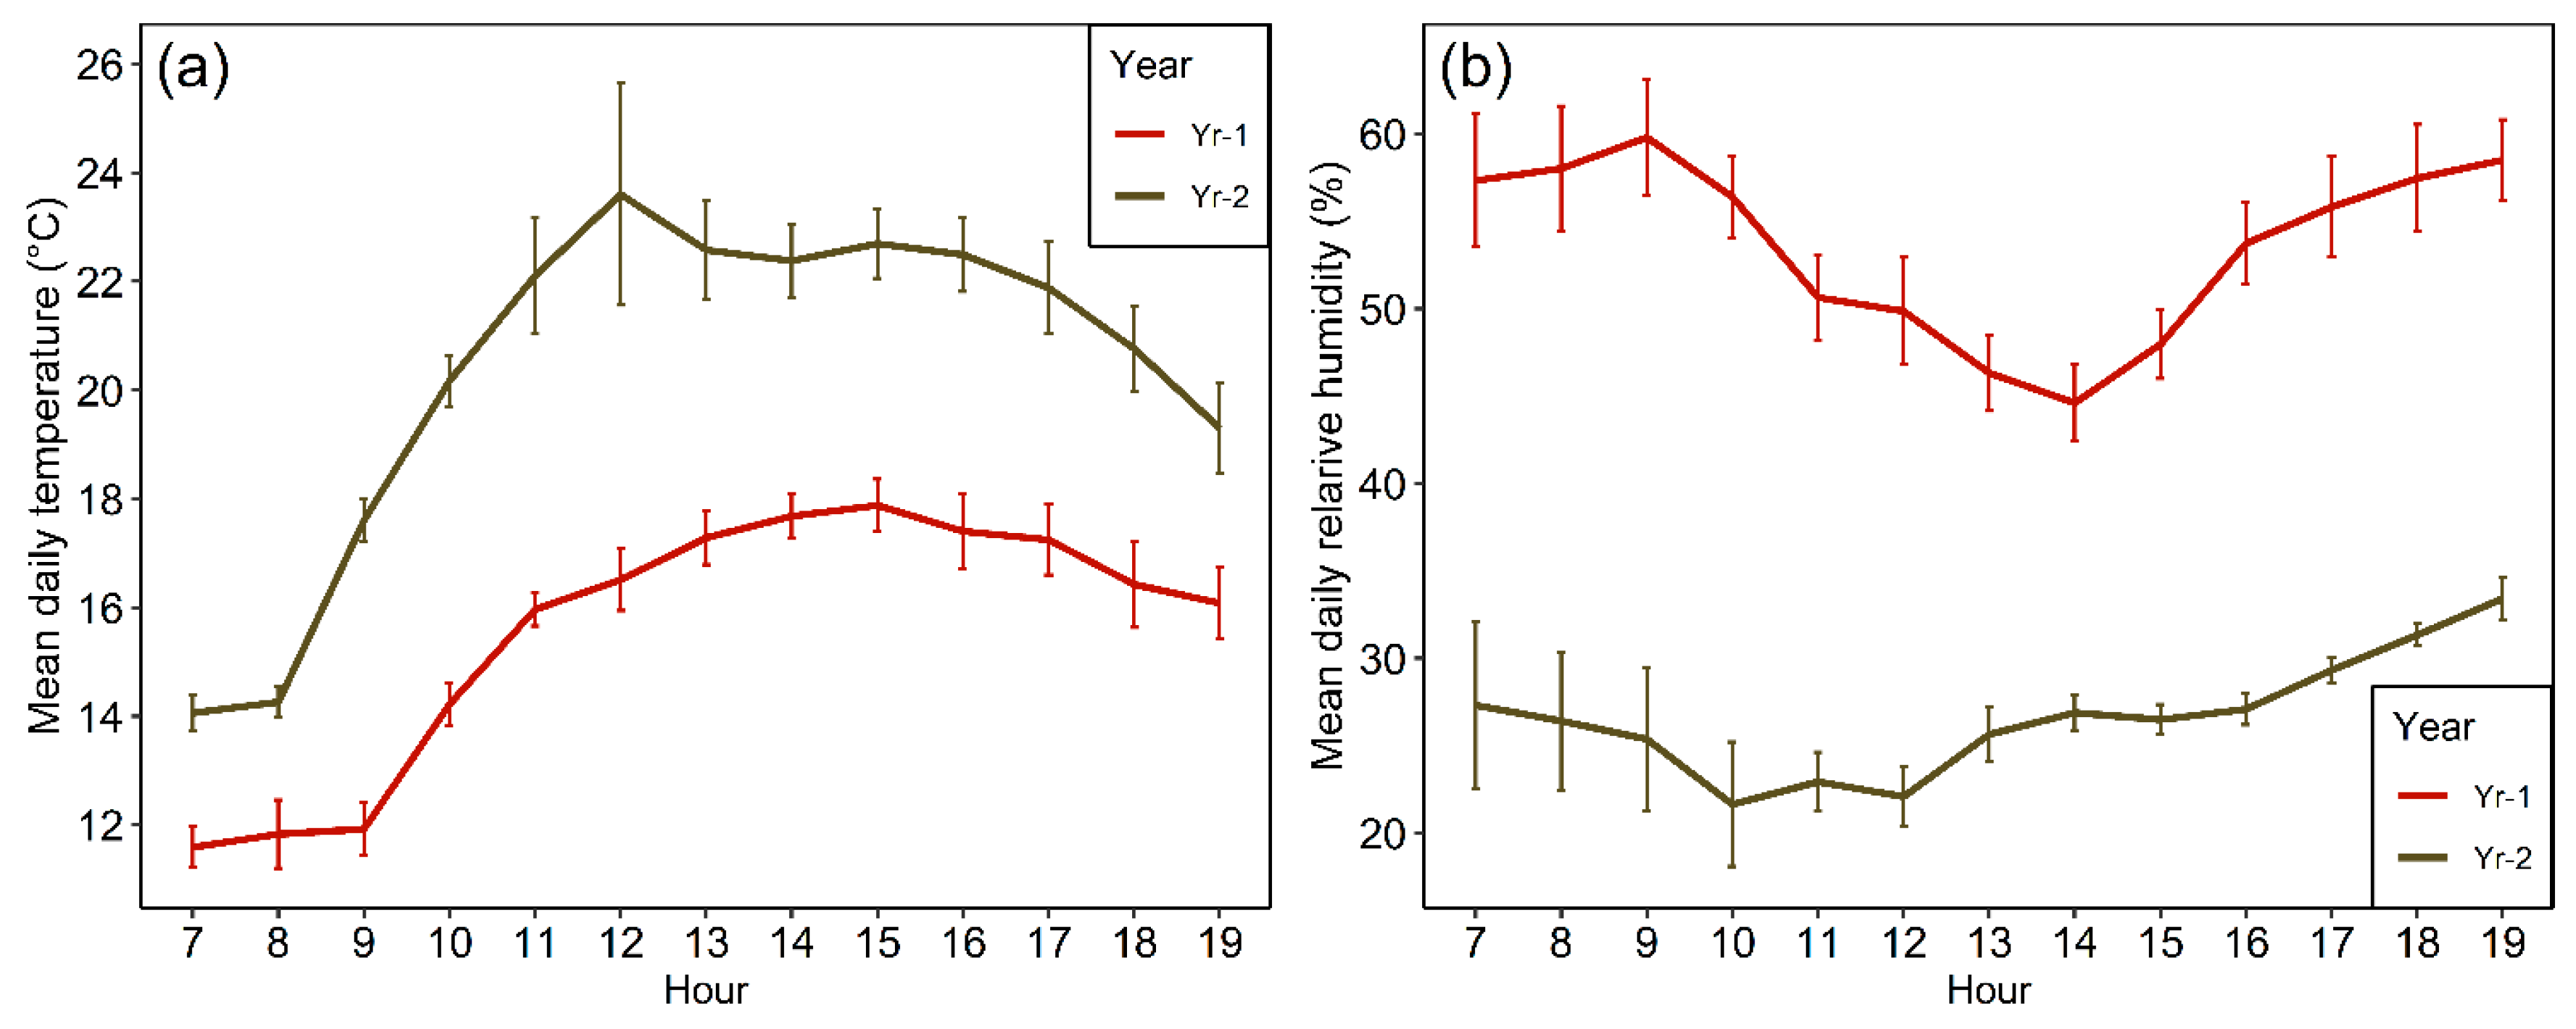
2.2. Onsite Weather Conditions over the Study Period
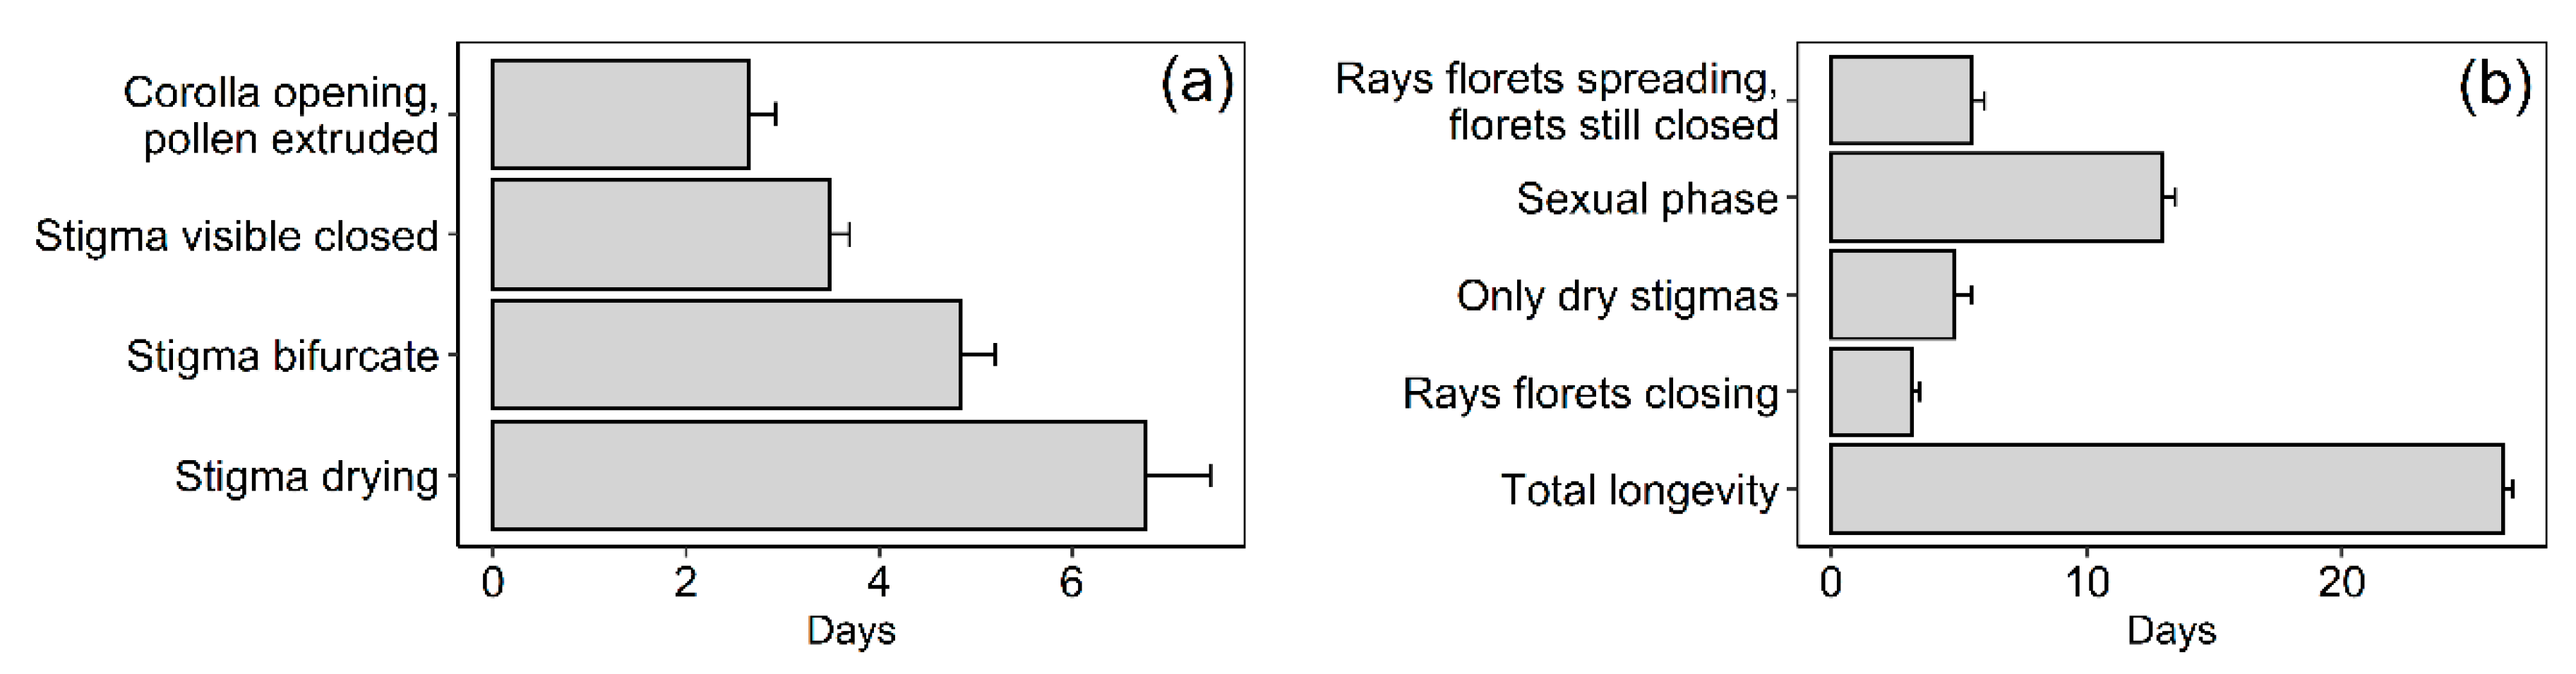
2.3. Selfing Capacity, Flower-Head and Individual Floret Longevity
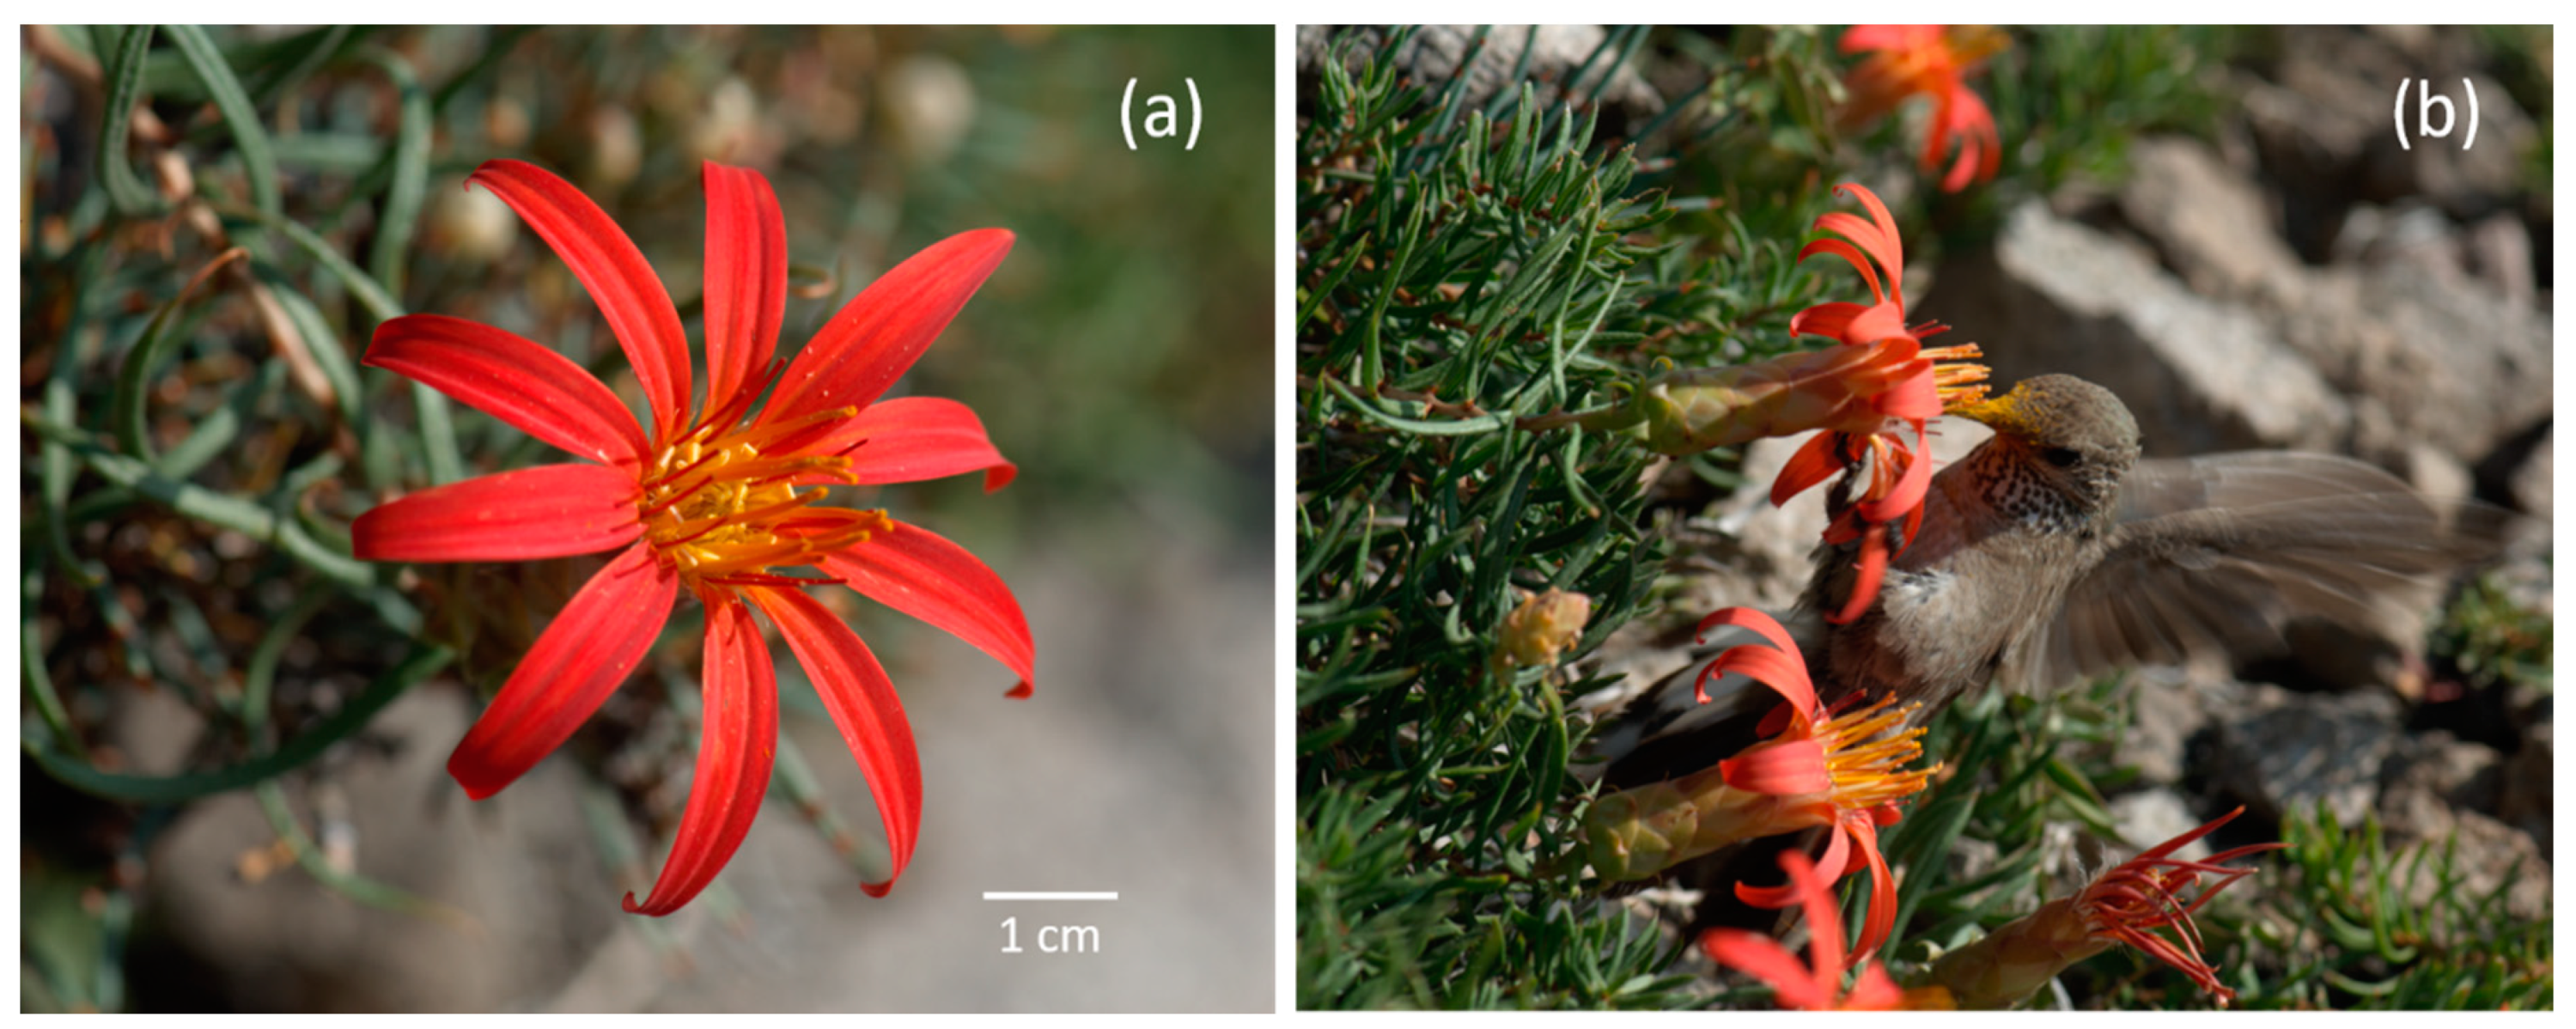
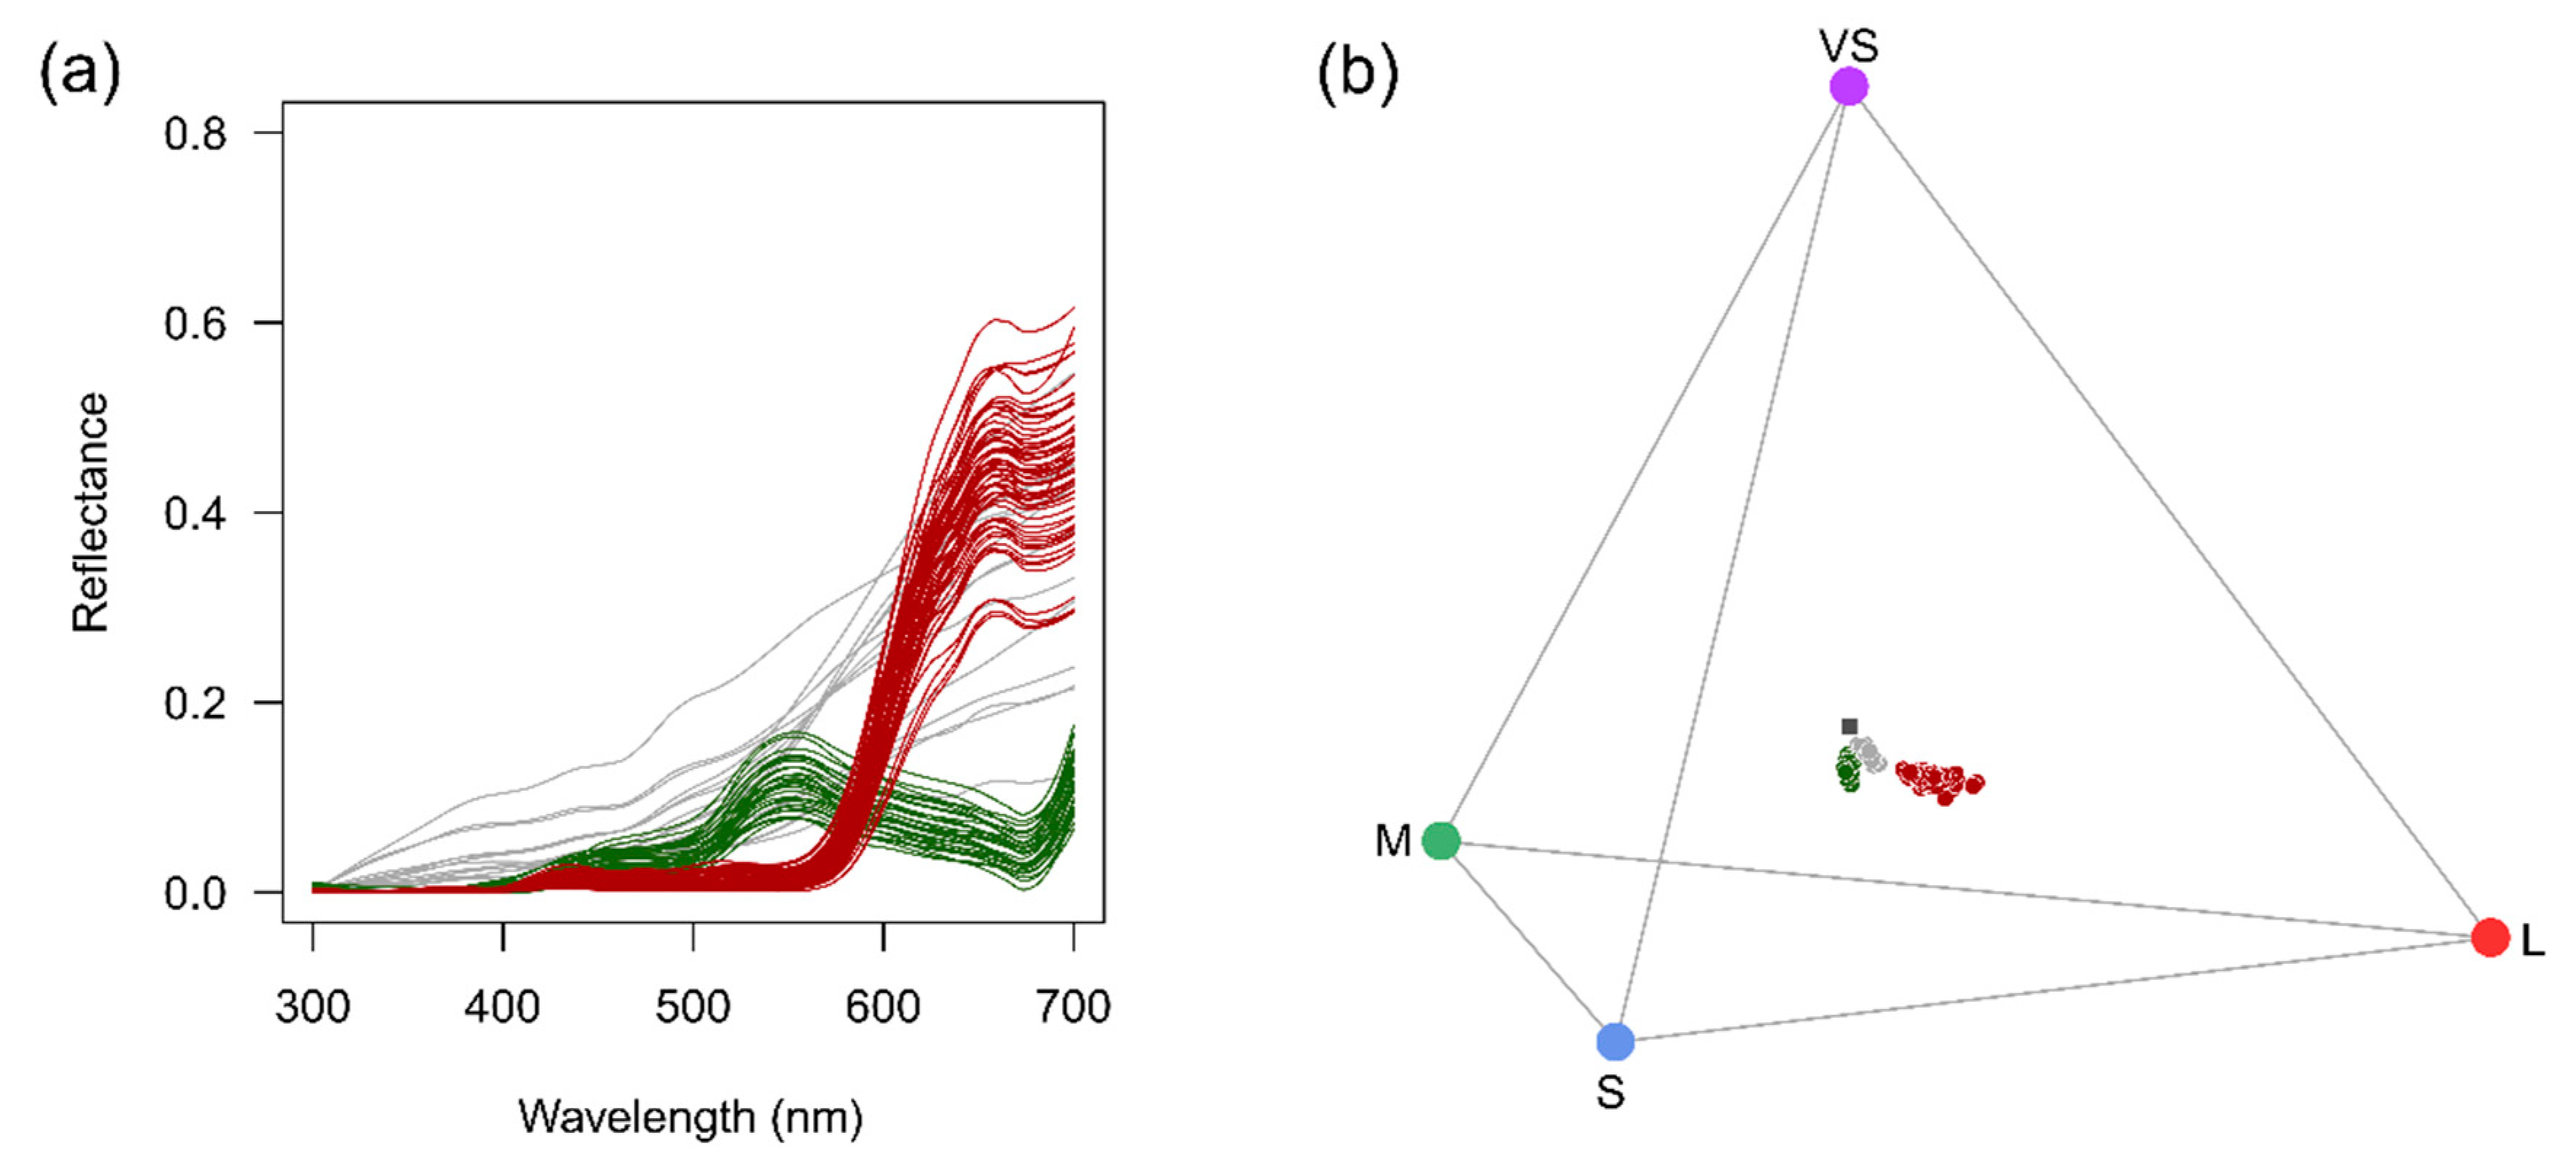
2.4. Flower Traits and Pollinators
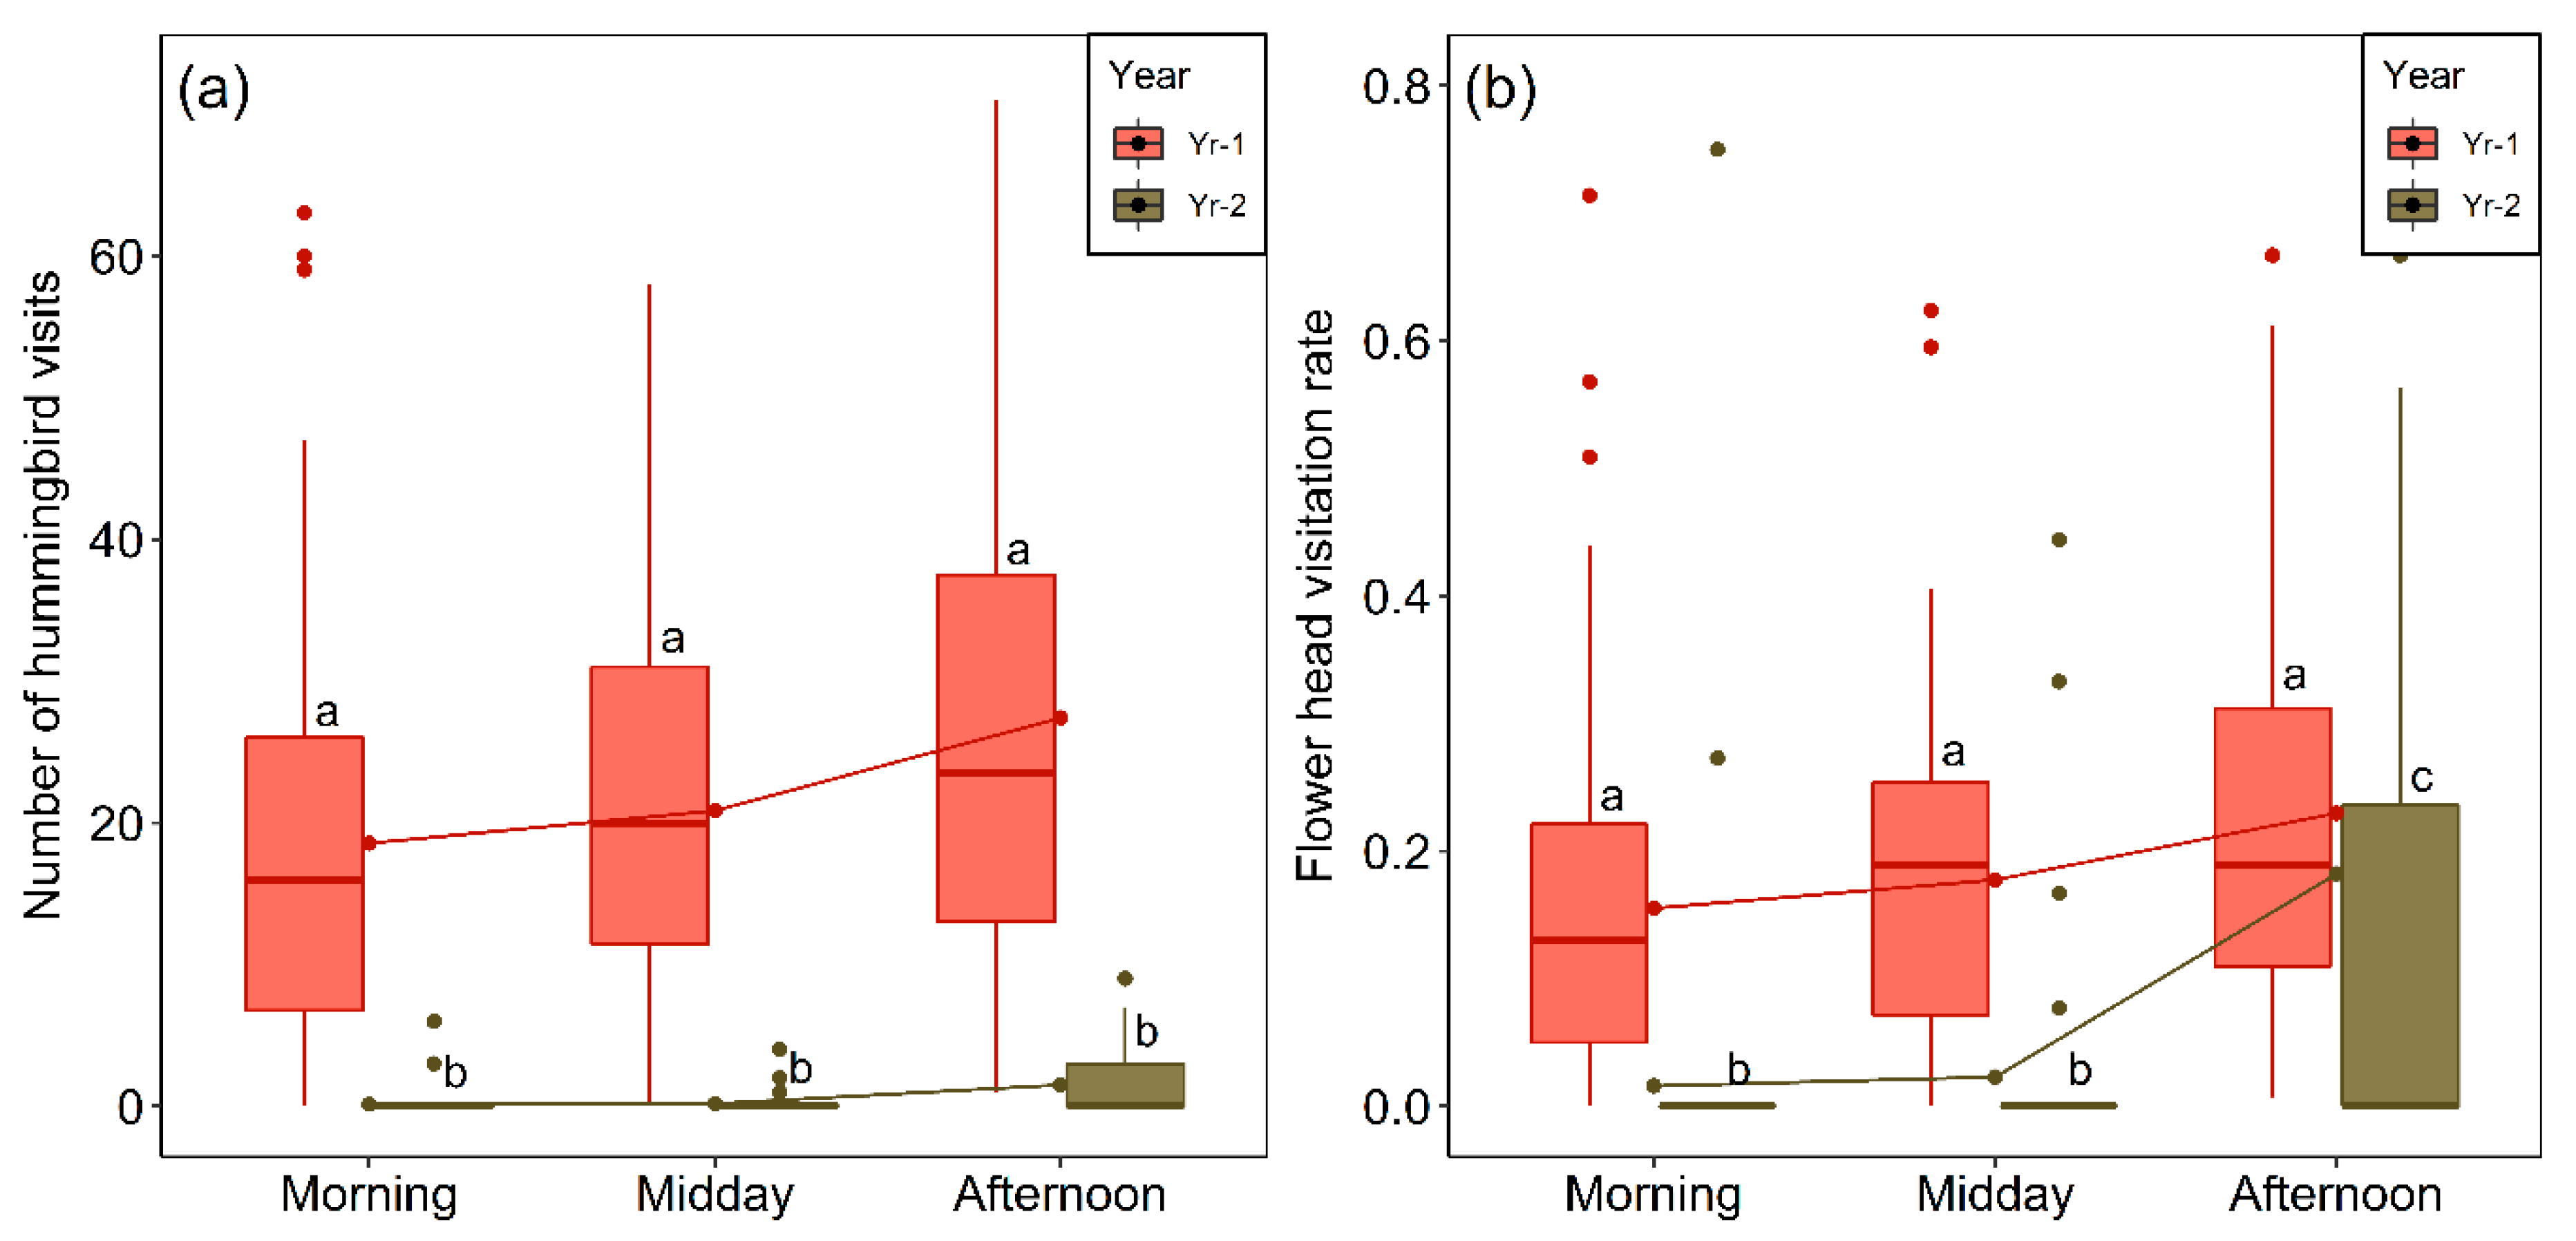
2.5. Interannual Variation in Flower-Head Abundance and Visitation
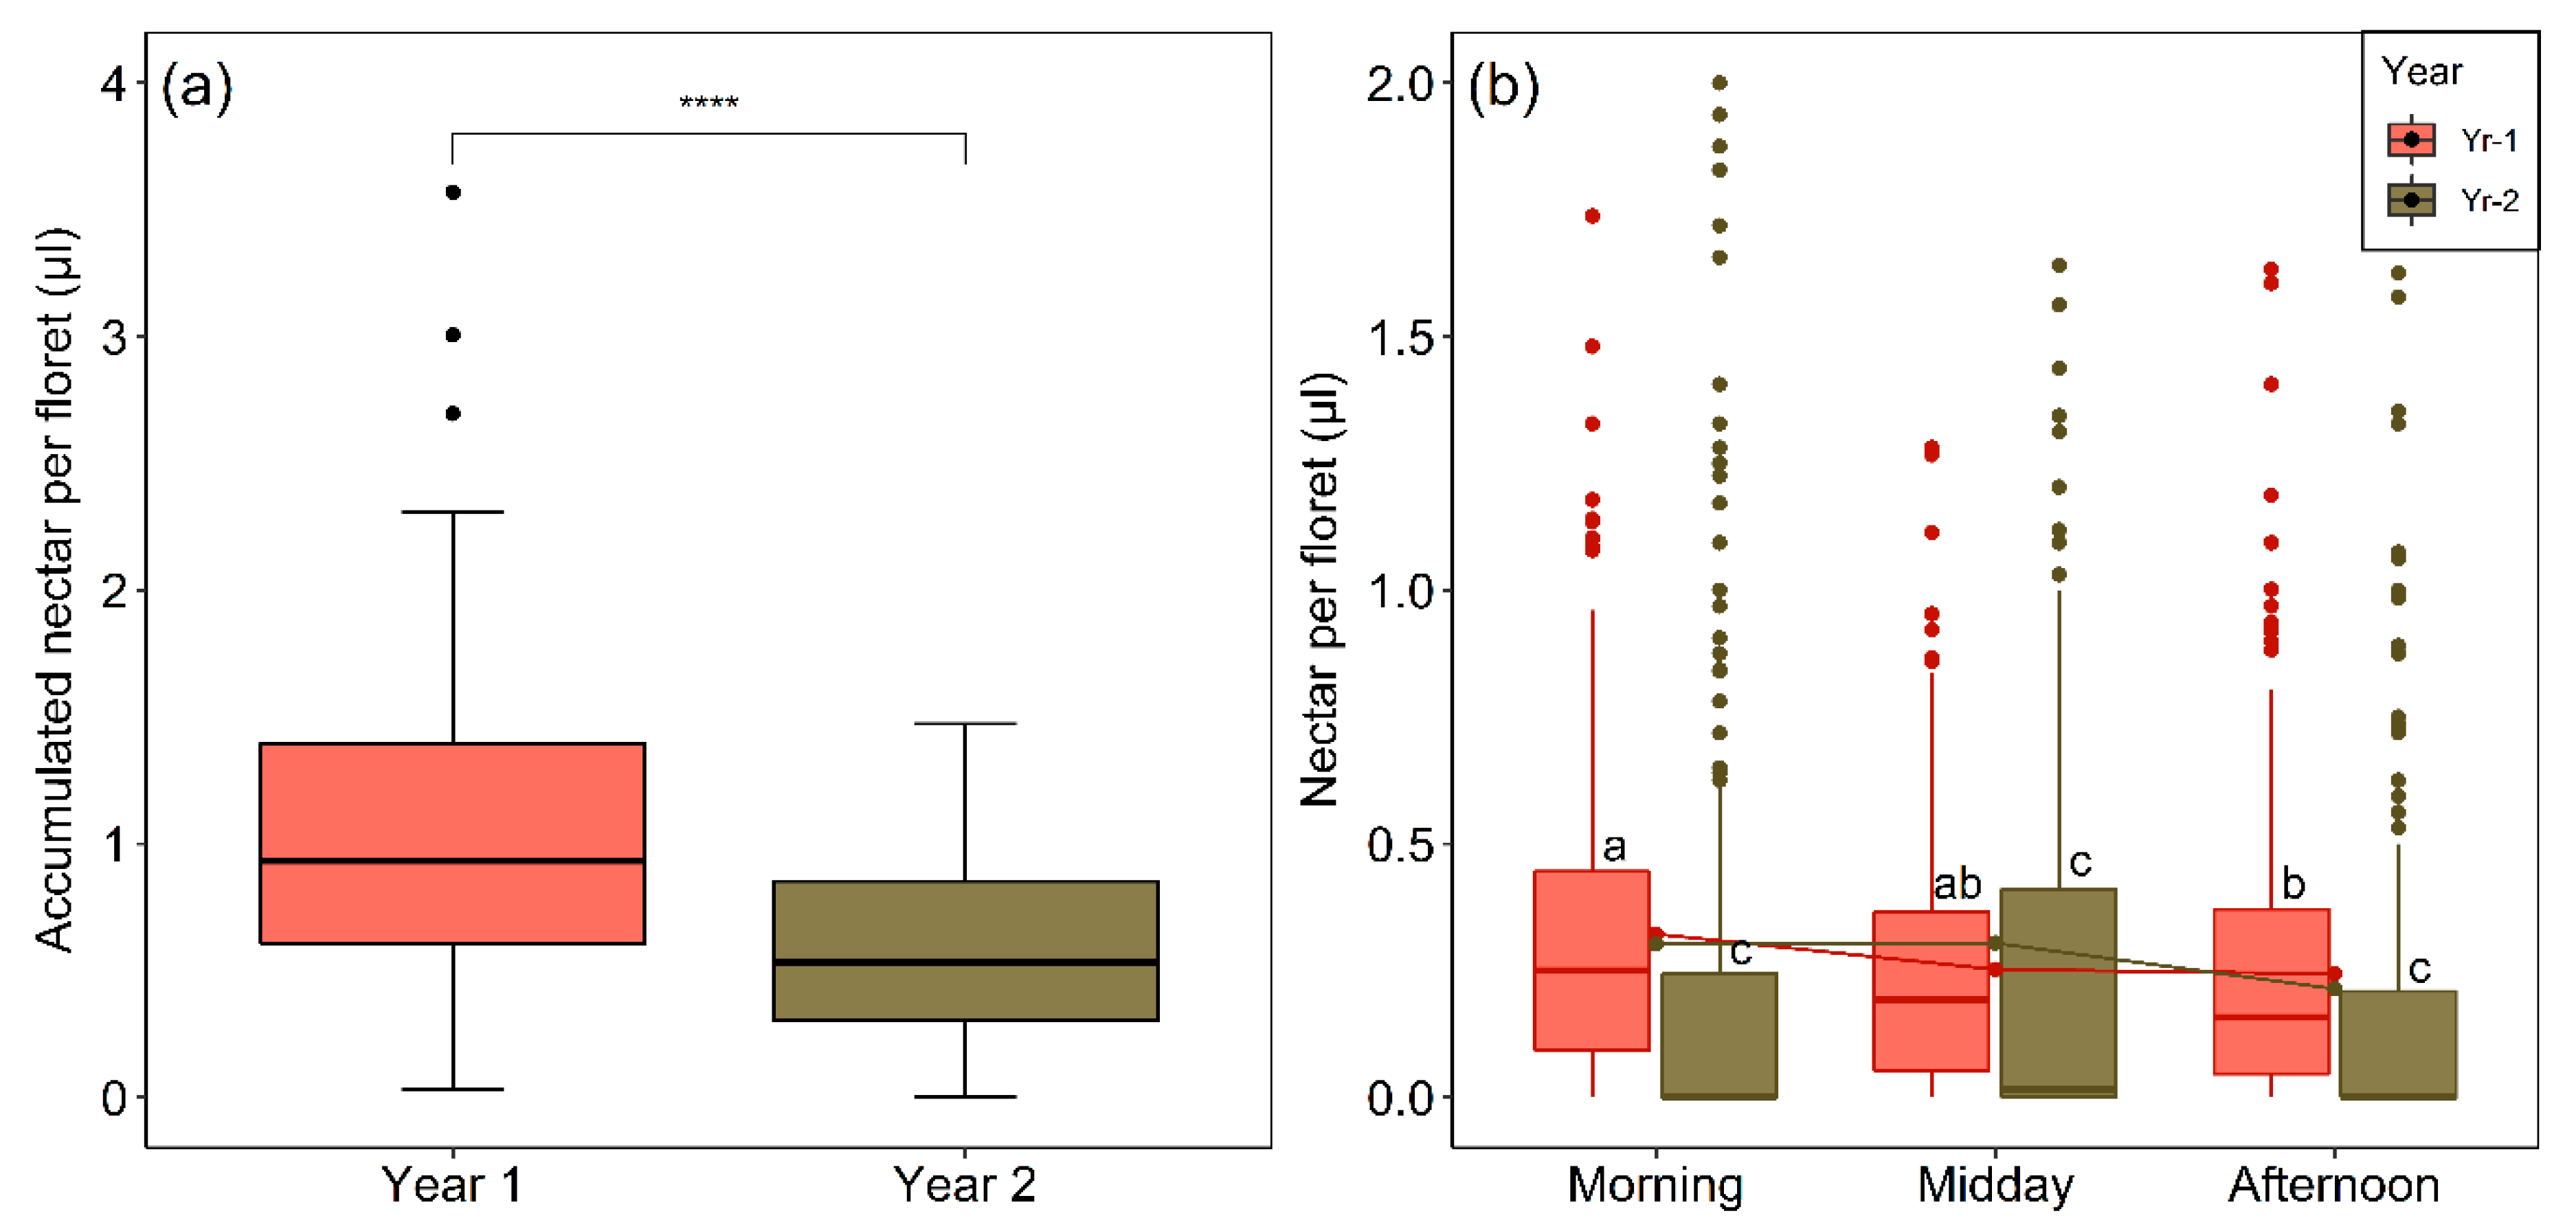
2.6. Interannual and Diurnal Variation in Nectar Production and Availability
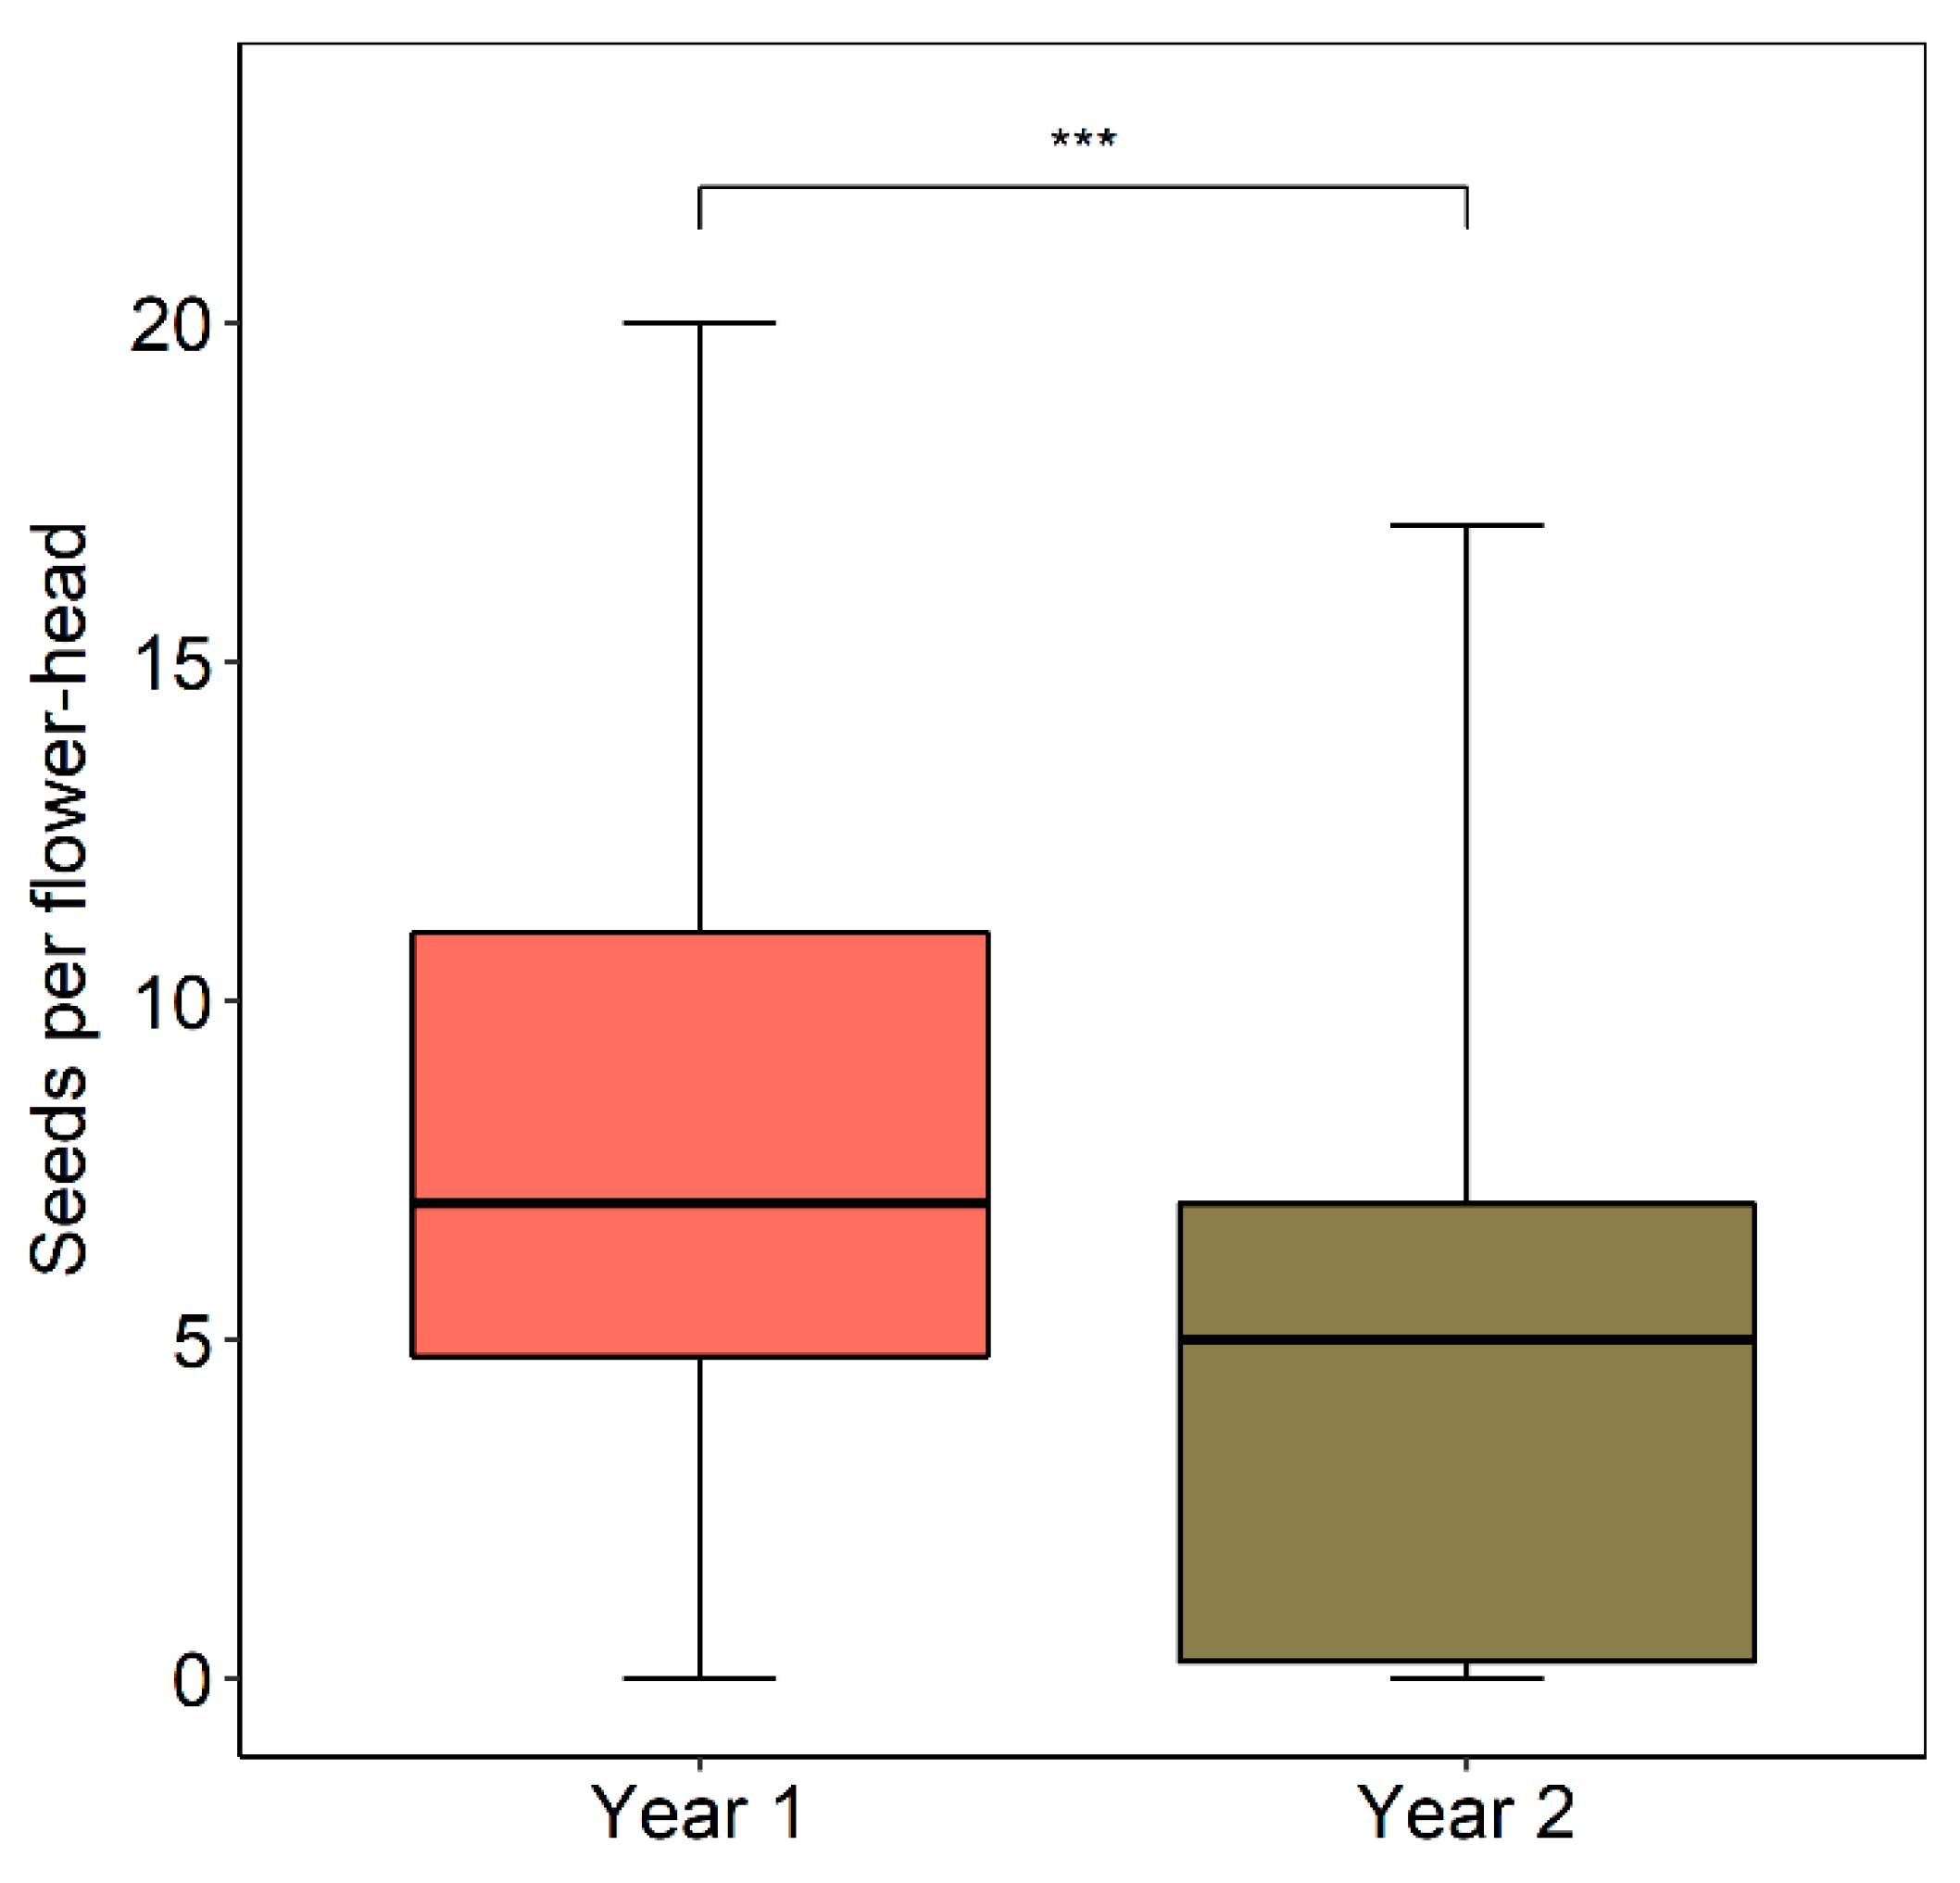
2.7. Seed Set
2.8. Effect of Direct and Indirect Drivers on Pollinator Activity
3. Discussion
4. Materials and Methods
4.1. Focal Species
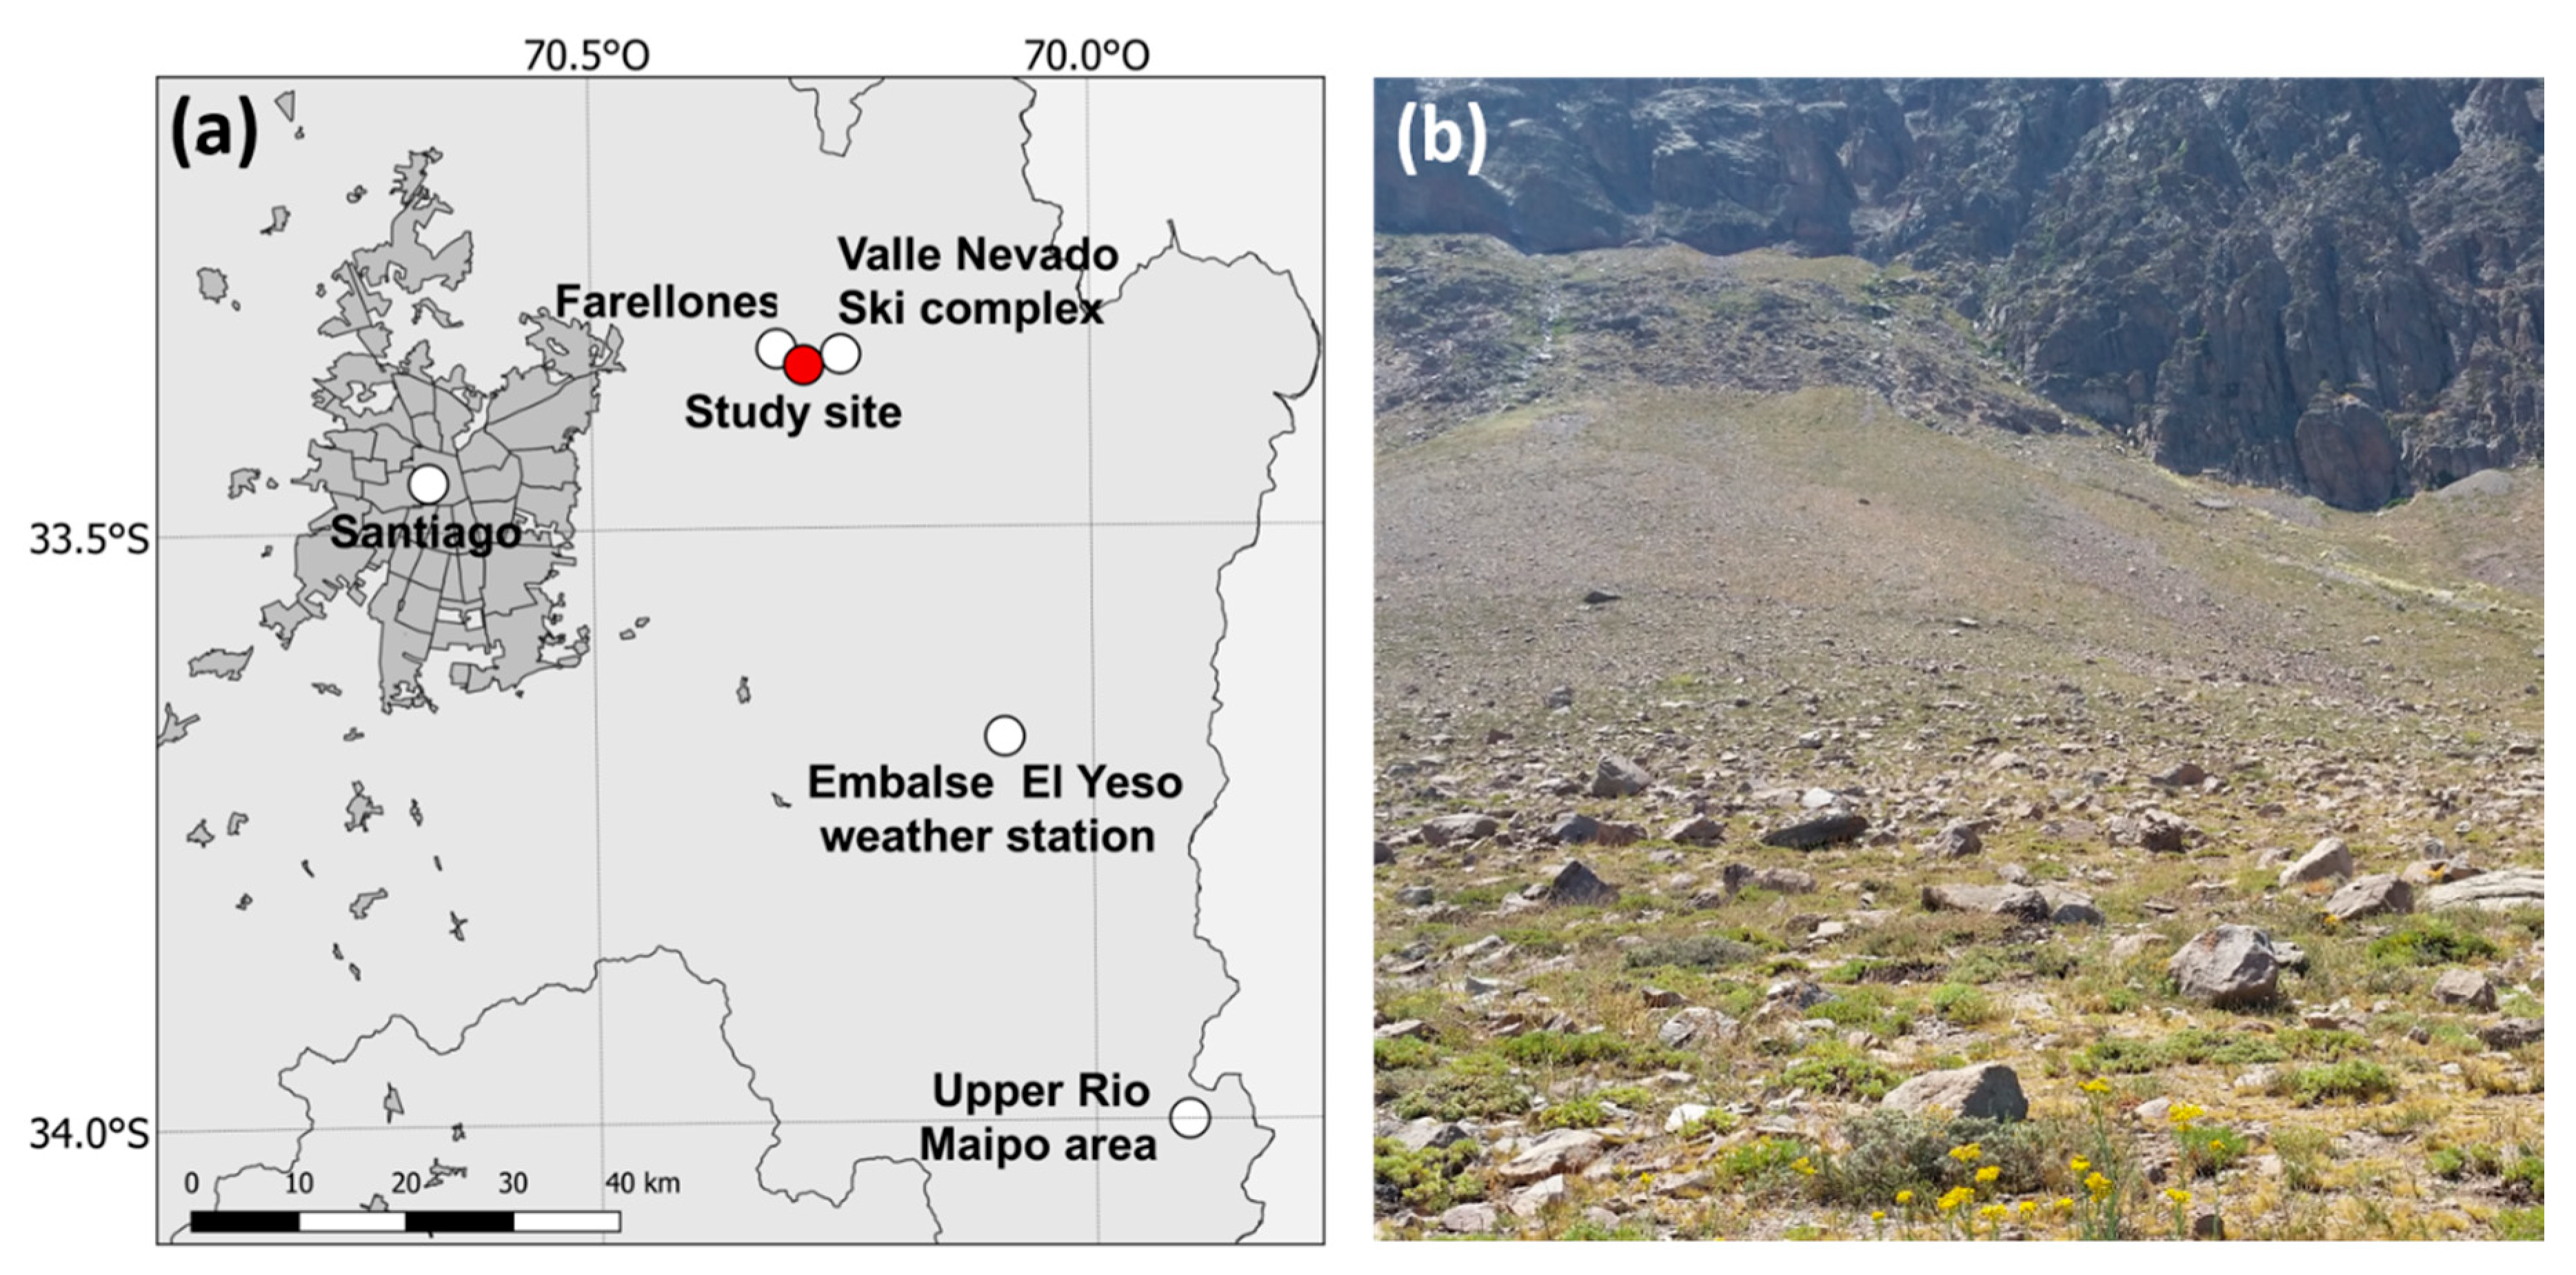
4.2. Study Site
4.3. Characterization of the Central Chilean Mega Drought
4.4. Floral Traits
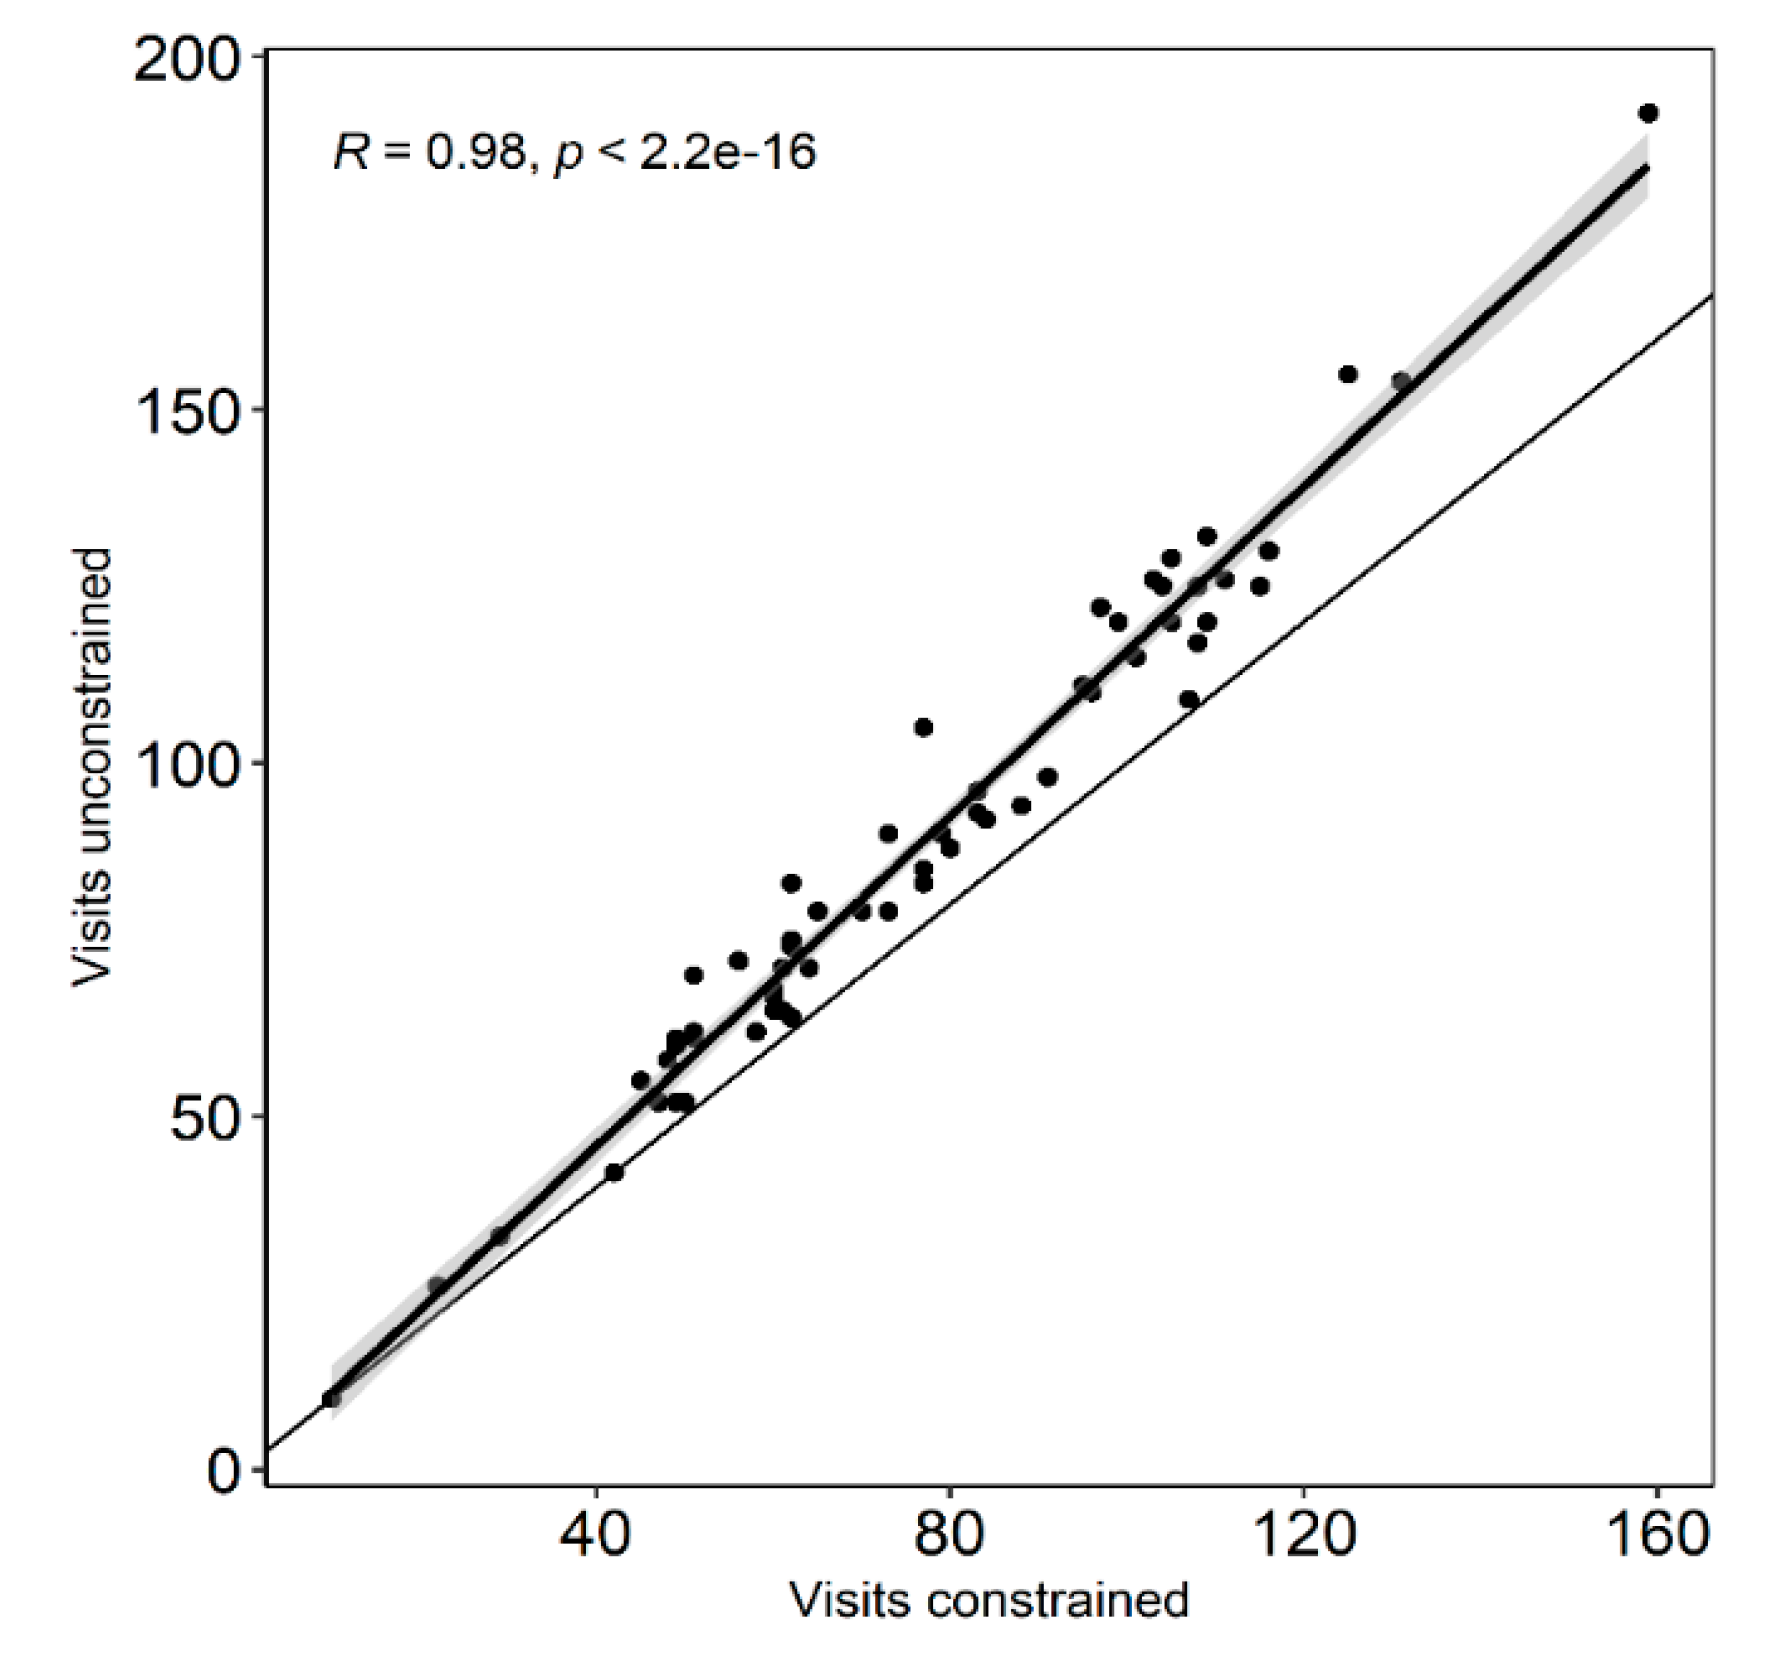
4.5. Pollinator Observations
4.6. Floral Resource Availability
4.7. Seed Set
4.8. Onsite Abiotic Variables
4.9. Data Analysis
5. Conclusions
Supplementary Materials
Author Contributions
Funding
Acknowledgments
Conflicts of Interest
Appendix A

Appendix B

References
- Christie, D.A.; Lara, A.; Barichivich, J.; Villalba, R.; Morales, M.S.; Cuq, E. El Nino-Southern Oscillation signal in the world’s highest-elevation tree-ring chronologies from the Altiplano, Central Andes. Palaeogeogr. Palaeoclimatol. Palaeoecol. 2009, 281, 309–319. [Google Scholar] [CrossRef]
- Garreaud, R.D.; Alvarez-Garreton, C.; Barichivich, J.; Boisier, J.P.; Christie, D.; Galleguillos, M.; LeQuesne, C.; McPhee, J.; Zambrano-Bigiarini, M. The 2010–2015 megadrought in central Chile: Impacts on regional hydroclimate and vegetation. Hydrol. Earth Syst. Sci. 2017, 21, 6307–6327. [Google Scholar] [CrossRef]
- Hughes, M.K.; Brown, P.M. Drought frequency in central California since 101 BC recorded in giant sequoia tree rings. Clim. Dyn. 1992, 6, 161–167. [Google Scholar] [CrossRef]
- Matusick, G.; Ruthrof, K.X.; Kala, J.; Brouwers, N.C.; Breshears, D.D.; Hardy, G.E.S. Chronic historical drought legacy exacerbates tree mortality and crown dieback during acute heatwave-compounded drought. Environ. Res. Lett. 2018, 13, 095002. [Google Scholar] [CrossRef]
- Robeson, S.M. Revisiting the recent California drought as an extreme value. Geophys. Res. Lett. 2015, 42, 6771–6779. [Google Scholar] [CrossRef]
- Sousa, P.M.; Blamey, R.C.; Reason, C.J.C.; Ramos, A.M.; Trigo, R.M. The ‘Day Zero’ Cape Town drought and the poleward migration of moisture corridors. Environ. Res. Lett. 2018, 13, 124025. [Google Scholar] [CrossRef]
- Van Dijk, A.; Beck, H.E.; Crosbie, R.S.; de Jeu, R.A.M.; Liu, Y.Y.; Podger, G.M.; Timbal, B.; Viney, N.R. The Millennium Drought in southeast Australia (2001–2009): Natural and human causes and implications for water resources, ecosystems, economy, and society. Water Resour. Res. 2013, 49, 1040–1057. [Google Scholar] [CrossRef]
- Wolski, P.; Conradie, S.; Jack, C.; Tadross, M. Spatio-temporal patterns of rainfall trends and the 2015–2017 drought over the winter rainfall region of South Africa. Int. J. Climatol. 2020. [Google Scholar] [CrossRef]
- Caloiero, T.; Caloiero, P.; Frustaci, F. Long-term precipitation trend analysis in Europe and in the Mediterranean basin. Water Environ. J. 2018, 32, 433–445. [Google Scholar] [CrossRef]
- Caloiero, T.; Veltri, S.; Caloiero, P.; Frustaci, F. Drought analysis in Europe and in the Mediterranean Basin using the standardized precipitation index. Water 2018, 10, 1043. [Google Scholar] [CrossRef]
- Christie, D.A.; Boninsegna, J.A.; Cleaveland, M.K.; Lara, A.; Le Quesne, C.; Morales, M.S.; Mudelsee, M.; Stahle, D.W.; Villalba, R. Aridity changes in the Temperate-Mediterranean transition of the Andes since ad 1346 reconstructed from tree-rings. Clim. Dyn. 2011, 36, 1505–1521. [Google Scholar] [CrossRef]
- Boisier, J.P.; Alvarez-Garreton, C.; Cordero, R.R.; Damiani, A.; Gallardo, L.; Garreaud, R.D.; Lambert, F.; Ramallo, C.; Rojas, M.; Rondanelli, R. Anthropogenic drying in central-southern Chile evidenced by long-term observations and climate model simulations. Elem. Sci. Anthr. 2018, 6, 74. [Google Scholar] [CrossRef]
- DMC. Dirección Meteorológica de Chile. 2020. Available online: http://archivos.meteochile.gob.cl/portaldmc/meteochile/prediccionestacional/DocumentosPDF/BoletinesPDF/Sequia/sequia_Noviebre-2019(Ed_Diciembre-2019).pdf (accessed on 9 October 2020).
- Miranda, A.; Lara, A.; Altamirano, A.; Di Bella, C.; Gonzalez, M.E.; Camarero, J.J. Forest browning trends in response to drought in a highly threatened mediterranean landscape of South America. Ecol. Indic. 2020, 115, 106401. [Google Scholar] [CrossRef]
- Gerard, M.; Vanderplanck, M.; Wood, T.; Michez, D. Global warming and plant-pollinator mismatches. Emerg. Top. Life Sci. 2020, 4, 77–86. [Google Scholar] [CrossRef]
- Gallagher, M.K.; Campbell, D.R. Shifts in water availability mediate plant-pollinator interactions. New Phytol. 2017, 215, 792–802. [Google Scholar] [CrossRef]
- Vicente-Serrano, S.M.; Quiring, S.M.; Pena-Gallardo, M.; Yuan, S.S.; Dominguez-Castro, F. A review of environmental droughts: Increased risk under global warming? Earth Sci. Rev. 2020, 201, 102953. [Google Scholar] [CrossRef]
- Walter, J. Dryness, wetness and temporary flooding reduce floral resources of plant communities with adverse consequences for pollinator attraction. J. Ecol. 2020, 108, 1453–1464. [Google Scholar] [CrossRef]
- Descamps, C.; Quinet, M.; Baijot, A.; Jacquemart, A.L. Temperature and water stress affect plant-pollinator interactions in Borago officinalis (Boraginaceae). Ecol. Evol. 2018, 8, 3443–3456. [Google Scholar] [CrossRef]
- Descamps, C.; Maree, S.; Hugon, S.; Quinet, M.; Jacquemart, A.L. Species-specific responses to combined water stress and increasing temperatures in two bee-pollinated congeners (Echium, Boraginaceae). Ecol. Evol. 2020, 10, 6549–6561. [Google Scholar] [CrossRef]
- Arroyo, M.T.K.; Pacheco, D.A.; Dudley, L.S. Functional role of long-lived flowers in preventing pollen limitation in a high elevation outcrossing species. Aob Plants 2017, 9, plx050. [Google Scholar] [CrossRef]
- Arroyo, M.T.K.; Armesto, J.J.; Primack, R.B. Community studies in pollination ecology in the high temperate Andes of Central Chile. II. Effect of temperature and visitation rates and population possibilities. Plant Syst. Evol. 1985, 149, 187–203. [Google Scholar] [CrossRef]
- Corbet, S.A.; Fussell, M.; Ake, R.; Fraser, A.; Gunson, C.; Savage, A.; Smith, K. Temperature and the pollinating activity of social bees. Ecol. Entomol. 1993, 18, 17–30. [Google Scholar] [CrossRef]
- Corbet, S.A. Pollination and the weather. Isr. J. Bot. 1990, 39, 13–30. [Google Scholar]
- McCall, C.; Primack, R.B. Influence of flower characteristics, weather, time of day, and season on insect visitation rates in 3 plant-communities. Am. J. Bot. 1992, 79, 434–442. [Google Scholar] [CrossRef]
- Torres-Diaz, C.; Cavieres, L.A.; Munoz-Ramirez, C.; Arroyoz, M.T.K. Consequences of microclimate variation on insect pollinator visitation in two species of Chaetanthera (Asteraceae) in the central Chilean Andes. Rev. Chil. Hist. Nat. 2007, 80, 455–468. [Google Scholar] [CrossRef][Green Version]
- Lundberg, H. Effects of weather on foraging-flights of bumblebees (Hymenoptera, Apidae) in a subalpine-alpine area. Holarct. Ecol. 1980, 3, 104–110. [Google Scholar] [CrossRef]
- Bergman, P.; Molau, U.; Holmgren, B. Micrometeorological impacts on insect activity and plant reproductive success in an alpine environment, Swedish Lapland. Arct. Alp. Res. 1996, 28, 196–202. [Google Scholar] [CrossRef]
- Wolf, L.L.; Hainsworth, F.R. Environmental influence on regulated body-temperature in torpid hummingbirds. Comp. Biochem. Physiol. 1972, 41, 167–173. [Google Scholar] [CrossRef]
- Kuhsel, S.; Bluthgen, N. High diversity stabilizes the thermal resilience of pollinator communities in intensively managed grasslands. Nat. Commun. 2015, 6, 7989. [Google Scholar] [CrossRef]
- Willmer, P.; Stone, G. Temperature and water relations in desert bees. J. Therm. Biol. 1997, 22, 453–465. [Google Scholar] [CrossRef]
- Powers, D.R.; Langland, K.M.; Wethington, S.M.; Powers, S.D.; Graham, C.H.; Tobalske, B.W. Hovering in the heat: Effects of environmental temperature on heat regulation in foraging hummingbirds. R. Soc. Open Sci. 2017, 4, 171056. [Google Scholar] [CrossRef] [PubMed]
- Stiles, F.G. Effects of a severe drought on the population biology of a tropical hummingbird. Ecology 1992, 73, 1375–1390. [Google Scholar] [CrossRef]
- Waser, N.M.; Price, M.V. Drought, pollen and nectar availability, and pollination success. Ecology 2016, 97, 1400–1409. [Google Scholar] [CrossRef] [PubMed]
- Abrahamczyk, S.; Kluge, J.; Gareca, Y.; Reichle, S.; Kessler, M. The influence of climatic seasonality on the diversity of different tropical pollinator groups. PLoS ONE 2011, 6, e27115. [Google Scholar] [CrossRef] [PubMed]
- Bergamo, P.J.; Streher, N.S.; Wolowski, M.; Sazima, M. Pollinator-mediated facilitation is associated with floral abundance, trait similarity and enhanced community-level fitness. J. Ecol. 2020, 108, 1334–1346. [Google Scholar] [CrossRef]
- Klank, C.; Pluess, A.R.; Ghazoul, J. Effects of population size on plant reproduction and pollinator abundance in a specialized pollination system. J. Ecol. 2010, 98, 1389–1397. [Google Scholar] [CrossRef]
- Gordon, C.; Woodin, S.J.; Alexander, I.J.; Mullins, C.E. Effects of increased temperature, drought and nitrogen supply on two upland perennials of contrasting functional type: Calluna vulgaris and Pteridium aquilinum. New Phytol. 1999, 142, 243–258. [Google Scholar] [CrossRef]
- Carroll, A.B.; Pallardy, S.G.; Galen, C. Drought stress, plant water status, and floral trait expression in fireweed, Epilobium angustifolium (Onagraceae). Am. J. Bot. 2001, 88, 438–446. [Google Scholar] [CrossRef]
- Villarreal, A.G.; Freeman, C.E. Effects of temperature and water-stress on some floral nectar characteristics in Ipomopsis longiflora (Polemoniaceae) under controlled conditions. Bot. Gaz. 1990, 151, 5–9. [Google Scholar] [CrossRef]
- Corbet, S.A.; Unwin, D.M.; Prysjones, O.E. Humidity, néctar and insect visits to flowers. with special reference to Crataegus, Tilia and Echium. Ecol. Entomol. 1979, 4, 9–22. [Google Scholar] [CrossRef]
- Takkis, K.; Tscheulin, T.; Petanidou, T. Differential effects of climate warming on the nectar secretion of early- and late-flowering Mediterranean plants. Front. Plant Sci. 2018, 9, 874. [Google Scholar] [CrossRef] [PubMed]
- Takkis, K.; Tscheulin, T.; Tsalkatis, P.; Petanidou, T. Climate change reduces nectar secretion in two common Mediterranean plants. Aob Plants 2015, 7, plv111. [Google Scholar] [CrossRef] [PubMed]
- Arroyo, M.T.K.; Dudley, L.S.; Jespersen, G.; Pacheco, D.A.; Cavieres, L.A. Temperature-driven flower longevity in a high-alpine species of Oxalis influences reproductive assurance. New Phytol. 2013, 200, 1260–1268. [Google Scholar] [CrossRef] [PubMed]
- Pacheco, D.A.; Dudley, L.S.; Cabezas, J.; Cavieres, L.A.; Arroyo, M.T.K. Plastic responses contribute to explaining altitudinal and temporal Variation in potential flower longevity in high Andean Rhodolirion montanum. PLoS ONE 2016, 11, e0166350. [Google Scholar] [CrossRef] [PubMed]
- Torres-Mura, J.C. Interacciones entre aves y flores en Chile Central y el archipiélago Juan Fernández. Rev. Chagual 2006, 4, 55–63. [Google Scholar]
- Arroyo, M.T.K.; Primack, R.; Armesto, J. Community studies in pollination ecology in the high temperate Andes of central Chile. 1. Pollination mechanisms and altitudinal variation. Am. J. Bot. 1982, 69, 82–97. [Google Scholar] [CrossRef]
- Telleria, M.C.; Katinas, L. New insights into the pollen morphology of the genus Mutisia (Asteraceae, Mutisieae). Plant Syst. Evol. 2009, 280, 229–241. [Google Scholar] [CrossRef]
- Garreaud, R.D.; Boisier, J.P.; Rondanelli, R.; Montecinos, A.; Sepulveda, H.H.; Veloso-Aguila, D. The Central Chile Mega Drought (2010–2018): A climate dynamics perspective. Int. J. Clim. 2020, 40, 421–439. [Google Scholar] [CrossRef]
- Falvey, M.; Garreaud, R.D. Regional cooling in a warming world: Recent temperature trends in the southeast Pacific and along the west coast of subtropical South America (1979-2006). J. Geophys. Res. Atmos. 2009, 114. [Google Scholar] [CrossRef]
- Vuille, M.; Franquist, E.; Garreaud, R.; Lavado Casimiro, W.S.; Caceres, B. Impact of the global warming hiatus on Andean temperature. J. Geophys. Res. Atmos. 2015, 120, 3745–3757. [Google Scholar] [CrossRef]
- Cocucci, A.A.; Sersic, A.N. Evidence of rodent pollination in Cajophora coronata (Loasaceae). Plant Syst. Evol. 1998, 211, 113–128. [Google Scholar] [CrossRef]
- Abrahamczyk, S.; Kessler, M. Morphological and behavioural adaptations to feed on nectar: How feeding ecology determines the diversity and composition of hummingbird assemblages. J. Ornithol. 2015, 156, 333–347. [Google Scholar] [CrossRef]
- Stavenga, D.G.; Arikawa, K. Evolution of color and vision of butterflies. Arthropod Struct. Dev. 2006, 35, 307–318. [Google Scholar] [CrossRef] [PubMed]
- Phillips, B.B.; Shaw, R.F.; Holland, M.J.; Fry, E.L.; Bardgett, R.D.; Bullock, J.M.; Osborne, J.L. Drought reduces floral resources for pollinators. Glob. Chang. Biol. 2018, 24, 3226–3235. [Google Scholar] [CrossRef] [PubMed]
- Wiens, D. Ovule survivorship, brood size, life-history, breeding systems, and reproductive success in plants. Oecologia 1984, 64, 47–53. [Google Scholar] [CrossRef] [PubMed]
- Perez, G.; Lara, C.; Viccon-Pale, J.; Signoret-Poillon, M. Memory for location and visual cues in white-eared hummingbirds Hylocharis leucotis. Curr. Zool. 2011, 57, 468–476. [Google Scholar] [CrossRef][Green Version]
- Gonzalez-Gomez, P.L.; Vasquez, R.A. A field study of spatial memory in green-backed firecrown hummingbirds (Sephanoides sephaniodes). Ethology 2006, 112, 790–795. [Google Scholar] [CrossRef]
- Araya-Salas, M.; Gonzalez-Gomez, P.; Wojczulanis-Jakubas, K.; Lopez, V.; Wright, T.F. Spatial memory is as important as weapon and body size for territorial ownership in a lekking hummingbird. Sci. Rep. 2018, 8, 2001. [Google Scholar] [CrossRef]
- Hixon, M.A.; Carpenter, F.L.; Paton, D.C. Territory area, flower density, and time budgeting in hummingbirds—An experimental and theoretical-analysis. Am. Nat. 1983, 122, 366–391. [Google Scholar] [CrossRef]
- Abrahamczyk, S.; Kessler, M. Hummingbird diversity, food niche characters, and assemblage composition along a latitudinal precipitation gradient in the Bolivian lowlands. J. Ornithol. 2010, 151, 615–625. [Google Scholar] [CrossRef]
- Abrahamczyk, S.; Poretschkin, C.; Renner, S.S. Evolutionary flexibility in five hummingbird/plant mutualistic systems: Testing temporal and geographic matching. J. Biogeogr. 2017, 44, 1847–1855. [Google Scholar] [CrossRef]
- Calder, W.A.; Waser, N.M.; Hiebert, S.M.; Inouye, D.W.; Miller, S. Site-fidelity, longevity, and population-dynamics of broad-tailed hummingbirds—A 10 year study. Oecologia 1983, 56, 359–364. [Google Scholar] [CrossRef] [PubMed]
- Perez, F.; Arroyo, M.T.K.; Armesto, J.J. Evolution of autonomous selfing accompanies increased specialization in the pollination system of Schizanthus (Solanaceae). Am. J. Bot. 2009, 96, 1168–1176. [Google Scholar] [CrossRef] [PubMed]
- Perez, F.; Arroyo, M.T.K.; Medel, R.; Hershkovitz, M.A. Ancestral reconstruction of flower morphology and pollination systems in Schizanthus (Solanaceae). Am. J. Bot. 2006, 93, 1029–1038. [Google Scholar] [CrossRef]
- Hegland, S.J.; Nielsen, A.; Lazaro, A.; Bjerknes, A.-L.; Totland, O. How does climate warming affect plant-pollinator interactions? Ecol. Lett. 2009, 12, 184–195. [Google Scholar] [CrossRef]
- Polce, C.; Garratt, M.P.; Termansen, M.; Ramirez-Villegas, J.; Challinor, A.J.; Lappage, M.G.; Boatman, N.D.; Crowe, A.; Endalew, A.M.; Potts, S.G.; et al. Climate-driven spatial mismatches between British orchards and their pollinators: Increased risks of pollination deficits. Glob. Chang. Biol. 2014, 20, 2815–2828. [Google Scholar] [CrossRef]
- Arroyo, M.T.K.; Till-Bottraud, I.; Torres, C.; Henriquez, C.A.; Martinez, J. Display size preferences and foraging habits of high Andean butterflies pollinating Chaetanthera lycopodioides (Asteraceae) in the subnival of the central Chilean Andes. Arct. Antarct. Alp. Res. 2007, 39, 347–352. [Google Scholar] [CrossRef]
- Kim, W.; Gilet, T.; Bush, J.W.M. Optimal concentrations in nectar feeding. Proc. Natl. Acad. Sci. USA 2011, 108, 16618–16621. [Google Scholar] [CrossRef]
- Dudley, L.S.; Arroyo, M.T.K.; Fernandez-Murillo, M.P. Physiological and fitness response of flowers to temperature and water augmentation in a high Andean geophyte. Environ. Exp. Bot. 2018, 150, 1–8. [Google Scholar] [CrossRef]
- Nagy, L.; Kreyling, J.; Gellesch, E.; Beierkuhnlein, C.; Jentsch, A. Recurring weather extremes alter the flowering phenology of two common temperate shrubs. Int. J. Biometeorol. 2013, 57, 579–588. [Google Scholar] [CrossRef]
- Jentsch, A.; Kreyling, J.; Boettcher-Treschkow, J.; Beierkuhnlein, C. Beyond gradual warming: Extreme weather events alter flower phenology of European grassland and heath species. Glob. Chang. Biol. 2009, 15, 837–849. [Google Scholar] [CrossRef]
- Cavieres, L.A.; Badano, E.I.; Sierra-Almeida, A.; Gomez-Gonzalez, S.; Molina-Montenegro, M.A. Positive interactions between alpine plant species and the nurse cushion plant Laretia acaulis do not increase with elevation in the Andes of central Chile. New Phytol. 2006, 169, 59–69. [Google Scholar] [CrossRef] [PubMed]
- Sevenello, M.; Sargent, R.D.; Forrest, J.R.K. Spring wildflower phenology and pollinator activity respond similarly to climatic variation in an eastern hardwood forest. Oecologia 2020, 193, 475–488. [Google Scholar] [CrossRef]
- Gordo, O.; Sanz, J.J. Long-term temporal changes of plant phenology in the Western Mediterranean. Glob. Chang. Biol. 2009, 15, 1930–1948. [Google Scholar] [CrossRef]
- Du, Y.J.; Mao, L.F.; Queenborough, S.A.; Primack, R.; Comita, L.S.; Hampe, A.; Ma, K.P. Macro-scale variation and environmental predictors of flowering and fruiting phenology in the Chinese angiosperm flora. J. Biogeogr. 2020, 47, 2303–2314. [Google Scholar] [CrossRef]
- Kudo, G. Dynamics of flowering phenology of alpine plant communities in response to temperature and snowmelt time: Analysis of a nine-year phenological record collected by citizen volunteers. Environ. Exp. Bot. 2020, 170, 103843. [Google Scholar] [CrossRef]
- CaraDonna, P.J.; Iler, A.M.; Inouye, D.W. Shifts in flowering phenology reshape a subalpine plant community (vol 111, pg 4916, 2014). Proc. Natl. Acad. Sci. USA 2018, 115, E9993. [Google Scholar] [CrossRef]
- Boisier, J.P.; Rondanelli, R.; Garreaud, R.D.; Munoz, F. Anthropogenic and natural contributions to the Southeast Pacific precipitation decline and recent megadrought in central Chile. Geophys. Res. Lett. 2016, 43, 413–421. [Google Scholar] [CrossRef]
- Raven, P.H. Why are bird-visited flowers predominantly red? Evolution 1972, 26, 674. [Google Scholar] [CrossRef]
- Altshuler, D.L. Flower color, hummingbird pollination, and habitat irradiance in four Neotropical forests. Biotropica 2003, 35, 344–355. [Google Scholar] [CrossRef]
- Lunau, K.; Papiorek, S.; Eltz, T.; Sazima, M. Avoidance of achromatic colours by bees provides a private niche for hummingbirds. J. Exp. Biol. 2011, 214, 1607–1612. [Google Scholar] [CrossRef] [PubMed]
- Martinez-Harms, J.; Palacios, A.G.; Marquez, N.; Estay, P.; Arroyo, M.T.K.; Mpodozis, J. Can red flowers be conspicuous to bees? Bombus dahlbomii and South American temperate forest flowers as a case in point. J. Exp. Biol. 2010, 213, 564–571. [Google Scholar] [CrossRef] [PubMed]
- Belmonte, E.; Arroyo, M.T.K. Morphology and ultrastructure of the floral nectary of Eccremocarpus scaber R et P (Bignoniaceae). Arch. De Biol. Y Med. Exp. 1983, 16, R138. [Google Scholar]
- Gegear, R.J.; Burns, R.; Swoboda-Bhattarai, K.A. “Hummingbird” floral traits interact synergistically to discourage visitation by bumble bee foragers. Ecology 2017, 98, 489–499. [Google Scholar] [CrossRef] [PubMed]
- Odeen, A.; Hastad, O. Pollinating birds differ in spectral sensitivity. J. Comp. Physiol. A Neuroethol. Sens. Neural Behav. Physiol. 2010, 196, 91–96. [Google Scholar] [CrossRef] [PubMed]
- Herrera, G.; Zagal, J.C.; Diaz, M.; Fernandez, M.J.; Vielma, A.; Cure, M.; Martinez, J.; Bozinovic, F.; Palacios, A.G. Spectral sensitivities of photoreceptors and their role in colour discrimination in the green-backed firecrown hummingbird (Sephanoides sephaniodes). J. Comp. Physiol. A Neuroethol. Sens. Neural Behav. Physiol. 2008, 194, 785–794. [Google Scholar] [CrossRef]
- Stoddard, M.C.; Eyster, H.N.; Hogan, B.G.; Morris, D.H.; Soucy, E.R.; Inouye, D.W. Wild hummingbirds discriminate nonspectral colors. Proc. Natl. Acad. Sci. USA 2020, 117, 15112–15122. [Google Scholar] [CrossRef]
- Sazima, I.; Buzato, S.; Sazima, M. An assemblage of hummingbird-pollinated flowers in a montane forest in southeastern Brazil. Bot. Acta 1996, 109, 149–160. [Google Scholar] [CrossRef]
- Buzato, S.; Sazima, M.; Sazima, I. Hummingbird-pollinated floras at three Atlantic forest sites. Biotropica 2000, 32, 824–841. [Google Scholar] [CrossRef]
- Arroyo, M.T.K.; Rozzi, R.; Squeo, F.A.; Belmonte, E. Pollination in tropical and temperate high elevation ecosystems: Hypotheses and the Asteraceae as a test case. In Mt. Kenya Area: Differentiation and Dynamics of a Tropical Mountain Ecosystem. Geographic Bernesia, African Studies Series A8; Winiger, M., Wiesmann, U., Rheker, J.R., Eds.; Institute of Geography, University of Berne: Berne, Switzerland, 1990; pp. 21–31. [Google Scholar]
- Medan, D.; Montaldo, N.H.; Devoto, M.; Mantese, A.; Vasellati, V.; Bartoloni, N.H. Plant-pollinator relationships at two altitudes in the Andes of Mendoza, Argentina. Arct. Antarct. Alp. Res. 2002, 34, 233–241. [Google Scholar] [CrossRef]
- Vogel, S. Vertebrate pollination in Compositae: Floral syndromes and field observations. Stapfia 2015, 103, 5–26. [Google Scholar]
- Moreira-Munoz, A.; Scherson, R.A.; Luebert, F.; Roman, M.J.; Monge, M.; Diazgranados, M.; Silva, H. Biogeography, phylogenetic relationships and morphological analyses of the South American genus Mutisia L.f. (Asteraceae) shows early connections of two disjunct biodiversity hotspots. Org. Divers. Evol. 2020. [Google Scholar] [CrossRef]
- Rodriguez, R.; Marticorena, C.; Alarcon, D.; Baeza, C.; Cavieres, L.; Finot, V.L.; Fuentes, N.; Kiessling, A.; Mihoc, M.; Pauchard, A.; et al. Catalogue of the vascular plants of Chile. Gayana Bot. 2018, 75, 1–430. [Google Scholar] [CrossRef]
- Arroyo, M.T.K.; Armesto, J.J.; Villagrán, C. Plant phenological patterns in the high Andean Cordillera of Central Chile. J. Ecol. 1981, 69, 205–233. [Google Scholar] [CrossRef]
- Medel, R.; Botto-Mahan, C.; Kalin-Arroyo, M. Pollinator-mediated selection on the nectar guide phenotype in the Andean monkey flower, Mimulus luteus. Ecology 2003, 84, 1721–1732. [Google Scholar] [CrossRef]
- Viale, M.; Garreaud, R. Summer precipitation events over the western slope of the subtropical Andes. Mon. Weather Rev. 2014, 142, 1074–1092. [Google Scholar] [CrossRef]
- Hall, D.K. MODIS/Terra Snow Cover Daily L3 Global 500m SIN Grid, Version 5; NASA National Snow and Ice Data Center Distributed Active Archive Center: Boulder, CO, USA, 2006.
- Goldsmith, T.H. Optimization, constraint, and history in the evolution of eyes. Q. Rev. Biol. 1990, 65, 281–322. [Google Scholar] [CrossRef]
- Kelber, A.; Vorobyev, M.; Osorio, D. Animal colour vision—Behavioural tests and physiological concepts. Biol. Rev. 2003, 78, 81–118. [Google Scholar] [CrossRef]
- Maia, R.; Eliason, C.M.; Bitton, P.P.; Doucet, S.M.; Shawkey, M.D. Pavo: An R package for the analysis, visualization and organization of spectral data. Methods Ecol. Evol. 2013, 4, 906–913. [Google Scholar] [CrossRef]
- Herrera, C.M. Daily patterns of pollinator activity, differential pollinating effectiveness, and floral resource availability, in a summer-flowering Mediterranean shrub. Oikos 1990, 58, 277–288. [Google Scholar] [CrossRef]
- RCoreTeam. R: A Language and Environment for Statistical Computing; R Foundation for Statistical Computing: Vienna, Austria, 2020. [Google Scholar]
- Zhang, Z.H. Variable selection with stepwise and best subset approaches. Ann. Transl. Med. 2016, 4. [Google Scholar] [CrossRef] [PubMed]
- Fox, J.; Weisberg, A. An R Companion to Applied Regression, 3rd ed.; Sage Publishing: Thousand Oaks, CA, USA, 2018. [Google Scholar]


| Pollinators | Year | Total Flight Bouts Recorded on Plots | Total Flight Bouts with Visits | Total Flower-heads Visited |
|---|---|---|---|---|
| N (%) | ||||
| Hummingbirds | Yr-1 | 2131 | 1119 (52.5%) | 5345 |
| Yr-2 | 55 | 44 (80.0%) | 117 | |
| Butterflies | Yr-1 | 1955 | 12 (0.6%) | 13 |
| Yr-2 | 2679 | 7 (0.3%) | 10 |
| Number of Flower-Head Visits | ||||
| Sum Sq | Df | F value | Pr (>F) | |
| Year | 4,316,679.0 | 1 | 832.66 | 2.88 × 10−102 |
| Period of day | 663,385.2 | 2 | 24.39 | 9.39 × 10⁻¹¹ |
| Year × Period of day | 436,201.3 | 2 | 15.34 | 3.68 × 10−07 |
| Flower-Head Visitation Rate | ||||
| Sum Sq | Df | F value | Pr (>F) | |
| Year | 1,667,083.4 | 1 | 145.57 | 4.90 × 10⁻²⁹ |
| Period of day | 365,901.8 | 2 | 13.20 | 2.74 × 10−06 |
| Year × Period of day | 103,221.6 | 2 | 3.57 | 2.89 × 10⁻² |
| Sum Sq | Df | F Value | Pr (>F) | |
|---|---|---|---|---|
| Year | 11,711,806.5 | 1 | 89.93 | 1.13 × 10⁻²⁰ |
| Time of day | 860,276.3 | 2 | 3.36 | 3.52 × 10⁻² |
| Year × Time of day | 1,414,651.0 | 2 | 5.50 | 4.00 × 10⁻³ |
| Model: VF ~ Intercept + NSC + T + RH + FHD | r2 = 0.4561 | p < 0.0001 | ||
|---|---|---|---|---|
| Variable | Estimate | SE | T | p |
| Intercept | −21.913 | 6.853 | −3.198 | 0.0015 |
| Nectar standing crop | 2.883 | 4.535 | 0.636 | 0.5253 |
| Temperature | 0.616 | 0.239 | 2.572 | 0.0105 |
| Relative humidity | 0.326 | 0.084 | 3.884 | 0.0001 |
| Flower-head density | 28.945 | 4.053 | 7.142 | <0.0001 |
Publisher’s Note: MDPI stays neutral with regard to jurisdictional claims in published maps and institutional affiliations. |
© 2020 by the authors. Licensee MDPI, Basel, Switzerland. This article is an open access article distributed under the terms and conditions of the Creative Commons Attribution (CC BY) license (http://creativecommons.org/licenses/by/4.0/).
Share and Cite
Arroyo, M.T.K.; Robles, V.; Tamburrino, Í.; Martínez-Harms, J.; Garreaud, R.D.; Jara-Arancio, P.; Pliscoff, P.; Copier, A.; Arenas, J.; Keymer, J.; et al. Extreme Drought Affects Visitation and Seed Set in a Plant Species in the Central Chilean Andes Heavily Dependent on Hummingbird Pollination. Plants 2020, 9, 1553. https://doi.org/10.3390/plants9111553
Arroyo MTK, Robles V, Tamburrino Í, Martínez-Harms J, Garreaud RD, Jara-Arancio P, Pliscoff P, Copier A, Arenas J, Keymer J, et al. Extreme Drought Affects Visitation and Seed Set in a Plant Species in the Central Chilean Andes Heavily Dependent on Hummingbird Pollination. Plants. 2020; 9(11):1553. https://doi.org/10.3390/plants9111553
Chicago/Turabian StyleArroyo, Mary T. K., Valeria Robles, Ítalo Tamburrino, Jaime Martínez-Harms, René D. Garreaud, Paola Jara-Arancio, Patricio Pliscoff, Ana Copier, Jonás Arenas, Joaquín Keymer, and et al. 2020. "Extreme Drought Affects Visitation and Seed Set in a Plant Species in the Central Chilean Andes Heavily Dependent on Hummingbird Pollination" Plants 9, no. 11: 1553. https://doi.org/10.3390/plants9111553
APA StyleArroyo, M. T. K., Robles, V., Tamburrino, Í., Martínez-Harms, J., Garreaud, R. D., Jara-Arancio, P., Pliscoff, P., Copier, A., Arenas, J., Keymer, J., & Castro, K. (2020). Extreme Drought Affects Visitation and Seed Set in a Plant Species in the Central Chilean Andes Heavily Dependent on Hummingbird Pollination. Plants, 9(11), 1553. https://doi.org/10.3390/plants9111553