Article

Complete Plastid Genome Sequencing of Eight Species from Hansenia, Haplosphaera and Sinodielsia (Apiaceae): Comparative Analyses and Phylogenetic Implications

1
Key Laboratory of Bio-Resources and Eco-Environment of Ministry of Education, College of Life Sciences, Sichuan University, Chengdu 610065, China
2
Sichuan Key Laboratory of Conservation Biology on Endangered Wildlife, College of Life Sciences, Sichuan University, Chengdu 610065, China
*
Author to whom correspondence should be addressed.
Equal contributions to this work.
Plants 2020, 9(11), 1523; https://doi.org/10.3390/plants9111523
Submission received: 12 October 2020 / Revised: 5 November 2020 / Accepted: 6 November 2020 / Published: 9 November 2020
(This article belongs to the Special Issue Plant Molecular Phylogenetics and Evolutionary Genomics)

Abstract

:
Hansenia Turcz., Haplosphaera Hand.-Mazz. and Sinodielsia H.Wolff are three Apiaceae genera endemic to the Hengduan Mountains and the Himalayas, which usually inhabit elevations greater than 2000 m. The phylogenetic relationships between and within the genera were uncertain, especially the placement of Hap. himalayensis and S. microloba. Therefore, we aimed to conduct comparative (simple sequence repeat (SSR) structure, codon usage bias, nucleotide diversity (Pi) and inverted repeat (IR) boundaries) and phylogenetic analyses of Hansenia, Haplosphaera and Sinodielsia (also compared with Chamaesium and Bupleurum) to reduce uncertainties in intergeneric and interspecific relationships. We newly assembled eight plastid genomes from Hansenia, Haplosphaera and Sinodielsia species, and analyzed them with two plastid genomes from GenBank of Hap. phaea, S. yunnanensis. Phylogenetic analyses used these ten genomes and another 22 plastid genome sequences of Apiaceae. We found that the newly assembled eight genomes ranged from 155,435 bp to 157,797 bp in length and all had a typical quadripartite structure. Fifty-five to 75 SSRs were found in Hansenia, Haplosphaera and Sinodielsia species, and the most abundant SSR was mononucleotide, which accounted for 58.47% of Hansenia, 60.21% of Haplosphaera and 48.01% of Sinodielsia. There was no evident divergence of codon usage frequency between the three genera, where codons ranged from 21,134 to 21,254. The Pi analysis showed that trnE(UUC)-trnT(GGU), trnH(GUG)-psbA and trnE(UUC)-trnT(GGU) spacer regions had the highest Pi values in the plastid genomes of Hansenia (0.01889), Haplosphaera (0.04333) and Sinodielsia (0.01222), respectively. The ndhG-ndhI spacer regions were found in all three genera to have higher diversity values (Pi values: 0.01028–0.2), and thus may provide potential DNA barcodes in phylogenetic analysis. IR boundary analysis showed that the length of rps19 and ycf1 genes entering IRs were usually stable in the same genus. Our phylogenetic tree demonstrated that Hap. himalayensis is sister to Han. weberbaueriana; meanwhile, Haplosphaera and Hansenia are nested together in the East Asia clade, and S. microloba is nested within individuals of S. yunnanensis in the Acronema clade. This study will enrich the complete plastid genome dataset of the Apiaceae genera and has provided a new insight into phylogeny reconstruction using complete plastid genomes of Hansenia, Haplosphaera and Sinodielsia.

1. Introduction

Hansenia Turcz., Haplosphaera Hand.-Mazz. and Sinodielsia H.Wolff are three endemic high-elevation (typically >2000 m) genera of Apiaceae, mainly distributed in the Hengduan Mountains and the Himalayas (Figure 1) [1]. According to the latest Apiaceae taxonomy, Hansenia, Haplosphaera and Sinodielsia comprise five, two and four species, respectively [2,3,4,5]. Previous phylogenetic studies of Hansenia, Haplosphaera and Sinodielsia based on two plastid genome regions (rpl16 and rps16 introns) and nuclear internal transcribed spacers (nrITSs) found that Sinodielsia is within the Acronema clade, while the closely related Hansenia and Haplosphaera are located in the East Asia clade, albeit from limited sampling [6,7,8,9,10,11]. One study of 106 nrITS sequences representing 100 species from 52 genera of Chinese Apiaceae found that the Acronema clade and the East Asia clade were well-supported (posterior probability both valued 100% by Bayesian inference) [8]. Additionally, Hap. himalayensis and S. microloba were unknown at the time of these previous studies and remain as two little-known species.
With the development of second-generation sequencing technology, more plastid genomes have been used in phylogeny and comparative studies, and fairly good results have been obtained [12]. Generally the circular genome consists of two inverted repeats (IRs) divided by two regions, the large (LSC) and small single-copy (SSC) regions [13,14], and most angiosperm complete plastid genomes are between 115 and 165 kb in length [15]. The gene content and order of plastid genomes are usually highly conserved, and the substitution rate in plastid DNA is much lower than in plant nuclear DNA [16]. The similarity of gene length and the low substitution rate of plant plastids make them valuable sources of genetic markers for phylogenetic studies [17].
In our previous studies, we sequenced two plastid genomes of Hap. phaea [18] and S. yunnanensis (HB: Zhongdian population) [19] and provided preliminary phylogenetic positions for the two species. Following on from this, we aimed to conduct comparative (simple sequence repeat (SSR), codon usage bias, nucleotide diversity (Pi) and IR) and phylogenetic analyses of Hansenia, Haplosphaera and Sinodielsia to reduce uncertainties in intergeneric and interspecific relationships. Analyses were conducted using a 32 complete plastid genome dataset, which was compiled from eight newly assembled plastid genomes from Han. forbesii, Han. forrestii, Han. oviformis, Han. weberbaueriana, Hap. himalayensis, S. microloba, S. yunnanensis (EY: Eryuan County pop.) and S. yunnanensis (KM: Kunming pop.), as well as previously sequenced genomes. Our study provides newly complete plastid genomes of Hansenia, Haplosphaera and Sinodielsia species, and since these three genera are endemic to Pan-Himalayan regions, the information provided herein is indispensable for Apiaceae plastid evolutionary and phylogenetic studies.

2. Results and Discussion

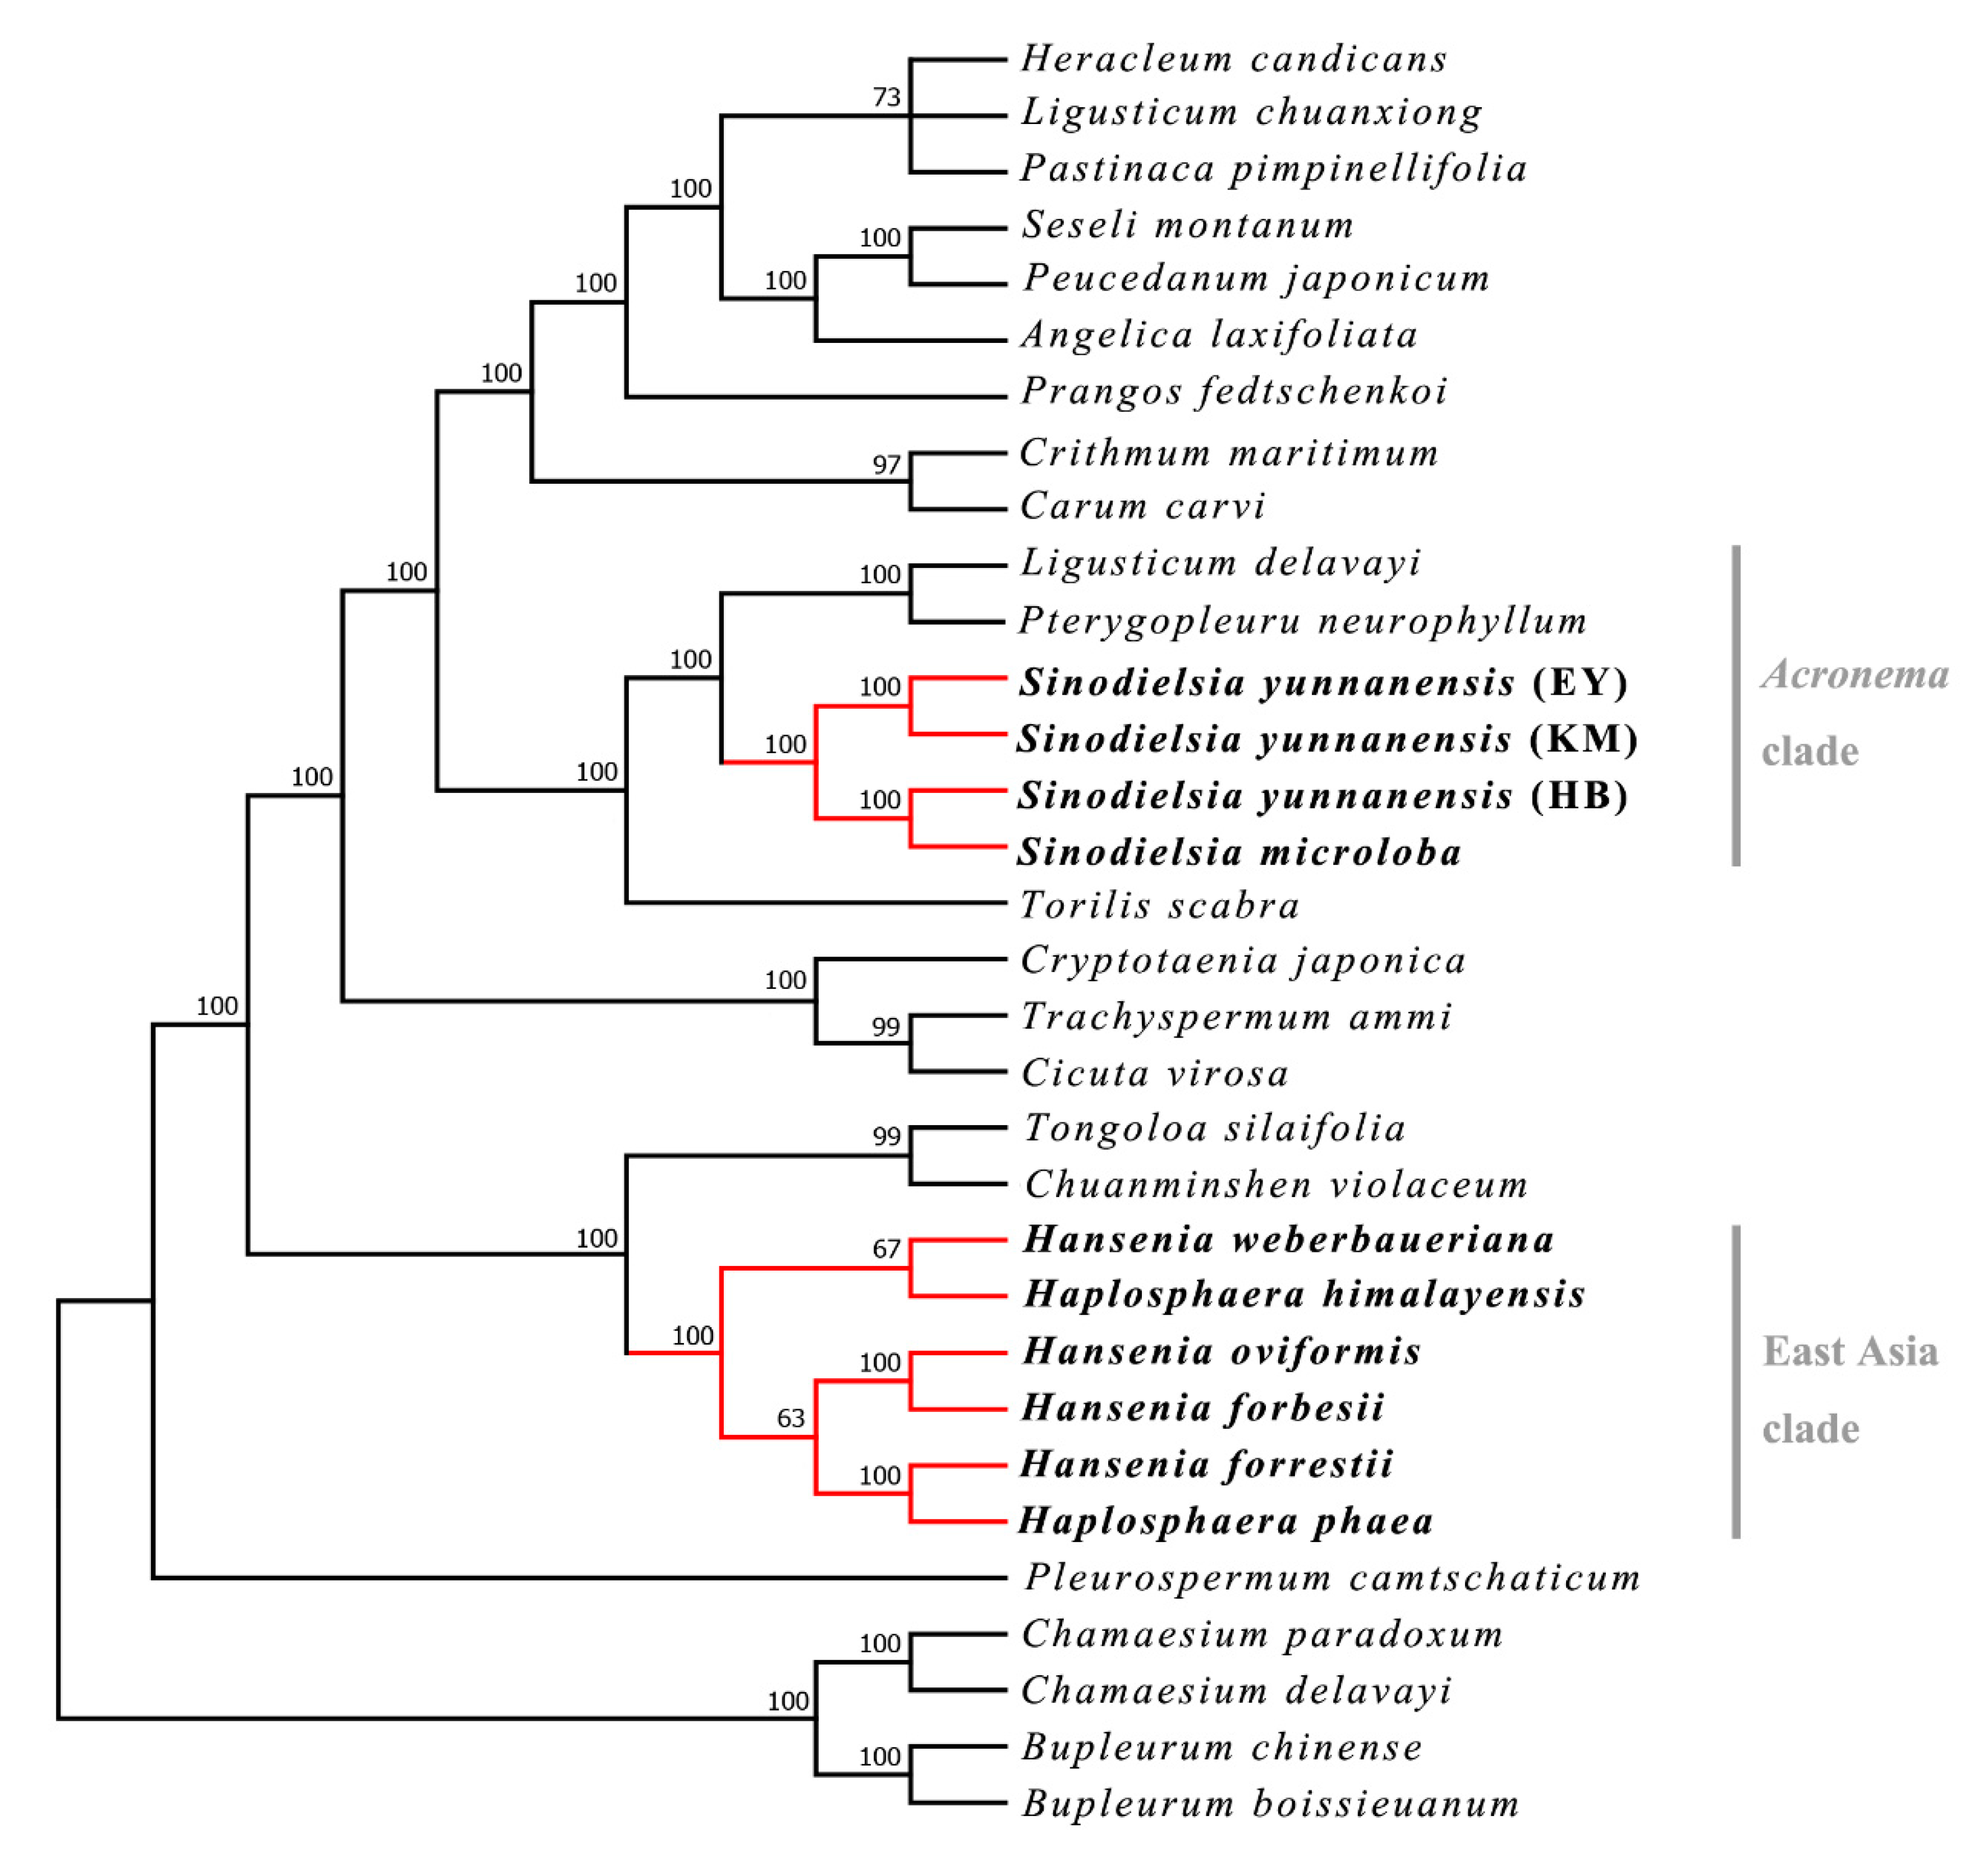
2.1. Phylogenetic Analysis

The phylogenetic tree (Figure 2) showed that Hansenia and Haplosphaera form a strongly supported monophyly (Maximum Likelihood-Bootstrap Support (ML-BS) = 100%) in the East Asia clade. Hap. himalayensis is sister to Han. weberbaueriana (ML-BS = 67%), and Hap. phaea, the type species of Haplosphaera, is sister to Han. forrestii (ML-BS = 100%), showing that Haplosphaera is nested within Hansenia. This suggests that Hansenia and Haplosphaera should be combined to a single genus, as already proposed in previous phylogenetic studies. [8,9,20].
The tree also showed that S. microloba is sister to S. yunnanensis (HB) (ML-BS = 100%) and allied with other S. yunnanensis (EY and KM) (ML-BS = 100%) populations instead of other species in the Acronema clade. The extremely close distance between S. microloba and S. yunnanensis is unusual compared to other Apiaceae species, even though they are congeneric [21,22,23]. However, their morphological characters are distinctive (Figure 1). We speculate there may have been a hybridization phenomenon (i.e., recent or ongoing) between the two species or other intrageneric species, which have to also use nuclear markers to disentangle the true phylogeny of the species. Otherwise, the observed closeness may be caused by incomplete lineage sorting. More populations of S. microloba and other Sinodielsia species are needed to explore their relationship and evolution.

2.2. The Plastid Genomes of Hansenia, Haplosphaera and Sinodielsia Species

The complete plastid genomes of Hansenia, Haplosphaera and Sinodielsia species exhibited a typical quadripartite organization of a single circular DNA molecule (Figure 3). The lengths of the ten genomes (four Hansenia, two Haplosphaera and four Sinodielsia species, including the additional two populations of S. yunnanensis) ranged from 154,670 bp (S. yunnanensis: HB) to 157,797 bp (Han. forbesii) (Table 1). Two identical IRs (including IRa and IRb, with lengths 26,404–26,542 bp) were found in the plastid genomes, which were separated by LSC (85,233–86,968 bp) and SSC (17,370–17,891 bp) regions. The quadripartite organization was found in most plastid genomes of higher plants [13,14], while IRs were absent in Taxus chinensis var. mairei, Erodium species, Pisum sativum and Vicia faba [21,24,25], which may lead to a reduction in the number of duplicated genes and the length of whole plastid genomes. In Apiaceae, the IRa and IRb were both present in the studied plastid genomes from GenBank, Bupleurum species [26] and Chamaesium species [27] ranging from 26,280–26,303 bp and 25,727–26,147 bp, respectively, and the difference of length is mainly caused by the loss or insertion of the spacer regions. The Hansenia, Haplosphaera and Sinodielsia plastid genomes had almost identical GC content (37.5–37.7%) to whole plastid genomes. Higher GC content (42.7–42.8%) was detected in the IR regions compared to the average of a whole genome, which was possibly due to the presence of rRNA sequences with high GC content (55.2–55.3%) in IR regions. Similarly, the high GC content of rRNA sequences also occurs in other Apiaceae species [26,27]. The ten new plastid genomes contained 133 genes, including eight rRNA, 37 tRNA and 85 protein-coding genes (PCGs) (Table 2). Among these 133 genes, 95 genes only had one copy, while 19 genes were duplicated in the IRa and IRb regions, including four rRNA genes (rrn4.5, rrn5, rrn16 and rrn23), seven tRNA genes (trnA-UGC, trnI-CAU, trnI-GAU, trnL-CAA, trnN-GUU, trnR-ACG and trnV-GAC) and eight PCGs (ndhB, rpl2, rpl23, rps7, rps12, rps19, ycf1 and ycf2). Four pseudogenes—ψrps19, ψycf1 and two ψycf15—were found in all the ten genomes. In comparison, Hansenia, Haplosphaera, Sinodielsia, Bupleurum [26] and Chamaesium [27] plastid genes are consistent in their total number of predicted coding regions.
The PCGs in the Hansenia, Haplosphaera and Sinodielsia plastid genomes included five genes (psaA, psaB, psaC, psaI and psaJ) encoding photosystem I subunits, while 15 genes (psbA, psbB, psbC, psbD, psbE, psbF, psbH, psbI, psbJ, psbK, psbL, psbM, psbN, psbT and psbZ) were related to photosystem II subunits. Nine (rpl2, rpl14, rpl16, rpl20, rpl22, rpl23, rpl32, rpl33 and rpl36) encoding large ribosomal protein genes and 12 (rps2, rps3, rps4, rps7, rps8, rps11, rps12, rps14, rps15, rps16, rps18 and rps19) encoding small ribosomal protein genes were detected. Additionally, six genes (atpA, atpB, atpE, atpF, atpH and atpI) of ATP synthase subunits were detected. These PCGs were also detected in Bupleurum [26] and Chamaesium species [27] and are generally involved in the important process of plant growth.

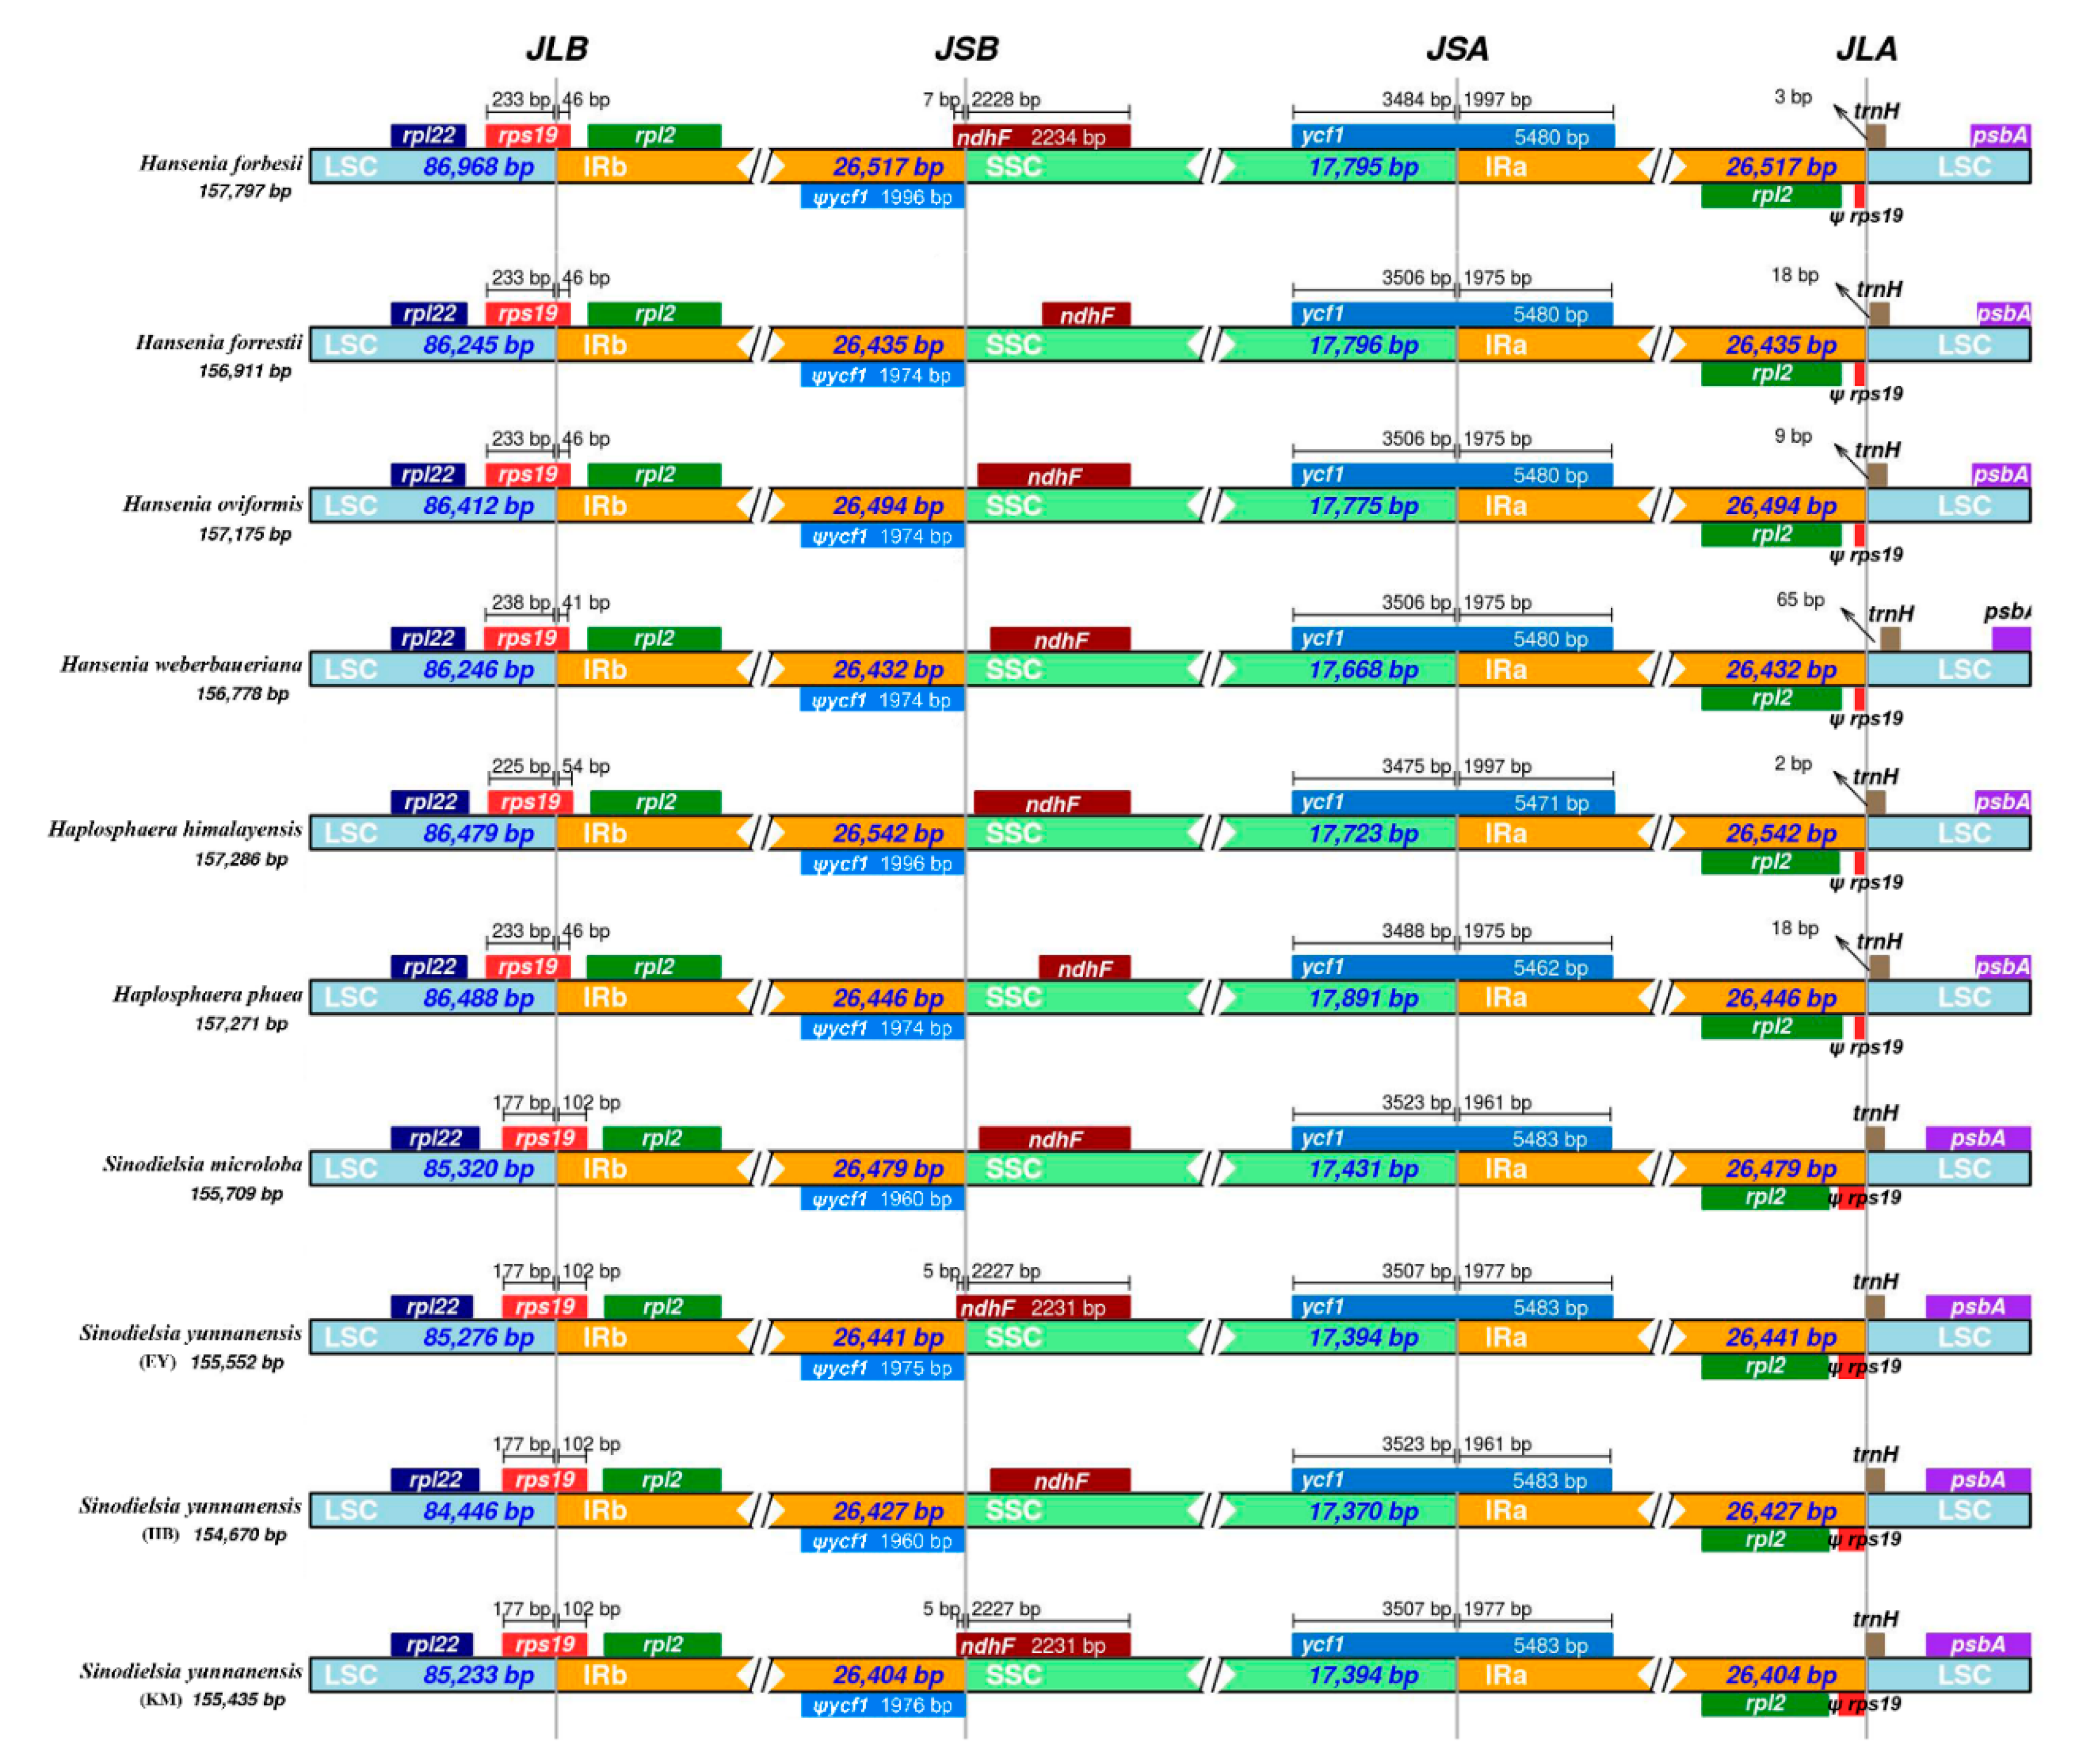
2.3. IR Boundaries and Simple Sequence Repeats (SSRs) Structure Analysis

The IR boundaries of the ten Hansenia, Haplosphaera and Sinodielsia plastid genomes were compared to analyze the fluctuations (expansion or contraction) in these regions (Figure 4). Although the ten plastid genomes showed a similar structure and content, some variations were still identified. The rps19 gene entered the IRb region with 46 bp, 46 bp, 46 bp, 41 bp, 54 bp and 46 bp in the plastid genomes of Han. forbesii, Han. forrestii, Han. oviformis, Han. weberbaueriana, Hap. himalayensis and Hap. phaea (respectively), while 102 bp, 102 bp, 102 bp and 102 bp were entered in the plastid genomes of S. microloba, S. yunnanensis (EY), S. yunnanensis (HB) and S. yunnanensis (KM), respectively. The ndhF genes of Han. forrestii, Han. oviformis, Han. weberbaueriana, Hap. himalayensis, Hap. phaea, S. microloba and S. yunnanensis (HB) are entirely within the SSC region, and a 6–48 bp intergenic region exists between the ndhF gene and the JSB line (the border between IRb and SSC), while the ndhF genes of Han. forbesii, S. yunnanensis (EY) and S. yunnanensis (KM) are partly included in IRb regions with 7 bp, 5 bp and 5 bp, respectively. The ycf1 gene of the ten plastid genomes occupies the JSA line (the border between SSC and IRa), with a length ranging from 1961 to 1997 bp in IRa regions, and ranging from 3475 to 3523 bp in close SSC regions. This also created a pseudogene ycf1 in the IRb regions. The trnH genes of Han. forbesii, Han. forrestii, Han. oviformis, Han. weberbaueriana, Hap. himalayensis and Hap. phaea are entirely within the LSC region. A 2–65 bp length of the intergenic region exists between the trnH genes and JLA line (the border between IRa and SSC), while the trnH gene of S. microloba, S. yunnanensis (EY), S. yunnanensis (HB) and S. yunnanensis (KM) is included in IRa regions with 1 bp.
We found that the lengths of rps19 and trnH genes entering IRs are similar between Hansenia (36–41 bp) and Haplosphaera (41–49 bp), which is different from these genes in Sinodielsia (102 bp). Not surprisingly, Hansenia is more closely related to Haplosphaera but distantly related to Sinodielsia, which has also been confirmed by nrITS sequences and transcriptome data [8,20]. A collective analysis of our results and previous studies [26,27,28,29] found that the lengths of rps19 and trnH genes entering IRs are usually stable in the same genus or phylogenetically related groups. For example, the length of rps19 gene entering IRs is 57–96 bp in Chamaesium species [27], and 49–84 bp in Bupleurum species [26], which are the phylogenetically basal groups in the Chamaesium clade and Bupleureae. Whereas in Apieae members, such as Anethum, Apium and Petroselium, the rps19 genes are not in the IRs. Instead, the rpl2 genes are partly in the IRs [26,30]. Although the rpl2 genes are partly duplicated in the IRs of some Apieae members, they are duplicated completely in the Hansenia, Haplosphaera and Sinodielsia species. As for the two pseudogenes ψrps19 and ψycf1 detected in the plastid genomes of Hansenia, Haplosphaera and Sinodielsia, their incomplete duplication may be caused by the fluctuations in the IR boundary. The fluctuations may lead to gene loss (or pseudogene loss), which is a common phenomenon in Apiaceae species [26,27]. Nevertheless, the length of land plants IRs can vary from 10 to 76 kbp, with most species having an IR of about 25 kbp, and often less than 15 kbp in lower land plants and fern species [31]. Fluctuations in IR regions are the main reason for the differences in plastid genome lengths in most species, which also leads to several genes entering the IR regions or the single-copy sequences [32].
Sixty-six, 72, 65, 62, 65, 75, 61, 57, 55 and 56 SSRs were identified in the plastid genomes of Han. forbesii, Han. forrestii, Han. oviformis, Han. weberbaueriana, Hap. himalayensis, Hap. phaea, S. microloba, S. yunnanensis (EY), S. yunnanensis (HB) and S. yunnanensis (KM), respectively. The results hint that plastids of related groups share similar numbers of SSRs, while that is not always the result [26]. Six repeat motifs (mono-, di-, tri-, tetra-, penta- and hexanucleotide repeats) of microsatellites were detected in the plastid genome of the Hansenia, Haplosphaera and Sinodielsia species. Mononucleotide repeats were the most abundant SSR, which accounted for 58.47% of Hansenia, 60.21% of Haplosphaera and 48.01% of Sinodielsia. Dinucleotide SSRs were the second most abundant SSR, which accounted for 18.02% of Hansenia, 17.69% of Haplosphaera and 29.29% of Sinodielsia. This was followed by tetranucleotide repeats of 8.69%, 9.28% and 4.79%, and trinucleotide repeats of 10.65%, 11.38% and 14.41% in Hansenia, Haplosphaera and Sinodielsia, respectively. Pentanucleotide and hexanucleotide were the least abundant SSR (average of the three genera: 2.73% and 0.62%, respectively) (Figure 5). The repeat motifs with the highest content in SSRs were all mononucleotide, which is similar to most species including Apiaceae plants [26,27], but different from Forthysia (dinucleotide) [33] and Nitotiana (trinucleotide) species [34]. The similar contents of mononucleotide and dinucleotide repeats of Hansenia and Haplosphaera indicates that both genera seem to belong together. In all Hansenia, Haplosphaera and Sinodielsia species the repeats were composed almost entirely of A/T, except for mononucleotide repeat motifs that also had G/C contents of 10.53%, 2.33%, 10.81%, 7.32% and 4.65 in Han. forbesii, Han. forrestii, Han. weberbaueriana, Hap. himalayensis and Hap. phaea. The phylogenetic closeness of these species suggests that the relatives may share similar mononucleotide repeated contents. Most dinucleotide repeats were AT/TA, except for one TC repeat that was in the plastid genome of S. yunnanensis (HB). Across all SSR loci, 94 SSRs (14.83%) were found in the IRs, 417 SSRs (65.77%) in LSC regions and 123 SSRs (19.40%) in SSC regions of the plastid genomes (Figure 6).

2.4. Codon Usage Analysis

The codon usage bias and relative synonymous codon usage (RSCU) values were calculated using 53 PCGs in the ten Hansenia, Haplosphaera and Sinodielsia plastid genomes. There was no evident divergence of the codon usage frequency when we compared the three genera (Figure 7). The number of codons of PCGs ranged from 21,134 (S. yunnanensis: KM) to 21,254 (Han. weberbaueriana) (Supplementary Table S2). Among these codons, leucine was encoded by 2227–2236 and cysteine was encoded by 214–224 codons, which presented the maximum and the minimum number of codons per amino acids in our study species, respectively. AUU (850–872) involved in encoding isoleucine and UAG (13–14) involved in encoding a terminator were the most and least used codons. Furthermore, 30 codons of Hansenia and Haplosphaera, and 31 codons of Sinodielsia plastid genomes had RSCU values larger than 1, indicating that they were the preferred codons in those ten plastid genomes. Among these 30/31 preferred codons, most codons terminated in A/T, except that UUG ended with G, and C was not found at the third position. This demonstrated that the codon usages of the ten plastid genomes were biased towards A/T at the third position of codons, which is generally consistent with other reported genomes of angiosperm [35,36], including the Bupleurum [26] and Chamaesium [27] species.
Codon usage bias is an important indicator for studying the evolutionary relationship of genomes [37]. Studies have shown that many biological factors affect the preference of synonymous codon usage, such as gene expression level [38], gene sequence length [39], tRNA abundance [40] and GC distribution position [41]. Codon bias seems to be maintained by selection–mutation–drift balance [42]. There is a general agreement that the strong bias towards highly expressed genes is due to selection for speed or translational efficiency [43]. Our studied species of Hansenia, Haplosphaera and Sinodielsia are from the Himalayan and Hengduan regions, usually inhabiting alpine areas over 3000 m, and one of the reasons for their similar RSCU values may be the shared natural selection pressures, even though they are not all closely related. This may provide another analytical technique to use when studying nuclear genomes and can assist in understanding how species of separate lineages, yet similar environments, have undergone parallel evolution. Increased numbers and improved methods of analytical techniques are especially useful when studying many Pan-Himalayan region Apiaceae species that are morphologically similar.

2.5. Nucleotide Diversity Analysis

Nucleotide diversity (Pi) values of the plastid genomes from the Hansenia, Haplosphaera and Sinodielsia species were calculated to evaluate their sequence divergence level (Figure 8). In the four Hansenia genomes, Pi values in the LSC regions ranged from 0 to 0.01889, with an average of 0.00371, and ranged from 0 to 0.01472 in the SSC regions, with an average of 0.00263. The Pi values of IR regions ranged from 0 to 0.00639 and had an average of 0.00089, the lowest Pi values of the three regions for these four genomes. In the two Haplosphaera genomes, Pi values ranged from 0 to 0.04333 and averaged 0.00531 in the LSC regions, and from 0 to 0.02 in the SSC regions, with an average value of 0.0028. The IR region values in the two Haplosphaera genomes were similarly low, with an average of 0.0015 and ranging from 0 to 0.01333. The two Haplosphaera species with high Pi values seem to be distant species within the genus Hansenia (see further under phylogenetic studies). In the two Sinodielsia genomes, Pi values ranged from 0 to 0.01222 with an average of 0.0021 in the LSC regions, and from 0 to 0.01028, averaging 0.00149 in the SSC regions. The Pi values of IR regions were again low for the two Sinodielsia genomes and ranged from 0 to only 0.00833, with a value of 0.00112. Pi values indicated mutations in the respective regions [26]. The Pi values of Sinodielsia were the lowest of the three genera, indicating that S. microloba is more closely related to S. yunnanensis than the other species within each genus.
We found that high Pi values of sequences were usually detected in spacer regions between genes. Among these genomic spacer regions of the Hansenia species, trnK (UUU)-rps16, psbK-psbI, trnE (UUC)-trnT (GGU), rps4-trnL (UAA), petL-psaJ, rpl22-rps19 and ndhG-ndhI had the highest Pi values, ranging from 0.01083 to 0.01889. The highest Pi values of spacer regions of the Haplosphaera species ranged between 0.015 and 0.04333 for trnH (GUG)-psbA, atpH-atpI, rps4-trnT (UGU), ycf4-cemA, petB-petD and ndhG-ndhI. Within the spacer regions of Sinodielsia species, matK-rps16, trnE (UUC)-trnT (GGU), ycf3-trnS (GGA), trnL (UAA)-ndhJ, rpl33-rps18, rps11-infA, rps3-rps19, ycf1-ndhF, ndhF-rpl32 and ndhG-ndhI had the highest Pi values, ranging from 0.00722 to 0.01222. Although the spacer regions were diverse among the three genera, we found the spacer regions ndhG-ndhI occurred in all three genera with relatively high values. Pending more specimen samples and plastid genome studies of Chinese Apiaceae, the spacer regions (e.g., high Pi value ndhG-ndhI) may provide DNA barcodes for molecular identification and phylogenetic studies in the large-scale clades such as East Asia clade and Acronema clade, where there are many parallel branches whose support rate is less than 50% using ITS or plastid DNA introns (rpl16 and rps16 genes) [8,9].

3. Materials and Methods

3.1. Material, DNA Extraction and Complete Genome Sequencing

The materials of Han. forbesii, Han. forrestii, Han. oviformis, Han. weberbaueriana, Hap. himalayensis, S. microloba, S. yunnanensis (EY) and S. yunnanensis (KM) were newly obtained for this study, which were collected from the type localities or their adjacent areas during 2018–2019 (Supplementary Table S1). The different populations of S. yunnanensis are represented by EY: from Eryuan County, Yunnan; KM: from Kunming, and Yunnan; HB: from Zhongdian, Yunnan (HB previously sequenced [19]). The total genomic DNA was extracted from silica gel-dried leaves according to the protocols of the plant genomic DNA kit (cwbio, Beijing, China), then sequenced using the Illumina Novaseq 6000 platform (Illumina, San Diego, CA, USA) with Novaseq 150 sequencing strategy by Novogene (Beijing, China).

3.2. Genome Construction and Annotation

The clean data (removed connectors and low-quality reads) were assembled using NOVOPlasty 2.7.1 [44] with K-mer 39, where the rbcL gene of Han. oviformis and S. yunnanensis (amplificated and sequenced beforehand) was used as a seed input and the reference sequence. The assembled complete plastid genomes were checked then aligned with the reference plastid genome of Chuanminshen violaceum (KU921430) using GENEIOUS R11 [45] to select the best option, which was then annotated using PGA [46]. GENEIOUS R11 was then used to manually adjust the annotation for uncertain start and stop codons based on the comparison with homologous genes from other annotated plastid genomes. The eight annotated plastid genomes were submitted to GenBank, and their accession numbers are in Supplementary Table S1. Their genome maps were drawn using OGDRAW version 1.3.1 [47].

3.3. Phylogenetic Analysis

To better infer phylogenetic relationships between Hansenia, Haplosphaera and Sinodielsia, the 32 plastid genomes were applied for reconstructing the phylogenetic tree, of which 24 plastid genomes were obtained from GenBank (Supplementary Table S1). All the plastid genomes were aligned using MAFFT v7.308 [48,49]. Maximum Likelihood was then conducted for phylogenetic analyses using RAxML version 8.2.4 [50] under the model GTR+G with 1000 rapid bootstraps. The scientific names of plants followed the International Plant Names Index (https://www.ipni.org). Chamaesium and Bupleurum species were selected as outgroups [8,9].

3.4. IRs Boundaries and SSR Analysis

The boundaries between the LSC, SSC and IR regions of the ten plastid genomes were compared and drawn using the online program: IRscope (https://irscope.shinyapps.io/irapp/) [51]. The SSRs were identified using MISA [52] with the repeat threshold settings: 10 repeats for mono-nucleotide, 5 for di-nucleotide, 4 for tri-nucleotide and 3 repeats for tetra-, penta-and hexanucleotide SSRs.

3.5. Codon Usage Bias Analysis

Codon usage bias analysis and calculation of RSCU values were conducted using the program CodonW [53]. Fifty-three PCGs (more than 300 bp in length) of each Hansenia, Haplosphaera and Sinodielsia plastid genomes were filtered. The codon adaptation index (CAI), the codon bias index (CBI), the effective number of codons (ENC), the frequency of optimal codons (Fop) and the GC content of the synonymous third codons positions (GC3s) were calculated to assess the extent of the codon usage bias. The RSCU values of the four Hansenia, two Haplosphaera and four Sinodielsia plastid genomes were also calculated to assess their codon usages, including Hap. phaea and S. yunnanensis (HB) downloaded from GenBank (Supplementary Table S1).

3.6. Nucleotide Diversity Analysis

The plastid genomes of Hansenia, Haplosphaera and Sinodielsia species were aligned using MAFFT v7.308 [48,49]. DNA polymorphism analysis was then conducted to calculate the Pi values in DnaSP v5 [54] in the sliding window. The setting parameters were as follows: (1) windows length: 600 sites; (2) step size: 200 sites.

4. Conclusions

In this study, the plastid genomes of Han. forbesii, Han. forrestii, Han. oviformis, Han. weberbaueriana, Hap. himalayensis, S. microloba, S. yunnanensis (KM) and S. yunnanensis (EY) were newly assembled and annotated. All the eight plastid genomes exhibited a typical circular quadripartite organization with similar whole length (155,435 bp to 157,797 bp) and gene contents. The IR boundary analysis showed that length of rps19 and ycf1 genes entering IRs are usually stable in the same genus. Hansenia shared relatively similar mononucleotide SSRs to Haplosphaera. Additionally, Hansenia, Haplosphaera and Sinodielsia species had similar codon usage. Although Hansenia and Haplosphaera are not phylogenetically close to Sinodielsia, there was no significant difference in their plastid genomes. Furthermore, we found that the ndhG-ndhI spacer regions possessed higher nucleotide diversity in the three genera and, therefore, may provide DNA barcodes for intra- and inter-genus identification in Apiaceae. The phylogeny of the 32 plastid genomes, including the eight taxa mentioned above, showed a close relationship between Hansenia and Haplosphaera, and S. microloba may be a species of hybrid origin. This study will enrich the complete plastid genome dataset of the genera Hansenia, Haplosphaera and Sinodielsia, and has provided a new insight into comparisons of distant taxa and phylogeny reconstruction using complete plastid genomes of Apiaceae.

Supplementary Materials

The following are available online at https://www.mdpi.com/2223-7747/9/11/1523/s1, Table S1: Voucher details and GenBank accession numbers of taxa used in this study, Table S2: The indexes of the codon usage bias in the Hansenia, Haplosphaera and Sinodielsia species.

Author Contributions

Conceptualization, W.G., S.-B.J., X.-L.G., S.-D.Z. and X.-J.H.; Data curation, W.G. and S.-B.J.; Formal analysis, W.G. and S.-B.J.; Funding acquisition, S.-D.Z. and X.-J.H.; Investigation, W.G. and S.-B.J.; Methodology, W.G. and S.-B.J.; Resources, W.G. and S.-B.J.; Software, W.G. and S.-B.J.; Supervision, S.-D.Z. and X.-J.H.; Writing-original draft, W.G. and S.-B.J.; Writing-review & editing, W.G., S.-B.J., M.P., X.-L.G., S.-D.Z. and X.-J.H. All authors have read and agreed to the published version of the manuscript.

Funding

This work was supported by the National Natural Science Foundation of China (Grant Nos. 31872647). The Chinese Ministry of Science and Technology throng the National Science and Technology Infrastructure Platform Project (Grant No. 2005DKA21403-JK). The fourth national survey of traditional Chinese medicine resources (Grant No. 2019PC002).

Acknowledgments

We would like to thank Yan Yu, Dan-Mei Su and Fu-Min Xie for the help in software use.

Conflicts of Interest

The authors declare no conflict of interest.

References

  1. Pu, F.D.; Watson, M.F. Apiaceae. In Flora of China; Science Press: Beijing, China; Missouri Botanical garden Press: Saint Louis, MO, USA, 2005; Volume 14, pp. 1–205. [Google Scholar]
  2. Pimenov, M.G.; Kljuykov, E.V.; Ostroumova, T.A. Reduction of Notopterygium to Hansenia (Umbelliferae). Willdenowia 2008, 38, 155–172. [Google Scholar] [CrossRef]
  3. Jia, S.B.; Guo, X.L.; Zhou, S.D.; He, X.J. Hansenia pinnatiinvolucellata is conspecific with H. weberbaueriana (Apiaceae) based on morphology and molecular data. Phytotaxa 2019, 418, 203–210. [Google Scholar] [CrossRef]
  4. Pimenov, M.G.; Kljuykov, E.V. New nomenclatural combinations for Chinese Umbelliferae. Feddes Repert. 1999, 110, 481–491. [Google Scholar] [CrossRef]
  5. Pimenov, M.G. Updated checklist of Chinese Umbelliferea: Nomenclature, synonymy, typification, distribution. Turcz 2017, 20, 106–239. [Google Scholar]
  6. Valiejo-Roman, C.M.; Terentieva, E.I.; Samigullin, T.H.; Pimenov, M.G. nrDNA ITS sequences and affinities of Sino-Himalayan Apioideae (Umbelliferae). Taxon 2002, 51, 685–701. [Google Scholar]
  7. Valiejo-Roman, C.M.; Shneyer, V.S.; Samigullin, T.H.; Terentieva, E.I.; Pimenov, M.G. An attempt to clarify taxonomic relationships in “Verwandtschaftskreis der Gattung Ligusticum” (Umbelliferae-Apioideae) by molecular analysis. Plant Syst. Evol. 2006, 257, 25–43. [Google Scholar] [CrossRef]
  8. Zhou, J.; Peng, H.; Downie, S.R.; Liu, Z.W.; Gong, X. A molecular phylogeny of Chinese Apiaceae subfamily Apioideae inferred from nuclear ribosomal DNA internal transcribed spacer sequences. Taxon 2008, 57, 402–416. [Google Scholar]
  9. Zhou, J.; Gong, X.; Downie, S.R.; Peng, H. Towards a more robust molecular phylogeny of Chinese Apiaceae subfamily Apioideae: Additional evidence from nrDNA ITS and cpDNA intron (rpl16 and rps16) sequences. Mol. Phylogenetics Evol. 2009, 53, 56–68. [Google Scholar] [CrossRef]
  10. Wang, Z.X.; Downie, S.R.; Tan, J.B.; Liao, C.Y.; Yu, Y.; He, X.J. Molecular phylogenetics of Pimpinella and allied genera (Apiaceae), with emphasis on Chinese native species, inferred from nrDNA ITS and cpDNA intron sequence data. Nord. J. Bot. 2014, 32, 642–657. [Google Scholar] [CrossRef]
  11. Liu, Z.W.; Zhou, J.; Gao, Y.z.; Wei, J.; Downie, S.R. Molecular phylogenetics of Ligusticum (Apiaceae) based on nrDNA ITS sequences: Placement of the Chinese endemic species and a reduced circumscription of the genus. Int. J. Plant Sci. 2019. [Google Scholar]
  12. Downie, S.R.; Palmer, J.D. Use of Chloroplast DNA Rearrangements in Reconstructing Plant Phylogeny; Molecular Systematics of Plants; Soltis, P.S., Soltis, D.E., Doyle, J.J., Eds.; Springer: Boston, MA, USA, 1992. [Google Scholar]
  13. Ravi, V.; Khurana, J.P.; Tyagi, A.K.; Khurana, P. An update on chloroplast genomes. Plant Syst. Evol. 2008, 271, 101–122. [Google Scholar] [CrossRef]
  14. Yu, X.L.; Tan, W.; Zhang, H.Y.; Gao, H.; Wang, W.X.; Tian, X.X. Complete chloroplast genomes of Ampelopsis humulifolia and Ampelopsis japonica: Molecular structure, comparative analysis, and phylogenetic analysis. Plants 2019, 8, 410. [Google Scholar] [CrossRef] [Green Version]
  15. Jansen, R.K.; Raubeson, L.A.; Boore, J.L.; Depamphilis, C.W.; Cui, L. Methods for Obtaining and Analyzing Whole Chloroplast Genome Sequences. Methods Enzymol. 2005, 395, 348–384. [Google Scholar] [PubMed]
  16. Korpelainen, H. The evolutionary processes of mitochondrial and chloroplast genomes differ from those of nuclear genomes. Sci. Nat. 2004, 91, 505–518. [Google Scholar] [CrossRef]
  17. Huotari, T.; Korpelainen, H. Complete chloroplast genome sequence of Elodea canadensis and comparative analyses with other monocot plastid genomes. Gene 2012, 508, 96–105. [Google Scholar] [CrossRef]
  18. Jia, S.B.; Guo, X.L.; Xie, D.F.; Yu, Y.; Zhou, S.D.; He, X.J. The complete chloroplast genome of Haplosphaera phaea (Apiaceae). Mitochondrial Dna B 2019, 4, 1969–1970. [Google Scholar] [CrossRef] [Green Version]
  19. Gou, W.; Guo, X.L.; Yu, Y.; Zhou, S.D.; He, X.J. The complete chloroplast genome of Meeboldia yunnanensis (Apiaceae). Mitochondrial Dna B 2019, 4, 4176–4177. [Google Scholar] [CrossRef] [Green Version]
  20. Wen, J.; Yu, Y.; Xie, D.F.; Peng, C.; Liu, Q.; Zhou, S.D.; He, X.J. A transcriptome-based study on the phylogeny and evolution for taxonomic controversial subfamily Apioideae (Apiaceae). Ann. Bot. 2020, 125, 937–953. [Google Scholar] [CrossRef]
  21. Zhang, Y.Z.; Ma, J.; Yang, B.X.; Li, R.Y.; Zhu, W.; Sun, L.L.; Tian, J.K.; Zhang, L. The complete chloroplast genome sequence of Taxus chinensis var. mairei (Taxaceae): Loss of an inverted repeat region and comparative analysis with related species. Gene 2014, 540, 201–209. [Google Scholar] [CrossRef]
  22. Guo, X.L.; Wang, C.B.; Wen, J.; Zhou, S.D.; He, X.J. Phylogeny of Chinese Chamaesium (Apiaceae: Apioideae) inferred from ITS, cpDNA and morphological characters. Phytotaxa 2018, 376, 1–16. [Google Scholar] [CrossRef]
  23. Xiao, Q.Y.; Yu, Y.; Xie, D.F.; Guo, X.L.; He, X.J. Taxonomic revision of Angelica oncosepala and Heracleum yunnanense. Nord. J. Bot. 2018, 36, 1–10. [Google Scholar]
  24. Guisinger, M.M.; Kuehl, J.V.; Boore, J.L.; Jansen, R.K. Extreme Reconfiguration of Plastid Genomes in the Angiosperm Family Geraniaceae: Rearrangements, Repeats, and Codon Usage. Mol. Biol. Evol. 2011, 28, 583–600. [Google Scholar] [CrossRef] [Green Version]
  25. Hu, Y.J. Chloroplast genome structure and chloroplast genes. Plant. Physiol. Commun. 1985, 2, 65–71. (In Chinese) [Google Scholar]
  26. Li, J.; Xie, D.F.; Guo, X.L.; Zheng, Z.Y.; He, X.J.; Zhou, S.D. Comparative Analysis of the Complete Plastid Genome of Five Bupleurum Species and New Insights into DNA Barcoding and Phylogenetic Relationship. Plants 2020, 9, 543. [Google Scholar] [CrossRef]
  27. Guo, X.L.; Zheng, H.Y.; Price, M.; Zhou, S.D.; He, X.J. Phylogeny and Comparative Analysis of Chinese Chamaesium Species Revealed by the Complete Plastid Genome. Plants 2020, 9, 965. [Google Scholar] [CrossRef]
  28. Mustafina, F.U.; Yi, D.K.; Choi, K.; Shin, C.H.; Tojibaev, K.S.; Downie, S.R. A comparative analysis of complete plastid genomes from Prangos fedtschenkoi and Prangos lipskyi (Apiaceae). Ecol. Evol. 2018, 1–14. [Google Scholar] [CrossRef]
  29. Kang, L.; Xie, D.F.; Xiao, Q.Y.; Peng, C.; Yu, Y.; He, X.J. Sequencing and analyses on chloroplast genomes of Tetrataenium candicans and two allies give new insights on structural variants, DNA barcoding and phylogeny in Apiaceae subfamily Apioideae. PeerJ 2019, 7, e8063. [Google Scholar] [CrossRef] [Green Version]
  30. Peery, R.M. Understanding Angiosperm Genome Interactions and Evolution: Insights from Sacred Lotus (Nelumbo nucifera) and the Carrot Family (Apiaceae). Ph.D. Thesis, University of Illinois at Urbana-Champaign, Champaign, IL, USA, 2015. [Google Scholar]
  31. Aii, J.; Kishima, Y.; Mikami, T.; Adachi, T. Expansion of the IR in the chloroplast genomes of buckwheat species is due to incorporation of an SSC sequence that could be mediated by an inversion. Curr. Genet. 1997, 31, 276–279. [Google Scholar] [CrossRef]
  32. Chung, H.J.; Jung, J.D.; Park, H.W.; Kim, J.H.; Cha, H.W. The complete chloroplast genome sequences of Solanum tuberosum and comparative analysis with Solanaceae species identified the presence of a 241-bp deletion in cultivated potato chloroplast DNA sequence. Plant Cell Rep. 2006, 25, 1369–1379. [Google Scholar] [CrossRef]
  33. Wang, W.B.; Yu, H.; Wang, J.H.; Lei, W.J.; Gao, J.H.; Qiu, X.P.; Wang, J.S. The complete chloroplast genome sequences of the medicinal plant Forsythia suspensa (Oleaceae). Int. J. Mol. Sci. 2017, 18, 2288. [Google Scholar] [CrossRef] [PubMed] [Green Version]
  34. Asaf, S.; Khan, A.L.; Khan, A.R.; Waqas, M.; Kang, S.M.; Khan, M.A.; Lee, S.M.; Lee, I.J. Complete chloroplast genome of Nicotiana otophora and its comparison with related species. Front. Plant. Sci. 2016, 7, 447. [Google Scholar] [CrossRef] [Green Version]
  35. Sharp, P.M. An evolutionary perspective on synopnymous codon usage in unicellular organisms. J. Mol. Evol. 1986, 24, 28–38. [Google Scholar]
  36. Du, Y.; Bi, Y.; Chen, X.; Yang, F.; Xue, J.; Zhang, X. The complete chloroplast genome of Lilium cernuum: Genome structure and evolution. Conserv. Genet. Resour. 2016, 8, 375–378. [Google Scholar] [CrossRef]
  37. Grantham, R.; Gautier, C.; Gouy, M. Codon frequencies in 119 individual genes confirm consistent choices of degenerate bases according to genome type. Nucleic Acids Res. 1980, 8, 1893–1912. [Google Scholar] [CrossRef]
  38. Rao, Y.S.; Wu, G.Z.; Wang, Z.F.; Chai, X.W.; Nie, Q.H.; Zhang, X.Q. Mutation Bias is the Driving Force of Codon Usage in the genome. DNA Res. 2011, 18, 499–512. [Google Scholar] [CrossRef] [Green Version]
  39. Rensing, S.A.; Fritzowsky, D.; Lang, D.; Reski, R. Protein encoding genes in an ancient plant: Analysis of codon usage, retained genes and splice sites in a moss, Physcomitrella patens. BMC Genom. 2005, 6, 43. [Google Scholar] [CrossRef] [PubMed] [Green Version]
  40. Novoa, E.M.; Pouplana, L.R.D. Speeding with control: Codon usage, TRNAs, and ribosomes. Trends Genet. 2012, 28, 574–581. [Google Scholar] [CrossRef]
  41. Harrison, R.J.; Charlesworth, B. Biased Gene Conversion Affects Patterns of Codon Usage and Amino Acid Usage in the Saccharomyces sensu stricto Group of Yeasts. Mol. Biol. Evol. 2011, 28, 117–129. [Google Scholar] [CrossRef] [Green Version]
  42. Clark, A.; Eisen, M.; Smith, D.; Singh, N.D.; Sackton, T.B.; Larracuente, A.M.; Bergman, C.M.; Gelbart, W.M.; Oliver, B.; Markow, T.A.; et al. Evolution of genes and genomes on the Drosophila phylogeny. Nature 2007, 450, 203–218. [Google Scholar]
  43. Bulmer, M.G. The selection-mutation-drift theory of synonymous codon usage. Genetics 1991, 129, 897–907. [Google Scholar]
  44. Dierckxsens, N.; Mardulyn, P.; Smits, G. NOVOPlasty: De novo assembly of organelle genomes from whole genome data. Nucleic Acids Res. 2017, 4, 4. [Google Scholar]
  45. Kearse, M.; Moir, R.; Wilson, A.; Stones-Havas, S.; Cheung, M.; Sturrock, S.; Buxton, S.; Cooper, A.; Markowitz, S.; Duran, C.; et al. Geneious Basic: An integrated and extendable desktop software platform for the organization and analysis of sequence data. Bioinformatics 2012, 28, 1647–1649. [Google Scholar] [CrossRef]
  46. Qu, X.J.; Moore, M.J.; Li, D.Z.; Yi, T.S. PGA: A software package for rapid, accurate, and flexible batch annotation of plastomes. Plant Methods 2019, 15, 50. [Google Scholar] [CrossRef] [Green Version]
  47. Greiner, S.; Lehwark, P.; Bock, R. OrganellarGenomeDRAW (OGDRAW) version 1.3.1: Expanded toolkit for the graphical visualization of organellar genomes. Nucleic Acids Res. 2019, 47, 59–64. [Google Scholar] [CrossRef] [Green Version]
  48. Amiryousefi, A.; Hyvönen, J.; Poczai, P. Irscope: An online program to visualize the junction sites of chloroplast genomes. Bioinformatics 2018, 34, 3030–3031. [Google Scholar] [CrossRef] [PubMed]
  49. Thiel, T.; Michalek, W.; Varshney, R.; Graner, A. Exploiting est databases for the development and characterization of gene-derived ssr-markers in barley (hordeum vulgarel.). Theor. Appl. Genet. 2003, 106, 411–422. [Google Scholar] [CrossRef]
  50. Peden, J.F. CodonW. Ph.D. Thesis, University of Nottingham, Nottinghamshire, UK, 1999. [Google Scholar]
  51. Katoh, K.; Misawa, K.; Kuma, K.i.; Miyata, T. MAFFT: A novel method for rapid multiple sequence alignment based on fast Fourier transform. Nucleic Acids Res. 2002, 30, 3059–3066. [Google Scholar] [CrossRef] [Green Version]
  52. Katoh, K.; Standley, D.M. MAFFT Multiple Sequence Alignment Software Version 7: Improvements in Performance and Usability. Mol. Phylogenet. Evol. 2013, 30, 772–780. [Google Scholar] [CrossRef] [Green Version]
  53. Librado, P.; Rozas, J. DnaSP v5: A software for comprehensive analysis of DNA polymorphism data. Bioinformatics 2009, 25, 1451–1452. [Google Scholar] [CrossRef] [PubMed] [Green Version]
  54. Stamatakis, A. RAxML version 8: A tool for phylogenetic analysis and post-analysis of large phylogenies. Bioinformatics 2014, 30, 1312–1313. [Google Scholar] [CrossRef]
Figure 1. Plants of Hansenia, Haplosphaera and Sinodielsia. (A) Han. forbesii, (B) Han. forrestii, (C) Han. oviformis, (D) Han. weberbaueriana, (E) Hap. himalayensis, (F) Hap. phaea, (G) S. microloba and (H) S. yunnanensis.
Plants 09 01523 g001
Figure 2. Maximum Likelihood (ML) phylogenetic tree of Apiaceae using the 32 plastid genomes dataset. The studied taxa are bold. The numbers above the nodes are Maximum Likelihood-Bootstrap Support (ML-BS) presented as percentages (>50%). The names of the clades follow the study of Zhou et al. [8,9].
Plants 09 01523 g002
Figure 3. Plastid genome map of eight Hansenia, Haplosphaera and Sinodielsia species (for a better view, these eight maps were combined into one derived from the map of H. forbesii because they have the same order and composition of genes). The genes shown inside and outside of the circle indicate those transcribed in the clockwise and counterclockwise direction, respectively. Genes of different functional groups are colored differently. The GC contents are shown in the inner circle with darker grey.
Plants 09 01523 g003
Figure 4. Comparisons of inverted repeat (IR) boundaries between ten Hansenia, Haplosphaera and Sinodielsia plastid genomes.
Plants 09 01523 g004
Figure 5. Frequency of detected simple sequence repeat (SSR) motifs in different repeat types in ten Hansenia, Haplosphaera and Sinodielsia plastid genomes.
Plants 09 01523 g005
Figure 6. Frequency of detected SSR motifs in LSC (blue), IR (orange) and SSC (green) regions of the ten Hansenia, Haplosphaera and Sinodielsia plastid genomes.
Plants 09 01523 g006
Figure 7. Codon content of 20 amino acids and the stop codon present in all 53 studied protein-coding genes (PCGs) of the (A) Hansenia, (B) Haplosphaera and (C) Sinodielsia plastid genome. Different colors of the histogram correspond to the different codons below.
Plants 09 01523 g007
Figure 8. The nucleotide diversity of (A) the four Hansenia, (B) the two Haplosphaera and (C) the four Sinodielsia plastid genomes. The positions of 0.02 in all three graphs were marked by a line. Ten or seven regions with the highest Pi values were named out.
Plants 09 01523 g008
Table 1. The features of plastid genomes of eight Hansenia, Haplosphaera and Sinodielsia species (IRs: inverted repeats; LSC: large single-copy region; SSC: small single-copy region).
TaxaSize (bp)LSC Length (bp)IR Length (bp)SSC Length (bp)Total GenesProtein Coding GenestRNA GenesrRNA GenesOverall GC Content (%)
Hansenia forbesii157,79786,96826,51717,7951318537837.6
Hansenia forrestii156,91186,24526,43517,7961318537837.6
Hansenia oviformis157,17586,41226,49417,7751318537837.6
Hansenia weberbaueriana156,77886,24626,43217,6681318537837.7
Haplosphaera himalayensis157,28686,47926,54217,7231318537837.6
Haplosphaera phaea157,27186,48826,44617,8911318537837.6
Sinodielsia microloba155,70985,32026,47917,4311318537837.5
Sinodielsia yunnanensis (EY)155,55285,27626,44117,3941318537837.6
Sinodielsia yunnanensis (HB)154,67084,44626,42717,3701318537837.6
Sinodielsia yunnanensis (KM)155,43585,23326,40417,3941318537837.5
Table 2. List of genes encoded in the ten Hansenia, Haplosphaera and Sinodielsia plastid genomes.
CategoryGroup of GenesName of Genes
Self-replicationtransfer RNAs (tRNAs)trnA-UGC *, trnC-GCA, trnD-GUC, trnE-UUC, trnF-GAA, trnfM-CAU, trnG-GCC, trnG-UCC, trnH-GUG, trnI-CAU *, trnI-GAU *, trnK-UUU, trnL-CAA *, trnL-UAA, trnL-UAG, trnM-CAU, trnN-GUU *, trnP-UGG, trnQ-UUG, trnR-ACG *, trnR-UCU, trnS-GCU, trnS-GGA, trnS-UGA, trnT-GGU, trnT-UGU, trnV-GAC *, trnV-UAC, trnW-CCA, trnY-GUA
ribosomal RNAs (rRNAs)rrn4.5 *, rrna5 *, rrn16 *, rrn23 *
RNA polymeraserpoA, rpoB, rpoC1, rpoC2
Small subunit of ribosomal proteins (SSU)rps2, rps3, rps4, rps7 *, rps8, rps11, rps12, rps14, rps15, rps16, rps18, rps19 *
Large subunit of ribosomal proteins (LSU)rpl2 *, rpl14, rpl16, rpl20, rpl22, rpl23 *, rpl32, rpl33, rpl36
Genes involved in photosynthesisSubunits of NADH-dehydrogenasendhA, ndhB *, ndhC, ndhD, ndhE, ndhF, ndhG, ndhH, ndhI, ndhJ, ndhK
Subunits in photosystem IpsaA, psaB, psaC, psaI, psaJ
Subunits in photosystem IIpsbA, psbB, psbC, psbD, psbE, psbF, psbH, psbI, psbJ, psbK, psbL, psbM, psbN, psbT, psbZ
Subunits of cytochrome b/f complexpetA, petB, petD, petG, petL, petN
Subunits of ATP synthaseatpA, atpB, atpE, atpF, atpH, atpI
Large subunit of rubiscorbcL
Other genesTranslational initiation factorinfA
ProteaseclpP
MaturasematK
Subunit of Acetyl-CoA-carboxylaseaccD
Envelope membrane proteincemA
C-type cytochrome synthesis geneccsA
Conserved reading framesConserved open reading framesψrps19, ycf1 * (ycf1, ψycf1), ycf2 *, ycf3, ycf4, ψycf15
* Duplicated genes.
Publisher’s Note: MDPI stays neutral with regard to jurisdictional claims in published maps and institutional affiliations.

