The Influence of Soil Acidity on the Physiological Responses of Two Bread Wheat Cultivars


Abstract
1. Introduction
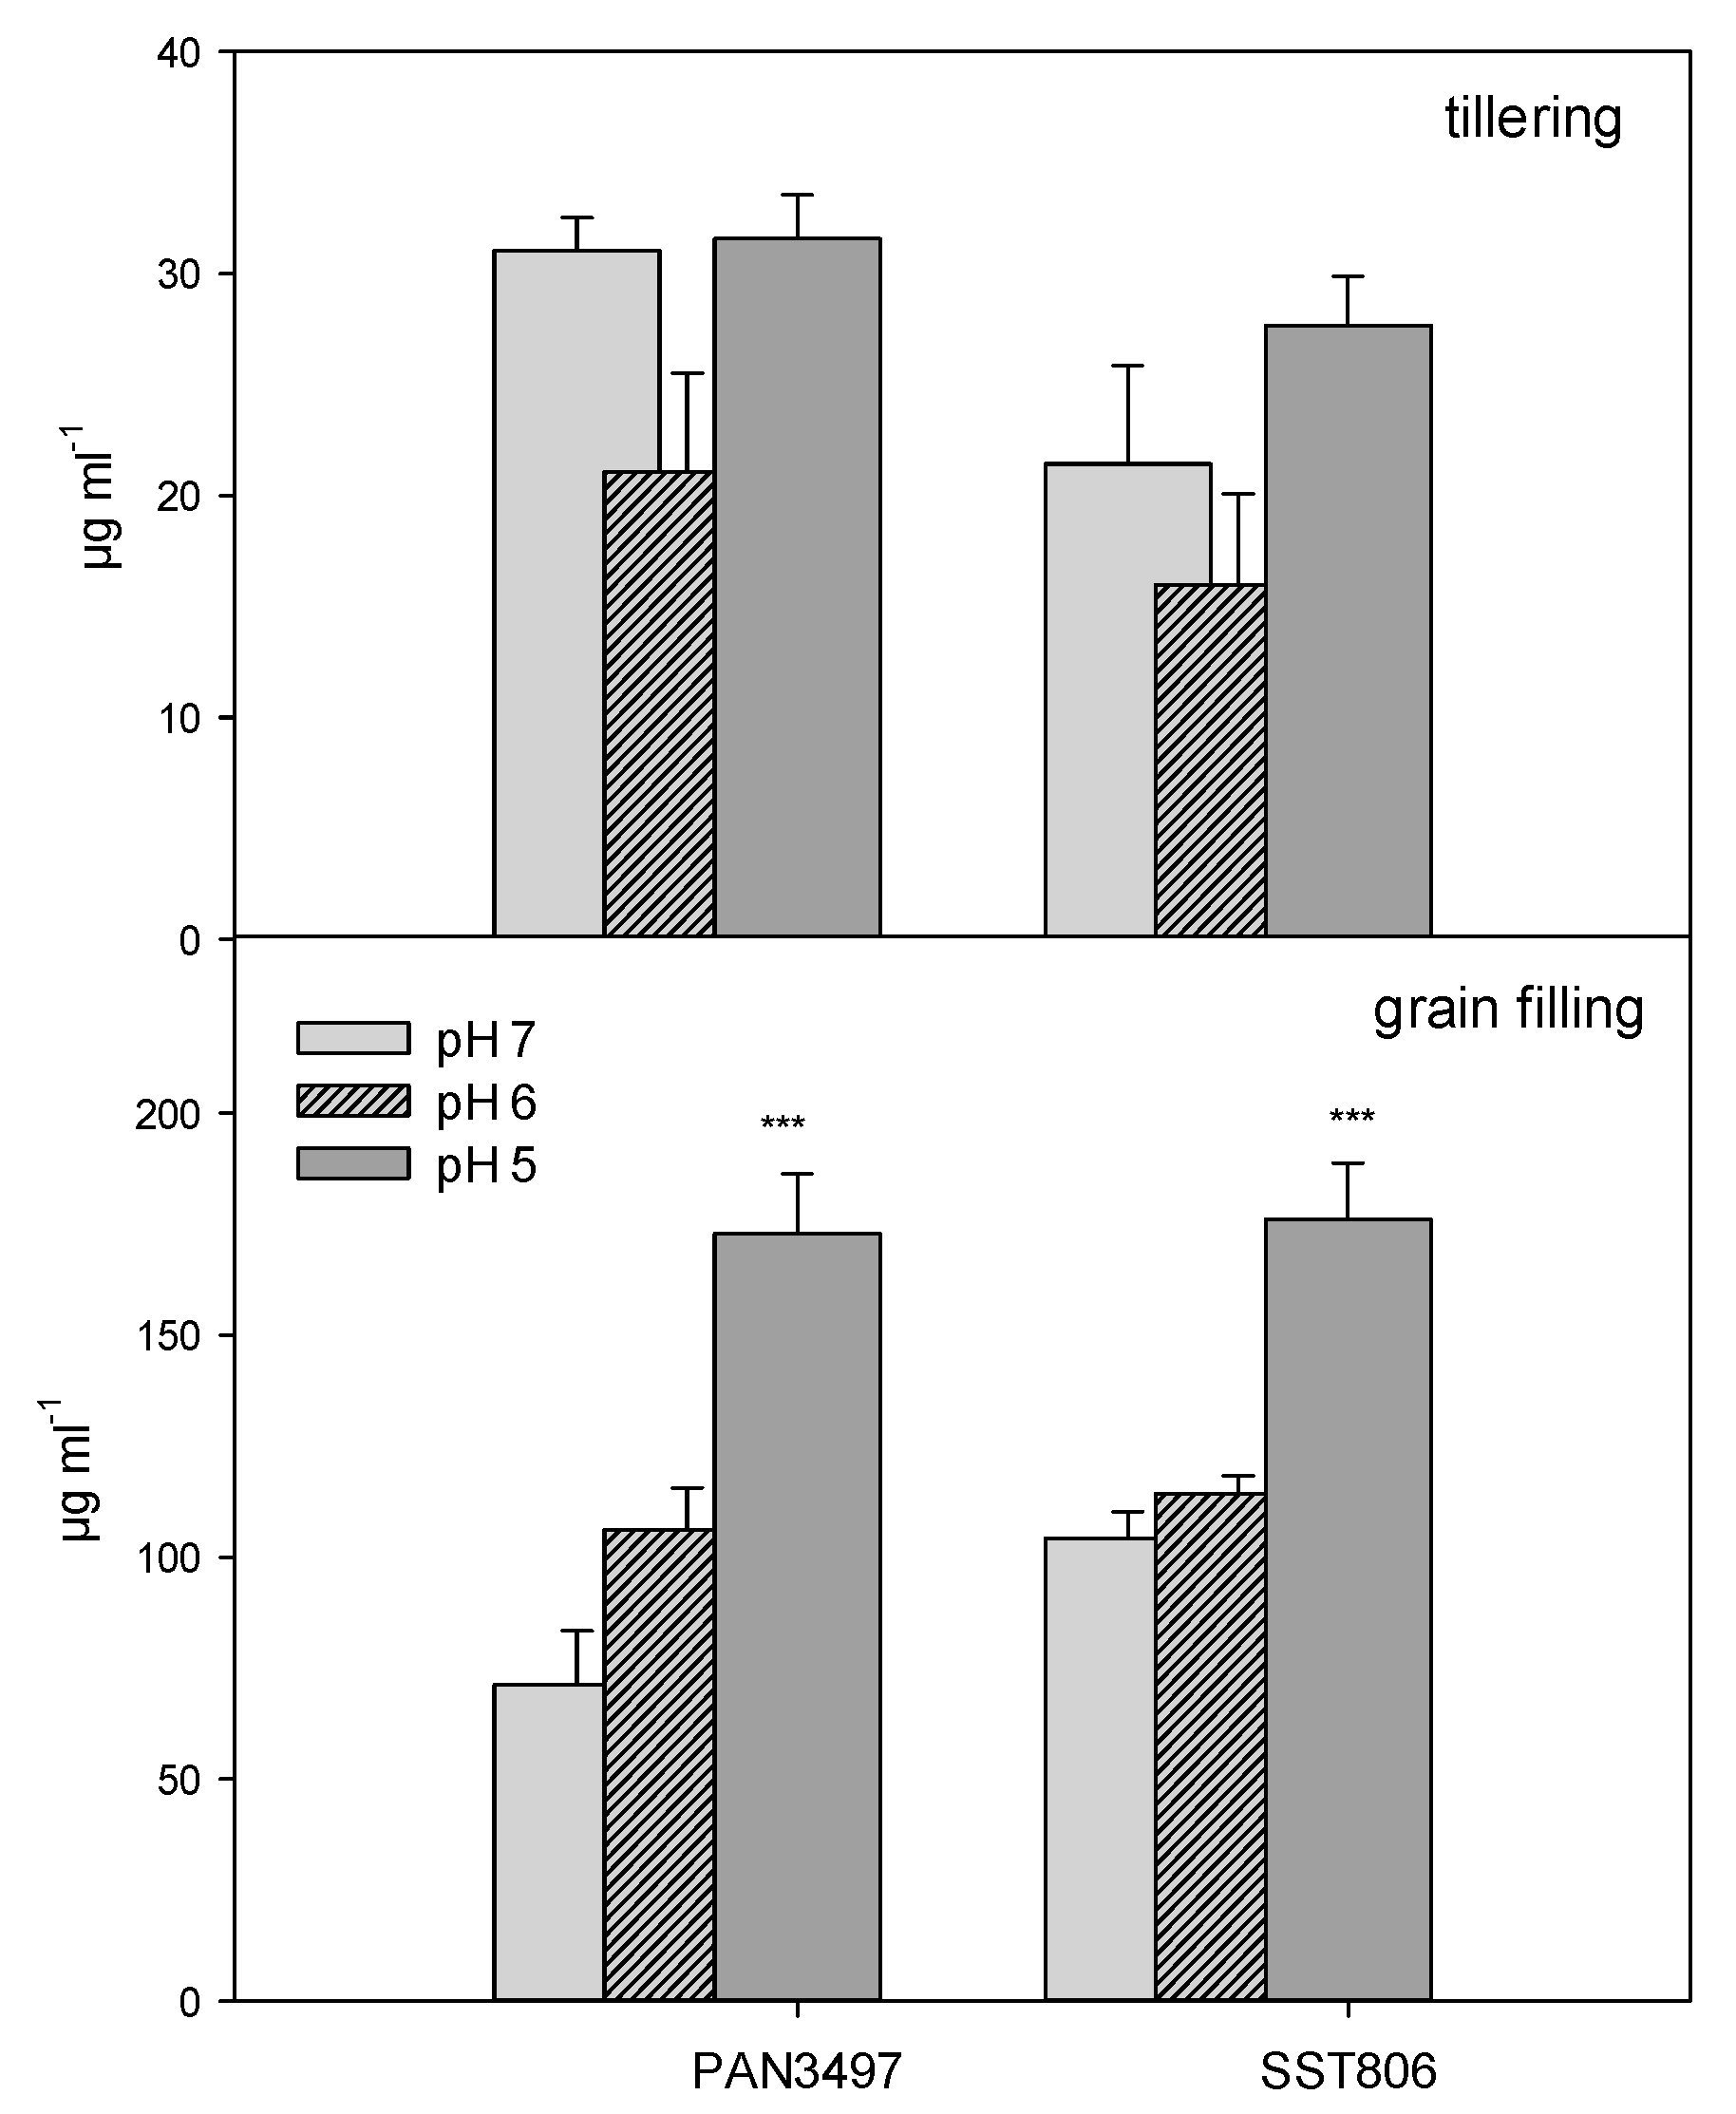
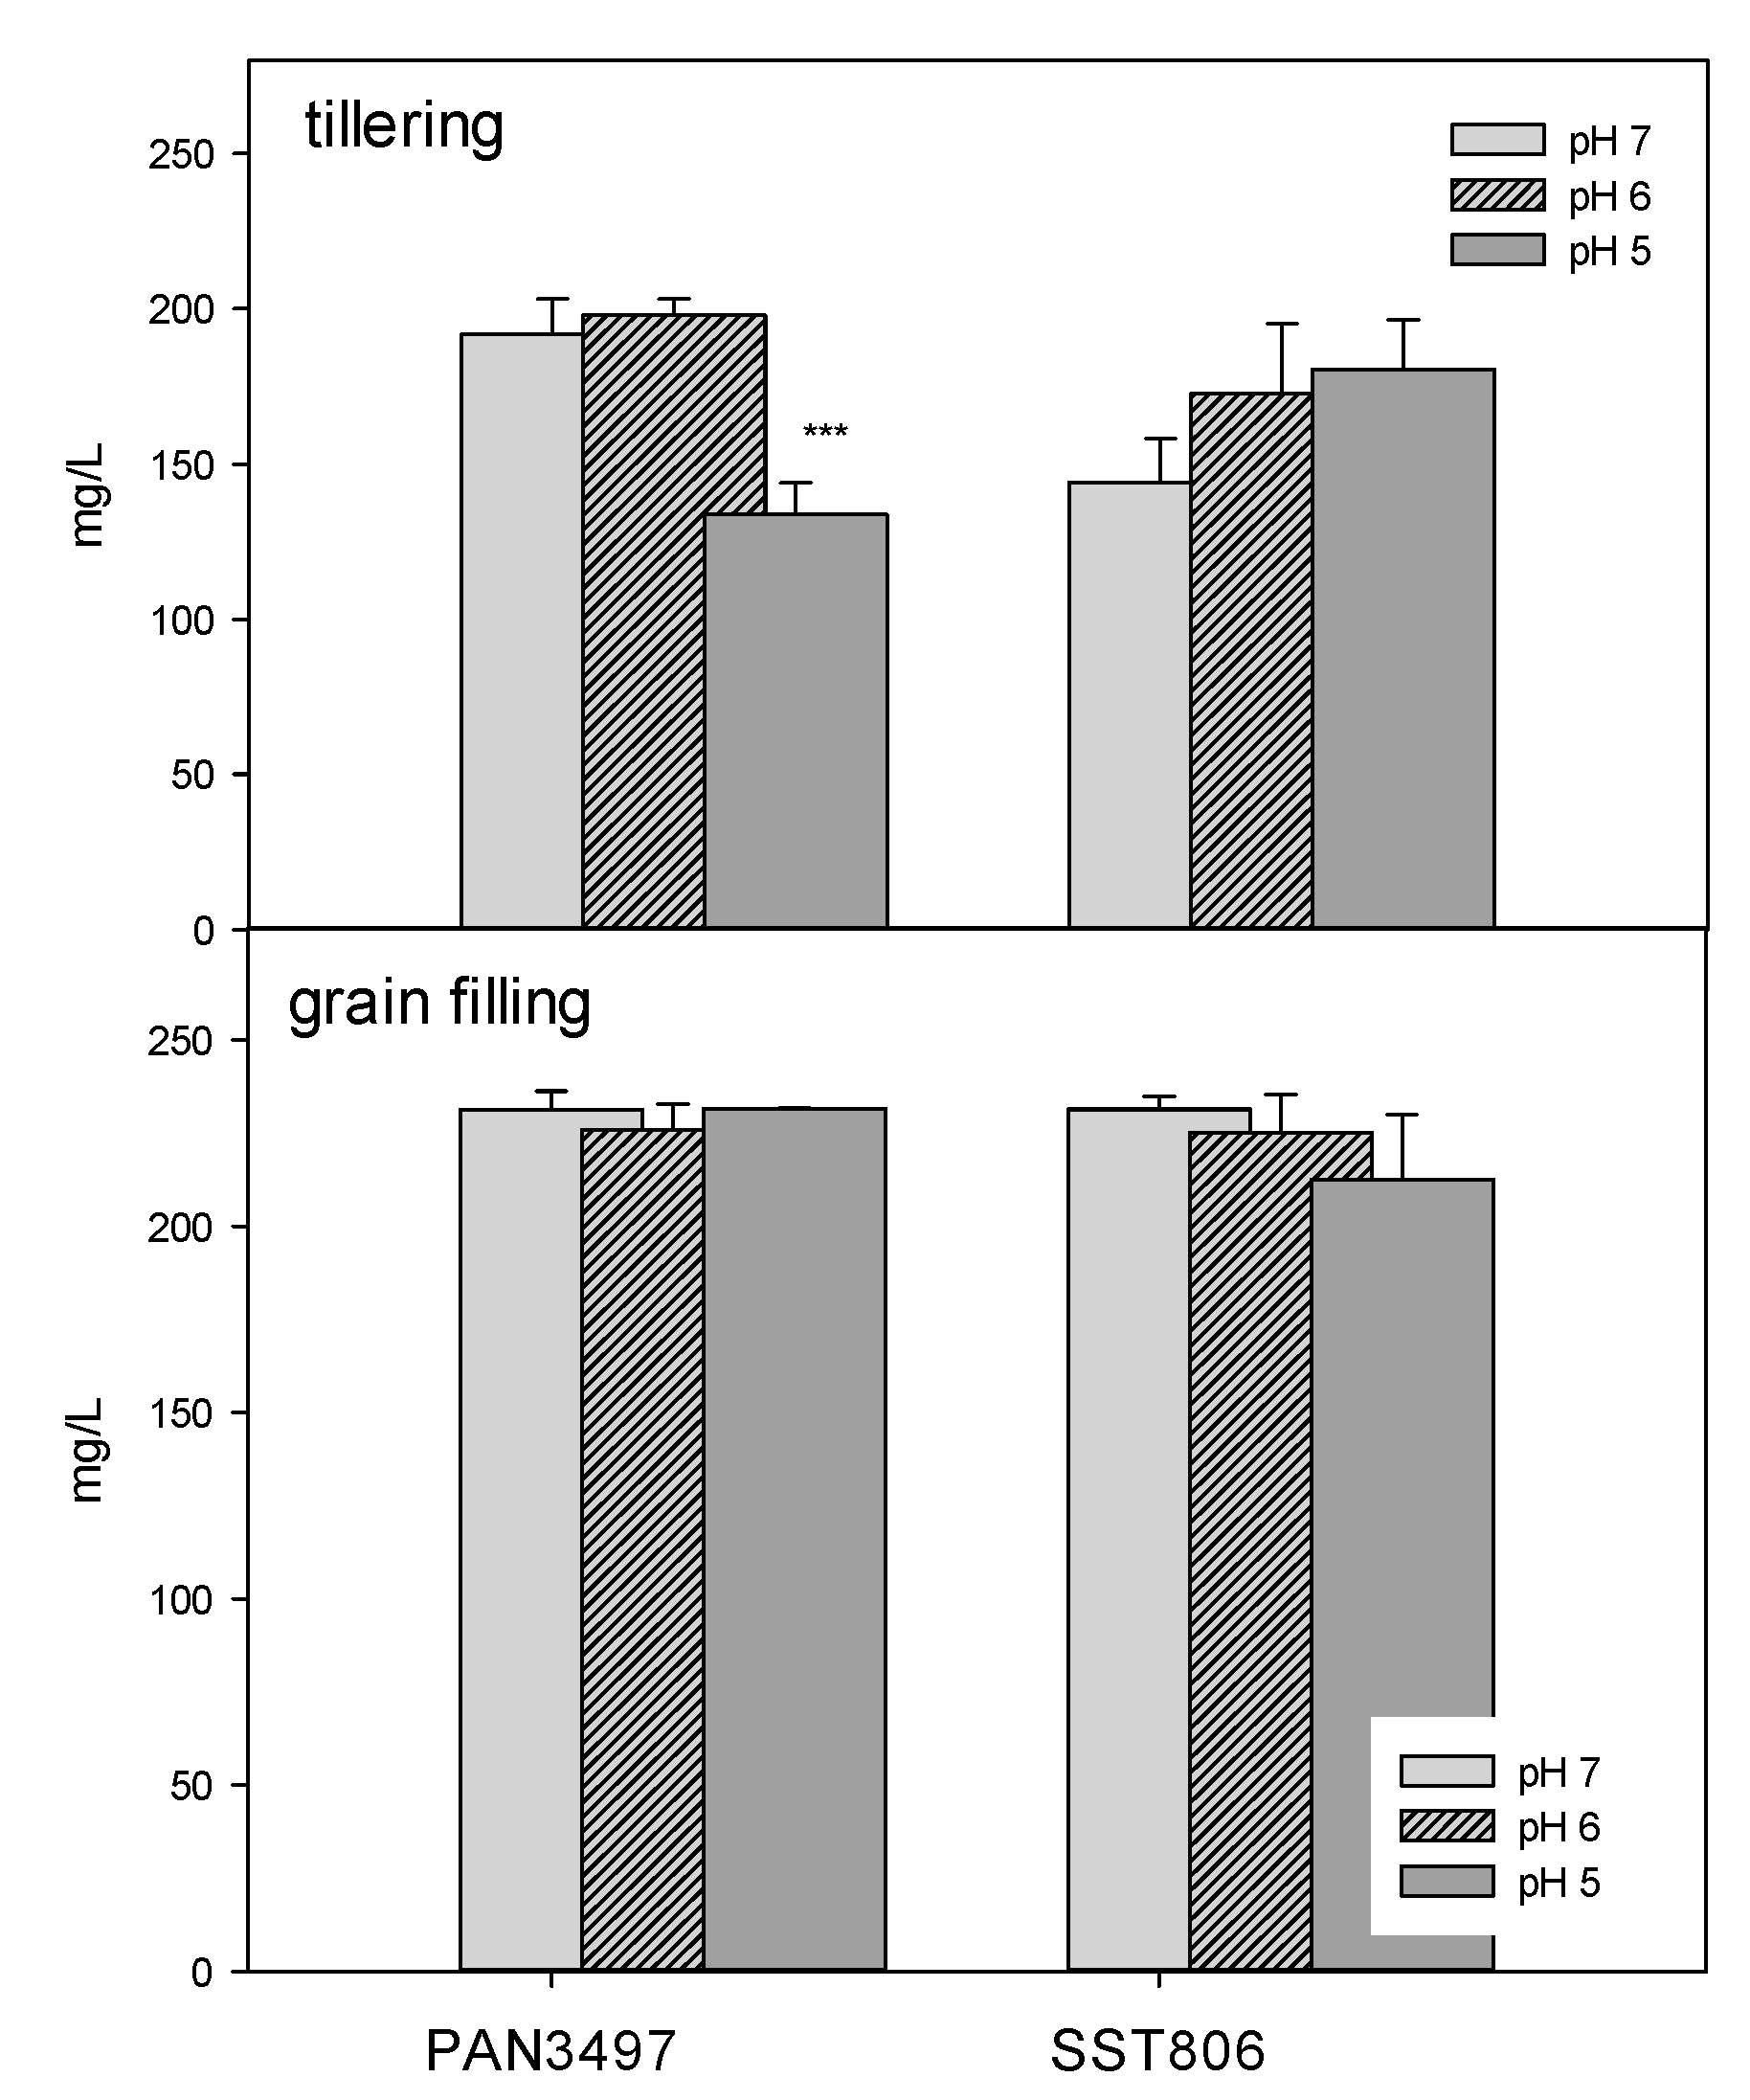
2. Results
3. Discussion
4. Materials and Methods
4.1. Green House Trial
4.2. Treatments
4.3. Sampling
4.4. Enzymes Assays
4.5. Statistical Analysis
Author Contributions
Funding
Acknowledgments
Conflicts of Interest
References
- Arraiza, M.P.; Santamarta, J.C.; Ioras, F.; García-Rodríguez, J.L.; Abrudan, I.V.; Korjas, H.; Borála, G. (Eds.) Climate Change and Restoration of Degraded Land; Colegio de Ingenieros de Montes: Madrid, Spain, 2014. [Google Scholar]
- Schoenholtz, S.; Miegroet, H.V.; Burger, J. A review of chemical and physiological properties as indicators of forest soil quality. Challenges and opportunities. Ecol. Manag. 2000, 138, 335–356. [Google Scholar]
- Von Uexkull, H.R.; Mutert, E. Global extent, development and economic impact of acid soils. Plant Soil 1995, 171, 1–15. [Google Scholar] [CrossRef]
- Venter, A.; Herselman, J.E.; VanderMerwe, G.M.E.; Steyn, C.; Beukes, D.J. Developing soil acidity maps for South Africa. In Proceedings of the 5th International Symposium on Soil Plant Interactions at Low pH, Bergville, South Africa, 12–16 March 2001; p. 21. [Google Scholar]
- Roberts, V.G.; Smeda, Z. The distribution of soil fertility constraints in KwaZulu-Natal, South Africa. In Proceedings of the 5th International Symposium on Plant Soil Interactions at low pH, Bergville, South Africa, 12–16 March 2001; p. 12. [Google Scholar]
- Dewi-Hayati, P.K.; Sutoyo, A.; Syarif, A.; Prasetyo, T. Performance of maize single-cross hybrids evaluated on acidic soils. Int. J. Adv. Sci. Eng. Inf. Technol. 2014, 4, 30–33. [Google Scholar]
- Koyama, H.; Toda, T.; Hara, T. Brief exposure to low-pH stress causes irreversible damage to the growing root in Arabidopsis thaliana: Pectin-Ca interaction may play an important role in proton rhizotoxicity. J. Exp. Bot. 2001, 52, 361–368. [Google Scholar] [PubMed]
- Ghiimire, R.; Machado, S.; Bista, P. Soil pH, soil organic matter, and crop yields in winter wheat-summer fallow systems. Agron. J. 2017, 109, 707–717. [Google Scholar] [CrossRef]
- Anderson, G.; Bell, R. Wheat grain-yield response to lime application: Relationships with soil pH and aluminium in Western Australia. Crop Pasture Sci. 2019, 70, 295–305. [Google Scholar] [CrossRef]
- Long, A.; Zhang, J.; Yang, L.T.; Ye, X.; Lai, N.W.; Tan, L.L.; Lin, D.; Chen, L.S. Effects of low pH on photosynthesis, related physiological parameters and nutrient profile of Citrus. Front. Plant Sci. 2017, 8, 185. [Google Scholar] [CrossRef]
- Schroeder, J.L.; Zhang, H.; Girma, K.; Raun, W.R.; Penn, C.J. Soil acidification from long-term use of nitrogen fertilizers on winter wheat. Soil Sci. Soc. Am. J. 2011, 75, 957–964. [Google Scholar] [CrossRef]
- Tian, D.; Niu, S. A global analysis of soil acidification caused by nitrogen addition. Environ. Res. Lett. 2015, 10, 024019. [Google Scholar] [CrossRef]
- Oertel, C.; Matschullat, J.; Zurba, K.; Zimmermann, F.; Erasmi, S. Greenhouse gas emissions from soils—A review. Geochemistry 2016, 76, 327–352. [Google Scholar] [CrossRef]
- Bini, C.; Breslin, F. Soil acidification by acid rain in forest ecosystems: A case study in northern Italy. Sci. Total Environ. 1998, 222, 1–15. [Google Scholar] [CrossRef]
- Russell, A.E.; Laird, D.A.; Mallarino, A.P. Nitrogen fertilizer and cropping system impacts on soil quality in mid-western Mollisols. Soil Sci. Soc. Am. J. 2006, 70, 249–255. [Google Scholar]
- Matsumoto, S.; Ogata, S.; Shimada, H.; Sasaoka, T.; Hamanaka, A.; Kusuma, G.J. Effects of pH-induced changes in soil physical characteristics on the development of soil water erosion. Geoscience 2018, 8, 134. [Google Scholar] [CrossRef]
- Meda, A.R.; Cassidato, M.E.; Pavan, M.A.; Miyazawa, M. Alleviating soil acidity through plant organic compounds. Braz. Arch. Biol. Technol. 2001, 44, 185–189. [Google Scholar] [CrossRef]
- Blake, L.; Goulding, K.W.T.; Mott, C.J.B.; Johnston, A.E. Changes in soil chemistry accompanying acidification over more than 100 years under woodland and grass at Rothamsted Experimental Station, UK. Eur. J. Soil Sci. 1999, 50, 401–412. [Google Scholar] [CrossRef]
- Robles-Aguilar, A.A.; Pang, J.; Postma, J.A.; Schrey, S.D.; Lambers, H.; Jablonowski, N.D. The effect of pH on morphological and physiological root traits of Lupinus angustifolius treated with struvite as a recycled phosphorus source. Plant Soil 2019, 434, 65–78. [Google Scholar] [CrossRef]
- Song, H.; Xu, X.; Wang, H.; Tao, Y. Protein carbonylation in barley seedling roots caused by aluminum and proton toxicity is suppressed by salicylic acid. Russ. J. Plant Physiol. 2011, 58, 653–659. [Google Scholar] [CrossRef]
- Sharma, P.; Jha, A.B.; Dubey, R.S.; Pessarakli, M. Reactive oxygen species, oxidative damage, and antioxidative defence mechanisms in plants under stressful conditions. J. Bot. 2012, 217037. [Google Scholar] [CrossRef]
- Zhang, Y.K.; Zhu, D.F.; Zhang, Y.P.; Chen, H.Z.; Xiang, J.; Lin, X.Q. Low pH-induced changes of antioxidant enzyme and ATPase activities in the roots of rice (Oryza sativa L.) seedlings. PLoS ONE 2015, 10, e0116971. [Google Scholar] [CrossRef]
- Martins, N.; Gonçalves, S.; Romano, A. Metabolism and aluminum accumulation in Plantago almogravensis and P. algarbiensis in response to low pH and aluminum stress. Biol. Plant. 2013, 57, 325–331. [Google Scholar] [CrossRef]
- Yang, M.; Huang, S.X.; Fang, S.Z.; Huang, X.L. Response of seedling growth of four Eucalyptus clones to acid and aluminum stress. Plant Nutr. Fertil. Sci. 2011, 17, 195–201. [Google Scholar]
- Martins, N.; Osório, M.L.; Gonçalves, S.; Osório, J.; Romano, A. Differences in Al tolerance between Plantago algarbiensis and P. almogravensis reflect their ability to respond to oxidative stress. Biometals 2013, 26, 427–437. [Google Scholar] [CrossRef] [PubMed]
- Liu, E.U.; Liu, C.P. Effects of simulated acid rain on the antioxidative system in Cinnamomum philippinense seedlings. Water Air Soil Poll. 2011, 215, 127–135. [Google Scholar] [CrossRef]
- Chen, J.; Wang, W.H.; Liu, T.W.; Wu, F.H.; Zheng, H.L. Photosynthetic and antioxidant responses of Liquidambar formosana and Schima superba seedlings to sulfuric-rich and nitric-rich simulated acid rain. Plant Physiol. Biochem. 2013, 64, 41–51. [Google Scholar] [CrossRef] [PubMed]
- Shi, Q.H.; Zhu, Z.J.; Juan, L.I.; Qian, Q.Q. Combined effects of excess Mn and low pH on oxidative stress and antioxidant enzymes in cucumber roots. Agric. Sci. China 2006, 5, 767–772. [Google Scholar] [CrossRef]
- Long, A.; Huang, W.L.; Qi, Y.P.; Yang, L.T.; Lai, N.W.M.; Guo, J.X.; Chen, L.S. 2019. Low pH effects on reactive oxygen species and methylglyoxal metabolisms in citrus roots and leaves. BMC Plant Biol. 2019, 19, 477. [Google Scholar] [CrossRef]
- Martins, N.; Gonçalves, S.; Palma, T.; Romano, A. The influence of low pH on in vitro growth and biochemical parameters of Plantago almogravensis and P. algarbiensis. Plant Cell Tissue Organ Cult. 2011, 107, 113–121. [Google Scholar] [CrossRef]
- Hasanuzzaman, M.; Nahar, K.; Hossain, M.S.; Mahmud, J.A.; Rahman, A.; Inafuku, M.; Oku, H.; Fujita, M. Coordinated actions of glyoxalase and antioxidant defense systems in conferring abiotic stress tolerance in plants. Int. J. Mol. Sci. 2017, 18, 200. [Google Scholar] [CrossRef]
- Bhuyan, M.H.M.B.; Hasanuzzaman, M.; Mahmud, J.A.; Hossain, S.; Bhuiyan, T.F.; Fujita, M. Unraveling morphophysiological and biochemical responses of Triticum aestivum L. to extreme pH: Coordinated actions of antioxidant defence and glyoxalase systems. Plants 2018, 8, 24. [Google Scholar] [CrossRef]
- Hou, Y.; Guo, Z.; Yi, Y.; Li, H.-N.; Li, H.-G.; Chen, L.; Ma, H.; Zhang, L.; Lin, J.W.; Zhong, M. Effects of cold acclimation and exogenous phytohormones abscisic acid treatment on physiological indicators of winterness wheat. J. Plant Sci. 2010, 5, 125–136. [Google Scholar]
- Turhan, A.; Ozmen, N.; Kuscu, H.; Serbeci, S.M.; Seniz, V. Influence of rootstocks on yield and fruits characteristics and quality of watermelon. Hortic. Environ. Biotechnol. 2012, 53, 336–341. [Google Scholar] [CrossRef]
- Firscher, R.A. Number of kernels in wheat crops and the influence of solar radiation and temperature. J. Agric. Sci. 1985, 105, 447–461. [Google Scholar] [CrossRef]
- Dreccer, M.F.; Fainges, J.; Whish, J.; Ogbonnaya, F.C. Comparison of sensitive stages of wheat, barley, canola, chickpea and field pea to temperature and water stress across Australia. Agric. For. Meteorol. 2018, 248, 275–294. [Google Scholar] [CrossRef]
- Nikolaeva, M.K.; Maevskaya, S.N.; Shugaev, A.G.; Bukhov, N.G. Effect of drought on chlorophyll content and antioxidant enzyme activities in leaves of three wheat cultivars varying in productivity. Russ. J. Plant. Physiol. 2010, 57, 87–95. [Google Scholar] [CrossRef]
- Verbruggen, N.; Hermans, C. Proline accumulation in plants: A review. Amino Acids 2008, 35, 753–759. [Google Scholar] [CrossRef]
- Hayat, S.; Hayat, Q.; Alyemeni, M.N.; Wani, A.S.; Pichtel, J.; Ahmad, A. Role of proline under changing environments. Plant Signal. Behav. 2012, 7, 1–11. [Google Scholar] [CrossRef] [PubMed]
- Ogagaoghene, A.J. pH level, ascorbic acid, proline and soluble sugar as bio-indicators for pollution. Chem. Search J. 2017, 8, 41–49. [Google Scholar]
- Naing, A.H.; Lee, D.B.; Ai, T.N.; Lim, K.B.; Kim, C.K. Enhancement of low pH stress tolerance in anthocyanin-enriched transgenetic Petunia overexpressing RsMYB1 gene. Front. Plant Sci. 2018, 9, 1124. [Google Scholar] [CrossRef] [PubMed]
- Hoque, M.A.; Banu, M.N.A.; Okuma, E.; Amako, K.; Nakamura, Y.; Shimoishi, Y.; Murata, Y. Exogenous proline and glycinebetaine increase NaCl-induced ascorbate-glutathione cycle enzyme activities, and proline improves salt tolerance more than glycinebetaine in tobacco Bright Yellow-2 suspension–cultures cells. J. Plant Physiol. 2007, 164, 1457–1468. [Google Scholar] [CrossRef]
- Sanmartin, M.; Drogoudi, P.A.; Lyons, T.; Pateraki, I.; Barnes, J.; Kanellis, A.K. Over-expression of ascorbate oxidase in the apoplast to transgenic tobacco results in altered ascorbate and glutathione redox states and increased sensitivity to ozone. Planta 2003, 216, 918–928. [Google Scholar] [CrossRef]
- De Tullio, M.C. Antioxidants and redox regulation: Changing notions in a changing world. Plant Physiol. Biochem. 2010, 48, 289–291. [Google Scholar] [CrossRef] [PubMed]
- Bremner, J.M. Determination of nitrogen in soil by the Kjeldahl method. J. Agric. Sci. 1960, 55, 11–33. [Google Scholar] [CrossRef]
- Bray, R.H.; Kurtz, L.T. Determination of total, organic, and available forms of phosphorus in soils. Soil Sci. 1945, 59, 39–45. [Google Scholar] [CrossRef]
- Miller, R.O.; Gavlak, R.; Horneck, D. Plant, Soil and Water Reference Methods for the Western Region; WREP: Western Rural Development Center: Corvallis, OR, USA, 2013; Volume 125. [Google Scholar]
- Walkley, A.; Black, I.A. An examination of the Degtjareff method for determining ssoil organic matter, and a proposed modification of the chromi acid titration method. Soil Sci. 1934, 37, 29–38. [Google Scholar] [CrossRef]
- Bouyoucos, G.J. Directions for Making Mechanical Analysis of Soils by the Hydrometer Method. Soil Sci. 1936, 4, 225–228. [Google Scholar] [CrossRef]
- Pukacka, S.; Ratajczak, E. Production and scavenging of reactive oxygen species in Fagus sylvatica seeds during storage at varied temperature and humidity. J. Plant Physiol. 2005, 162, 873–885. [Google Scholar] [CrossRef]
- Mishra, N.P.; Mishra, R.K.; Singhal, G.S. Changes in the activities of anti-oxidant enzymes during exposure of intact wheat leaves to strong visible light at different temperatures in the presence of protein synthesis inhibitors. Plant Physiol. 1993, 102, 903–910. [Google Scholar] [CrossRef]
- Zeislin, N.; Ben-Zaken, R. Peroxidases, phenylalanine ammonia-lyase and lignification in peduncles of rose flowers. Plant Physiol. Biochem. 1991, 29, 147–151. [Google Scholar]
- Bradford, M.M. A rapid and sensitive method for the quantitation of microgram quantities of protein utilizing the principle of protein-dye binding. Anal. Biochem. 1976, 72, 248–254. [Google Scholar] [CrossRef]
- Heath, R.L.; Packer, L. Photoperoxidation in isolated chloroplasts. I. Kinetics and stoichiometry of fatty acid peroxidation. Arch. Biochem. Biophys. 1968, 125, 189–198. [Google Scholar] [CrossRef]
- Carillo, P.; Gibon, Y. Protocol: Extraction and Determination of Proline. 2011. Available online: https://www.researchgate.net/publication/211353600_PROTOCOL_Extraction_and_determination_of_proline (accessed on 1 September 2020).
- Hummel, I.; Pantin, F.; Sulpice, R.; Piques, M.; Rolland, G.; Dauzat, M.; Christophe, A.; Pervent, M.; Bouteillé, M.; Stitt, M.; et al. Arabidopsis plants acclimate to water deficit at low cost through changes of carbon usage: An integrated perspective using growth, metabolite, enzyme, and gene expression analysis. Plant Physiol. 2010, 154, 357–372. [Google Scholar] [CrossRef]
- Agrobase. Agrobase Generation II, Agronomix; Agrobase: Winnipeg, MB, Canada, 2014. [Google Scholar]


| Cultivar (C) | Treatment (T) | Sampling Times (S) | CxT | CxS | TxS | CxTxS | |
|---|---|---|---|---|---|---|---|
| APX | 1.91 | 1.58 | 281.91 *** | 0.75 | 0.03 | 4.17 ** | 0.68 |
| MDA | 441.39 ** | 1055.19 *** | 1144.73 *** | 20.67 | 571.61 ** | 181.34 | 28.36 |
| POD | 0.00 | 0.01 | 0.30 *** | 0.01 | 0.01 | 0.06 ** | 0.01 |
| Proline | 612.26 | 17,677.81 *** | 185,844.69 *** | 1038.73 * | 2003.23 | 15,533.44 * | 833.11 |
| Protein | 485.68 | 1905.05 * | 62,151.63 *** | 2011.45 ** | 679.57 | 4362.51 *** | 3423.66 *** |
| pH 7 Mean ± S.D. | pH 6 Mean ± S.D. | pH 5 Mean ± S.D. | LSD (0.05) | |
|---|---|---|---|---|
| APX | 3.32 ± 2.03 | 3.71 ± 2.30 | 3.78 ± 2.56 | 0.38 |
| MDA | 26.51 ± 4.32 | 28.05 ± 6.60 | 38.76 ± 10.42 | 3.71 |
| POD | 0.40 ± 0.03 | 0.41 ± 0.05 | 0.41 ± 0.14 | 0.03 |
| Proline | 57.10 ± 38.22 | 64.46 ± 53.17 | 102.17 ± 83.80 | 8.54 |
| Protein | 199.60 ± 41.41 | 206.00 ± 23.03 | 189.10 ± 42.93 | 9.65 |
| PAN3497 | SST806 | LSD (0.05) | |
|---|---|---|---|
| APX | 3.36 ± 2.04 | 3.84 ± 0.11 | 0.31 |
| MDA | 29.03 ± 6.26 | 33.19 ± 11.14 | 3.03 |
| POD | 0.40 ± 0.05 | 0.41 ± 0.11 | 0.03 |
| Proline | 72.58 ± 58.97 | 76.57 ± 65.08 | 6.97 |
| Protein | 202.00 ± 37.36 | 194.97 ± 33.64 | 7.88 |
| Parameters | Value |
|---|---|
| pHH2O | 6.8 |
| sand (%) | 96 |
| clay (%) | 4 |
| silt (%) | 0 |
| CEC (cmol C kg−1) | 3.27 |
| density (g cm−1) | 1.18 |
| C (%) | 0.04 |
| N (mg kg−1) | <0.004 |
| P (mg kg−1) | 26.5 |
| K (mg kg−1) | 163.6 |
| Ca (mg kg−1) | 13,630 * |
| S (mg kg−1) | 1.62 |
| Mg (mg kg−1) | 38.914 * |
| Na (mg kg−1) | 1.80 * |
| Fe (mg kg−1) | 4.82 |
| Zn (mg kg−1) | 0.71 |
| Cu (mg kg−1) | 0.60 |
| Mn (mg kg−1) | 21.39 |
Publisher’s Note: MDPI stays neutral with regard to jurisdictional claims in published maps and institutional affiliations. |
© 2020 by the authors. Licensee MDPI, Basel, Switzerland. This article is an open access article distributed under the terms and conditions of the Creative Commons Attribution (CC BY) license (http://creativecommons.org/licenses/by/4.0/).
Share and Cite
Tóth, B.; Juhász, C.; Labuschagne, M.; Moloi, M.J. The Influence of Soil Acidity on the Physiological Responses of Two Bread Wheat Cultivars. Plants 2020, 9, 1472. https://doi.org/10.3390/plants9111472
Tóth B, Juhász C, Labuschagne M, Moloi MJ. The Influence of Soil Acidity on the Physiological Responses of Two Bread Wheat Cultivars. Plants. 2020; 9(11):1472. https://doi.org/10.3390/plants9111472
Chicago/Turabian StyleTóth, Brigitta, Csaba Juhász, Maryke Labuschagne, and Makoena Joyce Moloi. 2020. "The Influence of Soil Acidity on the Physiological Responses of Two Bread Wheat Cultivars" Plants 9, no. 11: 1472. https://doi.org/10.3390/plants9111472
APA StyleTóth, B., Juhász, C., Labuschagne, M., & Moloi, M. J. (2020). The Influence of Soil Acidity on the Physiological Responses of Two Bread Wheat Cultivars. Plants, 9(11), 1472. https://doi.org/10.3390/plants9111472