Article

Insights into the Superoxide Dismutase Gene Family and Its Roles in Dendrobium catenatum under Abiotic Stresses

1
Yunnan Key Laboratory for Wild Plant Resources, Kunming Institute of Botany, Chinese Academy of Sciences, Kunming 650201, China
2
University of Chinese Academy of Sciences, Beijing 100049, China
*
Author to whom correspondence should be addressed.
Plants 2020, 9(11), 1452; https://doi.org/10.3390/plants9111452
Submission received: 27 September 2020 / Revised: 20 October 2020 / Accepted: 20 October 2020 / Published: 28 October 2020
(This article belongs to the Special Issue Responses of Plants to Environmental Stresses)

Abstract

:
Dendrobium catenatum is a member of epiphytic orchids with extensive range of pharmacological properties and ornamental values. Superoxide dismutase (SOD), a key member of antioxidant system, plays a vital role in protecting plants against oxidative damage caused by various biotic and abiotic stresses. So far, little is known about the SOD gene family in D. catenatum. In this study, eight SOD genes, including four Cu/ZnSODs, three FeSODs and one MnSOD, were identified in D. catenatum genome. Phylogenetic analyses of SOD proteins in D. catenatum and several other species revealed that these SOD proteins can be assigned to three subfamilies based on their metal co-factors. Moreover, the similarities in conserved motifs and gene structures in the same subfamily corroborated their classification and inferred evolutionary relationships. There were many hormone and stress response elements in DcaSODs, of which light responsiveness elements was the largest group. All DcaSODs displayed tissue-specific expression patterns and exhibited abundant expression levels in flower and leaf. According to public RNA-seq data and qRT-PCR analysis showed that the almost DcaSODs, except for DcaFSD2, were highly expressed under cold and drought treatments. Under heat, light, and salt stresses, DcaCSD1, DcaCSD2, DcaCSD3 were always significantly up-regulated, which may play a vital role in coping with various stresses. The expression levels of DcaFSD1 and DcaFSD2 were promoted by high light, suggesting their important roles in light response. These findings provided valuable information for further research on DcaSODs in D. catenatum.

1. Introduction

Dendrobium catenatum, belonging to Dendrobium genus (Orchidaceae), is a member of epiphytic orchids which takes root on the surface of tree bark or rocks [1]. Due to the special living environment, D. catenatum evolved novel features and sophisticated defense mechanisms that allow it to exploit its environment and against serious abiotic stresses, including thick leaves, abundant polysaccharides and facultative crassulaceaen acid (CAM) metabolism that is a photosynthetic pathway with high water-use efficiency [2,3,4,5,6]. D. catenatum is considered to be drought-resistant material useful for elucidating mechanisms of mitigating drought stress [2,5,6]. Additionally, D. catenatum is a well-known traditional Chinese medicinal herb, and has both an extensive range of pharmacological properties and ornamental values. Stem of D. catenatum contains a large number of polysaccharides that exhibits anti-inflammatory, immune-enhancing, antioxidant, and anti-glycation activities [7,8]. Light and water affected significantly the accumulation of polysaccharides [2,6]. Consequently, study on the D. catenatum not only has important scientific value, but also has important economic value.
The increased production of toxic reactive oxygen species (ROS) is considered to be a universal or common feature of stress conditions. ROS includes hydrogen peroxide (H2O2), superoxide anion radicals (O2.-), peroxyl radicals (HOO-), hydroxyl radicals (OH-), and singlet oxygens (1O2) [9,10]. The antioxidant defense system constitutes the first line of defense against ROS produced in response to abiotic stresses. The superoxide dismutase (SOD) can catalyze the dismutation of supeoxide to H2O2 and O2. and is one of the most effective components of the antioxidant defense system in plant cells against ROS toxicity. SODs, which are localized at different cellular compartments, could be categorized into three subgroups based on metal co-factors: Cu/ZnSOD, FeSOD and MnSOD [11]. Because of their crucial roles in the antioxidant system, SODs have been reported to be involved in protection against abiotic stresses such as heat, cold, drought and salinity [12,13,14,15]. For example, Overexpression of Cu/ZnSODs in potato indicated that transgenic plants exhibited increased tolerance to oxidative stress [12]. Asensio et al. [14] indicated that stress conditions, such as nitrate excess or drought markedly increased anti-cytosolic FeSOD (cyt-FeSOD) contents in soybean tissues. Currently, the SOD gene family had been identified in many species, such as banana [15], Arabidopsis thaliana [16], tomato [17], cucumber [18], cotton [19], wheat [20], and Salvia miltiorrhiza [21]. To date, the characters of SOD genes and their roles in stress resistance of D. catenatum are still largely unknown. In this study, we perform a genome-wide analysis of SOD genes in D. catenatum genome, and investigated their characteristics, including physicochemical properties, structural characteristics and evolutionary relationships, and responses to abiotic stress. Together, our study provides a foundation for further investigation into its function of the SOD family in D. catenatum.

2. Results

2.1. Identification of SOD Gene Family Members in Dendrobium catenatum

After strict screening, a total of eight DcaSOD genes were identified in the D. catenatum genome (Table 1, Table S1). These DcaSOD genes were termed as DcaCSD1, DcaCSD2, DcaCSD3, DcaCSD4, DcaFSD1, DcaFSD2, DcaFSD3 and DcaMSD1, and were assigned to three subfamilies according to their functional annotations. The number of amino acids of DcaSOD proteins ranged from 269 amino acids (aa) (DcaFSD2) to 76 aa (DcaFSD3) with an average of 196 aa. The molecular weights (MW) changed from 15.31 (DcaCSD2) to 30.78 kDa (DcaFSD2) with isoelectric points of 4.91 (DcaFSD2)—8.61 (DcaMSD1). The subcellular localization of eight DcaSOD proteins were predicted by ProComp. The results showed that DcaCSD1, DcaFSD1, and DcaFSD2 may be located in the chloroplast. DcaCSD2, DcaCSD3 and DcaCSD4 were predictably located in the cytoplasmic. In addition, the DcaMSD1 was predictably located in the mitochondria. The grand average of hydropathicity (GRAVY) of these DcaSOD proteins implied that DcaCSD1 and DcaFSD3 were hydrophobic protein, and other DcaSOD proteins were hydrophilic protein.

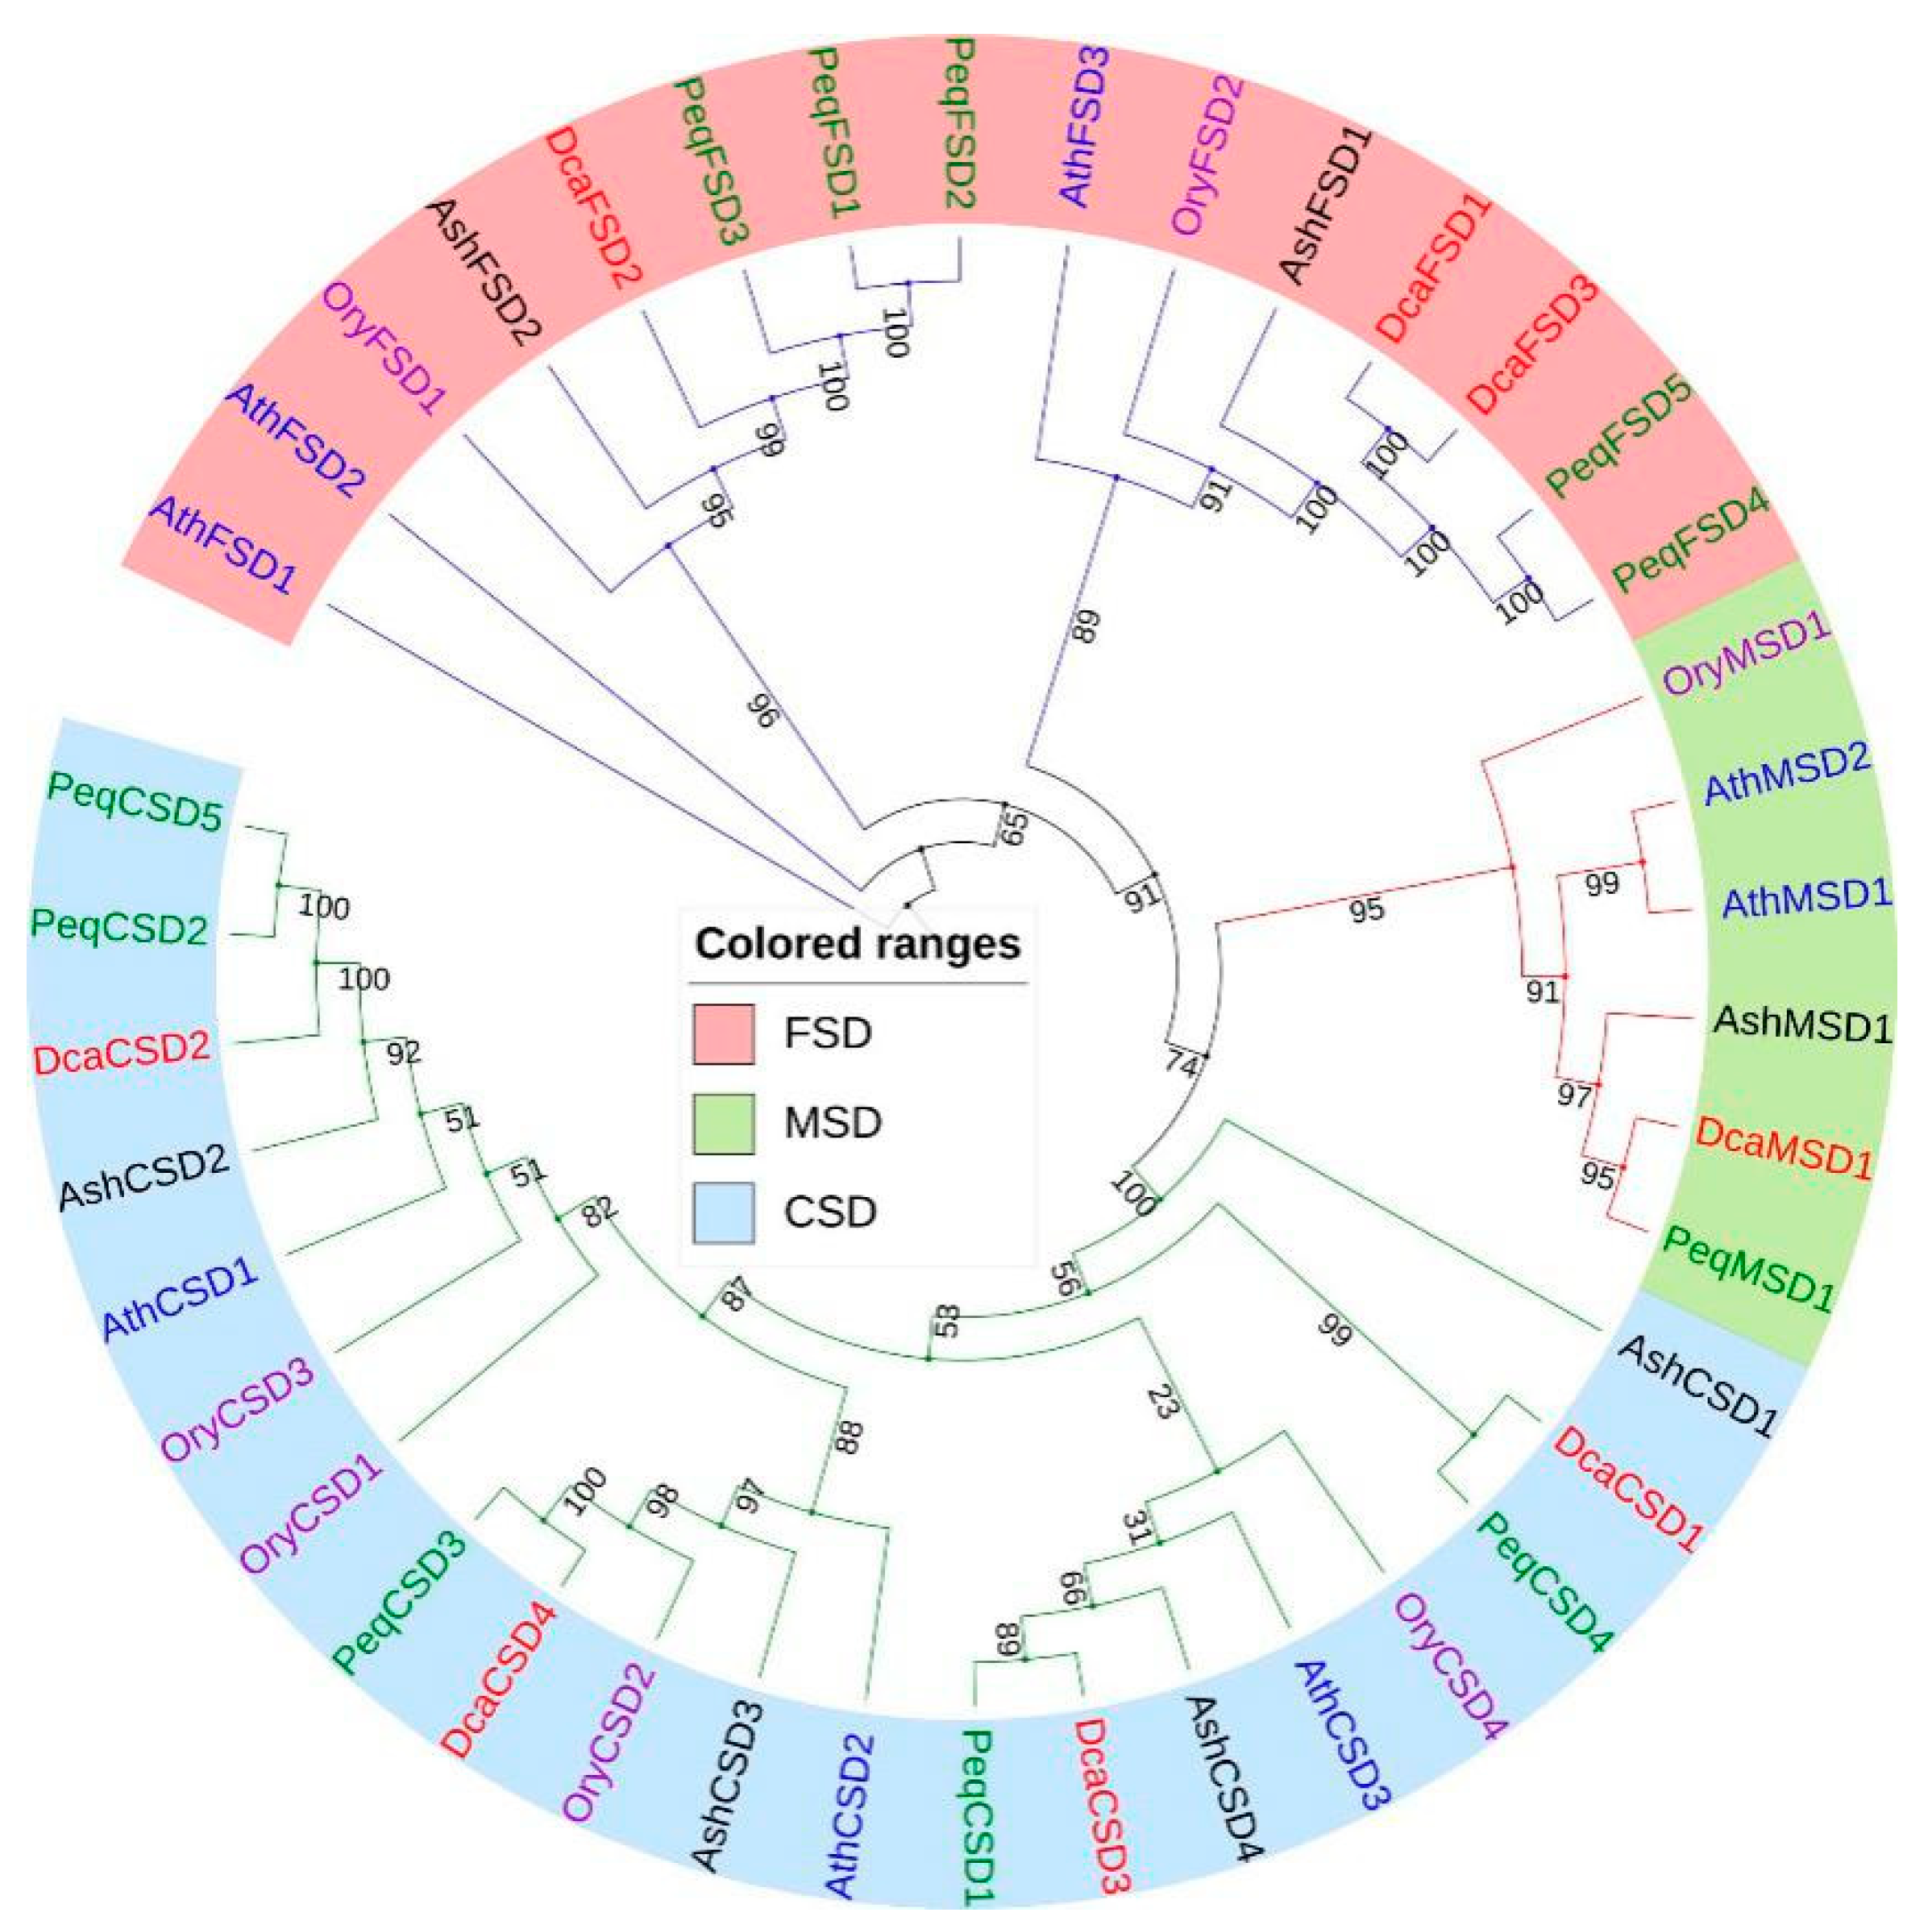
2.2. Phylogenetic Analysis of DcaSOD Proteins

To further explore the classification and evolutionary characteristics of these DcaSODs, multiple sequence alignment of DcaSOD protein sequences with their homologs from Arabidopsis, Oryza sativa, Phalaenopsis equestris and Apostasia shenzhenica was carried out. An un-rooted phylogenetic tree showed that all SOD genes were divided into three groups, named CSD, FSD and MSD subfamily (Figure 1, Table S1). The CSD subfamily had the most members (20), followed by the FSD (15) and MSD subfamily (6). We found that all DcaSOD proteins were much closer to PeqSOD proteins than AshSOD proteins.

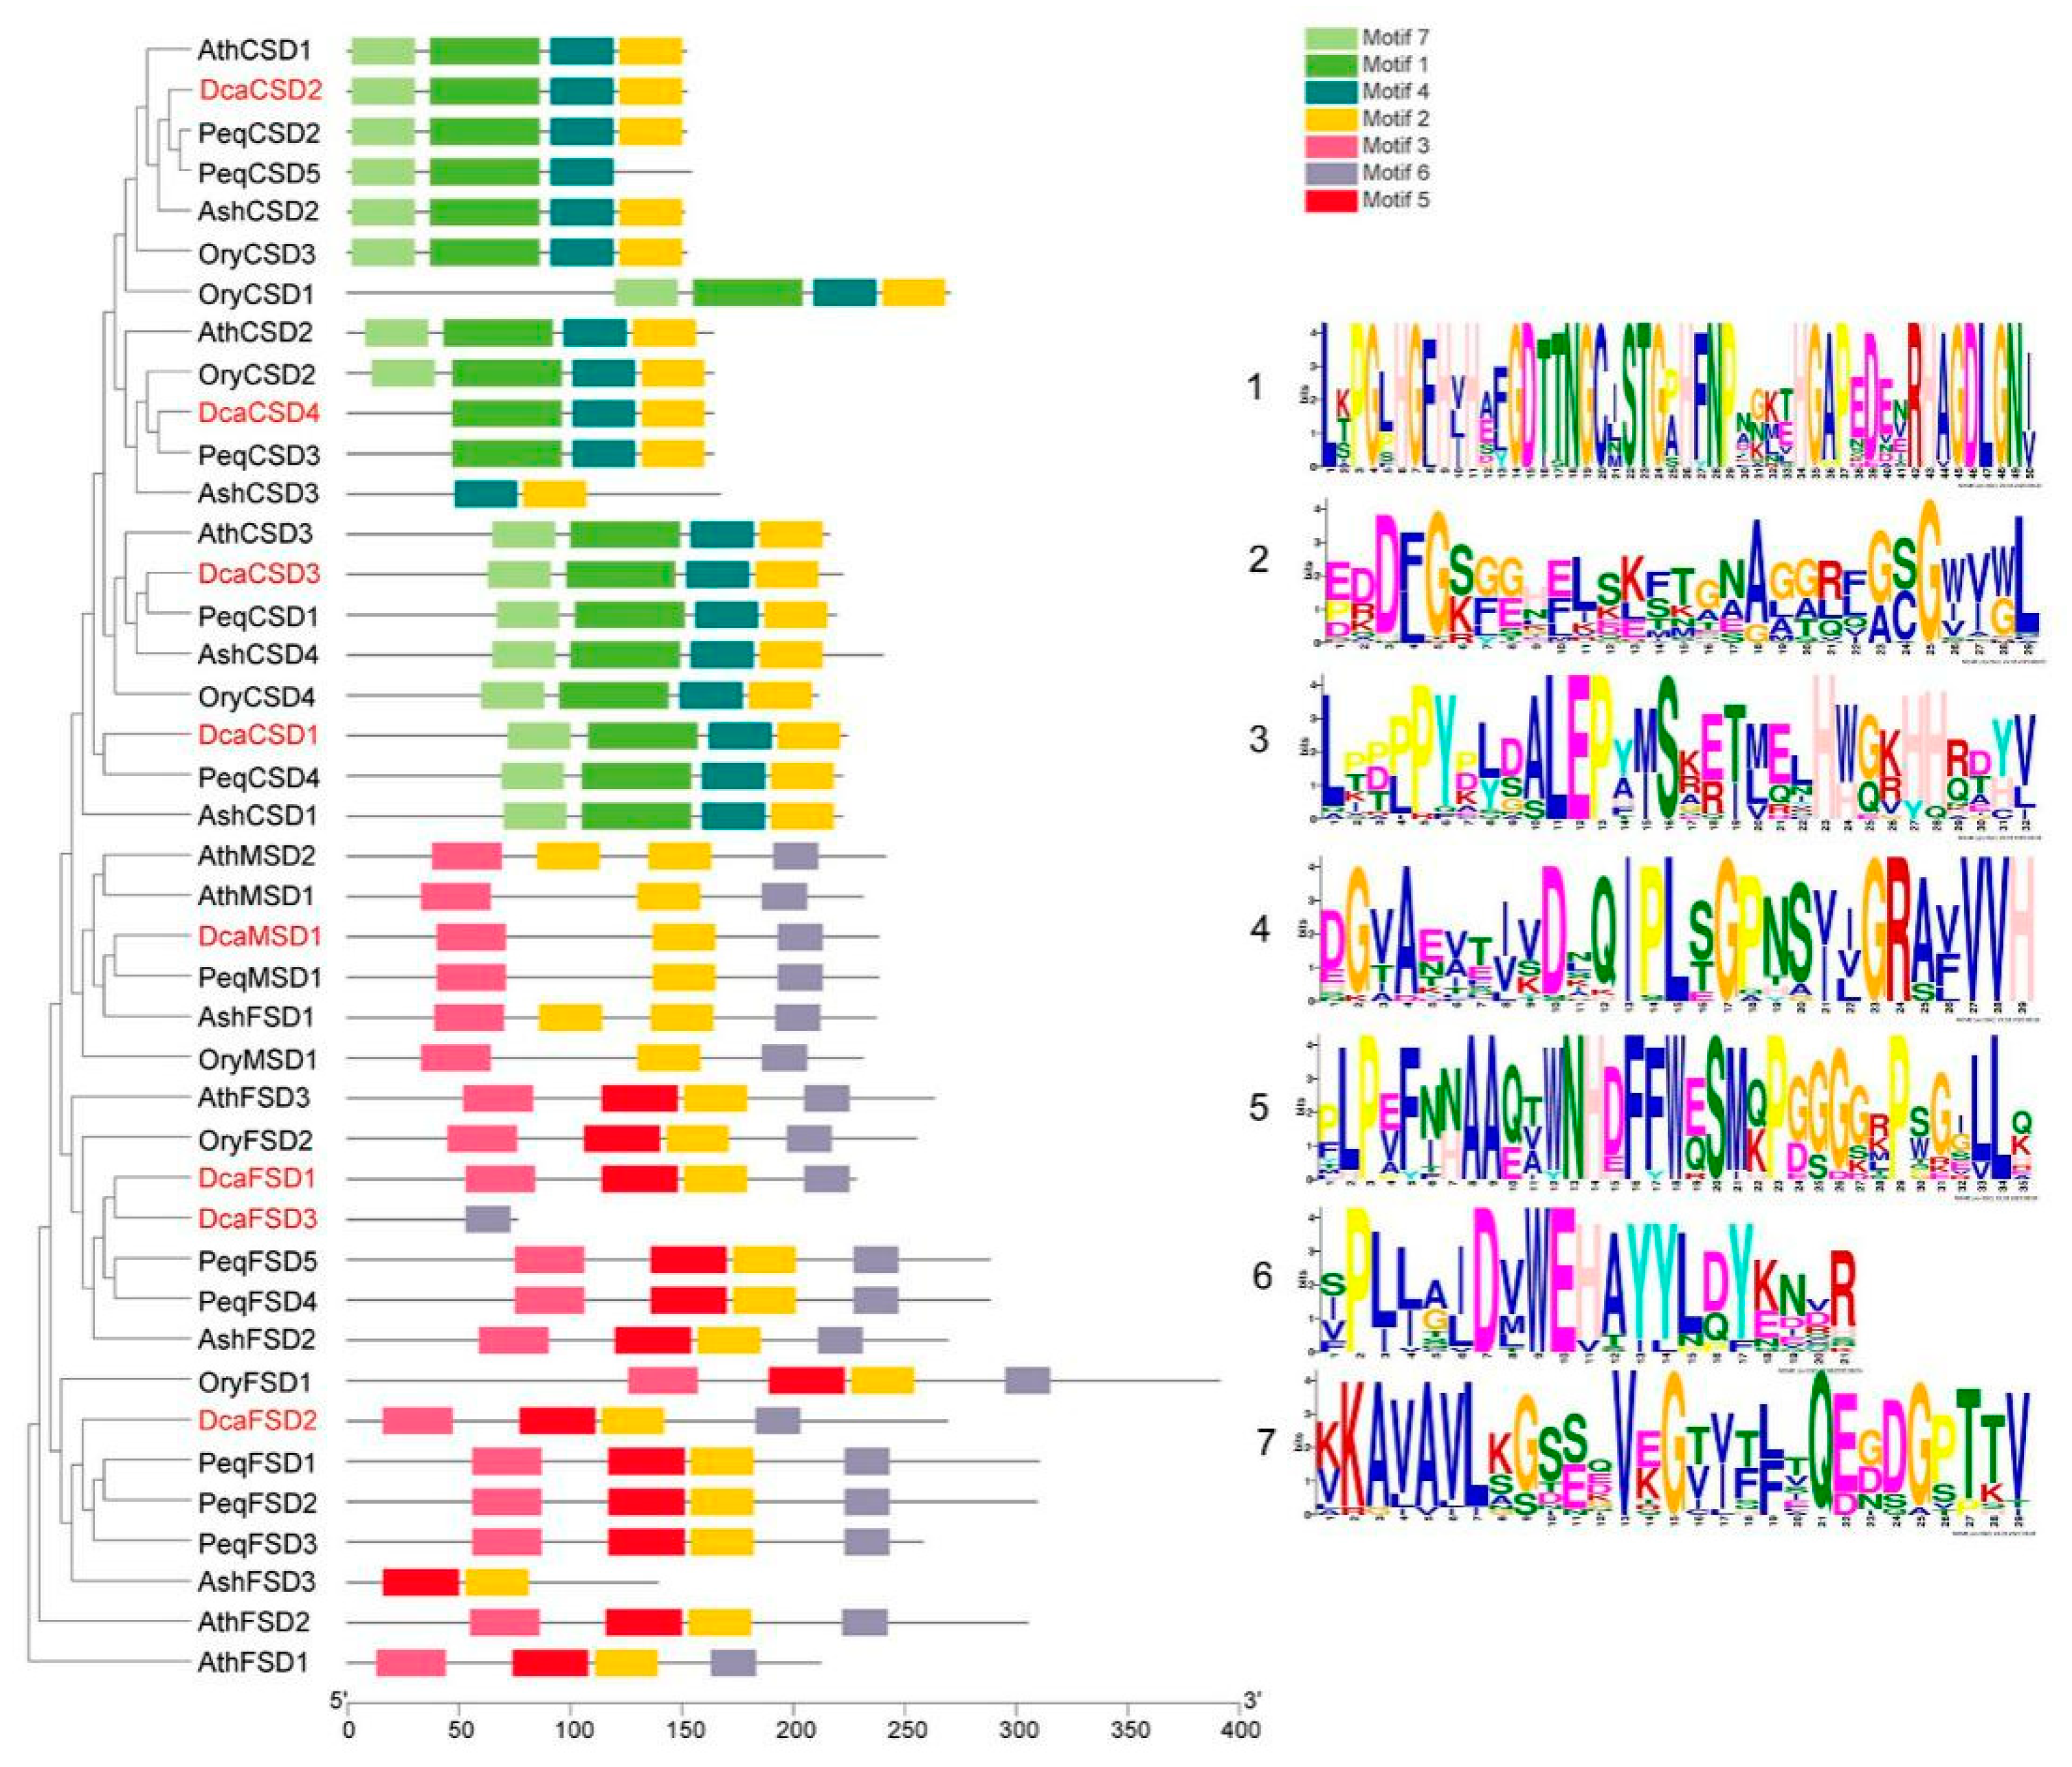
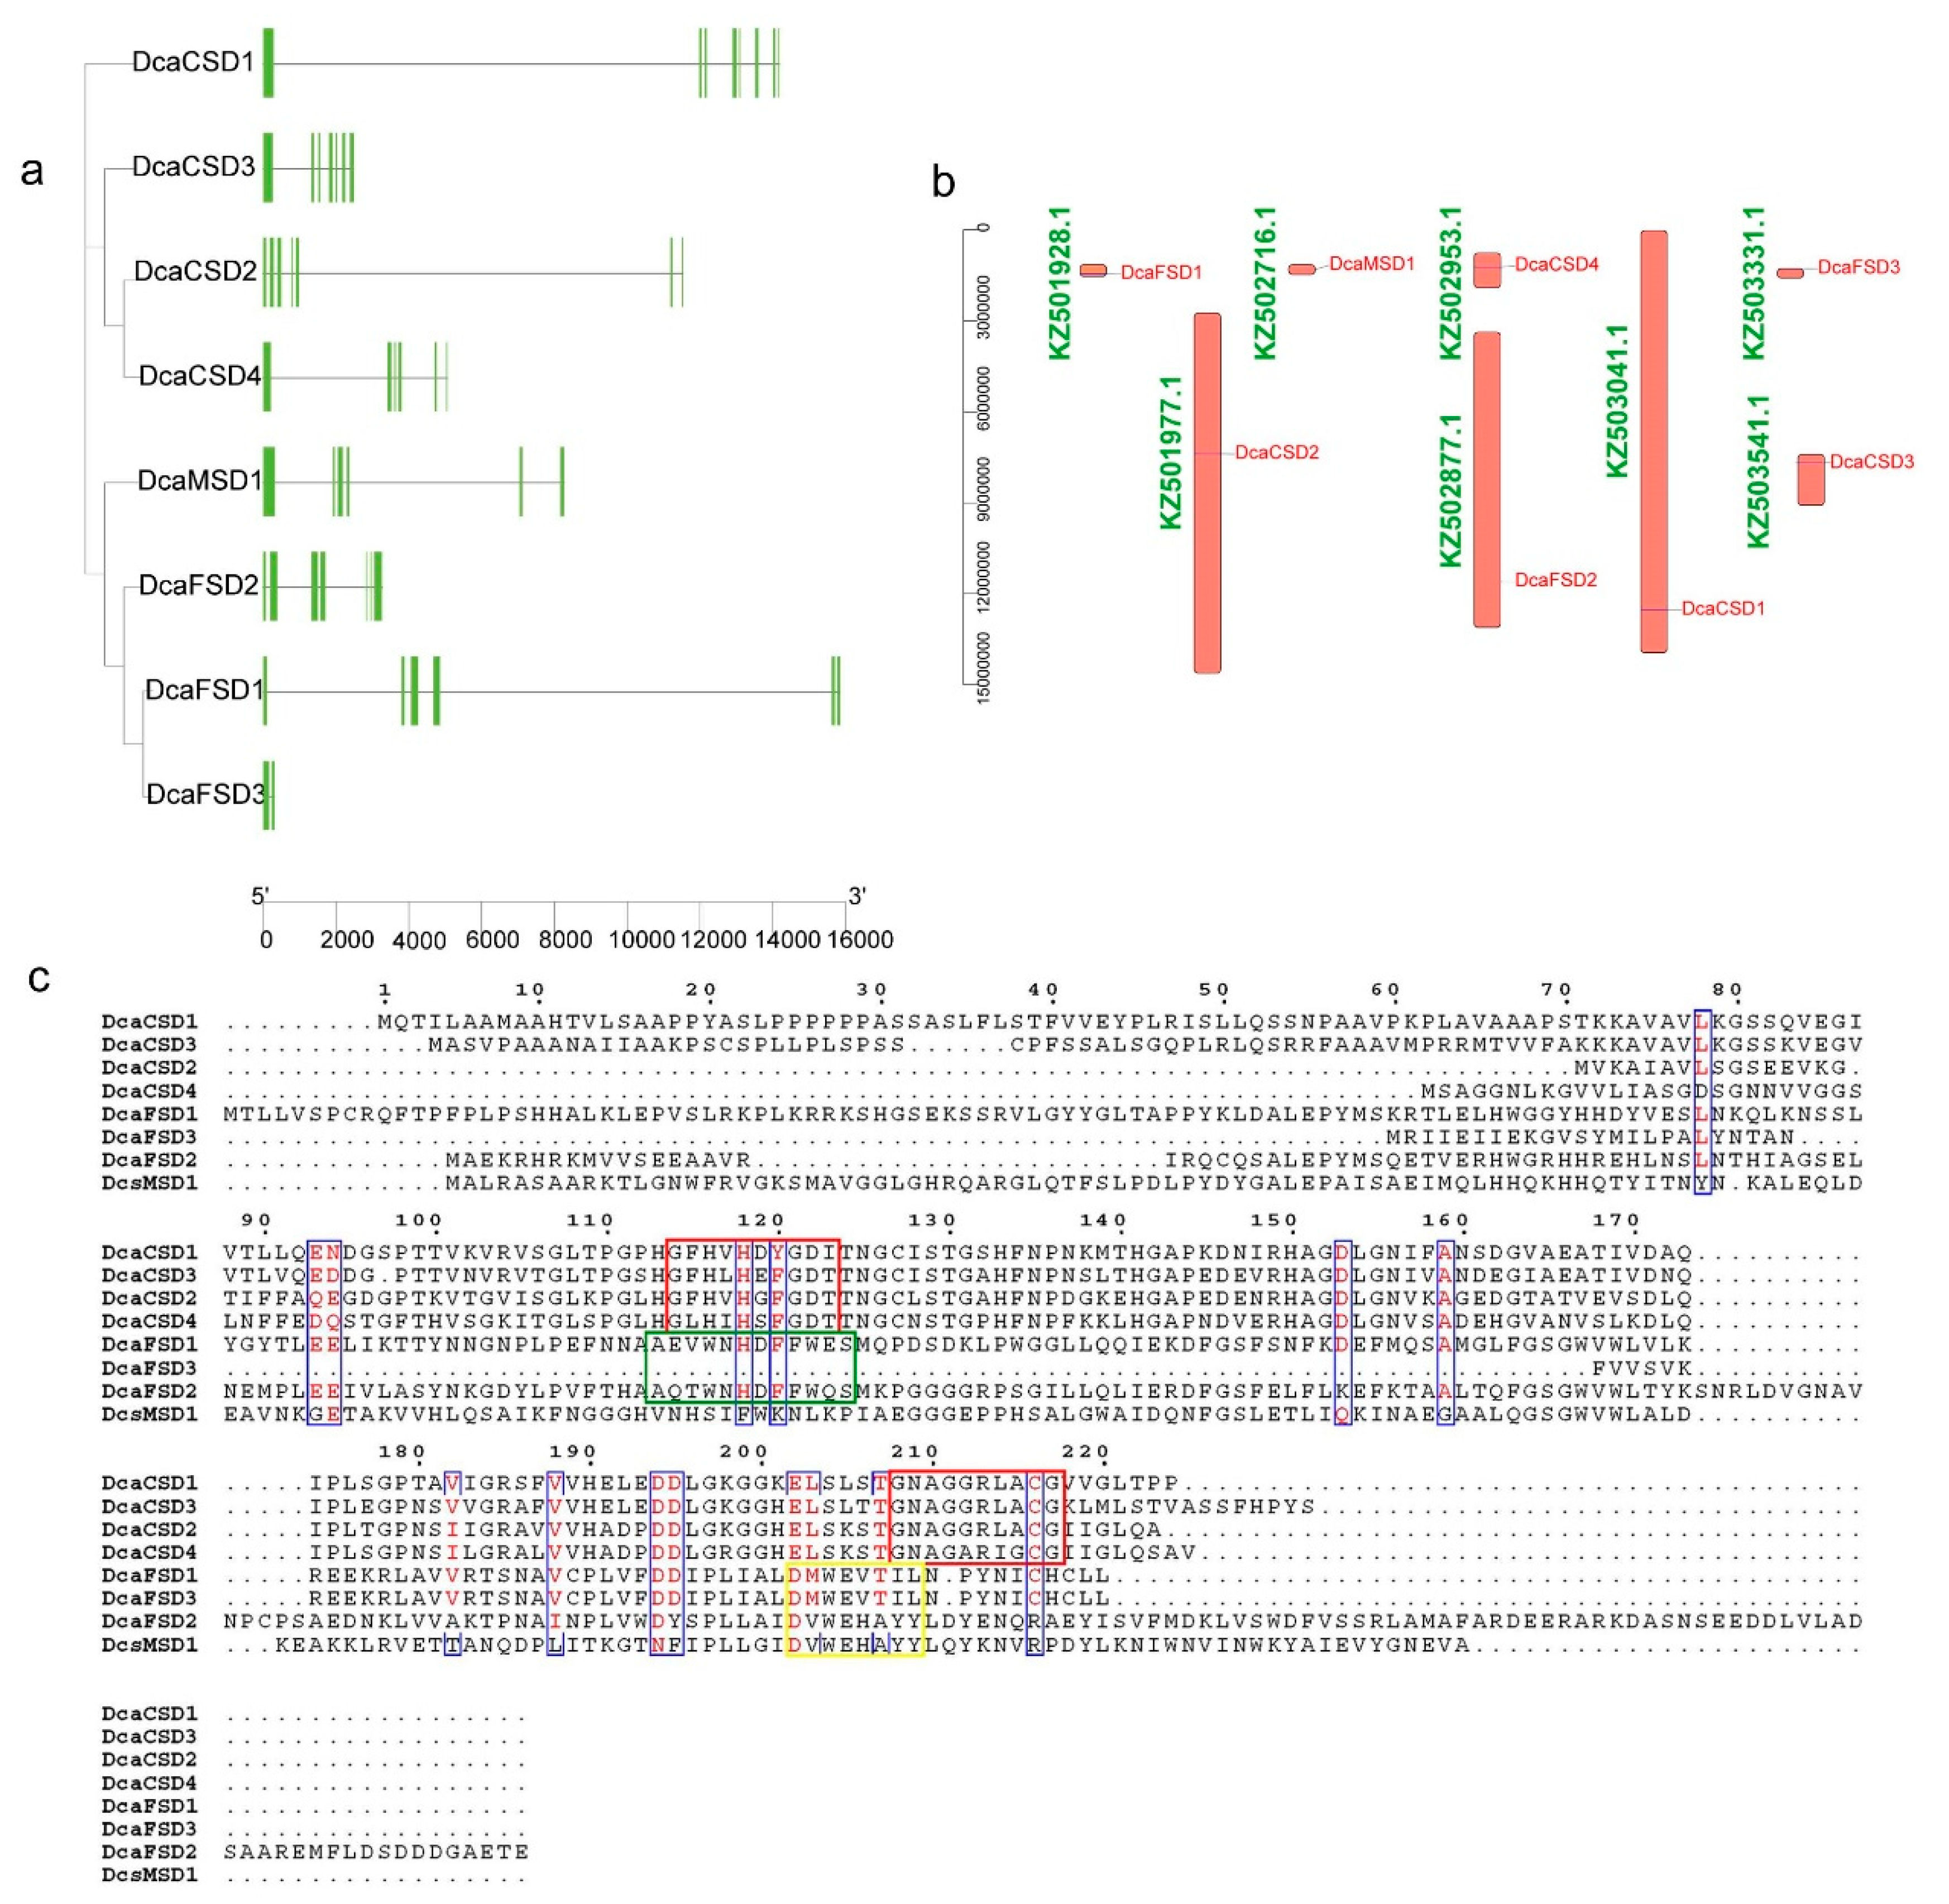
2.3. Conserved Motifs, Gene Structures, Distribution, and cis-Elements Analysis

A total of seven motifs ranging from 21 to 50 aa were searched by MEME analysis. As shown in Figure 2, almost all members in the same subfamily shared common motif compositions with each other, suggesting functional similarities among these SOD proteins within the same subfamily. Motif 2 was widely distributed across almost all SOD proteins, except for PeqCSD5 and DcaFSD3. The members of CSD subfamily contained the motifs 1, 2, 4, and 7. The members of MSD subfamily contained the motifs 2, 3, and 6. Motif 5 was presented in the members of FSD subfamily, except for DcaFSD3. The predicted exon-intron structures were analyzed to gain an insight into the variation of SOD genes in D. catenatum. The results showed that the exons numbers of DcaSOD genes ranged from 2 (DcaFSD3) to 8 (DcaCSD1) (Figure 3a). In addition, the identified eight DcaSOD genes were mapped onto scaffolds, which showed that they distributed in eight different scaffolds (Figure 3b). Multiple sequence alignment of the eight DcaSOD amino acid sequences was performed and the results showed that all DcaCSDs contained the Cu/ZnSOD signatures (G[FL]H[VLI]H[DEGS][FY]GD[TI]) and (GNAG[GA]R[LI][AG]CG) (Figure 3c). The conserved metal-binding domain (D[MV]WE[VH][TA][IY][LY]) were found in DcaFSDs and DcaMSD. In addition, the signature (A[EQ][VT]WNHDFFW[EQ]S) responsible for the recognition of iron ion by FeSODs were identified in DcaFSDs, except for DcaFSD3.
To further explore the potential functions of DcaSOD genes during plant growth and stress responses, the sequences of the 2.0 kb region upstream of the translation initiation site of each of DcaSOD genes were analysis using the PlantCARE. In total, 142 cis-elements related to hormones and stresses responses were identified in all identified DcaSOD promoters (Figure 4). Among these predicted cis-elements, the light responsiveness element was the largest group including Box 4 (25), G-Box (7), GT1-motif (10), I-box (8), TCT-motif (8), TCCC-motif (2) and others (17) (Table S2). The Box 4 (25), the most light-responsive element was present in 6 DcaSOD promoters. Fourteen CGTCA-motif and 14 TGACG-motif, both of which are involved in MeJA-responsiveness, were identified in five DcaSOD promoters, respectively. ABRE was abscisic acid (ABA) responsiveness element and was present exclusively in DcaFSD1 and DcaFSD2 promoters. DcaCSD2 and DcaFSD1 promoters contained low-temperature-responsive element (LTR) that was involved in response to cold stress. TATC-box and P-box that were gibberellin-responsive element were found to be present in three and three DcaSOD promoters, respectively. The TCA-element that was involved in salicylic acid responsiveness were found to be present in DcaCSD2 and DcaCSD3 promoters. In addition, eight ARE cis-elements involved in anaerobic induction were identified in five DcaSOD promoters. There was only a cis-element was identified in DcaFSD3 promoter, which is due to many gaps in its promoter region.

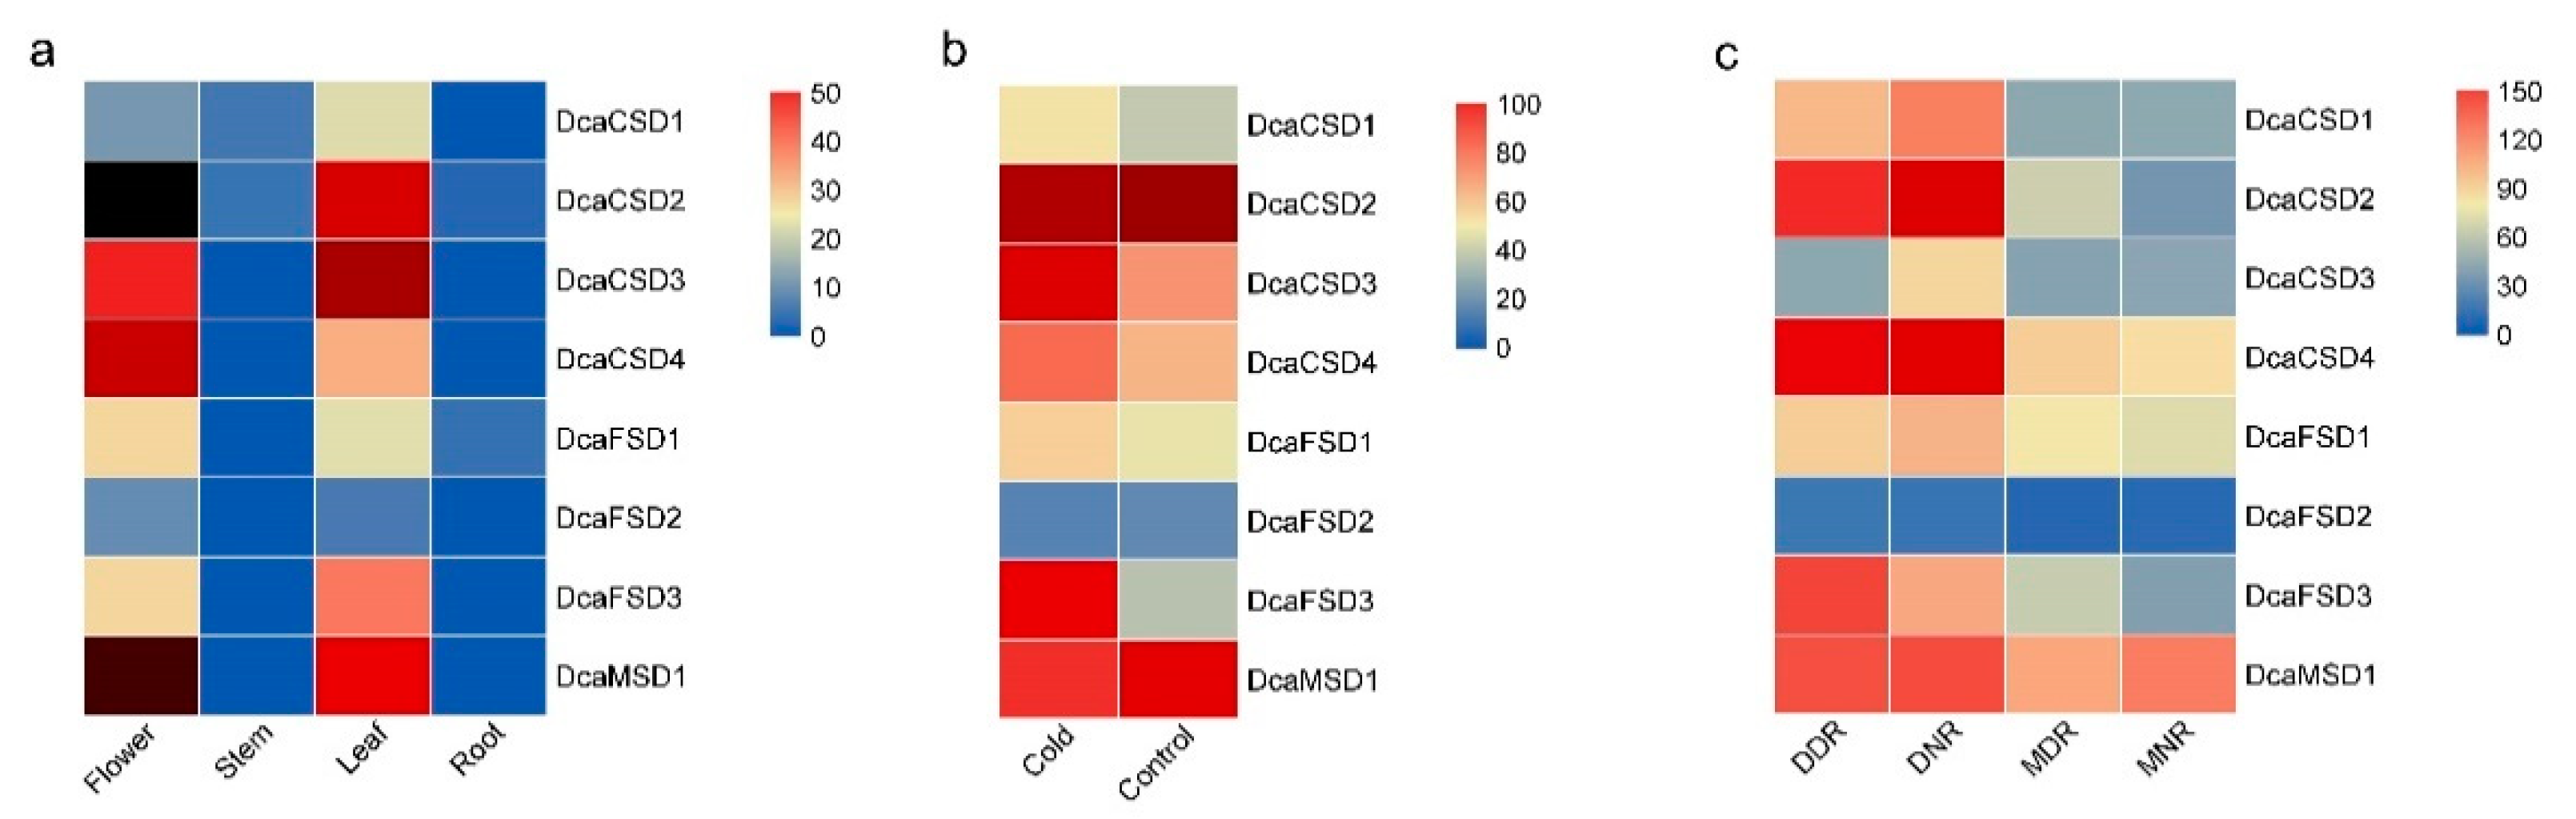
2.4. Distinct Expression Profiles of DcaSOD Genes in Different Tissues, Cold and Drought Responses

To analyze the expression profiles of eight DcaSOD genes, we investigated their transcripts abundance patterns across multiple tissues including flower, leaf, stem, and root based on public RNA-seq data. The heat map showed that almost all DcaSOD genes had tissue-specific expression patterns (Figure 5a). Most of them were highly expression level in flower and leaf, especially DcaCSD2, DcaCSD3, DcaCSD4 and DcaMSD1, and were lowly expressed in root and stem. Under cold treatment (0 °C for 20 h), the expression levels of DcaCSD1, DcaCSD3, DcaCSD4, DcaFSD1 and DcaFSD3 increased by cold treatment (Figure 5b). Of them, the expression level of DcaFSD3 under cold treatment was more than three times than that of control. DcaCSD2 and DcaMSD1 showed constitutive expression with high expression levels in leaves under control and cold treatment.
To achieve a better understanding of the roles of SODs under drought in D. catenatum, we used public RNA-seq data to analyze the transcriptomes of leaves under control (30–35% volumetric water content) and serious drought (0% volumetric water content), were collected at 09:00 (designed as moist-day MDR and dried-day DDR) and 21:00 (designed as moist-night MNR and dried-night DNR) (Figure 5c). Under drought treatment, the expression of all DcaSOD genes were up-regulated at night and in the daytime. The expression levels of DcaCSD2 were six and two times under drought than that of control at night and in the daytime, respectively. The expression levels of DcaCSD1 were three and two times under drought than that of control at night and in the daytime, respectively. It is notable that the four DcaCSDs were highly expressed in DNR than in DDR. Among the FSD subfamily, the expression levels of DcaFSD3 were three and two times under drought than that of control at night and in the daytime, respectively. After differentially expressed genes (DEGs) identification between DDR, DNR, MDR and MNR, a total of 5478 DEGs were identified (fold change ≥ 2 and FDR ≤ 0.01) (Table S3). DcaCSD1 and DcaCSD2 genes were annotated as DEGs. The Pearson correlation analysis was carried out to predict the relationship between the two DcaSODs and other DEGs, considering positive (≥0.99) and negative (≤−0.99) relationship with p-value < 0.005 (Table 2). In our result, two genes showed negative correlation with the DcaCSD1, while 13 genes were detected as positive. There were 12 negative correlation genes and three positive correlation genes with the DcaCSD2.

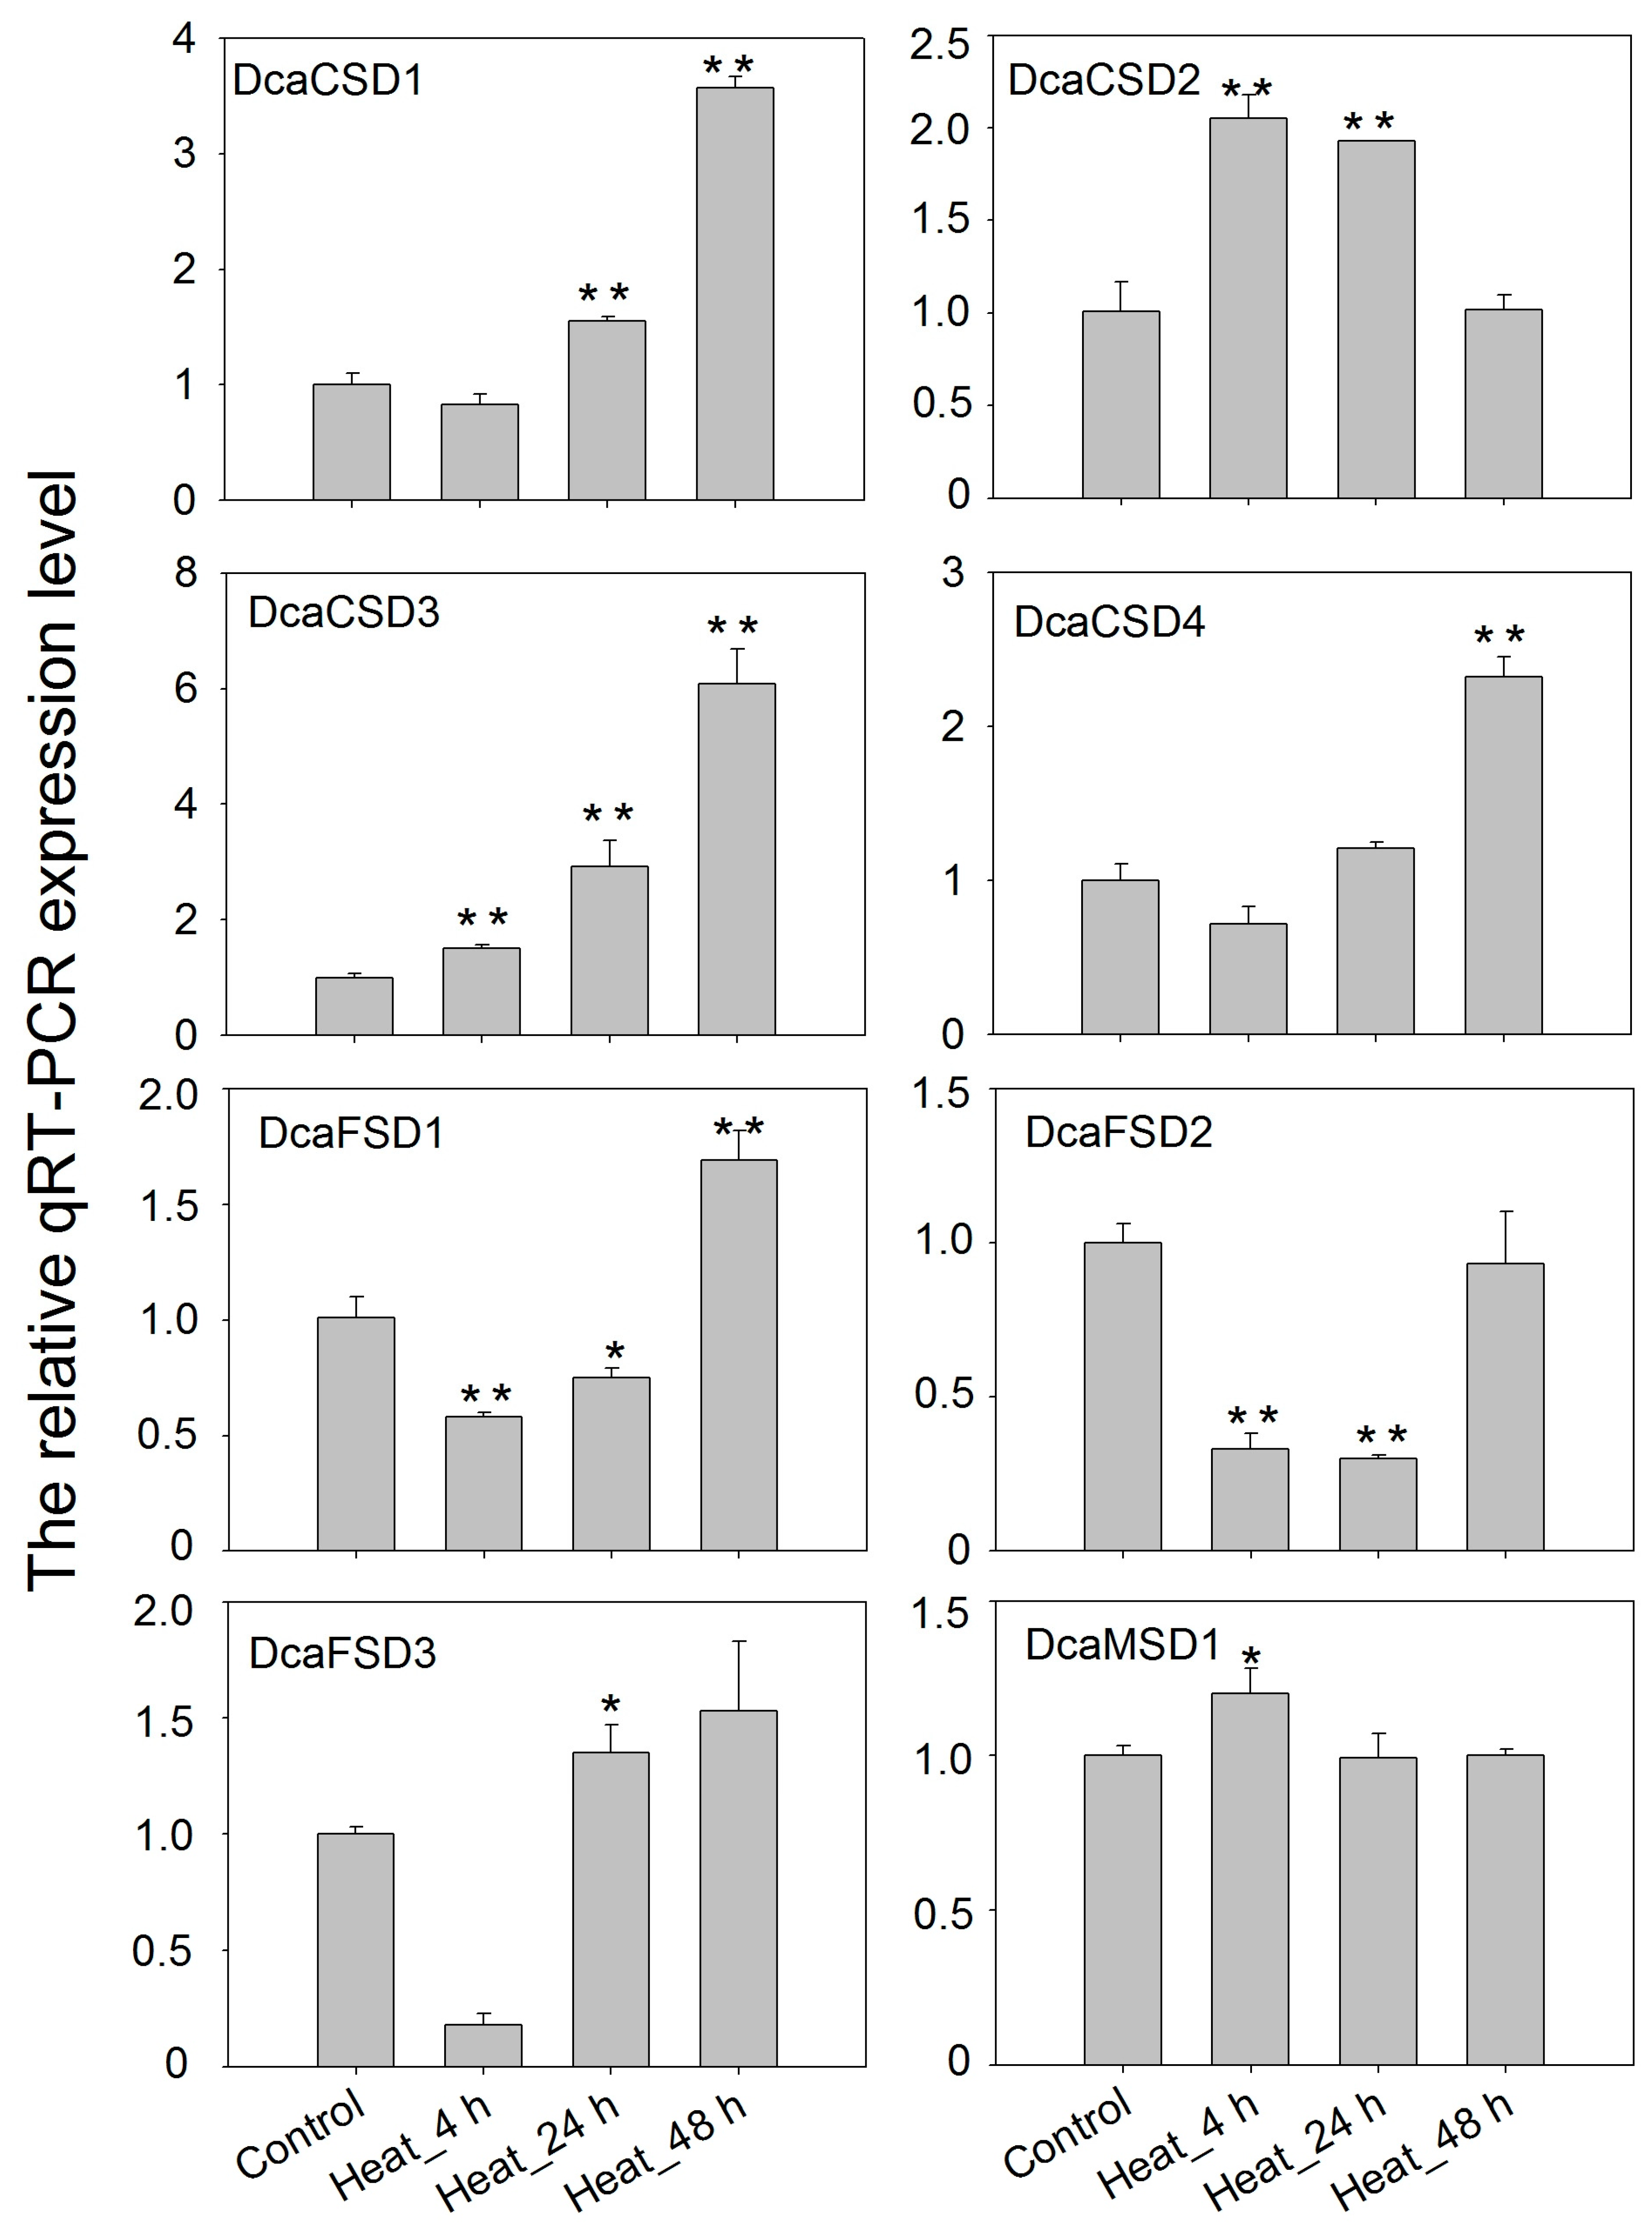
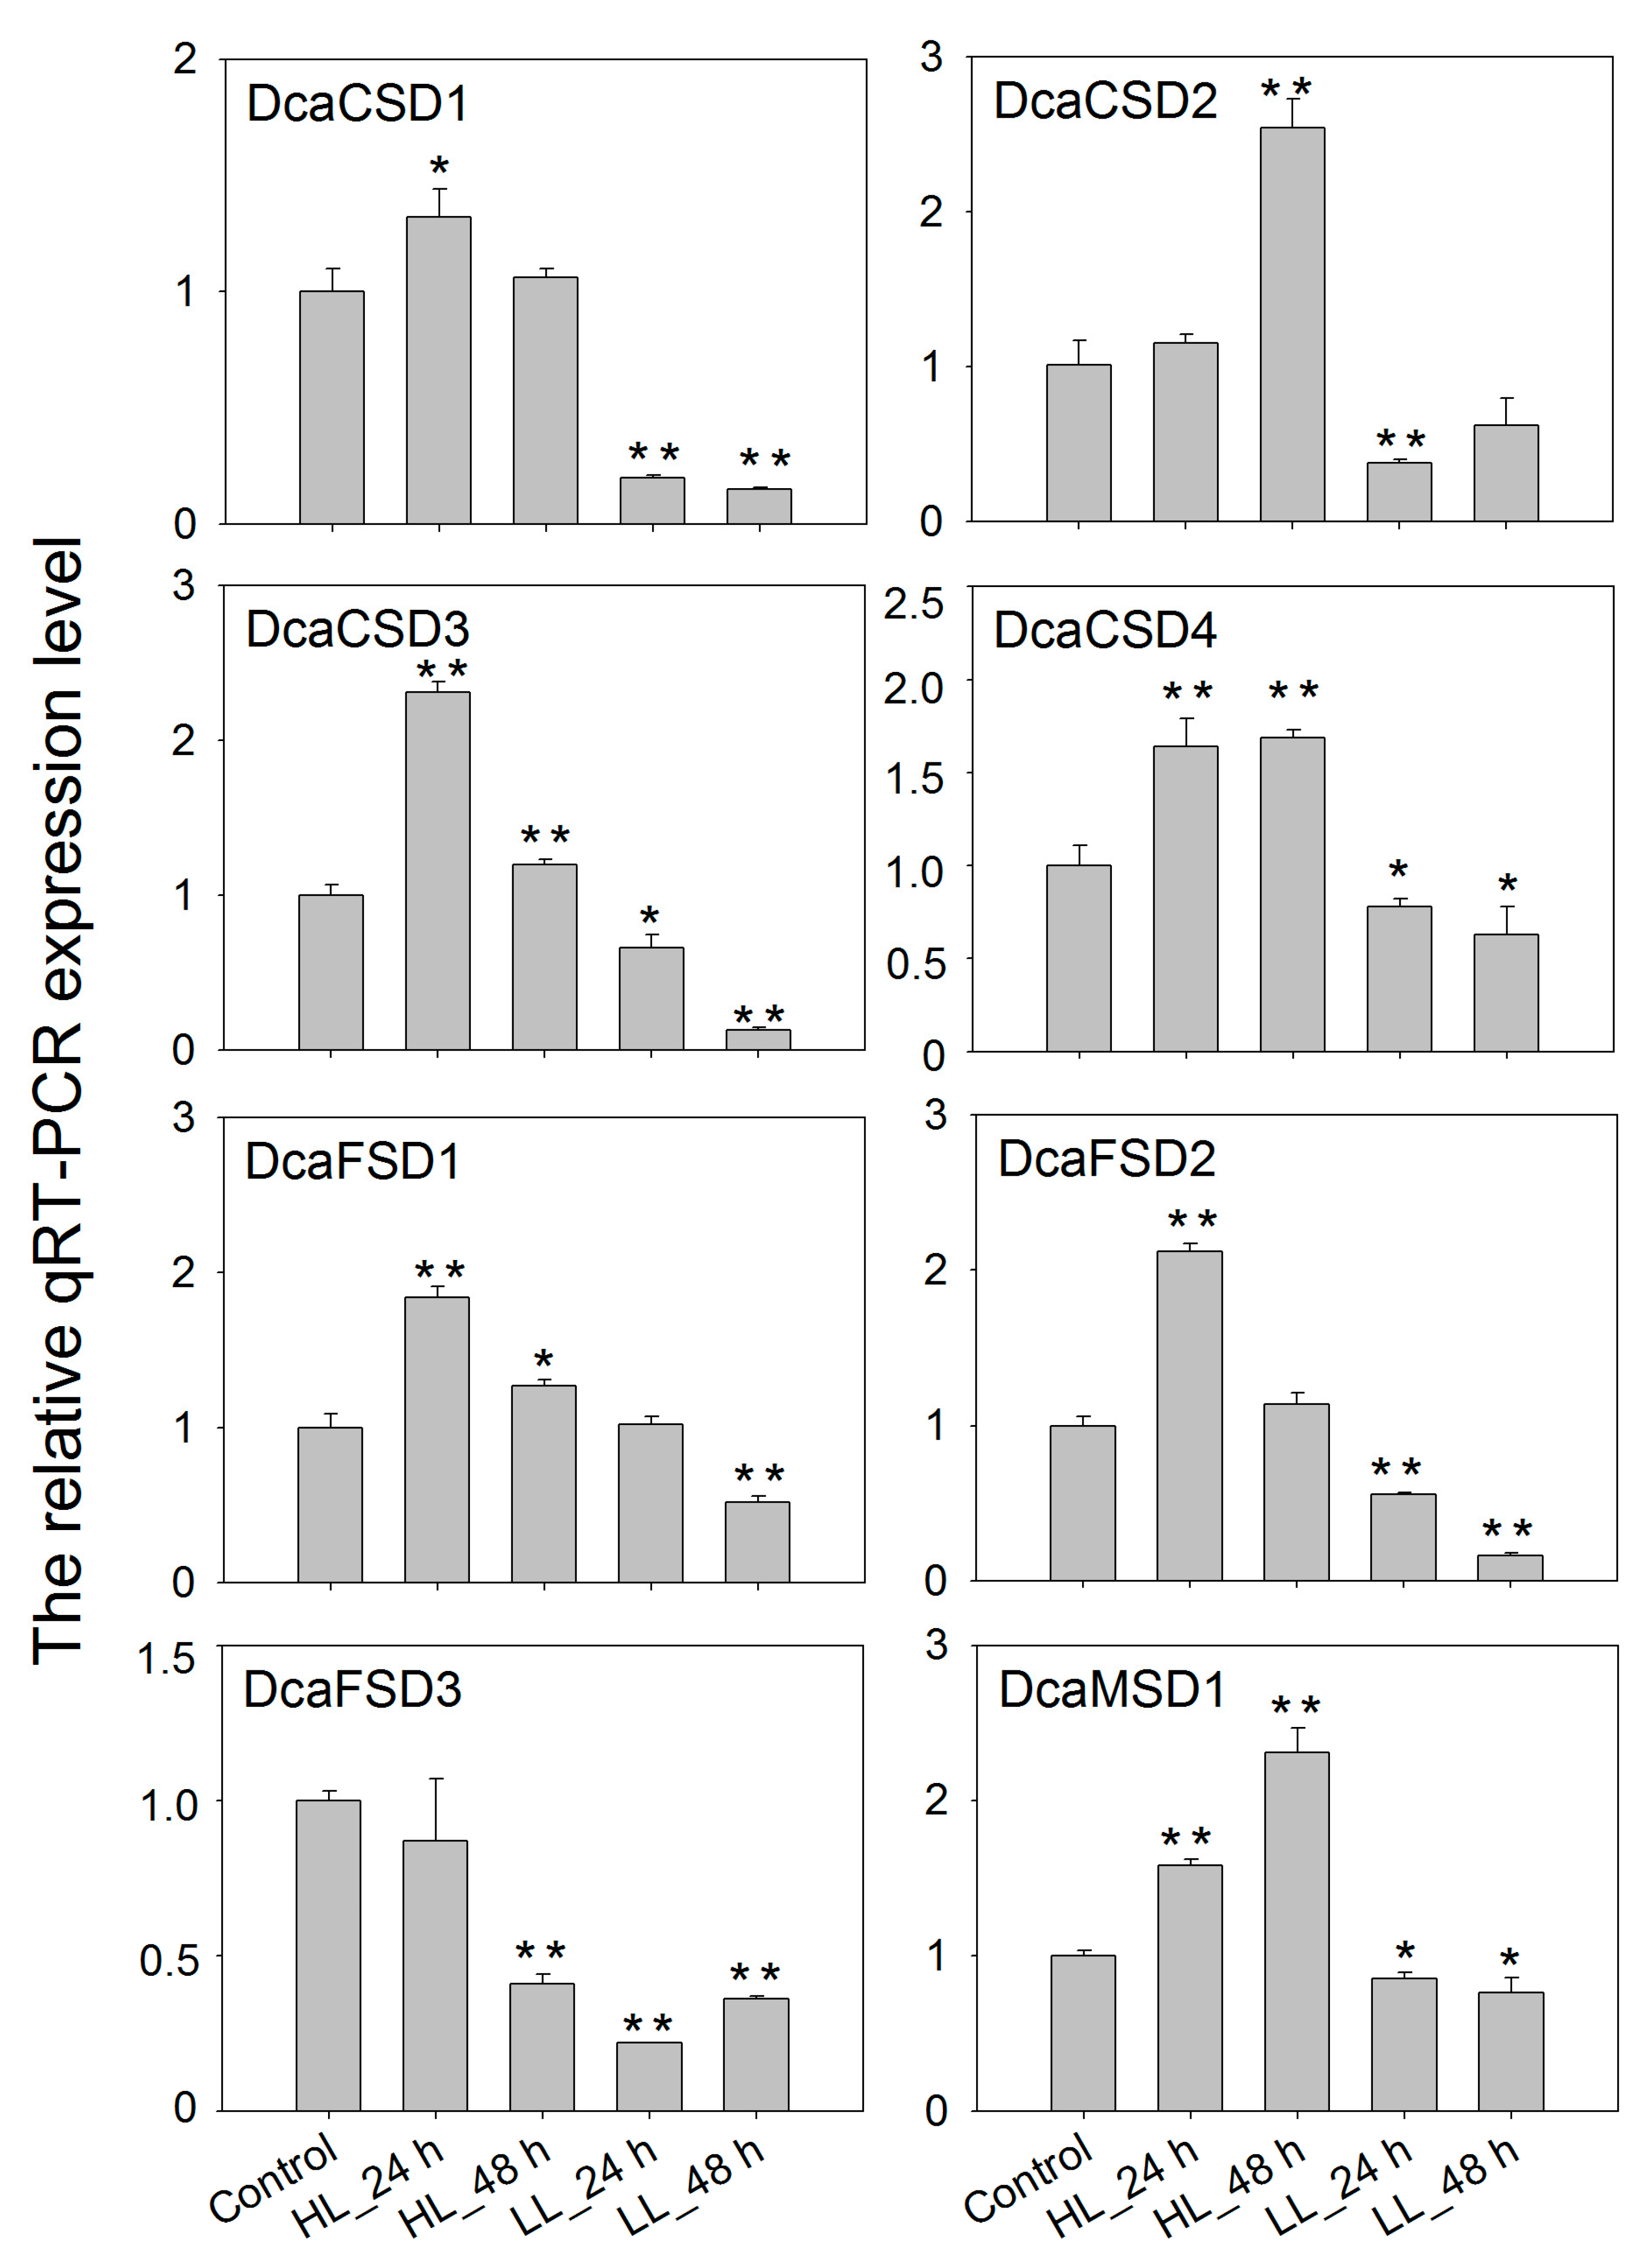
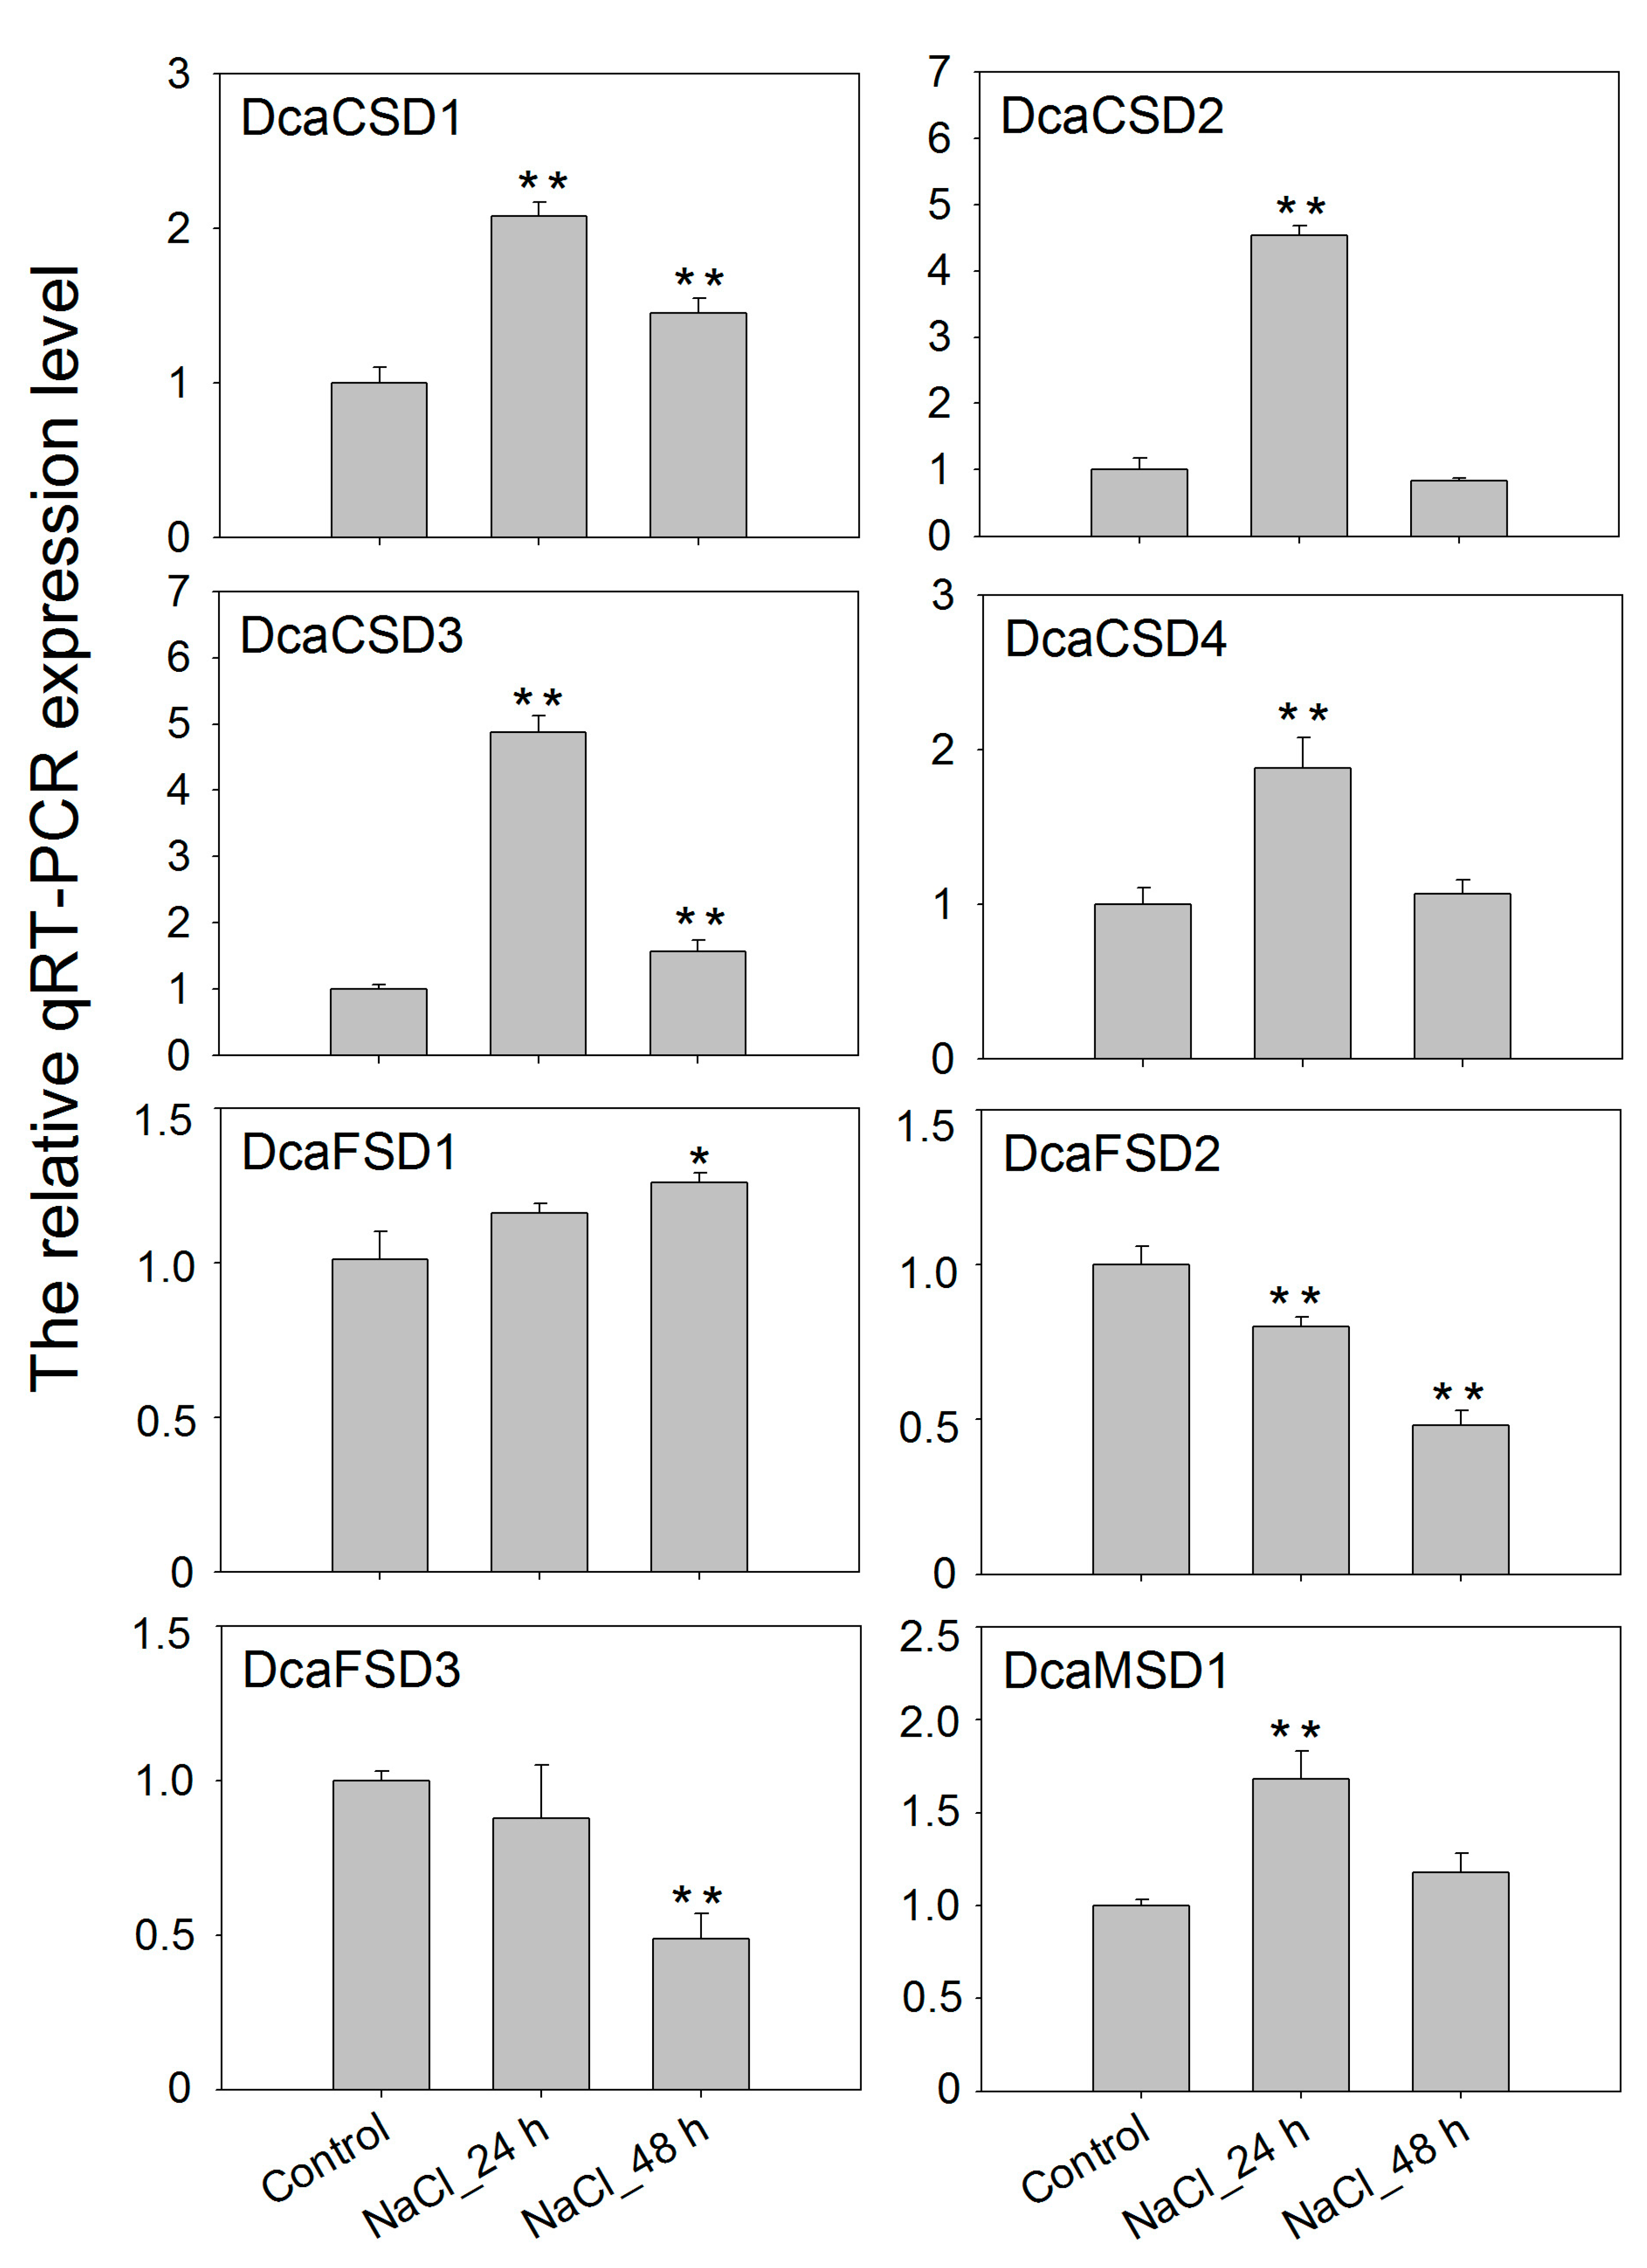
2.5. qRT-PCR Verified the Expression of DcaSOD Genes in Response to Heat, Light and NaCl Treatments

To gain insight into potential functions, qRT-PCR was used to assess the heat (35 °C), high light (HL), dark (LL) and NaCl treatments on the expression of eight DcaSOD genes in D. catenatum (Figure 6). Under heat stress, DcaCSD1 and DcaCSD3 were markedly up-regulated with the extension of time, especially in 48 h. The expression levels DcaCSD2 significantly increased in 4 h and 24 h, and followed with a decrease expression level in 48 h. The DcaFSD1, DcaFSD2, DcaFSD3 and DcaMSD1 were down-regulated under heat stresses, except for the DcaFSD1 in 48 h, DcaFSD3 in 24 h and DcaMSD1 in 4 h (Figure 6). Expression levels of seven DcaSOD genes including DcaCSD1, DcaCSD2, DcaCSD3, DcaCSD4, DcaFDS1, DcaFDS2 and DcaMSD1, were markedly up-regulated in leaves after HL treatments. The expression level of DcaCSD3 under HL treatment for 24 h was two times than that of control. It is notable that LL suppressed the expression of almost DcaSOD genes (Figure 7). Under salt stress, six DcaSOD genes including DcaCSD1, DcaCSD2, DcaCSD3, DcaCSD4, DcaFSD1, and DcaMSD1 were up-regulated in 24 h, especially the members of CSD subfamily. With the extension of salt stress time to 48 h, the expression levels of these DcaSOD genes were down-regulated compared with 24 h, except for the DcaFSD1 (Figure 8).

3. Discussion

Environmental stresses pose considerable challenges for plant growth and development. SODs are the core of antioxidant enzymes, and can effectively reduce oxidative damage via scavenging the active oxygen produced by organisms under stress. The crucial roles of SOD genes in the acclimation of plants to abiotic stresses have been demonstrated in many previous studies. However, detailed information concerning DcaSODs characters and functions, particularly their role in stresses responses of D. catenatum, remained unclear. Therefore, a systematic analysis of the SOD gene family was performed in D. catenatum.
In this study, a total of eight DcaSOD genes were identified in D. catenatum genome. Compared with other plant species, the number of SOD genes in D. catenatum is close to A. thaliana (8), tomato (8), cucumber (9), and S. miltiorrhiza (8), which is less than that in banana (12), cotton (Gossypium hirsutum, 18), Wheat (26). Intragenome syntenic relationship analysis indicated that MaCSD2A and 2B, and MaMSD1A and 1C or 1D in banana genome were derived from whole genome duplication [15]. Differences in the number of SOD genes between plant species may be attributed to gene duplication, which comprises tandem and segmental duplication, and plays a crucial role in the expansion of SOD genes for diversification. Analysis of the evolutionary relationships of SOD proteins among D. catenatum, Arabidopsis, O. sativa, P. equestris and A. shenzhenica showed that SOD proteins could be divided into three subfamily based on their metal co-factors, namely CSD, FSD, and MSD subfamily (Figure 1). Previous studies showed that there are only FeSOD and MnSOD in algae and bryophytes. Cu/ZnSOD only exist in higher plants, implying that FeSOD and MnSOD evolved first, and then Cu/ZnSOD appeared later to cope with the complex external environment that affects plant growth and development [22]. We found that all DcaSOD proteins were much closer to PeqSOD proteins than AshSOD proteins. There is a much closer evolutionary relationship between D. catenatum and P. equestris than D. catenatum and A. shenzhenica based on the whole genome sequences analysis [23]. The conserved motifs and gene structures provided further support for the classification of DcaSOD proteins in D. catenatum. The DcaFSD3 has a shorter length compared to other DcaSODs and FSDs in other species. We infer that the gene has been truncated, and key domains are missing. The failure of subcellular location prediction, and few identified motifs and exons in DcaFSD3 might attribute to its truncated sequence. Most DcaSOD proteins of the same group apparently had similar motifs constituents (Figure 2), which is in accordance with the results in other plant species [15,17,18]. Taken together, the similarities in conserved motifs and gene structures in the same subfamily corroborate their classification and inferred evolutionary relationships.
In D. catenatum, most DcaSOD genes displayed distinct tissue-specific expression patterns (Figure 5a). Most of them showed higher expression level in flower, which is similar to previous studies on foxtail millet [24] and Zostera marina [25]. There is a high production of ROS during organogenesis and reproductive metabolism, and high expression levels of SOD gene in flowers [18,19]. Moreover, most DcaSOD genes were highly expressed in leaf. MaCSD1D and MaFSD1A in banana exhibited the highest expression levels in leaves. However, other MaSODs were expressed moderately in leaves [15]. In cucumber, the expression of CsCSD1, CsCSD2, CsFSD1, CsFSD2 were also abundantly expressed in leaves [18]. The preferential expression patterns of SOD genes imply their specific roles in the development and biological function of different tissues. In addition, there might be functional divergence of SODs in different species.
A lot of evidence demonstrated that SOD genes participated in abiotic stresses responses [12,13,14,15]. A total of 142 cis-elements related to hormones and stresses responses were identified in all identified DcaSOD promoters (Figure 4). Among these predicted cis-elements, the light responsiveness elements (77) were the largest group element and appeared in six DcaSOD promoters (Figure 4). In cucumber, the light-responsive elements were also the largest group of elements [18]. A relatively large number of light-responsive cis-elements was also observed in tomato SiSOD promoters [17]. These results might suggest that the SOD genes participate in light response, which was confirmed by our qRT-PCR analysis (Figure 6). Under high and low light conditions, almost DcaSOD genes showed different expression levels. The high light promoted the expression of all DcaSOD genes, except for DcaFSD3. Transgenci pea with an overexpressing chloroplastic Cu/ZnSOD showed increased resistant to high light [26]. Although only three low-temperature responsiveness elements were found in DcaCSD2 and DcaFSD1 genes (Figure 4), almost DcaSODs were up-regulated under cold treatment (Figure 5b), demonstrating that those DcaSODs might play a predominant antioxidant role under cold stress. The introduction of MnSOD into the mitochondria and chloroplast of alfalfa resulted in an improvement of freeze tolerance [27]. Several cis-elements involved in drought response including ABA responsiveness, drought-inducibility and defense and stress responsiveness were identified in DcaCSD4, DcaFSD2, DcaFSD3 and DcaMSD1 (Figure 4). RNA-Seq data analysis results showed that all DcaSODs were up-regulated under drought treatment (Figure 5). Drought tolerance of sugarcane was attributed to the elevated activity of SOD [28]. Han et al. [21] demonstrated that SmCSD2 and SmCSD3 were highly expressed under drought stress in S. miltiorrhiza. Furthermore, the Pearson correlation analysis revealed that several genes function as stress resistance had close relationship with DcaCSD1 and DcaCSD2. For example, a glutathione peroxidase (DN33357_c2_g2_i1) that constitutes a glutathione peroxidase-like protective system against oxidative stresses [29], has a close relationship with DcaCSD1. The proline-rich receptor-like protein kinase (PERK) (DN29768_c0_g1_i3) has a close relationship with DcaCSD2. PERK suppressed the accumulation of ROS in Arabidopsis root [30]. The correlation analysis could provide useful information to reveal the regulation network of important pathways [31,32]. Under heat stress, the expression levels of four DcaCSDs increased at three time points, except for DcaCSD1 and DcaCSD4 at 4 h and DcaCSD2 at 48 h. However, the expression patterns of three DcaFSDs were opposite to that of DcaCSDs, and deceased under heat stress at 4 h. Heat stress can cause photoinhibition of PSII and promotes the accumulation of ROS, which accelerates oxidative stress [33]. Heat stress represses the expression of chloroplastic MaCSD2A but strongly induces chloroplastic MaFSD1A in banana [15]. It must be aware that there are different mechanisms of antioxidants to response the short-time (minutes and hours) reaction and the long-term adaptation in different light and temperature treatments [34]. Under NaCl stress, four DcaCSDs gene and DcaMSD1 were significantly up-regulated in 24 h, especially DcaCSD2 and DcaCSD3, and then decreased in 48 h. Contrast to DcaCSDs and DcaMSD1, three DcaFSDs were down-regulated or unchanged. We infer that DcaCSDs and DcaMSD1 genes play important role in coping with salt stress. Wang et al. [35] reported that transgenic Arabidopsis overexpressing MnSOD enhanced salt-tolerance. Further studies are needed to clarify the role of DcaSODs in the future.

4. Materials and Methods

4.1. Identification and Sequence Analysis of DcaSOD Genes in D. catenatum

The SOD proteins sequences of A. thaliana and O. sativa were retrieved from The Arabidopsis Information Resource (TAIR) (https://www.arabidopsis.org/) and Phytozome (http://www.phytozome.net/). The genome sequences of the D. catenatum, P. equestris and A. shenzhenica were downloaded from NCBI under the accession codes JSDN00000000 [6], PRJNA389183 and PRJNA310678 [23]. Firstly, SOD proteins sequences from Arabidopsis and O. sativa as query sequences to search the D. catenatum, P. equestris and A. shenzhenica protein database for candidate sequences by BLASTP (E-value < 1 × 10⁻⁵). In addition, then, the hmmsearch program of the HMMER software (version 3.2.1) (http://hmmer.org/download.html) was also applied to the identification of Fe/MnSOD (PF02777 and PF00081) and Cu/ZnSOD (PF00080) in Pfam 32.0 database (http://pfam.xfam.org/). For further screening, the above obtained protein sequences were analyzed by SMART (http://smart.embl-heidelberg.de/) and NCBI Conserved Domain-search (https://www.ncbi.nlm.nih.gov/cdd). Physicochemical characteristics of the DcaSOD proteins were computed using the online ExPASy-ProtParam tool (http://web.expasy.org/protparam/), including the number of amino acids, molecular weight (MW), isoelectric point (pI) and grand average of hydropathicity (GRAVY). The subcellular localization of DcaSOD proteins were predicted by ProComp 9.0 (http://linux1.softberry.com).

4.2. Phylogenetic Analysis

All predicted DcaSODs together with SODs of Arabidopsis, O. sativa, P. equestris and A. shenzhenica were aligned with CLUSTAL. A Maximum-Likelihood (ML) phylogenetic tree was constructed by MEGA X (version 10.1.7) [36], with the bootstrap values of 1000 replicates. The phylogenetic tree was visualized by iTOL (https://itol.embl.de/) [37].

4.3. Conserved Motifs, Gene Structures, Locations, Multiple Sequence Alignments and Cis-elements Analyses of DcaSOD Genes

The distribution of the conserved motifs based on amino acid sequence was conducted with the MEME (http://meme.nbcr.net/meme/) [38] and was visualized by using TBtools [39]. The exon-intron structures of DcaSOD genes were analyzed by the Gene Structure Display Server (GSDS) (http://gsds.cbi.pku.edu.cn/). According to the D. catenatum genome annotation file, the start and end location information of DcaSOD genes were extracted and visualized by TBtools. Multiple sequence alignments of the amino acid sequences of DcaSOD proteins were performed by ClustalW software (https://www.genome.jp/tools-bin/clustalw) and then redrawn with ESPript 3.0 (http://espript.ibcp.fr/ESPript/ESPript/index.php). For cis-acting regulatory elements predication, the DNA sequences (2000 bp) upstream of the initiation codon for each candidate gene were extracted, and the cis-elements were predicted with PlantCARE (http://bioinformatics.psb.ugent.be/webtools/plantcare/html/) [40].

4.4. Transcriptome Analysis

The raw RNA-seq data of different tissues under cold and dry treatments of D. catenatum were downloaded from the NCBI Sequence Read Archive (SRA) database (http://www.ncbi.nlm.nih.gov/sra) under the BioProject number PRJNA283237, PRJNA314400, and PRJNA432825 [41]. Hisat [42] was used for mapping reads to the D. catenatum reference genome with default parameters. The Stringtie [43] was used to analyze gene expression level, and then the Fragments Per Kilobase Million (FPKM) value was used to normalize gene expression level. The DEseq2 [44] was employed to identify the differentially expressed genes (DEGs) with a threshold of fold change ≥ 2 and false discovery rate (FDR) ≤ 0.01. The heatmaps of gene expression and the correlation coefficient calculation were performed by R software.

4.5. Plant Material, Growth Conditions and Treatments

D. catenatum three-year old plantlets were used in this study. For light treatments, the plantlets were treated under dark (designed as LL), high light (250 μmol photons m−2s−1, designed as HL) and 12 h light (80 μmol photons m−2s−1)/12 h dark photoperiod (control) for 24 and 48 h in greenhouse. For heat treatment, the plantlets were treated at 35 °C for 4, 24 and 48 h, and 25 °C was used as control in a growth chamber. Under salt stress, plantlets were treated with 0.5 M NaCl and sterile water (control) for 24 and 48 h in greenhouse. After treatments, mature leaves were collected and frozen immediately in liquid nitrogen, and stored at −80 °C for RNA extraction. Three biological replicate samples were contained in each treatment.

4.6. Real-Time PCR Experiment

Total RNAs were extracted using RNAprep Pure kit (DP441, Tiangen, Beijing, China), and were used as template to synthesize the first-strand cDNA by using the FastKing RT kit (Tiangen, Beijing, China). The primers were designed based on DcaSOD genes sequences using Premier 5.0 software (Table S4). The DcaActin gene was selected as an internal standard. qRT-PCR was performed on ABI PRISM® 7500 Sequence Detection System (Applied Biosystems, Foster City, CA, USA). qRT-PCR assay was performed as described Yao et al. [45]. The 2–ΔΔCT method was used to analyze relative transcript abundances. Student’s t-test was employed using SPSS software (version 18.0) to calculated levels of significance (* p < 0.05, ** p < 0.01).

Supplementary Materials

Supplementary Materials can be found at https://www.mdpi.com/2223-7747/9/11/1452/s1. Table S1: The SOD protein sequences of D. catenatum, Arabidopsis, O. sativa, P. equestris and A. shenzhenica. Table S2: The predicted cis-elements of DcaSOD genes promoters. Table S3: The annotation and expression level of DEGs under drought. Table S4: qRT-PCR primers used in this study.

Author Contributions

H.H. and Y.W. conceived and designed the experiments; H.H., H.W. and Y.T. performed the experiments and analyzed the data; H.H. wrote and revised the paper. All authors read and approved the final manuscript.

Funding

This work was supported by the Strategic Priority Research Program of Chinese Academy of Sciences (No. XDA20050204), the Second Tibetan Plateau Scientific Expedition and Research (STEP) program (2019QZKK0502), and the grant from the Beijing DR PLANT Biotechnology Co., Ltd.

Conflicts of Interest

The authors declare no conflict of interest.

References

  1. Atwood, J. The size of Orchidaceae and the systematic distribution of epiphytic orchids. Selbyana 1986, 9, 171–186. [Google Scholar]
  2. Su, W.H.; Zhang, G.F. The photosynthesis pathway in leaves of Dendrobium catenatum. Chin. J. Plant Ecol. 2003, 27, 631–637. [Google Scholar]
  3. Zhang, Z.; Dongxian, H.; Rongfu, G. Concomitant CAM and C3 photosynthetic pathways in Dendrobium catenatum plants. J. Am. Soc. Hortic. Sci. 2014, 139, 290–298. [Google Scholar] [CrossRef] [Green Version]
  4. Zhang, S.B.; Dai, Y.; Hao, G.Y.; Li, J.W.; Fu, X.W.; Zhang, J.L. Differentiation of water-related traits in terrestrial and epiphytic Cymbidium species. Front. Plant Sci. 2015, 6, 1–10. [Google Scholar] [CrossRef] [Green Version]
  5. Yan, L.; Wang, X.; Liu, H.; Tian, Y.; Lian, J.; Yang, R.; Hao, S.; Wang, X.; Yang, S.; Li, Q.; et al. The genome of Dendrobium officinale illuminates the biology of the important traditional chinese orchid herb. Mol. Plant 2015, 8, 922–934. [Google Scholar] [CrossRef] [Green Version]
  6. Zhang, G.-Q.; Xu, Q.; Bian, C.; Tsai, W.-C.; Yeh, C.-M.; Liu, K.-W.; Yoshida, K.; Zhang, L.-S.; Chang, S.-B.; Chen, F.; et al. The Dendrobium catenatum Lindl. genome sequence provides insights into polysaccharide synthase, floral development and adaptive evolution. Sci. Rep. 2016, 6, 19029. [Google Scholar] [CrossRef] [Green Version]
  7. Hsieh, Y.S.; Chien, C.; Liao, S.K.; Liao, S.F.; Hung, W.T.; Yang, W.B.; Lin, C.C.; Cheng, T.J.; Chang, C.C.; Fang, J.M. Structure and bioactivity of the polysaccharides in medicinal plant Dendrobium huoshanense. Bioorganic Med. Chem. 2008, 16, 6054–6068. [Google Scholar] [CrossRef]
  8. Ng, T.B.; Liu, J.; Wong, J.H.; Ye, X.; Sze, S.C.W.; Tong, Y.; Zhang, K.Y. Review of research on Dendrobium, a prized folk medicine. Appl. Microbiol. Biotechnol. 2012, 93, 1795–1803. [Google Scholar] [CrossRef]
  9. Karuppanapandian, T.; Moon, J.C.; Kim, C.; Manoharan, K.; Kim, W. Reactive oxygen species in plants: Their generation, signal transduction, and scavenging mechanisms. Aust. J. Crop Sci. 2011, 5, 709–725. [Google Scholar]
  10. Gupta, S.; Dong, Y.; Dijkwel, P.P.; Mueller-Roeber, B.; Gechev, T.S. Genome-wide analysis of ROS antioxidant genes in resurrection species suggest an involvement of distinct ROS detoxification systems during desiccation. Int. J. Mol. Sci. 2019, 20, 3101. [Google Scholar] [CrossRef] [Green Version]
  11. Wang, W.; Xia, M.; Chen, J.; Yuan, R.; Deng, F.; Shen, F. Gene expression characteristics and regulation mechanisms of superoxide dismutase and its physiological roles in plants under stress. Biochemistry 2016, 81, 465–480. [Google Scholar] [CrossRef] [PubMed]
  12. Perl, A.; Perl-Treves, R.; Galili, S.; Aviv, D.; Shalgi, E.; Malkin, S.; Galun, E. Enhanced oxidative-stress defense in transgenic potato expressing tomato Cu, Zn superoxide dismutases. Theor. Appl. Genet. 1993, 85, 568–576. [Google Scholar] [CrossRef] [PubMed]
  13. Pilon, M.; Ravet, K.; Tapken, W. The biogenesis and physiological function of chloroplast superoxide dismutases. BBA Bioenerg. 2011, 1807, 989–998. [Google Scholar] [CrossRef] [PubMed] [Green Version]
  14. Asensio, A.C.; Gil-Monreal, M.; Pires, L.; Gogorcena, Y.; Aparicio-Tejo, P.M.; Moran, J.F. Two Fe-superoxide dismutase families respond differently to stress and senescence in legumes. J. Plant Physiol. 2012, 169, 1253–1260. [Google Scholar] [CrossRef] [PubMed]
  15. Feng, X.; Lai, Z.; Lin, Y.; Lai, G.; Lian, C. Genome-wide identification and characterization of the superoxide dismutase gene family in Musa acuminata cv. Tianbaojiao (AAA group). BMC Genom. 2015, 16, 823. [Google Scholar] [CrossRef] [PubMed] [Green Version]
  16. Kliebenstein, D.J.; Monde, R.A.; Last, R.L. Superoxide dismutase in Arabidopsis: An eclectic enzyme family with disparate regulation and protein localization. Plant Physiol. 1998, 118, 637–650. [Google Scholar] [CrossRef] [PubMed] [Green Version]
  17. Feng, K.; Yu, J.; Cheng, Y.; Ruan, M.; Wang, R.; Ye, Q.; Zhou, G.; Li, Z.; Yao, Z.; Yang, Y.; et al. The SOD gene family in tomato: Identification, phylogenetic relationships, and expression patterns. Front. Plant Sci. 2016, 7, 1279. [Google Scholar] [CrossRef] [Green Version]
  18. Zhou, Y.; Hu, L.; Wu, H.; Jiang, L.; Liu, S. Genome-wide identification and transcriptional expression analysis of cucumber superoxide dismutase (SOD) family in response to various abiotic stress. Int. J. Genom. 2017, 2017, 7243973. [Google Scholar]
  19. Wang, W.; Zhang, X.; Deng, F.; Yuan, R.; Shen, F. Genome-wide characterization and expression analyses of superoxide dismutase (SOD) genes in Gossypium hirsutum. BMC Genom. 2017, 18, 376. [Google Scholar] [CrossRef] [Green Version]
  20. Jiang, W.Q.; Yang, L.; He, Y.Q.; Zhang, H.T.; Li, W.; Chen, H.G.; Ma, D.F.; Yin, J.L. Genome-wide identification and transcriptional expression analysis of superoxide dismutase (SOD) family in wheat (Triticum aestivum). PeerJ 2019, 7, e8062. [Google Scholar] [CrossRef] [Green Version]
  21. Han, L.M.; Hua, W.P.; Cao, X.Y.; Yan, J.A.; Chen, C.; Wang, Z.Z. Genome-wide identification and expression analysis of the superoxide dismutase (SOD) gene family in Salvia miltiorrhiza. Gene 2020, 742, 144603. [Google Scholar] [CrossRef] [PubMed]
  22. Lin, Y.L.; Lai, Z.X. Superoxide dismutase multigene family in longan somatic embryos: A comparison of CuZn-SOD, Fe-SOD, and Mn-SOD gene structure, splicing, phylogeny, and expression. Mol. Breed. 2013, 32, 595–615. [Google Scholar] [CrossRef]
  23. Zhang, G.Q.; Liu, K.W.; Li, Z.; Lohaus, R.; Hsiao, Y.Y.; Niu, S.-C.; Wang, J.-Y.; Lin, Y.-C.; Xu, Q.; Chen, L.-J.; et al. The Apostasia genome and the evolution of orchids. Nature 2017, 549, 379–386. [Google Scholar] [CrossRef] [PubMed] [Green Version]
  24. Wang, T.; Song, H.; Zhang, B.; Lu, Q.; Liu, Z.; Zhang, S.; Guo, R.; Wang, C.; Zhao, Z.; Liu, J. Genome-wide identification, characterization, and expression analysis of superoxide dismutase (SOD) genes in foxtail millet (Setaria italica L.). 3 Biotech 2018, 8, 486. [Google Scholar] [CrossRef] [PubMed]
  25. Zang, Y.; Chen, J.; Li, R.; Shang, S.; Tang, X. Genome-wide analysis of the superoxide dismutase (SOD) gene family in Zostera marina and expression profile analysis under temperature stress. PeerJ 2020, 8, 9063. [Google Scholar] [CrossRef] [PubMed]
  26. Gupta, A.S.; Heinen, J.L.; Holaday, A.S.; Burke, J.J.; Allen, R.D. Increased resistance to oxidative stress in transgenic plants that overexpress chloroplastic Cu/Zn superoxide dismutase. Proc. Natl. Acad. Sci. USA 1993, 90, 1629–1633. [Google Scholar] [CrossRef] [PubMed] [Green Version]
  27. McKersie, B.D.; Chen, Y.; de Beus, M.; Bowley, S.R.; Bowler, C.; Inze, D.; D’Halluin, K.; Botterman, J. Superoxide dismutase enhances tolerance of freezing stress in transgenic alfalfa (Medicago sativa L.). Plant Physiol. 1993, 103, 1155–1163. [Google Scholar] [CrossRef] [Green Version]
  28. Jain, R.; Chandra, A.; Venugopalan, V.K.; Solomon, S. Physiological changes and expression of SOD and P5CS genes in response to water deficit in Sugarcane. Sugar Tech 2015, 17, 276–282. [Google Scholar] [CrossRef]
  29. Milla, M.A.R.; Maurer, A.; Huete, A.R.; Gustafson, J.P. Glutathione peroxidase genes in Arabidopsis are ubiquitous and regulated by abiotic stresses through diverse signaling pathways. Plant J. 2003, 36, 602–615. [Google Scholar] [CrossRef]
  30. Hwang, Y.; Lee, H.; Lee, Y.S.; Cho, H.T. Cell wall-associated ROOT HAIR SPECIFIC 10, a proline-rich receptor-like kinase, is a negative modulator of Arabidopsis root hair growth. J. Exp. Bot. 2016, 67, 2007–2022. [Google Scholar] [CrossRef] [Green Version]
  31. Pillet, J.; Yu, H.W.; Chambers, A.H.; Whitaker, V.M.; Folta, K.M. Identification of candidate flavonoid pathway genes using transcriptome correlation network analysis in ripe strawberry (Fragaria × ananassa) fruits. J. Exp. Bot. 2015, 66, 4455–4467. [Google Scholar] [CrossRef] [PubMed]
  32. Ding, Z.; Fu, L.; Tan, D.; Sun, X.; Zhang, J. An integrative transcriptomic and genomic analysis reveals novel insights into the hub genes and regulatory networks associated with rubber synthesis in H. brasiliensis. Ind. Crop. Prod. 2020, 153, 112562. [Google Scholar] [CrossRef]
  33. Lu, T.; Meng, Z.; Zhang, G.; Qi, M.; Sun, Z.; Liu, Y.; Li, T. Sub-high temperature and high light intensity induced irreversible inhibition on photosynthesis system of tomato plant (Solanum lycopersicum L.). Front. Plant Sci. 2017, 8, 365. [Google Scholar] [CrossRef] [PubMed] [Green Version]
  34. Szymańska, R.; Ślesak, I.; Orzechowska, A.; Kruk, J. Physiological and biochemical responses to high light and temperature stress in plants. Environ. Exp. Bot. 2017, 139, 165–177. [Google Scholar] [CrossRef]
  35. Wang, Y.; Ying, Y.; Chen, J.; Wang, X. Transgenic Arabidopsis overexpressing MnSOD enhanced salt-tolerance. Plant Sci. 2004, 4, 671–677. [Google Scholar] [CrossRef]
  36. Kumar, S.; Stecher, G.; Li, M.; Knyaz, C.; Tamura, K. MEGA X: Molecular evolutionary genetics analysis across computing platforms. Mol. Biol. Evol. 2018, 35, 1547–1549. [Google Scholar] [CrossRef]
  37. Letunic, I.; Bork, P. Interactive tree of life (iTOL) v3: An online tool for the display and annotation of phylogenetic and other trees. Nucleic Acids Res. 2016, 44, 242–245. [Google Scholar] [CrossRef]
  38. Bailey, T.L.; Williams, N.; Misleh, C.; Li, W.W. MEME: Discovering and analyzing DNA and protein sequence motifs. Nucleic Acids Res. 2006, 34, 369–373. [Google Scholar] [CrossRef]
  39. Chen, C.; Chen, H.; Zhang, Y.; Thomas, H.R.; Frank, M.H.; He, Y.; Xia, R. TBtools-an integrative toolkit developed for interactive analyses of big biological data. Mol. Plant 2020, 13, 1194–1202. [Google Scholar] [CrossRef]
  40. Lescot, M.; Déhais, P.; Thijs, G.; Marchal, K.; Moreau, Y.; Van de Peer, Y.; Rouzé, P.; Rombauts, S. PlantCARE, a database of plant cis-acting regulatory elements and a portal to tools for in silico analysis of promoter sequences. Nucleic Acids Res. 2002, 30, 325–327. [Google Scholar] [CrossRef]
  41. Wan, X.; Zou, L.H.; Zheng, B.Q.; Tian, Y.Q.; Wang, Y. Transcriptomic profiling for prolonged drought in Dendrobium catenatum. Sci. Data 2018, 5, 180233. [Google Scholar] [CrossRef] [PubMed]
  42. Kim, D.; Langmead, B.; Salzberg, S.L. HISAT: A fast spliced aligner with low memory requirements. Nat. Methods 2015, 12, 357–360. [Google Scholar] [CrossRef] [PubMed] [Green Version]
  43. Pertea, M.; Pertea, G.M.; Antonescu, C.M.; Chang, T.C.; Mendell, J.T.; Salzberg, S.L. StringTie enables improved reconstruction of a transcriptome from RNA-seq reads. Nat. Biotechnol. 2015, 33, 290–295. [Google Scholar] [CrossRef] [Green Version]
  44. Love, M.I.; Huber, W.; Anders, S. Moderated estimation of fold change and dispersion for RNA-seq data with DESeq2. Genome Biol. 2014, 15, 550. [Google Scholar] [CrossRef] [PubMed] [Green Version]
  45. Yao, Q.Y.; Huang, H.; Tong, Y.; Xia, E.H.; Gao, L.Z. Transcriptome analysis identifies candidate genes related to triacylglycerol biosynthesis, flower coloration and flowering time control in Camellia reticulata (Theaceae), a well-known ornamental and oil-producing plant. Front. Plant Sci. 2016, 7, 163. [Google Scholar] [CrossRef] [PubMed] [Green Version]
Figure 1. Phylogenetic tree of SOD proteins from D. catenatum, Arabidopsis, Oryza sativa, Phalaenopsis equestris and Apostasia shenzhenica. The phylogenetic tree was constructed using the Maximum-Likelihood (ML) method with 1000 bootstrap replications. The three subfamilies were distinguished in different colors. The identified DcaSOD proteins were highlighted by red.
Plants 09 01452 g001
Figure 2. The motif composition and distribution of SOD proteins in D. catenatum, Arabidopsis, O. sativa and P. equestris and A. shenzhenica. The colored boxes with numbers represent seven motif. The identified DcaSOD proteins were highlighted by red.
Plants 09 01452 g002
Figure 3. Gene structures, locations, and multiple sequence alignment of DcaSOD genes. (a) Gene structures of DcaSOD genes. Exons and introns were represented by green ellipses and gray lines, respectively. (b) Locations of DcaSOD genes. The orange bars indicate the different scaffolds of D. catenatum genome. (c) Multiple sequence alignment of amino acid sequences of DcaSOD proteins. Cu/ZnSOD signatures (G[FL]H[VLI]H[DEGS][FY]GD[TI]) and (GNAG[GA]R[LI][AG]CG) are boxed in red. The conserved metal-binding domain (D[MV]WE[VH][TA][IY][LY]) for Fe-MnSOD is in yellow box. The signature (A[EQ][VT]WNHDFFW[EQ]S) responsible for the recognition of iron ion by FeSODs in boxed in green.
Plants 09 01452 g003
Figure 4. Cis-elements in promoters of DcaSOD genes that are related to hormone and stresses responses. The bar indicates that the number of cis-elements.
Plants 09 01452 g004
Figure 5. Expression profiles of DcaSOD genes in different tissues, cold and drought treatments. (a) Tissues. (b) Cold treatment. (c) Drought treatment. The Fragments Per Kilobase Million (FPKM) values of genes in samples were showed by different colored rectangles. Red indicates high expression level. Blue indicates low expression level.
Plants 09 01452 g005
Figure 6. qTR-PCR analysis of the expression patterns of DcaSOD genes under heat treatments. The relative qRT-PCR expression levels were calculated with 2∆∆CT and the DcaActin gene was used as endogenous reference gene. Error bars represent the standard deviation of three replications. Bars marked with asterisks indicate significant differences (Student’s t-test) to corresponding control samples for the time points under treatments (* p < 0.05, ** p < 0.01).
Plants 09 01452 g006
Figure 7. qTR-PCR analysis of the expression patterns of DcaSOD genes under high light and dark treatments. The relative qRT-PCR expression levels were calculated with 2∆∆CT and the DcaActin gene was used as endogenous reference gene. Error bars represent the standard deviation of three replications. Bars marked with asterisks indicate significant differences (Student’s t-test) to corresponding control samples for the time points under treatments (* p < 0.05, ** p < 0.01).
Plants 09 01452 g007
Figure 8. qTR-PCR analysis of the expression patterns of DcaSOD genes under NaCl treatment. The relative qRT-PCR expression levels were calculated with 2∆∆CT and the DcaActin gene was used as endogenous reference gene. Error bars represent the standard deviation of three replications. Bars marked with asterisks indicate significant differences (Student’s t-test) to corresponding control samples for the time points under treatments (* p < 0.05, ** p < 0.01).
Plants 09 01452 g008
Table 1. Summary of physicochemical characteristics and classification of DcaSOD proteins in D. catenatum.
No.Gene NameGene IDFunctional
Annotations
PositionProtein Length (aa)MWpIPredicted Subcellular LocalizationGrand Average of Hydropathicity (GRAVY)
1DcaCSD1Dca002609Cu/ZnSODKZ503041.1:12,499,497–2,513,68222422,761.916.43Chloroplast0.086
2DcaCSD2Dca003218Cu/ZnSODKZ501977.1:4,636,681–4,648,21115215,312.985.34Cytoplasmic−0.208
3DcaCSD3Dca012338Cu/ZnSODKZ503541.1:64,465–66,95222222,926.956.29Cytoplasmic−0.008
4DcaCSD4Dca016361Cu/ZnSODKZ502953.1:468,317–473,37416416,547.336.16Cytoplasmic−0.151
5DcaFSD1Dca023874FeSODKZ501928.1:290,962–306,81522826,325.256.71Chloroplast−0.344
6DcaFSD2Dca004481FeSODKZ502877.1:8,227,560–8,230,82226930,783.394.91Chloroplast−0.488
7DcaFSD3Dca024864FeSODKZ503331.1:79–3877626,554.215.66None0.603
8DcaMSD1Dca024548MnSODKZ502716.1:147,498–155,75923826,554.218.61Mitochondrial−0.343
Table 2. The Pearson correlation coefficients between two DcaCSD genes and other DEGs. The FPKM values of these genes are listed in Table S3. The genes with a correlation coefficients > 0.99 with DcaCSD1 have been indicated by red. The genes with a correlation coefficients > 0.99 with DcaCSD2 have been indicated by blue.
Gene IDCorrelation Coefficientp-ValueDescription
DcaCSD1
DN40231_c3_g1_i30.9990.0004MADS box protein DOMADS2
DN32316_c5_g1_i30.9990.0005HVA22-like protein e
DN28998_c0_g1_i2−0.9990.0007Cytochrome P450 90B2
DN33200_c0_g6_i40.9990.0008/
DN37544_c1_g1_i10.9990.0012CDT1-like protein a, chloroplastic
DN31187_c4_g1_i20.9990.001Sucrose synthase
DN36361_c1_g5_i2−0.9970.0026Trimethyltridecatetraene synthase
DN33357_c2_g2_i10.9960.0038Putative glutathione peroxidase 7, chloroplastic
DN24425_c0_g1_i20.9960.0039Dermcidin
DN32586_c2_g4_i10.9960.0041Aldehyde dehydrogenase family 2 member C4
DN36550_c0_g2_i40.9960.0041DEAD-box ATP-dependent RNA helicase 50
DN29711_c0_g1_i20.9960.0044Keratin, type I cytoskeletal 14
DN78496_c0_g1_i10.9960.0044Apolipoprotein E
DN39306_c2_g1_i50.9950.0048Keratin, type I cytoskeletal 10
DN29035_c0_g1_i10.9950.0049Probable histone H2A.2
DcaCSD2
DN29768_c0_g1_i3−0.9950.0046Proline-rich receptor-like protein kinase PERK13
DN33141_c1_g5_i1−0.9950.0049/
DN33417_c1_g1_i2−0.9990.0013Zinc-finger homeodomain protein 2
DN34829_c2_g1_i11−0.9970.0027Receptor-like serine/threonine-protein kinase SD1-7
DN36012_c3_g1_i1−0.9990.0008WAT1-related protein At5g64700
DN36361_c1_g1_i2−0.9960.0037Trimethyltridecatetraene synthase
DN36986_c4_g1_i20.9970.0033Starch branching enzyme I
DN37712_c8_g3_i2−0.9990.00033-O-acetylpapaveroxine carboxylesterase CXE1
DN38190_c0_g2_i6−0.9970.0027Ricin B-like lectin R40C1
DN38200_c5_g1_i1−0.9950.0049/
DN38969_c0_g3_i6−0.9980.0020RNA-directed DNA polymerase homolog
DN40032_c2_g2_i2−0.9990.0008Transposon Ty3-I Gag-Pol polyprotein
DN40530_c1_g4_i20.9980.0025Probable alpha-mannosidase At5g13980
DN40586_c9_g5_i10.9970.0030Homeobox-leucine zipper protein HOX32
DN40622_c1_g3_i1−0.9980.0018Protein ASPARTIC PROTEASE IN GUARD CELL 1
Publisher’s Note: MDPI stays neutral with regard to jurisdictional claims in published maps and institutional affiliations.

