Soybean Yield and Seed Composition Changes in Response to Increasing Atmospheric CO2 Concentration in Short-Season Canada


Abstract
:1. Introduction
2. Results
3. Discussion
4. Materials and Methods
Author Contributions
Funding
Acknowledgments
Conflicts of Interest
References
- IPCC. Climate change 1995: The science of climate change. In Contribution of WGI to the Second Assessment Report of the Intergovernmental Panel on Climate Change; Houghton, J.T., Meira Filho, L.G., Callander, B.A., Harris, N., Kattenberg, A., Maskell, K., Eds.; Press Syndicate of the University of Cambridge: Cambridge, UK, 1996; p. 572. [Google Scholar]
- Tans, P.; Keeling, R. Trends in Atmospheric Carbon Dioxide; Dr. Pieter Tans, N.E.w.e.n.g.g.c.t.a.D.R.K., Scripps Institution of Oceanography (scrippsco2.ucsd.edu/): San Diego, CA, USA, 2016. [Google Scholar]
- Conroy, J.; Seneweera, S.; Basra, A.; Rogers, G.; Nissen-Wooller, B. Influence of rising atmospheric CO2 concentrations and temperature on growth, yield and grain quality of cereal crops. Funct. Plant Biol. 1994, 21, 741–758. [Google Scholar] [CrossRef]
- IPCC. Contribution of Working Group III to the Fourth Assessment Report of the Intergovernmental Panel on Climate Change; Metz, B., Davidson, O.R., Bosch, P.R., Dave, R., Meyer, L.A., Eds.; Cambridge University Press: New York, NY, USA, 2007; p. 851. [Google Scholar]
- Stitt, M. Rising CO2 levels and their potential significance for carbon flow in photosynthetic cells. Plant Cell Environ. 1991, 14, 741–762. [Google Scholar] [CrossRef]
- Long, S.P.; Ainsworth, E.A.; Leakey, A.D.B.; Nösberger, J.; Ort, D.R. Food for thought: Lower-than-expected crop yield stimulation with rising CO2 concentrations. Science 2006, 312, 1918–1921. [Google Scholar] [CrossRef]
- Fischer, R.A.; Byerlee, D.; Edmeades, O.G. Crop Yields and Global Food Security: Will Yield Increase Continue to Feed the World? Volume ACIAR Monograph No. 158; Australian Centre for International Agricultural Research: Canberra, Australia, 2014. [Google Scholar]
- Hatfield, J.L.; Boote, K.J.; Kimball, B.A.; Ziska, L.H.; Izaurralde, R.C.; Ort, D.; Thomson, A.M.; Wolfe, D. Climate impacts on agriculture: Implications for crop production. Agron. J. 2011, 103, 351–370. [Google Scholar] [CrossRef]
- Kimball, B.A. Carbon dioxide and agricultural yield: An assemblage and analysis of 430 prior observations. Agron. J. 1983, 75, 779–788. [Google Scholar] [CrossRef]
- Ainsworth, E.A.; Davey, P.A.; Bernacchi, C.J.; Dermody, O.C.; Heaton, E.A.; Moore, D.J.; Morgan, P.B.; Naidu, S.L.; Yoo Ra, H.-S.; Zhu, X.-G.; et al. A meta-analysis of elevated [CO2] effects on soybean (glycine max) physiology, growth and yield. Glob. Chang. Biol. 2002, 8, 695–709. [Google Scholar] [CrossRef]
- Sakurai, G.; Iizumi, T.; Nishimori, M.; Yokozawa, M. How much has the increase in atmospheric CO2 directly affected past soybean production? Sci. Rep. 2014, 4, 4978. [Google Scholar] [CrossRef]
- Ainsworth, E.A.; Long, S.P. What have we learned from 15 years of free-air CO2 enrichment (face)? A meta-analytic review of the responses of photosynthesis, canopy properties and plant production to rising CO2. New Phytol. 2005, 165, 351–372. [Google Scholar] [CrossRef]
- Morgan, P.B.; Bollero, G.A.; Nelson, R.L.; Dohleman, F.G.; Long, S.P. Smaller than predicted increase in aboveground net primary production and yield of field-grown soybean under fully open-air [CO2] elevation. Glob. Chang. Biol. 2005, 11, 1856–1865. [Google Scholar] [CrossRef]
- Bunce, J.A. Limitations to soybean photosynthesis at elevated carbon dioxide in free-air enrichment and open top chamber systems. Plant Sci. 2014, 226, 131–135. [Google Scholar] [CrossRef]
- Sicher, R.C.; Bunce, J.A. The impact of enhanced atmospheric CO2 concentrations on the responses of maize and soybean to elevated growth temperatures. In Combined Stresses in Plants, Physiological, Molecular and Biochemical Aspects; Mahalingam, R., Ed.; Springer: New York, NY, USA, 2015; pp. 27–48. [Google Scholar]
- Ziska, L.H.; Bunce, J.A.; Caulfield, F. Intraspecific variationF in seed yield of soybean glycine max in response to increased atmospheric carbon dioxide. Funct. Plant Biol. 1998, 25, 801–807. [Google Scholar] [CrossRef]
- Zheng, H.F.; Chen, L.D.; Han, X.Z. The effects of global warming on soybean yields in a long-term fertilization experiment in northeast china. J. Agric. Sci. 2009, 147, 569–580. [Google Scholar] [CrossRef]
- Bunce, J.A. Carbon dioxide effects on stomatal responses to the environment and water use by crops under field conditions. Oecologia 2004, 140, 1–10. [Google Scholar] [CrossRef]
- Purcell, L.C.; Edwards, J.T.; Brye, K.R. Soybean yield and biomass responses to cumulative transpiration: Questioning widely held beliefs. Field Crop Res. 2007, 101, 10–18. [Google Scholar] [CrossRef]
- Specht, J.E.; Chase, K.; Macrander, M.; Graef, G.L.; Chung, J.; Markwell, J.P.; Germann, M.; Orf, J.H.; Lark, K.G. Soybean response to water. Crop Sci. 2001, 41, 493–509. [Google Scholar] [CrossRef]
- Myers, S.S.; Zanobetti, A.; Kloog, I.; Huybers, P.; Leakey, A.D.B.; Bloom, A.J.; Carlisle, E.; Dietterich, L.H.; Fitzgerald, G.; Hasegawa, T.; et al. Increasing CO2 threatens human nutrition. Nature 2014, 510, 139–142. [Google Scholar] [CrossRef]
- Zhu, C.; Kobayashi, K.; Loladze, I.; Zhu, J.; Jiang, Q.; Xu, X.; Liu, G.; Seneweera, S.; Ebi, K.L.; Drewnowski, A.; et al. Carbon dioxide (CO2) levels this century will alter the protein, micronutrients, and vitamin content of rice grains with potential health consequences for the poorest rice-dependent countries. Sci. Adv. 2018, 4, eaaq1012. [Google Scholar] [CrossRef]
- Morrison, M.J.; Voldeng, H.D.; Cober, E.R. Physiological changes from 58 years of genetic improvement of short-season soybean cultivars in canada. Agron. J. 1999, 91, 685–689. [Google Scholar] [CrossRef]
- Morrison, M.J.; Voldeng, H.D.; Cober, E.R. Agronomic changes from 58 years of genetic improvement of short-season soybean cultivars in canada. Agron. J. 2000, 92, 780–784. [Google Scholar] [CrossRef]
- Morrison, M.J.; McLaughlin, N.B.; Cober, E.R.; Butler, G.M. When is short-season soybean most susceptible to water stress? Can. J. Plant Sci. 2006, 86, 1327–1331. [Google Scholar] [CrossRef]
- Cober, E.R.; Morrison, M.J.; Ma, B.; Butler, G. Genetic improvement rates of short-season soybean increase with plant population. Crop Sci. 2005, 45, 1029–1034. [Google Scholar] [CrossRef]
- Cober, E.R.; Morrison, M.J. Short-season soybean genetic improvement evaluated in weed-free and weedy conditions. Crop Sci. 2011, 51, 2582–2588. [Google Scholar] [CrossRef]
- Ontario Centre for Climate Impacts and Adaptation Resources, O. Historical Climate Trends for Ottawa CDA, Ontario; Ontario Centre for Climate Impacts and Adaptation Resources: Sudbury, ON, Canada, 2011. [Google Scholar]
- Cober, E.R.; Molnar, S.J.; Rai, S.; Soper, J.F.; Voldeng, H.D. Selection for cold tolerance during flowering in short-season soybean. Crop Sci. 2013, 53, 1356–1365. [Google Scholar] [CrossRef]
- Deryng, D.; Conway, D.; Ramankutty, N.; Price, J.; Warren, R. Global crop yield response to extreme heat stress under multiple climate change futures. Environ. Res. Lett. 2014, 9, 034011. [Google Scholar] [CrossRef]
- Kucharik, C.J.; Serbin, S.P. Impacts of recent climate change on wisconsin corn and soybean yield trends. Environ. Res. Lett. 2008, 3, 034003. [Google Scholar] [CrossRef]
- Mourtzinis, S.; Specht, J.E.; Lindsey, L.E.; Wiebold, W.J.; Ross, J.; Nafziger, E.D.; Kandel, H.J.; Mueller, N.; Devillez, P.L.; Arriaga, F.J.; et al. Climate-induced reduction in us-wide soybean yields underpinned by region- and in-season-specific responses. Nat. Plants 2015, 1, 14026. [Google Scholar] [CrossRef]
- Voldeng, H.D.; Cober, E.R.; Hume, D.J.; Gillard, C.; Morrison, M.J. Fifty-eight years of genetic improvement of short-season soybean cultivars in canada. Crop Sci. 1997, 37, 428–431. [Google Scholar] [CrossRef]
- Schmid, I.; Franzaring, J.; Müller, M.; Brohon, N.; Calvo, O.C.; Högy, P.; Fangmeier, A. Effects of CO2 enrichment and drought on photosynthesis, growth and yield of an old and a modern barley cultivar. J. Agron. Crop Sci. 2016, 202, 81–95. [Google Scholar] [CrossRef]
- Ziska, L.H. Three-year field evaluation of early and late 20th century spring wheat cultivars to projected increases in atmospheric carbon dioxide. Field Crop Res. 2008, 108, 54–59. [Google Scholar] [CrossRef]
- Ziska, L.H.; Morris, C.F.; Goins, E.W. Quantitative and qualitative evaluation of selected wheat varieties released since 1903 to increasing atmospheric carbon dioxide: Can yield sensitivity to carbon dioxide be a factor in wheat performance? Glob. Chang. Biol. 2004, 10, 1810–1819. [Google Scholar] [CrossRef]
- Johannessen, M.M.; Mikkelsen, T.N.; Nersting, L.G.; Gullord, M.; von Bothmer, R.; Jörgensen, R.B. Effects of increased atmospheric CO2 on varieties of oat. Plant Breed. 2005, 124, 253–256. [Google Scholar] [CrossRef]
- Kumagai, E.; Aoki, N.; Masuya, Y.; Shimono, H. Phenotypic plasticity conditions the response of soybean seed yield to elevated atmospheric CO2 concentration. Plant Physiol. 2015, 169, 2021–2029. [Google Scholar] [CrossRef]
- Taub, D.R.; Miller, B.; Allen, H. Effects of elevated CO2 on the protein concentration of food crops: A meta-analysis. Glob. Chang. Biol. 2008, 14, 565–575. [Google Scholar] [CrossRef]
- Yaklich, R.W.; Vinyard, B.T. Estimating soybean seed protein and oil concentration before harvest. J. Am. Oil Chem. Soc. 2004, 81, 189–194. [Google Scholar] [CrossRef]
- Springer, C.J.; Ward, J.K. Flowering time and elevated atmospheric CO2. New Phytol. 2007, 176, 243–255. [Google Scholar] [CrossRef]
- Castro, J.C.; Dohleman, F.G.; Bernacchi, C.J.; Long, S.P. Elevated CO2 significantly delays reproductive development of soybean under free-air concentration enrichment (face). J. Exp. Bot. 2009, 60, 2945–2951. [Google Scholar] [CrossRef]
- Cober, E.; Curtis, D.; Stewart, D.; Morrison, M. Quantifying the effects of photoperiod, temperature and daily irradiance on flowering time of soybean isolines. Plants 2014, 3, 476–497. [Google Scholar] [CrossRef]
- Cooper, R.L. A delayed flowering barrier to higher soybean yields. Field Crop Res. 2003, 82, 27–35. [Google Scholar] [CrossRef]
- Kantolic, A.G.; Mercau, J.L.; Slafer, G.A.; Sadras, V.O. Simulated yield advantages of extending post-flowering development at the expense of a shorter pre-flowering development in soybean. Field Crop Res. 2007, 101, 321–330. [Google Scholar] [CrossRef]
- Rowntree, S.C.; Suhre, J.J.; Weidenbenner, N.H.; Wilson, E.W.; Davis, V.M.; Naeve, S.L.; Casteel, S.N.; Diers, B.W.; Esker, P.D.; Conley, S.P. Physiological and phenological responses of historical soybean cultivar releases to earlier planting. Crop Sci. 2014, 54, 804–816. [Google Scholar] [CrossRef]
- Butts-Wilmsmeyer, C.J.; Seebauer, J.R.; Singleton, L.; Below, F.E. Weather during key growth stages explains grain quality and yield of maize. Agronomy 2019, 9, 16. [Google Scholar] [CrossRef]
- Tamura, R.; Kobayashi, K.; Takano, Y.; Miyashiro, R.; Nakata, K.; Matsui, T. Mixed integer quadratic optimization formulations for eliminating multicollinearity based on variance inflation factor. J. Glob. Optim. 2019, 73, 431–446. [Google Scholar] [CrossRef]

| Climate Parameter | Linear Rate of Change | SE | p-Value |
|---|---|---|---|
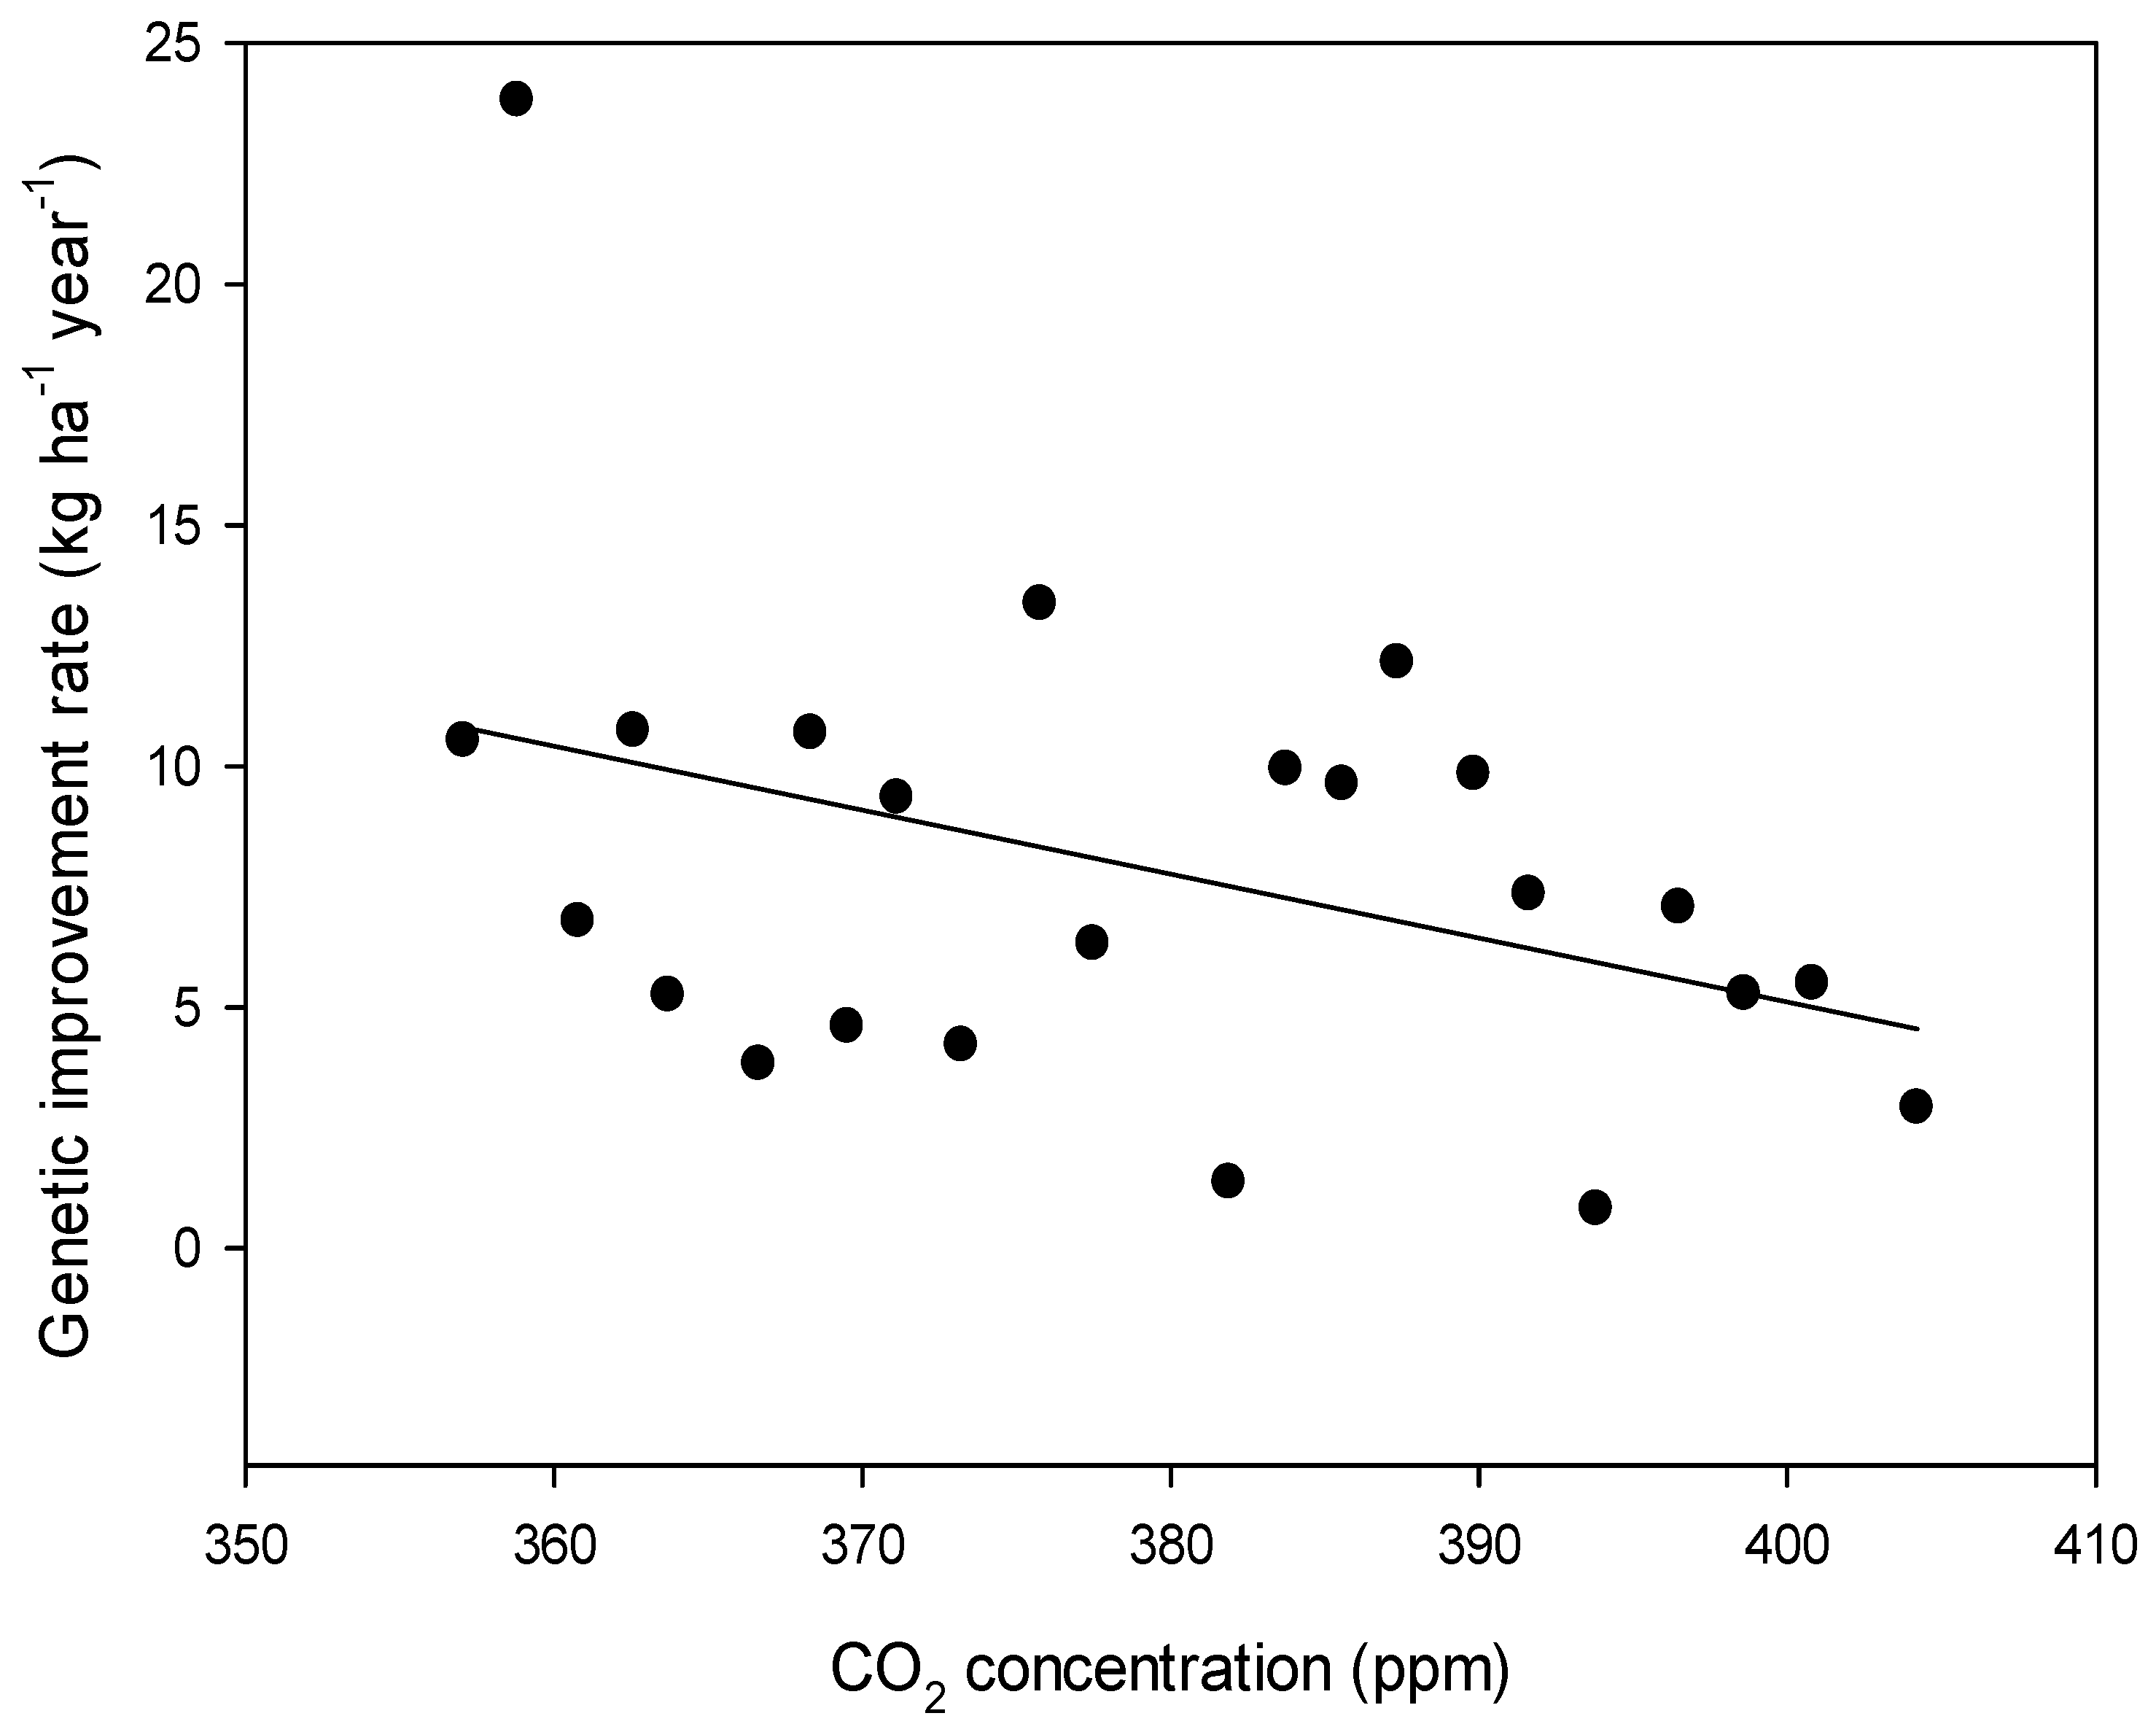
| [CO2] | 2.00 | 0.006 | <0.0001 |
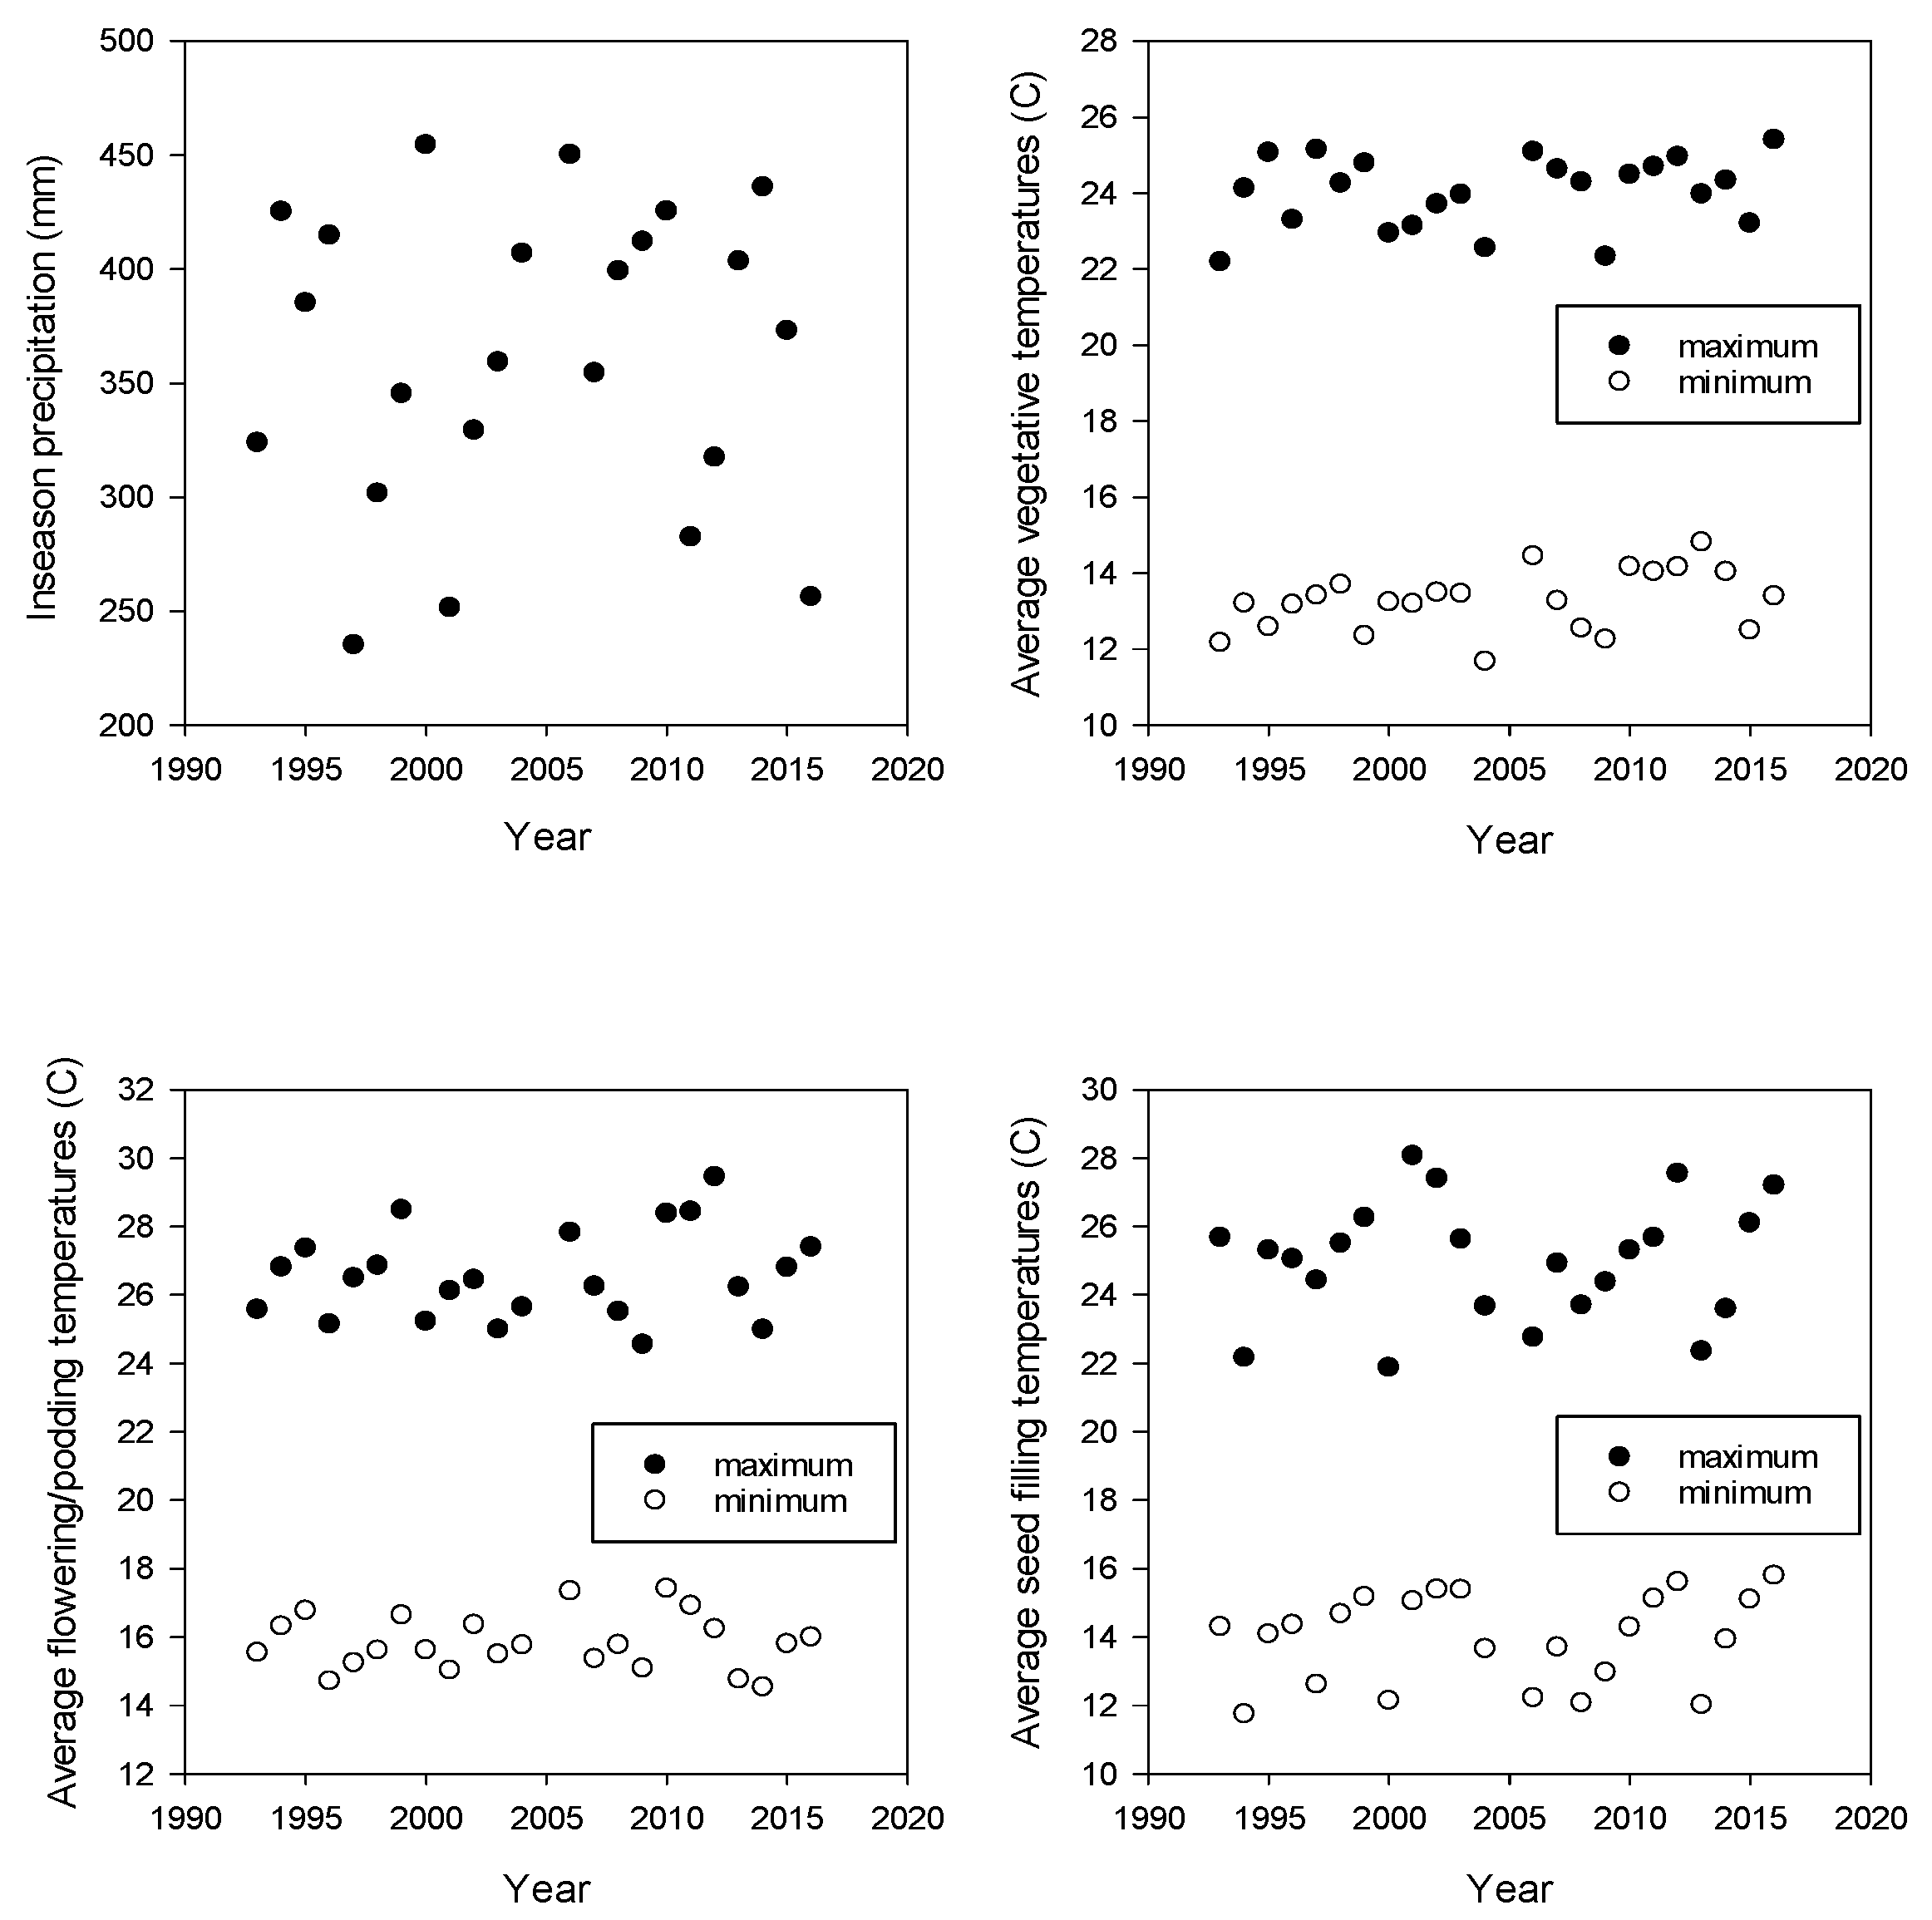
| In-season PPTN | -- | -- | ns |
| In-season mean Tmax | -- | -- | ns |
| In-season mean Tmin | -- | -- | ns |
| Days to first flower | −0.35 | 0.027 | <0.0001 |
| Days to maturity | -- | -- | ns |
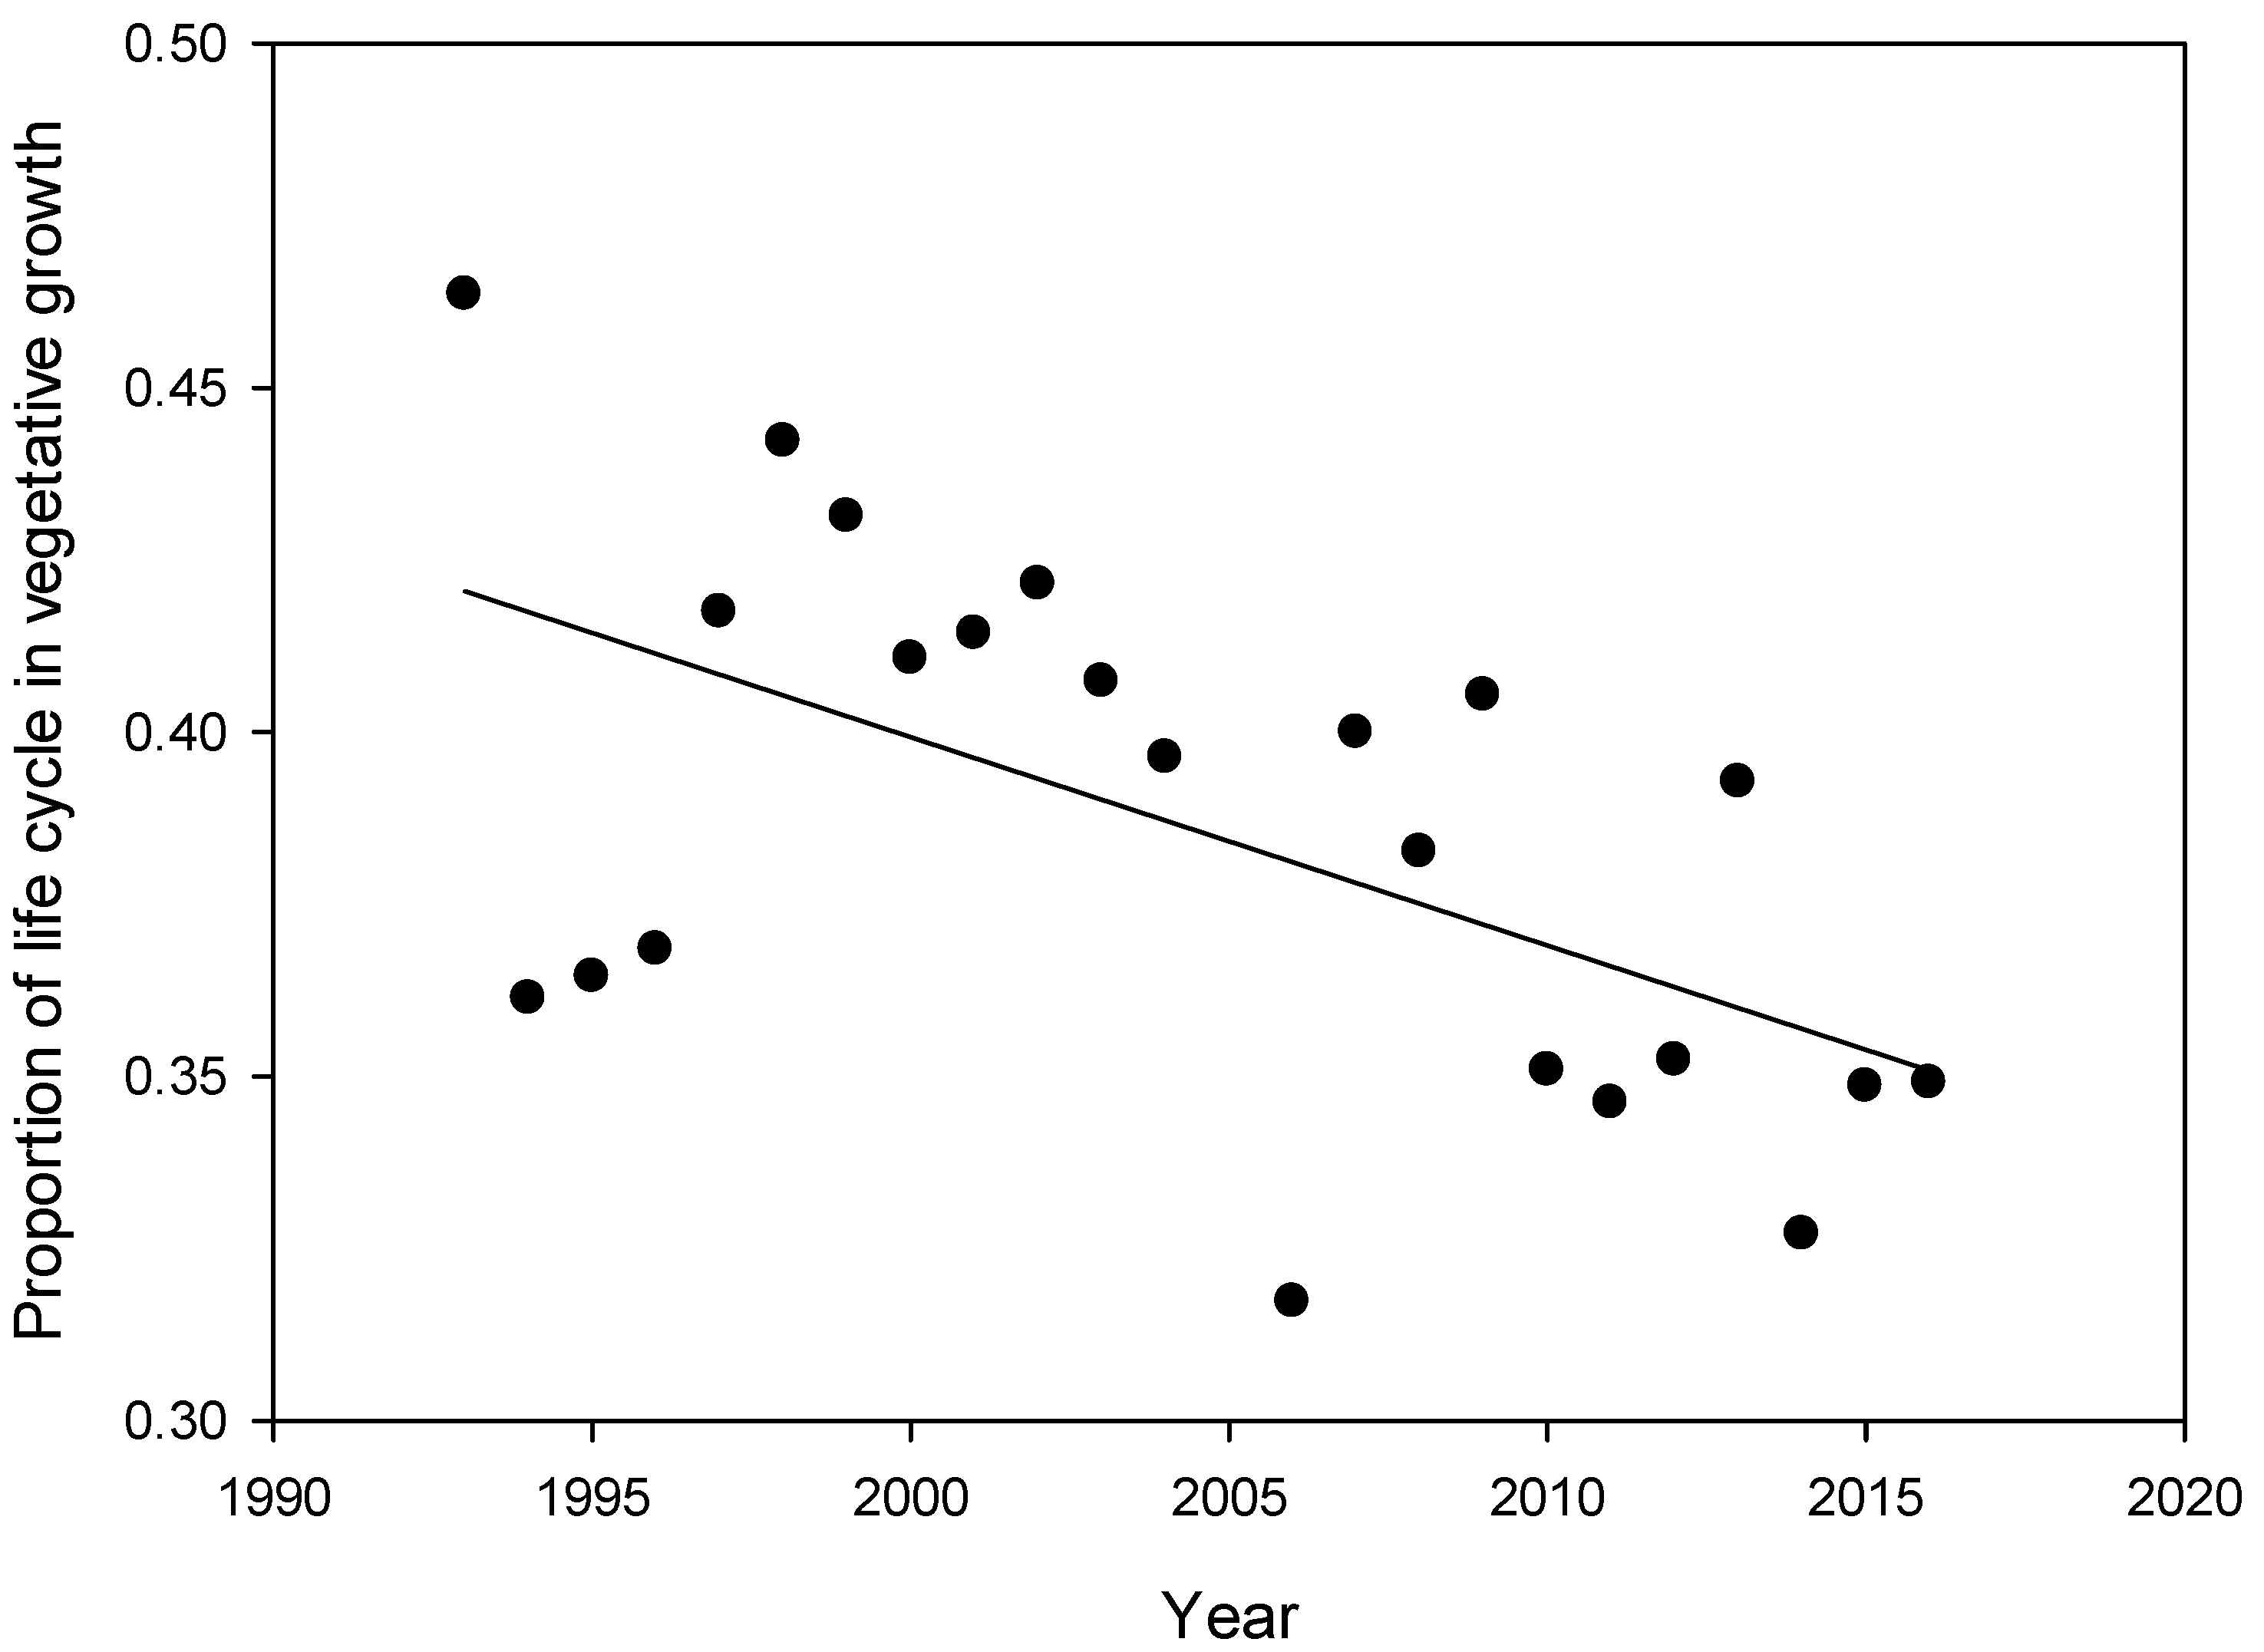
| Vprop | −0.0030 | 0.0002 | <0.0001 |
| [CO2] | V ppt | FP ppt | SF ppt | V Tmax | FP Tmax | SF Tmax | V Tmin | F PTmin | |
|---|---|---|---|---|---|---|---|---|---|
| V ppt | −0.230 | ||||||||
| FP ppt | −0.014 | 0.017 | |||||||
| SF ppt | 0.190 | −0.204 | −0.066 | ||||||
| V Tmax | 0.223 | −0.583 | −0.021 | −0.050 | |||||
| FP Tmax | 0.189 | −0.511 | −0.262 | 0.665 | 0.665 | ||||
| SF Tmax | 0.090 | −0.322 | −0.489 | 0.111 | 0.111 | 0.366 | |||
| V Tmin | 0.367 | −0.058 | −0.042 | −0.090 | 0.525 | 0.364 | −0.079 | ||
| FP Tmin | 0.004 | −0.198 | −0.040 | 0.112 | 0.450 | 0.745 | 0.116 | 0.110 | |
| SF Tmin | 0.172 | −0.349 | −0.467 | −0.080 | 0.106 | 0.341 | 0.906 | −0.035 | 0.129 |
| Variable a | Seed Yield (kg ha−1) | Vprop | ||||||||||
| Partial R2 | Estimate | SE | T Ratio | p-Value | Variance Inflation Factor | Partial R2 | Estimate | SE | T Ratio | p-Value | Variance Inflation Factor | |
| Intercept | −15146 | 3056 | −4.96 | <0.0001 | 0 | 1.278 | 0.044 | 28.78 | <0.0001 | 0 | ||
| Genetic gain | 0.057 | 8.0 | 1.4 | 5.77 | <0.0001 | 1.00 | ||||||
| [CO2], ppm | 0.006 | 4.3 | 2.2 | 1.92 | 0.0556 | 1.43 | 0.315 | −0.001 | 0.00001 | −10.98 | <0.0001 | 1.31 |
| V pptn, mm | 0.006 | 2.2 | 0.9 | 2.28 | 0.0233 | 2.54 | ||||||
| FP pptn, mm | 0.011 | 3.0 | 0.9 | 3.32 | 0.0010 | 2.22 | 0.088 | −0.0003 | 0.00003 | −9.41 | <0.0001 | 1.50 |
| SF pptn, mm | 0.040 | 3.0 | 0.6 | 4.82 | <0.0001 | 1.47 | 0.118 | −0.0003 | 0.00003 | −11.89 | <0.0001 | 1.16 |
| V Tmin, °C | 0.031 | −158 | 37 | −4.19 | <0.0001 | 1.28 | 0.065 | −0.014 | 0.002 | −8.12 | <0.0001 | 1.28 |
| FP Tmin, °C | 0.071 | 251 | 36 | 6.93 | <0.0001 | 1.18 | 0.097 | −0.013 | 0.002 | −7.97 | <0.0001 | 1.06 |
| SF Tmin, °C | 0.265 | −174 | 36 | −4.92 | <0.0001 | 2.98 | 0.004 | −0.002 | 0.001 | −2.00 | 0.0459 | 1.57 |
| Model p-value | <0.0001 | <0.0001 | ||||||||||
| R2 | 0.49 | 0.69 | ||||||||||
| Adjusted R2 | 0.47 | 0.68 | ||||||||||
| RMSE | 463 | 0.021 | ||||||||||
| Variable | Seed Protein (g kg−1) | Seed Oil (g kg−1) | ||||||||||
| Partial R2 | Estimate | SE | T Ratio | p-Value | Variance Inflation Factor | Partial R2 | Estimate | SE | T Ratio | p-Value | Variance Inflation Factor | |
| Intercept | 1500 | 95.2 | 15.79 | <0.0001 | 0 | −803 | 10.6 | −7.57 | <0.0001 | 0 | ||
| Genetic gain | 0.306 | −0.58 | 0.05 | −12.51 | <0.0001 | 1.00 | 0.151 | 0.45 | 0.005 | 9.01 | <0.0001 | 1.00 |
| [CO2], ppm | 0.029 | −0.25 | 0.007 | −3.40 | 0.0008 | 1.15 | ||||||
| V pptn, mm | 0.006 | 0.08 | 0.03 | 2.78 | 0.0058 | 2.13 | 0.106 | 0.18 | 0.003 | 6.67 | <0.0001 | 1.54 |
| FP pptn, mm | 0.062 | 0.17 | 0.03 | 5.95 | <0.0001 | 2.14 | ||||||
| SF pptn, mm | 0.005 | 0.03 | 0.02 | 1.54 | 0.1242 | 1.46 | ||||||
| V Tmin, °C | 0.024 | −3.24 | 1.14 | −2.85 | 0.0047 | 1.05 | ||||||
| FP Tmin, °C | 0.021 | 4.21 | 0.126 | 3.34 | 0.0009 | 1.11 | ||||||
| SF Tmin, °C | 0.005 | 3.41 | 1.17 | 2.93 | 0.0037 | 2.91 | 0.131 | 9.15 | 0.084 | 10.93 | <0.0001 | 1.28 |
| Model p-value | <0.0001 | <0.0001 | ||||||||||
| R2 | 0.41 | 0.44 | ||||||||||
| Adjusted R2 | 0.40 | 0.43 | ||||||||||
| RMSE | 15.4 | 16.7 | ||||||||||
| Variable | Seed Protein Plus Oil (g kg−1) | |||||||||||
| Partial R2 | Estimate | SE | T Ratio | p-Value | Variance Inflation Factor | |||||||
| Intercept | 728 | 13.5 | 5.41 | <0.0001 | 0 | |||||||
| Genetic gain | 0.010 | −0.13 | 0.006 | −2.05 | 0.0417 | 1.00 | ||||||
| [CO2], ppm | 0.095 | −0.27 | 0.010 | −2.77 | 0.0060 | 1.42 | ||||||
| V pptn, mm | 0.039 | 0.24 | 0.004 | 6.35 | <0.0001 | 2.00 | ||||||
| FP pptn, mm | 0.035 | 0.16 | 0.004 | 4.37 | <0.0001 | 1.83 | ||||||
| SF pptn, mm | ||||||||||||
| V Tmin, °C | 0.019 | −4.72 | 0.165 | −2.87 | 0.0044 | 1.23 | ||||||
| FP Tmin, °C | 0.020 | 5.49 | 0.161 | 3.41 | 0.0007 | 1.18 | ||||||
| SF Tmin, °C | 0.093 | 11.76 | 0.138 | 8.50 | <0.0001 | 2.28 | ||||||
| Model p-value | <0.0001 | |||||||||||
| R2 | 0.31 | |||||||||||
| Adjusted R2 | 0.29 | |||||||||||
| RMSE | 20.6 | |||||||||||
© 2019 by the authors. Licensee MDPI, Basel, Switzerland. This article is an open access article distributed under the terms and conditions of the Creative Commons Attribution (CC BY) license (http://creativecommons.org/licenses/by/4.0/).
Share and Cite
Cober, E.R.; Morrison, M.J. Soybean Yield and Seed Composition Changes in Response to Increasing Atmospheric CO2 Concentration in Short-Season Canada. Plants 2019, 8, 250. https://doi.org/10.3390/plants8080250
Cober ER, Morrison MJ. Soybean Yield and Seed Composition Changes in Response to Increasing Atmospheric CO2 Concentration in Short-Season Canada. Plants. 2019; 8(8):250. https://doi.org/10.3390/plants8080250
Chicago/Turabian StyleCober, Elroy R., and Malcolm J. Morrison. 2019. "Soybean Yield and Seed Composition Changes in Response to Increasing Atmospheric CO2 Concentration in Short-Season Canada" Plants 8, no. 8: 250. https://doi.org/10.3390/plants8080250
APA StyleCober, E. R., & Morrison, M. J. (2019). Soybean Yield and Seed Composition Changes in Response to Increasing Atmospheric CO2 Concentration in Short-Season Canada. Plants, 8(8), 250. https://doi.org/10.3390/plants8080250