Article

Identification of Genomic Regions Contributing to Protein Accumulation in Wheat under Well-Watered and Water Deficit Growth Conditions

by
Ibrahim S. Elbasyoni
1,*,
Sabah M. Morsy
1,
Raghuprakash K. Ramamurthy
2 and
Atef M. Nassar
3
1
Crop Science Department, Faculty of Agriculture, Damanhour University, Damanhour 22516, Egypt
2
Department of Agronomy and Horticulture, University of Nebraska-Lincoln, Lincoln, NE 68583, USA
3
Plant Protection Department, Faculty of Agriculture, Damanhour University, Damanhour 22516, Egypt
*
Author to whom correspondence should be addressed.
Plants 2018, 7(3), 56; https://doi.org/10.3390/plants7030056
Submission received: 6 June 2018 / Revised: 28 June 2018 / Accepted: 4 July 2018 / Published: 11 July 2018

Abstract

:
Sustaining wheat production under low-input conditions through development and identifying genotypes with enhanced nutritional quality are two current concerns of wheat breeders. Wheat grain total protein content, to no small extent, determines the economic and nutritive value of wheat. Therefore, the objectives of this study are to identify accessions with high and low grain protein content (GPC) under well-watered and water-deficit growth conditions and to locate genomic regions that contribute to GPC accumulation. Spring wheat grains obtained from 2111 accessions that were grown under well-watered and water-deficit conditions were assessed for GPC using near-infrared spectroscopy (NIR). Results indicated significant influences of moisture, genotype, and genotype × environment interaction on the GPC accumulation. Furthermore, genotypes exhibited a wide range of variation for GPC, indicating the presence of high levels of genetic variability among the studied accessions. Around 366 (166 with high GPC and 200 with low GPC) wheat genotypes performed relatively the same across environments, which implies that GPC accumulation in these genotypes was less responsive to water deficit. Genome-wide association mapping results indicated that seven single nucleotide polymorphism (SNPs) were linked with GPC under well-watered growth conditions, while another six SNPs were linked with GPC under water-deficit conditions only. Moreover, 10 SNPs were linked with GPC under both well-watered and water-deficit conditions. These results emphasize the importance of using diverse, worldwide germplasm to dissect the genetic architecture of GPC in wheat and identify accessions that might be potential parents for high GPC in wheat breeding programs.

1. Introduction

Wheat (Triticum aestivum L.) is the food commodity for more than third of the world's population. Wheat grain is a rich source of starch (carbohydrate). Therefore wheat is primarily considered as a source of energy [1]. However, wheat grain contains also moderate amounts of dietary proteins which determines, to a large extent, both the end-use quality and wheat grain price [2]. Wheat grain total protein content (GPC) ranges from 9 to 15% of the dry weight [3,4]. Although, GPC depends primarily on the genotype; the environment and genotype × environment interaction also plays an essential role in grain protein accumulation [5].
Nitrogen fertilization is the critical environmental factor that affects protein accumulation; if nitrogen fertilization stays constant, increased yield often results in decreased protein content because of nitrogen dilution by the large biomass [6,7,8,9]. Furthermore, under stress conditions, grain protein content tends to be higher compared to either irrigated or nitrogen-limited conditions [10]. Water deficit increases grain total protein content, but it decreases grain yield [11]. Wheat genotypes with higher yield potential tend to have lower protein content and vice versa [12]. Several explanations for the negative relationship between grain protein content and yield have been proposed [13]. However, some wheat genotypes deviate from the previous relationship, i.e., they produce high yield and high grain protein content [14]. That deviation implies that the nitrogen supply to grains was increased, but it was not associated with a reduction in the grain yield [15].
Exploring genetic resources to identify wheat genotypes with high grain protein content is the most efficient way to improve the nutritional value of wheat grains [16]. Wheat breeders were successful in selecting genotypes with a high total protein content that were generated from cultivated materials such as “Atlas,” “Atlas66” and “Nap Hall” [17]. Previous studies reported higher GPC in landraces and wild relatives compared to modern wheat genotypes [18,19]. A wild emmer (Triticum turgidum var dicoccoides) genotype was identified in Israel, i.e., “FA15-3” which was found to be able to accumulate 40% protein when given adequate nitrogen fertilization [20]. High grain protein content gene GPC-B1 allele which was originally identified in wild emmer wheat, was transferred to a spring wheat genotype and increased grain total protein content by 3% [21]. The GPC-B1 allele accelerates senescence and increases mobilization of nitrogen, zinc, and iron to the developing grains [22]. Thus, accessions containing this allele most likely will contain high protein as well as high iron and zinc [23]. However, most of the modern tetraploid and hexaploid wheat genotypes have lost a functional allele of GPC-B1 [16]. During the last decade, several QTLs for GPC were mapped using association mapping (AM) and biparental populations on chromosomes 5A, 5D, 2D, 2B, 6A, 6B and 7A [24,25,26,27,28,29,30,31], that QTLs were validated and used in marker-assisted selection to improve GPC.
Marker-assisted selection (MAS) was defined as one of the promising avenues to improve wheat total protein content and grain yield [32]. The critical step in MAS is to identify molecular markers associated with desirable phenotypic traits using AM or biparental populations [33]. Association mapping (AM) can be applied to structured populations [34], thus incorporating a broad spectrum of germplasm is possible [34,35,36]. However, the successful application of association mapping requires comprehensive phenotypic and genotypic data. The dramatic decrease in the genotyping costs [37] in addition to the availability of high throughput phenotyping technologies such as Near-Infrared Spectroscopy (NIR) make AM a viable approach for large populations [38]. Furthermore, A robust sequence and annotation of the wheat genome are now available [39] with the latest developments in genomic technologies. This might allow researchers to identify new loci associated with GPC genes and dissect the genetic architecture of GPC in wheat.
Three strategies were adopted to select for high GPC and grain yield, i.e., selecting for high grain protein alone, selecting for high grain protein within highest yielding genotypes, and using an index to simultaneously select for both protein and yield [40]. In the current study, the most recent developments in genotyping and phenotyping technologies were applied to identify genomic regions associated with GPC and select accessions with high and low grain protein content using a worldwide collection of spring wheat accessions.

2. Materials and Methods

2.1. Plant Materials and Field Growth Conditions

Wheat grains obtained from 2111 wheat accessions (882 landraces; 493 breeding lines; 419 cultivars and 317 with uncertain category) were used in the current study. The accessions seeds were provided by the national small grains collection (NSGC) located in Aberdeen, ID, USA. The accessions were screened in Egypt during 2015/2016 and 2016/2017 growing seasons for total protein content under well-watered and water deficit conditions in Damanhour university experimental farm (30°45′19.4″ N, 30°29′4.8″ E). During the two growing seasons, drought stress was imposed by controlling irrigation during the reproductive stage in which plants were irrigated at 40% depletion of plant available water (PAW) (well-watered), or 80% PAW (water deficit). Well-watered and water deficit treatments were applied on two sublocations within the same experimental farm to facilitate the control of water application. For both sublocations, the wheat accessions were planted in two replicates using a randomized incomplete block design [41] in plots of four rows wide with 25 cm between rows and two meters long. The incomplete blocks consisted of 50 accessions in addition to three check cultivars, i.e., “Sids13”, Gimmiza 9”, and “Giza 168. The check cultivars were planted in each incomplete block.

2.2. Estimation of Grain Protein Content (GPC)

Grain protein content (% or g/100 g) was estimated using near-infrared spectroscopy (NIR) with a Perten DA7250 diode array NIR (Springfield, IL, UAS). NIR is a nondestructive technique that complies with the ISO 12099 standard method. The measurements of GPC were done in the near infrared region 950–1650 nm and readings were processed in NetPlus software (Perten, Hägersten, Sweden), which includes validation calculation modules, such as calculations of bias, slope, and standard errors of prediction against the reference methods. However, for initial calibration of the Perten DA7250, the crude protein content of 100 wheat accessions was measured using the Kjeldahl method (Pelican Equipment’s, Chennai, India). The correlation coefficient (r) between the calibration set and Perten DA7250 NIR readings was 0.964 for crude protein (% dry basis).

2.3. Single Nucleotide Polymorphism (SNP)

Wheat accessions included in this study were genotyped through the Triticeae Coordinated Agriculture Project (TCAP) using the Illumina iSelect 9 K (Illumina, Madison, WI, USA) wheat array [42] at the USDA-ARS genotyping laboratory in Fargo, ND, USA. The single nucleotide polymorphism (SNP) markers were filtered by removing SNPs with missing values >10% and minor allele frequency (MAF) <5%. The filtration step resulted in 5090 high-quality SNPs in which the missing values were imputed using random forest regression [43], which was applied using the MissForest R/package [44]. Then, the filtered and imputed SNP markers were used for the association mapping analysis, in which SNP markers were plotted in a Manhattan plot using “WNSP 2013 consensus map”; available on: (https://triticeaetoolbox.org/wheat/) according to Wang et al. [45].

2.4. Statistical Analysis

Analysis of variance was carried out by fitting the following model [46]:
Yijlm = µ + Ei + EB(il)j + Gm + EGim + ԑijlm
where Yijlm is the response measured on the ijlm plot, µ is the overall mean, Ei is the effect of ith environment, EB(il)j is jth incomplete block nested within lth complete block and ith environment (random), Gm is the effect of mth accession, EGim is the interaction effect among ith environment and mth accession, and ԑijlm is the experimental error. Type III expected mean square estimation was conducted as follows:
SourceType III Expected Mean Square
Environment (Env)Var (Error) + 45.372 Var (IBlock (Env × Rep)) + Q (Env, Env × Genotypes)
Incomplete block (Env × block)Var (Error) + 36.829 Var (IBlock (Env × Rep))
AccessionsVar (Error) + Q (Genotypes, Env × Genotypes)
Env × AccessionsVar (Error) + Q (Env × Genotypes)
Homogeneity and normality of variance were checked using Bartlett and Shapiro-Wilk statistics using R/package agricolae [47]; Least Square Means (Lsmeans) were estimated using R/package lsmeans [48]. Lsmeans were compared using Tukey's studentized range (HSD) (at p-value < 0.05). Pearson correlation analysis (r) was carried out between lsmeans using R/package corr.test [47]. Mean-based heritability (h2) was estimated using the following model:
h2 = σG2/[σG2 + (σE2/ri)]
where σG2 is the genetic variance, σE2 the residual variance and ri is the number of replicates [49].

2.5. Association Mapping

The estimated Lsmeans for GPC and SNP markers were subjected to association analysis according to the following mixed linear model (MLM) in R package GAPIT [50].
Y = μ + Zu + Wm + e
where Y is a vector of the total protein content, μ is a vector of intercepts, u is an n × 1 vector of random polygene background effects, e is a vector of random experimental errors with mean 0 and covariance matrix Var(e), Z is an incidence matrix relating Y to u. Var(u) = 2 KVg, where K is a known n × n matrix of a realized relationship matrix, estimated using the A.mat function in R software [51], as K = WW/C, where Wik = Xik + 1 − 2pk and pk is the frequency of the one allele at marker k [51], Vg is the unknown genetic variance, which is a scalar, m is a vector of fixed effects due to SNP markers, W is incidence matrix relating Y to m. Var(e) = RVR, where R is an n × n matrix, and VR is the unknown residual variance, which is a scalar too. Furthermore, principal component analysis (PCA) was conducted using the filtered SNP markers [52] and the integrated PCA function (prcomp) of the R software. In addition to Model (1), another three models were fitted. Model (2) contained the K matrix and the first PCA; Model (3) contained the K matrix, in addition to PCA1 and 2. Moreover, Model (4) contained the K matrix, in addition to the first three PCAs. p-values estimated from the mixed models were subjected to false discovery rate (FDR) corrections using Q-value estimates applied in the R package q-value [53]. The proportion of phenotypic variance explained (R2) by the significant markers, and their additive effects were estimated using the GAPIT function, according to Wray et al. [54], in R software [50].

3. Results

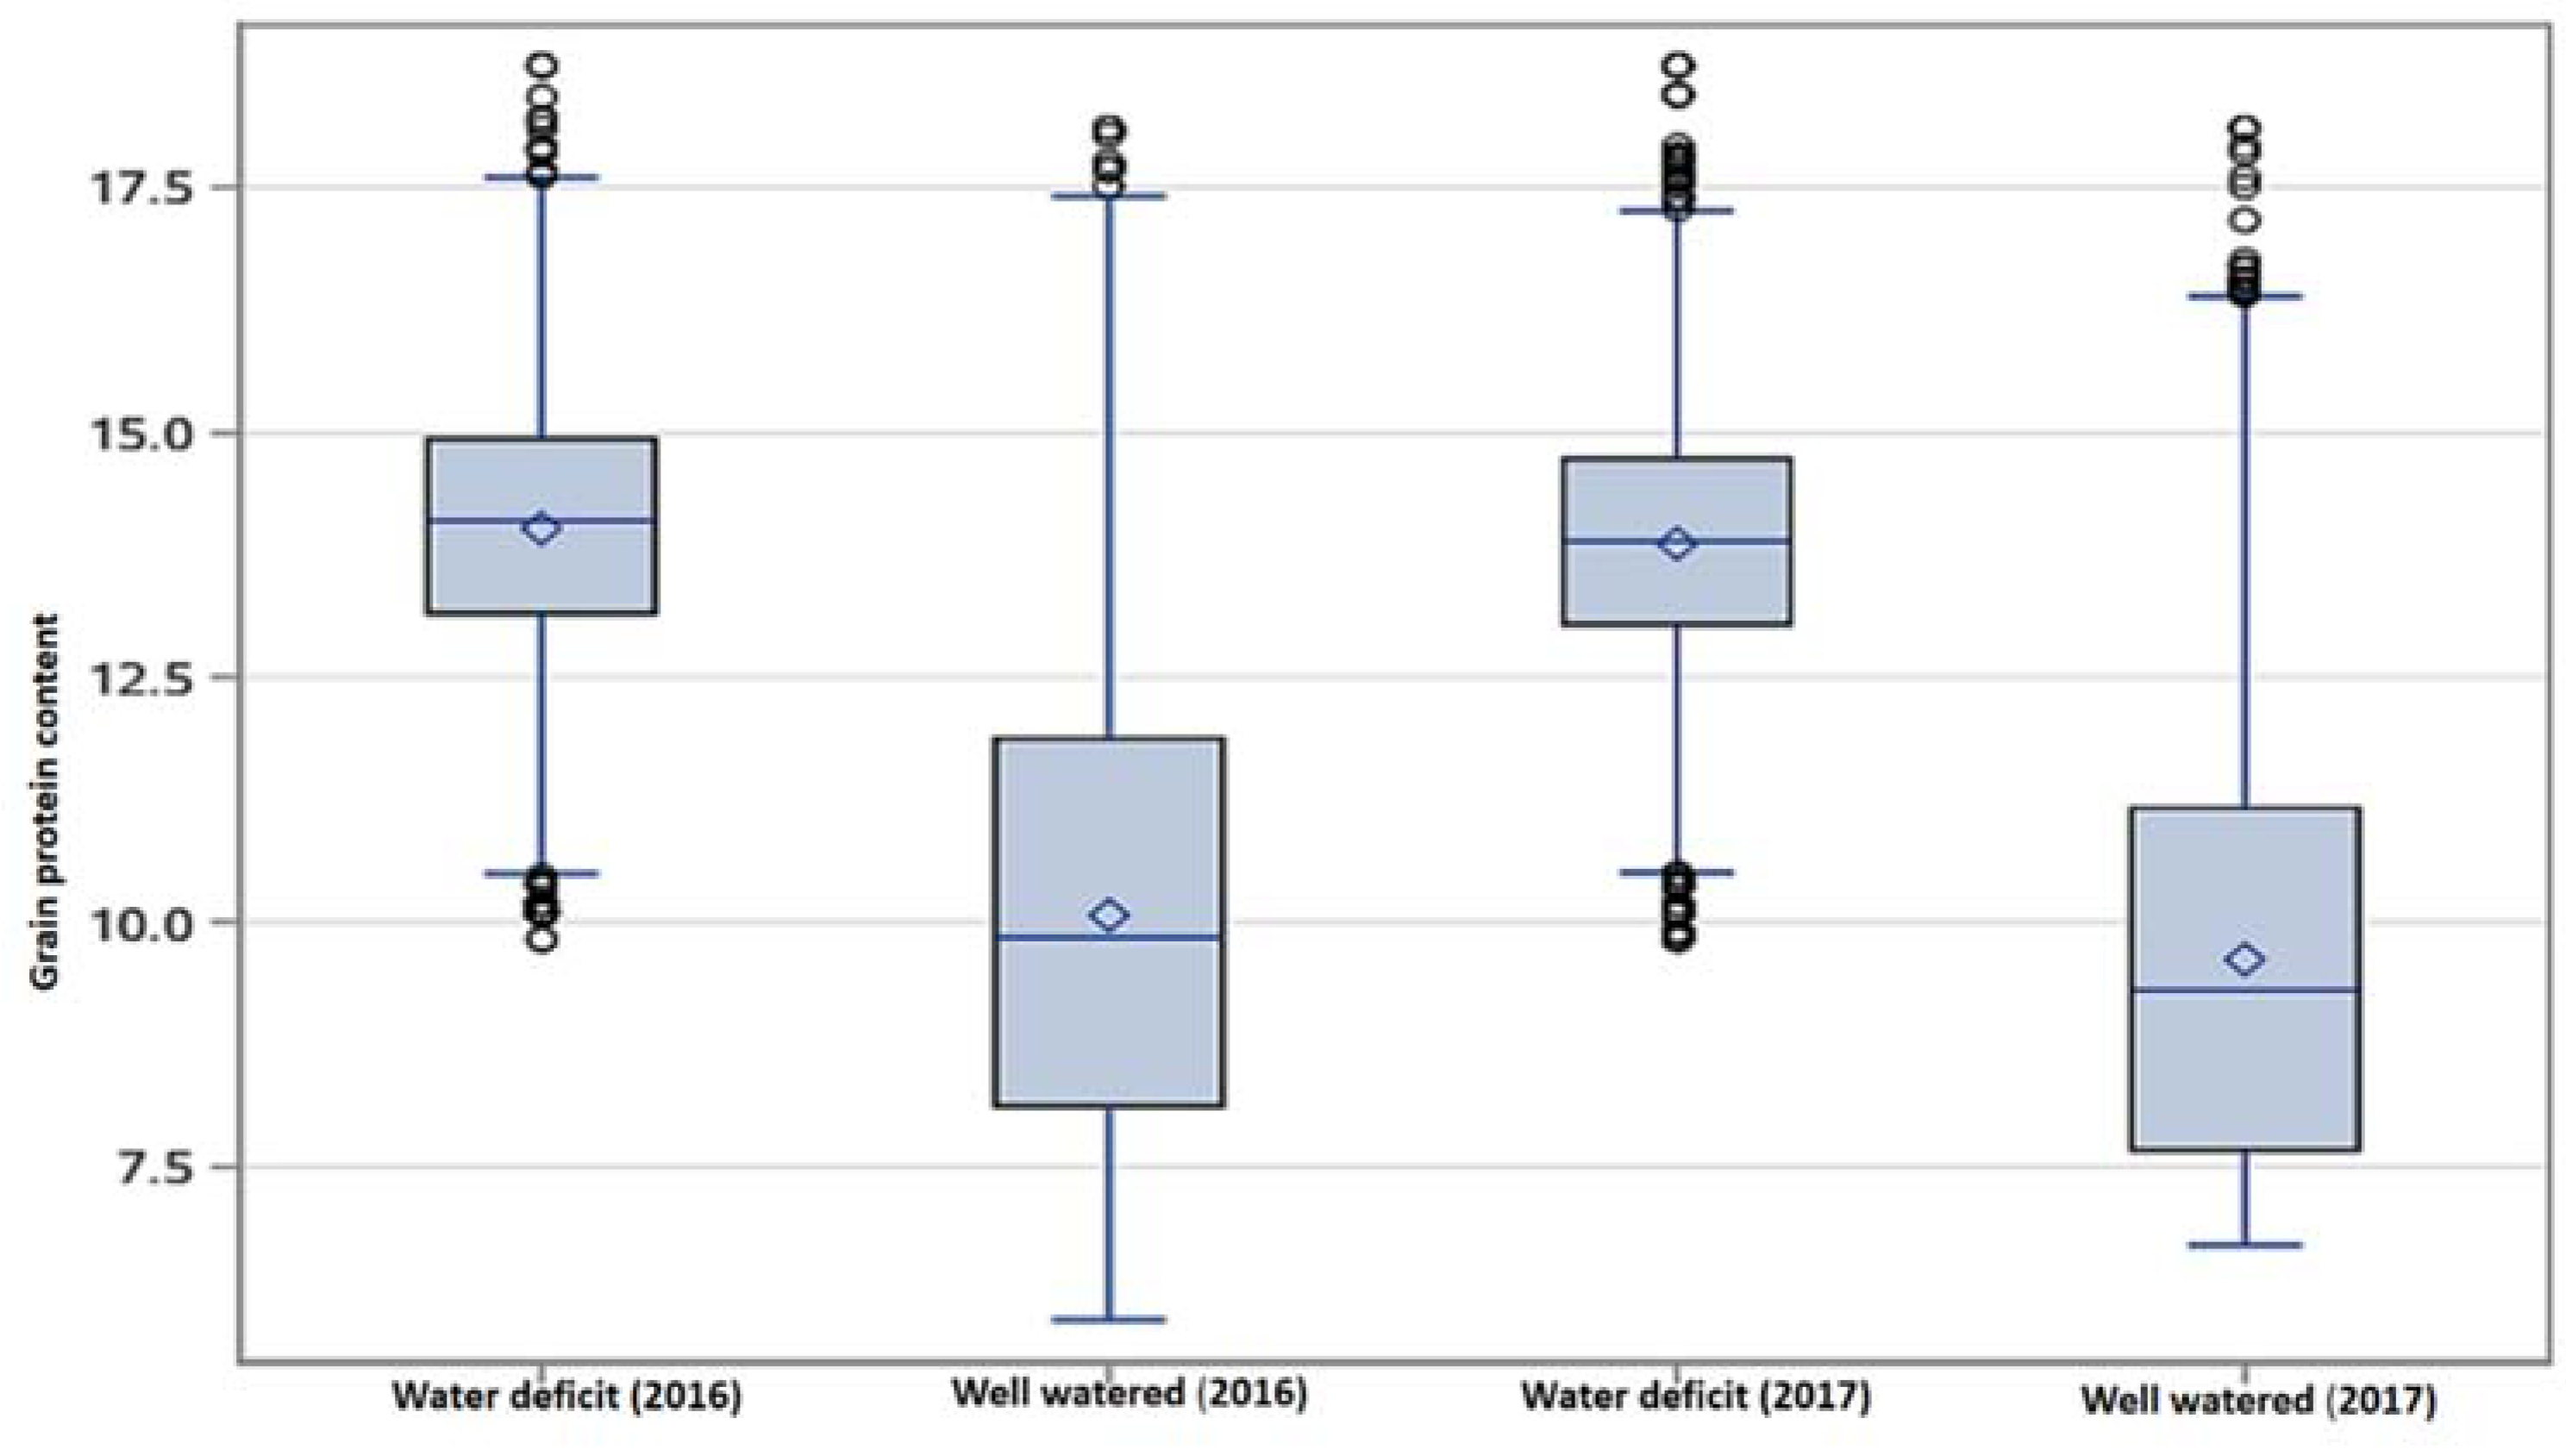
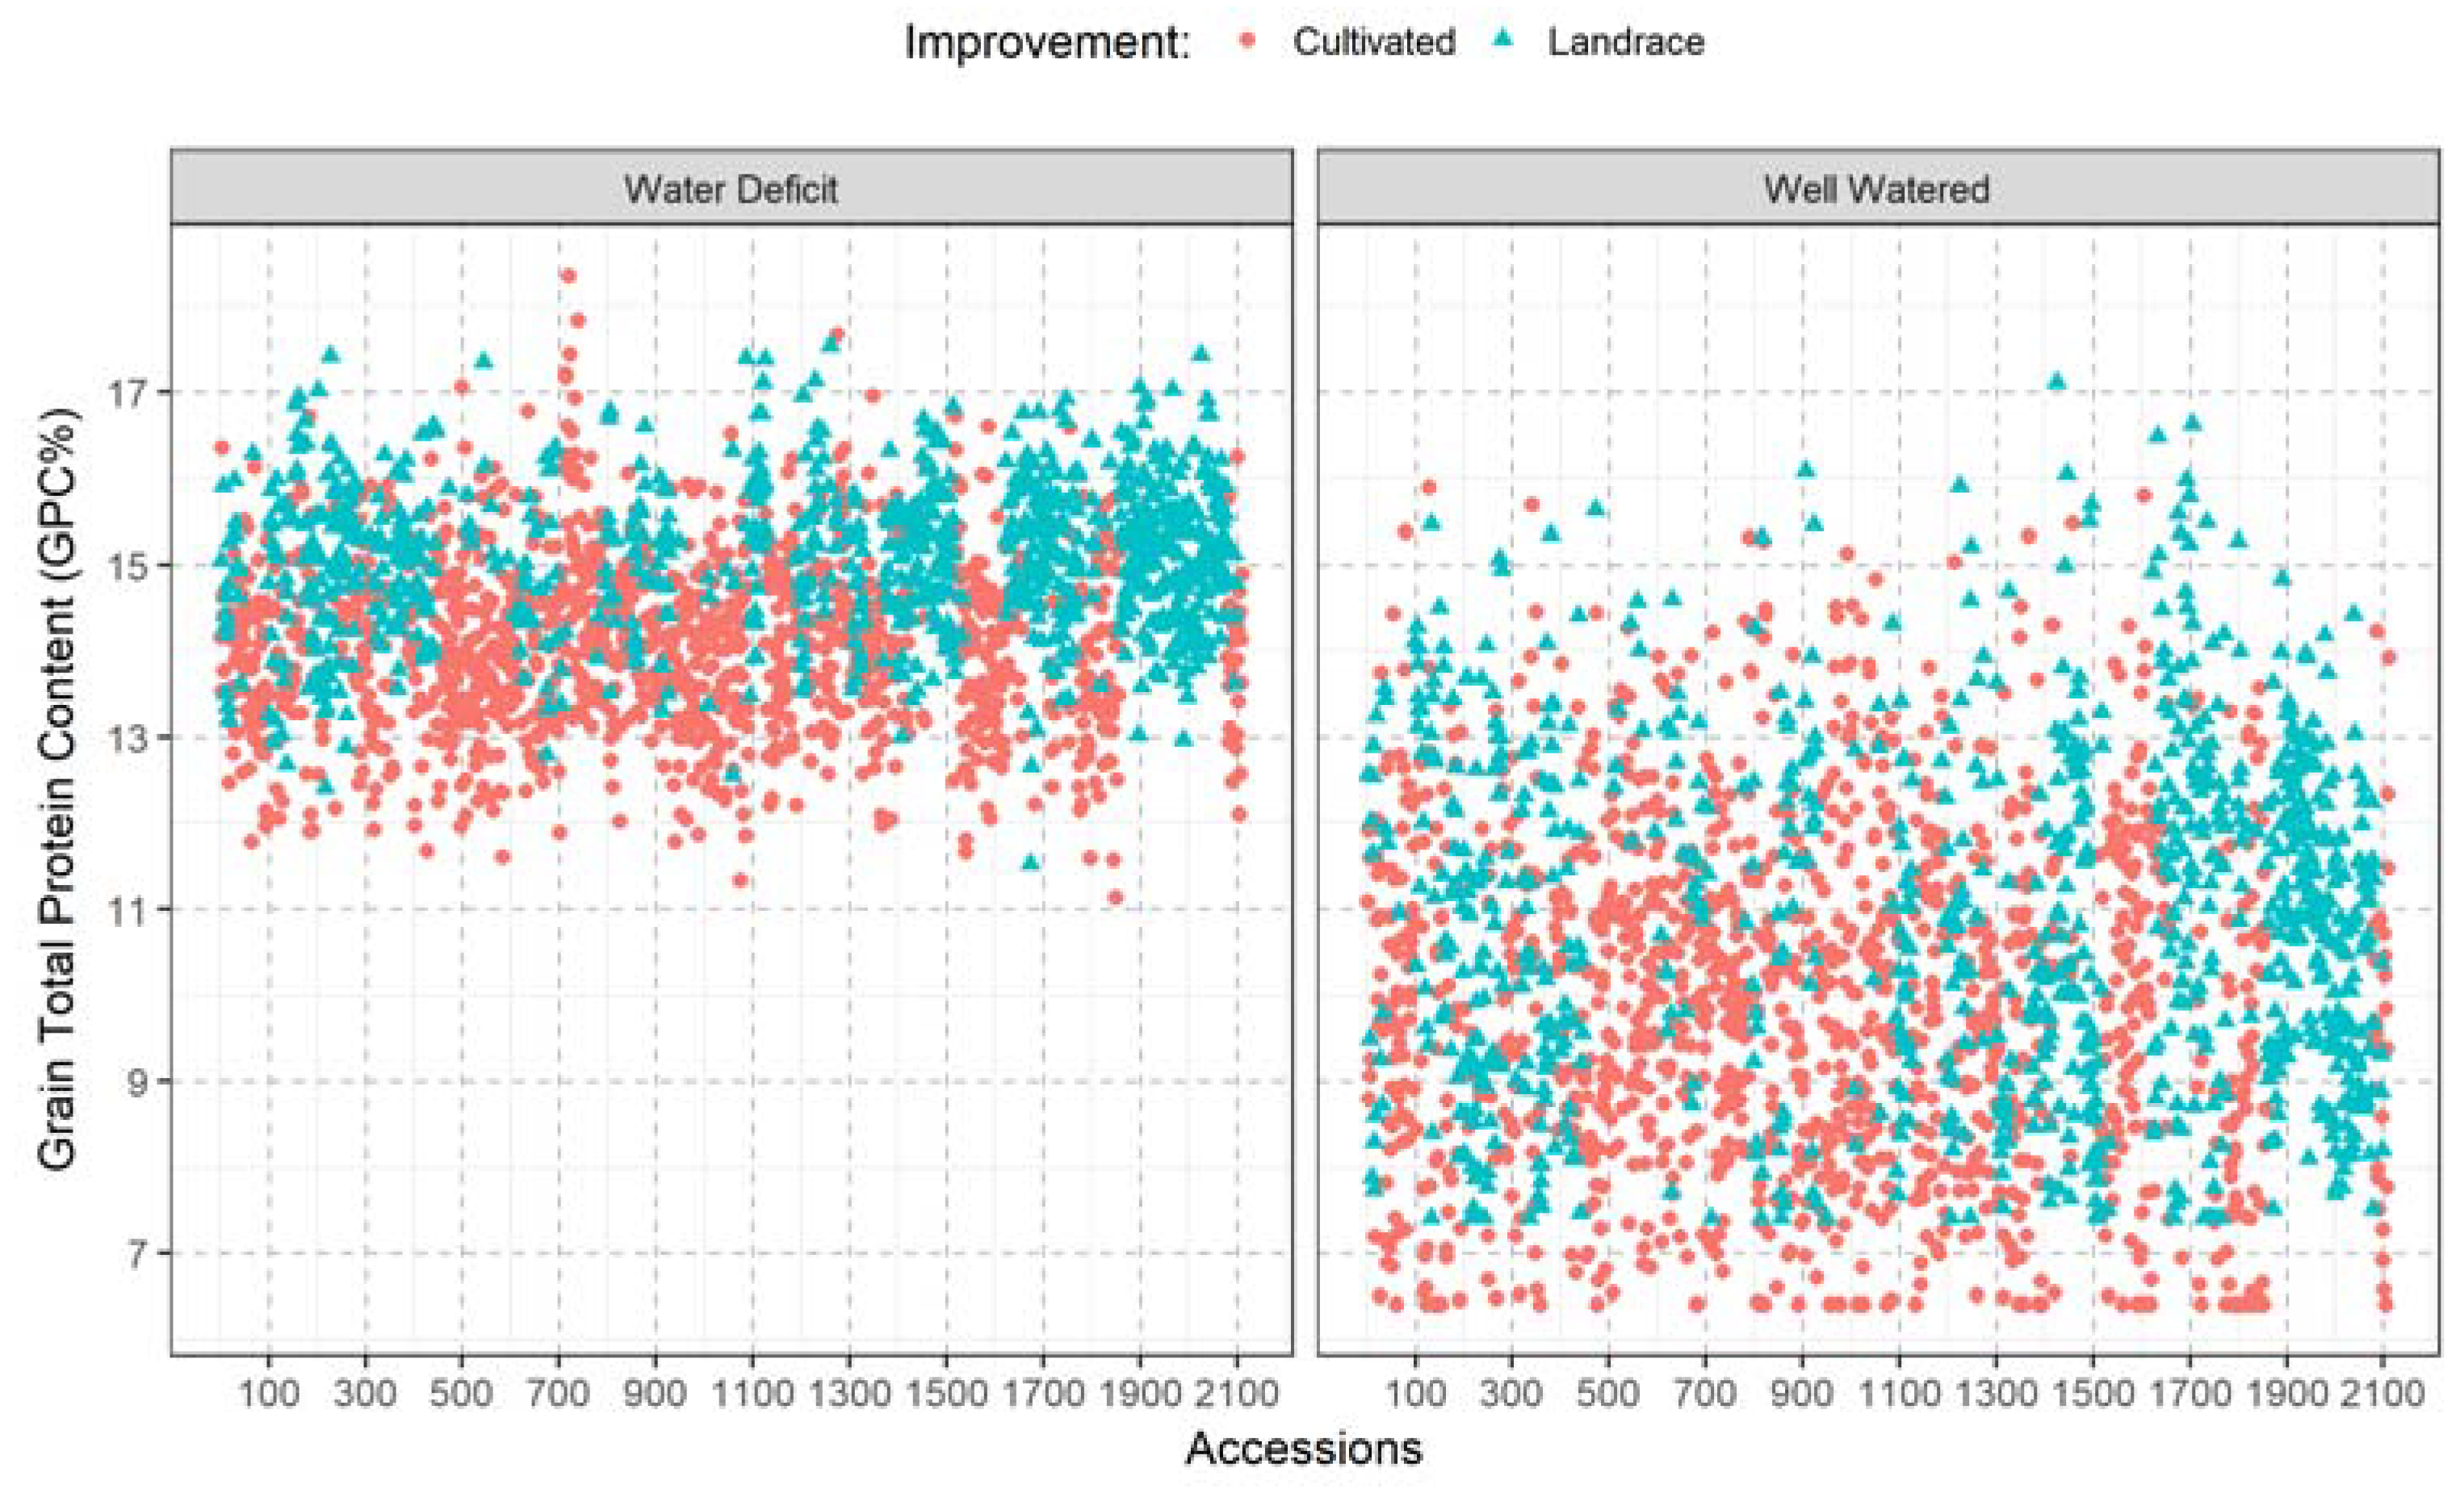
3.1. Grain Protein Content (GPC)

Normal distribution and homogeneity of variance for grain protein content (GPC) were observed across the four environments (two seasons and two water regimes). Thus, combined analysis of variance across environments was conducted. Combined analysis of variance for GPC indicated a highly significant effect (p-value < 0.01) for the environments, genotypes, and genotype × environment interaction (Table 1). Broad-sense heritability estimates ranged from 0.49 to 0.60 for well-watered and water deficit conditions, respectively. Furthermore, the broad sense heritability estimates across years, and water regimes (the four environments) was 0.64 lsmeans of the grain protein content (GPC) ranged from 5.96 to 17.11% with a mean of 10.15 under well-watered conditions during 2016, and 6.88 to 17.43 with a mean of 9.67 in 2017 growing seasons. On the other hand, under water deficit conditions, GPC ranged from 11.12 to 18.5 with a mean of 14.9 in 2016 and 9.8 to 18.3 with a mean of 13.97 in 2017 growing seasons. Although, no significant difference was detected for the difference between means of the growing seasons, the difference between the lsmeans of the water regimes was highly significant, based on HSD at 0.01 probability level. Overall, our results indicated that water deficit increased GPC by 29% across the two growing seasons (Figure 1).
Furthermore, the correlation between GPC obtained from well-watered with that obtained water deficit across all genotypes was positive and significant (r = 0.23, p-value = 0.01). The first quartiles for the GPC across growing seasons (the cut off for the lowest 25%) under well-watered and water deficit conditions were ≤8.36 and 13.41, respectively (Figure 1). Whereas, the third quartile (the cut off for the highest 25%) of the genotypes under well-watered and water deficit conditions were ≥11.35 and 14.66, respectively. The first and third quartiles in this study were used as criteria to classify the genotypes into high and low GPC genotypes. Therefore genotypes with GPC ≤8.36 under well-watered and ≤13.41 under water deficit conditions, were defined as low protein genotypes. On the other hand, genotypes with GPC ≥11.35 under well-watered and ≥14.66 under water deficit conditions were defined as high protein genotypes. Grain protein content (GPC) for all genotypes under well-watered and water deficit conditions (Figure 2) indicated that 166 (7.8% of the genotypes) had high protein content under well-watered and water deficit conditions concurrently. Another, 200 genotypes (9.47%) were classified as low protein genotypes under both well-watered and water deficit conditions concurrently. The top 20 accessions with the highest GPC under well-watered and water deficit conditions are presented in Table 2, in which no overlapping accessions between the two water regimes were detected. Out of the top 20 accessions, detected under well-watered conditions, nine landraces were present. On the other hand, 18 landraces were present among the top 20 accessions detected under water deficit conditions. Overall, the estimated lsmeans from the landraces (882 accessions) under well-watered conditions was 10.9; which was 11.22% higher than the overall average of all other accessions (Table 2). Additionally, under water deficit conditions the average GPC for the landraces was 15.04 which was 7.9% higher than the overall average of all other accessions. Overall, our results indicate that moisture has a significant impact on GPC accumulation in wheat. Landraces had higher GPC, compared to other germplasm used in the current study.

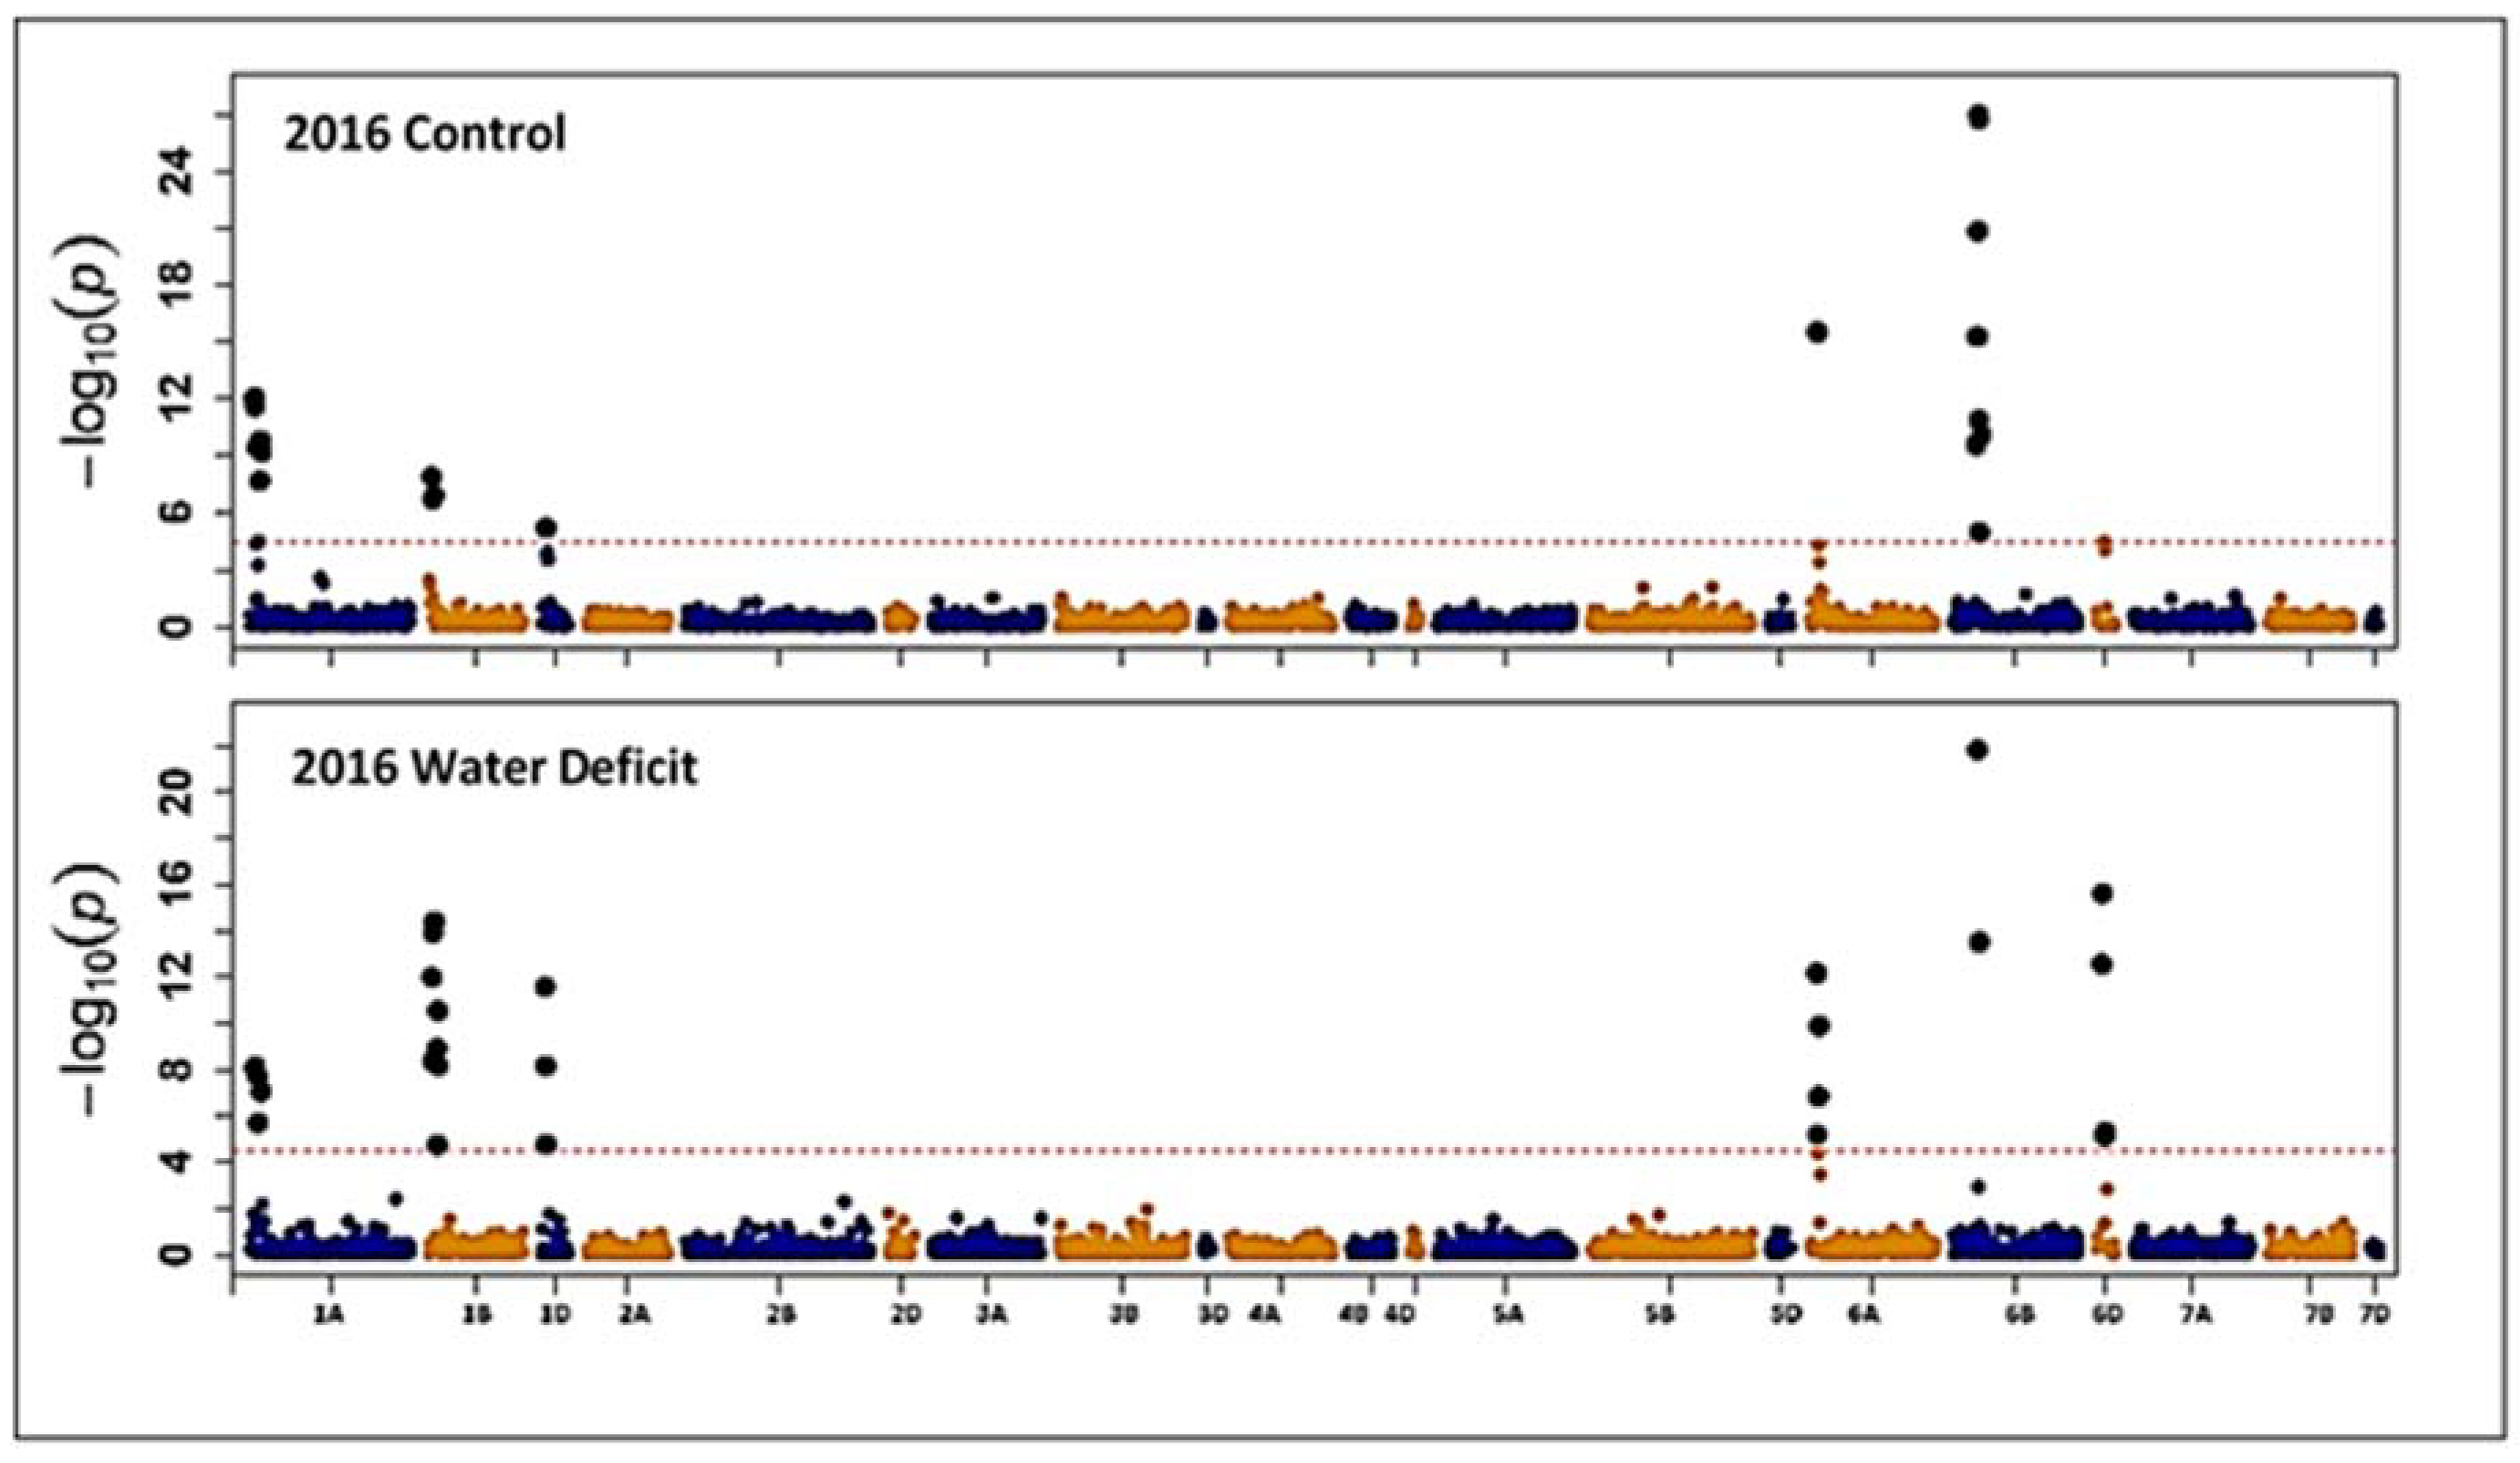
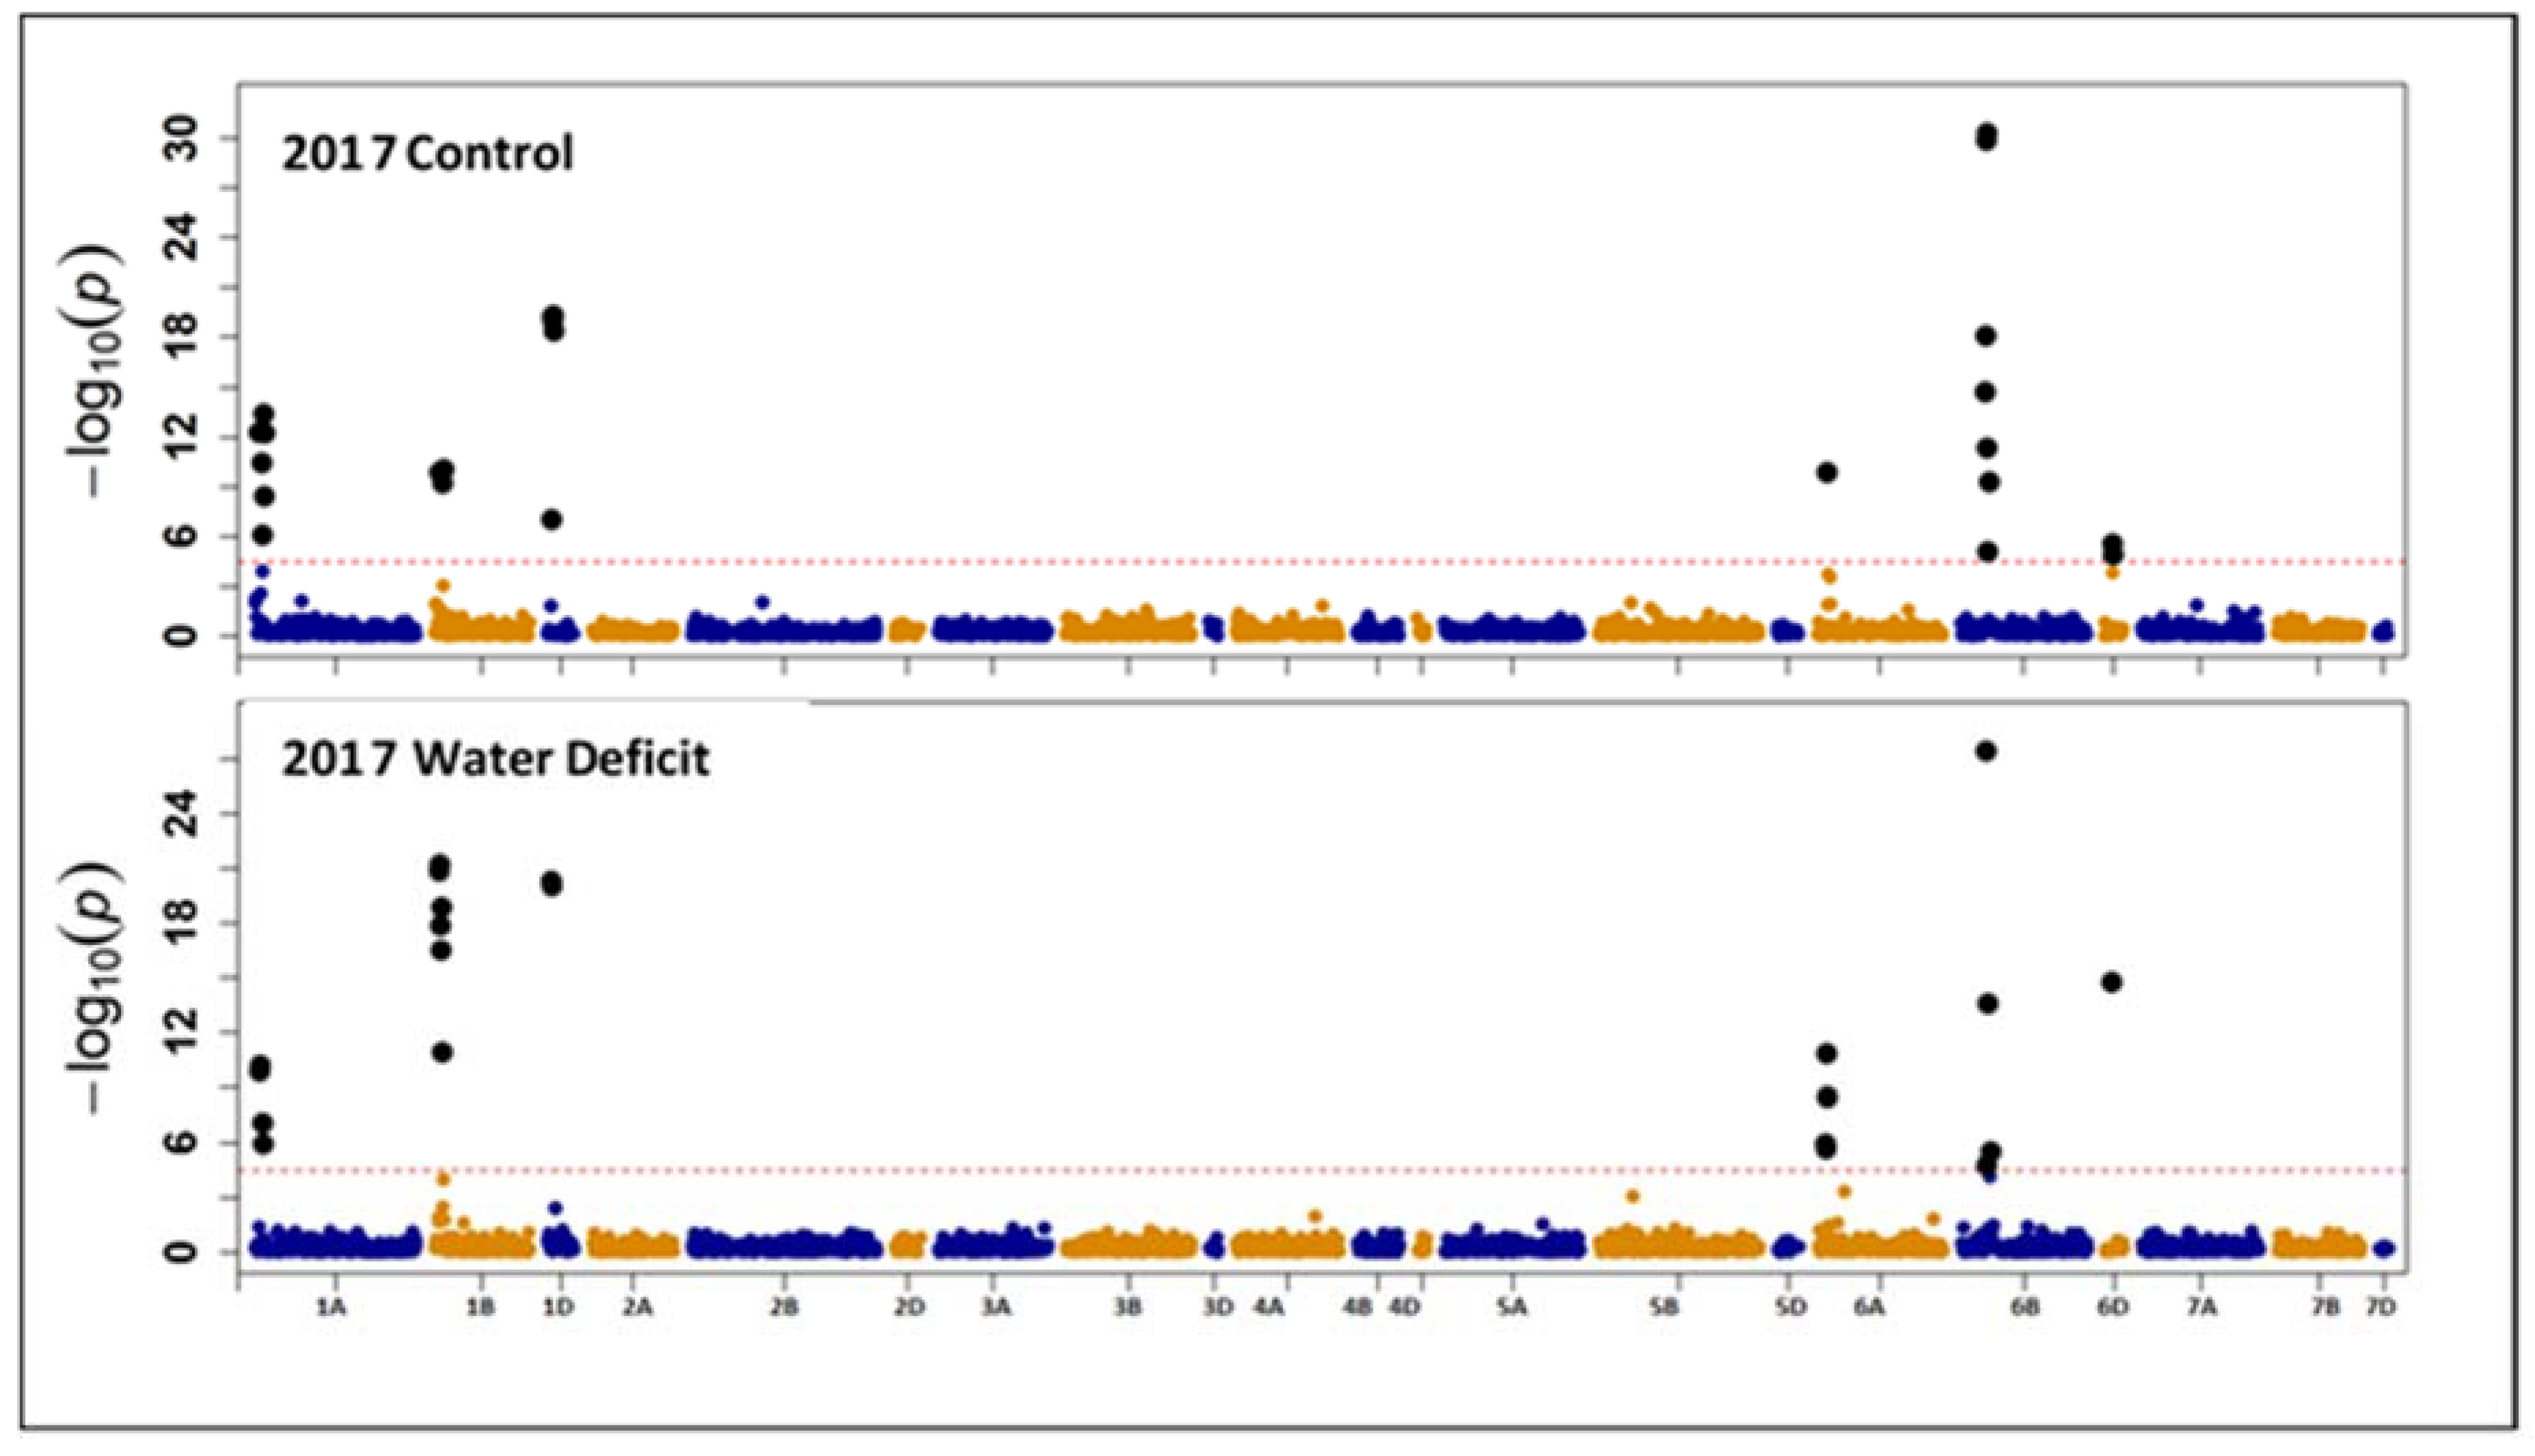
3.2. Association Mapping for Grain Protein Content

A total of 3215 mapped SNPs were used for estimating the extent of linkage disequilibrium (LD) in the 2111 wheat accessions. Only SNP loci having MAF ≥0.05 and missing values ≤10% were used to estimate r2 across all SNPs. The estimates of r2 for all pairs of SNPs loci were used to determine the rate of LD decay with genetic distance. Across the three wheat genomes, i.e., A, B and D using only markers with significant r2 (p-value = 0.001), the LD ranged from 0 to 0.35. Overall, LD declined to 50% of its initial value at about 8 cM (Supplementary Materials, Figure S1). Eigenvector decomposition of the kinship matrix was used to investigate the population structure among accessions. The first principal component (PCA) accounts for less than 1% of the total variance (Supplementary Materials, Figure S2). Nevertheless, GWAS models with kinship matrix (K matrix, supporting information Figure S3) with zero, one, two or three PCAs were compared using Bayesian information criteria (BIC). The results indicated noticeable difference between the four models. Additionally, the first model, i.e., with no PCA produced the highest BIC values, given that the largest is the best [55]. Therefore, we reported the results of association mapping using only the K matrix in which it accounted for most of the stratification among accessions.
Association mapping analysis was conducted on each environment separately (two growing seasons and two water regimes). Genome-wide association mapping (GWAS) indicated that 46 SNP markers found to be significantly linked with GPC. The significant SNP markers were located on chromosomes 1A (12 SNPs), 1B (12 SNPs), 1D (7 SNPs), 6A (6 SNPs), 6B (7 SNPs) and 6D (3 SNPs) (Figure 3 and Figure 4). Out of the 46 significant SNP markers, ten markers were linked with GPC under well-watered and water deficit conditions in one growing season at least. Three SNP markers (IWA3169, IWA3501, and IWA7937) were significantly linked with GPC across the four environments (2016, 2017 growing seasons, and well-watered and water deficit conditions) (Table 3). Four markers (IWA6649, IWA6787, IWA3481 and IWA4351) found to be linked with GPC in three environments (2016 well-watered, 2016 and 2017 water deficit conditions) (Table 3). These results together indicate that some loci were significantly associated with GPC in wheat irrespective of water status.
Under well-watered conditions for the two growing seasons, seven SNP markers (IWA5150, IWA4643, IWA4754, IWA3923, IWA6466, IWA6467, and IWA5986) found to be significantly linked with GPC. On the other hand, under water deficit conditions for the two growing seasons, six SNP markers (IWA7191, IWA8199, IWA7345, IWA3446, IWA7288, and IWA7287) found to be significantly linked with GPC. In contrary, 14 markers (IWA4753, IWA4678, IWA4644, IWA4506, IWA4163, IWA3738, IWA5020, IWA5019, IWA5018, IWA4598, IWA4551, IWA4552, IWA4962, and IWA4730) found to be significantly linked with GPC during only one growing season under well-watered conditions. Another ten markers (IWA7616, IWA3624, IWA6673, IWA7007, IWA8551, IWA6610, IWA6611, IWA7480, IWA7048, and IWA7050) found to be significantly linked with GPC under water deficit conditions in only one growing season. Repeatability of the GPC associated loci in 2 seasons under any given water treatment suggests the feasibility of using/developing markers in LD with these loci.

4. Discussion

Protein content is an essential compositional trait in wheat, which has a broad impact in the food industry concerning human nutrition and health. Consequently, breeding for enhanced end-use quality is one of the essential breeding goals in wheat. However, GPC in wheat is positively affected by water deficit compared to well-watered conditions [10]. In this study, we seek to evaluate a comprehensive spring wheat collection for grain protein content (GPC) and to locate genomic regions associated with GPC under well-watered and water deficit conditions using GWAS approach.
The most striking observation in this study was the weak, positive and significant correlation between GPC obtained from the well-watered condition and water deficit conditions (r = 0.23). That weak correlation implies strong genotype × environment interaction, in which genotypes responded differently concerning water treatment. Increase in GPC under water deficit conditions could be mainly due to higher rates of accumulation of grain nitrogen and lower rates of accumulation of carbohydrates. High moisture, on the other hand, may decrease GPC by dilution of nitrogen with carbohydrates [56]. An increased grain protein and gluten content in response to water deficit as compared to the well-watered experiment in a winter wheat was also reported in a previous study [57]. The current study, as well as previous reports, indicated a significant effect of environment (moisture and growing seasons) on wheat GPC accumulation. Analysis of variance indicated a significant effect of moisture, genotype, and genotype × environment interaction on GPC in wheat, suggesting that GPC is a complex trait influenced by several factors. The significant genotypic effect observed in this study also indicated a wide range of variation for GPC accumulation among wheat accessions used. Moreover, around 366 (166 with high GPC and 200 with low GPC) wheat genotypes performed relatively the same across environments, which implies that GPC accumulation on these genotypes was less responsive to moisture.
Genotypic variation is a result of several alleles on genes which result in different responses to environmental conditions [58]. Furthermore, landraces serve as a valuable genetic resource in which it might provide new alleles for improvement of economically important traits such as GPC [19]. Results reported herein showed that landraces outperformed cultivated genotypes concerning GPC. These findings agree with previous reports [59,60] in which 121 landraces, 101 obsolete cultivars, and modern wheat cultivars were evaluated for GPC under the same environmental conditions, and landraces had higher total protein content compared to other studied accessions. Grain quality of some wheat landraces should be of particular interest because much broader diversity can be found in landraces compared to modern wheat cultivars [61]. Additionally, most of the organic wheat production systems rely on cultivars that were developed for high-input production systems [60,62]. Wheat landraces have been developed mostly in environments with low nutrient availability; they represent a source of variation for selection of genotypes adapted to cropping systems with low fertilizer input [61]. In the current study, we identified 224, 214 and 70 wheat landraces that were found to have high GPC under well-watered, water deficit and both conditions, respectively. Our results and previous reports indicated that GPC depends mainly on genotype, environment, and genotype × environment interaction [59]. However, the response mechanism that modifies protein accumulation under water deficit conditions is still unclear. Recently, a putative mechanism underlying the increased accumulation of storage proteins in wheat endosperm under water deficit was provided by Chen et al. [63]. They identified four differentially expressed miRNAs induced by drought stress that may affect the development of protein bodies in caryopsis by regulating the expression levels of target genes involved in protein biosynthesis pathways.
One of the primary goals of this study was to locate significant genomic regions that control the accumulation of GPC which might shed light on the genetic architecture of GPC and the protein accumulation mechanism. The genome-wide association mapping analysis, applied in the current study, using the kinship (K) matrix in a mixed model indicated that K matrix was adequate in accounting for population structure [64]. Also, these results agree with those of Zhao et al. [65], in which they found that K models were adequate for genome-wide association mapping. Furthermore, the K model was more effective in reducing the false-positive rate compared to using the Q + K model. Linkage disequilibrium (LD) was estimated using r2 among all pairs of SNPs loci, in which r2 in this study was 0.09, which is higher than that obtained by Breseghello and Sorrells [66] and 0.019 reported by Neumann et al. [67] because of their small size populations, and with a similar number of marker pairs. This indicates that the population size might have an impact on the LD.
Genome-wide association analysis (GWAS) was conducted on each environment separately to measure the repeatability of the significant SNPs, and the effect of moisture on the genomic regions controlling GPC. Several SNPs found to be significantly linked to the GPC under well-watered conditions but not significantly linked to GPC under water deficit conditions and vice versa. Moreover, ten QTLs were linked with GPC under both well-watered and water deficit conditions. The GWAS analysis suggested a significant role of genotype × environment interaction in detecting GPC associated loci. Genome-wide association studies using diverse wheat germplasm have successfully detected GPC associated loci in durum wheat [68], and bread wheat lines [69]. Thus, the SNPs associated with GPC under water deficit or well-watered environmental conditions, from this study might provide useful molecular information for wheat breeders to incorporate specific QTLs to increase GPC in low input or drought-stressed environments. Around 50% of the significant SNPs detected in the current study was on chromosome 1, where copies of Glu-B1 and Gli-B1 genes reside [70]. Glu-B1 and Gli-B1 genes were previously reported to contribute of about 24.6 and 19.5% of the total phenotypic variation for sedimentation volume (determines gluten strength and in turn cooking quality of pasta) [2]. Several SNP loci in LD with sedimentation volume were discovered recently on chromosome 1A and 1B, in durum wheat [68].
These results together emphasized the importance of using diverse worldwide germplasm to dissect the genetic architecture of GPC in wheat and identify accessions that might be potential parents in wheat breeding programs. Ongoing multiple years, multiple replication study using 406 accessions identified in the current study is being conducted, to evaluate these genotypes for yield and validate the GPC associated loci detected herein. Furthermore, GPC estimates under well-watered and water deficit conditions was used as a selection parameter to downsize the number of accessions from 2111 to 406. Reducing the number of accessions will allow us to profoundly investigate other wheat quality aspects such as concentrations (soluble and insoluble) of glutenin, α/β, γ gliadin and albumin/globulin in addition to the total protein for high and low GPC genotypes.

5. Conclusions

Based on previous research and our findings, the spring wheat collection used in this study contains high protein accessions. Furthermore, GPC measurement under well-watered and water deficit conditions was used as a selection criterion to reduce the number of accessions from 2111 to 406 accessions. This reduction in the number of studied accessions will allow us to profoundly study other wheat quality aspects such as concentrations (soluble and insoluble) of glutenin, α/β, γ gliadin and albumin/globulin in addition to the total protein for high and low GPC genotypes. It also represents a precious resource for further investigations including annotation of relevant genomic regions/genes using available wheat genomic resources to study the GPC. Results of GWAS indicated that several genomic regions were involved in GPC accumulation in wheat grains. Furthermore, GWAS results also suggested a significant role for genotype x environment interaction in the identification of GPC associated loci under well-watered and water deficit conditions. The identified loci might allow development of marker-assisted selection (MAS) for GPC and might also facilitate the development of a better understanding of the genetic architecture that controls GPC in wheat. Therefore, the high and low GPC accessions identified in the current study were included in ongoing multiple years and locations studies to evaluate them for yield and confirm the GPC associated loci detected.

Supplementary Materials

The following are available online at https://www.mdpi.com/2223-7747/7/3/56/s1, Figure S1: Decay of r2 as a function of genetic distance between SNP markers estimated for 2111 spring wheat collection from different geographic regions, Figure S2: The percentage of variance explained by principal components (PCA), Figure S3: Heatmap and dendrogram of a kinship matrix estimated using the A.mat function (rrBLUP package) based on 5090 SNPs among 2111 wheat accessions.

Author Contributions

I.S.E. Conception or design of the work, collecting the phenotypic data, data analysis, drafting the article, final approval of the version to be published. S.A.M. Design of the work, collecting the phenotypic data, review of the first draft, final approval of the version to be published. R.K.R. Design of the work, review of the first draft, final approval of the version to be published. A.M.K.N. Review of the first draft, final approval of the version to be published.

Funding

This study was supported financially by the Science and Technology Development Fund (STDF), Egypt, Grant No. 14935.

Acknowledgments

The authors would like to thank Holland Computing Center (University of Nebraska-Lincoln) for allowing the authors of this publication to use UNL’s supercomputing resources.

Conflicts of Interest

The authors declare no conflict of interest.

References

  1. Hawkesford, M.J. Reducing the reliance on nitrogen fertilizer for wheat production. J. Cereal Sci. 2014, 59, 276–283. [Google Scholar] [CrossRef] [PubMed]
  2. Würschum, T.; Leiser, W.L.; Kazman, E.; Longin, C.F.H. Genetic control of protein content and sedimentation volume in European winter wheat cultivars. Theor. Appl. Genet. 2016, 129, 1685–1696. [Google Scholar] [CrossRef] [PubMed]
  3. Day, L. Proteins from land plants? Potential resources for human nutrition and food security. Trends Food Sci. Technol. 2013, 32, 25–42. [Google Scholar] [CrossRef]
  4. Cantu, D.; Pearce, S.P.; Distelfeld, A.; Christiansen, M.W.; Uauy, C.; Akhunov, E.; Fahima, T.; Dubcovsky, J. Effect of the down-regulation of the high Grain Protein Content (GPC) genes on the wheat transcriptome during monocarpic senescence. BMC Genome 2011, 12, 492. [Google Scholar] [CrossRef] [PubMed]
  5. Triboi, E. Environmentally-induced changes in protein composition in developing grains of wheat are related to changes in total protein content. J. Exp. Bot. 2003, 54, 1731–1742. [Google Scholar] [CrossRef] [PubMed] [Green Version]
  6. Bertheloot, J.; Martre, P.; Andrieu, B. Dynamics of Light and Nitrogen Distribution during Grain Filling within Wheat Canopy. Plant Physiol. 2008, 148, 1707–1720. [Google Scholar] [CrossRef] [PubMed] [Green Version]
  7. Beta, T.; Nam, S.; Dexter, J.E.; Sapirstein, H.D. Phenolic Content and Antioxidant Activity of Pearled Wheat and Roller-Milled Fractions. Cereal Chem. J. 2005, 82, 390–393. [Google Scholar] [CrossRef]
  8. Li, X.; Zhou, L.; Liu, F.; Zhou, Q.; Cai, J.; Wang, X.; Dai, T.; Cao, W.; Jiang, D. Variations in Protein Concentration and Nitrogen Sources in Different Positions of Grain in Wheat. Front. Plant Sci. 2016, 7, 942. [Google Scholar] [CrossRef] [PubMed]
  9. Arduini, I.; Masoni, A.; Ercoli, L.; Mariotti, M. Grain yield, and dry matter and nitrogen accumulation and remobilization in durum wheat as affected by variety and seeding rate. Eur. J. Agron. 2006, 25, 309–318. [Google Scholar] [CrossRef]
  10. Lantican, M.A.; Braun, H.J.; Payne, T.S.; Singh, R.P.; Sonder, K.; Baum, M.; van Ginkel, M.; Erenstein, O. Impacts of International Wheat Improvement Research, 1994–2014; CIMMYT: Texcoco de Mora, Mexico, 2016; ISBN 9786078263554. [Google Scholar]
  11. Ashraf, M. Stress-Induced Changes in Wheat Grain Composition and Quality. Crit. Rev. Food Sci. Nutr. 2014, 54, 1576–1583. [Google Scholar] [CrossRef] [PubMed]
  12. Blanco, A.; Mangini, G.; Giancaspro, A.; Giove, S.; Colasuonno, P.; Simeone, R.; Signorile, A.; De Vita, P.; Mastrangelo, A.M.; Cattivelli, L.; et al. Relationships between grain protein content and grain yield components through quantitative trait locus analyses in a recombinant inbred line population derived from two elite durum wheat cultivars. Mol. Breed 2012, 30, 79–92. [Google Scholar] [CrossRef]
  13. De Santis, M.A.; Giuliani, M.M.; Giuzio, L.; De Vita, P.; Lovegrove, A.; Shewry, P.R.; Flagella, Z. Differences in gluten protein composition between old and modern durum wheat genotypes in relation to 20th century breeding in Italy. Eur. J. Agron. 2017, 87, 19–29. [Google Scholar] [CrossRef] [PubMed]
  14. Ravier, C.; Meynard, J.M.; Cohan, J.P.; Gate, P.; Jeuffroy, M.H. Early nitrogen deficiencies favor high yield, grain protein content and N use efficiency in wheat. Eur. J. Agron. 2017, 89, 16–24. [Google Scholar] [CrossRef]
  15. Gaju, O.; Allard, V.; Martre, P.; Le Gouis, J.; Moreau, D.; Bogard, M.; Hubbart, S.; Foulkes, M.J. Nitrogen partitioning and remobilization in relation to leaf senescence, grain yield and grain nitrogen concentration in wheat cultivars. Field Crops Res. 2014, 155, 213–223. [Google Scholar] [CrossRef]
  16. Mondal, S.; Rutkoski, J.E.; Velu, G.; Singh, P.K.; Crespo-Herrera, L.A.; Guzmán, C.; Bhavani, S.; Lan, C.; He, X.; Singh, R.P. Harnessing Diversity in Wheat to Enhance Grain Yield, Climate Resilience, Disease and Insect Pest Resistance and Nutrition Through Conventional and Modern Breeding Approaches. Front. Plant Sci. 2016, 7, 991. [Google Scholar] [CrossRef] [PubMed]
  17. Shewry, P.R.; Hey, S.J. The contribution of wheat to human diet and health. Food Energy Secur. 2015, 4, 178–202. [Google Scholar] [CrossRef] [PubMed] [Green Version]
  18. Lindeque, R.C. Protein Quality vs. Quantity in South African Commercial Bread Wheat Cultivars. Ph.D. Thesis, University of the Free State, Bloemfontein, South Africa, 2016. [Google Scholar]
  19. Soriano, J.M.; Villegas, D.; Aranzana, M.J.; García Del Moral, L.F.; Royo, C. Genetic structure of modern durum wheat cultivars and mediterranean landraces matches with their agronomic performance. PLoS ONE 2016, 11, e0160983. [Google Scholar] [CrossRef] [PubMed]
  20. Shewry, P.R. Improving the protein content and composition of cereal grain. J. Cereal Sci. 2007, 46, 239–250. [Google Scholar] [CrossRef]
  21. Velu, G.; Singh, R.P.; Cardenas, M.E.; Wu, B.; Guzman, C.; Ortiz-Monasterio, I. Characterization of grain protein content gene (GPC-B1) introgression lines and its potential use in breeding for enhanced grain zinc and iron concentration in spring wheat. Acta Physiol. Plant. 2017, 39, 212. [Google Scholar] [CrossRef]
  22. Uauy, C.; Brevis, J.C.; Dubcovsky, J. The high grain protein content gene Gpc-B1 accelerates senescence and has pleiotropic effects on protein content in wheat. J. Exp. Bot. 2006, 57, 2785–2794. [Google Scholar] [CrossRef] [PubMed] [Green Version]
  23. Amiri, R.; Bahraminejad, S.; Sasani, S.; Jalali-Honarmand, S.; Fakhri, R. Bread wheat genetic variation for grain’s protein, iron and zinc concentrations as uptake by their genetic ability. Eur. J. Agron. 2015, 67, 20–26. [Google Scholar] [CrossRef]
  24. Ravel, C.; Praud, S.; Murigneux, A.; Linossier, L.; Dardevet, M.; Balfourier, F.; Dufour, P.; Brunel, D.; Charmet, G. Identification of Glu-B1-1 as a candidate gene for the quantity of high-molecular-weight glutenin in bread wheat (Triticum aestivum L.) by means of an association study. Theor. Appl. Genet. 2006, 112, 738–743. [Google Scholar] [CrossRef] [PubMed]
  25. Nakamura, T.; Yamamori, M.; Hirano, H.; Hidaka, S. Decrease of Waxy (Wx) Protein in Two Common Wheat Cultivars with Low Amylose Content. Plant Breed 1993, 111, 99–105. [Google Scholar] [CrossRef]
  26. Giroux, M.J.; Morris, C.F. A glycine to serine change in puroindoline b is associated with wheat grain hardness and low levels of starch-surface friabilin. TAG Theor. Appl. Genet. 1997, 95, 857–864. [Google Scholar] [CrossRef]
  27. Gupta, R.B.; Singh, N.K.; Shepherd, K.W. The cumulative effect of allelic variation in LMW and HMW glutenin subunits on dough properties in the progeny of two bread wheats. Theor. Appl. Genet. 1989, 77, 57–64. [Google Scholar] [CrossRef] [PubMed]
  28. Araki, E.; Miura, H.; Sawada, S. Identification of genetic loci affecting amylose content and agronomic traits on chromosome 4A of wheat. TAG Theor. Appl. Genet. 1999, 98, 977–984. [Google Scholar] [CrossRef]
  29. Payne, P.I.; Nightingale, M.A.; Krattiger, A.F.; Holt, L.M. The relationship between HMW glutenin subunit composition and the bread-making quality of British-grown wheat varieties. J. Sci. Food Agric. 1987, 40, 51–65. [Google Scholar] [CrossRef]
  30. McCartney, C.A.; Somers, D.J.; Lukow, O.; Ames, N.; Noll, J.; Cloutier, S.; Humphreys, D.G.; McCallum, B.D. QTL analysis of quality traits in the spring wheat cross RL4452 × ‘AC Domain’. Plant Breed 2006, 125, 565–575. [Google Scholar] [CrossRef]
  31. Sun, H.; Lü, J.; Fan, Y.; Zhao, Y.; Kong, F.; Li, R.; Wang, H.; Li, S. Quantitative trait loci (QTLs) for quality traits related to protein and starch in wheat. Prog. Nat. Sci. 2008, 18, 825–831. [Google Scholar] [CrossRef]
  32. Fu, Y.-B.; Yang, M.-H.; Zeng, F.; Biligetu, B. Searching for an Accurate Marker-Based Prediction of an Individual Quantitative Trait in Molecular Plant Breeding. Front. Plant Sci. 2017, 8, 1182. [Google Scholar] [CrossRef] [PubMed]
  33. Zhao, Y.; Mette, M.F.; Gowda, M.; Longin, C.F.H.; Reif, J.C. Bridging the gap between marker-assisted and genomic selection of heading time and plant height in hybrid wheat. Heredity 2014, 112, 638–645. [Google Scholar] [CrossRef] [PubMed]
  34. Adhikari, T.B.; Gurung, S.; Hansen, J.M.; Jackson, E.W.; Bonman, J.M. Association Mapping of Quantitative Trait Loci in Spring Wheat Landraces Conferring Resistance to Bacterial Leaf Streak and Spot Blotch. Plant Genome J. 2012, 5, 1–16. [Google Scholar] [CrossRef] [Green Version]
  35. Odong, T.L.; van Heerwaarden, J.; Jansen, J.; van Hintum, T.J.L.; van Eeuwijk, F.A. Determination of genetic structure of germplasm collections: Are traditional hierarchical clustering methods appropriate for molecular marker data? Theor. Appl. Genet. 2011, 123, 195–205. [Google Scholar] [CrossRef] [PubMed]
  36. Zhang, L.; Liu, D.; Guo, X.; Yang, W.; Sun, J.; Wang, D.; Sourdille, P.; Zhang, A. Investigation of genetic diversity and population structure of common wheat cultivars in northern China using DArT markers. BMC Genet. 2011, 12, 42. [Google Scholar] [CrossRef] [PubMed]
  37. Hiremath, P.J.; Kumar, A.; Penmetsa, R.V.; Farmer, A.; Schlueter, J.A.; Chamarthi, S.K.; Whaley, A.M.; Carrasquilla-Garcia, N.; Gaur, P.M.; Upadhyaya, H.D.; et al. Large-scale development of cost-effective SNP marker assays for diversity assessment and genetic mapping in chickpea and comparative mapping in legumes. Plant Biotechnol. J. 2012, 10, 716–732. [Google Scholar] [CrossRef] [PubMed] [Green Version]
  38. Tadesse, W.; Ogbonnaya, F.C.; Jighly, A.; Sanchez-Garcia, M.; Sohail, Q.; Rajaram, S.; Baum, M. Genome-wide association mapping of yield and grain quality traits in winter wheat genotypes. PLoS ONE 2015, 10, e0141339. [Google Scholar] [CrossRef] [PubMed]
  39. Uauy, C. Wheat genomics comes of age. Curr. Opin. Plant Biol. 2017, 36, 142–148. [Google Scholar] [CrossRef] [PubMed]
  40. Taulemesse, F.; Gouis, J. Le; Gouache, D.; Gibon, Y.; Allard, V. Bread wheat (Triticum aestivum L.) grain protein concentration is related to early post-flowering nitrate uptake under putative control of plant satiety level. PLoS ONE 2016, 11, e0149668. [Google Scholar] [CrossRef] [PubMed]
  41. Federer, W.T.; Crossa, J. I.4 Screening Experimental Designs for Quantitative Trait Loci, Association Mapping, Genotype-by Environment Interaction, and Other Investigations. Front. Physiol. 2012, 3, 156. [Google Scholar] [CrossRef] [PubMed]
  42. Cavanagh, C.R.; Chao, S.; Wang, S.; Huang, B.E.; Stephen, S.; Kiani, S.; Forrest, K.; Saintenac, C.; Brown-Guedira, G.L.; Akhunova, A.; et al. Genome-wide comparative diversity uncovers multiple targets of selection for improvement in hexaploid wheat landraces and cultivars. Proc. Natl. Acad. Sci. USA 2013, 110, 8057–8062. [Google Scholar] [CrossRef] [PubMed] [Green Version]
  43. Breiman, L. Random forests. Mach. Learn. 2001, 45, 5–32. [Google Scholar] [CrossRef]
  44. Stekhoven, D.J.; Bühlmann, P. MissForest-non-parametric missing value imputation for mixed-type data. Bioinformatics 2012, 28, 112–118. [Google Scholar] [CrossRef] [PubMed]
  45. Wang, S.; Wong, D.; Forrest, K.; Allen, A.; Chao, S.; Huang, B.E.; Maccaferri, M.; Salvi, S.; Milner, S.G.; Cattivelli, L.; et al. Characterization of polyploid wheat genomic diversity using a high-density 90,000 single nucleotide polymorphism array. Plant Biotechnol. J. 2014, 12, 787–796. [Google Scholar] [CrossRef] [PubMed] [Green Version]
  46. Federer, W.T.; King, F. Variations on Split Plot and Split Block Experiment Designs; John Wiley & Sons: New York, NY, USA, 2006; ISBN 9780470108581. [Google Scholar]
  47. R Core Team. R: A Language and Environment for Statistical Computing; R Foundation for Statistical Computing: Vienna, Austria, 2017; Available online: https://www.R-project.org/ (accessed on 6 October 2017).
  48. Lenth, R.V. Least-Squares Means: The R Package lsmeans. J. Stat. Softw. 2016, 69. [Google Scholar] [CrossRef]
  49. Asadabadi, Y.Z.; Khodarahmi, M.; Nazeri, S.M.; Peyghambari, S.A. Genetic Study of Grain Yield and its Components in Bread Wheat Using Generation Mean Analysis under Water Stress Condition. J. Plant Physiol. Breed 2012, 2, 55–60. [Google Scholar]
  50. Lipka, A.E.; Tian, F.; Wang, Q.; Peiffer, J.; Li, M.; Bradbury, P.J.; Gore, M.A.; Buckler, E.S.; Zhang, Z. GAPIT: Genome association and prediction integrated tool. Bioinformatics 2012, 28, 2397–2399. [Google Scholar] [CrossRef] [PubMed]
  51. Endelman, J.B.; Jannink, J.-L. Shrinkage Estimation of the Realized Relationship Matrix. Genes Genome Genet. 2012, 2, 1405–1413. [Google Scholar] [CrossRef] [PubMed] [Green Version]
  52. Zheng, X.; Weir, B.S. Eigenanalysis of SNP data with an identity by descent interpretation. Theor. Popul. Biol. 2016, 107, 65–76. [Google Scholar] [CrossRef] [PubMed]
  53. Storey, J.D.; Tibshirani, R. Statistical significance for genomewide studies. Proc. Natl. Acad. Sci. USA 2003, 100, 9440–9445. [Google Scholar] [CrossRef] [PubMed] [Green Version]
  54. Wray, N.R.; Yang, J.; Hayes, B.J.; Price, A.L.; Goddard, M.E.; Visscher, P.M. Pitfalls of predicting complex traits from SNPs. Nat. Rev. Genet. 2013, 14, 507–515. [Google Scholar] [CrossRef] [PubMed] [Green Version]
  55. Schwarz, G. Estimating the Dimension of a Model. Ann. Stat. 1978, 6, 461–464. [Google Scholar] [CrossRef]
  56. Singh, S.; Gupta, A.K.; Kaur, N. Influence of drought and sowing time on protein composition, antinutrients, and mineral contents of wheat. Sci. World J. 2012, 2012, 485751. [Google Scholar] [CrossRef] [PubMed]
  57. Ozturk, A.; Aydin, F. Effect of water stress at various growth stages on some quality characteristics of winter wheat. J. Agron. Crop Sci. 2004, 190, 93–99. [Google Scholar] [CrossRef]
  58. Grenier, S.; Barre, P.; Litrico, I. Phenotypic Plasticity and Selection: Nonexclusive Mechanisms of Adaptation. Scientifica 2016, 2016, 7021701. [Google Scholar] [CrossRef] [PubMed]
  59. Dvořáček, V.; Čurn, V. Evaluation of protein fractions as biochemical markers for identification of spelt wheat cultivars (Triticum spelta L.). Plant Soil Environ. 2003, 49, 99–105. [Google Scholar] [CrossRef]
  60. Jaradat, A.A. Wheat landraces: A mini review. Emir. J. Food Agric. 2013, 25, 20–29. [Google Scholar] [CrossRef]
  61. Lopes, M.S.; El-Basyoni, I.; Baenziger, P.S.; Singh, S.; Royo, C.; Ozbek, K.; Aktas, H.; Ozer, E.; Ozdemir, F.; Manickavelu, A.; et al. Exploiting genetic diversity from landraces in wheat breeding for adaptation to climate change. J. Exp. Bot. 2015, 66, 3477–3486. [Google Scholar] [CrossRef] [PubMed] [Green Version]
  62. Baenziger, P.S.; Salah, I.; Little, R.S.; Santra, D.K.; Regassa, T.; Wang, M.Y. Structuring an Efficient Organic Wheat Breeding Program. Sustainability 2011, 3, 1190–1205. [Google Scholar] [CrossRef] [Green Version]
  63. Chen, X.-Y.; Yang, Y.; Ran, L.-P.; Dong, Z.; Zhang, E.-J.; Yu, X.-R.; Xiong, F. Novel Insights into miRNA Regulation of Storage Protein Biosynthesis during Wheat Caryopsis Development under Drought Stress. Front. Plant Sci. 2017, 8, 1707. [Google Scholar] [CrossRef] [PubMed]
  64. Endelman, J. Using rrBLUP 4.0. Jeffrey Endelman 17 September 2012. Available online: http://www.afhalifax.ca/bete/revive-eponge/Rblkfct/vignette.pdf (accessed on 8 July 2018).
  65. Zhao, K.; Aranzana, M.J.; Kim, S.; Lister, C.; Shindo, C.; Tang, C.; Toomajian, C.; Zheng, H.; Dean, C.; Marjoram, P.; et al. An Arabidopsis example of association mapping in structured samples. PLoS Genet. 2007, 3, e4. [Google Scholar] [CrossRef] [PubMed]
  66. Breseghello, F.; Sorrells, M.M.E. Association mapping of kernel size and milling quality in wheat (Triticum aestivum L.) cultivars. Genetics 2006, 172, 1165–1177. [Google Scholar] [CrossRef] [PubMed]
  67. Neumann, K.; Kobiljski, B.; Denčić, S.; Varshney, R.K.; B?rner, A. Genome-wide association mapping: A case study in bread wheat (Triticum aestivum L.). Mol. Breed 2011, 27, 37–58. [Google Scholar] [CrossRef]
  68. Fiedler, J.D.; Salsman, E.; Liu, Y.; Michalak de Jiménez, M.; Hegstad, J.B.; Chen, B.; Manthey, F.A.; Chao, S.; Xu, S.; Elias, E.M.; et al. Genome-Wide Association and Prediction of Grain and Semolina Quality Traits in Durum Wheat Breeding Populations. Plant Genome 2017, 10. [Google Scholar] [CrossRef] [PubMed] [Green Version]
  69. Liu, J.; Feng, B.; Xu, Z.; Fan, X.; Jiang, F.; Jin, X.; Cao, J.; Wang, F.; Liu, Q.; Yang, L.; et al. A genome-wide association study of wheat yield and quality-related traits in southwest China. Mol. Breed 2018, 38, 1. [Google Scholar] [CrossRef]
  70. Troccoli, A.; Borrelli, G.M.; De Vita, P.; Fares, C.; Di Fonzo, N. Mini Review: Durum Wheat Quality: A Multidisciplinary Concept. J. Cereal Sci. 2000, 32, 99–113. [Google Scholar] [CrossRef]
Figure 1. Boxplot for the overall performance of the 2111 wheat accessions across the four environments (well-watered and water-deficit conditions in 2016 and 2017 growing seasons).
Plants 07 00056 g001
Figure 2. The overall performance of the 2111 wheat accessions across the two growing seasons under water deficit and well-watered growth conditions.
Plants 07 00056 g002
Figure 3. Manhattan plot for grain protein content (GPC) obtained from genome-wide association mapping in the 2016 growing season.
Plants 07 00056 g003
Figure 4. Manhattan plot for grain protein content (GPC) obtained from genome-wide association mapping in the 2017 growing season.
Plants 07 00056 g004
Table 1. Analysis of variance for grain protein content (GPC) of the 2111 genotypes across environments.
SourceDFType III SSMean SquareF Value
Environment370,093.7823,364.5919,188.5 **
IBlock (Replicate Environment)2561361.565.314.37
Genotypes211326,096.1912.3510.14 **
Environment × Genotypes625526,164.384.183.44 **
Error920811,211.991.21
**: Significant at 0.01 probability level.
Table 2. Lsmean values of the grain protein content (GPC) of 20 accessions with the highest values across 2015/2016 and 2016/2017 growing seasons obtained from well-watered (control) and water-deficit conditions.
Well-WateredWater Deficit
AccessionOriginImprovementMeanAccessionOriginImprovementMean
534,406Algerialandrace14.78366,801Afghanistanlandrace17.965
534,448Algerialandrace15.63350,850Austrialandrace18.38
338,364Belgiumcultivar14.83350,820Austrialandrace18.1125
481,731Bhutanlandrace14.69565,254Bolivialandrace17.9275
14,261Canadabreeding15.39374,243Chadlandrace18.135
313,109Colombiauncertain15.1357,825Indialandrace18.0175
372,434Cypruslandrace14.90382,048Iranlandrace18.535
428,672Czech Republiccultivar15.33625,916Iranlandrace18.43
254,023Europeuncertain15.27623,758Iranlandrace18.055
278,279Greecelandrace15.09624,992Iranlandrace18.03
468,988Greecelandrace16.11624,124Iranlandrace17.9125
15,396Lebanonuncertain15.89626,116Iranlandrace17.9075
520,369Mexicobreeding15.80623,968Iranlandrace17.8525
525,283Moroccolandrace15.4970,704Iraqlandrace18.42
477,901Perulandrace15.05191,987Portugallandrace18.3475
370,724Polandcultivar15.03345,474Serbialandrace18.3975
155,119Russian Federationcultivar15.68225,424Uruguaybreeding18.355
479,700South Africacultivar15.48225,519Uruguaybreeding17.8375
241,596Taiwancultivar15.3136,500Uzbekistanlandrace17.95
534,366Tunisialandrace14.9824,485Uzbekistanlandrace17.85
Table 3. SNP markers that found to be significantly linked with GPC under well-watered (control) and water deficit conditions.
MarkerChromPositionWell-WateredWater DeficitR2 (%)Additive EffectMAFMarkerChromPositionWell-WateredWater DeficitR2 (%)Additive EffectMAF
20162017201620172016201720162017
IWA51501A9.9++0.893−0.0070.19IWA85511D32.8+1.0690.0620.25
IWA66491A11.6+++1.1410.070.35IWA34811D45.1++1.1220.130.07
IWA43511A11.6+++1.0890.0620.35IWA34461D45.1++1.0010.0860.07
IWA46431A21++0.8920.0040.28IWA50201D47.7+0.918−0.0260.33
IWA47531A21.7+0.9−0.020.1IWA50191D47.7+0.918−0.0260.33
IWA71911A21.7++0.9650.0530.13IWA50181D47.7+0.917−0.0260.33
IWA46781A22.5+0.9010.0280.08IWA45981D48.6+0.9120.0230.33
IWA46441A22.9+0.915−0.0260.16IWA70076A10+0.9180.0250.23
IWA47541A23.2++0.8920.0030.34IWA45516A16.2+1.294−0.130.13
IWA45061A26.9+0.907−0.0190.29IWA45526A16.2+1.313−0.1310.13
IWA70501A32.5+1.3050.0920.38IWA72886A17.8++1.3160.0930.35
IWA41631A32.8+1.17−0.0760.39IWA72876A21.9++1.3910.1160.21
IWA43491B13.2++1.5890.1280.26IWA49626A22.8+0.923−0.0270.24
IWA67871B13.2++1.4330.1050.28IWA47306B48.5+0.9220.0460.06
IWA70481B22.9+1.7460.2440.07IWA35016B48.8++++2.6810.2130.39
IWA74801B22.9+1.4720.1110.35IWA79376B48.8++++2.6540.1870.37
IWA31691B23.7++++2.0270.1610.31IWA39236B48.8++1.2080.1170.11
IWA81991B27.4++1.2710.0990.25IWA64666B48.8++1.4480.1310.18
IWA73451B28.1++1.8080.230.09IWA64676B48.8++1.4550.1320.18
IWA66111B28.1+1.6360.1310.27IWA59866B50.8++0.8920.0050.24
IWA66101B28.1+1.642−0.130.27IWA66736D17.2+1.1470.0790.24
IWA37381B28.2+1.4510.120.22IWA36246D17.3+1.0730.0680.41
IWA82751B28.2+1.6180.1280.27IWA76166D29.8+1.5420.1420.17
− and + refer to nonsignificant and significant SNPs, respectively.

