Article

Comparison between Canadian Canola Harvest and Export Surveys

by
Véronique J. Barthet
Grain Research Laboratory, Canadian Grain Commission, 1404-303 Main St., Winnipeg, MB R3C 3G8, Canada
Plants 2016, 5(3), 30; https://doi.org/10.3390/plants5030030
Submission received: 14 April 2016 / Revised: 13 July 2016 / Accepted: 14 July 2016 / Published: 20 July 2016
(This article belongs to the Special Issue Selected/Extended Full Papers of 14th International Rapeseed Congress)

Abstract

:
Parameters, such as oil, protein, glucosinolates, chlorophyll content and fatty acid composition, were determined using reference methods for both harvest survey samples and Canadian Canola exports. Canola harvest survey and export data were assessed to evaluate if canola harvest survey data can be extrapolated to predict the quality of the Canadian canola exports. There were some differences in some measured parameters between harvest and export data, while other parameters showed little difference. Protein content and fatty acid composition showed very similar data for harvest and export averages. Canadian export data showed lower oil content when compared to the oil content of harvest survey was mainly due to a diluting effect of dockage in the export cargoes which remained constant over the years (1.7% to 1.9%). Chlorophyll was the least predictable parameter; dockage quality as well as commingling of the other grades in Canola No. 1 Canada affected the chlorophyll content of the exports. Free fatty acids (FFA) were also different for the export and harvest survey. FFA levels are affected by storage conditions; they increase during the shipping season and, therefore, are difficult to predict from their harvest survey averages.

Graphical Abstract

1. Introduction

Canola production steadily increased in Canada to reach over 17 million tonnes in 2013. In 2014, the Canola Council of Canada released a new strategy (“keep it coming”) to encourage the Canadian canola industry to increase canola production to 26 million tonnes and to acquire new markets for the increased production. On a yearly average, over half of the seed production is exported to China, Japan, Mexico and the US, which are the main markets in Canada.
In Canada, canola is sold based on grades defined by the Canadian grain guide [1]. These grades have been established to allow for rapid segregation upon delivery at the various points of the grain supply chain (primary or terminal elevator, feed mill or crushing plant). While the Canadian grain guide defines the grades of Canadian canola, there are also other important chemical quality parameters for canola seed. These include oil, protein, chlorophyll, glucosinolates, free fatty acids and the fatty acid composition. Oil is an important quality factor since canola, being an oilseed, is processed to produce high quality oil. Protein content is important in order to produce good quality feed for animals, especially dairy cows. Chlorophyll content is a negative quality factor for Canadian canola. The short growing season in Canada is usually responsible for seed containing non-negligible chlorophyll amounts. This chlorophyll is found in crude oil and has to be removed from the oil during refining to produce clear canola oil for commercial use.
Genetic and environmental growing conditions affect canola quality parameters. For example, there is an inverse relationship with the oil content of the seed and temperature; hot growing conditions will lead to lower oil content when compared to cooler conditions. The opposite effect is found for the protein content of the seeds. Canola chlorophyll content is greatly affected by the growing conditions; a longer growing season will give a low chlorophyll content whereas a shorter season, often due to early frost, will give seeds with very high chlorophyll content
This paper deals with a comparison of the data obtained from the yearly harvest survey program (Harvest Sample Data or HSD) of the Canadian Grain Commission and from the export monitoring program (Export Cargo Data or ECD) also conducted by the Canadian Grain Commission on officially inspected cargoes.

2. Results and Discussion

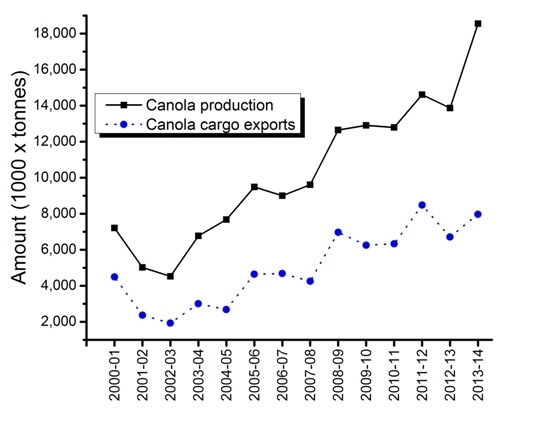
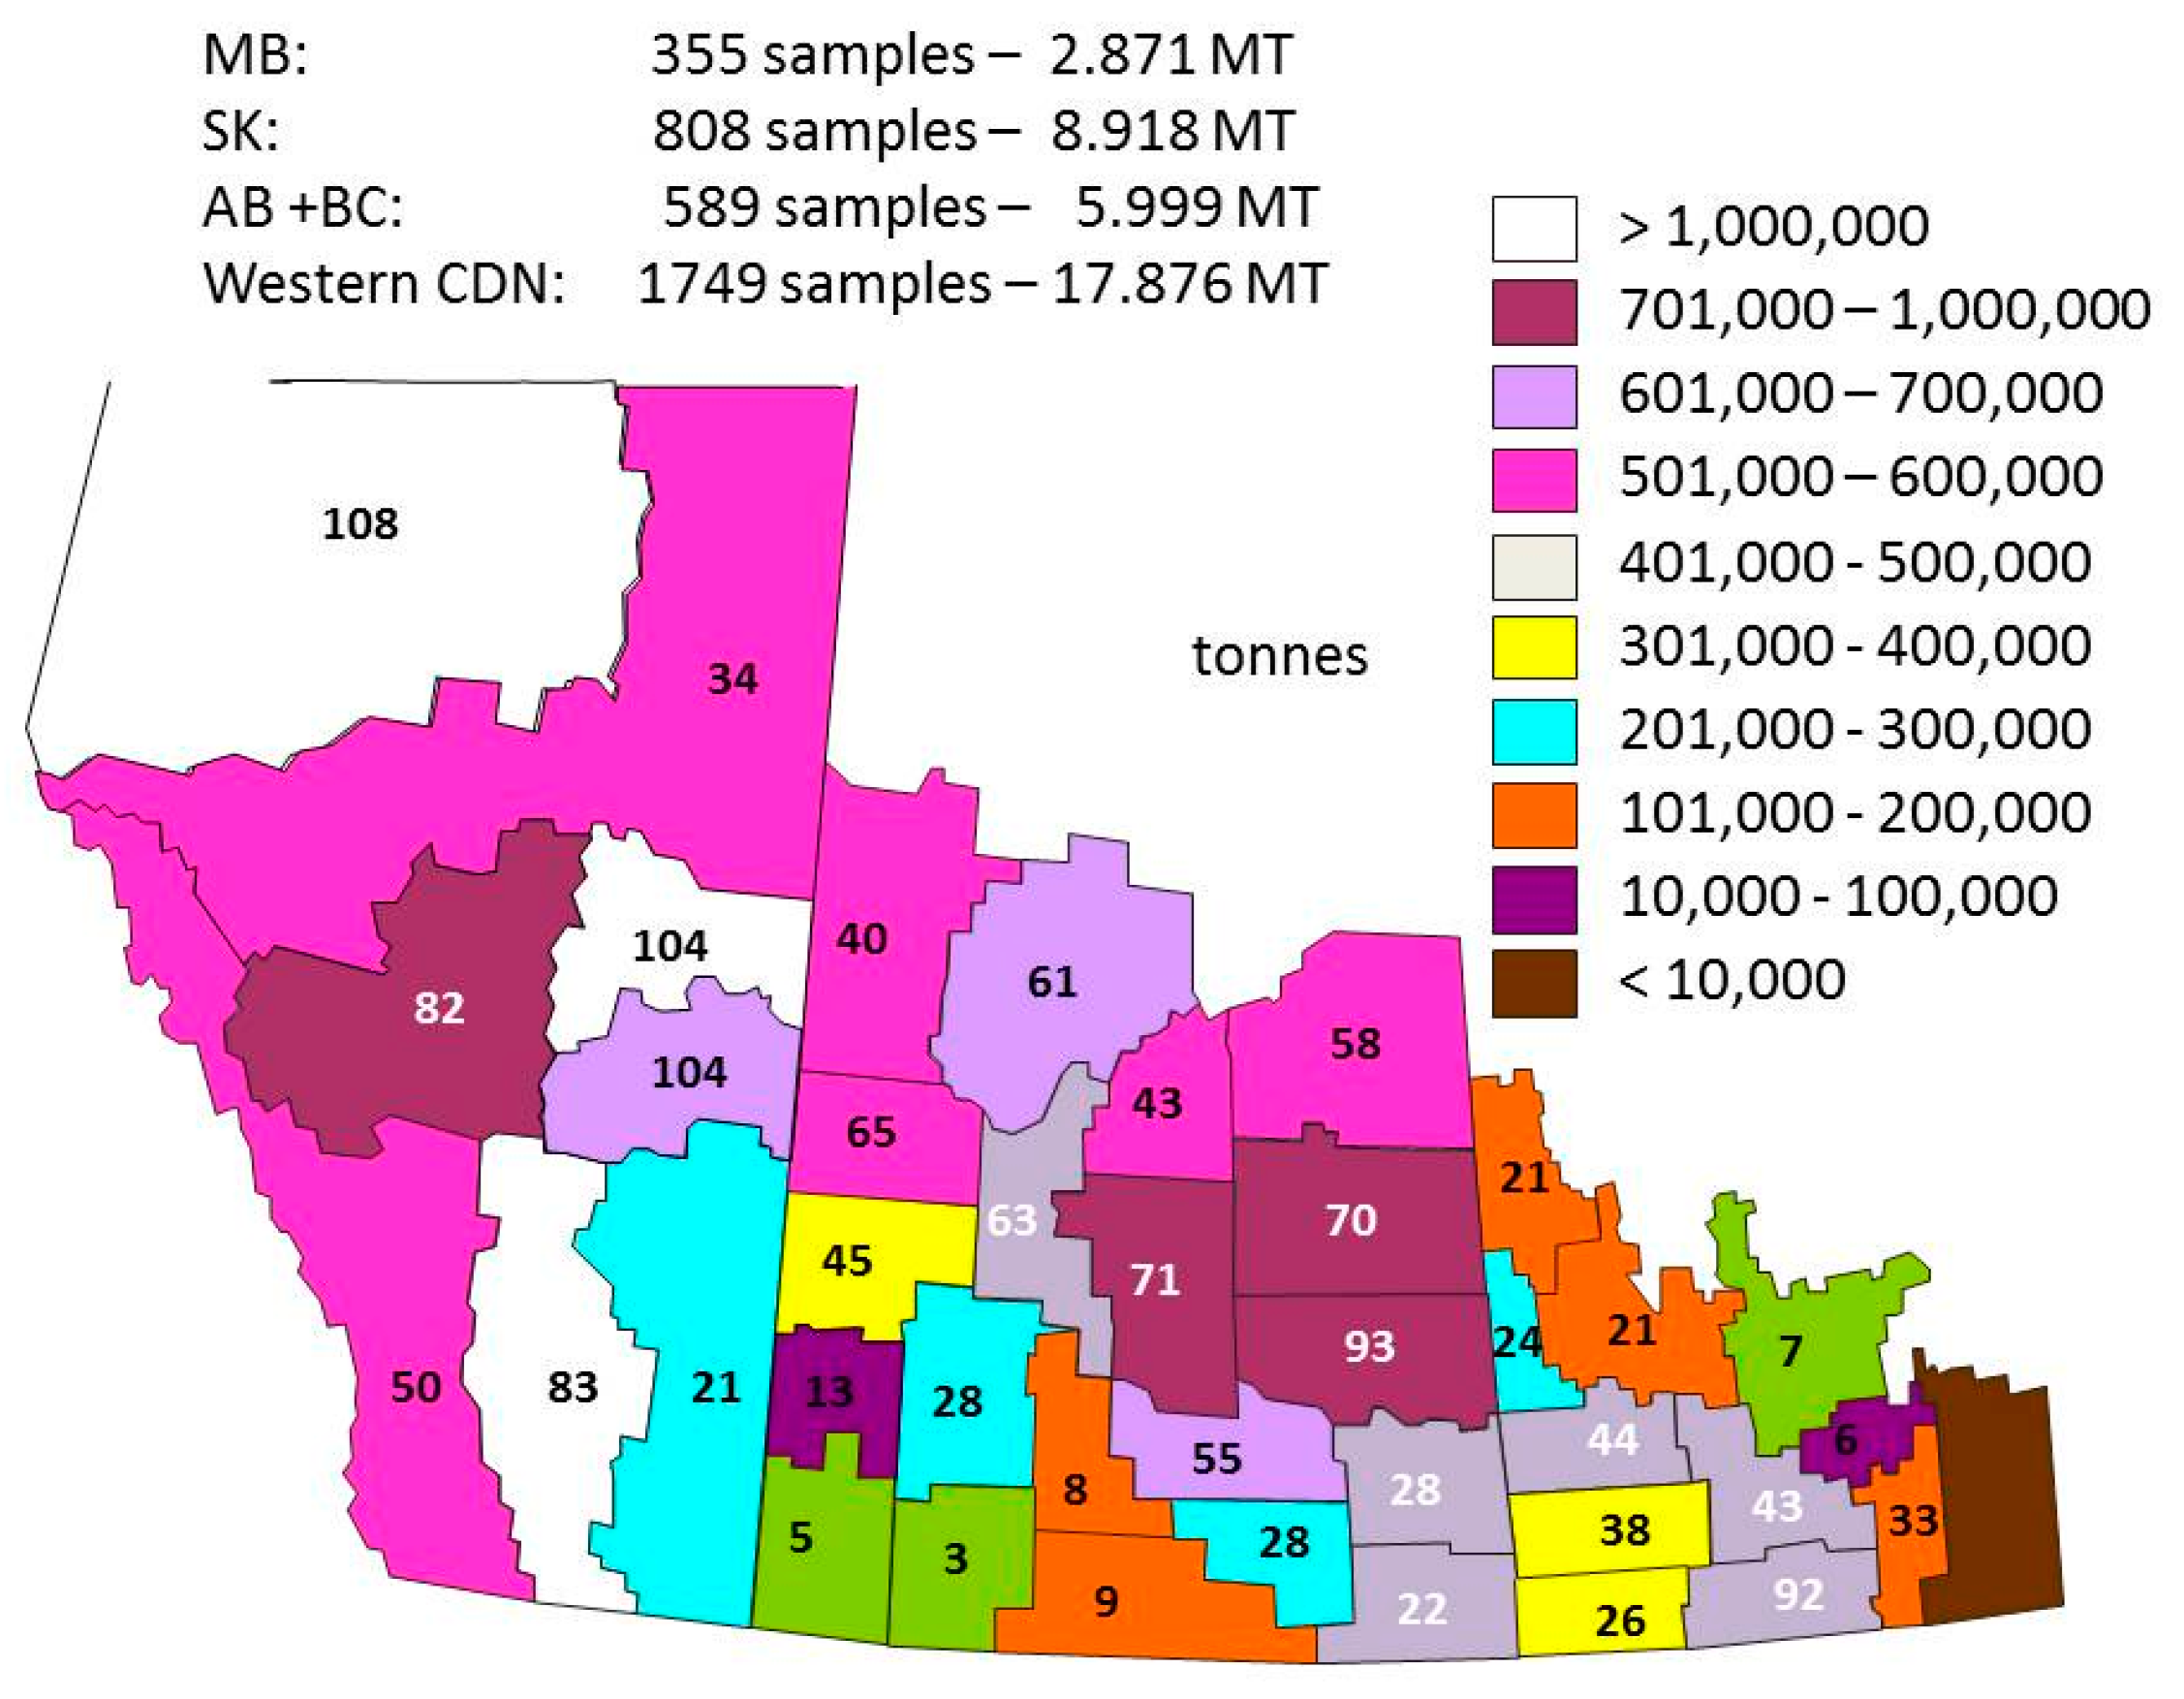
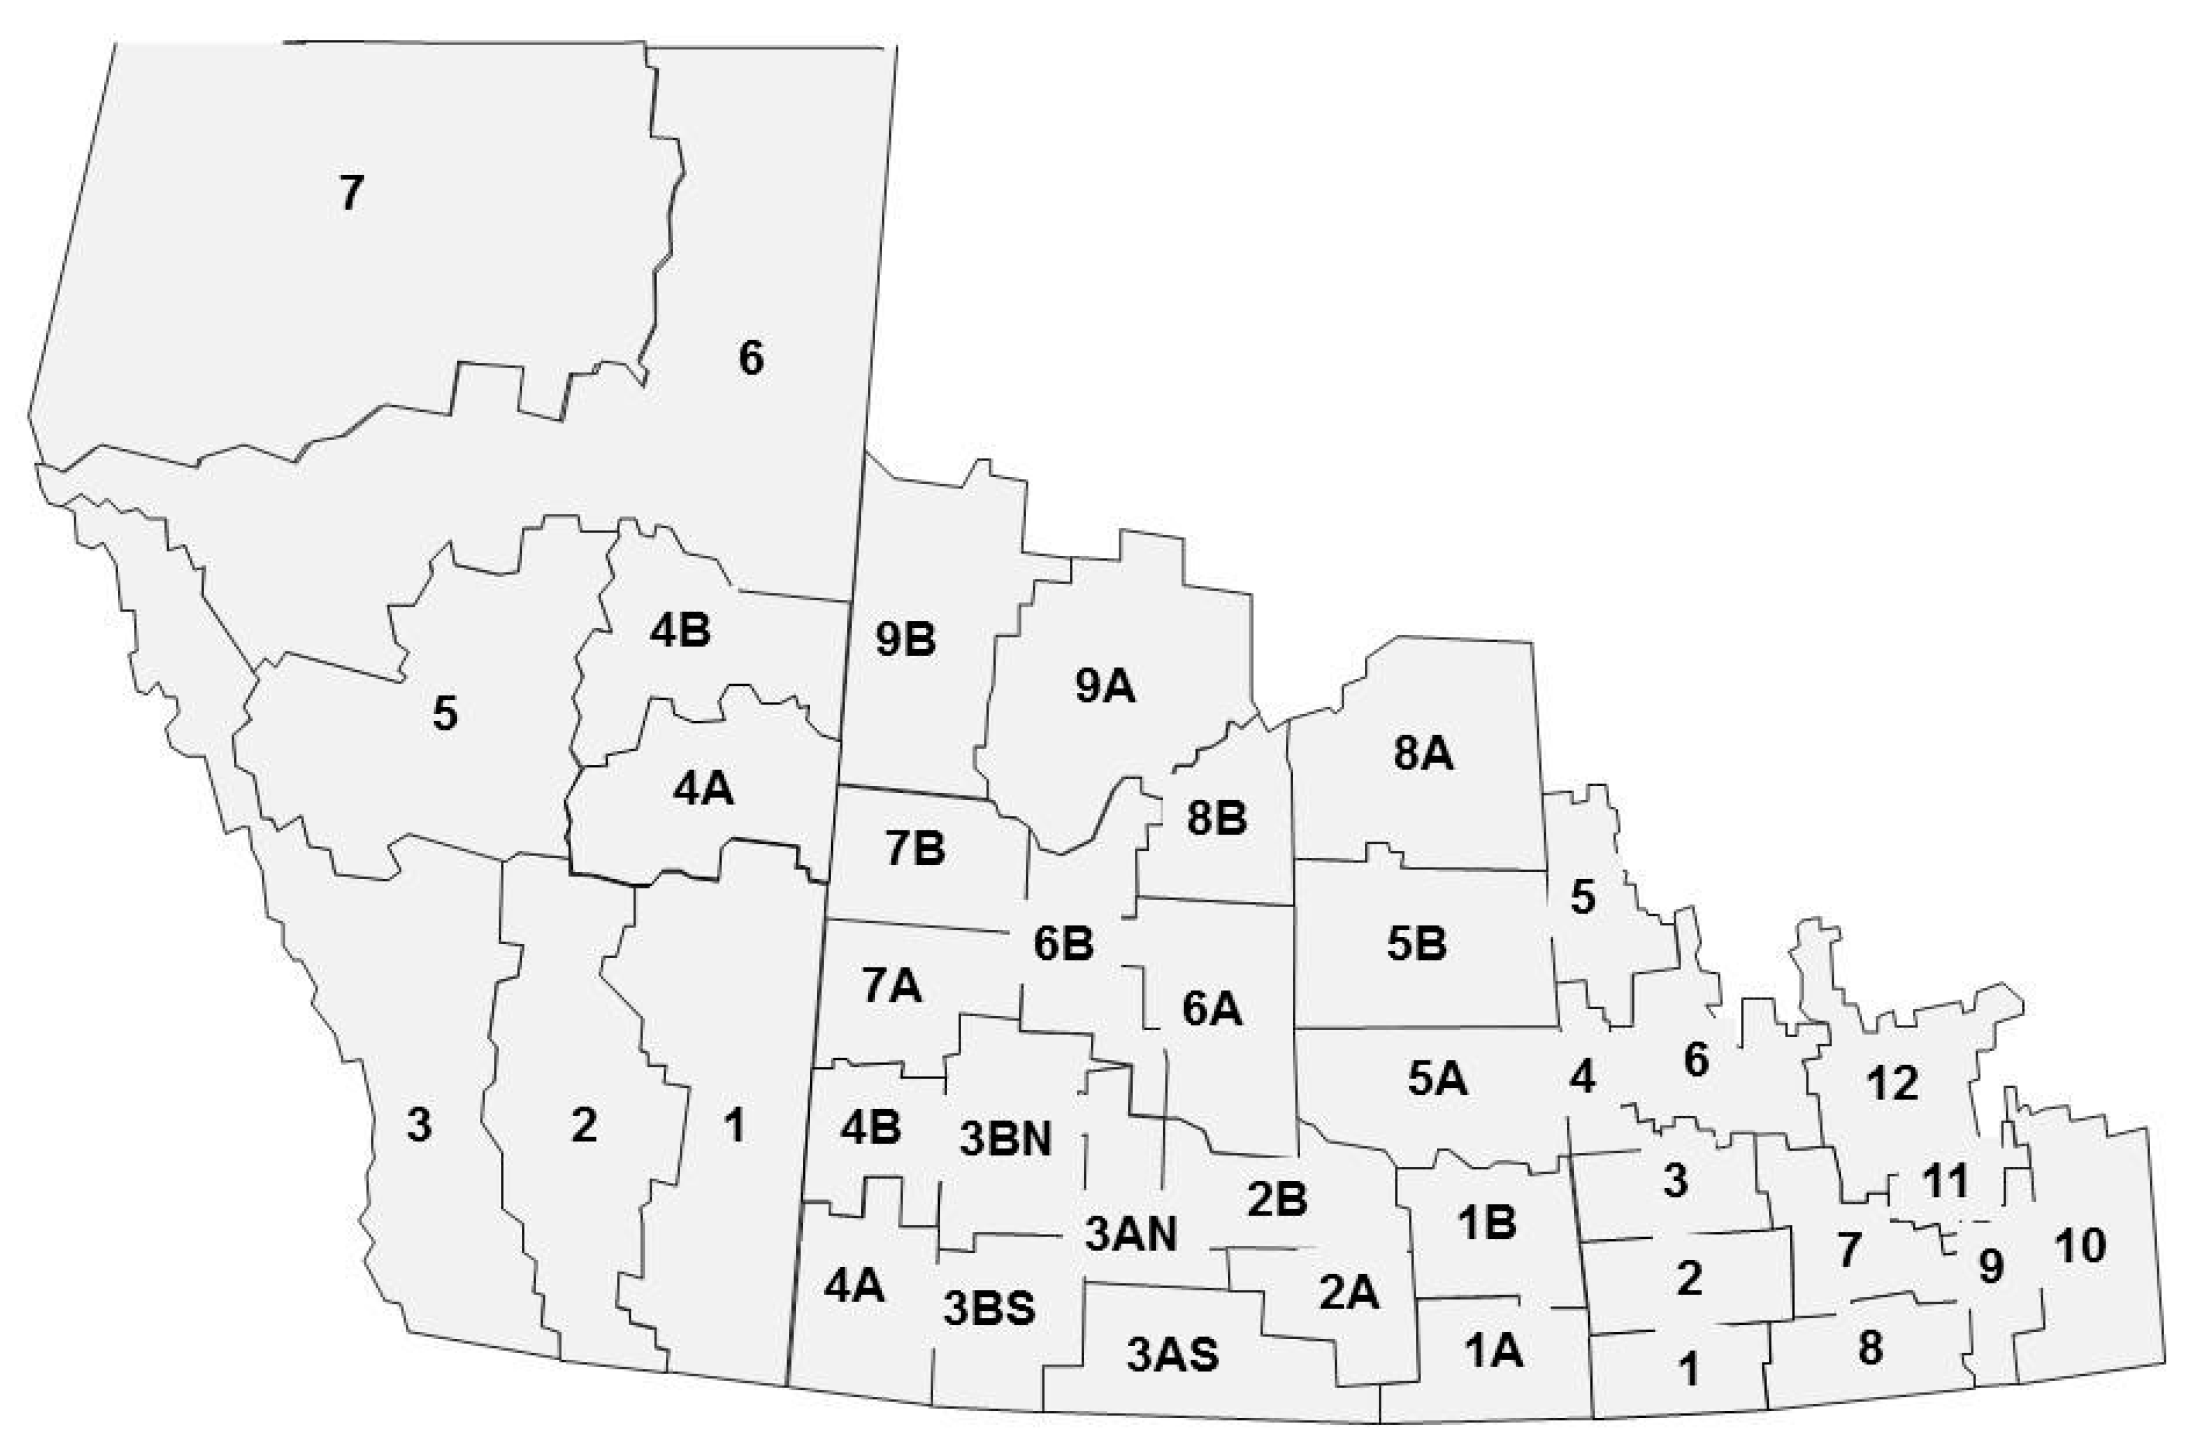
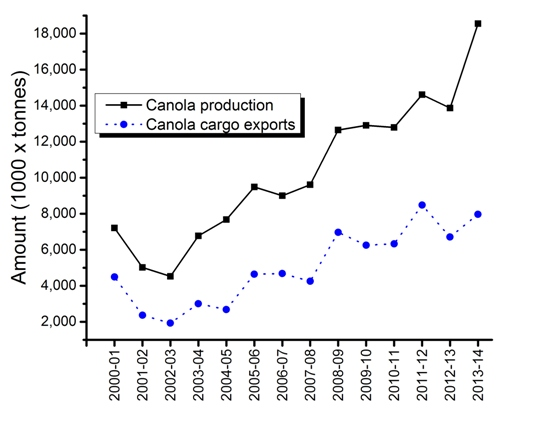
2.1. Harvest Survey Data
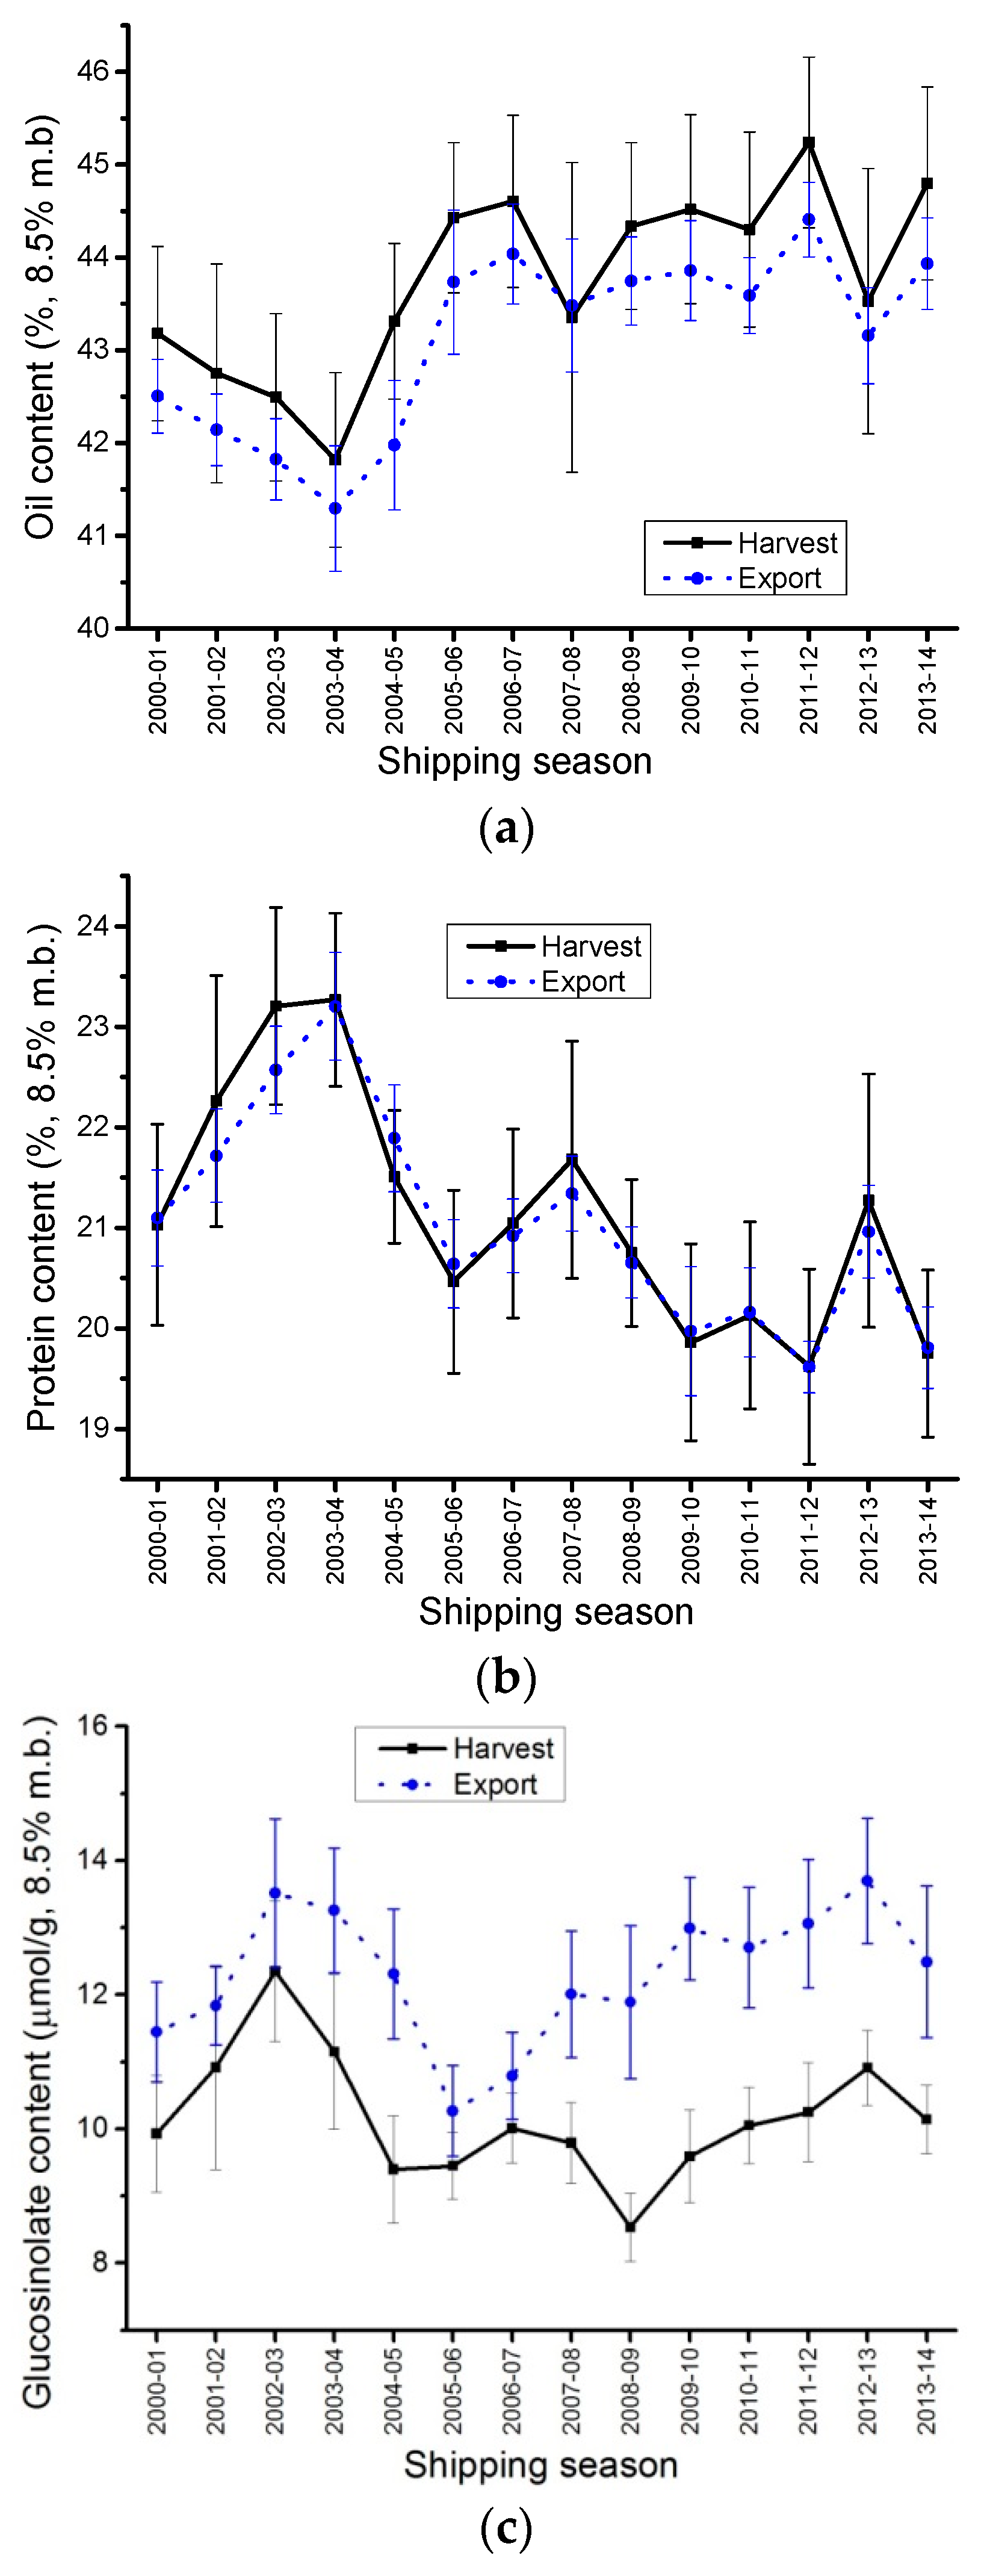
In 1927, the Canadian Grain Commission started a voluntary survey for wheat in the western provinces of Canada. In 1956, rapeseed (canola) was included in the annual harvest survey. Every year, samples of canola from western Canada are sent by producers, grain elevators and processors to the Canadian Grain Commission where the samples are graded and analyzed to produce annual reports describing the quality of the harvest of western Canadian grains. For this paper, only canola harvest sample data (HSD) reported for the western provinces (Manitoba, Saskatchewan, Alberta and the Peace River area of British Columbia) from 2000 to 2014 are used (Table 1).
The averages for each of the provinces for the harvest survey are calculated using crop district data (Figure 1). HSD for each crop district are weighted by production values and by the number of samples in the grade. These in turn are used to calculate the provincial averages.
Figure 1 shows an example of crop district production and the number of samples received by crop district. In this report, the production data used for each crop district to calculate the weighted quality averages are estimated production numbers since small production data are usually published by Statistics Canada [2] well after the harvest survey reports are posted. Yearly production estimates have also been difficult to assess due to a continual increase in canola production since 2000 and the large effects of the environment on the crop district production, e.g., flood in Manitoba in 2011 (Table 2).
Estimated crop district production numbers take into account the production differences between regions. The production estimations were made using five-year production averages for each crop district until 2010. In 2011, three-year production averages were chosen to lessen the discrepancy due to the steady production increase. The number of samples received in the harvest survey varied from year to year (Table 1). Production as well as quality of the crop was assumed to affect the number of samples received. Over the years, it was expected that more samples would be submitted to the harvest program if there were higher incidences of crop damage; however, Table 1 did not show a relationship between crop damage and the number of samples received.
On average for the harvest years of 2000 to 2007, one sample represented approximately 4000 tonnes. For the 2008 harvest there was an increase of over 3000 tonnes. There has been a steady rise in tonnage from 2008 to 2014. On average, 1 sample represents approximately 8266 tonnes. The highest ratio tonnes/sample was observed in 2013, which was a bumper crop year, where 1 sample represented 11,313 tonnes.
Since 2000, canola yield averages steadily increased, but that increase was not reflected equally in each province. Since 2000, on average there was a yearly yield increase of 29, 45, 57 and 22 Kg/hectare for Manitoba, Saskatchewan, Alberta and British Columbia, respectively. At the same time, Statistics Canada reported that in Canada, the number of land crop farms decreased (215,581 in 2001 versus 174,343 in 2011) while the average size of the farms increased (417 hectares in 2001 versus 501 hectares in 2011).
This could partially explain why the number of samples received in the harvest survey did not increase directly as a function of the production. It is also true that not all producers return their envelopes. The canola harvest survey shows that canola producers have between 37% and 40% envelop return rate. This highlights one of the limitations of the harvest survey program. It is voluntary and only willing producers participate; as such, the number of samples varies from year to year. As a result of the variation, the grade distribution for each crop district and the provincial averages might not be as accurate as they should be.
Export cargo data (ECD) and the number of cargoes analyzed as part of the export cargo-monitoring program from 2000 to 2014 are presented in Table 1. Overall, a little less than 50% of the Canadian canola production has been exported, and over 95% the cargoes were leaving from the port of Vancouver (data not shown). Prince Rupert, also located in British Columbia, has been marginally used to export canola cargoes.

2.2. Oil Content

There was a statistical difference between the oil content of the HSD and the oil content of the ECD (Table 3, Figure 2a). There was a linear relationship between the HSD and the ECD oil contents (R2 = 0.93976); the HSD oil content was always about 0.64% higher than the ECD averages. In 2005, DeClerq and Daun [3] also reported that HSD oil content averages were 0.25% higher than ECD oil content average. The harvest samples are cleaned before analyses (0.00% dockage), and they contain only inconspicuous admixture (seeds that are not readily distinguishable from canola). Canola cargo exports are considered commercially clean when they contain less than 2.5% dockage. On average, Canadian commercially-clean canola exports contained 1.88% of dockage (Table 1), whereas the harvest samples contained 0.00% dockage. Dockage is defined in the Official Grain Grading Guide as any material intermixed with canola other than canola seed [1]. It is usually made of roughage material, seed pods, knuckles or other seeds such as wheat, barley or flax and also, sometimes, broken canola seeds. Dockage material contains less oil than canola seeds, therefore, commercially clean canola samples are likely to have a lower oil content than completely clean canola samples. Every year producers grow canola seeds with higher oil content, which in turn increases the difference in oil content between the canola seeds and dockage material. The bigger difference observed in this report when compared to the 2005 report [3] was likely due to the increase in oil content of the canola seeds. It would be commercially impossible to have exports with no dockage since there is a fine balance between removing all foreign material (using various size sieves) and eliminating/losing canola seeds during the cleaning.
As a result, on average, ECD will always show lower oil content when compared to HSD. The differences in oil content between commercially clean exports and the harvest survey samples graded Canola No. 1, Canada will continue to increase as canola oil content increases with breeding.

2.3. Protein Content

There was no statistical difference between the protein content of the HSD and the protein content of the ECD (Table 3, Figure 2b). This agreed with DeClercq and Daun’s [3] findings. Unlike oil content, dockage had no effect on the protein content of the ECD when compared to HSD. Slight differences were observed between averages of the 2001 HSD and its corresponding ECD and between the 2002 HSD and its corresponding ECD, however, there was no statistical difference between the averages.
There were larger variations for HSD oil and protein contents than for ECD (higher standard deviation). It is known that growing conditions have important effects on oil and protein contents. The narrower variations observed in the ECD were likely due to how the grain is handled in Canada. In western Canada, producers deliver seeds to primary grain elevators where they are combined with seed from another location before moving to terminal elevators to be exported. In the primary elevators, the seeds of the same grade are combined and mixed leading to an averaging of quality and a reduction of the variations. Exported seeds also tend to be collected from geographically narrower areas than the whole western part of Canada; seeds exported via the ports in the west (Vancouver and Prince Rupert) are more likely drawn from growing areas closer to export points to reduce transportation risk and cost, for example, crop districts No. 4A and 4B from Alberta or the BC Peace River. Narrowing the growing area where the seeds are exported from will result in a narrowing of the oil and protein variation ranges.

2.4. Glucosinolates Content

Total glucosinolates content overall showed a statistical difference between the ECD and the HSD averages (Table 4). ECD averages were about 2 µmol/g higher than the HSD averages (Figure 2c). Again, the difference was probably due to dockage. However, it was unlikely that dockage contained components with high glucosinolates contents. Glucosinolates are very low in Canadian canola. The analytical method used to measure them might be responsible for the difference. Due to the low amount of glucosinolate, the NIR method might not be accurate as a reference method because dockage components could create artifacts leading to a slight overestimation of the glucosinolates content of the ECD compared to the HSD. However, even though a statistical difference was observed, it was a very slight. One could conclude that glucosinolates for the HSD data are able to predict glucosinolates ECD.

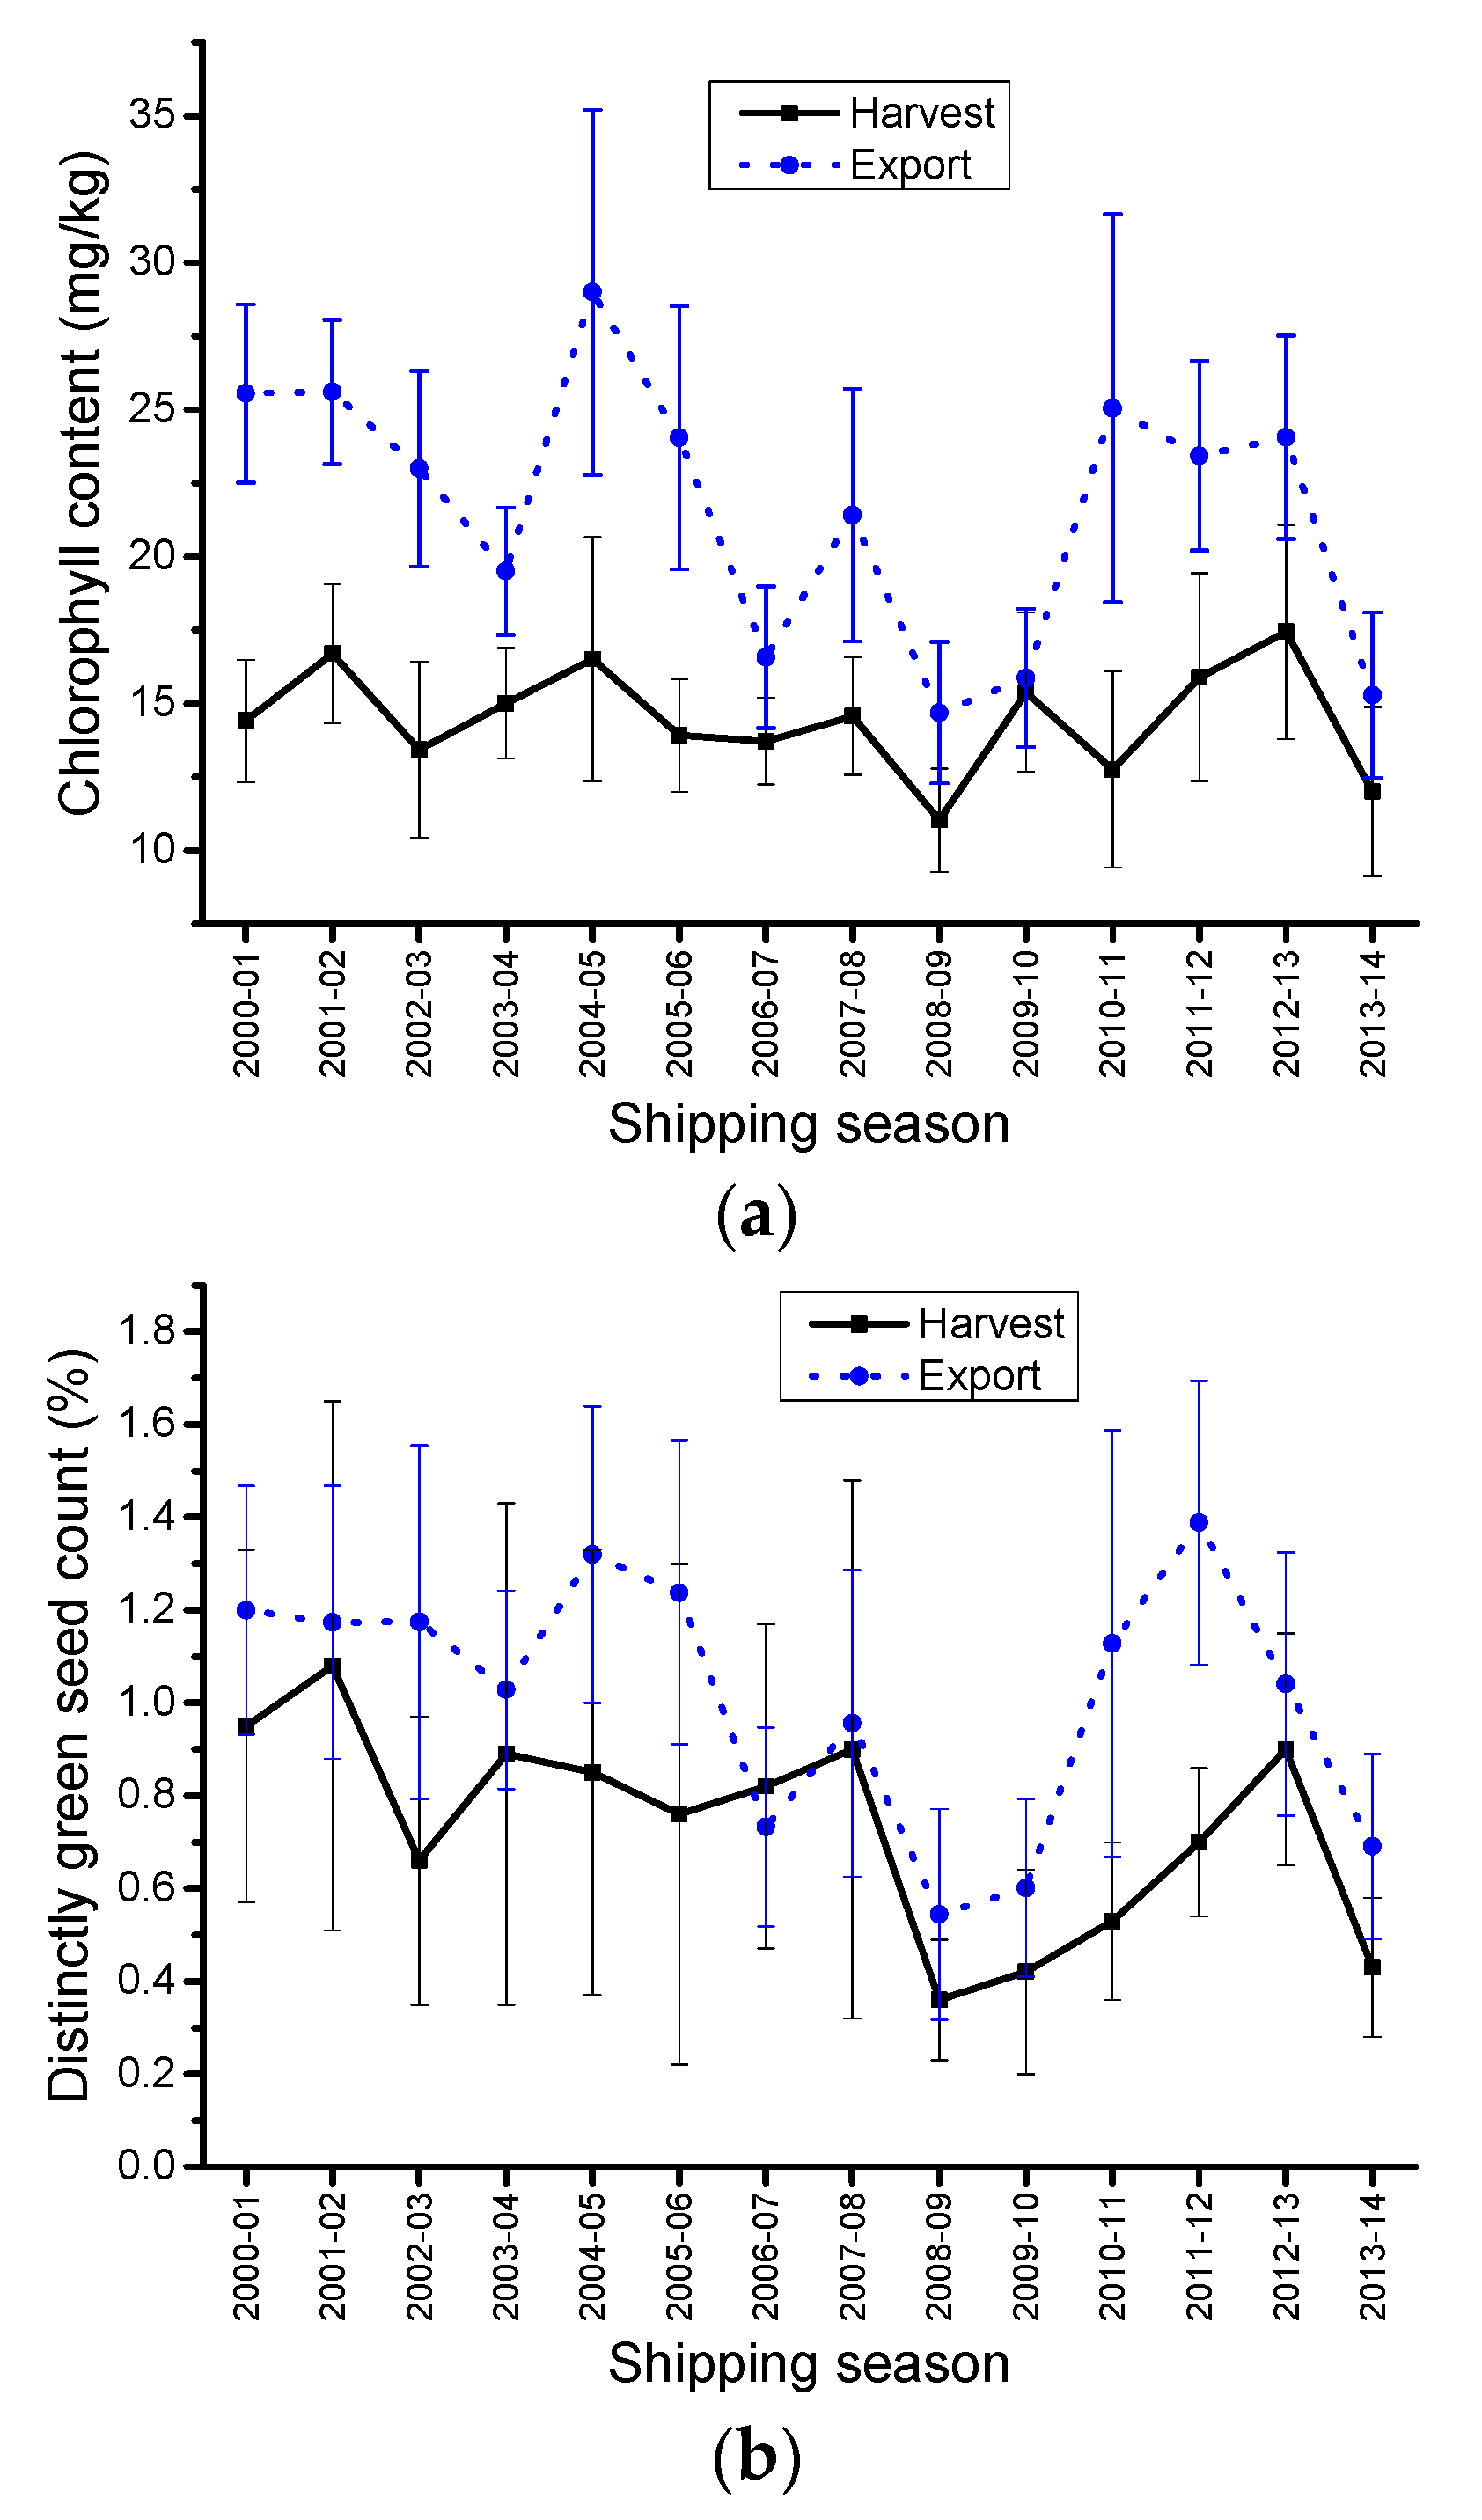
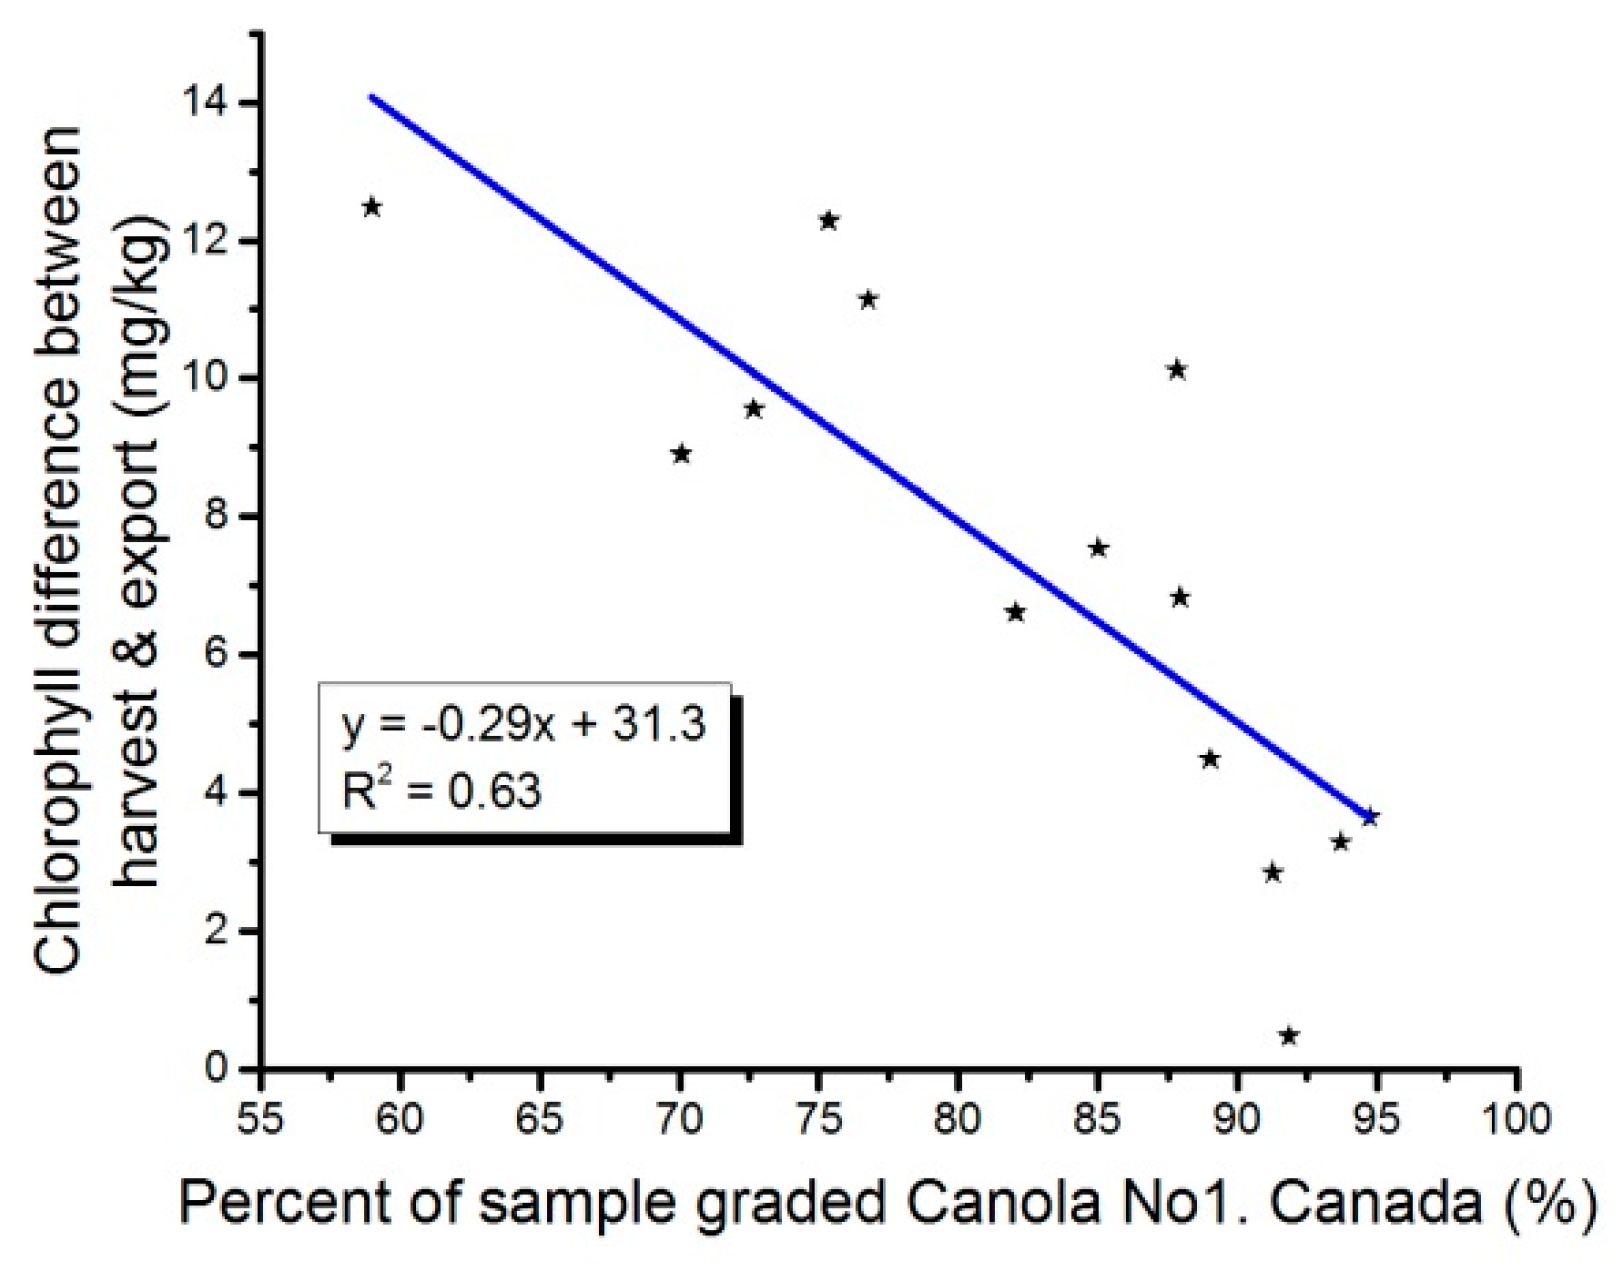
2.5. Chlorophyll Content

Large differences were observed for Chlorophyll content between HSD and ECD. On average the chlorophyll content for HSD was 7 mg/kg lower than ECD (Table 3, Figure 3a). The same 7 mg/kg difference was observed in a 2005 report [3]. The highest mean differences were observed between 2004 and 2005 ECD and its corresponding 2004 HSD (12.49 mg/kg) (Figure 3a). The lowest difference was observed between 2009 and 2010 ECD and its corresponding 2009 HSD (0.48 mg/kg) (Figure 3a). Unlike oil content, there was a very poor linear relationship between HSD and ECD chlorophyll contents (R2 = 0.35979), which suggests that factors other than the amount of dockage was responsible for the mean differences. Chlorophyll is directly affected by the environment, and important geographic differences are observed almost every year in Canada, leading to geographical differences in chlorophyll content of the samples. It has also been shown that dockage quality more than quantity was affecting the chlorophyll content for the exports [4].
In 2004, the Western Prairie region experienced a very short, cold summer, with early frost in mid-August. This led to large amounts of immature and frost damaged seeds in the harvested canola. The 2004 frost damaged canola seeds were green (showing very high levels of chlorophyll), shriveled/shrunken and smaller than normal canola seeds. During grading, these frost damaged seeds became part of the dockage in the exports, whereas they were eliminated from the harvest samples during the cleaning step. The frost damaged seeds which were very high in chlorophyll content led to a significant increase in chlorophyll for the 2004–2005 ECD when compared to the HSD chlorophyll content averages of clean samples graded Canola No.1, Canada.
Chlorophyll is not a grading factor. Distinctly Green seed (DGR) count is used for grading canola Green seed, and the tolerances are defined by the Official Grain Grading Guide [1]. Canola samples graded Canola, No.1 Canada contain a maximum of 2% DGR. There is a relationship between DGR counts and chlorophyll content. Overall, the more DGR present in a sample of canola, the higher the chlorophyll content will be. However, this is not a linear relationship [5,6]. DGR variations for HSD and ECD surveys are presented in Figure 3b. There is a statistically significant difference between ECD and HSD DGR (p = 0.0005). Most years, export samples show higher DGR than the harvest survey samples (Table 3). Figure 4 suggested that the amount of samples graded other than Canola No.1 Canada had an influence on the chlorophyll content differences between HSD and ECD; less Canola No.1. Canada samples resulted in a higher difference. This suggested a possible commingling of the other grades into the Canola No.1 Canada. As suggested by Daun and Symons [5], this was likely due to the green perception difference between individual grain inspectors and the sampling effect. They reported [5] that at 2% DGR using 1000 seeds for grading, the DGR could vary from 0.96% to 3.0%, 19 times out of 20. Over the 2000–2014 period, DGR has been the factor responsible of the downgrading of canola from Canola No. 1 Canada to Canola No. 2 Canada and Canola No. 3 Canada. This points out the difficulty in assessing DGR accurately; the result being the commingling of some of the lower grade canola into Canola No.1 Canada at the various step of the grain handling chain between the producers (harvest survey) and the terminal at the port (exports).

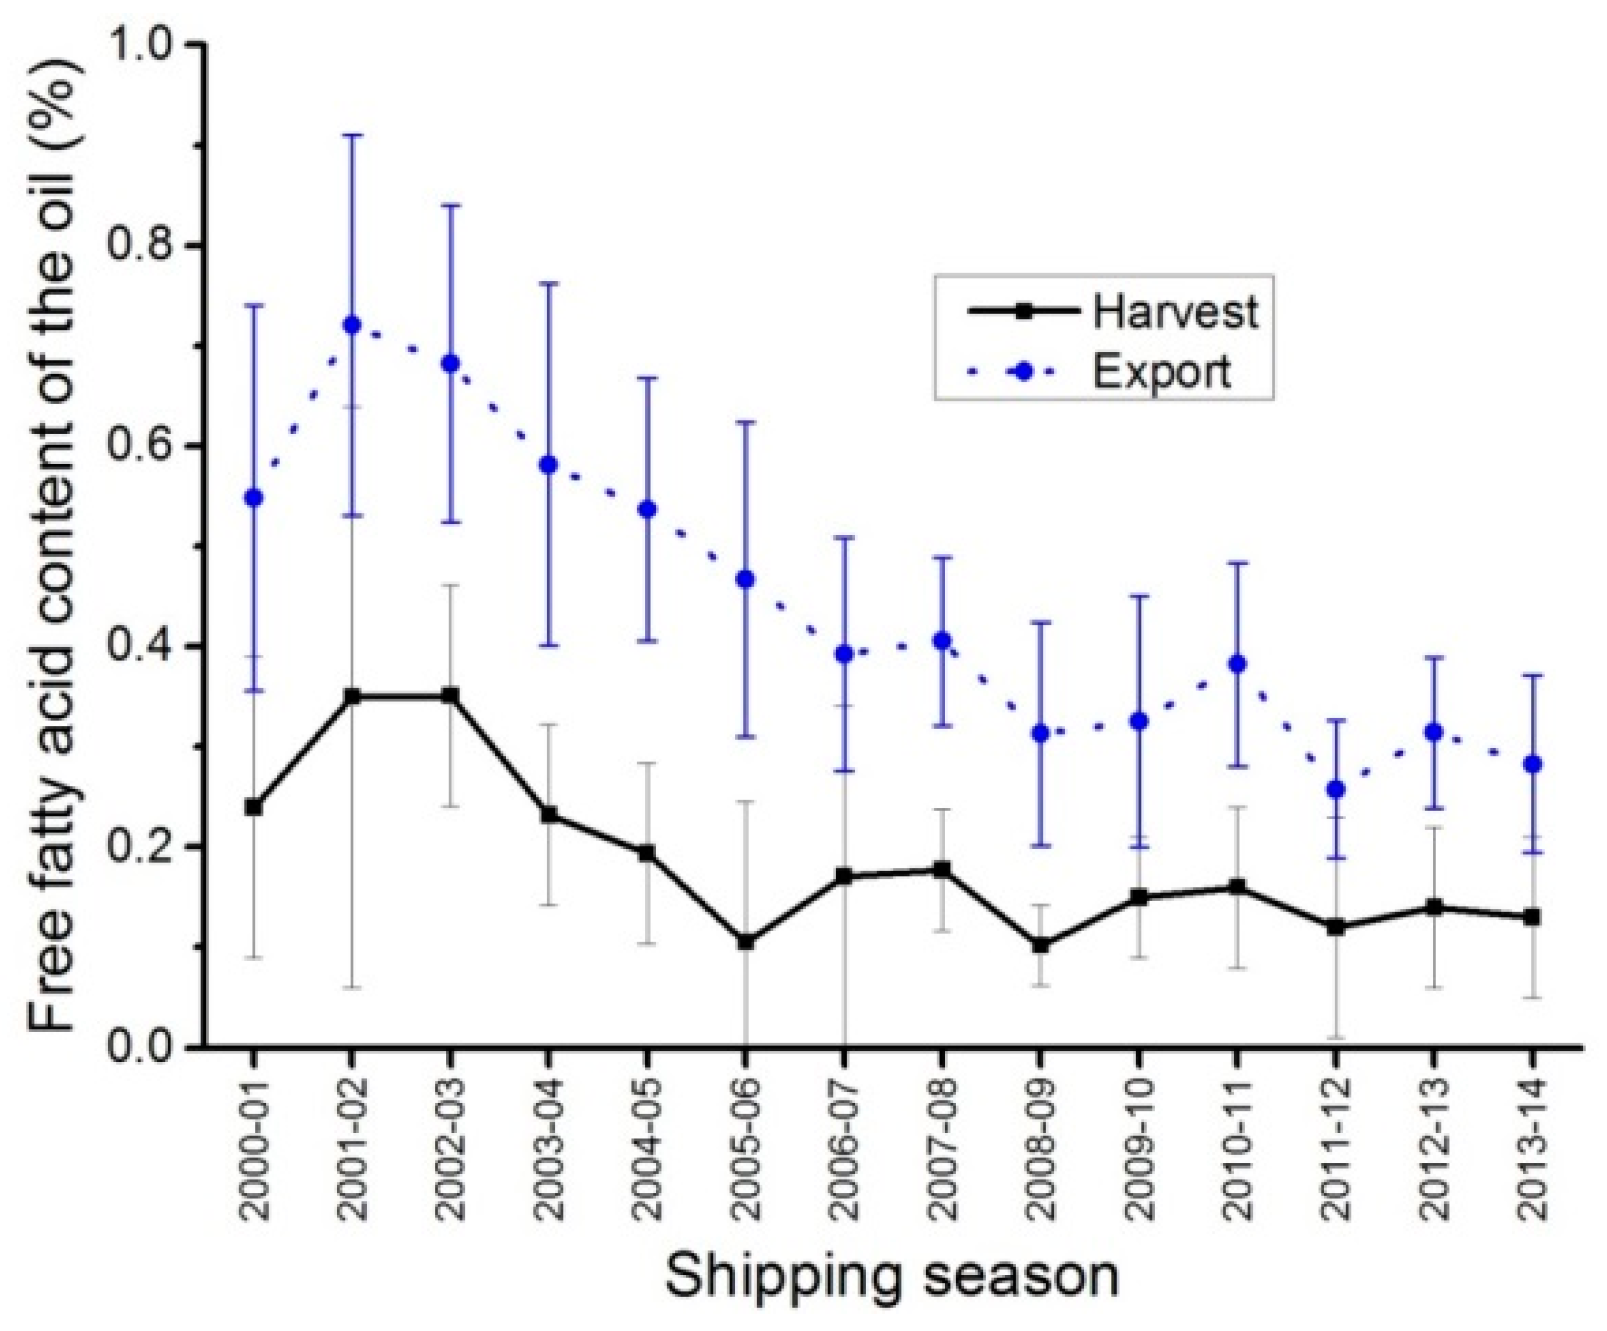
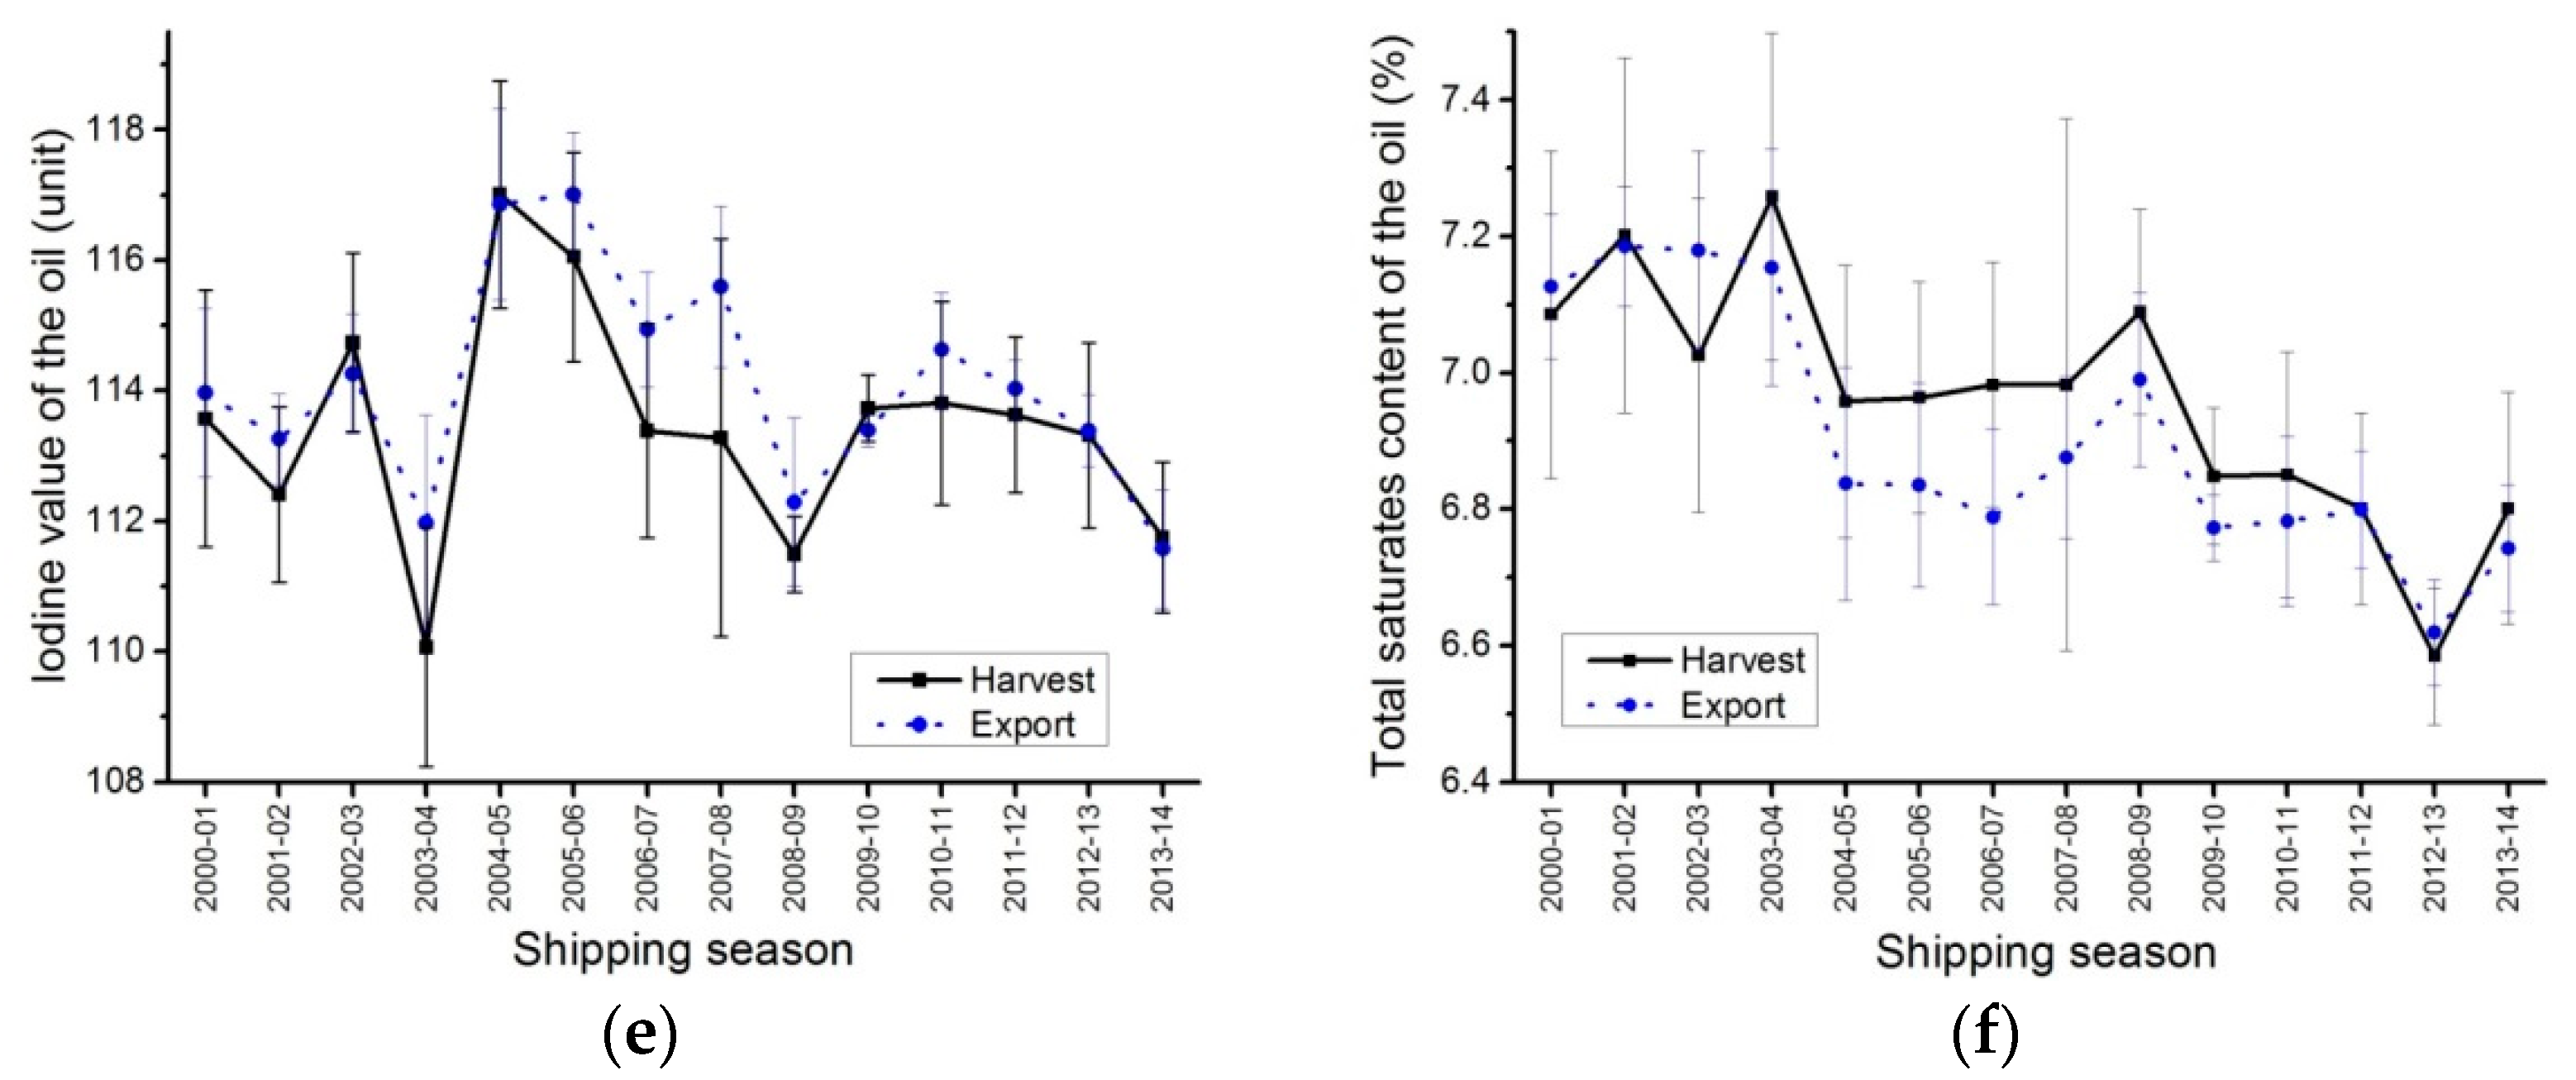
2.6. Free Fatty Acid Content of the Oil

Harvest free fatty acid averages were lower than export free fatty acid average by about 0.26% (Figure 5, Table 4). Small, shrunken/withered and broken seeds are part of dockage. These seeds are damaged leading to an increase of the free fatty acid of their oil due to break down or damage of the cellular structures. As a result, commercially clean exports with 2.5% dockage will have higher free fatty acid contents than clean samples. It has also been noted that free fatty acid content could increase during storage also leading to an increase of the export free fatty acid contents when compared to the harvest data.

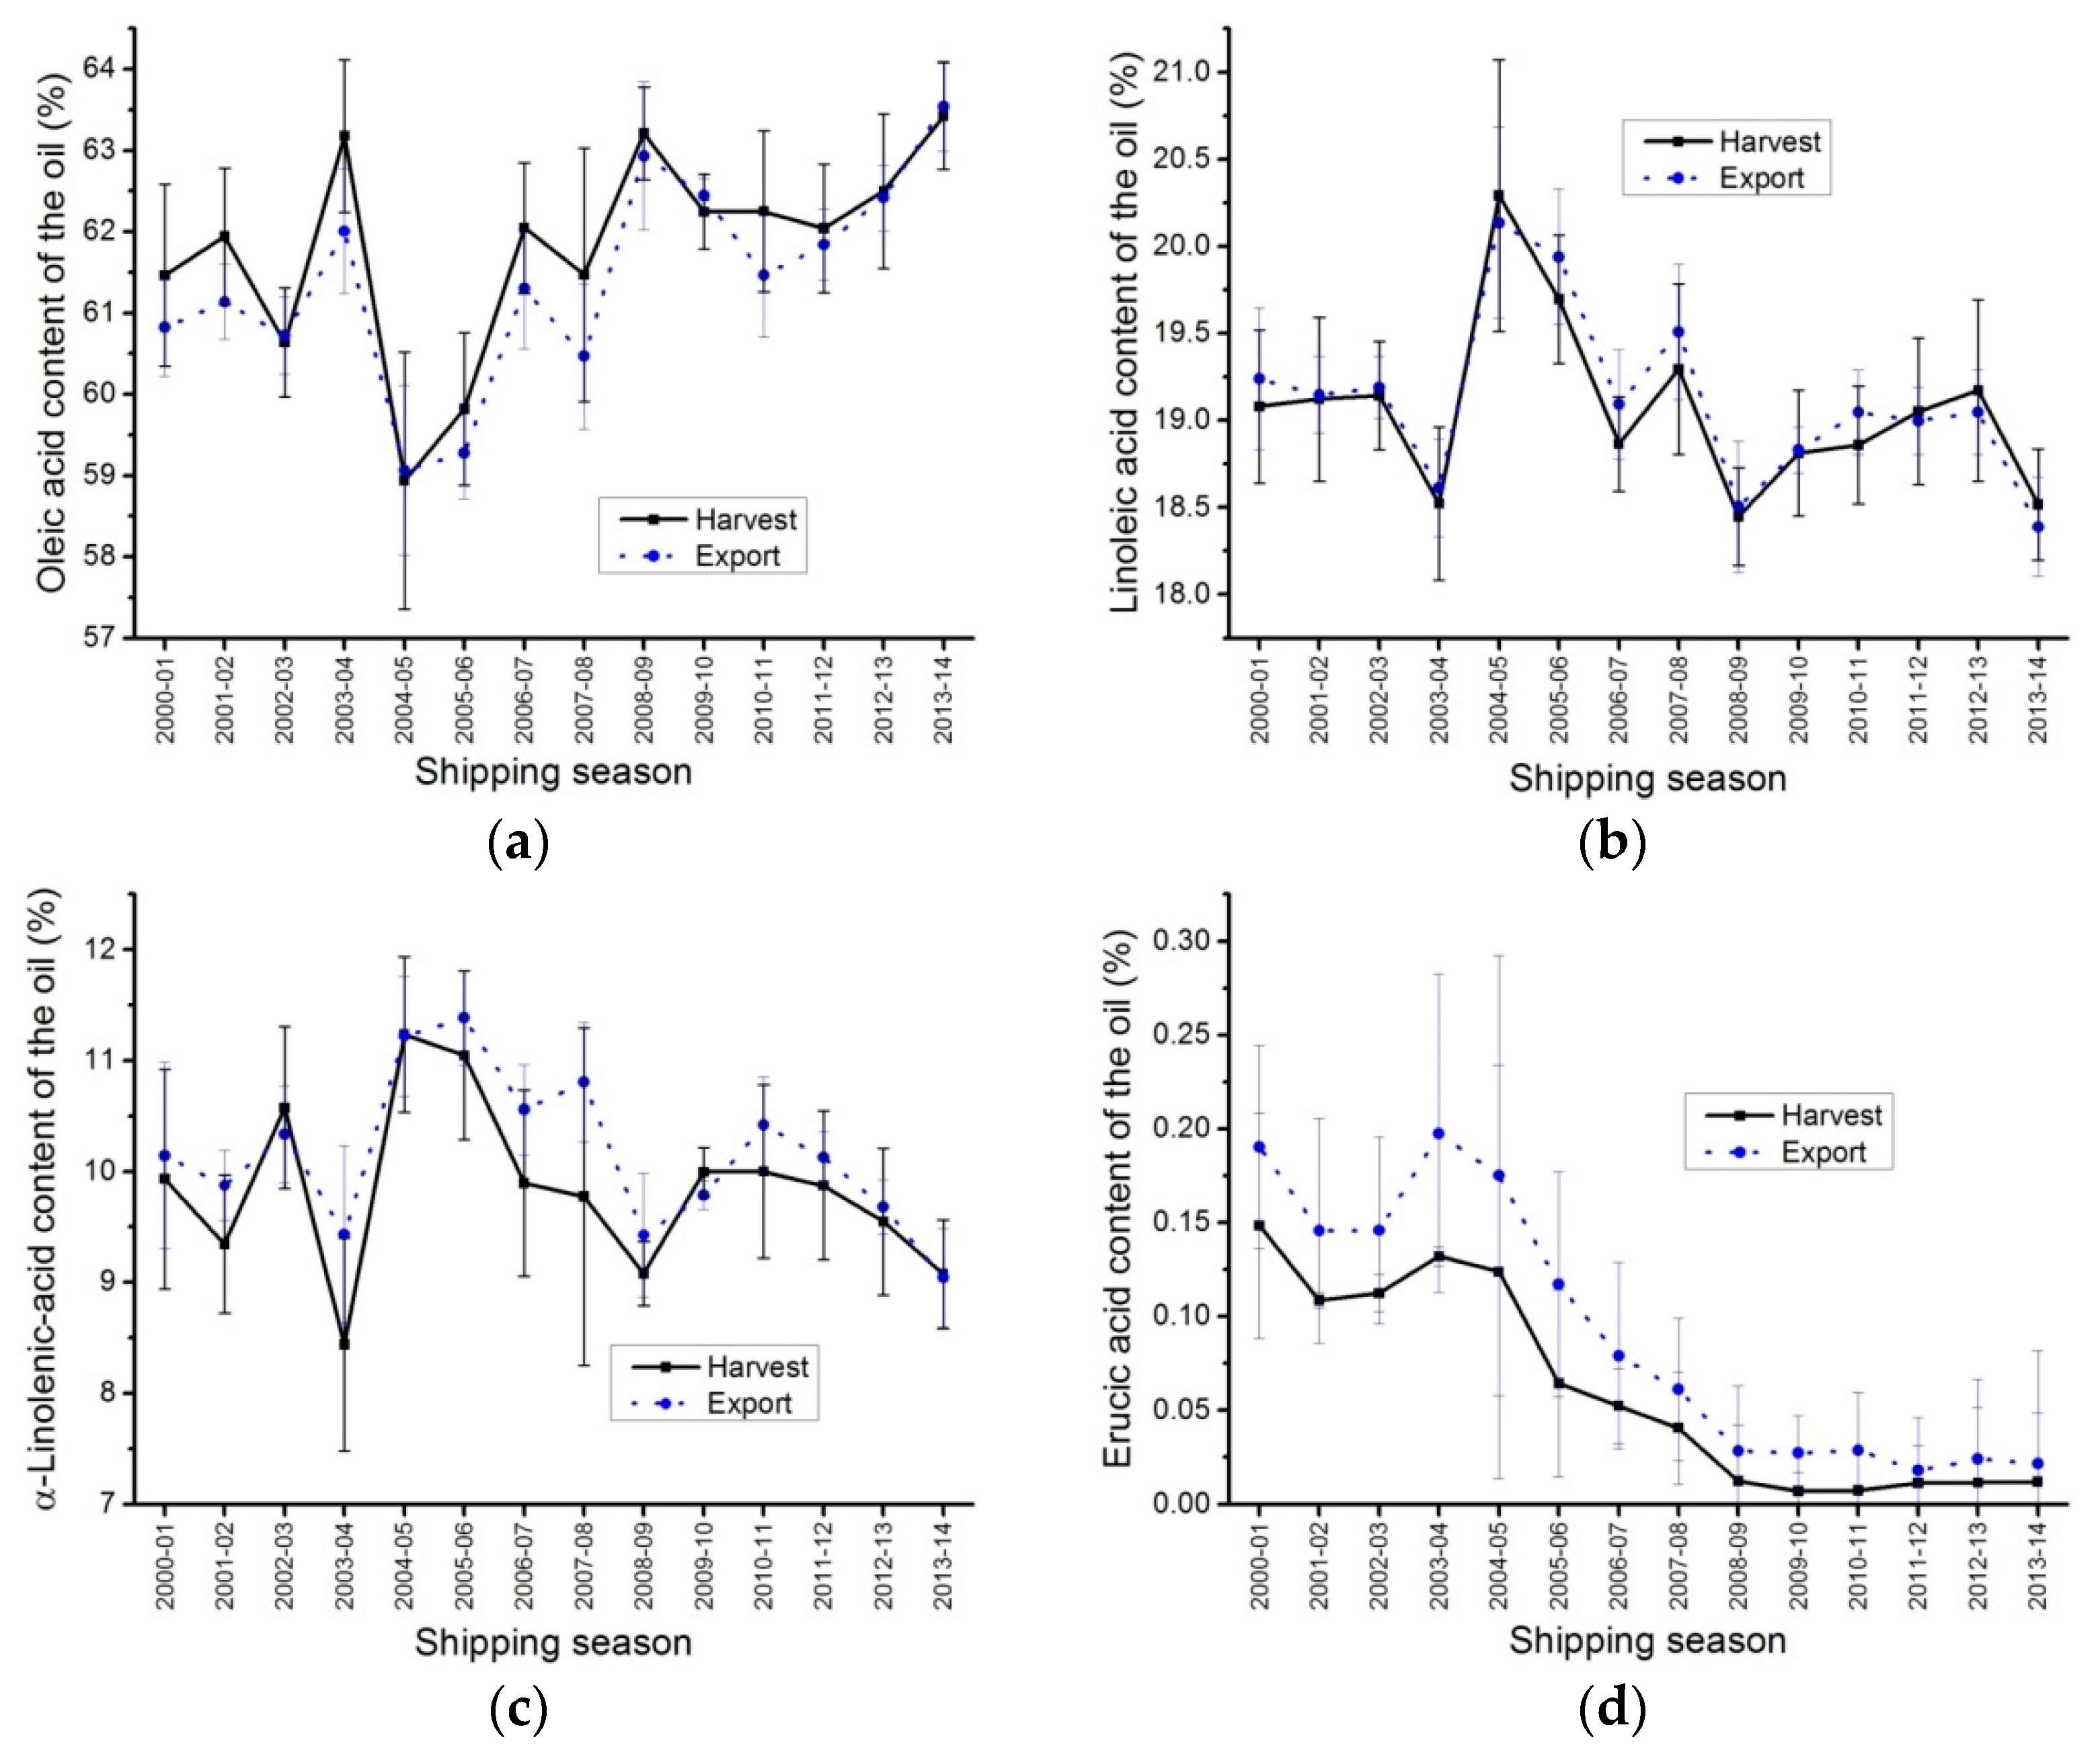
2.7. Fatty Acid Composition of the Oil

Oleic, linoleic, α-linolenic, erucic acid contents, total saturates and iodine value of the oil for export closely followed the harvest averages (Figure 6, Table 4 and Table 5). Statistical differences were observed between the harvest and export averages for oleic, α-linolenic and erucic acid, iodine value and total saturates (Table 4 and Table 5), however, the differences were small and had no practical effect.
Erucic acid contents have been very low since 2009; harvest and export erucic acid content averages of the oil have been well below 0.05%, with individual samples (harvest or export) showing an erucic acid range of 0.00% to 0.10% (Figure 6d and Table 5).
These data suggested that the fatty acid composition for the HSD data could be used to predict the ECD fatty acid composition.

3. Material and Methods

3.1. Harvest Data

The harvest data are from the Canadian Grain Commission’s annual harvest program. Quality data are from analyses of canola samples submitted to the Canadian Grain Commission throughout the harvest period by producers, grain companies and oilseed crushing companies. The data on quality for the reported years were based on the analyses of the number of samples received in the harvest survey and the number of samples graded Canola No. 1 Canada (NH1) (Table 1). Composites of Canola No. 1 Canada from the various crop districts for each province are made yearly to be analyzed by reference methods. The reported harvest data included only conventional canola samples (no specialty oil samples). Provincial and western Canadian averages were calculated from results for each crop district (Figure 7), weighted by a combination of production by crop district (Figure 1) using Statistics Canada production estimates [2], combined with an estimate of grade distribution per crop district using the Canadian Grain Commission data (Figure 7). Each sample submitted to the harvest sample program is officially graded by inspectors of the Industry Services Division of the Canadian Grain Commission using the Official Grain Grading Guide for canola and rapeseed [1]. Harvest samples are collected from 1 August to 1 December of the same calendar year. Harvest data from 2000 to 2014 were used in this report.

3.2. Export Data

Exports of commercially cleaned canola exports (from 1 August to 31 July of the following calendar year) were used in the report. Canola exports containing less than 2.5% dockage are considered commercially clean. The export quality average was calculated using each cargo quality data weighted with the cargo tonnage. Export data from 2000 to 31 July 2014 were used in this report.

3.3. Methods

Quality parameters used are oil, protein, chlorophyll, glucosinolates, free fatty acids and the fatty acid composition. Oil, protein and glucosinolates content values are presented using the Canadian Grain Commission’s historical 8.5% moisture basis. Protein content was determined using the AOCS Official method [7]; results are reported as a percentage using N × 6.25. Oil content, expressed as %, was determined by nuclear magnetic resonance (NMR) according to the International Organization for Standardization [8]. The NMR instrument was calibrated with oilseed samples analyzed with the ISO reference method [9]. Glucosinolate content was determined by NIR calibrated with the total glucosinolate method [10]. Chlorophyll content was determined spectrometricaly [11] and results were expressed as milligrams per kilogram (mg/kg), seed basis. Fatty acid composition was determined after base catalyzed derivatization [12] using a gas chromatograph equipped with a FID detector [13]. The results are presented as a relative fatty acid composition. Iodine value which is a measure of unsaturation was calculated from the fatty acid composition according to AOCS recommended practice [14]. The free fatty acid content of the oil was determined using Ke et al.’s method [15] and the results are expressed as a percentage by weight of oleic acid in the oil.

3.4. Statistic and Analysis

The harvest quality averages for the year (1 August to 1 December of the same calendar year) were compared with the export quality averages of the corresponding shipping season (1 August of the year of harvest to 31 July of the following calendar year). Analyses were done using Instat version 3.10 (GraphPad, San Diego, CA, USA). Paired t-tests with two tail p-value were used to compare the yearly averages. Origin version 9.1.0 (Origin Lab Corporation) was used to produce the graphs.

4. Conclusions

Canola harvest survey data can be extrapolated to predict the quality of the Canadian Canola exports. Some differences were constant, e.g., Canadian exports contained lower oil content when compared to the oil content of the Harvest Survey and the difference was mainly due to dockage, which remained constant over the years (1.7% to 1.9%). Chlorophyll was the least predictable of all the parameters; dockage quality, as well as commingling of the other grades in Canola No. 1 Canada affected the chlorophyll content of the exports and those effects are difficult to predict from one cargo to another or one year to another. Other parameters such as protein content and fatty acid composition were very similar for harvest and export averages. Free fatty acids also showed some differences, however, they are affected by storage and as such are difficult to predict.
The results of this study suggested that the canola data quality obtained by the CGC harvest survey program could be used to forecast the quality of the canola exported by shipments for the corresponding season. Canola harvest survey data are a reliable descriptor of the yearly quality of western Canadian canola and could be used as a tool to support the marketing of Canadian canola.

Acknowledgments

Thanks to the Oilseeds Staff, past and present, who perform accurately and reproducibly all the analyses. Thanks to the Canadian producers, grain handlers and processors for taking the time to collect samples and to participate in the harvest survey program.

Conflicts of Interest

The author declares no conflict of interest.

References

  1. Official Grain Grading Guide—Canola and Rapeseed, Chapter 10. Available online: http://www.grainscanada.gc.ca/oggg-gocg/10/oggg-gocg-10-eng.htm (accessed on 5 February 2016).
  2. Estimated Areas, Yield and Production of Principal Field Crops by Small Area Data Regions, in Metric and Imperial Units Annual. Available online: http://www5.statcan.gc.ca/cansim/a26?lang=eng&retrLang=eng&id=0010071&paSer=&pattern=&stByVal=1&p1=1&p2=31&tabMode=dataTable&csid (accessed on 12 February 2016).
  3. DeClercq, D.R.; Daun, J.K. Canadian Canola Quality Parameters: Comparison of Results from Harvest and Export Surveys. International Consultative Group for Research on Rapeseed. 2005. Available online: http://gcirc.org/fileadmin/documents/Bulletins/B22/Canadian_Canola_Quality_Parameters.pdf (accessed on 15 April 2016).
  4. Siemens, B.; Daun, J.K. Contribution of Dockage (Admixture) to the Chlorophyll Content of Canadian Canola exports. International Consultative Group for Research on Rapeseed. 2005. Available online: http://gcirc.org/fileadmin/user_upload/Contribution_of_Dockage.pdf (accessed on 15 April 2016).
  5. Daun, J.K.; Symons, S. How green is green? Sampling and perception in assessing green seeds and chlorophyll in Canola. J. Am. Oil Chemists’ Soc. 2000, 77, 1209–1214. [Google Scholar] [CrossRef]
  6. Daun, J.K. How green is green? Long term relationship between green seed and chlorophyll in Canola grading. J. Am. Oil Chemists’ Soc. 2003, 80, 119–122. [Google Scholar] [CrossRef]
  7. American Oil Chemists’ Society method number Ba 4e-93. Generic Combustion Method for Determination of Crude Protein, revised in 2011. Available online: http://methods.aocs.igx.rd.net/methods/search-results?method=111449&keywords= (accessed on 19 July 2016).
  8. International Organization for Standardization—ISO 10565:1998 Oilseeds—Simultaneous determination of oil and water contents—Method using pulsed nuclear magnetic resonance spectrometry. Available online: http://www.iso.org/iso/catalogue_detail.htm?csnumber=26317 (accessed on 19 July 2016).
  9. International Organization for Standardization—ISO 659:2009—Oilseeds—Determination of oil content (Reference method). Available online: http://www.iso.org/iso/iso_catalogue/catalogue_tc/catalogue_detail.htm?csnumber=43169 (accessed on 19 July 2016).
  10. International Organization for Standardization—ISO 9167–3—Oilseeds—Rapeseed—Determination of glucosinolates content—Part 3: Spectrophotometric method using glucose release. Removed from the ISOTC34SC2, the standard will be change to a technical document and will have a new number. Available online: http://www.iso.org/iso/home/store/catalogue_tc/catalogue_tc_browse.htm?commid=47870 (accessed on 19 July 2016).
  11. International Organization for Standardization—ISO 10519:1997—Rapeseed—Determination of chlorophyll content—Spectrometric method. Available online: http://www.iso.org/iso/iso_catalogue/catalogue_tc/catalogue_detail.htm?csnumber=22763 (accessed on 19 July 2016).
  12. International Organization for Standardization—ISO 12966–2:2011. Animal and vegetable fats and oils—Gas chromatography of fatty acid methyl esters—Part 2: Preparation of methyl esters of fatty acids. Available online: http://www.iso.org/iso/home/store/catalogue_tc/catalogue_detail.htm?csnumber=43172 (accessed on 19 July 2016).
  13. International Organization for Standardization—ISO 12966–1:2014 Animal and vegetable fats and oils —Gas chromatography of fatty acid methyl esters—Part 1: Guidelines on modern gas chromatography of fatty acid methyl esters. Available online: http://www.iso.org/iso/catalogue_detail.htm?csnumber=52294 (accessed on 19 July 2016).
  14. American Oil Chemists’ Society method number Cd 1c-85. Calculated Iodine Value, reapproved in 2009. Available online: http://search.aocs.org/methods/search_methods_results.cfm (accessed on 19 July 2016).
  15. Ke, P.J.; Woyewoda, A.D. A titrimetric method for determination of free fatty acids in tissues and lipids with ternary solvents and m-cresol purple indicator. Anal. Chim. Acta 1978, 99, 387–391. [Google Scholar] [CrossRef]
Figure 1. Scheme of the western provinces (Manitoba, Saskatchewan and Alberta) showing each crop district present in the 2013 production survey and the number of samples received for the harvest survey in 2014 for each crop district.
Plants 05 00030 g001
Figure 2. Canola oil, protein and total glucosinolate content averages (at 8.5% moisture basis), harvest (HSD) and export (ECD) samples of Canada No.1, Canola from 1 August 2000 to 31 July 2014. (a) Canola oil content averages (%); (b) Canola protein content averages (%); (c) Total glucosinolate content averages (µmol/g).
Plants 05 00030 g002
Figure 3. Chlorophyll content and green seed count averages, harvest (HSD) and export (ECD) samples of Canada No.1, Canola from 1 August 2000 to 31 July 2014. (a) Canola chlorophyll content averages; (b) Green seed count averages.
Plants 05 00030 g003
Figure 4. Difference between harvest and export chlorophyll averages versus the percent of harvest samples graded Canada No. 1, Canola.
Plants 05 00030 g004
Figure 5. Free fatty acid content of the oil averages, harvest and export samples of Canada No. 1, Canola from 1 August 2000 to 31 July 2014.
Plants 05 00030 g005
Figure 6. Oil quality, oleic acid, linoleic acid, α-linolenic acid, erucic acid, iodine value and total saturate content averages, harvest (HSD) and export (ECD) samples of Canada No. 1, Canola from 1 August 2000 to 31 July 2014. (a) oleic acid content averages (%); (b) linoleic acid content averages (%); (c) α-Linolenic acid content averages (%); (d) erucic acid content averages (%); (e) iodine value (units) averages; (f) total saturates content averages (%).
Plants 05 00030 g006aPlants 05 00030 g006b
Figure 7. Scheme of the western provinces (Manitoba, Saskatchewan and Alberta) with the crop district divisions used in the Canadian Grain Commission harvest survey.
Plants 05 00030 g007
Table 1. Summary table—Canadian canola production, number of samples received in the harvest survey with the percent of samples graded Canada No. 1 Canola, number of export cargoes analyzed by the monitoring program and the tonnage they represent (average, minimum and maximum), and percent dockage average of the export cargoes from 1 August 2000 to 31 July 2014.
Year of HarvestShipping SeasonCanada Production (Tonnes) *Number of Samples in Harvest Survey (NH)Percent of Canola, No.1 Canada (NH1)Number of Cargoes (NE)Total Export (Tonnes)Export Average (Tonnes)Minimum Export Tonnage (Tonnes)Maximum Export Tonnage (Tonnes)Dockage (%)
20002000–017,205,300138676.771484,180,55428,246.9949857,7501.97 ± 0.21
20012001–025,017,100134370.07972,244,76923,141.9384852,3761.96 ± 0.30
20022002–034,520,500126672.67831,683,82820.287.08420051,5691.90 ± 0.27
20032003–046,771,200220389.011142,695,24323,642.48210056,5001.88 ± 0.21
20042004–057,673,600194358.981002,240,21622,402.16348955,0021.80 ± 0.25
20052005–069,483,300218687.831584,270,43027,028.04200060,5001.69 ± 0.38
20062006–079,000,300248591.271493,880,91626,046.42329060,5001.86 ± 0.27
20072007–089,611,300211487.941513,609,32623,902.82201765,2531.94 ± 0.20
20082008–0912,644,900176794.741966,351,66932,406.47383365,8791.77 ± 0.29
20092009–1012,898,100136291.851835,678,67831,031.03324965,5561.91 ± 0.35
20102010–1112,788,600178575.351695,161,05330,538.78190063,2251.88 ± 0.28
20112011–1214,608,100174985.021936,465,59233,500.48342769,5501.89 ± 0.27
20122012–1313,868,500208982.051685,080,79830,242.85123663,8001.99 ± 0.27
20132013–1417,965,800158893.701927,190,04837,448.17525066,0001.92 ± 0.40
* Data published by Statistics Canada.
Table 2. Crop district summary table—Canola production per crop district (average, minimum and maximum) and number of samples received by the annual harvest survey program (average, minimum and maximum) from 1 August 2000 to 31 July 2014.
Production (Tonnes)Number of Samples in Harvest Survey
Census Ag RegionCanola Crop DistrictMeanMin.Max.MeanMin.Max.
Manitoba
11206,77972,478376,485461174
22193,470119,699321,300542186
33231,997136,492450,600573685
4495,74351,346212,900352352
55156,52994,986202,250271740
66137,76687,162228,942382154
77257,834100,567436,80061995
88360,678192,968560,4069549139
9 + 109 + 1092,84215,313145,012381462
111165,39819,136102,25716631
121255,40323,37486,50010317
Manitoba1,854,4431,122,6002,871,200476332662
Saskatchewan
11 + 121389,742120,331902,8007220111
21 + 222295,09985,754878,400714194
31 + 32 + 33 + 343204,58655,722658,700451780
41 + 42434,2094064114,5009315
51 + 525911,496495,2141,696,200172129231
61 + 626729,810221,8671,316,60014194203
71 + 727376,40438,217918,6007922115
81 + 828752,037209,0921,390,13012775184
91 + 929723,52681,0821,245,80011945158
Saskatchewan4,414,9001,769,0008,917,6008355711085
Alberta + British Columbia
10185,00217,189218,13412419
202540,415116,8141,154,9938137117
303 + 1 *229,43037,760546,300441267
404A + 4B938,368133,0011,717,60019362262
505492,696164,888771,400623297
606342,346148,350590,500332146
707 + 8 **694,917452,8491,188,6009150130
AB + BC3,470,6001,242,8006,087,500517274677
Canada9,739,9434,463,30017,876,300182713002337
* Samples from crop district #1 from British Columbia were combined with samples from Alberta crop district #3; ** Samples from crop district #8 from British Columbia were combined with samples from Alberta Crop district #7.
Table 3. Yearly mean average and standard deviation for harvest (HSD) and exports (ECD) samples of Canada No. 1, Canola for green seed count, oil, protein and chlorophyll content.
Distinctly Green Seeds (%)Oil Content (%, 8.5% m.b.)Protein Content (%, 8.5% m.b.)Chlorophyll Content (mg/kg)
HarvestExportHarvestExportHarvestExportHarvestExport
Average0.731.0243.7643.1221.1321.0414.4821.64
Standard deviation0.220.270.990.981.181.041.844.52
Minimum0.360.5441.8241.3019.6219.6111.0314.68
Maximum1.081.3945.2444.4123.2723.2017.4328.99
Median
Paired t-test—Two tail p value—Results
Mean difference−0.285400.640000.09286−7.16300
p value0.00050.000100.23670<0.0001
t4.3227.6741.2407.078
Table 4. Yearly mean average and standard deviation for harvest (HSD) and exports (ECD) samples of Canada No. 1, Canola for free fatty acid, total glucosinolates, and total saturates contents.
Total Glucosinolates Content of the Seeds (µmol/g)Free Fatty Acid Content of the Oil (%)Iodine Value of the Oil (Units)Total Saturates Content of the Oil (%)
HarvestExportsHarvestExportHarvestExportHarvestExports
Average10.1812.310.190.44113.45114.086.966.91
Standard deviation0.931.010.080.151.771.650.180.19
Minimum8.5310.270.100.26110.07111.576.586.62
Maximum12..3513.70.350.72117.01117.017.267.18
Median10.0312.40.160.40113.48114.006.976.84
Paired t-test—Two tail p value Results
Mean difference−2.13−0.2564−0.63710.05286
p value<0.0001<0.00010.01500.0410
t8.55111.3362.8022.268
Table 5. Yearly mean average and standard deviation for harvest (HSD) and exports (ECD) of samples of Canada No. 1, Canola for oleic, linoleic, α-linolenic and erucic acid contents of the oil.
Oleic Acid Content of the Oil (C18:1, %)Linoleic Acid Content of the Oil (C18:2, %)α-Linolenic Acid Content of the Oil (C18:3, %)Erucic Acid Content of the Oil (C22:1, %)
HarvestExportHarvestExportHarvestExportHarvestExport
Average61.8061.3919.0619.129.8410.160.060.09
Standard deviation1.281.280.490.490.760.680.050.07
Minimum58.9459.0718.4518.398.449.040.010.02
Maximum63.4363.5420.2920.1411.2411.380.150.20
Median62.0461.3819.0719.079.8810.140.040.07
Paired t-test—Two tail p value—Results
Mean difference0.4093−0.05857−0.3157−0.03214
p value0.00540.13000.0104<0.0001
t3.3341.6162.9935.993

