Article

Bulked Segregant Analysis Revealed the Common Resistant QTLs Associated with Fusarium Ear Rot and Gibberella Ear Rot in Maize

1
Institute of plant protection, Sichuan Academy of Agricultural Sciences, Chengdu 610066, China
2
Key Laboratory of Integrated Crop Pest Management in Southwest China, Ministry of Agriculture, Chengdu 610066, China
*
Authors to whom correspondence should be addressed.
Plants 2026, 15(9), 1401; https://doi.org/10.3390/plants15091401
Submission received: 4 February 2026 / Revised: 17 April 2026 / Accepted: 29 April 2026 / Published: 4 May 2026
(This article belongs to the Special Issue Identification of Resistance of Maize Germplasm Resources to Disease)

Abstract

Maize ear rot, primarily caused by Fusarium verticillioides (Fusarium ear rot, FER) and Fusarium graminearum (Gibberella ear rot, GER), is a devastating disease that causes significant yield losses and mycotoxin contamination. Breeding resistant varieties is the most effective control strategy, but this requires the identification of stable genetic loci for resistance. In this study, we employed bulked segregant analysis (BSA) on two F2 mapping populations to identify quantitative trait loci (QTLs) conferring resistance to FER and GER. We identified five and eleven QTLs for FER and GER, respectively. Notably, chromosome 4 was identified as a major hotspot for resistance to both diseases, and there was a co-localization of the FER QTL (qFER4.05) and GER QTL (qGER4.05-1) within a 58.58–71.34 Mb interval on bin 4.05, suggesting a potential locus for broad-spectrum resistance. Within this overlapping region, we identified 18 high-confidence candidate genes, including genes encoding leucine-rich repeat receptor-like kinases (LRR-RLKs), remorin, cytochrome P450 monooxygenases, and wall-associated receptor kinase-like (WAKL) protein, all with established roles in plant defense. These findings advance the understanding of the genetic architecture of ear rot resistance and provide critical resources for marker-assisted breeding to develop maize hybrids with durable resistance to both FER and GER.

1. Introduction

Maize ear rot, one of the most devastating diseases in global maize production, not only reduces the yield and quality of harvested maize but also is fatal to humans and animals that consume the contaminated grain, which contains mycotoxins from the pathogen Fusarium spp. [1,2]. Fusarium verticillioides and Fusarium graminearum are the two most important pathogens that can cause Fusarium ear rot (FER) and Gibberella ear rot (GER), respectively [3,4]. Fusarium spp. can survive in plant residue, healthy seeds, and soil, and exhibits a high level of genetic diversity, which allows them to easily adapt to a variety of environmental changes and fungicides, resulting in chemical and agronomic measures usually being ineffective [2,5,6]. The best strategy to prevent and control maize ear rot is breeding and promoting resistant varieties, which requires us to understand the genetics of resistance clearly and identify the alleles that can significantly reduce damage caused by F. verticillioides and F. graminearum [7,8]. Molecular marker-assisted selection and polyresistant polymerization, which depend on functional genes and stable quantitative trait loci (QTLs), are effective ways to improve the efficiency of breeding [9]. It is very important to identify novel resistance genes and QTLs against the two pathogens in order to develop a sustainable solution to FER and GER problems in maize production.
Resistance to ear rot in maize is a complex trait that is controlled by many genes with minor effects, and it is strongly influenced by environmental conditions [10,11,12,13]. As of yet, numerous studies have attempted to identify stable inheritance of resistance loci for FER and GER.
For FER resistance, there have been relatively more research efforts focused on the detection of stable QTLs and the identification of resistance genes compared to GER resistance. Several studies have identified QTL associated with FER using cross-populations, such as F2, F2:3, and RILs. Chen et al. discovered a stable and significant resistance effect QTL (bin 4.05/4.06) for FER resistance affecting approximately 17.95% of the phenotypic variation using 210 F2:3 families, and accounting for up to 35.2% of the phenotypic effect in near-isogenic lines (NILs) when in homozygosity [14]. Maschietto et al. detected three significant resistance QTLs (bin 6.01, bin 7.02, and bin 9.05) for FER resistance using 188 F2:3 families, explaining 15.45–19.47% of phenotypic variation [15]. In two additional studies based on RIL populations, Ding et al. detected two stable QTLs (bin3.04) across multiple environments by using 187 RILs, explaining 13–22% of the phenotypic variation [16], and Li et al. detected a resistance QTL (bin 4.06) with 10.2% of the phenotypic variation by using 250 RILs [17]. Certainly, many other studies on FER resistance use linkage mapping, a widely applied method that produces fewer false-positive results and offsets the low allelic diversity in progeny populations [18,19,20]. In addition, work on GWAS for FER has been performed by many other studies, such as [21,22,23,24,25] and others. However, no genes have been isolated by map-based cloning to date, and few stable QTLs have been verified for molecular breeding.
For GER resistance, some progress has been made in the detection of stable QTLs and the identification of resistance genes [26]. Three QTLs for resistance to GER were detected in different environments by using 144 recombinant inbred lines (RILs) [10]. Another study identified one QTL associated with GER in multiple environments by using 410 RILs [27]. Moreover, the important loci of qRger7.1 and qRger7.2 have been identified, which conferred resistance to GER by using two F2 populations [28]. Five stable QTLs were detected by 204 RILs, and the largest effect QTL (qGER4.09) has been validated using 588 F2 individuals [29]. Recently, two environment-specific resistant QTLs (qGER3.2 and qGER3.4), which had a PVE greater than 10%, were detected using 246 double-haploid inbred lines [30]. Moreover, work on GWAS for GER has been performed by many other studies. Eight QTLs were detected, jointly explaining 34% of the genetic variance by using 500 double-haploid lines derived from two European maize landraces [31]. Ten significantly associated SNPs linked to GER resistance, with the greatest phenotypic variation explained (PVE) value at 9.07%, were detected by a genome-wide association study using 316 diverse inbred lines [32]. Additionally, sixty-nine quantitative trait nucleotides conferring resistance to GER were detected using 344 inbred lines [33]. Although several QTLs or SNPs for resistance to GER have been detected using different populations, few underlying genes have been identified because of the different populations and environments.
Despite extensive research on FER and GER resistance, several critical gaps remain unresolved. First, most previous studies have investigated FER and GER resistance independently, using different populations and experimental conditions, making direct comparison of their genetic architectures difficult. Second, the identification of common genetic loci conferring resistance to both diseases has been limited. Third, the resolution of QTL intervals from bulked segregant analysis (BSA) studies has often been insufficient for precise candidate gene identification. These limitations hinder the development of broad-spectrum resistance breeding strategies.
This study employed BSA to identify QTLs conferring resistance to both FER and GER in maize. Two F2 populations, derived from resistant × susceptible crosses, were phenotyped under the same environmental conditions. We hypothesize that simultaneous analysis of FER and GER under comparable environmental conditions will reveal shared genetic architecture, and the identification of co-localized QTLs on chromosome 4 will provide targets for developing maize varieties with durable, broad-spectrum resistance to both ear rot diseases. We present the first simultaneous BSA mapping study of FER and GER resistance under comparable conditions, enabling direct comparison of their genetic architectures, and identified chromosome 4 as a major hotspot for both diseases and discovered co-localized QTLs (qFER4.05 and qGER4.05-1) within a 58.58–71.34 Mb interval, suggesting potential broad-spectrum resistance loci. We further provided detailed candidate gene analysis within the overlapping region, prioritizing genes directly involved in plant immunity and discussing the potential of these loci for application in marker-assisted breeding to enhance FER and GER resistance.

2. Results

2.1. Phenotype of the FER and GER Resistance

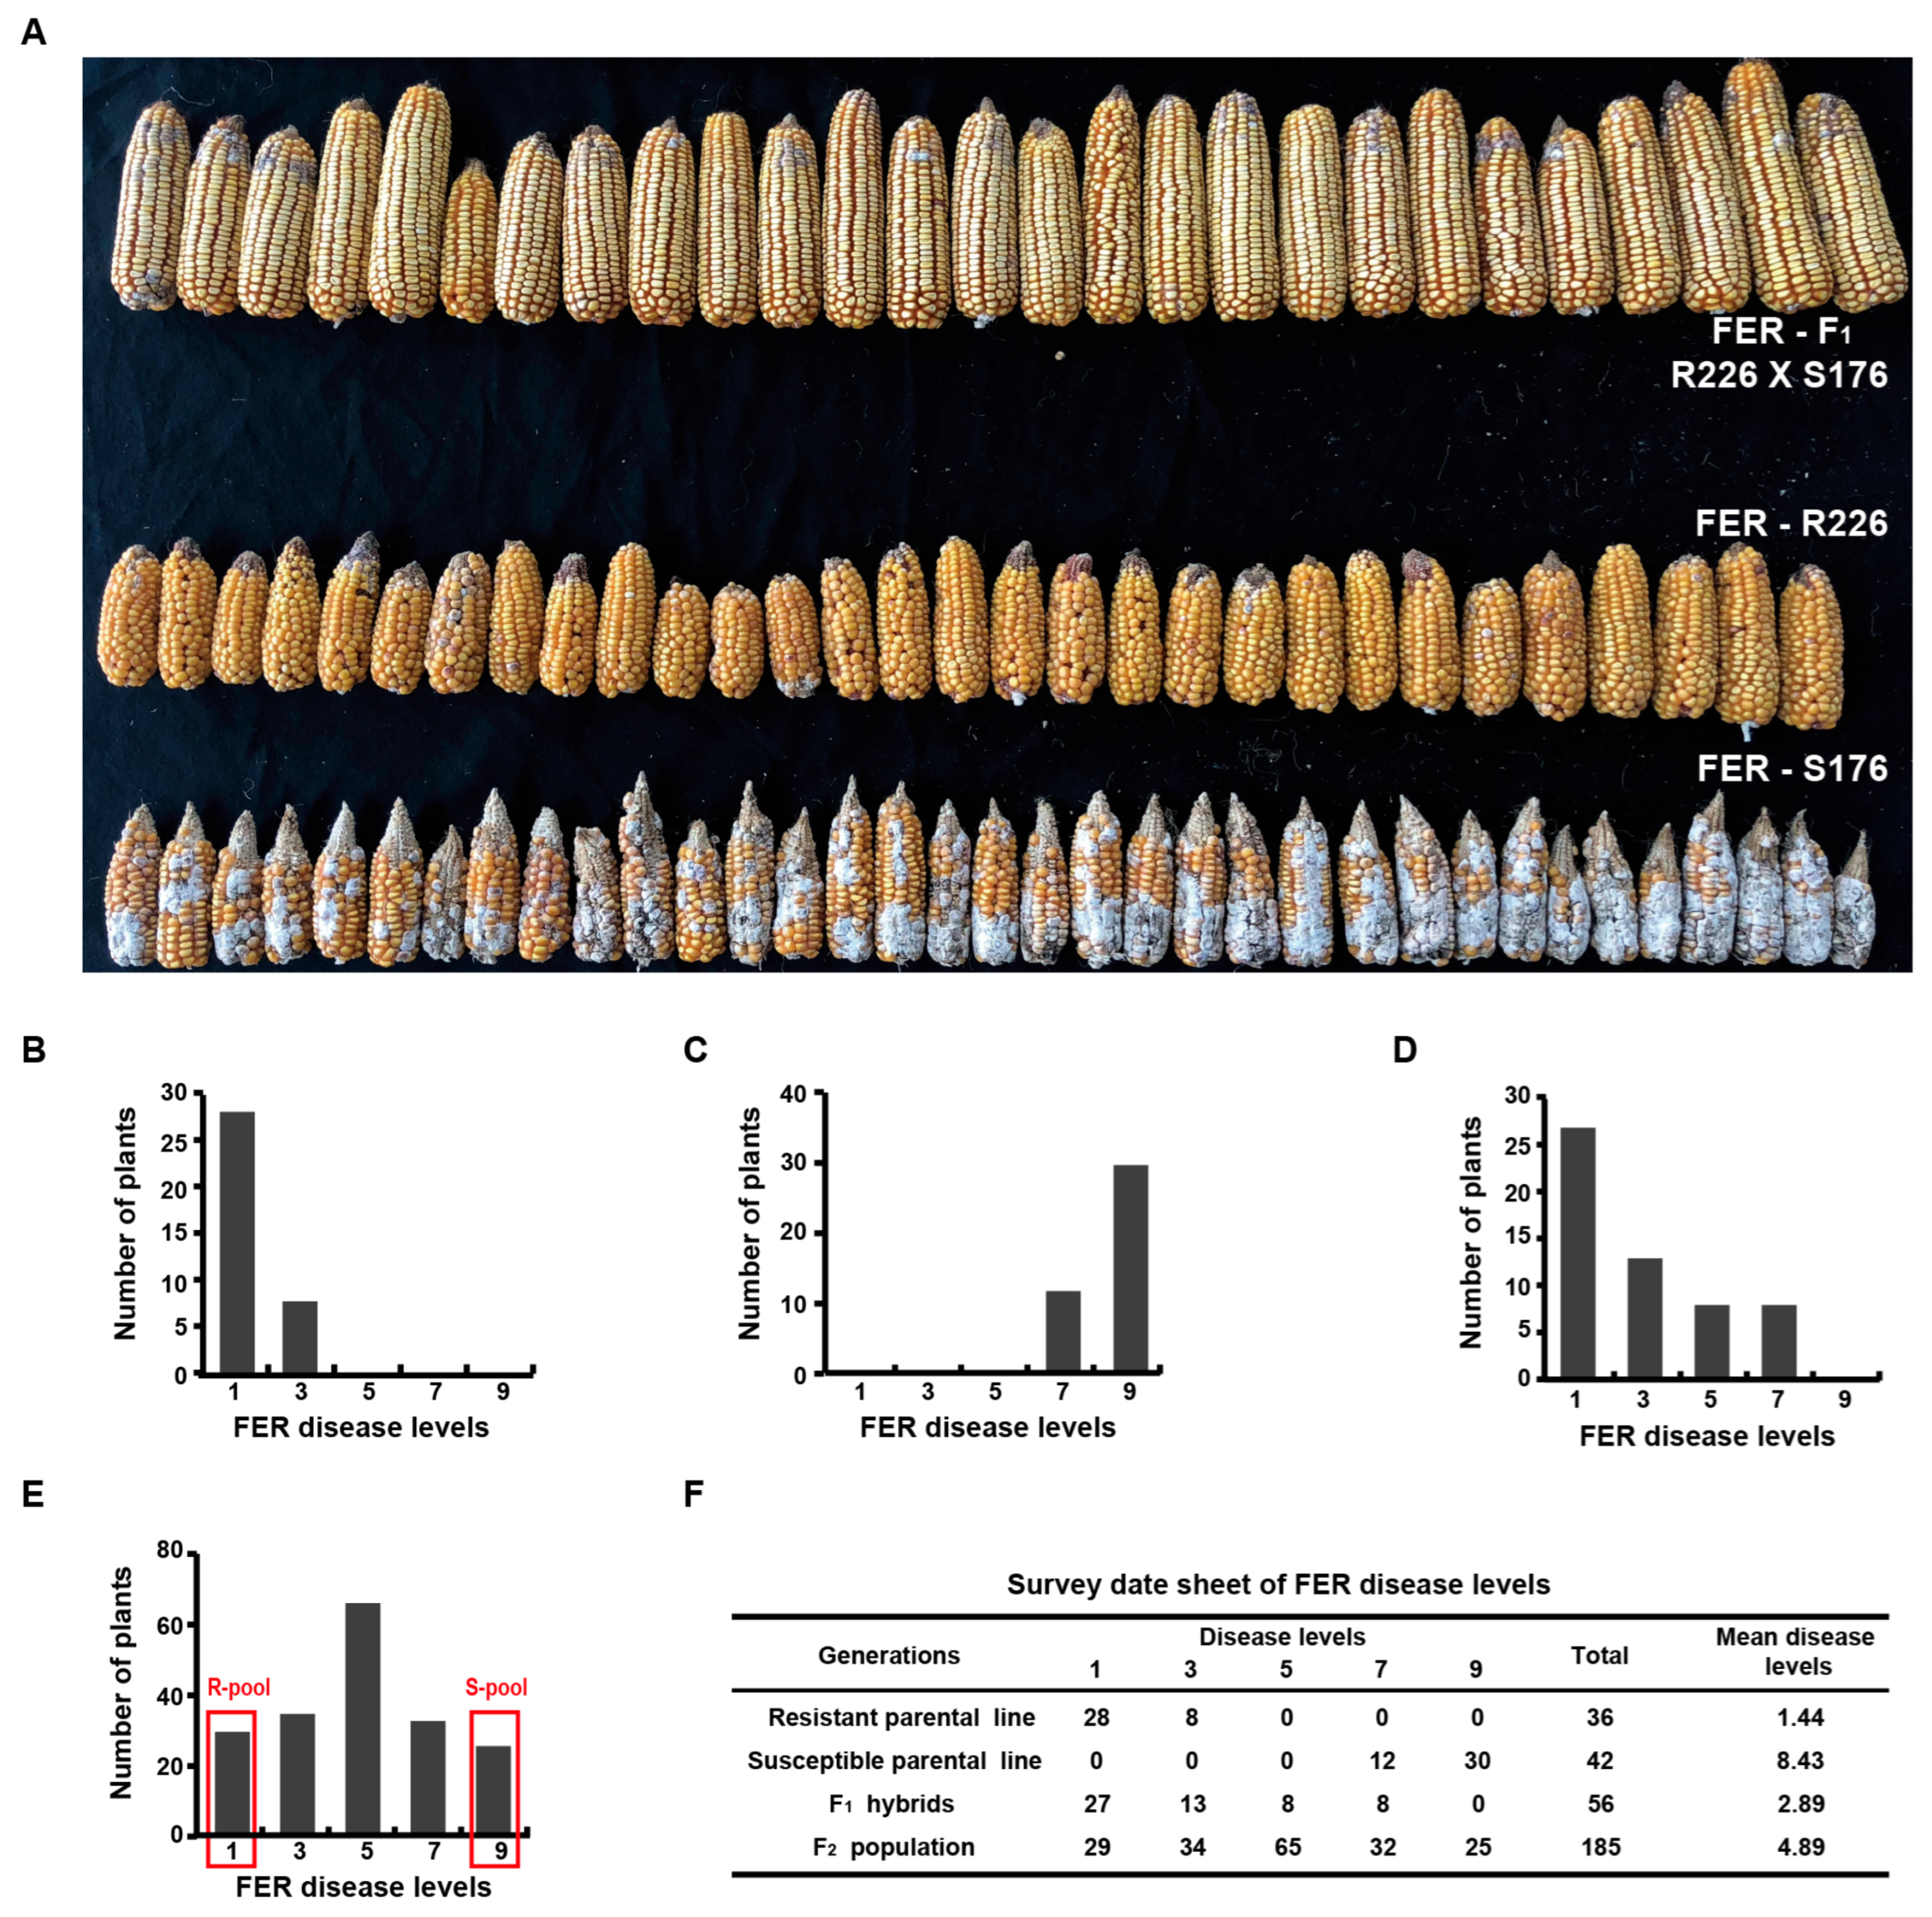
The frequency distribution of FER resistance following artificial inoculation with F. verticillioides is presented in Figure 1A–F. The resistant parental inbred line, R226, exhibited high resistance to FER (mean disease level at 1.44) (Figure 1A,B,F), whereas the susceptible parental inbred line, S176, was highly susceptible (mean disease level at 8.43) (Figure 1A,C,F). The majority of F1 hybrids (71.43%) were resistant, with a mean disease level of 2.89 (Figure 1A,D,F), suggesting that the major FER resistance alleles are likely dominant. The F2 population displayed a continuous variation in disease severity (Figure 1E,F) with a mean disease level of 4.89. This segregation pattern is consistent with quantitative inheritance, suggesting that FER resistance in R226 is a polygenic trait.
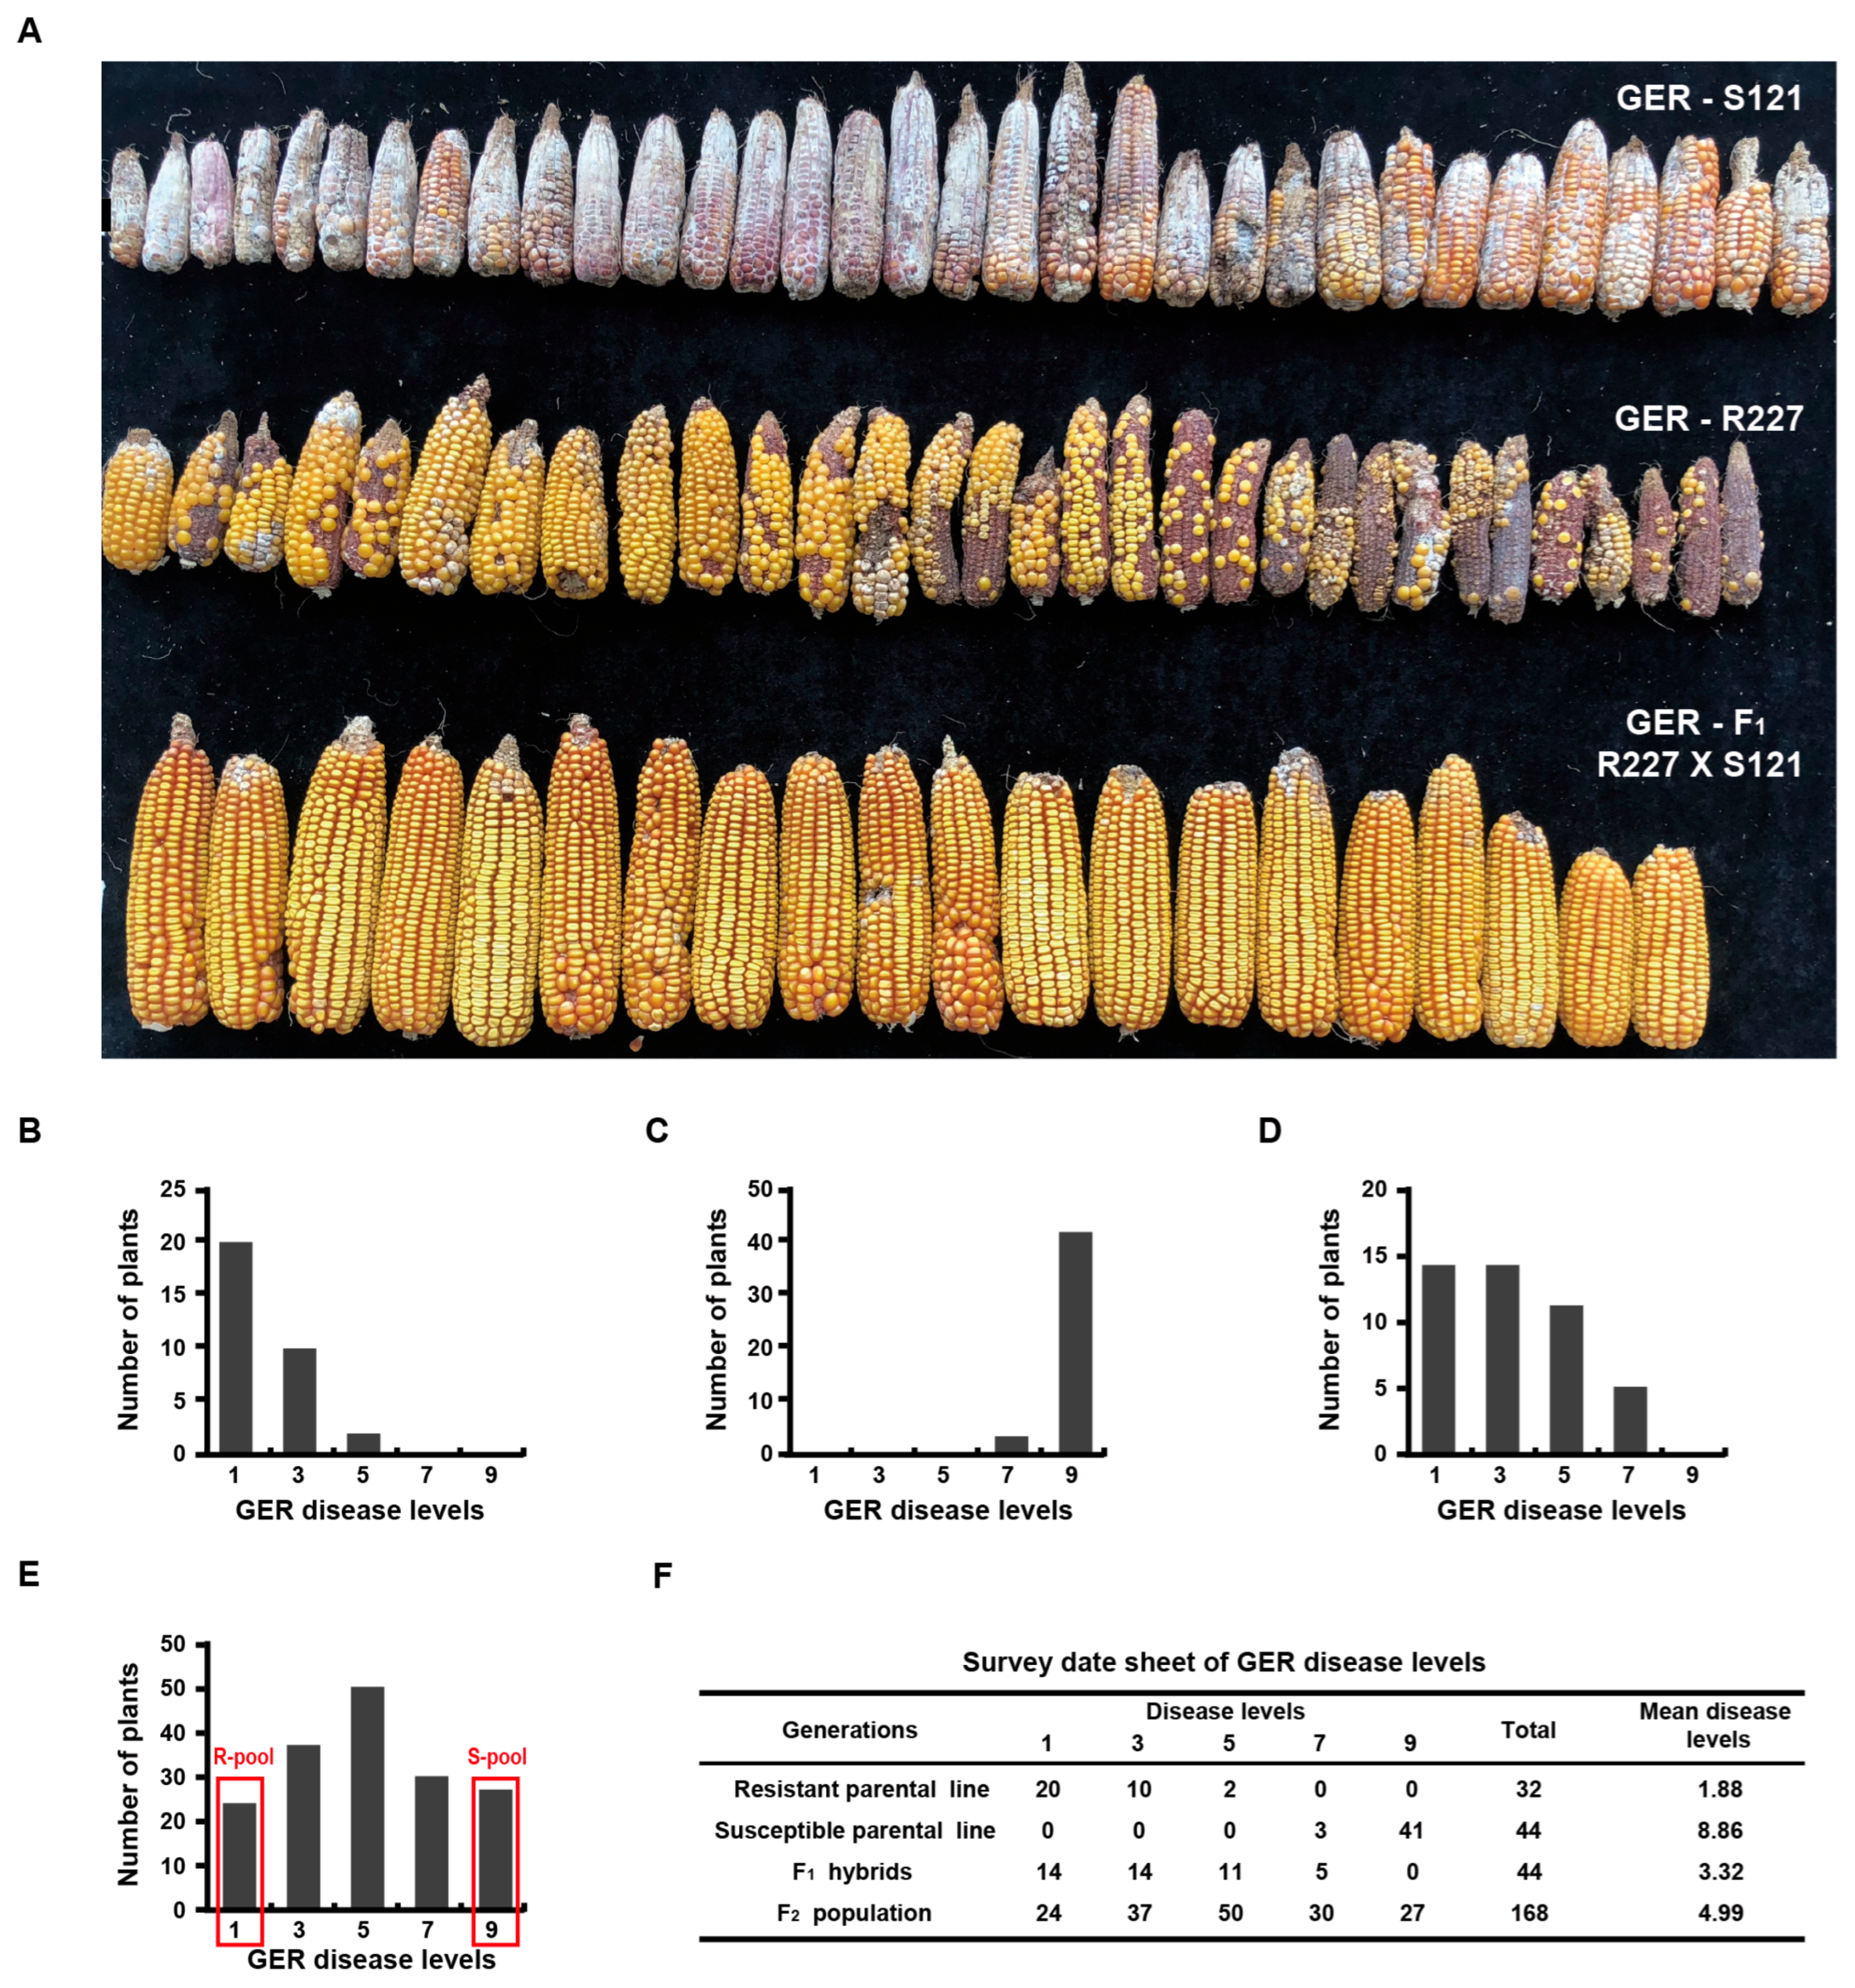
Similarly, the distribution of GER resistance after inoculation with F. graminearum is shown in Figure 2A–F. The resistant parental, inbred line R227, showed strong resistance (mean disease level at 1.88) (Figure 2A,B,F), while the susceptible parental inbred line S121 showed severe symptoms (mean disease level at 8.86) (Figure 2A,C,F). A significant proportion of F1 hybrids (63.64%) were resistant, with a mean disease level of 3.32 (Figure 2A,D,F). The F2 population also exhibited a continuous distribution of GER symptoms (Figure 2E,F) with a mean disease level of 4.99, indicating that the resistance to GER in the resistant parental inbred line R227 is also quantitatively inherited.

2.2. BSA Mapping of FER Resistance

BSA was performed using two pooled DNA samples representing extreme phenotypes from the F2 population (derived from the cross between R226 and S176). Whole-genome sequencing of the susceptible and resistant bulks yielded 185,305,948 and 187,834,729 clean reads, corresponding to 55.51 and 56.27 Gb of high-quality sequence (Q30 ≥ 93.42%), respectively. The clean reads were aligned to the reference genome, achieving mapping rates of 97.42% for the susceptible bulk and 98.58% for the resistant bulk (Table S1). A total of 10,714,248 SNPs were identified (Table S2). A total of 2,857,322 high-quality SNPs were identified and used for association analysis between the two pools after filtering diversity loci (Table S2).
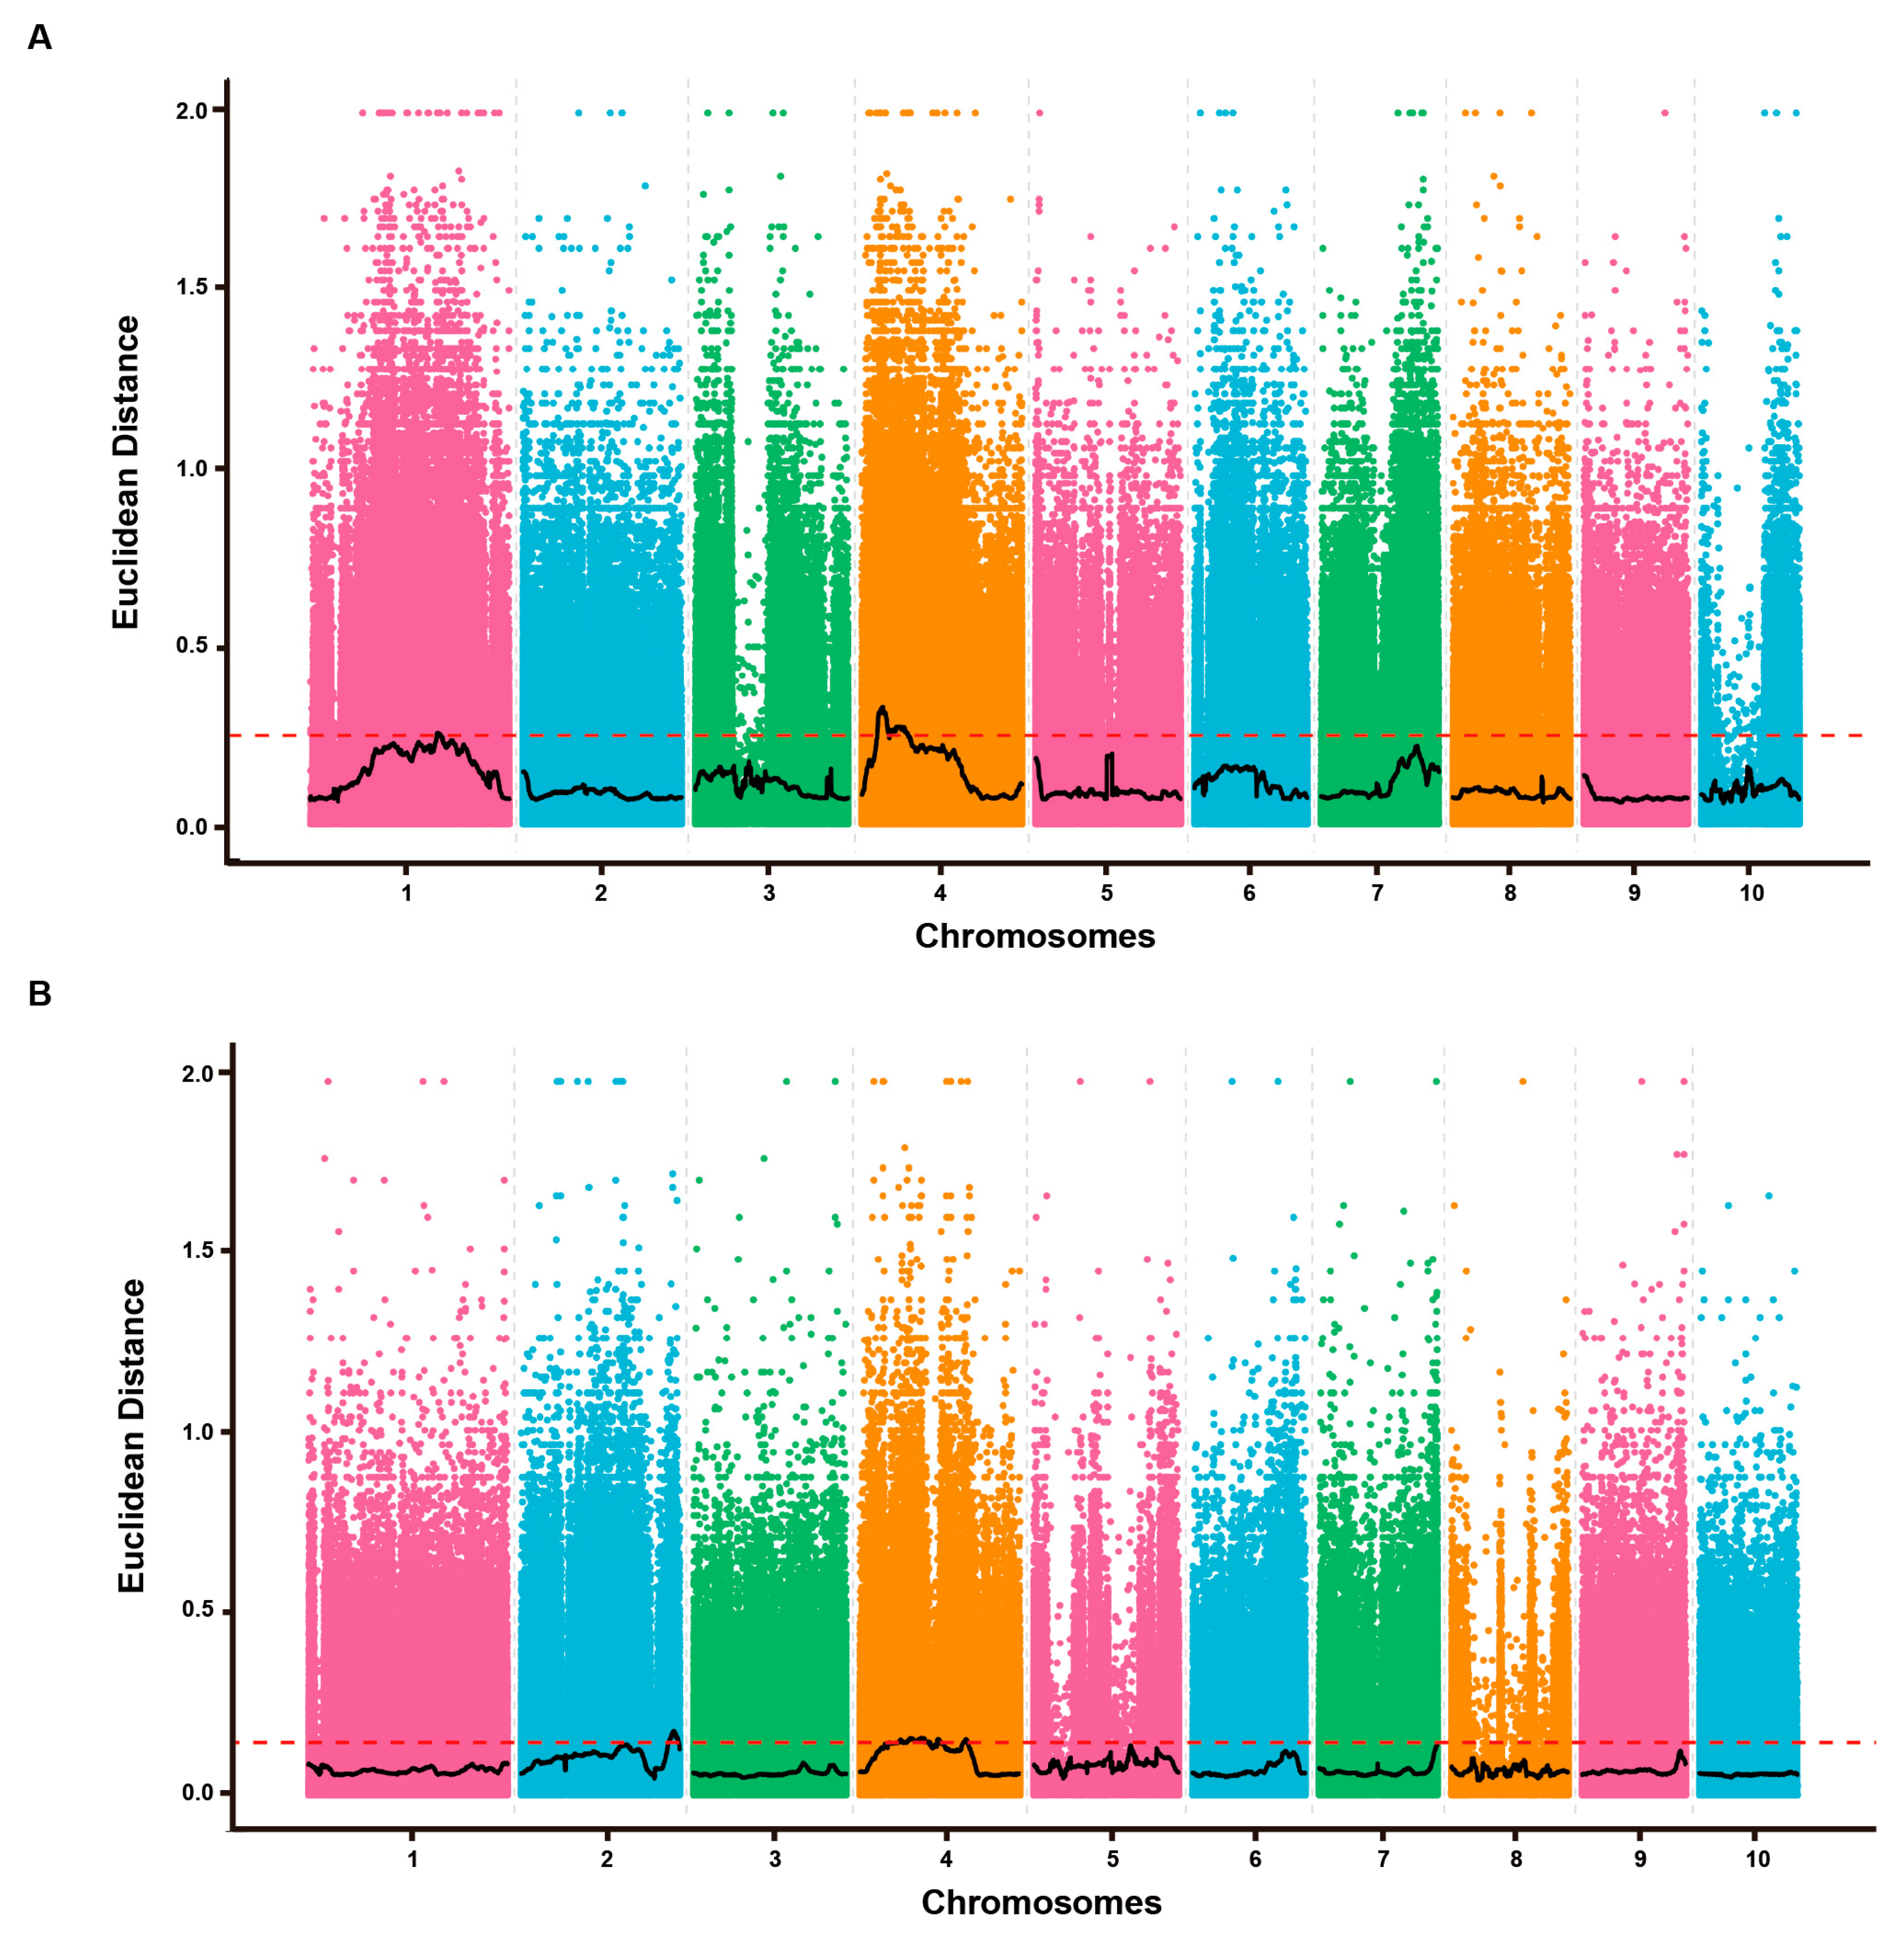
The Euclidean distance (ED) value for each high-quality SNP was calculated to assess the association between allele frequency and FER resistance in the contrasting bulks (FER_S and FER_R). The ED_values were plotted across all maize chromosomes (Figure 3A). A significance threshold of ED ≥ 0.25, derived from the fitted values of all high-quality SNPs [34], was used to identify significant association peaks. The distribution of ED-associated values of SNPs on different chromosomes is displayed in Figure S1. This analysis defined five QTLs, which were designated as qFERbin QTLs, located on chromosome bins 1.06, 4.04, and 4.05 with a total length of 52.22 Mb, and 2507 genes. A total of 481 genes with non-synonymous SNP loci were identified from these five QTLs, and these QTLs were named qFERbin. For instance, qFER1.06 denotes the QTL identified on chromosome bin 1.06. This QTL spanned a 5.98 Mb region on chromosome 1, ranging from 195,150,000 to 201,130,000 bp, and contained 458 genes. Simultaneously, two QTLs (qFER4.04/4.05 and qFER4.05) were identified on chromosome 4 with intervals of less than 1.01 Mb (Table 1). The qFER4.04/4.05 spanned an 18.16 Mb region (23,670,000–41,830,000 bp) and contained 1256 genes, while qFER4.05 covered a 28.50 Mb region (42,840,000–71,340,000 bp) with 793 genes. Given the substantial genetic length and the magnitude of the ED peak on chromosome 4, we propose that this genomic region represents a hotspot for FER resistance in maize (Figure 3A).

2.3. BSA Mapping of GER Resistance

BSA was similarly conducted for GER resistance. Two DNA pools were constructed from F2 individuals exhibiting extreme GER phenotypes, derived from a cross between the resistant parent R227 and the susceptible parent S121. Whole-genome sequencing of the susceptible and resistant bulks generated 231,018,662 and 240,786,470 clean reads, corresponding to 69.20 Gb and 72.14 Gb of high-quality sequence (Q30 ≥ 93.19%), respectively (Table S1). Alignment of these reads to the reference genome resulted in mapping rates of 98.32% for the susceptible bulk and 98.14% for the resistant bulk (Table S1). A total of 10,476,096 SNPs were identified, and 3,152,820 high-quality SNPs were obtained, which were used for further association analysis (Table S2).
The association between allele frequency and GER resistance was evaluated by calculating the ED for each high-quality SNP between the GER_S and GER_R bulks. The ED values were plotted across all maize chromosomes (Figure 3B), with the full distribution provided in Figure S2. Using a significance threshold of ED ≥ 0.25, we identified 11 QTLs, which we designated as qGERbin, in chromosome bins 2.08–2.10, 4.05, and 4.06 (Table 2). These QTLs collectively spanned 73.94 Mb and encompassed 3261 genes, 764 of which contained non-synonymous SNPs.
The QTL qGER2.09 spanned a 15.58 Mb region starting from 227,400,000 to 242,980,000 on chromosome 2, bin2.08–2.10, and contained 1429 genes (Table 2). Moreover, three QTLs were located on Chr 4, qGER4.05-1, qGER4.05-2, and qGER4.06, which spanned a region of 48.35 Mb, 6.12 Mb, and 6.34 Mb, starting from 58,580,000 to 106,930,000, 119,340,000 to 125,460,000, and 160,050,000 to 166,390,000, and contained 1063, 152, and 617 genes, respectively (Table 2). The intervals between adjacent QTLs on chromosome 4 were 12.41 Mb and 34.59 Mb, respectively. Given the high density and substantial genomic span of the QTLs on chromosome 4, we identified this chromosome as a major hotspot for GER resistance in maize (Figure 3B).

2.4. Candidate Genes and Enrichment Analysis

We further characterized each QTL and conducted KEGG pathway enrichment analysis for the identified genes residing in the QTL regions for FER and GER resistance, respectively. A total of 458, 1256, 793, 1429, 1063, 152, and 617 genes were identified in qFER1.06, qFER4.04/4.05, qFER4.05, qGER2.09, qGER4.05-1, qGER4.05-2, and qGER4.06, respectively (Table 1 and Table 2). KEGG pathways enriched in FER QTLs were identified as endocytosis, peroxisome, phagosome, phosphatidylinositol signaling, plant hormone signal transduction, ubiquitin-mediated proteolysis, plant–pathogen interaction, circadian rhythm–plant, biotin metabolism, citrate cycle, oxidative phosphorylation, carbohydrate metabolism, biosynthesis and metabolism of amino acids, fatty acid, ribosome, spliceosome, and the replication, splicing, repair, homologous recombination, transport and metabolism of nucleic acid (Figure S3). The similar enrichment results, which were without the circadian rhythm–plant, biotin metabolism, and citrate cycle but additionally enriched the propanoate metabolism and carotenoid biosynthesis, were exhibited in the GER QTLs (Figure S4).
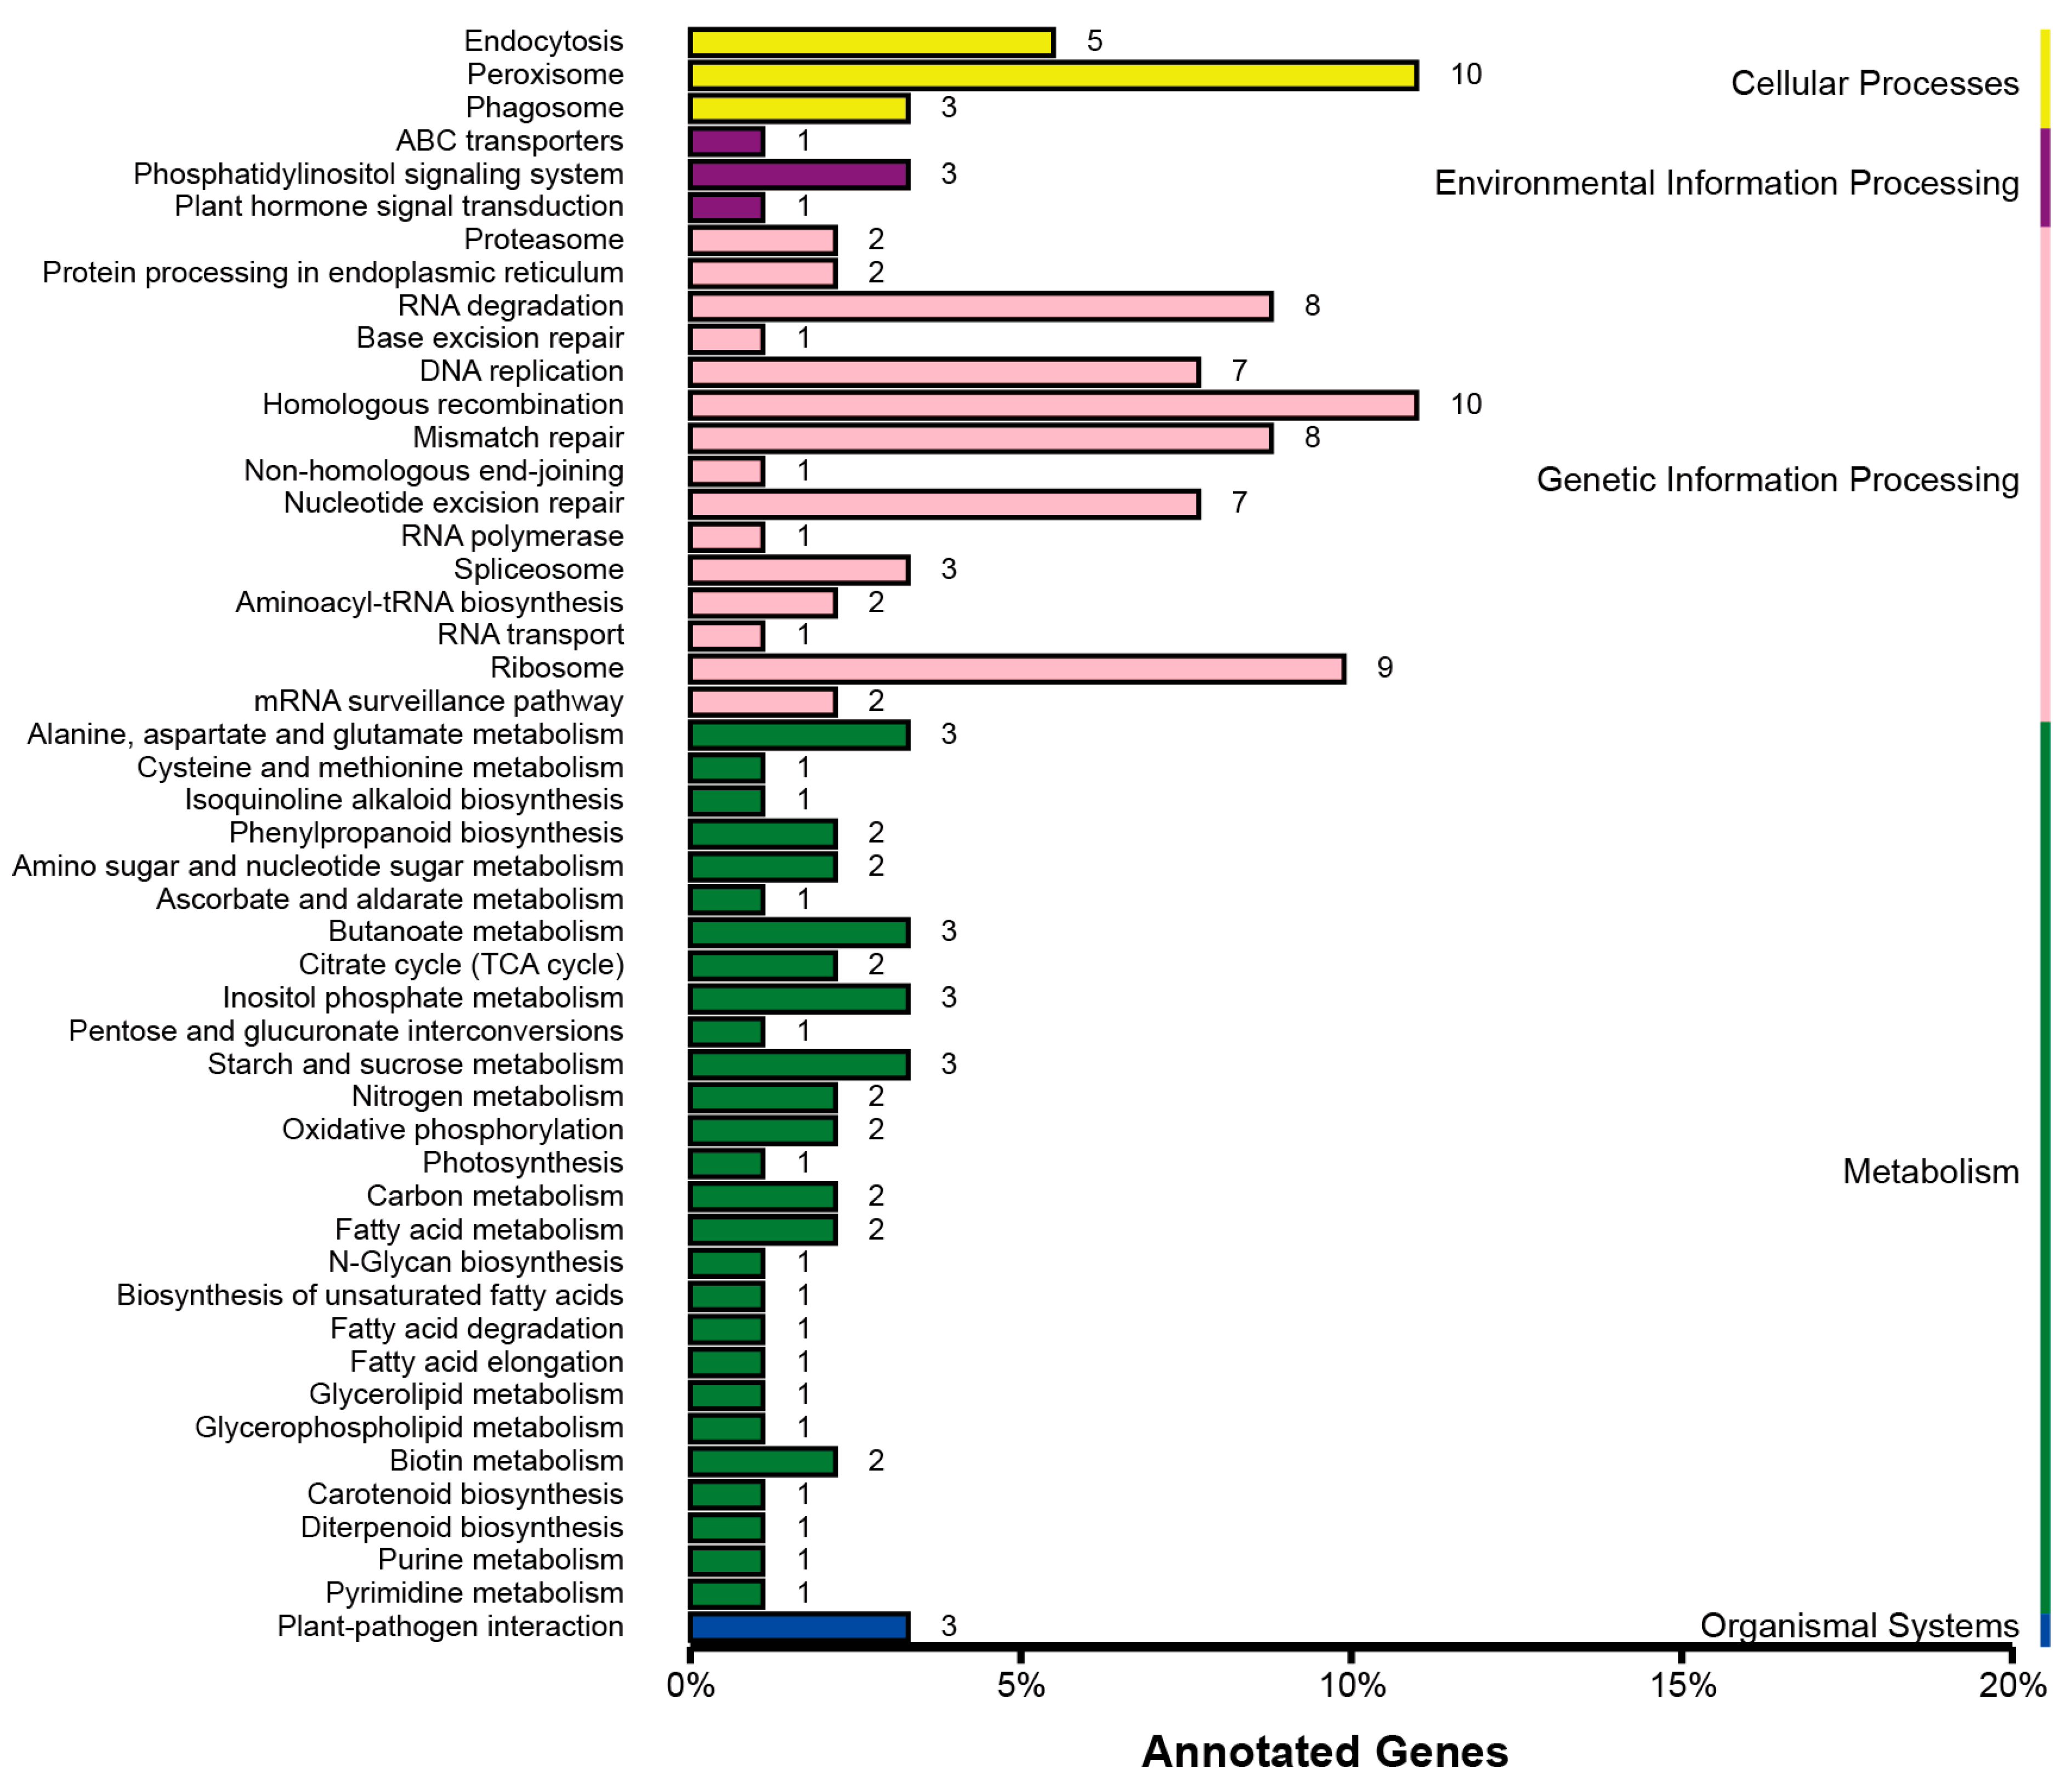
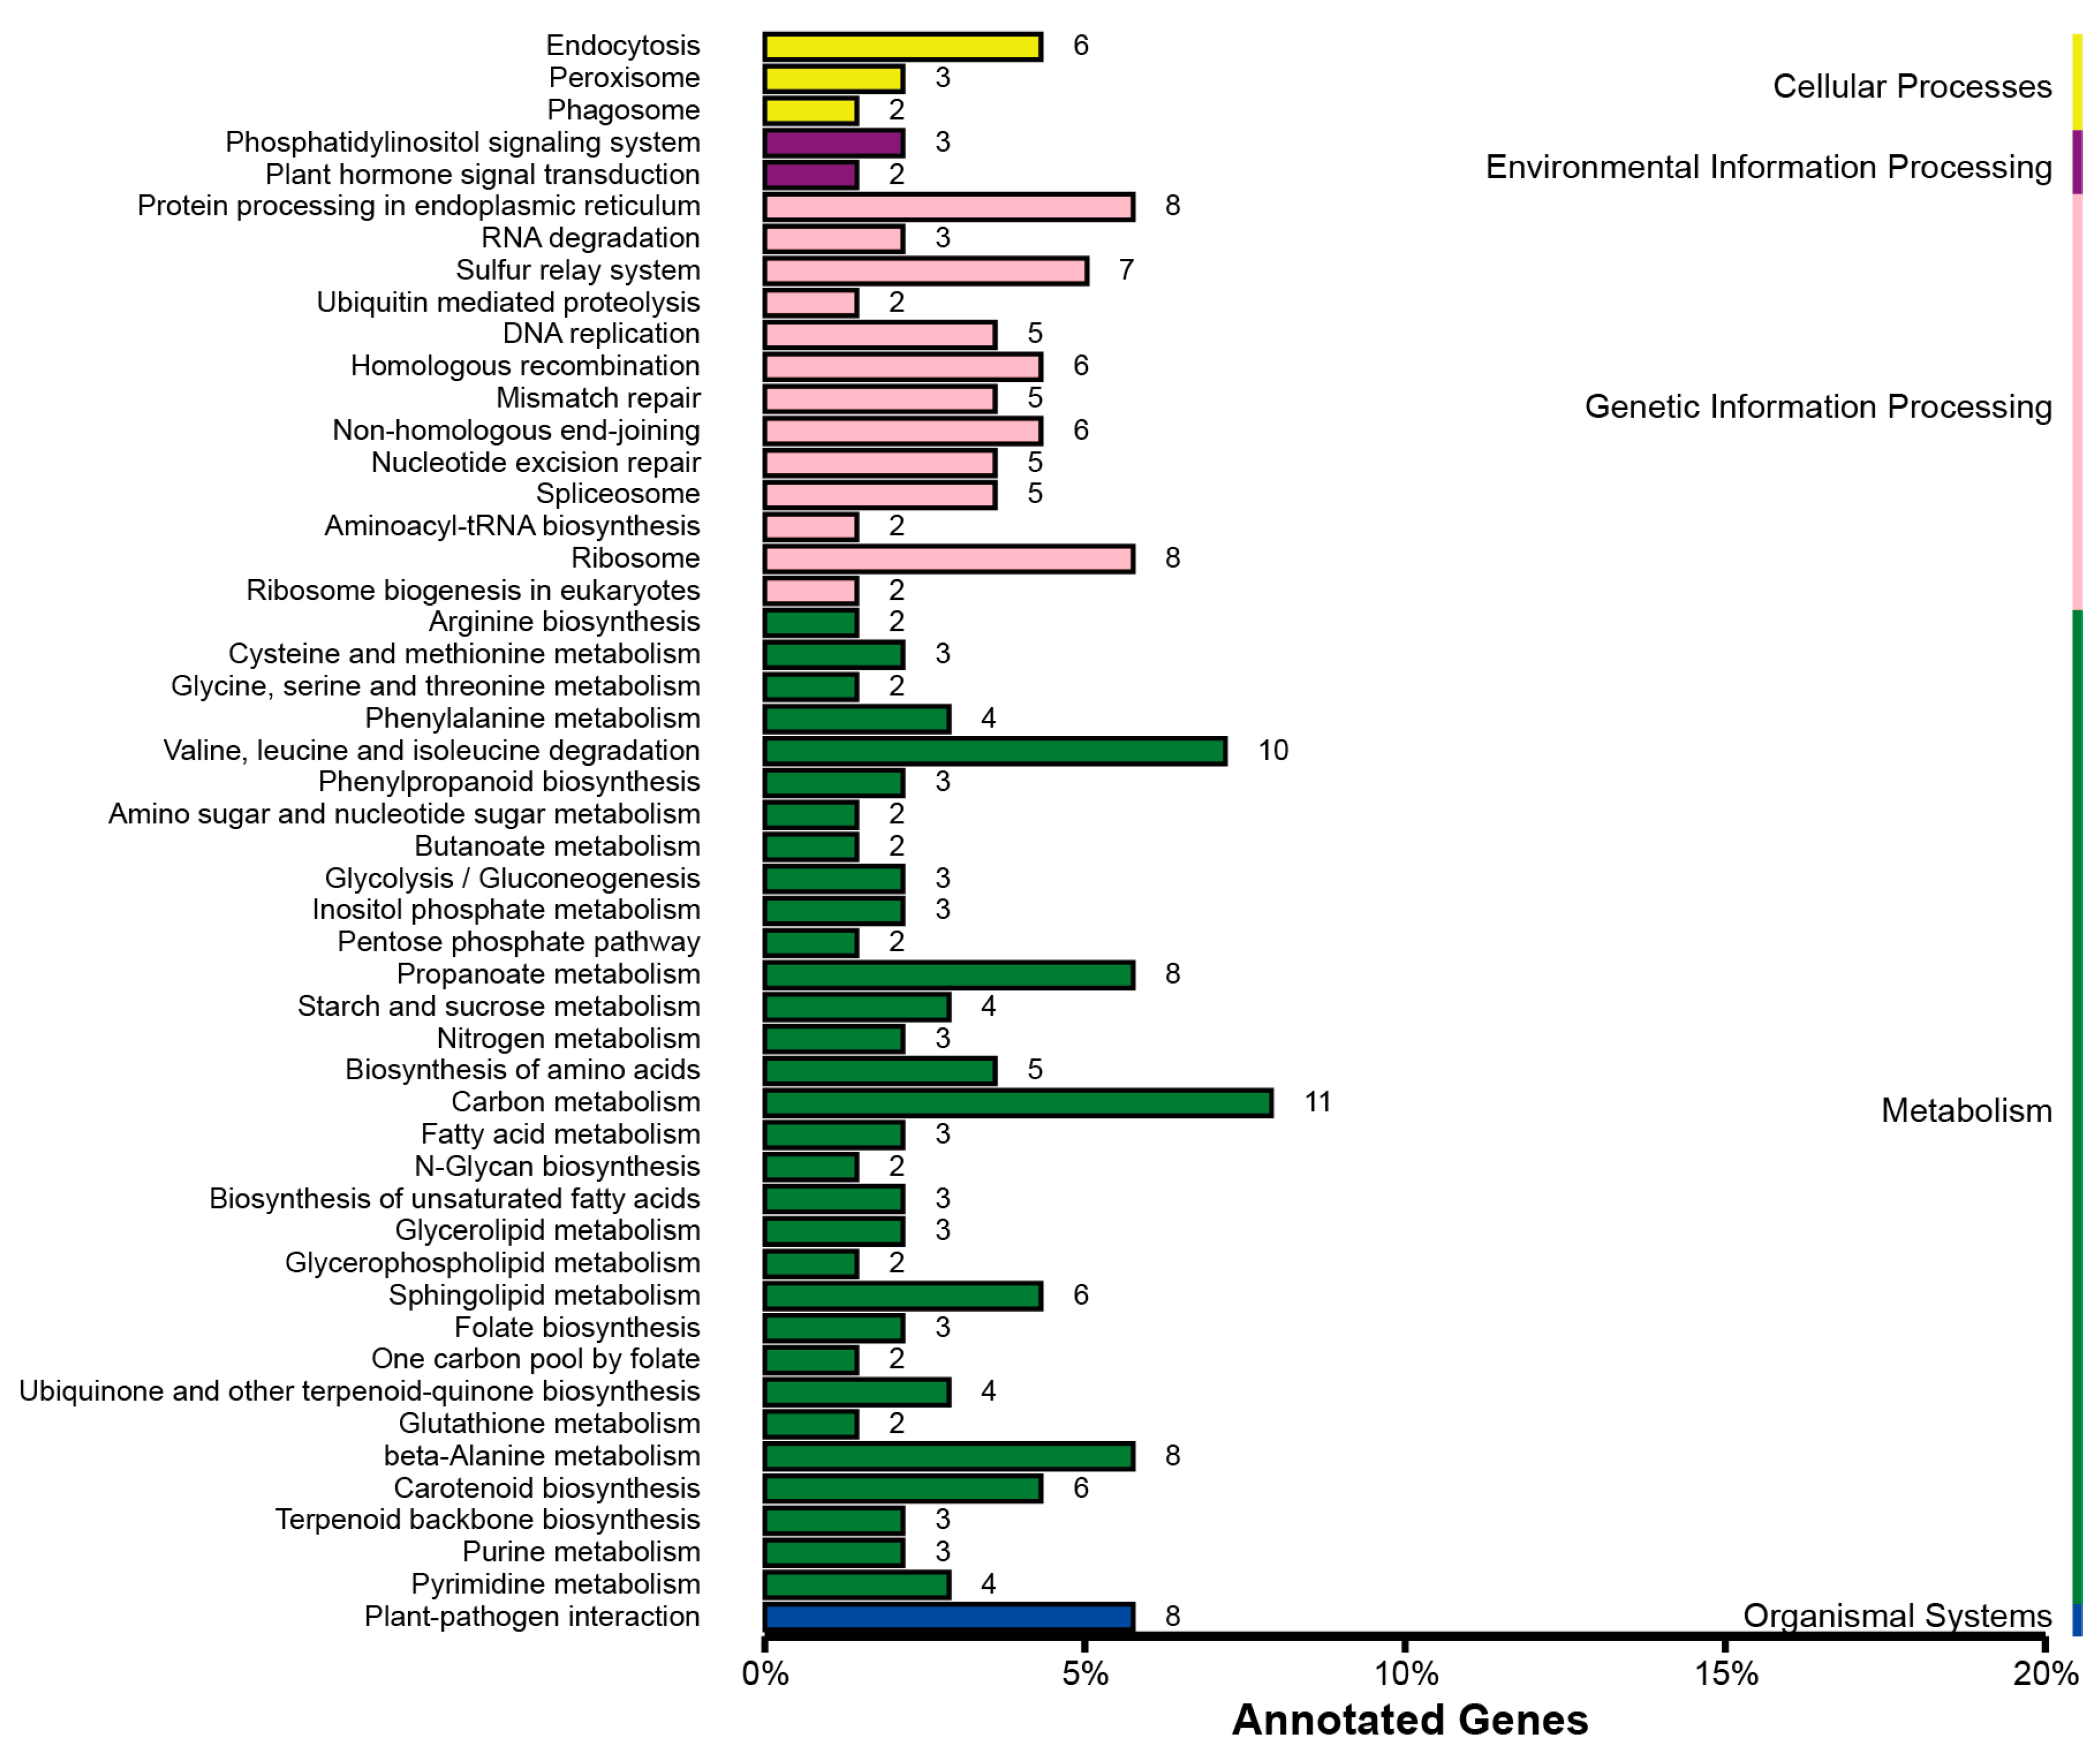
A total of 59,899 and 67,070 significant SNPs were identified from the extreme phenotype mixed pools for the FER and GER mapping populations, respectively. The identified SNPs were further screened for non-synonymous SNPs as candidate sites. A total of 350 and 391 non-synonymous SNPs were identified from the mixed pools for the two mapping populations. A total of 502 and 810 genes were closely associated with these SNPs. KEGG pathway enrichment analysis was further conducted for these non-synonymous SNP-associated genes. The non-synonymous SNP-associated genes in FER QTLs were enriched in endocytosis, peroxisome, phagosome, ABC transporters, phosphatidylinositol signaling, plant hormone signal transduction, ubiquitin-mediated proteolysis, plant–pathogen interaction, biotin metabolism, citrate cycle, oxidative phosphorylation, carbohydrate metabolism, biosynthesis and metabolism of amino acids and fatty acid, RNA degradation, ribosome, spliceosome, and DNA replication, mismatch repair, homologous recombination, nucleotide excision repair, and so on (Figure 4). Compared with the FER QTLs, more genes were enriched in the pathways of plant–pathogen interaction, folate and carotenoid biosynthesis, ubiquinone and other terpenoid–quinone biosyntheses, propanoate metabolism, sphingolipid metabolism, beta-alanine metabolism, and carbohydrate and amino acid metabolism for the GER QTLs (Figure 5).
A total of 52 genes were identified as cross genes that are associated with the non-synonymous SNPs in the overlap region of the QTLs for both FER and GER resistance. There were six genes without any annotation whose association with the ear rot resistance could not be determined, but 18 genes were possibly associated with the FER and GER resistance among the other 46 genes (Table 3). The annotation information regarding these genes suggested their involvement in various pathways, including enzyme activities such as protein serine/threonine kinase activity, transporter activity, transcription factor activity, electron transfer activity, cytoplasmic vesicle, integral component of organelles such as endoplasmic reticulum, ribosome, membrane, wall, thylakoid, and exocyst, proteolysis, protein phosphorylation, glycosylation, methylation, and ubiquitination, response to wounding and JA, defense response to bacterium, carotenoid and hydrogen peroxide biosynthesis, metal ion binding, heat shock protein binding, translation, exocytosis, oxidation-reduction, pollen development, DNA binding, and ATP binding pathway in this study.

2.5. Candidate Genes Expression Analysis

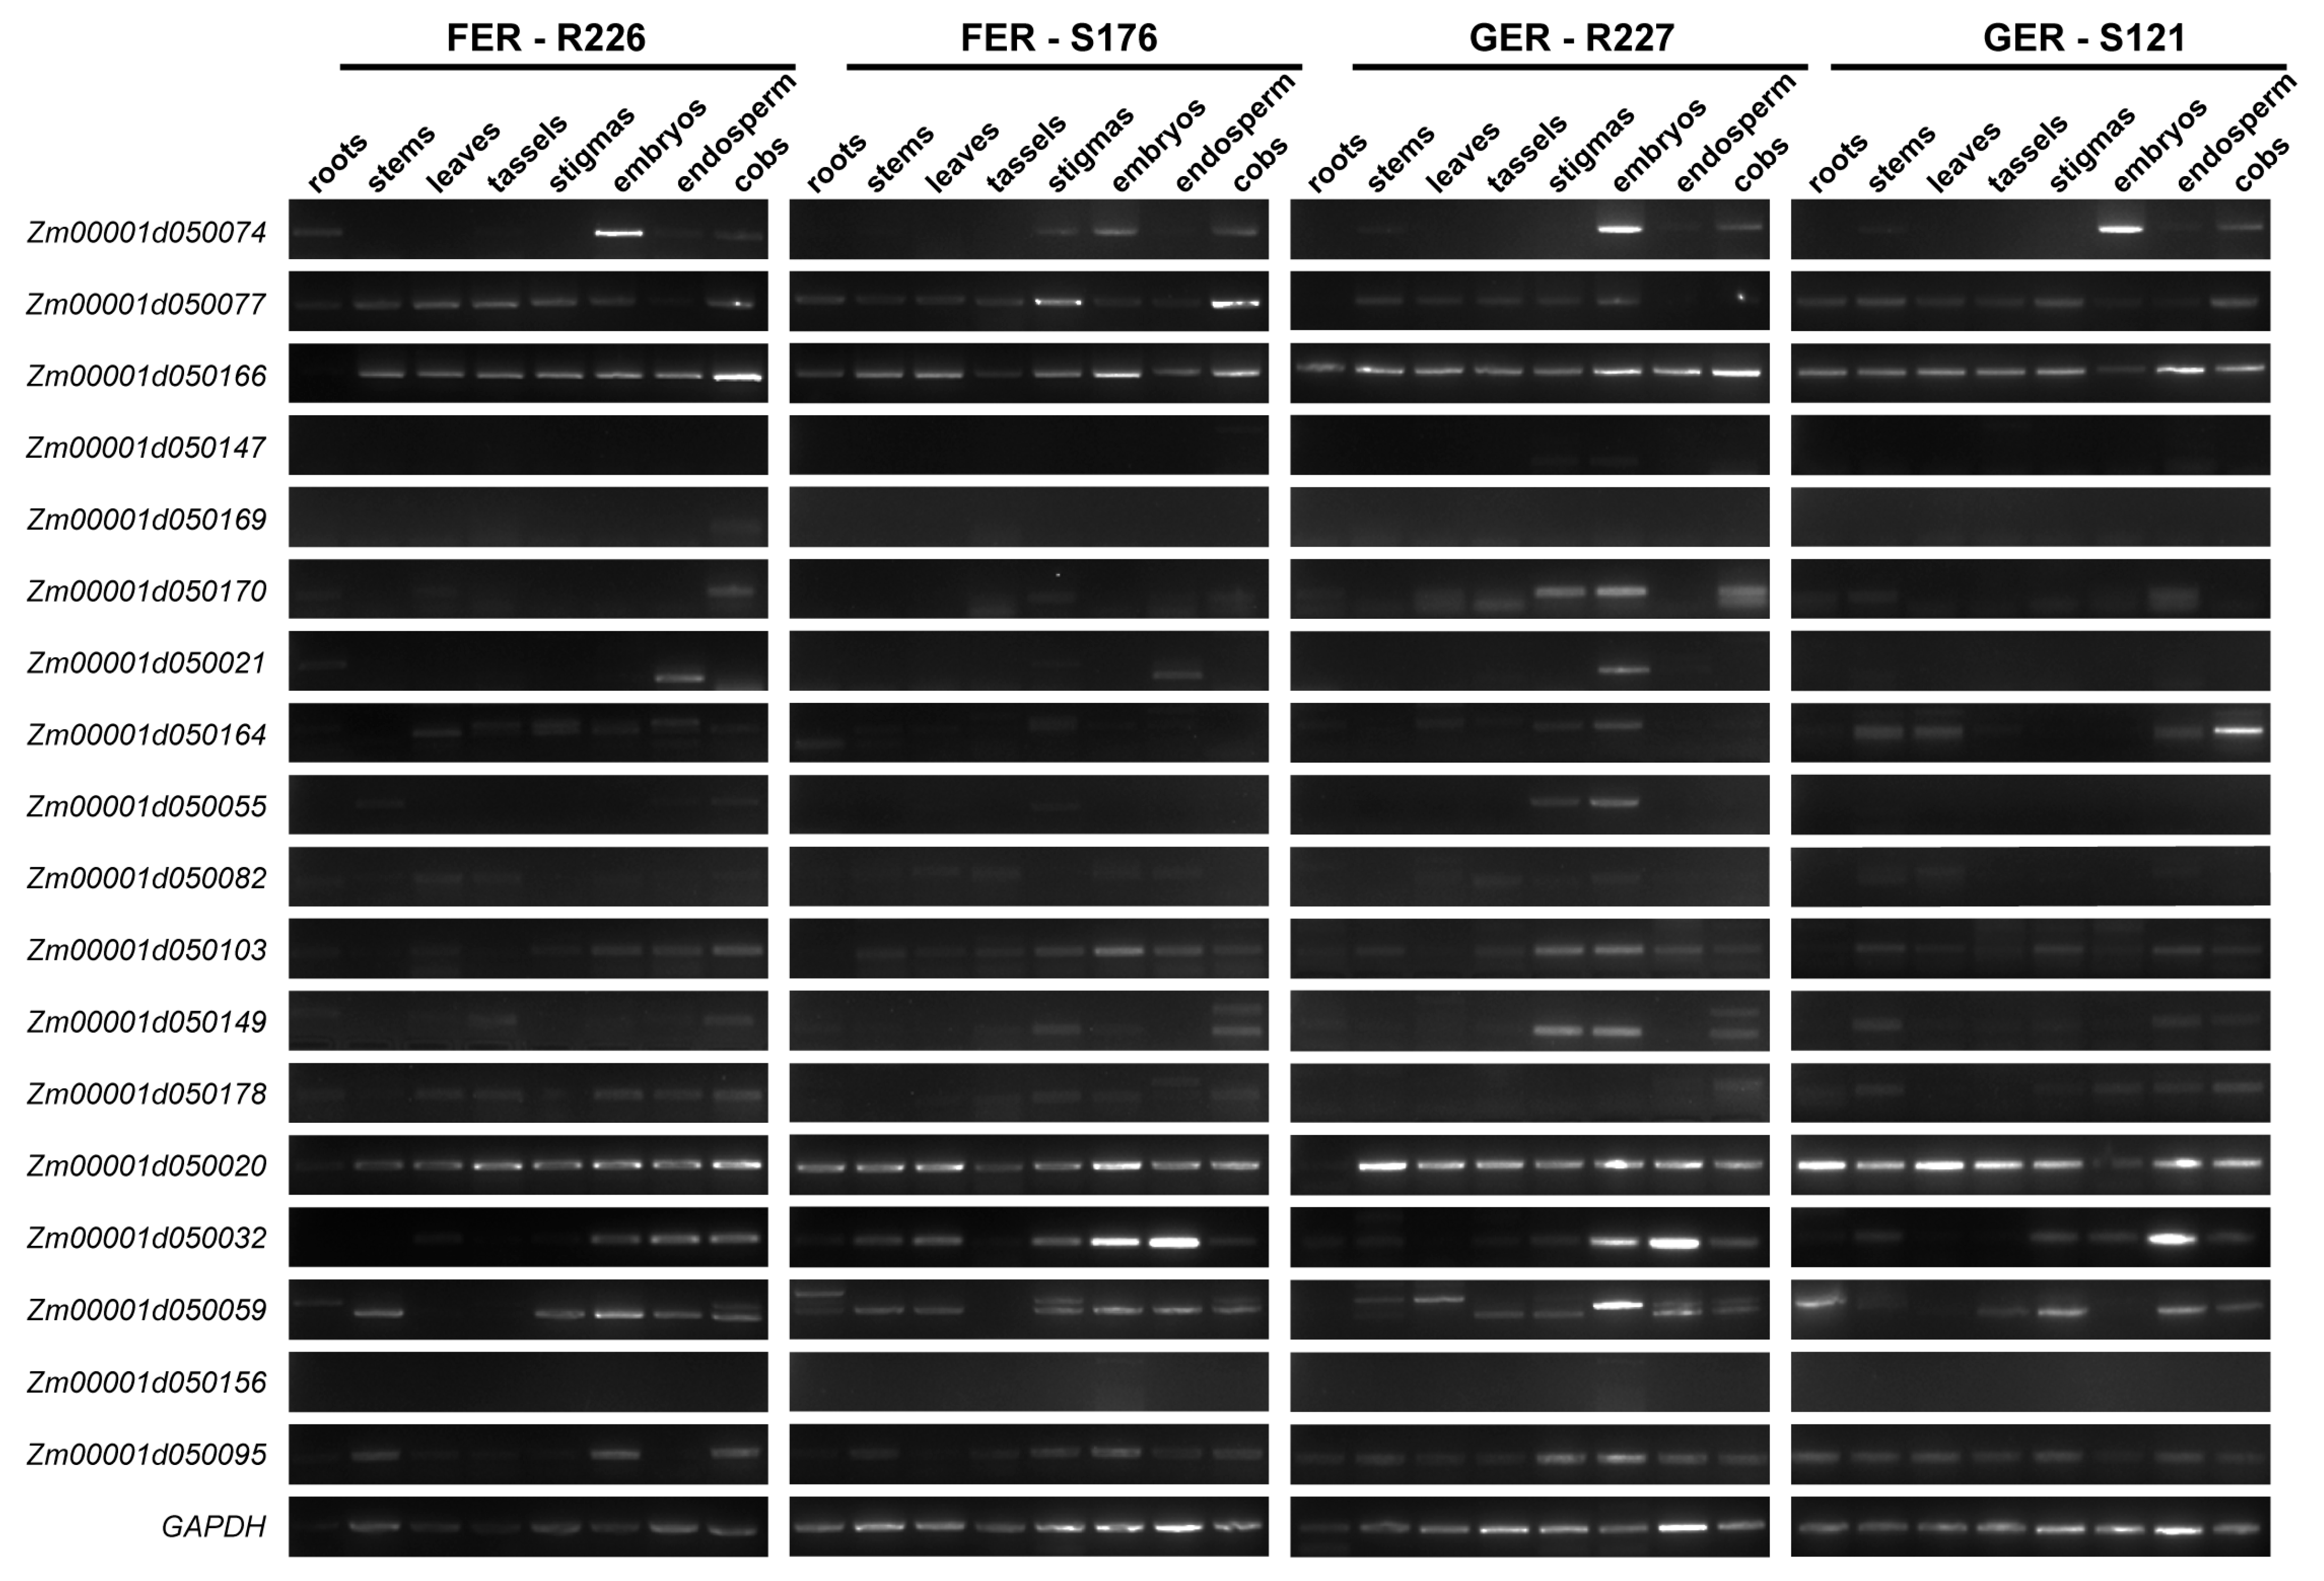
The tissue-specific expression profiles of 18 candidate genes (LRR-RLK, WAKL family members) in roots, stems, leaves, tassels, stigmas, embryos, endosperm, and cobs of maize (15 days after pollination) were detected by RT-PCR, with GAPDH as the internal reference gene. The results are as follows (Figure 6).
Zm00001d050074 was mainly expressed in embryos, endosperm, and cobs, suggesting that it may be involved in the defense response of maize against ear rot pathogens. It showed relatively high expression levels in the embryos of maize lines R226, R227, and S121. Zm00001d050077 and Zm00001d050166 were expressed in all tested tissues. Specifically, Zm00001d050077 had relatively higher expression in the stigmas and cobs of line S176, while Zm00001d050166 showed slightly higher expression in the cobs of lines R226 and R227. Zm00001d050170 was weakly expressed in the cobs of R226 and the stigmas of S176; it was also detected in the stigmas, embryos, and cobs of R227, with relatively higher expression in embryos. Zm00001d050021 was only detected in the endosperm of the three maize lines (R226, S176, and R227). It exhibits tissue-specific expression and may be associated with resistance to ear rot. Zm00001d050164 showed slightly higher expression in the endosperm of R227 and the cobs of S121, and no or weak expression in other lines and tissues. Zm00001d050055 was weakly detected in the stems, endosperm, and cobs of R227, as well as the stigmas of S176; it had relatively higher expression in the stigmas and embryos of R227. Zm00001d050082 showed no or weak expression in all tissues of all tested lines. Zm00001d050103 was weakly detected in all tissues of all lines, with relatively higher expression in the embryos of S176 and the stigmas and embryos of R227. Zm00001d050149 had higher expression in the stigmas and embryos of R227, and no or weak expression in other tissues. Zm00001d050178 showed weak or no expression in all tissues of all tested lines. Zm00001d050020 and Zm00001d050095 were expressed in all tissues without significant tissue specificity or expression differences among different tissues and lines. Zm00001d050032 was expressed in all tissues, with high expression levels in the endosperm of lines S176, R227, and S121. Zm00001d050059 had relatively higher expression in the embryos of R227. In addition, no expression of Zm00001d050147, Zm00001d050169, and Zm00001d050156 was detected in any of the tested tissues.
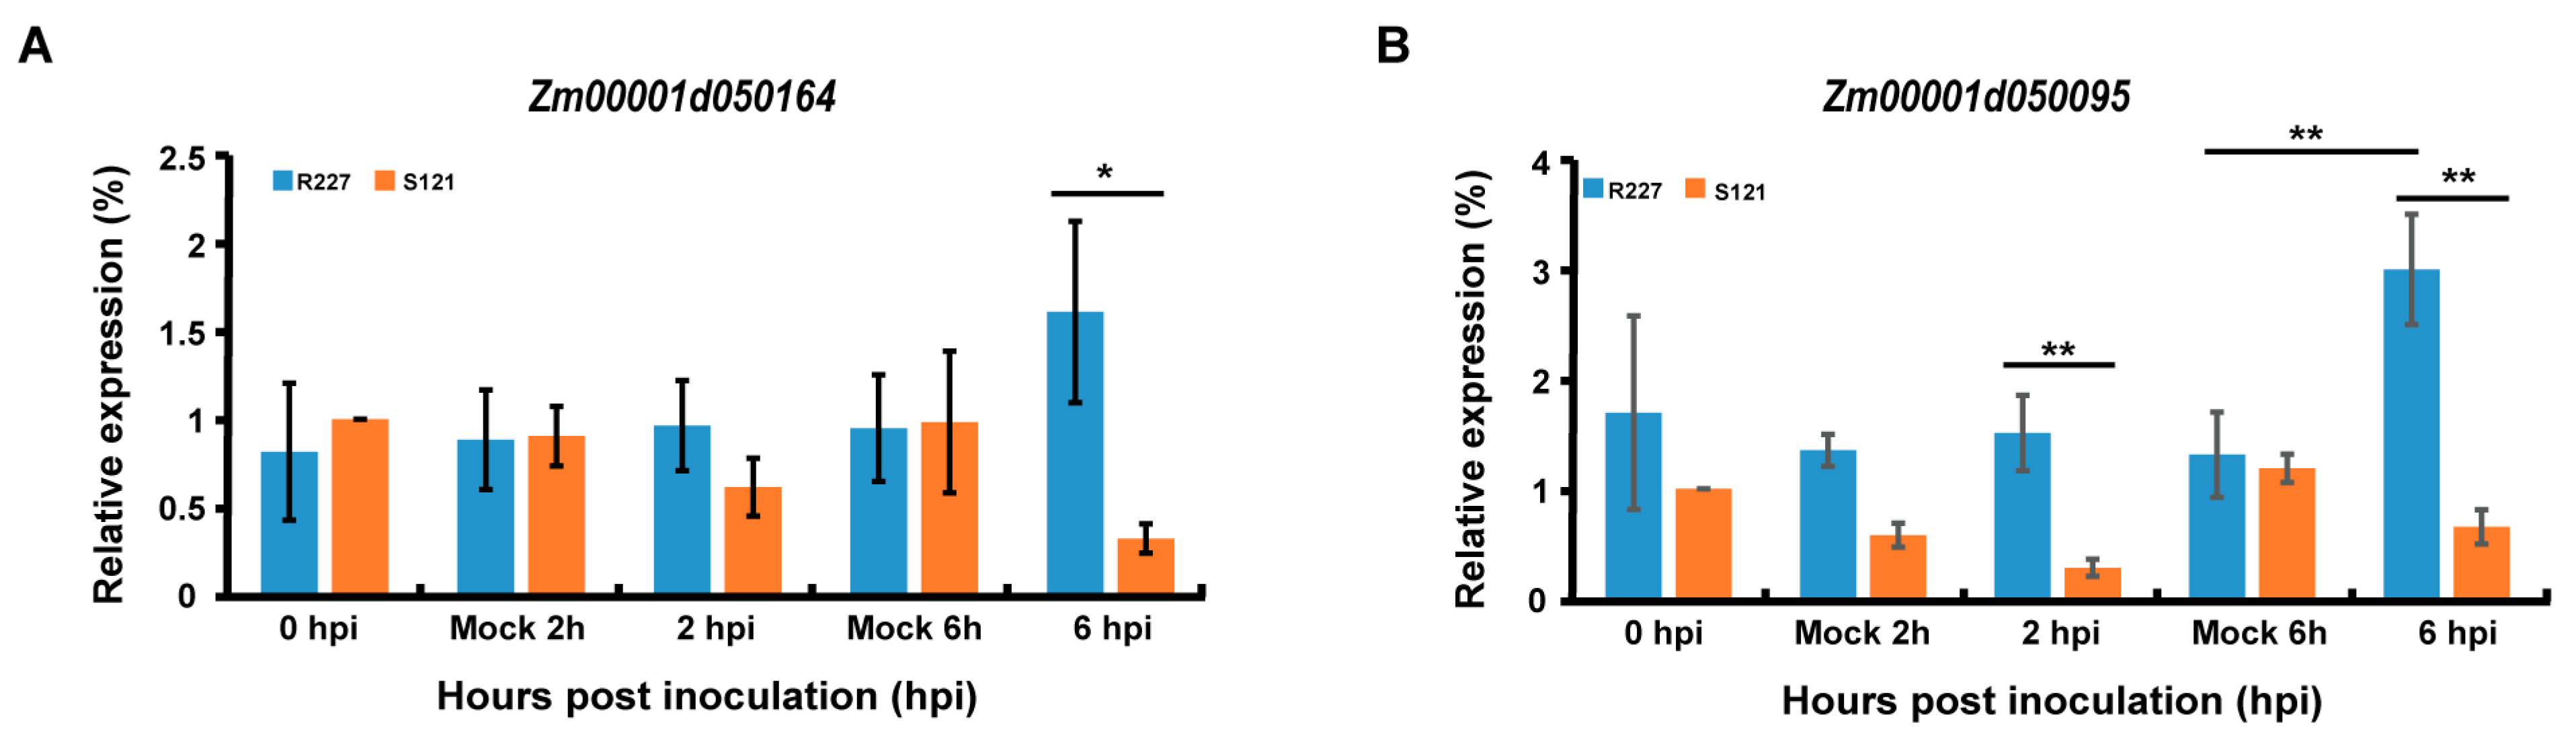
Based on the results of tissue-specific expression analysis, eight candidate genes, including key genes such as LRR-RLK and WAKL family members, were selected for quantitative Real-Time PCR (qRT-PCR) detection to verify their expression dynamics under Fusarium stress. The results showed that the Zm00001d050164 (a WAKL family gene) and Zm00001d050095 had significant expression differences between resistant and susceptible lines at 6 hpi. Among them, Zm00001d050095 was up-regulated in resistant lines after pathogen inoculation, which is closely related to the immune response of maize, further supporting the potential role of these two genes in resisting ear rot (Figure 7A,B). For the other candidate genes, no significant expression differences were detected between the inoculated group and the control group, or between resistant and susceptible lines.

3. Discussion

Ear rot has emerged as a major threat to maize production in China. Developing cultivars with enhanced resistance to FER and GER is becoming a critical need. The mining of stable and simultaneously resistant genes/loci to FER and GER will significantly accelerate breeding programs.
Compared with the classical linkage mapping with RIL/DH populations, BSA provides faster results (weeks vs. years for RIL development) and requires fewer resources. Meanwhile, BSA also has its limitations: the QTL intervals identified by the BSA are relatively broad. This limitation is inherent to BSA methodology, which provides rapid identification of genomic regions but with lower resolution, mainly due to the limited number of recombination events captured in the bulks and the lack of individual genotypic data. These broad intervals should be considered as primary candidate regions for fine-mapping validation. BSA based on pooled sequencing generally yields relatively wide QTL confidence intervals,
Many efforts have been made to identify QTLs associated with FER and GER resistance. The locus on chromosome bin 1.06 resistant to FER has been validated by two linkage mapping studies using an F2 population and a RIL population, respectively [35,36]. The QTL intervals were 95.03 Mb (110.78–205.81 Mb) and 2 Mb (192–194 Mb), with corresponding PVEs of 5.45 and 5.76 (Table S3). Similarly, the QTL qFER4.04-4.05 has been reported in multiple studies, including two inbred line populations and one F2 population [25,35,37]. The GWAS results from the two natural populations identified one and three associated markers at 29.04 Mb and 29.96 Mb in bin4.04, with PVEs of 1.60, 3.65, 4.83, and 3.64 (Table S3). And the QTL detected in the F2 population spanned 35.53 Mb (32.89–68.42 Mb), covering part of both qFER4.04–4.05 and qFER4.05, which were identified in the present study, with a PVE of 4.46 (Table S3). In addition to being covered by the above-mentioned QTL, qFER4.05 has also been reported in at least one F2 population (PVE = 17.95) and one RIL population (PVE = 2.78) (Table S3) [14,35,38]. These QTLs were repeatedly detected across different environments in independent studies, indicating that they are relatively stable QTLs. For GER resistance, the locus on chromosome bin 2.09 has been reported by two linkage mapping studies and one association mapping study using one RIL population and two DH populations [10,31,39]. The intervals from linkage mapping were 12.59 Mb (220.44–233.03 Mb, B73_V3) and 4.19 Mb (225.87–230.06 Mb), which partially overlapped with qGER2.09 in this study, with corresponding PVEs of 29.40 and 6.90 (Table S3). The marker identified by GWAS was located at 238.01 Mb, with a PVE of 2.84 (Table S3). Another linkage mapping study using an RIL population detected a QTL on bin 4.02–4.05 spanning 129.66 Mb (5.87–135.53 Mb), which completely covered the two QTLs qGER4.05-1 and qGER4.05-2 identified in this study, with a PVE of 11.00 (Table S3) [10]. In contrast, a separate linkage mapping study using an RIL population detected a QTL on bin 4.05 spanning 51.52 Mb (24.28–75.54 Mb), which shared a 16.96 Mb overlapping region (58.58–75.54 Mb) with qGER4.05-1 in the present study, with a PVE of 11.00 (Table S3) [29]. And this QTL was detected in three distinct environments, suggesting that it is a stable QTL. Surprisingly, the QTL qGER4.06 detected in this study has not been reported in previous studies, suggesting new resistant loci for GER resistance. A promising strategy for enhancing the durability of ear rot resistance is the pyramiding of multiple resistance genes into elite inbred lines to develop multi-resistant cultivars. In this context, the novel QTLs identified here represent promising candidates for future breeding programs aimed at achieving broad-spectrum resistance. Their integration, particularly alongside the stable, co-localized FER/GER QTLs on chromosome 4, could provide valuable donor resources and contribute to the development of more resilient maize varieties.
On the other hand, a few studies simultaneously conducted phenotype identification and QTL mapping for FER and GER resistance at the same location. Proverbially, infections caused by pathogens of maize ear rot are complex and diverse because of their diverse pathogenic infection pathways and the sensitivity to the environmental conditions [35]. This study simultaneously investigated the underlying QTL resistances to both FER and GER under shared environmental conditions. By cultivating two distinct mapping populations at the same location and time and employing artificial inoculation, we ensured that both populations experienced nearly identical post-inoculation conditions. This design enhances the reliability of directly comparing the genetic architectures of FER and GER resistance. Under these standardized conditions, three QTLs for FER and four for GER were detected. Notably, a QTL on bin 4.05 was identified for both diseases. This genomic region has been frequently associated with resistance in previous studies targeting either FER or GER [10,14,25,29,35,37,38], suggesting that resistant loci on bin 4.05 might be resistance hotspots for both FER and GER. Furthermore, the specific QTLs qFER4.05 and qGER4.05-1 were found to overlap within a 58.58–71.34 Mb interval on bin 4.05. This co-localization strongly indicates the presence of a gene or cluster of genes within this region that confers resistance to both pathogens. Such a locus would be highly valuable for maize breeding programs aimed at pyramiding multiple disease resistance genes. Therefore, we selected this overlapping region for fine mapping. Subsequent genetic analysis identified 18 candidate genes within this interval that are potentially involved in the defense responses against FER and GER, providing a focused set of targets for subsequent functional validation.
Plant immune response was activated by the perception of pathogen-associated molecular patterns (PAMPs) or effector proteins, and this process was mediated by pattern-recognition receptors (PRRs) and nucleotide-binding and leucine-rich repeat domain-containing receptors (NLRs). Plant R-genes, which include the leucine-rich repeat (LRR) and leucine-rich repeat receptor-like kinase (LRR-RLK) gene families, the main type of proteins encoded by which are NLRs, are known to regulate plant resistance against various biotic stresses. Two LRR-RLKs (Zm00001d050074 and Zm00001d050077) and one LRR gene (Zm00001d050166) were located in this region, which have been reported to regulate disease resistance in gramineae plants [40,41,42,43]. Notably, a recent study indicated that the LRR-RLK genes were potentially involved in resistance to F. verticillioides infection in maize [44].
Zm00001d050147 encodes a remorin protein in this region. Two maize remorins, ZmREM6.3 and ZmREM1.3, have been demonstrated to exhibit resistance against Northern Corn Leaf Blight (NCLB) and Southern Corn Rust (SCR), respectively, likely via SA/JA-mediated defense signaling pathways [45,46]. The presence of a remorin in our candidate interval suggests a possible conserved role for this protein family in broad-spectrum disease resistance in maize.
Furthermore, Zm00001d050169 and Zm00001d050170 were annotated as cytochrome P450 monooxygenases. This class of enzymes is directly relevant to F. graminearum defense; a wheat cytochrome P450 was shown to enhance resistance to deoxynivalenol (DON), a key mycotoxin and virulence factor produced by this pathogen during Fusarium Head Blight [47]. Given that F. graminearum is also the causal agent of GER in maize, these cytochrome P450s are compelling candidates for mediating resistance to the fungus or its toxins. This group also includes a gene, Zm00001d050021, for abscisic acid 8′-hydroxylase, which is itself a cytochrome P450 monooxygenase [48,49], linking a key hormone regulatory pathway to the cytochrome P450 activity in this locus.
The wall-associated receptor kinases (WAKs) and WAK-likes (WAKLs) have been reported to be associated with resistance to plant diseases, such as NCLB, maize Gibberella Stalk Rot (GSR) and Head Smut (HS), wheat rust, Fusarium Crown Rot (FCR) and Sharp Eyespot, Barley Stripe (BS), and Rice Blast (RB) [50,51,52,53,54,55,56]. The candidate gene Zm00001d050164 in this region encoded a precursor of WAKL20, which might be related to resistance to maize ear rot [55,56]. Moreover, four genes (Zm00001d050055, Zm00001d050082, Zm00001d050103, and Zm00001d050149) in this region encoded glycine-rich cell-wall structural protein-like, pectinesterase, trichome birefringence-like protein, and precursor of exopolygalacturonase, respectively, and might regulate the defense against pathogens by altering the structure of the cell wall or interfering with the hypersensitive defense response [57,58,59,60,61]. Another candidate gene, Zm00001d050178, encoded a protein that was homologous to the N-terminal of Xylanase inhibitors, which have been reported to be associated with resistance to wheat FHB [62]. Zm00001d050020, Zm00001d050032, and Zm00001d050059 encoded proteins that are related to post-translational glycosylation and methylation modifications, and these post-translational modifications have been reported to regulate disease resistance in maize, rice, and wheat [63,64,65]. Zm00001d050156 encoded a pentatricopeptide repeat-containing protein (PPR), while the PPRs have been reported to regulate plant responses to abiotic stresses in rice [66]. And the Zm00001d050095 encoded Exo70 exocyst complex subunit, which has been reported to participate in rice immunity [67].
The tissue-specific expression analysis and the qRT-PCR results of candidate genes (including LRR-RLK and WAKL family members) under Fusarium stress supplemented the functional exploration of maize ear rot resistance-related genes. Among them, Zm00001d050164 (a WAKL gene) and Zm00001d050095 showed significant expression differences between resistant and susceptible lines at 6 hpi. WAKL genes are key in plant biotic stress responses by mediating cell-wall signal transduction, so Zm00001d050164 may participate in the early recognition of ear rot pathogens. Zm00001d050095 was up-regulated in resistant inbred lines after inoculation, indicating it may be closely related to maize resistance against ear rot. Consistent with tissue-specific expression results, Zm00001d050164 was slightly more expressed in R227′s endosperm and S121′s cobs, while Zm00001d050095 had no obvious tissue specificity. Their expression differences under stress are closely related to material resistance, suggesting they may play a direct role in whole-plant resistance responses to ear rot.
Notably, the other candidate genes showed no significant expression differences between the inoculated and control groups, or between resistant and susceptible lines. This may be due to three reasons: these genes are not involved in the early response to ear rot pathogens; their expression is regulated by unmet environmental or physiological conditions; or their function depends on post-transcriptional modification rather than transcriptional changes, which cannot be detected by qRT-PCR.
Future research should focus on the functional validation of the candidate genes within the identified QTLs, especially Zm00001d050164 and Zm00001d050095, which will be crucial to move from genetic association to a mechanistic understanding of ear rot resistance. A comprehensive understanding of the functions of these genes will not only illuminate the complex mechanisms of quantitative disease resistance in maize but will also directly empower marker-assisted breeding strategies. The translation of this knowledge into elite germplasm is a vital step toward developing durable resistance against devastating ear rot diseases.

4. Materials and Methods

4.1. Plant Materials and Field Management

In the previous research, we identified two highly resistant inbred lines, R226 and R227, with resistance to FER and GER, respectively. These two inbred lines were used as the resistant parent in this study. Two highly susceptible inbred lines, S176 and S121, were selected to be the susceptible parents. Using R226 and S176, R227 and S121, two F2 populations (including 168 and 185 individuals, respectively) and their corresponding F2:3 families were constructed for QTL mapping. The parental lines, F1 hybrid lines, and F2 individuals were planted at two field trial locations, Chengdu and Xichang, in Sichuan Province, China. The corresponding F2:3 families, which were selected from highly resistant F2 individuals, were planted at Yingzhou, in Hainan Province, China. Each line was grown in single rows of 5 m, with 0.25 m spaces between plants within a row and a planting density of 67,000 plants/ha, and standard cultural practices were followed throughout the growth period. All plants were artificially bag-pollinated and inoculated with a pathogen spore suspension.

4.2. Pathogen Culture and Artificial Inoculation

The F. verticillioides and F. graminearum strains were isolated and stored by our laboratory, and they were used for artificial inoculation. Firstly, the pathogens were inoculated on a potato dextrose agar medium in plates and cultured in a dark incubator for 4–5 days at 25 °C until the hyphae filled the medium plates, and they were stored in the refrigerator at 4 °C for future use. Then, each plate with the pathogen was cut into fungal discs with a diameter of 0.5 cm, and 3 discs were suspended in 100 mL potato dextrose liquid medium before being shaken at 180 rpm for 10–15 days at 25 °C; then, the pathogen liquid was gathered and stored in the refrigerator at 4 °C for future use. Before artificial inoculation, the spores were collected after the hyphae were filtered, and a spore suspension with a concentration of 5 × 10⁶ spores/mL was prepared with sterile distilled water; tween-80 (Solarbio, Beijing, China) (2%) was added to the spore suspension and mixed, and the spores were ready for inoculation. The silk channel injection method, which more closely resembles natural infection of a non-wounded host plant, was used for artificial inoculation, and the best differentiation between resistant and susceptible genotypes was easier to obtain when inoculation occurred within a week after silking [2,68,69]. In this study, two days after artificial pollination, 2 mL of the prepared pathogen spore suspension was injected into the silk channel in two consecutive injections with a syringe. After inoculation, the wound was pinched gently with fingers to prevent the pathogen spore suspension from flowing out. At the maturation stage, maize ears were manually removed from the husks and harvested, ear rot incidence severity was surveyed, and resistance scales were evaluated.

4.3. Disease Evaluation

Individual plants were artificially inoculated with F. verticillioides and F. graminearum, and evaluated for their resistance to FER and GER at different field trial locations. An evaluation system with five grades (1, 3, 5, 7, and 9) was used to visually evaluate the severity of ear rot disease. Based on the size of the lesion area due to ear rot damage, grades 1, 3, 5, 7, and 9 represented 0 to 1%, 2 to 10%, 11 to 25%, 26 to 50%, and 51 to 100%, respectively, of damage. Each individual plant was independently rated at the maturation stage.

4.4. DNA Extraction, Library Construction, and Sequencing

Allele frequency estimates in BSA are dependent on the variation in segregant samples and sequencing technology. The variation due to segregant samples can be minimized by either increasing the number of segregants or the bulk size [70]. According to the phenotype of each population in multiple environments, the parental lines R226 and S176 and their F2 population, 22 resistant and 22 susceptible F2 individuals, which were resistant to FER and planted at Xichang, were selected to construct BSA pools. The parental lines R227 and S121 and their F2 populations, 27 resistant and 27 susceptible F2 individuals, which were resistant to GER and planted at Xichang, were selected to construct BSA pools. Genomic DNA was extracted individually by the high-throughput cetyltrimethylammonium bromide (CTAB) method, and an equal amount of the extraction from each individual was mixed to form resistant and susceptible DNA pools; the DNA extracted from parental lines was also prepared for library construction. All of these DNA samples were sent to Biomarker Technologies (Beijing, China) for re-sequencing. The DNA samples were randomly broken into 350 bp fragments using ultrasonic fragmentation, and each fragment was repaired at the end, and A was added at the 3′ end; sequencing adapters are added, purified, and PCR-amplified to complete the construction of the sequencing library. Libraries built for each pool were sequenced using Illumina HiSeq after passing the quality inspection. The raw sequencing data (whole-genome sequencing for bulked segregant analysis of FER and GER traits in Zea mays) have been deposited in the NCBI Sequence Read Archive (SRA) under the BioProject accession PRJNA1417795 (http://www.ncbi.nlm.nih.gov/bioproject/1417795, accessed on 2 February 2026), with the corresponding BioSample accessions SAMN55017278–SAMN55017285 and SRA accessions SRR37076531–SRR37076538. The data will be released to the public on 1 March 2026.

4.5. Data Processing and Analysis

For data analysis, we filtered out the low-quality reads, which included multiple alleles, fewer than 4 supporting reads, those consistent with a mixed pool, and susceptible pool loci that were not from the susceptible parent, and then we aligned the clean reads to the reference maize genome (Maize B73 RefGen_v4) by using the bwa software (version 0.7.17) [71]. Picard tools were used to exclude the mark duplicates, and the GATK was used for preprocessing, including local realignment and base recalibration to ensure the accuracy of detected SNPs [8]. Then, GATK was used for variant (SNP and InDel) calling, filtering, and obtaining the final set of variant loci [8]. The parents were used to filter polymorphic information.
The Euclidean distance (ED) algorithm, which was used to predict the ED between two vectors defined by the frequencies of the alternate and the reference alleles in the high and low bulks to identify the region of interest [34,72], was used to estimate the difference between the two mixed DNA pools using the following formula:
ED = ( A mut   A wt ) 2   +   ( C mut   C wt ) 2   + ( G mut     G wt ) 2 +   ( T mut     T wt ) 2
where Amut, Cmut, Gmut, and Tmut were used to represent frequencies of A, C, G, and T bases in the resistant pool, while Awt, Cwt, Gwt, and Twt were used to represent the frequencies in the susceptible pool, respectively. The ED value represents the size of the difference between the two DNA pools. Higher ED values indicate larger allelic frequency differences between the two extreme bulks and thus stronger genetic effects of the corresponding QTL.
The significance threshold of ED greater than or equal to 0.25 was derived from the fitted values of all high-quality SNPs following established methods in BSA [34]. This threshold represents the 95th percentile of the ED distribution under the null hypothesis of no association [34].

4.6. Pathway Enrichment Analysis

Genes usually interact with each other to play roles in certain biological functions. Pathway-based analysis usually helps to further understand genes’ biological functions, and the pathway enrichment analysis identified significantly enriched metabolic pathways or signal transduction pathways in genes in defined QTLs. KEGG, which was the major public pathway-related database [73], was used to perform the pathway enrichment analysis for genes in the identified QTLs according to the p-value.

4.7. Tissue-Specific Expression Analysis

To clarify the spatial expression characteristics of candidate genes in maize, we performed tissue-specific expression analysis using RT-PCR. The two resistant lines (R226 and R227) and susceptible lines (S176 and S121) were selected, key tissues (roots, stems, leaves, tassels, stigmas, embryos, endosperm, and cobs) at 15 days after pollination were collected from healthy plants (3 biological replicates each), immediately frozen in liquid nitrogen, and stored at −80 °C. Total RNA was extracted using Trizol reagent (Invitrogen, Carlsbad, CA, USA), and its integrity and purity were verified; cDNA was synthesized via reverse transcription. The concentration of PCR products of the internal reference gene GAPDH was used for normalization to ensure equal loading of cDNA templates, followed by RT-PCR amplification of candidate genes. Primers used for RT-PCR and qRT-PCR were provided in Supplementary Materials Table S4.

4.8. qRT-PCR Analysis

To verify the expression dynamics of candidate genes under pathogen stress, qRT-PCR analysis was performed. The resistant lines R227 and susceptible lines S121 were selected, maize ears were inoculated with F. graminearum (1 × 10⁶ conidia/mL) and sterile water (blank control) at 15 days after pollination. Ear samples were collected at 0 h (CK), 2 h, and 6 h post-inoculation and stored at −80 °C. Total RNA extraction and cDNA synthesis followed the same protocol as above; specific primers were designed and verified, and qRT-PCR was conducted using Taq ProUniversal SYBR qPCR Master Mix (Vazyme, Nanjing, China). The 2−ΔΔCt method was used to calculate relative expression levels, with TTEST for significance analysis (p < 0.05).

5. Conclusions

In conclusion, we employed BSA on two F2 mapping populations to identify QTLs conferring resistance to FER and GER and identified five and eleven QTLs for FER and GER, respectively. We found that chromosome 4 was identified as a major hotspot for resistance to both diseases, and the co-localization of the FER QTL (qFER4.05) and GER QTL (qGER4.05-1) within a 58.58–71.34 Mb interval on bin 4.05, suggesting a potential locus for broad-spectrum resistance. Within this overlapping region, we identified 18 high-confidence candidate genes, including several genes that have established roles in plant defense. The tissue-specific expression analysis and the qRT-PCR results of candidate genes showed that the Zm00001d050164 (a WAKL family gene) and Zm00001d050095 had significant expression differences between resistant and susceptible lines, and Zm00001d050095 was up-regulated in resistant lines after pathogen inoculation, which is closely related to the immune response of maize, further supporting the potential role of these two genes in resisting ear rot. Our results reveal novel resistance QTLs, provide a valuable set of candidate genes for functional validation, and advance the understanding of the genetic architecture of ear rot resistance, providing critical resources for marker-assisted breeding to develop maize hybrids with durable resistance to both FER and GER.

Supplementary Materials

The following supporting information can be downloaded at: https://www.mdpi.com/article/10.3390/plants15091401/s1. Figure S1. The distribution of ED_values for high-quality SNPs to the FER resistance on different chromosomes. The ED value represents the size of the difference between the FER_S and FER_R DAN pools. The red dashed line represents the correlation threshold, which was calculated as 0.25. Figure S2. The distribution of ED_values for high-quality SNPs to the GER resistance on different chromosomes. The ED value represents the size of the difference between the GER_S and GER_R DAN pools. The red dashed line represents the correlation threshold, which was calculated as 0.25. Figure S3. The KEGG_enrichment for whole genes in FER QTL regions. Figure S4. The KEGG_enrichment for whole genes in GER QTL regions. Table S1. Quality of whole-genome sequencing for the susceptible and resistant bulks and their parental lines. Table S2. Filter the high-quality loci for the sequencing data. Table S3. Synthetic Table of QTL Overlap with Previously Reported Maize Ear Rot Resistance QTLs. Table S4. Primers used for RT-PCR and qRT-PCR detection of candidate genes.

Author Contributions

Conceptualization, H.Z. and X.L.; methodology, H.Z.; software, C.Z. and L.L. (Ling Li); validation, W.L., L.D. and L.C.; formal analysis, W.C. and Z.Z.; investigation, H.Z., W.L., and L.D.; resources, X.L. and L.C.; data curation, L.L. (Lin Li) and R.X.; writing—original draft preparation, H.Z.; writing—review and editing, H.Z. and W.C.; visualization, H.Z. and W.C.; supervision, X.L. and L.C.; project administration, H.Z. and L.C.; funding acquisition, H.Z., W.C., L.C. and X.L. All authors have read and agreed to the published version of the manuscript.

Funding

This research was supported by the Natural Science Foundation of Sichuan Province (No. 2023NSFSC1263), the Sichuan Academy of Agricultural Sciences “Original Research Program 2035” (No. YSCX2035-003), the earmarked fund for the China Agriculture Research System (CARS) (No. CARS-02), and the “1+9” Key Scientific and Technological Project of Sichuan Academy of Agricultural Sciences (No. 1+9KJGG006).

Data Availability Statement

All relevant data are within the manuscript and its Supplementary Files.

Conflicts of Interest

The authors declare no conflicts of interest.

References

  1. Missmer, S.A.; Suarez, L.; Felkner, M.; Wang, E.; Merrill, A.H., Jr.; Rothman, K.J.; Hendricks, K.A. Exposure to fumonisins and the occurrence of neural tube defects along the Texas-Mexico border. Environ. Health Perspect. 2006, 114, 237–241. [Google Scholar] [CrossRef]
  2. Munkvold, G.P.; Desjardins, A.E. Fumonisins in Maize: Can We Reduce Their Occurrence? Plant Dis. 1997, 81, 556–565. [Google Scholar] [CrossRef]
  3. Mesterházy, Á.; Lemmens, M.; Reid, L.M. Breeding for resistance to ear rots caused by Fusarium spp. in maize—A review. Plant Breed. 2012, 131, 1–19. [Google Scholar] [CrossRef]
  4. Kebebe, A.Z.; Reid, L.M.; Zhu, X.; Wu, J.; Woldemariam, T.; Voloaca, C.; Xiang, K. Relationship between kernel drydown rate and resistance to gibberella ear rot in maize. Euphytica 2015, 201, 79–88. [Google Scholar] [CrossRef]
  5. Morales-Rodriguez, I.; Yanez-Morales, M.; Silva-Rojas, H.V.; Garcia-de-Los-Santos, G.; Guzman-de-Pena, D.A. Biodiversity of Fusarium species in Mexico associated with ear rot in maize, and their identification using a phylogenetic approach. Mycopathologia 2007, 163, 31–39. [Google Scholar] [CrossRef]
  6. Talas, F.; McDonald, B.A. Significant variation in sensitivity to a DMI fungicide in field populations of Fusarium graminearum. Plant Pathol. 2015, 64, 664–670. [Google Scholar] [CrossRef]
  7. Munkvold, G.P. Cultural and genetic approaches to managing mycotoxins in maize. Annu. Rev. Phytopathol. 2003, 41, 99–116. [Google Scholar] [CrossRef] [PubMed]
  8. McKenna, A.; Hanna, M.; Banks, E.; Sivachenko, A.; Cibulskis, K.; Kernytsky, A.; Garimella, K.; Altshuler, D.; Gabriel, S.; Daly, M.; et al. The Genome Analysis Toolkit: A MapReduce framework for analyzing next-generation DNA sequencing data. Genome Res. 2010, 20, 1297–1303. [Google Scholar] [CrossRef]
  9. Collard, B.C.; Mackill, D.J. Marker-assisted selection: An approach for precision plant breeding in the twenty-first century. Philos. Trans. R. Soc. B Biol. Sci. 2008, 363, 557–572. [Google Scholar] [CrossRef] [PubMed]
  10. Ali, M.L.; Taylor, J.H.; Jie, L.; Sun, G.; William, M.; Kasha, K.J.; Reid, L.M.; Pauls, K.P. Molecular mapping of QTLs for resistance to Gibberella ear rot, in corn, caused by Fusarium graminearum. Genome 2005, 48, 521–533. [Google Scholar] [CrossRef]
  11. Lanubile, A.; Maschietto, V.; Borrelli, V.M.; Stagnati, L.; Logrieco, A.F.; Marocco, A. Molecular Basis of Resistance to Fusarium Ear Rot in Maize. Front. Plant Sci. 2017, 8, 1774. [Google Scholar] [CrossRef] [PubMed]
  12. Yang, Q.; Balint-Kurti, P.; Xu, M. Quantitative Disease Resistance: Dissection and Adoption in Maize. Mol. Plant 2017, 10, 402–413. [Google Scholar] [CrossRef]
  13. Santiago, R.; Cao, A.; Malvar, R.A.; Butron, A. Genomics of Maize Resistance to Fusarium Ear Rot and Fumonisin Contamination. Toxins 2020, 12, 431. [Google Scholar] [CrossRef] [PubMed]
  14. Chen, J.; Ding, J.; Li, H.; Li, Z.; Sun, X.; Li, J.; Wang, R.; Dai, X.; Dong, H.; Song, W.; et al. Detection and verification of quantitative trait loci for resistance to Fusarium ear rot in maize. Mol. Breed. 2012, 30, 1649–1656. [Google Scholar] [CrossRef]
  15. Maschietto, V.; Colombi, C.; Pirona, R.; Pea, G.; Strozzi, F.; Marocco, A.; Rossini, L.; Lanubile, A. QTL mapping and candidate genes for resistance to Fusarium ear rot and fumonisin contamination in maize. BMC Plant Biol. 2017, 17, 20. [Google Scholar] [CrossRef]
  16. Ding, J.; Wang, X.; Chander, S.; Yan, J.; Li, J. QTL mapping of resistance to Fusarium ear rot using a RIL population in maize. Mol. Breed. 2008, 22, 395–403. [Google Scholar] [CrossRef]
  17. Li, Z.M.; Ding, J.Q.; Wang, R.X.; Chen, J.F.; Sun, X.D.; Chen, W.; Song, W.B.; Dong, H.F.; Dai, X.D.; Xia, Z.L.; et al. A new QTL for resistance to Fusarium ear rot in maize. J. Appl. Genet. 2011, 52, 403–406. [Google Scholar] [CrossRef]
  18. Yang, Q.; Zhang, D.; Xu, M. A sequential quantitative trait locus fine-mapping strategy using recombinant-derived progenyF. J. Integr. Plant Biol. 2012, 54, 228–237. [Google Scholar] [CrossRef]
  19. Jiang, C.; Zeng, Z.B. Multiple trait analysis of genetic mapping for quantitative trait loci. Genetics 1995, 140, 1111–1127. [Google Scholar] [CrossRef]
  20. Ding, J.; Zhang, L.; Chen, J.; Li, X.; Li, Y.; Cheng, H.; Huang, R.; Zhou, B.; Li, Z.; Wang, J.; et al. Genomic Dissection of Leaf Angle in Maize (Zea mays L.) Using a Four-Way Cross Mapping Population. PLoS ONE 2015, 10, e0141619. [Google Scholar] [CrossRef]
  21. Zila, C.T.; Samayoa, L.F.; Santiago, R.; Butron, A.; Holland, J.B. A genome-wide association study reveals genes associated with fusarium ear rot resistance in a maize core diversity panel. G3 Genes Genomes Genet. 2013, 3, 2095–2104. [Google Scholar] [CrossRef]
  22. Butron, A.; Santiago, R.; Cao, A.; Samayoa, L.F.; Malvar, R.A. QTLs for Resistance to Fusarium Ear Rot in a Multiparent Advanced Generation Intercross (MAGIC) Maize Population. Plant Dis. 2019, 103, 897–904. [Google Scholar] [CrossRef] [PubMed]
  23. Yao, L.; Li, Y.; Ma, C.; Tong, L.; Du, F.; Xu, M. Combined genome-wide association study and transcriptome analysis reveal candidate genes for resistance to Fusarium ear rot in maize. J. Integr. Plant Biol. 2020, 62, 1535–1551. [Google Scholar] [CrossRef] [PubMed]
  24. Ayesiga, S.B.; Rubaihayo, P.; Oloka, B.M.; Dramadri, I.O.; Sserumaga, J.P. Genome-wide association study and pathway analysis to decipher loci associated with Fusarium ear rot resistance in tropical maize germplasm. Genet. Resour. Crop Evol. 2024, 71, 2435–2448. [Google Scholar] [CrossRef] [PubMed]
  25. Chen, J.; Shrestha, R.; Ding, J.; Zheng, H.; Mu, C.; Wu, J.; Mahuku, G. Genome-Wide Association Study and QTL Mapping Reveal Genomic Loci Associated with Fusarium Ear Rot Resistance in Tropical Maize Germplasm. G3 Genes Genomes Genet. 2016, 6, 3803–3815. [Google Scholar] [CrossRef]
  26. Miedaner, T.; Boeven, A.L.G.; Gaikpa, D.S.; Kistner, M.B.; Grote, C.P. Genomics-Assisted Breeding for Quantitative Disease Resistances in Small-Grain Cereals and Maize. Int. J. Mol. Sci. 2020, 21, 9717. [Google Scholar] [CrossRef]
  27. Kebede, A.Z.; Woldemariam, T.; Reid, L.M.; Harris, L.J. Quantitative trait loci mapping for Gibberella ear rot resistance and associated agronomic traits using genotyping-by-sequencing in maize. Theor. Appl. Genet. 2016, 129, 17–29. [Google Scholar] [CrossRef]
  28. Wen, J.; Shen, Y.; Xing, Y.; Wang, Z.; Han, S.; Li, S.; Yang, C.; Hao, D.; Zhang, Y. QTL mapping of resistance to Gibberella ear rot in maize. Mol. Breed. 2020, 40, 94. [Google Scholar] [CrossRef]
  29. Zhou, G.; Li, S.; Ma, L.; Wang, F.; Jiang, F.; Sun, Y.; Ruan, X.; Cao, Y.; Wang, Q.; Zhang, Y.; et al. Mapping and Validation of a Stable Quantitative Trait Locus Conferring Maize Resistance to Gibberella Ear Rot. Plant Dis. 2021, 105, 1984–1991. [Google Scholar] [CrossRef]
  30. Yuan, G.; Li, Y.; He, D.; Shi, J.; Yang, Y.; Du, J.; Zou, C.; Ma, L.; Pan, G.; Shen, Y. A Combination of QTL Mapping and GradedPool-Seq to Dissect Genetic Complexity for Gibberella Ear Rot Resistance in Maize Using an IBM Syn10 DH Population. Plant Dis. 2023, 107, 1115–1121. [Google Scholar] [CrossRef]
  31. Gaikpa, D.S.; Kessel, B.; Presterl, T.; Ouzunova, M.; Galiano-Carneiro, A.L.; Mayer, M.; Melchinger, A.E.; Schon, C.C.; Miedaner, T. Exploiting genetic diversity in two European maize landraces for improving Gibberella ear rot resistance using genomic tools. Theor. Appl. Genet. 2021, 134, 793–805. [Google Scholar] [CrossRef]
  32. Yuan, G.; He, D.; Shi, J.; Li, Y.; Yang, Y.; Du, J.; Zou, C.; Ma, L.; Gao, S.; Pan, G.; et al. Genome-Wide Association Study Discovers Novel Germplasm Resources and Genetic Loci with Resistance to Gibberella Ear Rot Caused by Fusarium graminearum. Phytopathology 2023, 113, 1317–1324. [Google Scholar] [CrossRef]
  33. Zhou, G.; Ma, L.; Zhao, C.; Xie, F.; Xu, Y.; Wang, Q.; Hao, D.; Gao, X. Genome-wide association study and molecular marker development for susceptibility to Gibberella ear rot in maize. Theor. Appl. Genet. 2024, 137, 222. [Google Scholar] [CrossRef] [PubMed]
  34. Hill, J.T.; Demarest, B.L.; Bisgrove, B.W.; Gorsi, B.; Su, Y.C.; Yost, H.J. MMAPPR: Mutation mapping analysis pipeline for pooled RNA-seq. Genome Res. 2013, 23, 687–697. [Google Scholar] [CrossRef] [PubMed]
  35. Wen, J.; Shen, Y.; Xing, Y.; Wang, Z.; Han, S.; Li, S.; Yang, C.; Hao, D.; Zhang, Y. QTL Mapping of Fusarium Ear Rot Resistance in Maize. Plant Dis. 2021, 105, 558–565. [Google Scholar] [CrossRef]
  36. Xia, Y.; Wang, B.; Zhu, L.; Wu, W.; Sun, S.; Zhu, Z.; Li, X.; Weng, J.; Duan, C. Identification of a Fusarium ear rot resistance gene in maize by QTL mapping and RNA sequencing. Front. Plant Sci. 2022, 13, 954546. [Google Scholar] [CrossRef]
  37. Guo, Z.; Zou, C.; Liu, X.; Wang, S.; Li, W.X.; Jeffers, D.; Fan, X.; Xu, M.; Xu, Y. Complex Genetic System Involved in Fusarium Ear Rot Resistance in Maize as Revealed by GWAS, Bulked Sample Analysis, and Genomic Prediction. Plant Dis. 2020, 104, 1725–1735. [Google Scholar] [CrossRef]
  38. Wu, Y.; Zhou, Z.; Dong, C.; Chen, J.; Ding, J.; Zhang, X.; Mu, C.; Chen, Y.; Li, X.; Li, H.; et al. Linkage mapping and genome-wide association study reveals conservative QTL and candidate genes for Fusarium rot resistance in maize. BMC Genom. 2020, 21, 357. [Google Scholar] [CrossRef] [PubMed]
  39. Martin, M.; Miedaner, T.; Schwegler, D.D.; Kessel, B.; Ouzunova, M.; Dhillon, B.S.; Schipprack, W.; Utz, H.F.; Melchinger, A.E. Comparative Quantitative Trait Loci Mapping for Gibberella Ear Rot Resistance and Reduced Deoxynivalenol Contamination across Connected Maize Populations. Crop Sci. 2012, 52, 32–43. [Google Scholar] [CrossRef]
  40. Fang, N.; Jia, C.; Chen, R.; An, J.; Kang, Z.; Liu, J. The wheat CC-NBS-LRR protein TaRGA3 confers resistance to stripe rust by suppressing ascorbate peroxidase 6 activity. Plant Physiol. 2024, 197, kiae603. [Google Scholar] [CrossRef]
  41. Wang, S.; Wang, X.; Zhang, R.; Liu, Q.; Sun, X.; Wang, J.; Wang, Y.; Xing, J.; Liu, Y.; Zhao, Y.; et al. RppM, Encoding a Typical CC-NBS-LRR Protein, Confers Resistance to Southern Corn Rust in Maize. Front. Plant Sci. 2022, 13, 951318. [Google Scholar] [CrossRef] [PubMed]
  42. Zhang, H.; Chen, C.; Li, L.; Tan, X.; Wei, Z.; Li, Y.; Li, J.; Yan, F.; Chen, J.; Sun, Z. A rice LRR receptor-like protein associates with its adaptor kinase OsSOBIR1 to mediate plant immunity against viral infection. Plant Biotechnol. J. 2021, 19, 2319–2332. [Google Scholar] [CrossRef]
  43. Wang, Y.; Xu, Y.; Gupta, S.; Zhou, Y.; Wallwork, H.; Zhou, G.; Broughton, S.; Zhang, X.Q.; Tan, C.; Westcott, S.; et al. Fine mapping QSc.VR4, an effective and stable scald resistance locus in barley (Hordeum vulgare L.), to a 0.38-Mb region enriched with LRR-RLK and GLP genes. Theor. Appl. Genet. 2020, 133, 2307–2321. [Google Scholar] [CrossRef] [PubMed]
  44. Gao, Y.; Qu, Q.; Liu, N.; Sun, M.; Liu, X.; Cao, Z.; Dong, J. Genome identification of the LRR-RLK gene family in maize (Zea mays) and expression analysis in response to Fusarium verticillioides infection. BMC Plant Biol. 2025, 25, 524. [Google Scholar] [CrossRef]
  45. Jamann, T.M.; Luo, X.; Morales, L.; Kolkman, J.M.; Chung, C.L.; Nelson, R.J. A remorin gene is implicated in quantitative disease resistance in maize. Theor. Appl. Genet. 2016, 129, 591–602. [Google Scholar] [CrossRef]
  46. Wang, S.; Chen, Z.; Tian, L.; Ding, Y.; Zhang, J.; Zhou, J.; Liu, P.; Chen, Y.; Wu, L. Comparative proteomics combined with analyses of transgenic plants reveal ZmREM1.3 mediates maize resistance to southern corn rust. Plant Biotechnol. J. 2019, 17, 2153–2168. [Google Scholar] [CrossRef]
  47. Gunupuru, L.R.; Arunachalam, C.; Malla, K.B.; Kahla, A.; Perochon, A.; Jia, J.; Thapa, G.; Doohan, F.M. A wheat cytochrome P450 enhances both resistance to deoxynivalenol and grain yield. PLoS ONE 2018, 13, e0204992. [Google Scholar] [CrossRef]
  48. Saito, S.; Hirai, N.; Matsumoto, C.; Ohigashi, H.; Ohta, D.; Sakata, K.; Mizutani, M. Arabidopsis CYP707As encode (+)-abscisic acid 8′-hydroxylase, a key enzyme in the oxidative catabolism of abscisic acid. Plant Physiol. 2004, 134, 1439–1449. [Google Scholar] [CrossRef] [PubMed]
  49. Krochko, J.E.; Abrams, G.D.; Loewen, M.K.; Abrams, S.R.; Cutler, A.J. (+)-Abscisic acid 8′-hydroxylase is a cytochrome P450 monooxygenase. Plant Physiol. 1998, 118, 849–860. [Google Scholar] [CrossRef]
  50. He, M.; Zhang, S.; Tang, C.; Yan, Y.; Zhang, Z.; Wang, J.; Wang, N.; Wang, X. TaWAKL8-2B, a wall-associated receptor-like kinase, mediates wheat rust resistance by linalool and ROS accumulation. Stress Biol. 2025, 5, 50. [Google Scholar] [CrossRef]
  51. Qi, H.; Guo, F.; Lv, L.; Zhu, X.; Zhang, L.; Yu, J.; Wei, X.; Zhang, Z. The Wheat Wall-Associated Receptor-Like Kinase TaWAK-6D Mediates Broad Resistance to Two Fungal Pathogens Fusarium pseudograminearum and Rhizoctonia cerealis. Front. Plant Sci. 2021, 12, 758196. [Google Scholar] [CrossRef] [PubMed]
  52. Li, H.; Zhou, S.Y.; Zhao, W.S.; Su, S.C.; Peng, Y.L. A novel wall-associated receptor-like protein kinase gene, OsWAK1, plays important roles in rice blast disease resistance. Plant Mol. Biol. 2009, 69, 337–346. [Google Scholar] [CrossRef]
  53. Yang, P.; Scheuermann, D.; Kessel, B.; Koller, T.; Greenwood, J.R.; Hurni, S.; Herren, G.; Zhou, S.; Marande, W.; Wicker, T.; et al. Alleles of a wall-associated kinase gene account for three of the major northern corn leaf blight resistance loci in maize. Plant J. 2021, 106, 526–535. [Google Scholar] [CrossRef]
  54. Zuo, W.; Chao, Q.; Zhang, N.; Ye, J.; Tan, G.; Li, B.; Xing, Y.; Zhang, B.; Liu, H.; Fengler, K.A.; et al. A maize wall-associated kinase confers quantitative resistance to head smut. Nat. Genet. 2015, 47, 151–157. [Google Scholar] [CrossRef] [PubMed]
  55. Zhong, C.; Li, W.; Zhang, X.; Zhang, D.; Wen, Z.; Song, W.; Jiang, Z.; Gao, Z.; Guo, H.; Bi, G.; et al. A cell wall-associated kinase phosphorylates NLR immune receptor to negatively regulate resistosome formation. Nat. Plants 2025, 11, 561–579. [Google Scholar] [CrossRef]
  56. Zuo, N.; Bai, W.Z.; Wei, W.Q.; Yuan, T.L.; Zhang, D.; Wang, Y.Z.; Tang, W.H. Fungal CFEM effectors negatively regulate a maize wall-associated kinase by interacting with its alternatively spliced variant to dampen resistance. Cell Rep. 2022, 41, 111877. [Google Scholar] [CrossRef]
  57. Cao, Y.; Zhang, Y.; Chen, Y.; Yu, N.; Liaqat, S.; Wu, W.; Chen, D.; Cheng, S.; Wei, X.; Cao, L.; et al. OsPG1 Encodes a Polygalacturonase that Determines Cell Wall Architecture and Affects Resistance to Bacterial Blight Pathogen in Rice. Rice 2021, 14, 36. [Google Scholar] [CrossRef]
  58. He, Y.; Karre, S.; Johal, G.S.; Christensen, S.A.; Balint-Kurti, P. A maize polygalacturonase functions as a suppressor of programmed cell death in plants. BMC Plant Biol. 2019, 19, 310. [Google Scholar] [CrossRef]
  59. Ferrari, S.; Galletti, R.; Pontiggia, D.; Manfredini, C.; Lionetti, V.; Bellincampi, D.; Cervone, F.; De Lorenzo, G. Transgenic expression of a fungal endo-polygalacturonase increases plant resistance to pathogens and reduces auxin sensitivity. Plant Physiol. 2008, 146, 669–681. [Google Scholar] [CrossRef] [PubMed]
  60. Ryser, U.; Schorderet, M.; Zhao, G.F.; Studer, D.; Ruel, K.; Hauf, G.; Keller, B. Structural cell-wall proteins in protoxylem development: Evidence for a repair process mediated by a glycine-rich protein. Plant J. 1997, 12, 97–111. [Google Scholar] [CrossRef]
  61. Gao, Y.; He, C.; Zhang, D.; Liu, X.; Xu, Z.; Tian, Y.; Liu, X.H.; Zang, S.; Pauly, M.; Zhou, Y.; et al. Two Trichome Birefringence-Like Proteins Mediate Xylan Acetylation, Which Is Essential for Leaf Blight Resistance in Rice. Plant Physiol. 2017, 173, 470–481. [Google Scholar] [CrossRef]
  62. Lin, J.; Ruan, S.; Guo, Q.; Zhang, Y.; Fang, M.; Li, T.; Luo, G.; Tian, Z.; Zhang, Y.; Tandayu, E.; et al. Comprehensive genome-wide analysis of wheat xylanase inhibitor protein (XIP) genes: Unveiling their role in Fusarium head blight resistance and plant immune mechanisms. BMC Plant Biol. 2024, 24, 462. [Google Scholar] [CrossRef]
  63. Wang, M.; Zhu, X.; Wang, K.; Lu, C.; Luo, M.; Shan, T.; Zhang, Z. A wheat caffeic acid 3-O-methyltransferase TaCOMT-3D positively contributes to both resistance to sharp eyespot disease and stem mechanical strength. Sci. Rep. 2018, 8, 6543. [Google Scholar] [CrossRef]
  64. Yang, Q.; He, Y.; Kabahuma, M.; Chaya, T.; Kelly, A.; Borrego, E.; Bian, Y.; El Kasmi, F.; Yang, L.; Teixeira, P.; et al. A gene encoding maize caffeoyl-CoA O-methyltransferase confers quantitative resistance to multiple pathogens. Nat. Genet. 2017, 49, 1364–1372. [Google Scholar] [CrossRef]
  65. Tian, J.; Zhang, H.; Li, S.; Lin, Y.; Xiong, L.; Yuan, M. Precision editing of a susceptibility gene promoter to alter its methylation modification for engineering rice resilience to biotic and abiotic stresses. Plant Biotechnol. J. 2024, 22, 3082–3084. [Google Scholar] [CrossRef] [PubMed]
  66. Lu, K.; Li, C.; Guan, J.; Liang, W.H.; Chen, T.; Zhao, Q.Y.; Zhu, Z.; Yao, S.; He, L.; Wei, X.D.; et al. The PPR-Domain Protein SOAR1 Regulates Salt Tolerance in Rice. Rice 2022, 15, 62. [Google Scholar] [CrossRef]
  67. Hou, H.; Fang, J.; Liang, J.; Diao, Z.; Wang, W.; Yang, D.; Li, S.; Tang, D. OsExo70B1 Positively Regulates Disease Resistance to Magnaporthe oryzae in Rice. Int. J. Mol. Sci. 2020, 21, 7049. [Google Scholar] [CrossRef]
  68. Lanubile, A.; Pasini, L.; Marocco, A. Differential gene expression in kernels and silks of maize lines with contrasting levels of ear rot resistance after Fusarium verticillioides infection. J. Plant Physiol. 2010, 167, 1398–1406. [Google Scholar] [CrossRef] [PubMed]
  69. Campos-Bermudez, V.A.; Fauguel, C.M.; Tronconi, M.A.; Casati, P.; Presello, D.A.; Andreo, C.S. Transcriptional and metabolic changes associated to the infection by Fusarium verticillioides in maize inbreds with contrasting ear rot resistance. PLoS ONE 2013, 8, e61580. [Google Scholar] [CrossRef] [PubMed]
  70. Magwene, P.M.; Willis, J.H.; Kelly, J.K. The statistics of bulk segregant analysis using next generation sequencing. PLoS Comput. Biol. 2011, 7, e1002255. [Google Scholar] [CrossRef]
  71. Li, H.; Durbin, R. Fast and accurate short read alignment with Burrows-Wheeler transform. Bioinformatics 2009, 25, 1754–1760. [Google Scholar] [CrossRef] [PubMed]
  72. de la Fuente Canto, C.; Vigouroux, Y. Evaluation of nine statistics to identify QTLs in bulk segregant analysis using next generation sequencing approaches. BMC Genom. 2022, 23, 490. [Google Scholar] [CrossRef] [PubMed]
  73. Kanehisa, M.; Araki, M.; Goto, S.; Hattori, M.; Hirakawa, M.; Itoh, M.; Katayama, T.; Kawashima, S.; Okuda, S.; Tokimatsu, T.; et al. KEGG for linking genomes to life and the environment. Nucleic Acids Res. 2008, 36, D480–D484. [Google Scholar] [CrossRef] [PubMed]
Figure 1. Phenotypic diversity and frequency distribution of resistance to Fusarium ear rot (FER) at harvest. Phenotypic diversity of resistance to FER for the two parental inbred lines and their F1 hybrids (A), frequency distribution of resistance to FER for the resistant parental inbred line (B), the susceptible parental inbred line (C), the F1 hybrids (D), and the F2 population (E), respectively, and the phenotypic survey results for the whole generations of the QTL mapping population to FER resistance (F).
Plants 15 01401 g001
Figure 2. Phenotypic diversity and frequency distribution of resistance to Gibberella ear rot (GER) at harvest. Phenotypic diversity of resistance to GER for the two parental inbred lines and their F1 hybrids (A), frequency distribution of resistance to GER for the resistant parental inbred line (B), the susceptible parental inbred line (C), the F1 hybrids (D), and the F2 population (E), respectively, and the phenotypic survey results for the whole generations of the QTL mapping population to GER resistance (F).
Plants 15 01401 g002
Figure 3. The distribution of ED_values for high-quality SNPs to the FER (A) and GER (B) resistance on all chromosomes. The ED value represents the size of the difference between the FER_S and FER_R DAN pools. The red dashed line represents the correlation threshold, which was calculated as 0.25.
Plants 15 01401 g003
Figure 4. The KEGG_enrichment for the non-synonymous SNP-associated genes in FER QTL regions.
Plants 15 01401 g004
Figure 5. The KEGG_enrichment for the non-synonymous SNP-associated genes in GER QTL regions.
Plants 15 01401 g005
Figure 6. Tissue expression profiles of 18 candidate genes in various tissues at 15 days after pollination.
Plants 15 01401 g006
Figure 7. qRT-PCR results of candidate genes Zm00001d050164 (A) and Zm00001d050095 (B) in resistant and susceptible lines after Fusarium inoculation. * indicates significant difference at p < 0.05, ** indicates highly significant difference at p < 0.01.
Plants 15 01401 g007
Table 1. Statistics for QTLs identified for FER resistance.
QTLsBinsChr.Start (Mb)End (Mb)Size (Mb)Gene_NO.Peak ED
qFER1.061.061195.15201.135.984580.26
qFER4.044.04–4.05423.6741.8318.1612560.34
qFER4.054.05442.8471.3428.507930.28
Chr. = chromosome, and Gene_NO. = Gene_Number.
Table 2. Statistics for QTLs identified for GER resistance.
QTLsBinsChr.Start (Mb)End (Mb)Size (Mb)Gene_NO.Peak ED
qGER2.092.08–2.102227.40242.9815.5814290.20
qGER4.05-14.05458.58106.9348.3510630.18
qGER4.05-24.054119.34125.466.121520.17
qGER4.064.064160.05166.396.346170.18
Chr. = chromosome, and Gene_NO. = Gene_Number.
Table 3. Distribution of candidate genes associated with resistance to FER and GER in the co-localization region on chromosome 4.
Gene_IDStart (bp)End (bp)SymbolDescriptionAnnotated Databases
Zm00001d05007464,147,00464,152,219LRR-RLKLeucine-rich repeats receptor-like protein kinase (Precursor)Pfam/Swissprot
Zm00001d05007764,429,79364,431,264LRR-RLKLeucine-rich repeats receptor-like protein kinase (Precursor)Pfam/Swissprot
Zm00001d05016670,207,74370,219,453SKIP1F-box protein SKIP1Swissprot
Zm00001d05014769,181,57369,184,287/Remorin, C-terminal regionPfam
Zm00001d05016970,238,02970,244,611CYP86B1Cytochrome P450 86B1Swissprot
Zm00001d05017070,328,12470,329,750CYP86B1LCytochrome P450 86B1-likenr
Zm00001d05002160,281,92460,287,213ABA8′-HAbscisic acid 8′-hydroxylaseKEGG
Zm00001d05016470,178,21270,181,943WAKL20Wall-associated receptor kinase-like 20 (precursor)Swissprot
Zm00001d05005562,771,01662,771,591GRPLglycine-rich cell wall structural protein-likenr
Zm00001d05008264,847,02164,848,362PPE8BPectinesterase/pectinesterase PPE8BKEGG
Zm00001d05010365,733,09665,736,167TBL16Protein trichome birefringence-like 16Swissprot
Zm00001d05014969,353,35869,355,399/Exopolygalacturonase (precursor; fragment)Swissprot
Zm00001d05017871,005,58571,008,083ASPG2Xylanase inhibitor N-terminalPfam
Zm00001d05002060,146,87760,161,157FUT11Glycoprotein 3-alpha-L-fucosyltransferaseKEGG
Zm00001d05003261,315,57561,321,274G1PATGlucose-1-phosphate adenylyltransferaseKEGG
Zm00001d05005962,917,78562,921,893ICMTProtein-S-isoprenylcysteine O-methyltransferaseKEGG
Zm00001d05015669,627,91669,629,499PCMP-H12Pentatricopeptide repeat-containing protein At1g08070Swissprot
Zm00001d05009565,387,72465,389,604EXO70B1Exo70 exocyst complex subunitPfam
Disclaimer/Publisher’s Note: The statements, opinions and data contained in all publications are solely those of the individual author(s) and contributor(s) and not of MDPI and/or the editor(s). MDPI and/or the editor(s) disclaim responsibility for any injury to people or property resulting from any ideas, methods, instructions or products referred to in the content.