Article

Physiological and Proteomic Analysis of Sorghum Bicolor Seedling Leaves Reveals Molecular Responses to PEG-Induced Drought Stress


1
State Key Laboratory of Soil and Water Conservation and Desertification Control, College of Soil and Water Conservation Science and Engineering, Northwest A&F University, Yangling 712100, China
2
Plant Systems Engineering Research Center, Korea Research Institute of Bioscience and Biotechnology (KRIBB), Daejeon 34141, Republic of Korea
*
Author to whom correspondence should be addressed.
Plants 2026, 15(8), 1255; https://doi.org/10.3390/plants15081255
Submission received: 27 November 2025 / Revised: 29 March 2026 / Accepted: 9 April 2026 / Published: 18 April 2026

Abstract

Drought stress significantly constrains crop productivity and yield stability. Sorghum (Sorghum bicolor L. Moench), a C4 cereal widely cultivated in arid and semi-arid regions, exhibits high water-use efficiency and remarkable drought tolerance. Understanding both the impacts of drought and the plant’s response mechanisms is essential for enhancing drought resilience in this crop. In this study, physiological changes and differential protein accumulation were analyzed in leaves of the sorghum inbred line BT × 623 under 10% PEG-6000-induced drought stress. The physiological adaptation to drought was characterized by improved water retention and mitigation of oxidative damage through the synergistic action of antioxidant enzymes. Using two-dimensional electrophoresis (2-DE) and MALDI-TOF-TOF mass spectrometry, 43 protein spots were successfully identified, corresponding to 38 unique proteins differentially expressed under osmotic stress. These proteins function in diverse biological processes, including protein synthesis, processing, and degradation; photosynthesis; carbohydrate and energy metabolism; transcriptional regulation; stress and defense; lipid and membrane metabolism; and amino acid metabolism. Proteomic profiling revealed that the coordinated modulation of multiple functional groups, such as those involved in photosynthesis, energy metabolism, transcriptional adjustment, ROS scavenging, and protein turnover, underpins sorghum’s osmotic stress adaptation. These findings provide key insights into the drought resistance mechanisms of sorghum at both physiological and proteomic levels.

1. Introduction

Drought stress is regarded as one of the principal constraints on plant growth and crop productivity in most agricultural regions worldwide [1,2]. Given the long-term effects of global warming, drought events are anticipated to occur with greater frequency in the future [3]. To develop food crops with enhanced productivity in marginal lands, a comprehensive understanding of the intrinsic mechanisms underlying plant stress responses is imperative. The mechanisms by which plants respond to drought stress are highly complex, involving the regulation of a series of changes at morphological, physiological, and molecular levels [4,5].
Sorghum (Sorghum bicolor (L.) Moench) exhibits remarkable adaptation to arid and adverse environments [6], positioning it as an increasingly vital food source in semi-arid and arid regions. As a valuable germplasm resource, sorghum serves as a promising model system for elucidating the molecular mechanisms underlying drought resistance in cereal crops. Its advantageous traits include high photosynthetic efficiency, a short growth cycle, low water requirements, and pronounced drought tolerance [7]. These characteristics render it particularly suitable for cultivation in marginal soils and water-limited regions. Unraveling the molecular basis and inherent regulatory mechanisms of drought tolerance in sorghum would facilitate the exploration of genetic resources for crop improvement.
Under drought conditions, plants typically accumulate reactive oxygen species (ROS), leading to oxidative stress. Excessive ROS production can inflict cellular damage through oxidation of lipids, proteins, and nucleic acids, ultimately resulting in cell injury and death [8]. To maintain ROS homeostasis, plants employ enzymatic antioxidant systems-including superoxide dismutase (SOD), peroxidase (POD), ascorbate peroxidase (APX), catalase (CAT), polyphenol oxidase (PPO), and glutathione reductase (GR)—to mitigate oxidative damage [8,9,10,11]. The capacity to minimize ROS accumulation and mitigate their detrimental effects is closely associated with plant drought tolerance [12].
Although sorghum’s drought resistance has been largely attributed to morphological and physiological features—such as C4 photosynthesis, a dense root system [6,13], high leaf epicuticular wax deposition [14], sustained stomatal opening and photosynthesis under low water potential, efficient soil water extraction [15], and osmotic adjustment ability [16]—the responses of antioxidant enzymes in leaves under osmotic stress remain inadequately characterized, particularly their dynamic changes across different time points following stress exposure. Therefore, investigating the physiological and molecular mechanisms governing drought resistance in sorghum will provide critical insights for developing effective genetic enhancement strategies.
Given the significance of sorghum stress resistance, its molecular mechanisms have been extensively investigated. Transcriptomic profiles of sorghum under osmotic stress, high sodium chloride, abscisic acid (ABA), heat, and drought treatments have been systematically characterized [17,18,19]. Recently, Abdel-Ghany (2020) conducted a transcriptome analysis of drought-resistant and drought-sensitive sorghum seedlings subjected to PEG-induced drought stress, identifying a suite of drought-responsive genes, including many encoding uncharacterized proteins associated with drought resistance [20]. These studies provide preliminary molecular insights into drought resistance in sorghum and yield valuable transcriptomic data regarding its response to water deficit. While they offer important directions for future research on drought tolerance mechanisms, the fundamental intrinsic mechanisms underlying sorghum’s drought resistance remain to be fully elucidated.
The overall function of a gene within an organism is ultimately realized through its encoded protein at the cellular level. Transcriptional-level gene expression information alone is often insufficient to fully elucidate the precise roles of genes in cellular processes, given that biological outcomes in cells, tissues, and organs are primarily governed by proteins rather than genes. Merely observing changes in expression levels through gene or RNA sequencing may not capture the entirety of cellular regulatory processes and their consequent biological effects. Moreover, the expression levels of genes do not strictly correlate with the abundance of their corresponding proteins [21]. Therefore, investigating the molecular mechanisms of sorghum’s response to drought stress from a proteomic perspective, along with exploiting drought resistance genetic resources and identifying as well as cloning drought-resistant proteins, holds significant research value for clarifying the molecular basis of drought tolerance in sorghum. Such efforts are particularly crucial for the rational utilization of drought-resistant traits. Furthermore, this research bears substantial theoretical and practical importance for enhancing drought resistance and improving water-use efficiency in crops such as wheat and maize.
With the completion of genomic sequencing for an increasing number of organisms—including sorghum [22], whose BT × 623 line, with a genome size of 750 Mb, positions it as an ideal model crop—proteomics has emerged as a crucial methodology in the post-genomic era. Sorghum exhibits high water-use efficiency, primarily utilizing soluble sugars and proteins as key osmoregulatory substances under drought stress [13]. Following severe drought, sorghum demonstrates a rapid recovery capacity and can achieve substantial yield once water becomes available. In response to water deficit, sorghum undergoes a series of adaptations spanning cellular to physiological levels, involving significant changes in the abundance and composition of numerous proteins. Proteomic analyses will facilitate a deeper understanding of the protective and adaptive mechanisms that enable sorghum to withstand drought stress.
The functional identification of numerous drought-responsive proteins has been reported in model species such as Arabidopsis [23,24], rice [25], maize [26,27], and other plants [28,29,30,31,32]. These studies have substantially elucidated the molecular mechanisms underlying plant responses to water deficit and demonstrate the broad application potential of proteomics in research on plant drought resistance. However, functional insights remain limited in sorghum to date. Proteomic analyses of two Sorghum bicolor landraces—drought-resistant (accession number 11434) and drought-sensitive (accession number 11431)-under drought stress revealed altered protein expression profiles in leaves. The most notable differences between resistant and sensitive genotypes involved proteins associated with energy balance, metabolic processes, and molecular chaperones [33]. Additionally, physiological and comparative proteomic studies in sorghum have identified protein groups responsive to abiotic stresses including salinity, cadmium/copper exposure, and drought conditions [34,35,36,37,38,39,40,41,42].
Although numerous proteomic studies have investigated drought stress responses in sorghum, the mechanism by which leaves—the primary vegetative organs—respond to drought at the protein level remains unclear. Unlike previous sorghum proteomic studies that often compared different cultivars or examined later stress responses, this study focuses on the proteome dynamics of the reference genotype BT × 623 under PEG-induced osmotic stress at a time point representing established physiological adjustment (24 h), rather than early signaling. By coupling this single-time-point proteomic analysis with time-resolved physiological measurements across multiple early time points (3, 6, and 9 h), we establish direct links between early physiological adjustments and specific protein changes at the stabilized phase, providing an integrated view of the drought response mechanisms during the transition from early sensing to established adaptation. Moreover, comparison with existing transcriptomic datasets reveals discrepancies between transcript and protein abundances, highlighting potential post-transcriptional regulatory events critical for drought adaptation in sorghum. A comprehensive understanding spanning from physiological to molecular traits is essential to identify key genes involved in sorghum’s drought resilience. Thus, to further elucidate the molecular events underlying sorghum’s response to water deficit, physiological assessments and proteomic analyses were employed to compare physiological changes and differentially accumulated proteins in the sorghum inbred line BT × 623 under PEG-induced drought stress. This study aims to uncover sorghum’s drought resistance adaptation mechanisms, identify drought-responsive proteins, determine major protein categories involved in the stress response, and screen key drought-related protein genes for potential use in genetic engineering to enhance drought tolerance in cereal crops. The findings are expected to provide deeper insights into the mechanisms of drought resistance in sorghum, thereby supporting efforts to improve the plant’s drought adaptability.

2. Materials and Methods

2.1. Seedling Cultivation and Polyethylene Glycol (PEG) Treatment

Surface-sterilized seeds of the Sorghum bicolor genotype BTx623, whose genome sequence has been published (http://www.phytozome.net/sorghum, accessed on 22 June 2021), were germinated for 4 days at 25 °C. After germination, healthy seedlings were transferred to a plastic container with 4 L of half-strength Hoagland nutrient solution [composed of Ca(NO3)2, KNO3, MgSO4, (NH4)3PO4, iron salt solution, and trace elements; pH = 6.0]. The nutrient solution was replaced with full-strength Hoagland solution 6 days after transplanting. Continuous aeration was provided, and the pH was maintained at 6.0 using 0.1 M HCl or 1 N KOH.
The cultivation of sorghum seedlings in this experiment was conducted in an artificial climate chamber under the following conditions: light period of 14 h, light intensity of 450 μmol m−2 s−1, temperature of 28 °C, nighttime temperature of 23 °C, and humidity of 40–50%.
To induce drought stress, 10% PEG-6000 (−0.2 MPa) was applied at 8:00 a.m., 12 days after transplanting. Samples were collected after 3, 6, 9, and 24 h of treatment for analysis. Untreated plants served as controls. For physiological assays, each treatment included three biological replicates, with two technical replicates per biological replicate. For proteomic analysis, three independent biological replicates were used.

2.2. Leaf Relative Water Content (RWC) and Leaf Water Potential Measurement

To assess the water status under PEG-induced drought stress, the relative water content (RWC) was measured according to the method of Ahmad et al. [43]. In brief, the uppermost fully expanded leaves were weighed to obtain fresh weight (FW), saturated in water for 6 h at 20 °C under light conditions, and then weighed again to determine turgid weight (TW). The samples were subsequently oven-dried at 80 °C for 48 h to obtain dry weight (DW). RWC was calculated using the formula: RWC = (FW − DW)/(TW − DW) × 100. Prior to excision, the uppermost fully expanded leaves were covered with aluminum foil, and water potential was measured using a pressure chamber (Model 3500, Soil Moisture Equipment Corp., Santa Barbara, CA, USA). Each treatment consisted of six replicates.

2.3. MDA Contents Measurement

Lipid peroxidation was assessed by measuring malondialdehyde (MDA) content using a modified thiobarbituric acid (TBA) method [44]. Approximately 0.1 g of leaf tissue was homogenized in 1.0 mL of 10% trichloroacetic acid (TCA) using a mortar and pestle. The homogenate was centrifuged at 10,000 rpm for 20 min. A reaction mixture consisting of 0.5 mL of the supernatant and 1 mL of TBA solution was heated at 100 °C for 30 min, rapidly cooled on ice, and centrifuged again at 10,000 rpm for 20 min. Absorbance was measured at 450 nm, 532 nm, and 600 nm using a UV spectrophotometer (Shimadzu UV-2550, Kyoto, Japan). Three biological replicates were performed.

2.4. Antioxidative Enzyme Activity Assays

To analyze the activities of SOD, POD, and PPO, total soluble protein was extracted from the third leaf from the top of sorghum plants subjected to 10% PEG-6000 treatment. Approximately 0.1 g of frozen leaf tissue was homogenized in ice-cold 50 mM potassium phosphate buffer (pH 7.0) containing 1 mM EDTA-Na2 and 2% (w/v) polyvinylpolypyrrolidone (PVPP) using a pre-chilled mortar and pestle. The homogenate was centrifuged at 15,000× g for 20 min at 4 °C, and the supernatant was immediately used for enzyme assays.
Protein concentration was determined using the Bradford method [45] with a Bio-Rad (Hercules, CA, USA) protein assay kit, using bovine serum albumin as the standard. SOD activity was measured based on the inhibition of the photochemical reduction of nitro blue tetrazolium (NBT) at 560 nm [46]. POD activity was assayed according to Kwak et al. [47] using pyrogallol as the substrate. One unit of POD activity was defined as the amount of enzyme required to produce 1 mg of purpurogallin from pyrogallol in 20 s, measured at 420 nm.
PPO activity was determined by monitoring the increase in absorbance at 420 nm at 15 s intervals for 5 min. The reaction mixture consisted of 0.05 mL of enzyme extract, 0.4 mL of 100 mM catechol, and 0.8 mL of 0.1 M phosphate buffer (pH 5.0) at 25 °C. A control without enzyme extract and a blank with buffer were included. Enzyme activity was calculated from the linear region of the absorbance curve, with one unit defined as an increase of 0.01 in absorbance per minute.

2.5. Measurement of Free Proline Content

The free proline content in drought-treated plants was determined spectrophotometrically following the method of Bates et al. (1973) [48]. In brief, 0.1 g of leaf tissue was homogenized in 3 mL of 3% sulfosalicylic acid and centrifuged at 10,000× g for 15 min. Subsequently, 1 mL of the supernatant was combined with 1 mL of glacial acetic acid and 1 mL of ninhydrin reagent in a test tube. The mixture was incubated in a boiling water bath at 100 °C for 30 min. After cooling, 2 mL of toluene was added, and the solution was vortexed for 30 s. The absorbance of the upper toluene phase (containing proline) was measured at 520 nm using a UV-2550 spectrophotometer (Shimadzu, Kyoto, Japan), with toluene serving as the blank. Proline content (μg/g fresh weight) was quantified using a standard curve prepared with known proline concentrations according to the ninhydrin acid reagent method [48].

2.6. Protein Extraction and Quantification

Freshly harvested sorghum leaves were ground using a mortar and pestle pre-cooled with liquid nitrogen. Total proteins were extracted from the powdered plant tissue using the trichloroacetic acid (TCA)–acetone precipitation method [49]. Protein concentration was determined using the Bradford reagent [45].

2.7. Isoelectric Focusing (IEF) and SDS–PAGE Conditions

For each sample, 500 μg of protein was combined with rehydration buffer (7 M urea, 2 M thiourea, 4% w/v CHAPS, 65 mM DTT, 0.2% Bio-Lyte, and 0.001% w/v bromophenol blue) to a final volume of 330 μL. Protein samples were loaded onto 17 cm pH 4–7 Bio-Rad ReadyStrip™ IPG strips (Bio-Rad, Beijing, China) according to the manufacturer’s protocol. Isoelectric focusing (IEF) was performed using a PROTEAN IEF system (Bio-Rad) under the following conditions: 250 V for 1 h, 500 V for 1 h, 1000 V for 1 h, a linear gradient from 1000 V to 10,000 V over 5 h, 10,000 V for 6.5 h, and a final hold at 500 V. After IEF, the strips were incubated for 15 min in equilibration buffer I (6 M urea, 2% SDS, 0.375 M Tris-HCl, pH 8.8, 20% glycerol, 2% DTT), followed by 15 min in equilibration buffer II (6 M urea, 2% SDS, 0.375 M Tris-HCl, pH 8.8, 20% glycerol, 2.5% iodoacetamide). The equilibrated strips were then transferred onto 12% polyacrylamide gels-selected after comparative testing of 10%, 12%, and 15% concentrations for optimal resolution-and sealed with 1% agarose. Electrophoresis was carried out using a PROTEAN II XL system (Bio-Rad), beginning at 1 W per gel for 45 min, then increasing to 12 W per gel for 6 h.

2.8. Staining of 2-DE Gels and Gel Images Analysis

Protein spots were visualized using colloidal Coomassie Brilliant Blue G-250 staining. Each treatment was analyzed in three biological replicates, and gels were scanned with a UMAX PowerLook scanner (Bio-Rad). Protein spot quantification was performed with PDQuest 8.0 software (Bio-Rad), using the “total density in gel image” method to normalize spot intensities across gels. Over-saturated spots were omitted from analysis. Statistical significance between treated samples and controls was assessed by Student’s t-test (p < 0.05). Only protein spots exhibiting statistically significant intensity differences were selected for further analysis.

2.9. MALDI-TOF-TOF MS and Database Query

Protein spots exhibiting a ≥2-fold change with a quality score ≥80 (p < 0.05) were excised from two-dimensional gels. The excised gel plugs were destained, dried at 50 °C, digested with trypsin, and extracted with 50% acetonitrile [50]. Tryptic peptides were analyzed using a REFLEX MALDI-TOF-TOF mass spectrometer (Bruker Daltonics, Bremen, Germany) operated in positive ion reflector mode. Mass spectra were calibrated using trypsin autolysis peaks as internal standards. Protein identification was performed by searching the NCBI non-redundant protein sequence database using the Mascot software (http://www.matrixscience.com, accessed on 8 April 2026) [51]. Identifications were considered confident with Mascot scores exceeding 73 (corresponding to p < 0.05). Gene locus, protein function, and subcellular localization were annotated using Phytozome v11.0 with the Sorghum bicolor v3.1 genome annotation database (https://phytozome.jgi.doe.gov, accessed on 8 April 2026), along with the SIB bioinformatics resource portal (http://www.expasy.org, accessed on 8 April 2026) and UniProtKB complete proteome database (http://www.uniprot.org, accessed on 8 April 2026).

2.10. Functional Categorization and Subcellular Localization of Detected Proteins

The identified proteins were functionally classified using Gene Ontology (GO) (http://geneontology.org/, accessed on 8 April 2026) based on the sorghum and maize genome annotation databases. Subcellular localization of proteins was predicted using the SIB Bioinformatic Resource Portal (http://www.expasy.org/proteomics, accessed on 9 August 2024) and the UniProtKB Complete Proteome database (http://www.uniprot.org, accessed on 8 April 2026). Gene Ontology terms were assigned to all 43 protein spots manually according to their biological processes and cellular components.

2.11. Statistical Analysis

Statistical analysis was performed using the Statistical Package for the Social Sciences (SPSS version 17.0 for Windows; SPSS Inc., Chicago, IL, USA). Data were subjected to one-way analysis of variance (ANOVA), and mean differences were compared using the Tukey–Kramer test (p < 0.05). Multiple comparisons were further examined with the least significant difference (LSD) test. All experiments included at least three independent replicates. Figures were generated using SigmaPlot 12.0, and statistically significant differences (p < 0.05) are indicated by different letters in the figures.

3. Results

3.1. Effect of Drought Stress on Leaf Relative Water Content (RWC) and Leaf Water Potential

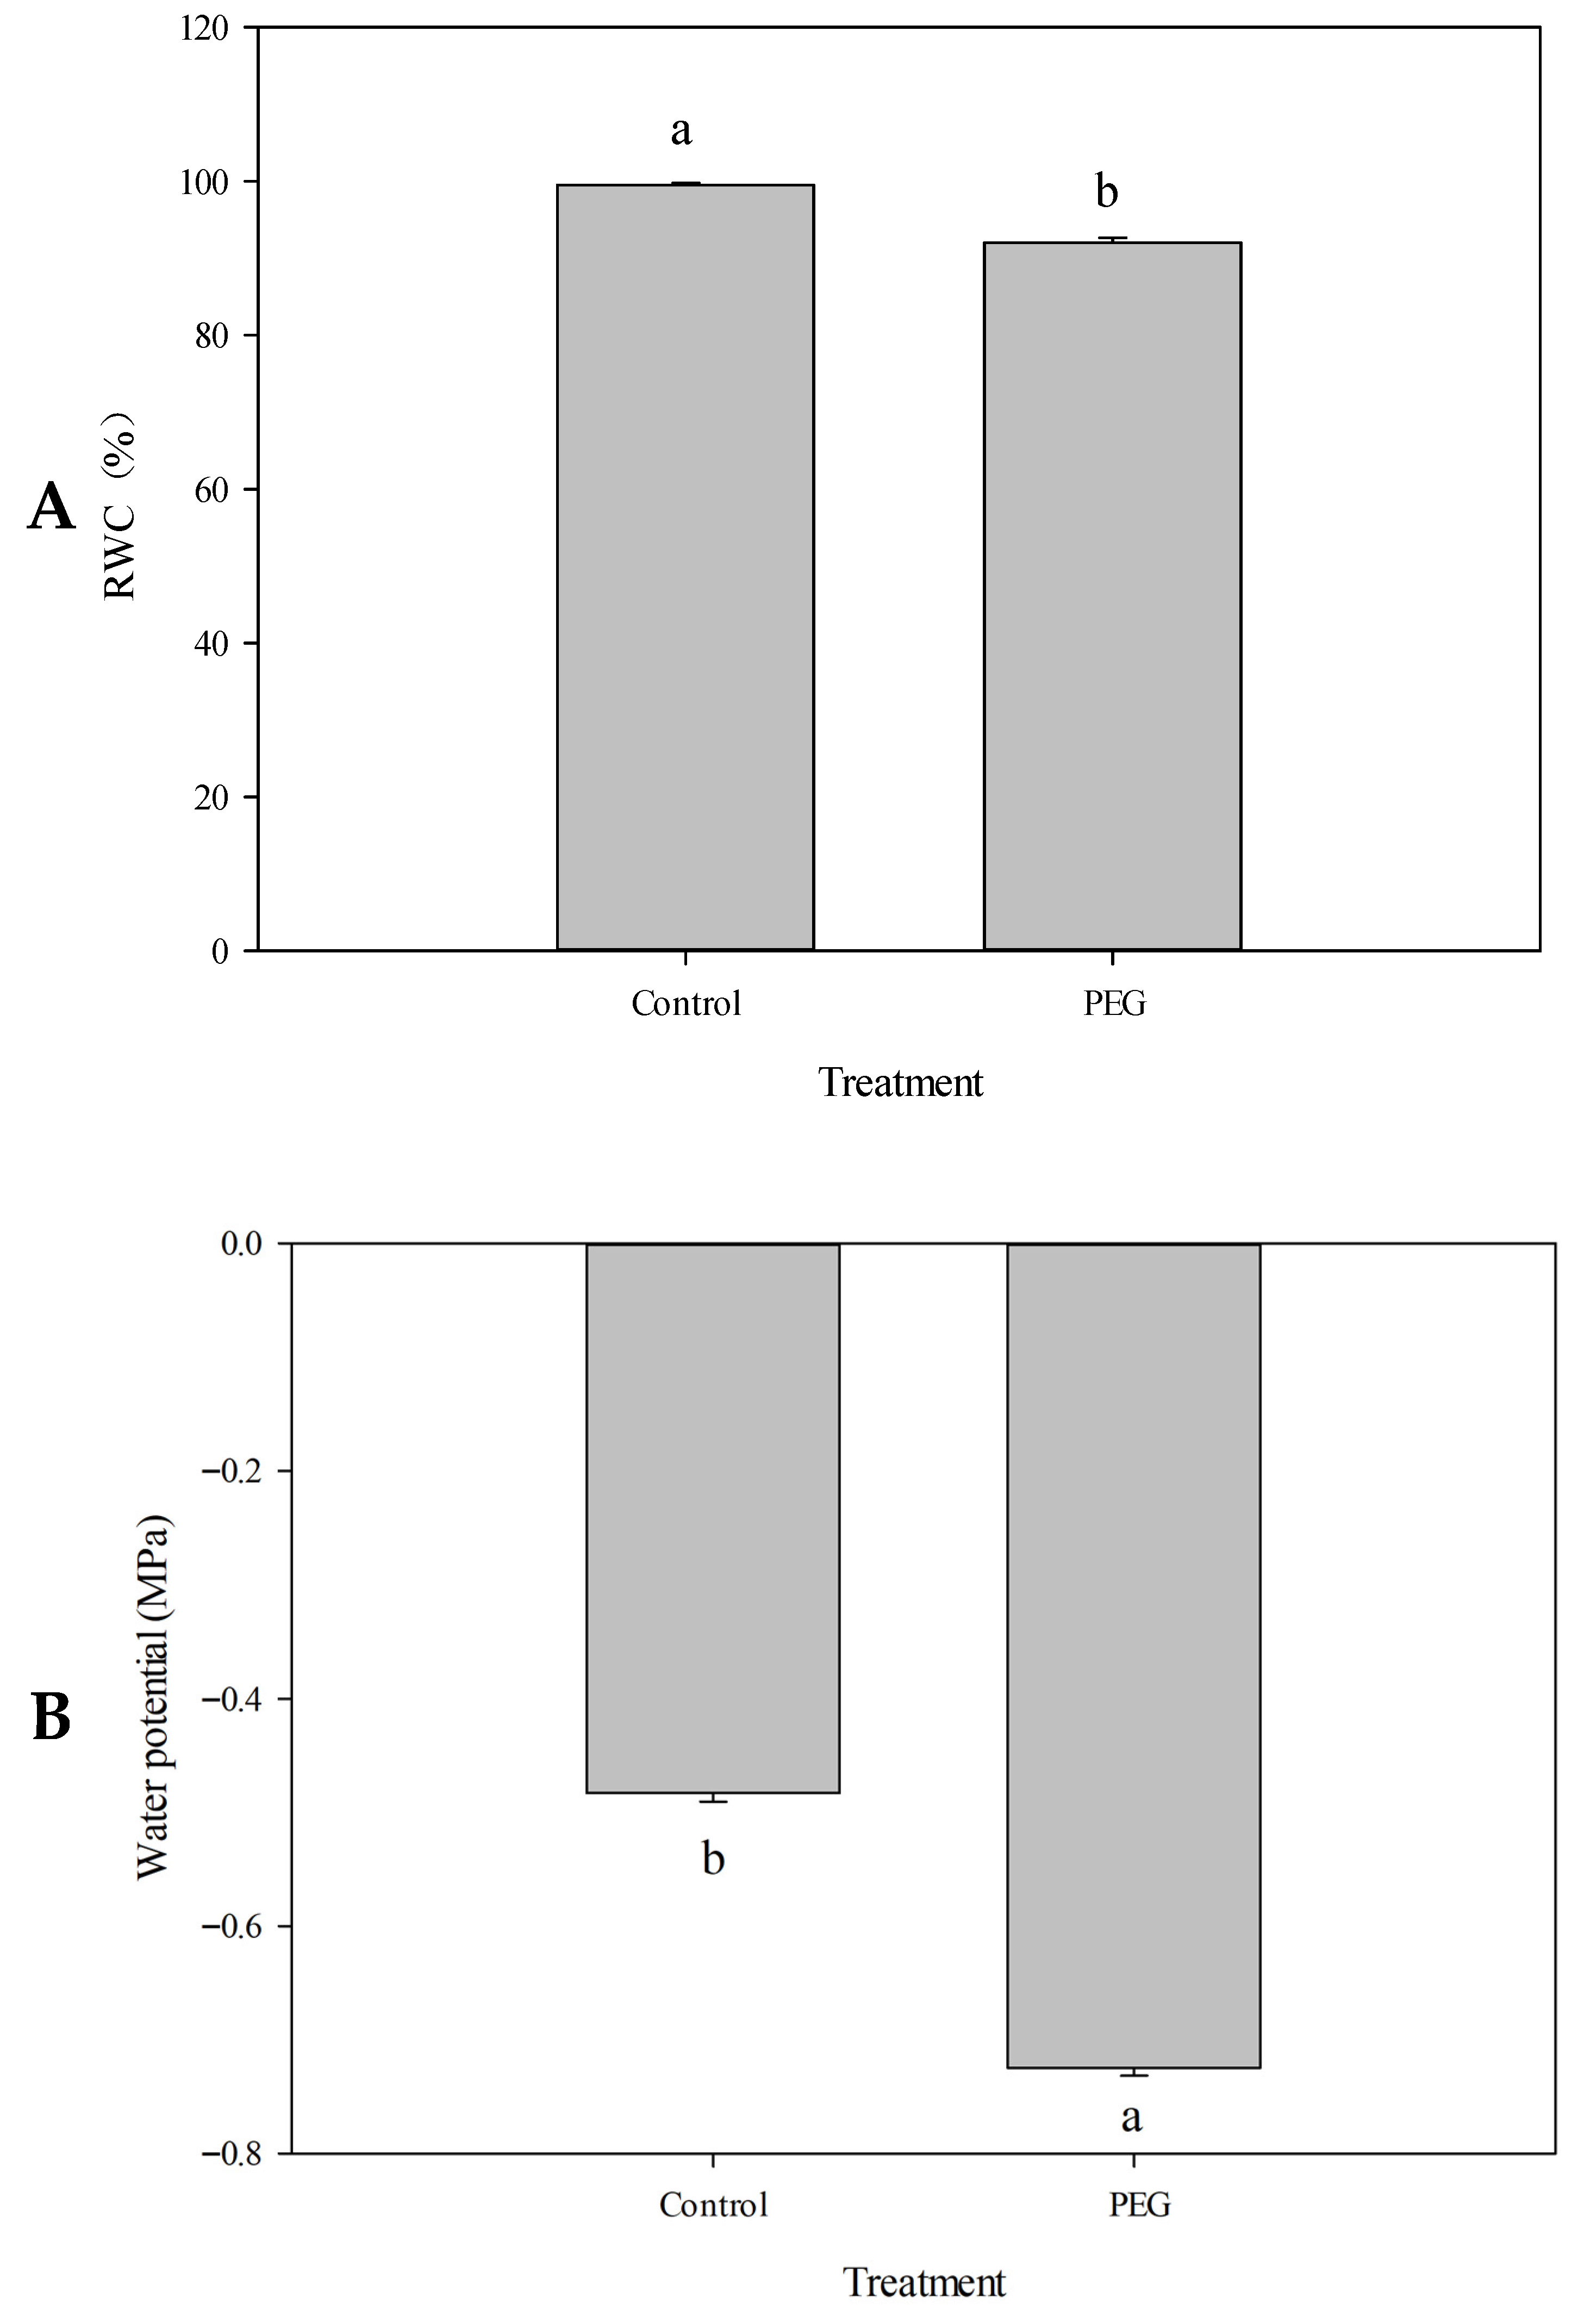
To determine whether PEG-induced drought stress affects sorghum growth, leaf relative water content (RWC) and leaf water potential were measured. As shown in Figure 1, under well-watered conditions, the leaf RWC of sorghum seedlings was nearly 100%, and the leaf water potential was approximately −0.5 MPa. After 3 h of PEG-induced osmotic stress, leaf RWC decreased to 92%, and leaf water potential declined to −0.72 MPa. In the early stage of PEG-simulated drought, PEG-6000 primarily induced osmotic stress, leading to water loss in leaf cells and consequent reductions in RWC and leaf water potential. These changes triggered stomatal closure, thereby limiting the leaf transpiration rate. Ultimately, the reduction in water loss assisted the sorghum plants in maintaining favorable water status and enhancing drought resistance. These results suggest that leaf RWC and water potential can serve as reliable indicators of plant water status, and the capacity to maintain adequate water homeostasis reflects the drought adaptability of sorghum.

3.2. Drought Stress Induced MDA and Proline Accumulation in Leaves of Sorghum

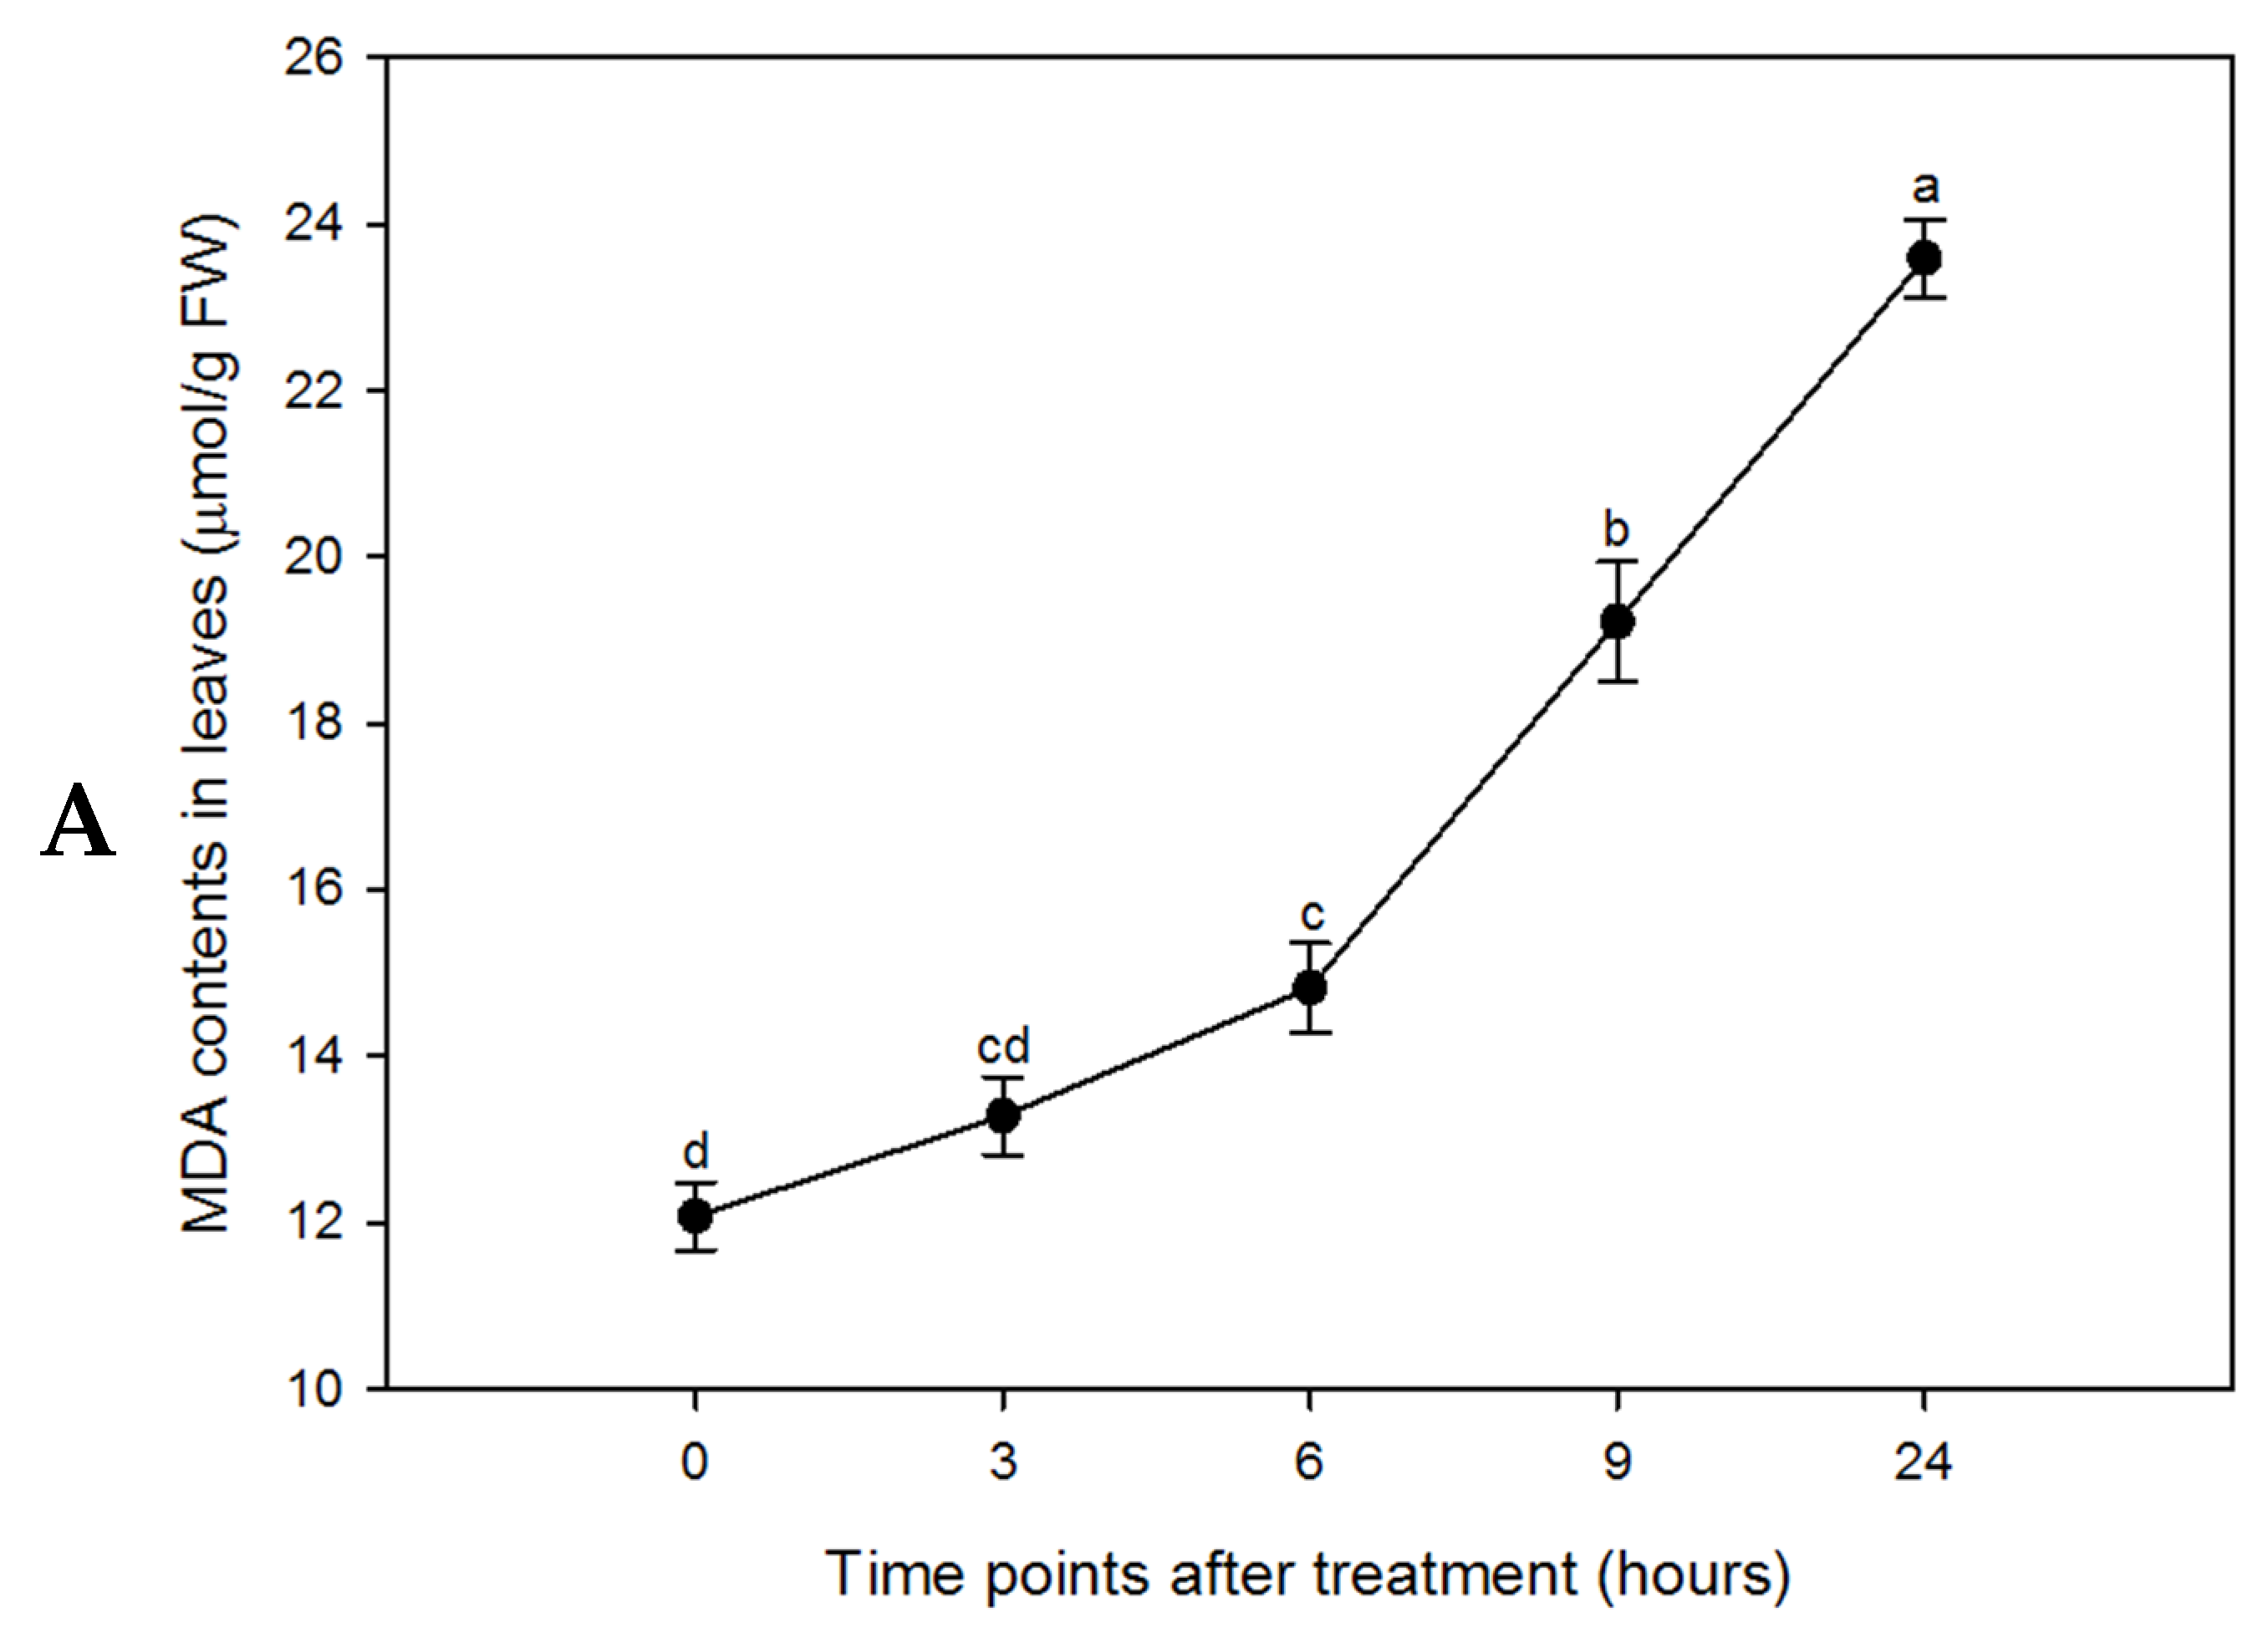
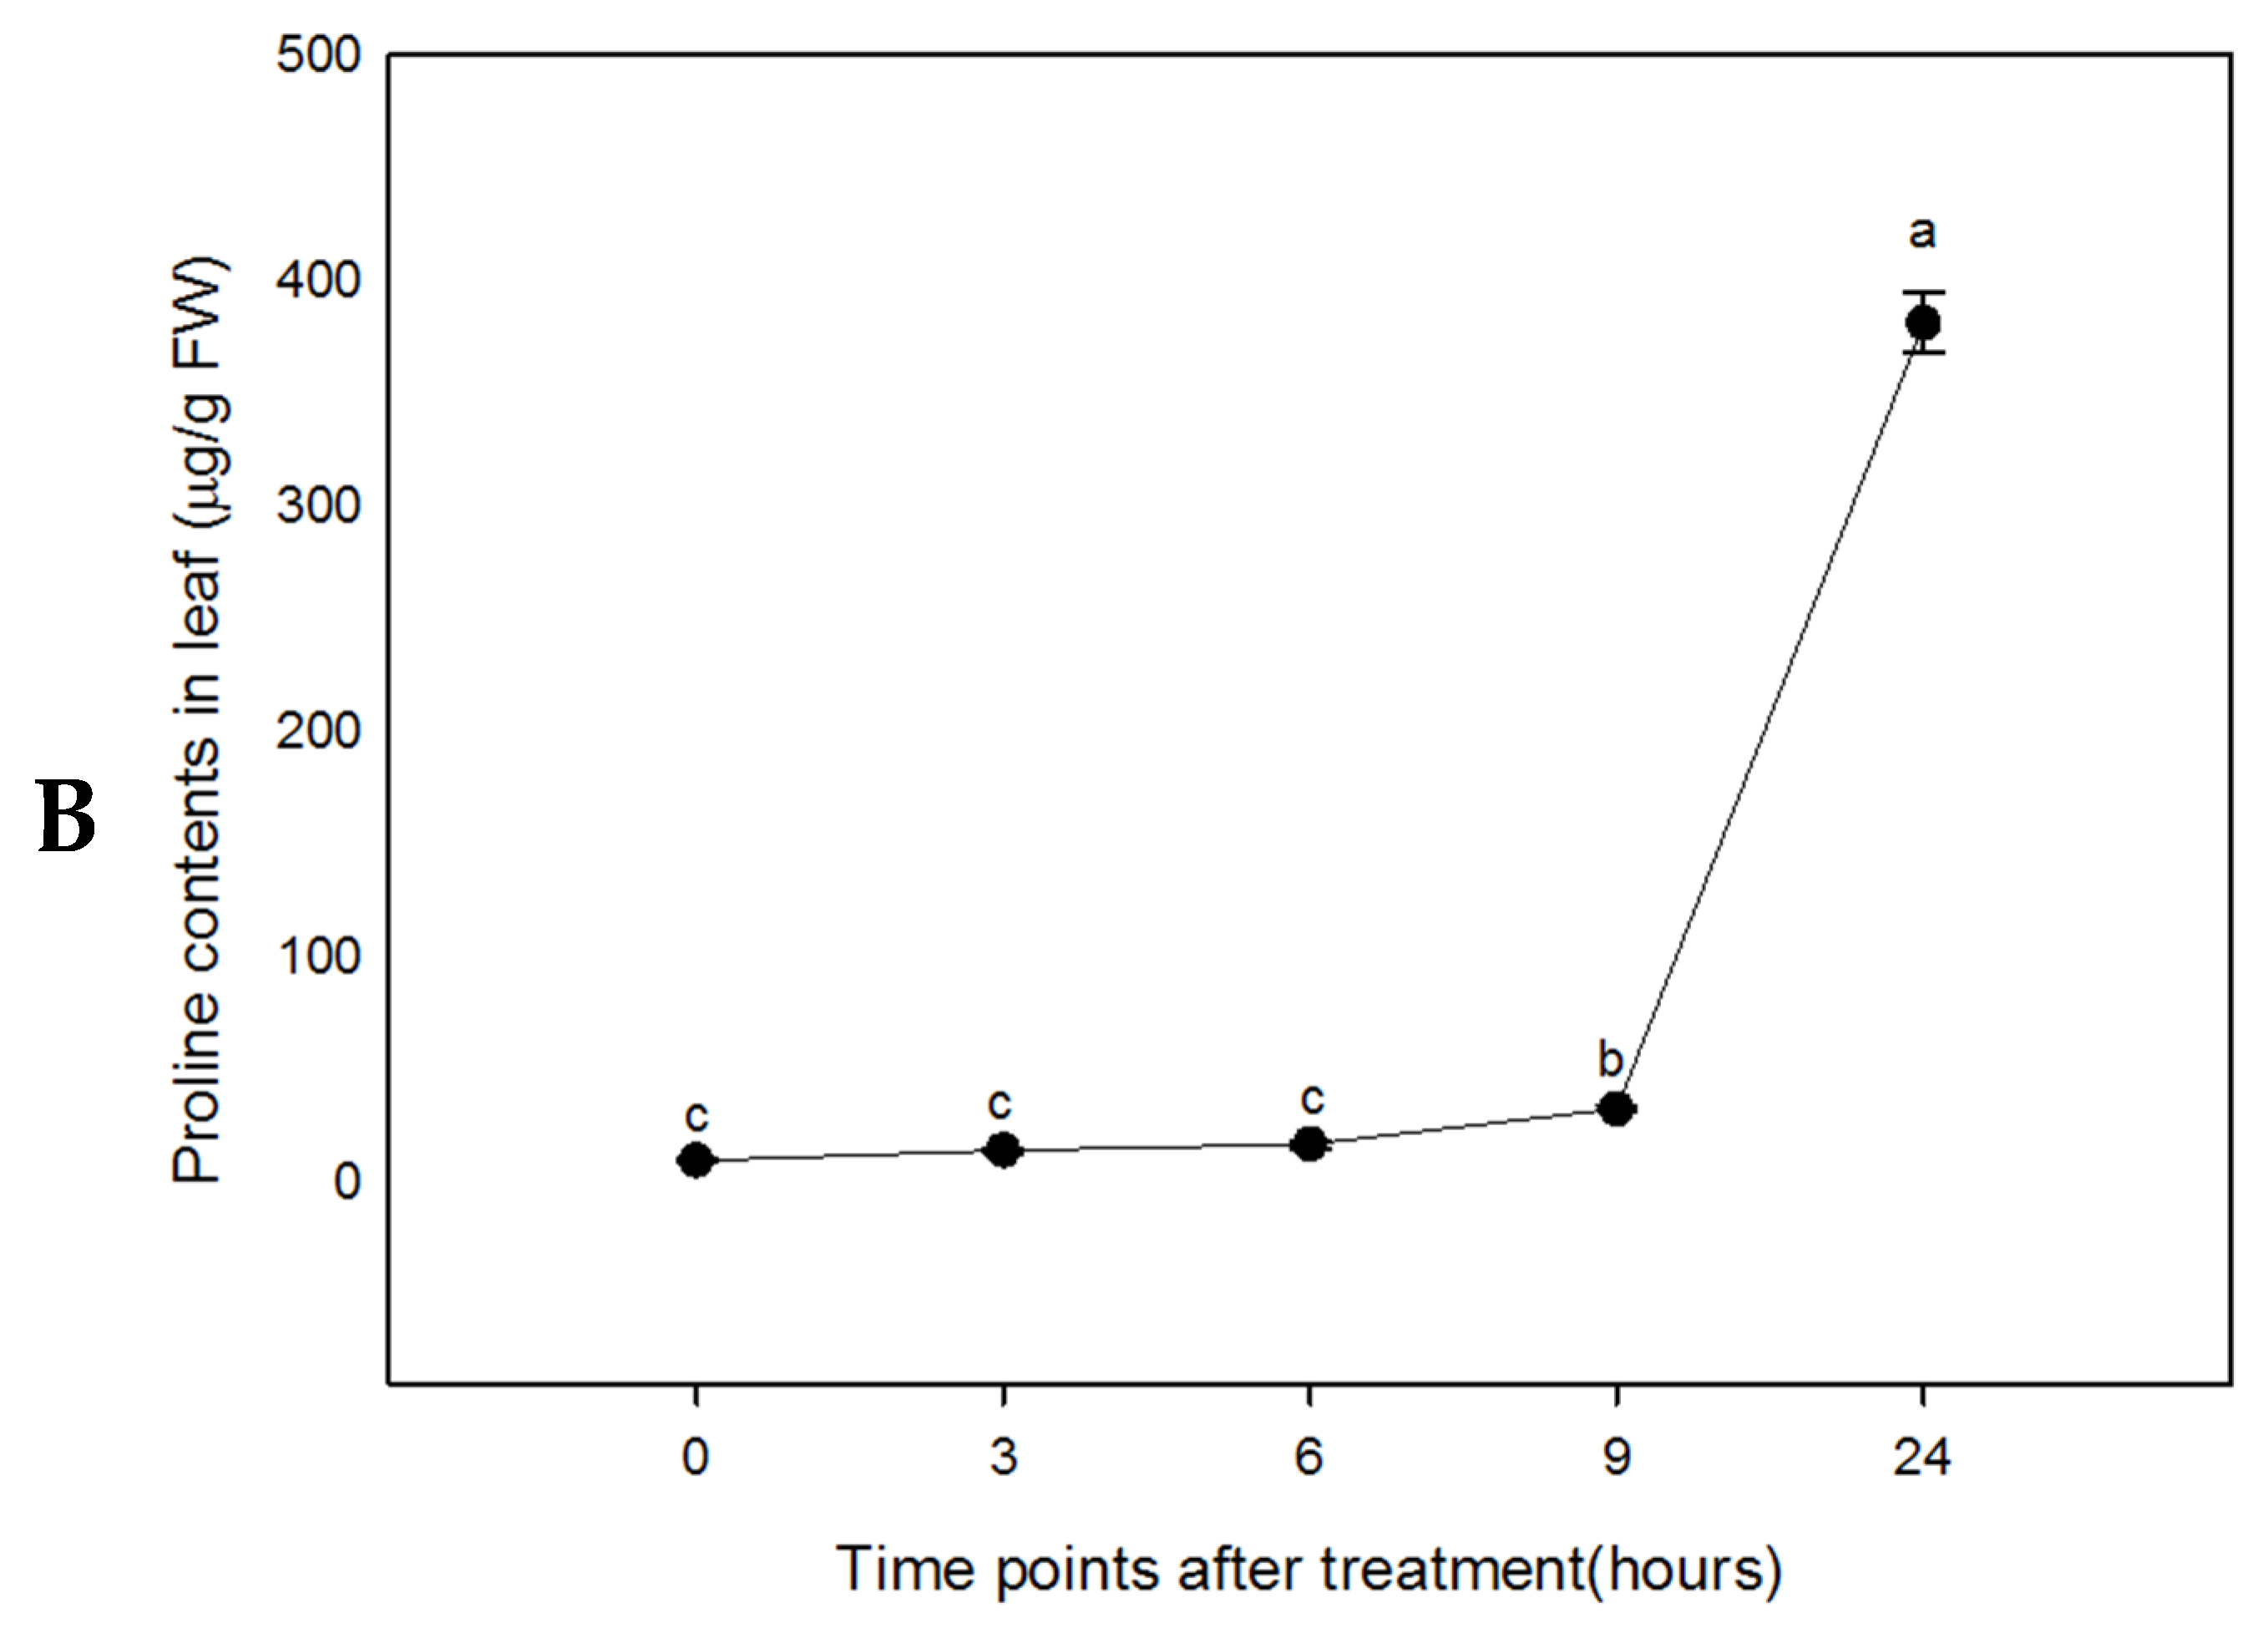
We next assessed the effects of PEG-induced drought stress on the accumulation of malondialdehyde (MDA) and proline in sorghum leaves. MDA, a key product of polyunsaturated fatty acid peroxidation, serves as an indicator of lipid peroxidation and a biomarker of oxidative stress. As shown in Figure 2, prior to stress, MDA and proline contents were 12 μmol/g FW and 9.31 μg/g FW, respectively. With prolonged stress, both metabolites increased significantly, reaching 23.59 μmol/g FW and 375 μg/g FW, respectively, at 24 h after treatment, indicating drought-induced accumulation of MDA and proline. The accumulation of osmoprotectants such as proline under stress represents a primary defense mechanism to sustain cellular osmotic balance [52,53]. The ability to accumulate proline has been linked to enhanced stress tolerance in various plant species, including sorghum [37,38,54,55]. Stress-induced proline accumulation may contribute to antioxidative defense by scavenging free radicals or activating antioxidant systems, thereby mitigating oxidative damage [56,57]. MDA content in sorghum leaves exhibited a similar trend during drought stress: a gradual increase during the first 9 h, followed by a sharp rise from 9 to 24 h. The marked accumulation of proline likely helps alleviate MDA-induced oxidative damage and supports the activation of antioxidant mechanisms.

3.3. Drought Stress Induced the Increase in Antioxidant Enzyme Activity in Leaves

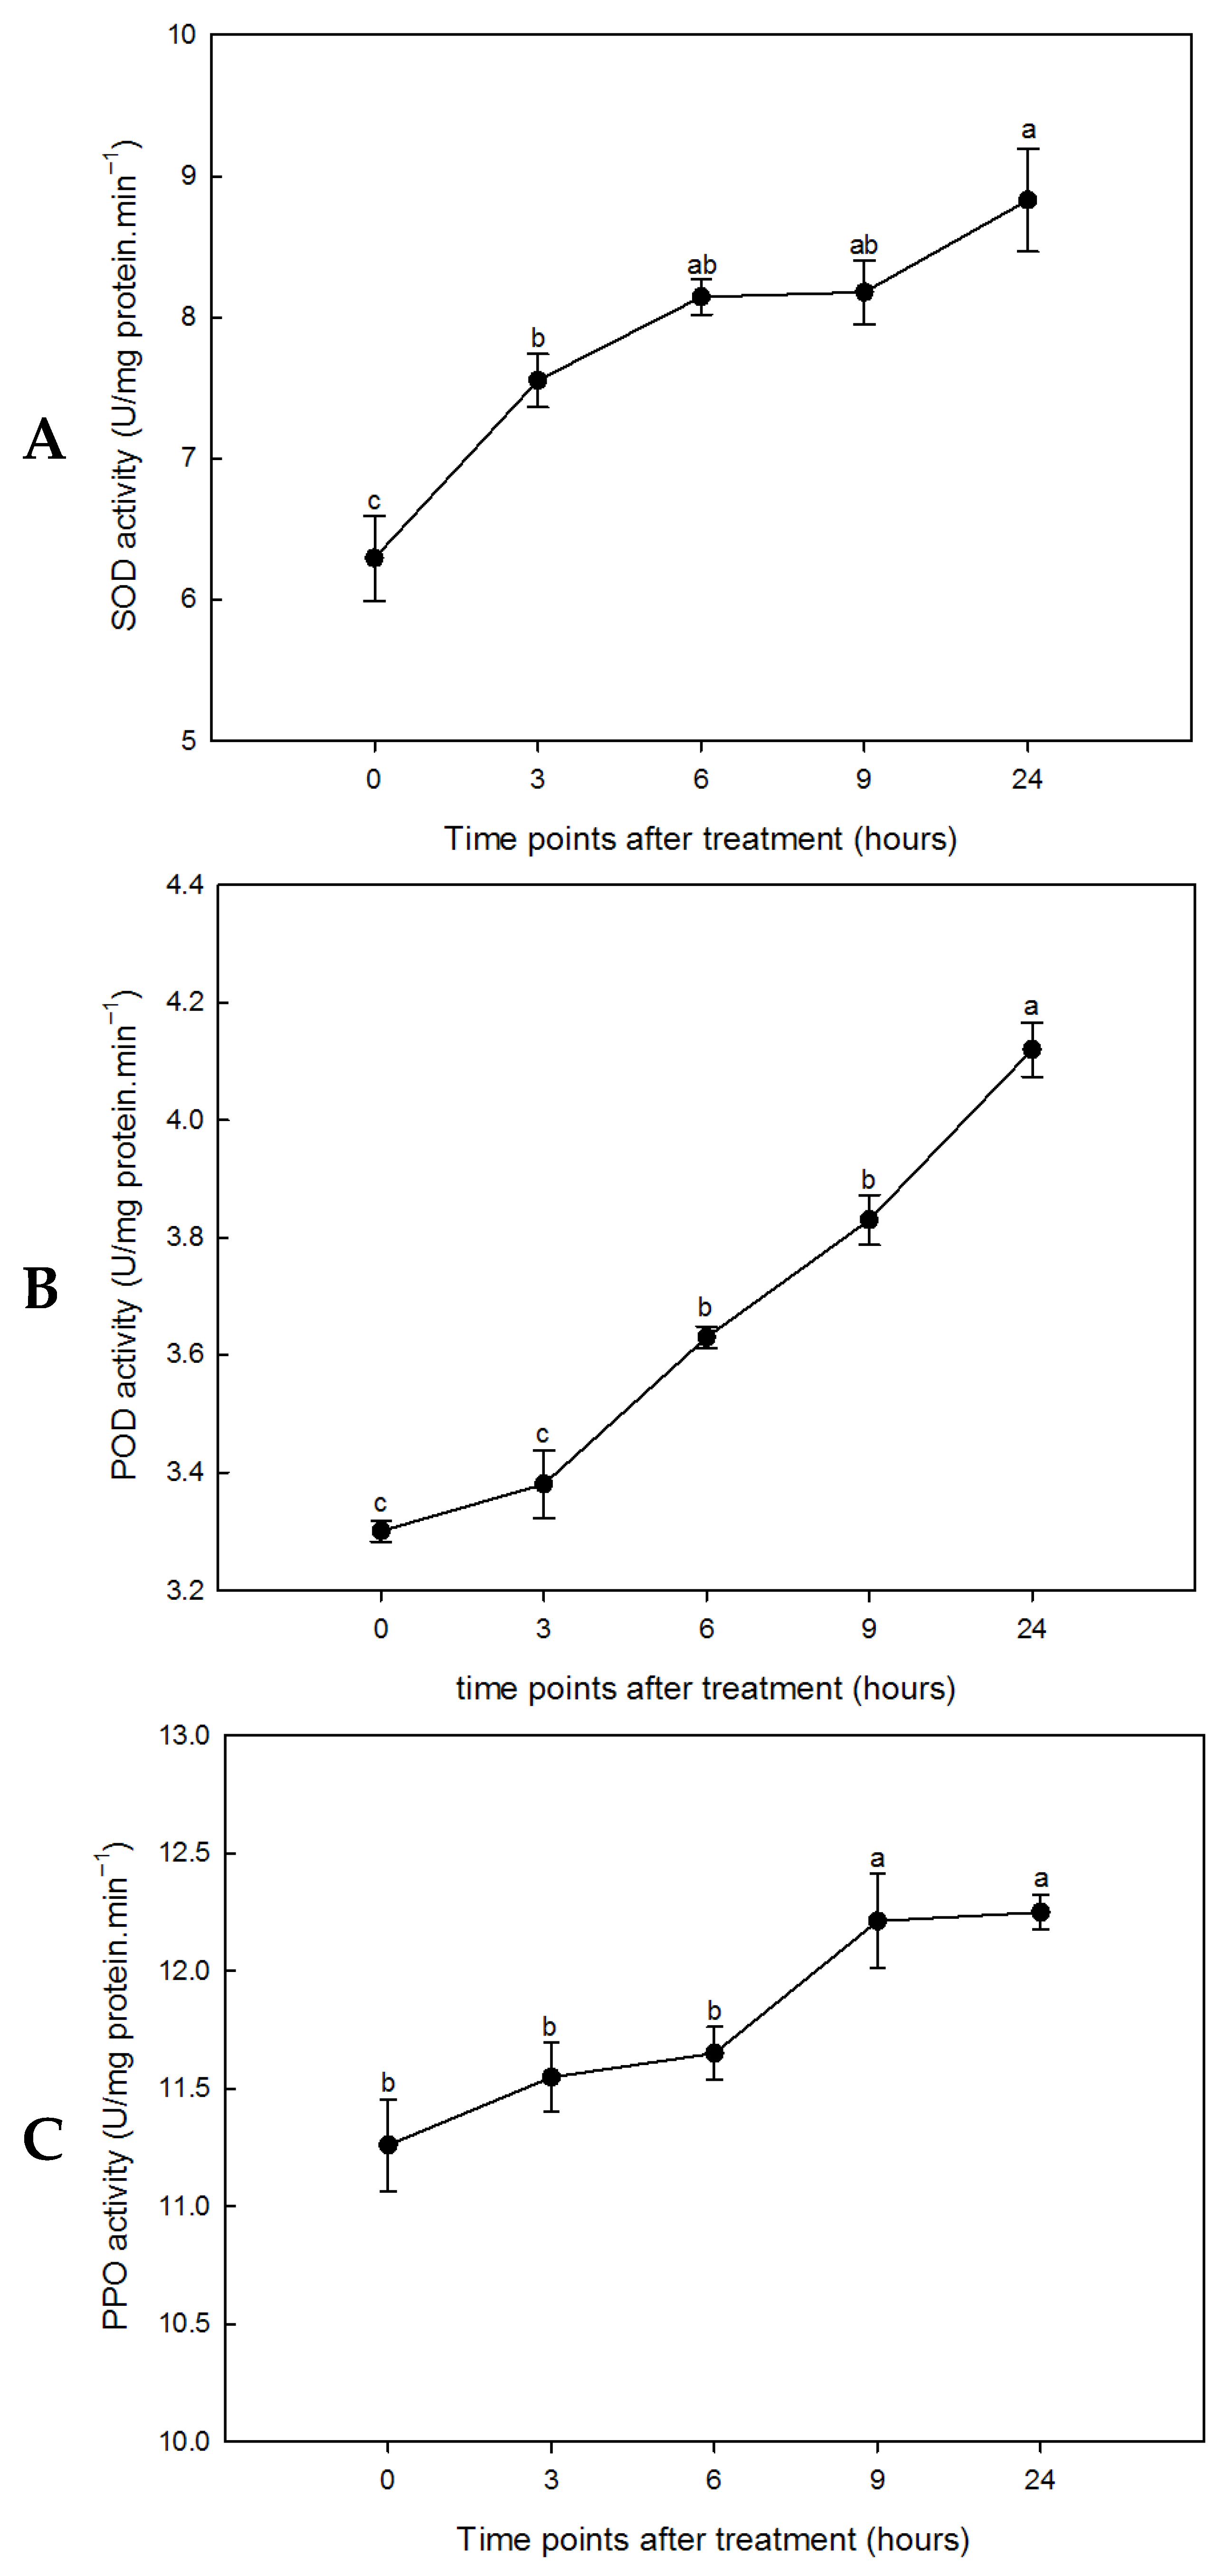
Reactive oxygen species (ROS)—including superoxide radical anions, hydrogen peroxide, and hydroxyl radicals—are highly reactive and toxic molecules that can induce oxidative damage and cell death. To examine whether drought resistance in sorghum involves enhanced ROS scavenging capacity, we measured the activities of peroxidase (POD), superoxide dismutase (SOD), and polyphenol oxidase (PPO) at various time points following drought stress (Figure 3). All three enzymes showed significantly increased activities over the course of the stress treatment. Analysis of antioxidant enzyme dynamics revealed similar trends in sorghum leaves throughout the stress period. Plants possess an intrinsic protective system mediated by antioxidant enzymes, which functions to mitigate ROS-induced damage and maintain normal cellular function [58]. The balance between ROS production and antioxidant enzyme activity determines the extent of oxidative signaling and/or damage [59]. Sustaining high levels of antioxidative enzyme activities may enhance drought tolerance by improving the capacity to counteract oxidative injury [60]. Our results demonstrate that SOD, POD, and PPO activities in sorghum leaves increased gradually during the early phase of drought stress. These findings support the view that efficient antioxidative properties contribute to improved protection against oxidative stress in leaves under water-deficient conditions.

3.4. Changes in Proteomic Expression Patterns in Sorghum Seedling Leaves in Response to PEG Imitation Drought Stress

Two-week-old sorghum seedlings were subjected to 10% PEG-6000 treatment for 24 h. Proteins extracted from the leaves were separated by two-dimensional electrophoresis (2-DE) and visualized with colloidal Coomassie Brilliant Blue staining (Figure 4). A total of 708 protein spots were reproducibly detected across gels. Among these, 387 spots were either not consistent across replicates or were exclusively present in the control samples (Supplementary Figure S1). Of the remaining 321 spots, 71 (22.1%) were up-regulated and 51 (15.9%) were down-regulated in PEG-6000 treated samples compared with the untreated control (Table 1). From these differentially expressed proteins, 36 up-regulated and 18 down-regulated spots—exhibiting at least a 2.0-fold change and a quality score above 80—were selected for identification by MALDI-TOF-TOF mass spectrometry (Table 2 and Table 3).

3.5. Identification of Drought-Responsive Proteins by MALDI-TOF-TOF MS Analysis

MALDI-TOF-TOF mass spectrometric analysis of the selected protein spots, followed by peptide mass fingerprint (PMF)-based MASCOT database searching, successfully identified 43 out of 54 spots (Table 4). Discrepancies between the theoretical and experimental molecular weight (MW) and isoelectric point (pI) were observed for some proteins. Such discrepancies are common in 2-DE experiments, often arising from the presence of highly similar isoforms, proteolytic cleavage, co-/post-translational modifications (PTMs), or artificial modifications. Importantly, these inconsistencies did not compromise the identification of the majority of proteins, which provided valuable insights into the molecular mechanisms underlying the sorghum response to PEG-induced drought stress.

3.6. Functional Classification and Subcellular Location of Identified Proteins

To better understand the characteristics of drought-resistant plants and the functional roles of proteins involved in drought stress responses, the identified proteins were functionally classified using genome annotation databases and the Complete Proteome database. Gene Ontology terms were assigned to all 43 protein spots for specific functional groups manually according to their biological processes and cellular components (Table 5).
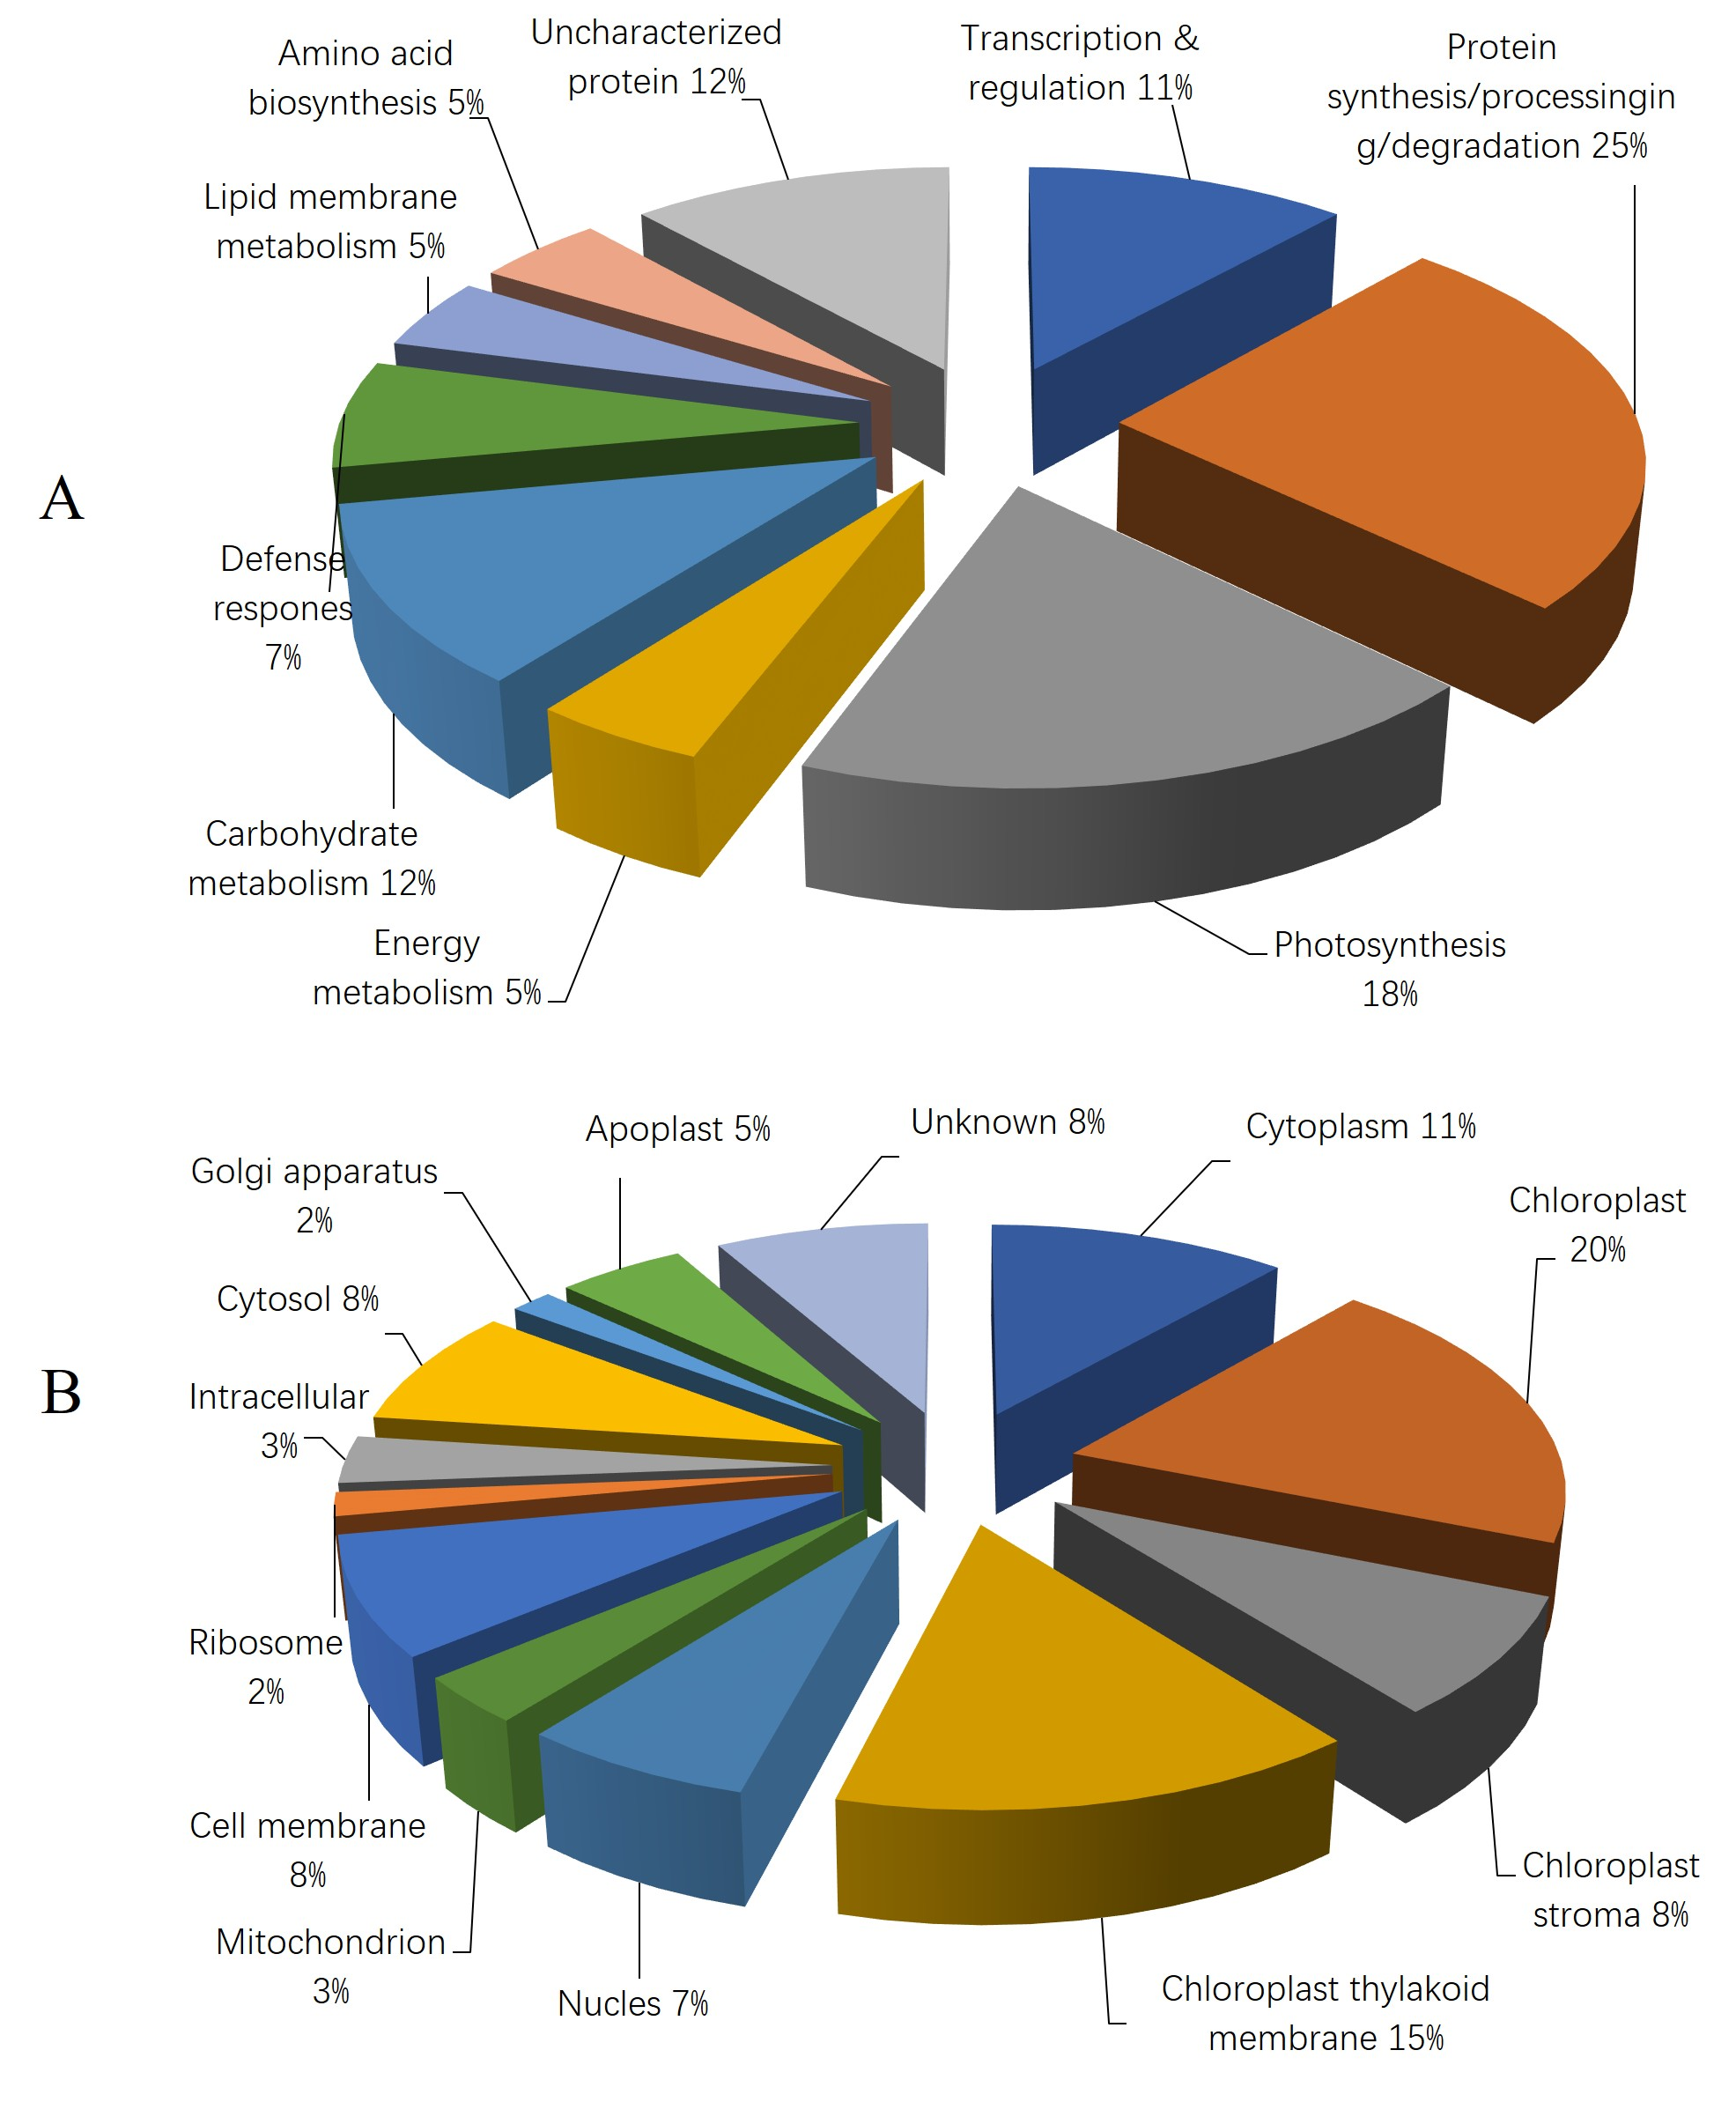
Based on biological function, the identified proteins were classified into nine categories: transcription and regulation; protein synthesis, processing, and degradation; photosynthesis; energy metabolism; carbohydrate metabolism; stress- and defense-related proteins; lipid and membrane metabolism; amino acid metabolism; and uncharacterized proteins. Among these, the majority were associated with protein synthesis, processing, and degradation, followed by photosynthesis and carbohydrate metabolism (Figure 5A).
With respect to subcellular localization, the proteins were categorized into 13 groups (Figure 5B). Most proteins were localized to the chloroplast and chloroplast thylakoid membrane, followed by the cytoplasm, cell membrane, chloroplast stroma, cytosol, nucleus, apoplast, mitochondrion, ribosome, Golgi apparatus, and unknown locations.
The functional classification of identified proteins was carried out using gene ontology (http://geneontology.org/, accessed on 8 April 2026) based on the sorghum and maize genome annotation project database. Subcellular location was identified using SIB Bioinformatic resource portal (http://www.expasy.org/proteomics, accessed on 8 April 2026) with UniProtKB Complete proteome (http://www.uniprot.org/, accessed on 8 April 2026) annotation project databases.

4. Discussion

Our study focuses on the proteomic response of sorghum leaves to acute osmotic stress at a time point representing established physiological adjustment (24 h), rather than an early signaling phase. While we acknowledge that PEG treatment does not fully replicate the complex, gradual onset of soil drying or the associated physical and biological changes in the rhizosphere, it effectively isolates the cellular dehydration response. This allows us to dissect the molecular events triggered by water deficit after a full light-dark cycle, without confounding factors such as soil heterogeneity or differential root penetration. Moreover, our physiological measurements across multiple early time points (3, 6, and 9 h) provide a temporal context linking the initial osmotic adjustments to the proteomic changes observed at 24 h, offering insights into the transition from early responses to a more stable physiological state under drought stress.

4.1. Physiological Alteration in Leaves of Sorghum in Response to Drought Stress

Physiological analyses indicate that the drought-induced defense response was fully activated after 24 h of treatment, confirming this time point as optimal for proteomic investigation. Enhancing crop drought resistance requires a deeper understanding of the traits inherent in drought-tolerant sorghum plants to facilitate their integration into new varieties. This study was designed to elucidate the molecular mechanisms, specifically the proteomic alterations, in sorghum leaves under simulated drought stress. The integrated proteomic and physiological data provide valuable insights into the mechanisms underlying osmotic stress responses in sorghum plants.

4.2. Proteins Involved in Synthesis/Processing/Degradation

Six up-regulated protein spots—eukaryotic translation initiation factor 3 subunit F (eIF-3f, spot 2304), an uncharacterized protein (spot 3103), AAA domain-containing proteins (spots 3702 and 5006), a UVR domain-containing protein (spot 5805), and a PDZ domain-containing protein (spot 6403)—are involved in efficient protein synthesis and proteolysis. Protein synthesis plays a critical role in abiotic stress adaptation. Proteomic studies have shown that multiple components of the protein synthesis machinery alter their expression under drought stress, including ribosomal proteins, translation initiation and elongation factors, and chaperones [61]. As an abiotic stress, drought causes protein damage and/or degradation through oxidative injury or proteolytic activity. Thus, increased levels of proteins involved in synthesis and proteolysis are essential for repairing damaged proteins and restoring metabolic activity and growth in plant cells. Elevated abundance of such proteins has also been reported in sorghum under salt/drought and Cd/Cu stress [33,34,35,36,38], as well as in sugarcane and rice under salt/drought stress [61,62,63].
Five down-regulated protein spots were identified: a peptidase S1 domain-containing protein (spot 3005), a PPIase cyclophilin-type domain-containing protein (spot 0502), and three uncharacterized proteins (spots 2804, 2805, 5101). Among these, spots 2804 and 2805 belong to the HSP70 family and participate in protein refolding. Most heat shock proteins (HSPs) act as molecular chaperones that maintain protein stability and proper folding. HSP70 is a known stress-responsive protein induced by various abiotic stresses such as heat, cold, drought, salinity, and oxidative stress [7]. The reason for the observed reduction in these two chaperones under drought remains unclear; however, similar decreases in HSP70 have been reported in Arabidopsis thaliana [64] and Agrostis stolonifera [65] under salt stress. The uncharacterized protein spot 5101 is associated with ribosome assembly and protein translation, belonging to the ribosomal protein subunit (RPs) family. It forms part of the ribosomal stalk and facilitates ribosome interaction with GTP-bound translation factors. RPs are essential for protein synthesis and play important roles in metabolism, cell division, and growth [66]. The PPIase cyclophilin-type domain protein is implicated in protein folding, while the peptidase S1 domain protein is involved in proteolysis. Reduced abundance of these five proteins suggests impaired protein synthesis, processing, and turnover under drought stress.
The differential expression of various components of the translation machinery indicates the presence of a sophisticated regulatory mechanism controlling protein synthesis and proteolysis in response to drought.

4.3. Proteins Involved in Photosynthesis

Photosynthesis is a fundamental metabolic process in plants, generating carbon sources that are subsequently converted into energy-rich molecules via the Calvin cycle in chloroplasts [67]. This process is highly susceptible to environmental stress, and water deficit can cause detrimental effects and disruptions in photosynthetic activity. Four up-regulated drought-responsive proteins associated with photosynthesis were identified: two uncharacterized proteins (spots 1009, 2704), the Rubisco large subunit (spot 5105), and uroporphyrinogen decarboxylase (spot 5402). RuBisCO comprises eight identical large subunits that contain the catalytic site responsible for carbon fixation. Under stress conditions, the RuBisCO large subunit is often degraded into multiple fragments [68]. Additionally, the RuBisCO large subunit-binding protein beta subunit acts as a chaperone to maintain complex assembly and RuBisCO activity [61]. In this study, drought stress induced the expression of both the RuBisCO large chain and an uncharacterized protein (spot 2704). Alterations in RuBisCO large chain levels have also been reported in maize [69], rapeseed [70], Populus cathayana [71], Arabidopsis [64], and wheat [72]. The uncharacterized protein (spot 2704) was identified as a RuBisCO large subunit-binding protein beta subunit, whose increased abundance has been observed in Glycine max [73], Arabidopsis [23], and wheat [74]. The up-regulation of these two proteins under drought conditions likely supports photosynthetic efficiency and energy production. The putative uncharacterized protein (spot 1009) is associated with chlorophyll biosynthesis, while uroporphyrinogen decarboxylase (spot 5402) participates in heme biosynthesis—both being essential components of the Calvin cycle. The elevated levels of these four proteins suggest that the sorghum inbred line BT × 623 enhances carbon fixation and energy metabolism under drought stress.
The levels of two proteins—cytochrome b6-f complex iron-sulfur subunit (spots 5001, 6001) and transketolase_1 domain-containing protein (spots 4806, 5806)—were decreased in drought-treated sorghum leaves. The cytochrome b6-f complex iron-sulfur subunit is a chloroplast precursor, and a decrease in its abundance has previously been reported in Aeluropus lagopoides [75]. In this study, the down-regulation of this protein suggests impairment of the photosynthetic machinery under water deficit, likely through degradation of photosynthesis-related proteins. Transketolase is involved in the Calvin cycle, and its reduced level under stress has been observed in several plant species [75,76]. Our results align with prior proteomic studies, indicating that photosynthetic activity was compromised under drought conditions.

4.4. Proteins Involved in Carbohydrate Metabolism

Plants require the expression of carbohydrate metabolism-related proteins to sustain normal growth and development under stress conditions [77]. Carbohydrate metabolism is considered one of the most critical pathways regulating sugar synthesis, interconversion, and carbon partitioning in plants [36]. In this study, three proteins involved in carbohydrate metabolism were up-regulated under drought stress: cytoplasmic malate dehydrogenase (spot 6404), an uncharacterized protein (spot 6706), and glucose-1-phosphate adenylyltransferase (spot 7601). Cytoplasmic malate dehydrogenase is a key enzyme in the tricarboxylic acid (TCA) cycle. Its increased abundance has been reported in rice [78] and wheat [72] under salt stress. The uncharacterized protein (spot 6706) exhibits beta-glucosidase activity, which is associated with cyanogenic glycoside catabolism [79], and its elevated levels have been observed in sorghum seedlings under salinity stress [34]. Glucose-1-phosphate adenylyltransferase participates in starch biosynthesis, a component of glycan biosynthesis, and its increased expression in sorghum leaves under salt stress has been documented [80]. The up-regulation of these proteins in drought-stressed sorghum seedlings likely reflects the cellular demand for additional energy to cope with water deficit and repair damage. One protein related to carbohydrate metabolism, malic enzyme, showed reduced abundance under drought stress. Multiple spots (4701, 5005) were identified as malic enzyme with differing molecular weights and isoelectric points. We speculate that spot 5005 (increased intensity) may represent a degradation fragment of malic enzyme (spot 4701, decreased), though this hypothesis requires experimental validation. A moderate reduction in malic enzyme under drought stress has been previously reported in sorghum [33], consistent with our findings. This down-regulation may lead to decreased decarboxylation activity and reduced malate consumption.

4.5. Proteins Involved in Energy Metabolism

Energy metabolism underwent significant alterations under drought stress. In this study, two energy metabolism-related proteins showed abundance changes: the chloroplastic ATP synthase delta chain (spot 0101) was down-regulated, while an uncharacterized protein (spot 7801) was up-regulated. ATP synthase is a key enzyme for assessing photosynthetic capacity in plants [81]. It plays a central role in energy transduction in chloroplasts and mitochondria, and helps maintain chloroplast function during drought. The enzyme consists of two domains—F0 and F1—the latter comprising α, β, γ, δ, and ε subunits [68]. The expression of ATP synthase subunits is influenced by various stresses. Up-regulation of the α and β subunits has been observed in cotton [82] and sugarcane [83] under drought, and in rice under temperature stress [84,85], suggesting a positive correlation between ATP synthase expression and stress tolerance. In contrast, its down-regulation has been documented in wheat [86] and sunflower [81] under water deficit, as well as in sorghum under cadmium and copper stress [35,36]. Although differential expression of the ATP synthase δ subunit under drought has not been widely reported, our study detected its decreased abundance under simulated drought, consistent with observations in sugarcane under osmotic stress [62]. This reduction may lead to decreased ATP production under water deficit. The uncharacterized protein (spot 7801) is predicted to be the NADH-ubiquinone oxidoreductase 75 kDa subunit, a core component of mitochondrial complex I. This complex transfers electrons from NADH to the respiratory chain and participates in ATP metabolism. Its up-regulation has been reported in salt-tolerant rice seedlings [87], aligning with our results and underscoring the importance of sufficient energy supply for sorghum to cope with drought stress.

4.6. Proteins Involved in Transcriptional & Regulation

The transcriptional regulation of drought-responsive genes represents a key adaptive mechanism in plants under various stress conditions [29]. Proteomic analyses indicate that the abundance of transcription-related proteins is altered by drought stress and contributes significantly to drought resistance [61]. In this study, regulatory proteins including an uncharacterized protein (spot 0104, 6004) and maturase K (spot 6804) were significantly up-regulated under drought stress. The uncharacterized protein (spot 0104) is identified as an RNA helicase, a protein family involved in RNA unwinding, replication, and transcription. Previous studies have reported salt-induced up-regulation of RNA helicase in wheat [88] and Arabidopsis [64]. The uncharacterized protein (spot 6004) contains BAH and TFIIS domains, which are associated with chromatin binding and transcriptional regulation. Maturase K, an RNA processing and splicing-related protein, facilitates intron binding and modulates gene expression at the transcriptional level [35]. Its increased abundance has been observed under salt and copper stress [68,89]. These regulatory proteins likely function within transcriptional networks to coordinate diverse processes in response to drought.
Two additional proteins—an uncharacterized protein (spot 0209) and a guanylate cyclase domain-containing protein (spot 4201)—were down-regulated under water deficit (Table 3). The uncharacterized protein (spot 0209) belongs to a kinase family implicated in transcriptional regulation, while the guanylate cyclase domain-containing protein may participate in cyclic nucleotide biosynthesis. Their down-regulation may reflect an optimized transcriptional program under drought conditions.

4.7. Proteins Involved in Stress Response

Stress-related proteins play pivotal roles in plant adaptation to environmental stress [61,63,90]. In this study, two stress-associated proteins—a disease resistance protein (spot 0601) and catalase (CAT, spot 9603)—were down-regulated in sorghum seedling leaves under drought treatment, while a NAD(P)-binding domain-containing protein (spot 3208) was up-regulated under water deficit. Down-regulation of disease resistance protein has been previously observed in Salicornia europaea under salinity stress [91], consistent with our findings. CAT, localized predominantly in peroxisomes, catalyzes the decomposition of H2O2 into water and oxygen, thereby mitigating ROS accumulation under abiotic stress. Reduced CAT levels have been reported in citrus [76], cucumber [92], and barley [93] under salt stress. The down-regulation of CAT observed here suggests that drought-resistant sorghum may employ alternative ROS scavenging pathways under water deficit, a finding supported by our physiological data (Figure 3).
The up-regulated NAD(P)-binding domain-containing protein (spot 3208) is associated with defense responses. Increased expression of stress-responsive proteins under abiotic stress is commonly reported [7]. These results indicate that reprogramming of metabolic pathways represents a key mechanism of drought resistance in sorghum.

4.8. Proteins Involved in Lipid Membrane Metabolic

Two protein spots related to lipid metabolism—a PlsC domain-containing protein (spot 7104) and a PMR5N domain-containing protein (spot 8201)—exhibited decreased abundance under drought stress (Table 3). The PlsC domain-containing protein is implicated in cutin biosynthesis, while the PMR5N domain-containing protein functions as an integral membrane component. Lipid synthesis and efficient transport are essential for maintaining membrane structural homeostasis under stress conditions [61]. Thus, the down-regulation of these proteins suggests that drought stress disrupts lipid metabolism, triggering rapid membrane remodeling as part of cellular adaptation to drought.

4.9. Proteins Involved in Amino Acid Metabolic

During drought stress, proteins involved in amino acid metabolism, including an uncharacterized protein (spot 6704) and cysteine synthase (spot 7301), were up-regulated in sorghum leaves. Cysteine synthase is a key enzyme in cysteine biosynthesis and contributes to increased glutathione (GSH) levels—a central component of the GSH-ascorbate cycle that detoxifies hydrogen peroxide [94]. Up-regulation of cysteine synthase has been observed in rice seedlings under oxidative and salt stress [68], as well as in aluminum-treated rice roots [95]. In this study, elevated cysteine synthase expression may enhance sorghum drought tolerance by mitigating oxidative damage caused by reactive molecules. The uncharacterized protein (spot 6704) is a nitrate-responsive protein homologous to ferredoxin–nitrite reductase, which plays an essential role in nitrate assimilation and the nitrogen cycle. Water deficit can induce nitrate accumulation in plants [63], and elevated nitrate levels may become toxic, inhibiting metabolic processes. Ferredoxin–nitrite reductase alleviates this toxicity by reducing nitrite to NO or NH3, thereby supplying precursors for nitrogenous metabolites and supporting plant growth under stress. Up-regulation of this enzyme has been reported in salt-stressed wheat leaves and roots [72,88]. The overexpression of this ferredoxin–nitrite reductase homolog in our study underscores its significant role in sorghum’s adaptation to water deficit.

4.10. Uncharacterized Protein

In this study, four up-regulated protein spots (1109, 1206, 8303, 9105) were identified as putative uncharacterized proteins with unknown functions. Another up-regulated spot (5008) was characterized as a NAB domain-containing protein, which exhibits actin filament-binding activity, though its precise biological role remains unclear. As a C4 cereal, sorghum has had its full genome sequenced since 2009 [22], yet most of its gene products remain experimentally unvalidated and are annotated as hypothetical proteins in databases. Such proteins are computationally predicted from genomic data but lack experimental confirmation at the protein level [36]. The present findings align with recent sorghum proteomic studies [33,34,35,36,37,38,39,40,41,42,71,80].
The 43 confidently identified proteins corresponded to 38 unique gene products, as several proteins appeared in multiple spots on 2-DE gels with variations in molecular weight (Mr) and/or isoelectric point (pI). Examples include transketolase_1 domain-containing protein (spots 4806 and 5806), cytochrome b6-f complex iron-sulfur subunit (spots 5001 and 6001), and malic enzyme (spots 4701 and 5005). These differences may arise from post-translational modifications (PTMs)—such as glycosylation or phosphorylation—that alter protein charge or mass. Similar electrophoretic patterns have been widely reported [34,61,96,97,98]. The presence of a single protein in multiple gel locations may reflect PTMs, isoforms from multigene families, proteolytic fragments, products of alternative splicing, protein subunits, or modifications introduced during sample preparation.

5. Conclusions

Water deficit poses a global challenge that constrains crop quality and yield, with particularly severe impacts on resource-limited rural communities in developing regions. Sorghum is recognized for its inherent drought tolerance; however, its molecular-level responses remain insufficiently characterized. Investigating drought resistance mechanisms in C4 cereal crops may provide insights that could contribute to efforts aimed at improving plant drought resilience. This study presents an integrated physiological and proteomic analysis to explore the biological responses of sorghum to PEG-induced drought stress.
The physiological response of sorghum to drought stress observed in this study included enhanced water retention capacity and the mitigation of oxidative damage, possibly through the synergistic action of antioxidant enzymes such as SOD, POD, and PPO. Proteomic analysis of sorghum leaves revealed that changes in the abundance of multiple functional protein groups were associated with the response to drought stress. These included proteins involved in photosynthesis, carbohydrate and energy metabolism, transcriptional regulation, and reactive oxygen species (ROS) scavenging. In addition, alterations in proteins related to protein synthesis, processing, and proteolysis were identified, suggesting that these processes may contribute to the established phase of the drought stress response. Further studies will be required to validate the functional significance of these candidate proteins under true drought conditions.

Supplementary Materials

The following supporting information can be downloaded at: https://www.mdpi.com/article/10.3390/plants15081255/s1, Figure S1. Two-D gel analysis with proteins isolated from leaves of control sorghum seedling (A) or leaves of PEG-6000 treated sorghum seedlings (B) and harvested at 24 h post treatment.

Author Contributions

H.L. and X.D. planned experiment. H.L., Q.H. and Q.K. conducted experiment, collected and analyzed the data, and prepared the draft. Z.Y. and M.C. help organize data and revise manuscript. S.-S.K., S.Z. and X.D. helped in drafting the manuscript and interpretation the results. All authors have read and agreed to the published version of the manuscript.

Funding

This study was supported by the Project of the 12th Five-years National Science and Technology Support Plan of China (2015BAD22B01) and the International (Regional) Cooperation and Exchange Program of the National Natural Science Foundation of China (41561144011).

Data Availability Statement

The original contributions presented in this study are included in the article/Supplementary Material. Further inquiries can be directed to the corresponding author.

Acknowledgments

We thank our associate Wang Baiqun for providing sorghum inbred BT × 623 seeds.

Conflicts of Interest

The authors declare no conflicts of interest.

References

  1. Fahad, S.; Bajwa, A.A.; Nazir, U.; Anjum, S.A.; Farooq, A.; Zohaib, A.; Sadia, S.; Nasim, W.; Adkins, S.; Saud, S.; et al. Crop Production under Drought and Heat Stress: Plant Responses and Management Options. Front. Plant. Sci. 2017, 8, 1147. [Google Scholar] [CrossRef]
  2. Sheteiwy, M.S.; Ali, D.F.I.; Xiong, Y.C.; Brestic, M.; Skalicky, M.; Hamoud, Y.A.; Ulhassan, Z.; Shaghaleh, H.; AbdElgawad, H.; Farooq, M.; et al. Physiological and biochemical responses of soybean plants inoculated with Arbuscular mycorrhizal fungi and Bradyrhizobium under drought stress. BMC Plant Biol. 2021, 21, 195. [Google Scholar] [CrossRef] [PubMed]
  3. Lobell, D.B.; Field, C.B. Global scale climate—Crop yield relationships and the impacts of recent warming. Environ. Res. Lett. 2007, 2, 014002. [Google Scholar] [CrossRef]
  4. Fang, Y.; Xiong, L. General mechanisms of drought response and their application in drought resistance improvement in plants. Cell. Mol. Life Sci. 2015, 72, 673–689. [Google Scholar] [CrossRef] [PubMed]
  5. Tardieu, F.; Simonneau, T.; Muller, B. The Physiological Basis of Drought Tolerance in Crop Plants: A Scenario-Dependent Probabilistic Approach. Annu. Rev. Plant Biol. 2018, 69, 733–759. [Google Scholar] [CrossRef]
  6. Tari, I.; Laska, Z.; Takacs, Z.; Poor, P. Response of sorghum to abiotic stresses: A review. J. Agron. Crop Sci. 2013, 199, 264–274. [Google Scholar] [CrossRef]
  7. Ngara, R.; Ndimba, B.K.; Mock, H.P. Model plant systems in salinity and drought stress proteomics studies: A perspective on Arabidopsis and Sorghum. Plant Biol. 2014, 16, 1029–1032. [Google Scholar] [CrossRef]
  8. Gill, S.S.; Tuteja, N. Reactive oxygen species and antioxidant machinery in abiotic stress tolerance in crop plants. Plant Physiol. Biochem. 2010, 48, 909–930. [Google Scholar] [CrossRef]
  9. Ulhassan, Z.; Gill, R.A.; Huang, H.F.; Ali, S.; Mwamba, T.M.; Ali, B.; Huang, Q.; Hamid, Y.; Khan, A.R.; Wang, W.J.; et al. Selenium mitigates the chromium toxicity in Brassicca napus L. by ameliorating nutrients uptake, amino acids metabolism and antioxidant defense system. Plant Physiol. Biochem. 2019, 145, 142–152. [Google Scholar] [CrossRef]
  10. Ulhassan, Z.; Gill, R.A.; Ali, S.; Mwamba, T.M.; Ali, B.; Wang, J.; Huang, Q.; Aziz, R.; Zhou, W.J. Dual behavior of selenium: Insights into physio-biochemical, anatomical and molecular analyses of four Brassica napus cultivars. Chemosphere 2019, 225, 329–341. [Google Scholar] [CrossRef]
  11. Yang, S.; Ulhassan, Z.; Shah, A.M.; Khan, A.R.; Azhar, W.; Hamid, Y.; Hussain, S.; Sheteiwy, M.S.; Salam, A.; Zhou, W.J. Salicylic acid underpins silicon in ameliorating chromium toxicity in rice by modulating antioxidant defense, ion homeostasis and cellular ultrastructure. Plant Physiol. Biochem. 2021, 166, 1001–1013. [Google Scholar] [CrossRef] [PubMed]
  12. Tsugane, K.; Kobayashi, K.; Niwa, Y.; Ohba, Y.; Kobayashi, W.H. A Recessive Arabidopsis Mutant That Grows Photoautotrophically under Salt Stress Shows Enhanced Active Oxygen Detoxification. Plant Cell 1999, 11, 1195–1206. [Google Scholar] [CrossRef] [PubMed][Green Version]
  13. Ogbaga, C.C.; Stepien, P.; Johnson, G.N. Sorghum (Sorghum bicolor) varieties adopt strongly contrasting strategies in response to drought. Physiol. Plant. 2014, 152, 389–401. [Google Scholar] [CrossRef] [PubMed]
  14. Mutava, R.N.; Prasad, P.V.V.; Tuinstra, M.R.; Kofoid, K.D.; Yu, J. Characterization of sorghum genotypes for traits related to drought tolerance. Field Crops Res. 2015, 123, 10–18. [Google Scholar] [CrossRef]
  15. Salih, A.A.; Ali, I.A.; Lux, A.; Luxová, M.; Cohen, Y.; Sugimoto, Y.; Inanaga, S. Rooting, water uptake, and xylem structure adaptation to drought of two sorghum cultivars. Crop Sci. 1999, 39, 168–173. [Google Scholar] [CrossRef]
  16. Ludlow, M.M.; Santamaria, J.M.; Fukai, S. Contribution of osmotic adjustment to grain yield in Sorghum bicolor (L.) Moench under water-ltd. conditions. II. Water stress after anthesis. Aust. J. Agric. Res. 1990, 41, 67–78. [Google Scholar] [CrossRef]
  17. Buchanan, C.D.; Lim, S.; Salzman, R.A.; Kagiampakis, I.; Morishige, D.T.; Weers, B.D.; Klein, R.R.; Pratt, L.H.; Cordonnier-Pratt, M.-M.; Klein, P.E.; et al. Sorghum bicolor’s transcriptome response to dehydration, high salinity and ABA. Plant Mol. Biol. 2005, 58, 699–720. [Google Scholar] [CrossRef]
  18. Dugas, D.V.; Monaco, M.K.; Olson, A.; Klein, R.R.; Kumari, S.; Ware, D.; Klein, P.E. Functional annotation of the transcriptome of Sorghum bicolor in response to osmotic stress and abscisic acid. BMC Genom. 2011, 12, 514. [Google Scholar] [CrossRef]
  19. Johnson, S.M.; Lim, F.L.; Finkler, A.; Fromm, H.; Slabas, A.R.; Knight, M.R. Transcriptomic analysis of Sorghum bicolor responding to combined heat and drought stress. BMC Genom. 2014, 15, 456. [Google Scholar] [CrossRef]
  20. Abdel-Ghany, S.E.; Ullah, F.; Ben-Hur, A.; Reddy, A.S.N. Transcriptome Analysis of Drought-Resistant and Drought-Sensitive Sorghum (Sorghum bicolor) Genotypes in Response to PEG-Induced Drought Stress. Int. J. Mol. Sci. 2020, 21, 772. [Google Scholar] [CrossRef]
  21. Jansen, R.C.; Nap, J.P.; Mlynarova, L. Errors in genomics and proteomics. Nat. Biotechnol. 2002, 20, 19. [Google Scholar] [CrossRef]
  22. Paterson, A.H.; Bowers, J.E.; Bruggmann, R.; Dubchak, I.; Grimwood, J.; Gundlach, H.; Haberer, G.; Hellsten, U.; Mitros, T.; Poliakov, A.; et al. The Sorghum bicolor genome and the diversification of grasses. Nature 2009, 457, 551–556. [Google Scholar] [CrossRef] [PubMed]
  23. Kim, Y.O.; Pan, S.; Jung, C.H.; Kang, H. A zinc finger-containing glycine-rich RNA-Binding protein, atRZ-1a, has a negative impact on seed germination and seedling growth of Arabidopsis thaliana under salt or drought stress conditions. Plant Cell Physiol. 2007, 48, 1170–1181. [Google Scholar] [CrossRef] [PubMed]
  24. Wienkoop, S.; Baginsky, S.; Weckwerth, W. Arabidopsis thaliana as a model organism for plant proteome research. J. Proteom. 2010, 73, 2239–2248. [Google Scholar] [CrossRef] [PubMed]
  25. Salekdeh, G.H.; Siopongco, J.; Wade, L.J.; Ghareyazie, B.; Bennett, J. Proteomic analysis of rice leaves during drought stress and recovery. Proteomics 2002, 2, 1131–1145. [Google Scholar] [CrossRef]
  26. Riccardi, F.; Gazeau, P.; Jacquemot, M.P.; Vincent, D.; Zivy, M. Deciphering genetic variations of proteome responses to water deficit in maize leaves. Plant Physiol. Biochem. 2004, 42, 1003–1011. [Google Scholar] [CrossRef]
  27. Vincent, D.; Lapierre, C.; Pollet, B.; Cornic, G.; Negroni, L.; Zivy, M. Water deficits affect caffeate O-methyltransferase, lignification, and related enzymes in maize leaves. A proteomic investigation. Plant Physiol. 2005, 137, 949–960. [Google Scholar] [CrossRef]
  28. Hajheidari, M.; Abdollahian-Noghabi, M.; Askari, H.; Heidari, M.; Sadeghian, S.Y.; Ober, E.S.; Salekdeh, G.H. Proteome analysis of sugar beet leaves under drought stress. Proteomics 2005, 5, 950–960. [Google Scholar] [CrossRef]
  29. Jiang, G.Q.; Wang, Z.; Shang, H.H.; Yang, W.L.; Hu, Z.; Phillips, J.; Deng, X. Proteome analysis of leaves from the resurrection plant Boea hygrometrica in response to dehydration and rehydration. Planta 2007, 225, 1405–1420. [Google Scholar] [CrossRef]
  30. Ingle, R.A.; Schmidt, U.G.; Farrant, J.M.; Thomson, J.A.; Mundree, S.G. Proteomic analysis of leaf proteins during dehydration of the resurrection plant Xerophyta viscosa. Plant Cell Environ. 2007, 30, 435–446. [Google Scholar] [CrossRef]
  31. Rollins, J.A.; Habte, E.; Templer, S.E.; Colby, T.; Schmidt, J.; von Korff, M. Leaf proteome alterations in the context of physiological and morphological responses to drought and heat stress in barley (Hordeum vulgare L.). J. Exp. Bot. 2013, 64, 3201–3212. [Google Scholar] [CrossRef] [PubMed]
  32. Urban, M.O.; Vasek, J.; Klima, M.; Krtkova, J.; Kosova, K.; Prasil, I.T.; Vitamvas, P. Proteomic and physiological approach reveals drought-induced changes in rapeseeds: Water-saver and water-spender strategy. J. Proteom. 2017, 152, 188–205. [Google Scholar] [CrossRef] [PubMed]
  33. Jedmowski, C.; Ashoub, A.; Beckhaus, T.; Berberich, T.; Karas, M.; Brüggemann, W. Comparative Analysis of Sorghum bicolor Proteome in Response to Drought Stress and following Recovery. Int. J. Proteom. 2014, 2014, 395905. [Google Scholar] [CrossRef]
  34. Ngara, R.; Ndimba, R.; Borch-Jensen, J.; Jensen, O.N.; Ndimba, B. Identification and profiling of salinity stress-responsive proteins in Sorghum bicolor seedlings. J. Proteom. 2012, 75, 4139–4150. [Google Scholar] [CrossRef] [PubMed]
  35. Roy, S.K.; Cho, S.W.; Kwon, S.J.; Kamal, A.M.; Kim, S.W.; Oh, M.W.; Lee, M.S.; Chung, K.Y.; Xin, Z.G.; Woo, S.H. Morpho-Physiological and Proteome Level Responses to Cadmium Stress in Sorghum. PLoS ONE 2016, 11, e0150431. [Google Scholar] [CrossRef]
  36. Roy, S.K.; Kwon, S.J.; Cho, S.W.; Kamal, A.H.M.; Kim, S.W.; Sarker, K.; Oh, M.W.; Lee, M.-S.; Chung, K.Y.; Xin, Z.; et al. Leaf proteome characterization in the context of physiological and morphological changes in response to copper stress in sorghum. Biometals 2016, 29, 495–513. [Google Scholar] [CrossRef]
  37. Fadoul, H.E.; Siddig, M.A.E.; Abdalla, A.W.H.; Hussein, A.A.E. Physiological and proteomics analysis of two contrasting sorghum bicolor genotypes in response to drought stress. Aust. J. Crop Sci. 2018, 12, 1543–1551. [Google Scholar] [CrossRef]
  38. Goche, T.; Shargie, N.G.; Cummins, I.; Brown, A.P.; Chivasa, S.; Ngara, R. Comparative physiological and root proteome analyses of two sorghum varieties responding to water limitation. Sci. Rep. 2020, 10, 11835. [Google Scholar] [CrossRef]
  39. Li, H.B.; Li, Y.L.; Ke, Q.B.; Kwak, S.S.; Zhang, S.Q.; Deng, X.P. Physiological and Differential Proteomic Analyses of Imitation Drought Stress Response in Sorghum bicolor Root at the Seedling Stage. Int. J. Mol. Sci. 2020, 21, 9174. [Google Scholar] [CrossRef]
  40. Li, Y.N.; Tan, B.L.; Wang, D.P.; Mu, Y.Y.; Li, G.Y.; Zhang, Z.G.; Pan, Y.H.; Zhu, L. Proteomic Analysis Revealed Different Molecular Mechanisms of Response to PEG Stress in Drought-Sensitive and Drought-Resistant Sorghums. Int. J. Mol. Sci. 2022, 23, 13297. [Google Scholar] [CrossRef]
  41. Abreha, K.B.; Enyew, M.; Carlsson, A.S.; Vetukuri, R.R.; Feyissa, T.; Motlhaodi, T.; Ng’uni, D.; Geleta, M. Sorghum in dryland: Morphological, physiological, and molecular responses of sorghum under drought stress. Planta 2022, 255, 20. [Google Scholar] [CrossRef] [PubMed]
  42. Ali, A.E.E.; Husselmann, L.H.; Tabb, D.L.; Ludidi, N. Comparative Proteomics Analysis between Maize and Sorghum Uncovers Important Proteins and Metabolic Pathways Mediating Drought Tolerance. Life 2023, 13, 170. [Google Scholar] [CrossRef] [PubMed]
  43. Ahmad, R.; Kim, M.D.; Back, K.H.; Kim, H.S.; Lee, H.S.; Kwon, S.Y.; Murata, N.; Chung, W.I.; Kwak, S.S. Stress-induced expression of choline oxidase in potato plant chloroplasts confers enhanced tolerance to oxidative, salt, and drought stresses. Plant Cell Rep. 2008, 27, 687–698. [Google Scholar] [CrossRef] [PubMed]
  44. Sunarpi; Horie, T.; Motoda, J.; Kubo, M.; Hua, Y. Enhanced salt tolerance mediated by AtHKT1 transporter- induced Naþ unloading from xylem vessels to xylem parenchyma cells. Plant J. 2005, 44, 928–938. [Google Scholar] [CrossRef]
  45. Bradford, M.M. A rapid and sensitive method for the quantitation of microgram quantities of protein utilizing the principle of protein-dye binding. Anal. Biochem. 1976, 72, 248–254. [Google Scholar] [CrossRef]
  46. Beyer, W.F.; Fridovich, I. Assaying for superoxide dismutase activity: Some large consequences of minor changes in conditions. Anal. Biochem. 1987, 161, 559–566. [Google Scholar] [CrossRef]
  47. Kwak, S.S.; Kim, S.K.; Lee, M.S.; Jung, K.H.; Park, I.H.; Liu, J.R. Acidic peroxidases from suspension-cultures of sweet potato. Phytochemistry 1995, 39, 981–984. [Google Scholar] [CrossRef]
  48. Bates, L.S.; Waldren, R.P.; Teare, I.D. Rapid determination of free proline for water-stress studies. Plant Soil 1973, 39, 205–207. [Google Scholar] [CrossRef]
  49. Wang, W.; Scali, M.; Vignani, R.; Spadafora, A.; Sensi, E.; Mazzuca, S.; Cresti, M. Protein extraction for two-dimensional electrophoresis from olive leaf, a plant tissue containing high levels of interfering compounds. Electrophoresis 2003, 24, 2369–2375. [Google Scholar] [CrossRef]
  50. Shevchenko, A.; Wilm, M.; Vorm, O.; Mann, M. Mass spectrometric sequencing of proteins silver-stained polyacrylamide gels. Anal. Chem. 1996, 68, 850–858. [Google Scholar] [CrossRef]
  51. Perkins, D.N.; Pappin, D.J.C.; Creasy, D.M.; Cottrell, J.S. Probability-based protein identification by searching sequence databases using mass spectrometry data. Electrophoresis 1999, 20, 3551–3567. [Google Scholar] [CrossRef]
  52. Koca, H.; Bor, M.; Ozdemir, F.; Türkan, I. The effect of salt stress on lipid peroxidation, antioxidative enzymes and proline content of sesame cultivars. Environ. Exp. Bot. 2007, 60, 344–351. [Google Scholar] [CrossRef]
  53. Nxele, X.; Klein, A.; Ndimba, B.K. Drought and salinity stress alters ROS accumulation, water retention, and osmolyte content in sorghum plants. S. Afr. J. Bot. 2017, 108, 261–266. [Google Scholar] [CrossRef]
  54. Maggio, A.; Miyazaki, S.; Veronese, P.; Fujita, T.; Ibeas, J.I.; Damsz, B.; Narasimhan, M.L.; Hasegawa, P.M.; Joly, R.J.; Bressan, R.A. Does proline accumulation play an active role in stress-induced growth reduction? Plant J. 2010, 31, 699–712. [Google Scholar] [CrossRef] [PubMed]
  55. Claussen, W. Proline as a measure of stress in tomato plants. Plant Sci. 2005, 168, 241–248. [Google Scholar] [CrossRef]
  56. Ben Rejeb, K.; Abdelly, C.; Savouré, A. How reactive oxygen species and proline face stress together. Plant Physiol. Biochem. 2014, 80, 278–284. [Google Scholar] [CrossRef]
  57. Ulhassan, Z.; Huang, Q.; Gill, R.A.; Ali, S.; Mwamba, T.M.; Ali, B.; Hina, F.; Zhou, W.J. Protective mechanisms of melatonin against selenium toxicity in Brassica napus: Insights into physiological traits, thiol biosynthesis and antioxidant machinery. BMC Plant Biol. 2019, 19, 507. [Google Scholar] [CrossRef]
  58. Horváth, E.; Szalai, G.; Janda, T. Induction of Abiotic Stress Tolerance by Salicylic Acid Signaling. J. Plant Growth Regul. 2007, 26, 290–300. [Google Scholar] [CrossRef]
  59. Møller, I.M.; Jensen, P.E.; Hansson, A. Oxidative modifications to cellular components in plants. Annu. Rev. Plant Biol. 2007, 58, 459–481. [Google Scholar] [CrossRef]
  60. Sharma, P.; Dubey, R.S. Drought Induces Oxidative Stress and Enhances the Activities of Antioxidant Enzymes in Growing Rice Seedlings. Plant Growth Regul. 2005, 46, 209–221. [Google Scholar] [CrossRef]
  61. Zhang, H.; Han, B.; Wang, T.; Chen, S.; Li, H.; Zhang, Y.; Dai, S. Mechanisms of Plant Salt Response: Insights from Proteomics. J. Proteome Res. 2012, 11, 49–67. [Google Scholar] [CrossRef] [PubMed]
  62. Zhou, G.; Yang, L.T.; Li, Y.R.; Zou, C.L.; Huang, L.P.; Qiu, L.H.; Huang, X.; Srivastava, M.K. Proteomic Analysis of Osmotic Stress-Responsive Proteins in Sugarcane Leaves. Plant Mol. Biol. Rep. 2012, 30, 349–359. [Google Scholar] [CrossRef]
  63. Singh, R.; Jwa, N.S. Understanding the responses of rice to environmental stress using proteomics. J. Proteome Res. 2013, 12, 4652–4669. [Google Scholar] [CrossRef] [PubMed]
  64. Pang, Q.; Chen, S.; Dai, S.; Chen, Y.; Wang, Y.; Yan, X. Comparative proteomics of salt tolerance in Arabidopsis thaliana and Thellungiella halophila. J. Proteome Res. 2010, 9, 2584–2599. [Google Scholar] [CrossRef]
  65. Xu, C.; Sibicky, T.; Huang, B. Protein profile analysis of salt-responsive proteins in leaves and roots in two cultivars of creeping bentgrass differing in salinity tolerance. Plant Cell Rep. 2010, 29, 595–615. [Google Scholar] [CrossRef]
  66. Zhang, W.; Zhang, H.; Ning, L.; Li, B.; Bao, M. Quantitative Proteomic Analysis Provides Novel Insights into Cold Stress Responses in Petunia Seedlings. Front. Plant Sci. 2016, 7, 136. [Google Scholar] [CrossRef]
  67. Hussain, S.; Ulhassan, Z.; Brestic, M.; Zivcak, M.; Zhou, W.J.; Allakhverdiev, S.I.; Yang, X.H.; Safdar, M.E.; Yang, W.Y.; Liu, W.G. Photosynthesis research under climate change. Photosynth. Res. 2021, 150, 5–19. [Google Scholar] [CrossRef]
  68. Liu, T.; Shen, C.; Wang, Y.; Huang, C.; Shi, J.; Balestrini, R. New Insights into Regulation of Proteome and Polysaccharide in Cell Wall of Elsholtzia splendens in Response to Copper Stress. PLoS ONE 2014, 9, e109573. [Google Scholar] [CrossRef]
  69. Zorb, C.; Schmitt, S.; Neeb, A.; Karl, S.; Linder, M.; Schubert, S. The biochemical reaction of maize (Zea mays L.) to salt stress is characterized by a mitigation of symptoms and not by a specific adaptation. Plant Sci. 2004, 167, 91–100. [Google Scholar] [CrossRef]
  70. Bandehagh, A.; Salekdeh, G.H.; Toorchi, M.; Mohammadi, A.; Komatsu, S. Comparative proteomic analysis of canola leaves under salinity stress. Proteomics 2011, 11, 1965–1975. [Google Scholar] [CrossRef]
  71. Chen, F.; Zhang, S.; Jiang, H.; Ma, W.; Korpelainen, H.; Li, C. Comparative proteomics analysis of salt response reveals sex-related photosynthetic inhibition by salinity in Populus cathayana cuttings. J. Proteome Res. 2011, 10, 3944–3958. [Google Scholar] [CrossRef] [PubMed]
  72. Peng, Z.; Wang, M.; Li, F.; Lv, H.; Li, C.; Xia, G. A Proteomic Study of the Response to Salinity and Drought Stress in an Introgression Strain of Bread Wheat. Mol. Cell. Proteom. 2009, 8, 2676–2686. [Google Scholar] [CrossRef] [PubMed]
  73. Sobhanian, H.; Razavizadeh, R.; Nanjo, Y.; Ehsanpour, A.A.; Jazii, F.R.; Motamed, N.; Komatsu, S. Proteome analysis of soybean leaves, hypocotyls and roots under salt stress. Proteome Sci. 2010, 8, 19. [Google Scholar] [CrossRef] [PubMed]
  74. Caruso, G.; Cavaliere, C.; Guarino, C.; Gubbiotti, R.; Foglia, P.; Laganà, A. Identification of changes in Triticum durum L. leaf proteome in response to salt stress by two-dimensional electrophoresis and MALDI-TOF mass spectrometry. Anal. Bioanal. Chem. 2008, 391, 381–390. [Google Scholar] [CrossRef]
  75. Sobhanian, H.; Motamed, N.; Jazii, F.R.; Nakamura, T.; Komatsu, S. Salt Stress Induced Differential Proteome and Metabolome Response in the Shoots of Aeluropus lagopoides (Poaceae), a Halophyte C-4 Plant. J. Proteome Res. 2010, 9, 2882–2897. [Google Scholar] [CrossRef]
  76. Tanou, G.; Job, C.; Rajjou, L.; Arc, E.; Belghazi, M.; Diamantidis, G.; Molassiotis, A.; Job, D. Proteomics reveals the overlapping roles of hydrogen peroxide and nitric oxide in the acclimation of citrus plants to salinity. Plant J. 2010, 60, 795–804. [Google Scholar] [CrossRef]
  77. Hossain, Z.; Komatsu, S. Contribution of proteomic studies towards understanding plant heavy metal stress response. Front. Plant Sci. 2012, 3, 43–48. [Google Scholar] [CrossRef]
  78. Chitteti, B.R.; Peng, Z. Proteome and phosphoproteome differential expression under salinity stress in rice (Oryza sativa) roots. J. Proteome Res. 2007, 6, 1718–1727. [Google Scholar] [CrossRef]
  79. Ganjewala, D.; Kumar, S.; Asha, D.S.; Ambika, K. Advances in cyanogenic glycosides biosynthesis and analyses in plants: A review. Acta Biol. Szeged. 2010, 54, 6814–6818. [Google Scholar]
  80. Swami, A.K.; Alam, S.I.; Sengupta, N.; Sarin, R. Differential proteomic analysis of salt stress response in Sorghum bicolor leaves. Environ. Exp. Bot. 2011, 71, 321–328. [Google Scholar] [CrossRef]
  81. Tezara, W.; Mitchell, V.J.; Driscoll, S.D.; Lawlor, D.W. Water stress inhibits plant photosynthesis by decreasing coupling factor and ATP. Nature 1999, 401, 914–917. [Google Scholar] [CrossRef]
  82. Deeba, F.; Pandey, A.K.; Ranjan, S.; Mishra, A.; Singh, R.; Sharma, Y.; Shirke, P.A.; Pandey, V. Physiological and proteomic responses of cotton (Gossypium herbaceum L.) to drought stress. Plant Physiol. Biochem. 2012, 53, 6–18. [Google Scholar] [CrossRef] [PubMed]
  83. Jangpromma, N.; Kitthaisong, S.; Lomthaisong, K.; Daduang, S.; Jaisil, P.; Thammasirirak, S. A Proteomics Analysis of Drought Stress-Responsive Proteins as Biomarker for Drought-Tolerant Sugarcane Cultivars. Am. J. Biochem. Biotechnol. 2010, 6, 89–102. [Google Scholar] [CrossRef]
  84. Cui, S.X.; Huang, F.; Wang, J.; Ma, X.; Cheng, Y.S.; Liu, J.Y. A proteomic analysis of cold stress responses in rice seedlings. Proteomics 2005, 5, 3162–3172. [Google Scholar] [CrossRef]
  85. Lee, D.G.; Ahsan, N.; Lee, S.H.; Kang, K.Y.; Bahk, J.D.; Lee, I.J.; Lee, B.H. A proteomic approach in analyzing heat-responsive proteins in rice leaves. Proteomics 2007, 7, 3369–3383. [Google Scholar] [CrossRef]
  86. Caruso, G.; Cavaliere, C.; Foglia, P.; Gubbiotti, R.; Samperi, R.; Lagana, A. Analysis of drought responsive proteins in wheat (Triticum durum) by 2D-PAGE and MALDI-TOF mass spectrometry. Plant Sci. 2009, 177, 570–576. [Google Scholar] [CrossRef]
  87. Li, X.J.; Yang, M.F.; Chen, H.; Qu, L.Q.; Chen, F.; Shen, S.H. Abscisic acid pretreatment enhances salt tolerance of rice seedlings: Proteomic evidence. BBA Proteins Proteom. 2010, 1804, 929–940. [Google Scholar] [CrossRef]
  88. Wang, M.C.; Peng, Z.Y.; Li, C.L.; Li, F.; Xia, G.M. Proteomic analysis on a high salt tolerance introgression strain of Triticum aestivum/Thinopyrum ponticum. Proteomics 2008, 8, 1470–1489. [Google Scholar] [CrossRef]
  89. Chattopadhyay, A.; Subba, P.; Pandey, A.; Bhushan, D.; Kumar, R.; Datta, A.; Chakraborty, S.; Chakraborty, N. Analysis of the grasspea proteome and identification of stress-responsive proteins upon exposure to high salinity, low temperature, and abscisic acid treatment. Phytochemistry 2011, 72, 1293–1307. [Google Scholar] [CrossRef]
  90. Kosova, K.; Vitamvas, P.; Urban, M.O.; Prasil, I.T.; Renaut, J. Plant Abiotic Stress Proteomics: The Major Factors Determining Alterations in Cellular Proteome. Front. Plant Sci. 2018, 9, 122. [Google Scholar] [CrossRef]
  91. Wang, X.C.; Fan, P.X.; Song, H.M.; Chen, X.Y.; Lil, X.F.; Li, Y.X. Comparative Proteomic Analysis of Differentially Expressed Proteins in Shoots of Salicornia europaea under Different Salinity. J. Proteome Res. 2009, 8, 3331–3345. [Google Scholar] [CrossRef]
  92. Du, C.X.; Fan, H.F.; Guo, S.R.; Tezuka, T.; Li, J. Proteomic analysis of cucumber seedling roots subjected to salt stress. Phytochemistry 2010, 71, 1450–1459. [Google Scholar] [CrossRef]
  93. Witzel, K.; Weidner, A.; Surabhi, G.-K.; Borner, A.; Mock, H.P. Salt stress-induced alterations in the root proteome of barley genotypes with contrasting response towards salinity. J. Exp. Bot. 2009, 60, 3545–3557. [Google Scholar] [CrossRef]
  94. Britto, D.T.; Kronzucker, H.J. NH4+ toxicity in higher plants: A critical review. J. Plant Physiol. 2002, 159, 567–584. [Google Scholar] [CrossRef]
  95. Yang, Q.; Wang, Y.; Zhang, J.; Shi, W.; Qian, C.; Peng, X. Identification of aluminum-responsive proteins in rice roots by a proteomic approach: Cysteine synthase as a key player in Al response. Proteomics 2007, 7, 737–749. [Google Scholar] [CrossRef]
  96. Yu, J.; Chen, S.; Zhao, Q.; Wang, T.; Yang, C.; Diaz, C.; Sun, G.; Dai, S. Physiological and proteomic analysis of salinity tolerance in Puccinellia tenuiflora. J. Proteome Res. 2011, 10, 3852–3870. [Google Scholar] [CrossRef]
  97. Zhao, Q.; Zhang, H.; Wang, T.; Chen, S.; Dai, S. Proteomics-based investigation of salt-responsive mechanisms in plant roots. J. Proteom. 2013, 82, 230–253. [Google Scholar] [CrossRef]
  98. Long, R.; Li, M.; Zhang, T.; Kang, J.; Sun, Y.; Cong, L.; Gao, Y.; Liu, F.; Yang, Q. Comparative Proteomic Analysis Reveals Differential Root Proteins in Medicago sativa and Medicago truncatula in Response to Salt Stress. Front. Plant Sci. 2016, 7, 424. [Google Scholar] [CrossRef] [PubMed]
Figure 1. Effects of imitation drought stress on Relative Water Content (RWC) and leaf water potential of sorghum. Changes in RWC (A) and Water potential (B) of sorghum leaf in response to imitated drought stress (two-week-old seedlings treated with 10% PEG-6000 for 3 h). Data presented mean ± SD (n = 3). Different letters indicate statistically significant differences at p < 0.05.
Plants 15 01255 g001
Figure 2. MDA and Proline analysis for determination of lipid peroxidation in sorghum leaves under imitation drought stress. Changes in MDA (A) and Proline (B) contents of sorghum leaf in response to PEG simulated drought stress (two-week-old seedlings treated with 10% PEG-6000). Data presented mean ± SD (n = 3). Different letters indicate statistically significant differences at p < 0.05.
Plants 15 01255 g002aPlants 15 01255 g002b
Figure 3. Antioxidative enzymes ((A): SOD; (B): POD; (C): PPO) activity of sorghum leaf in response to simulated drought stress (two-week-old seedlings treated with 10% PEG-6000). Data presented mean ± SD (n = 3). Different letters indicate statistically significant differences at p < 0.05.
Plants 15 01255 g003
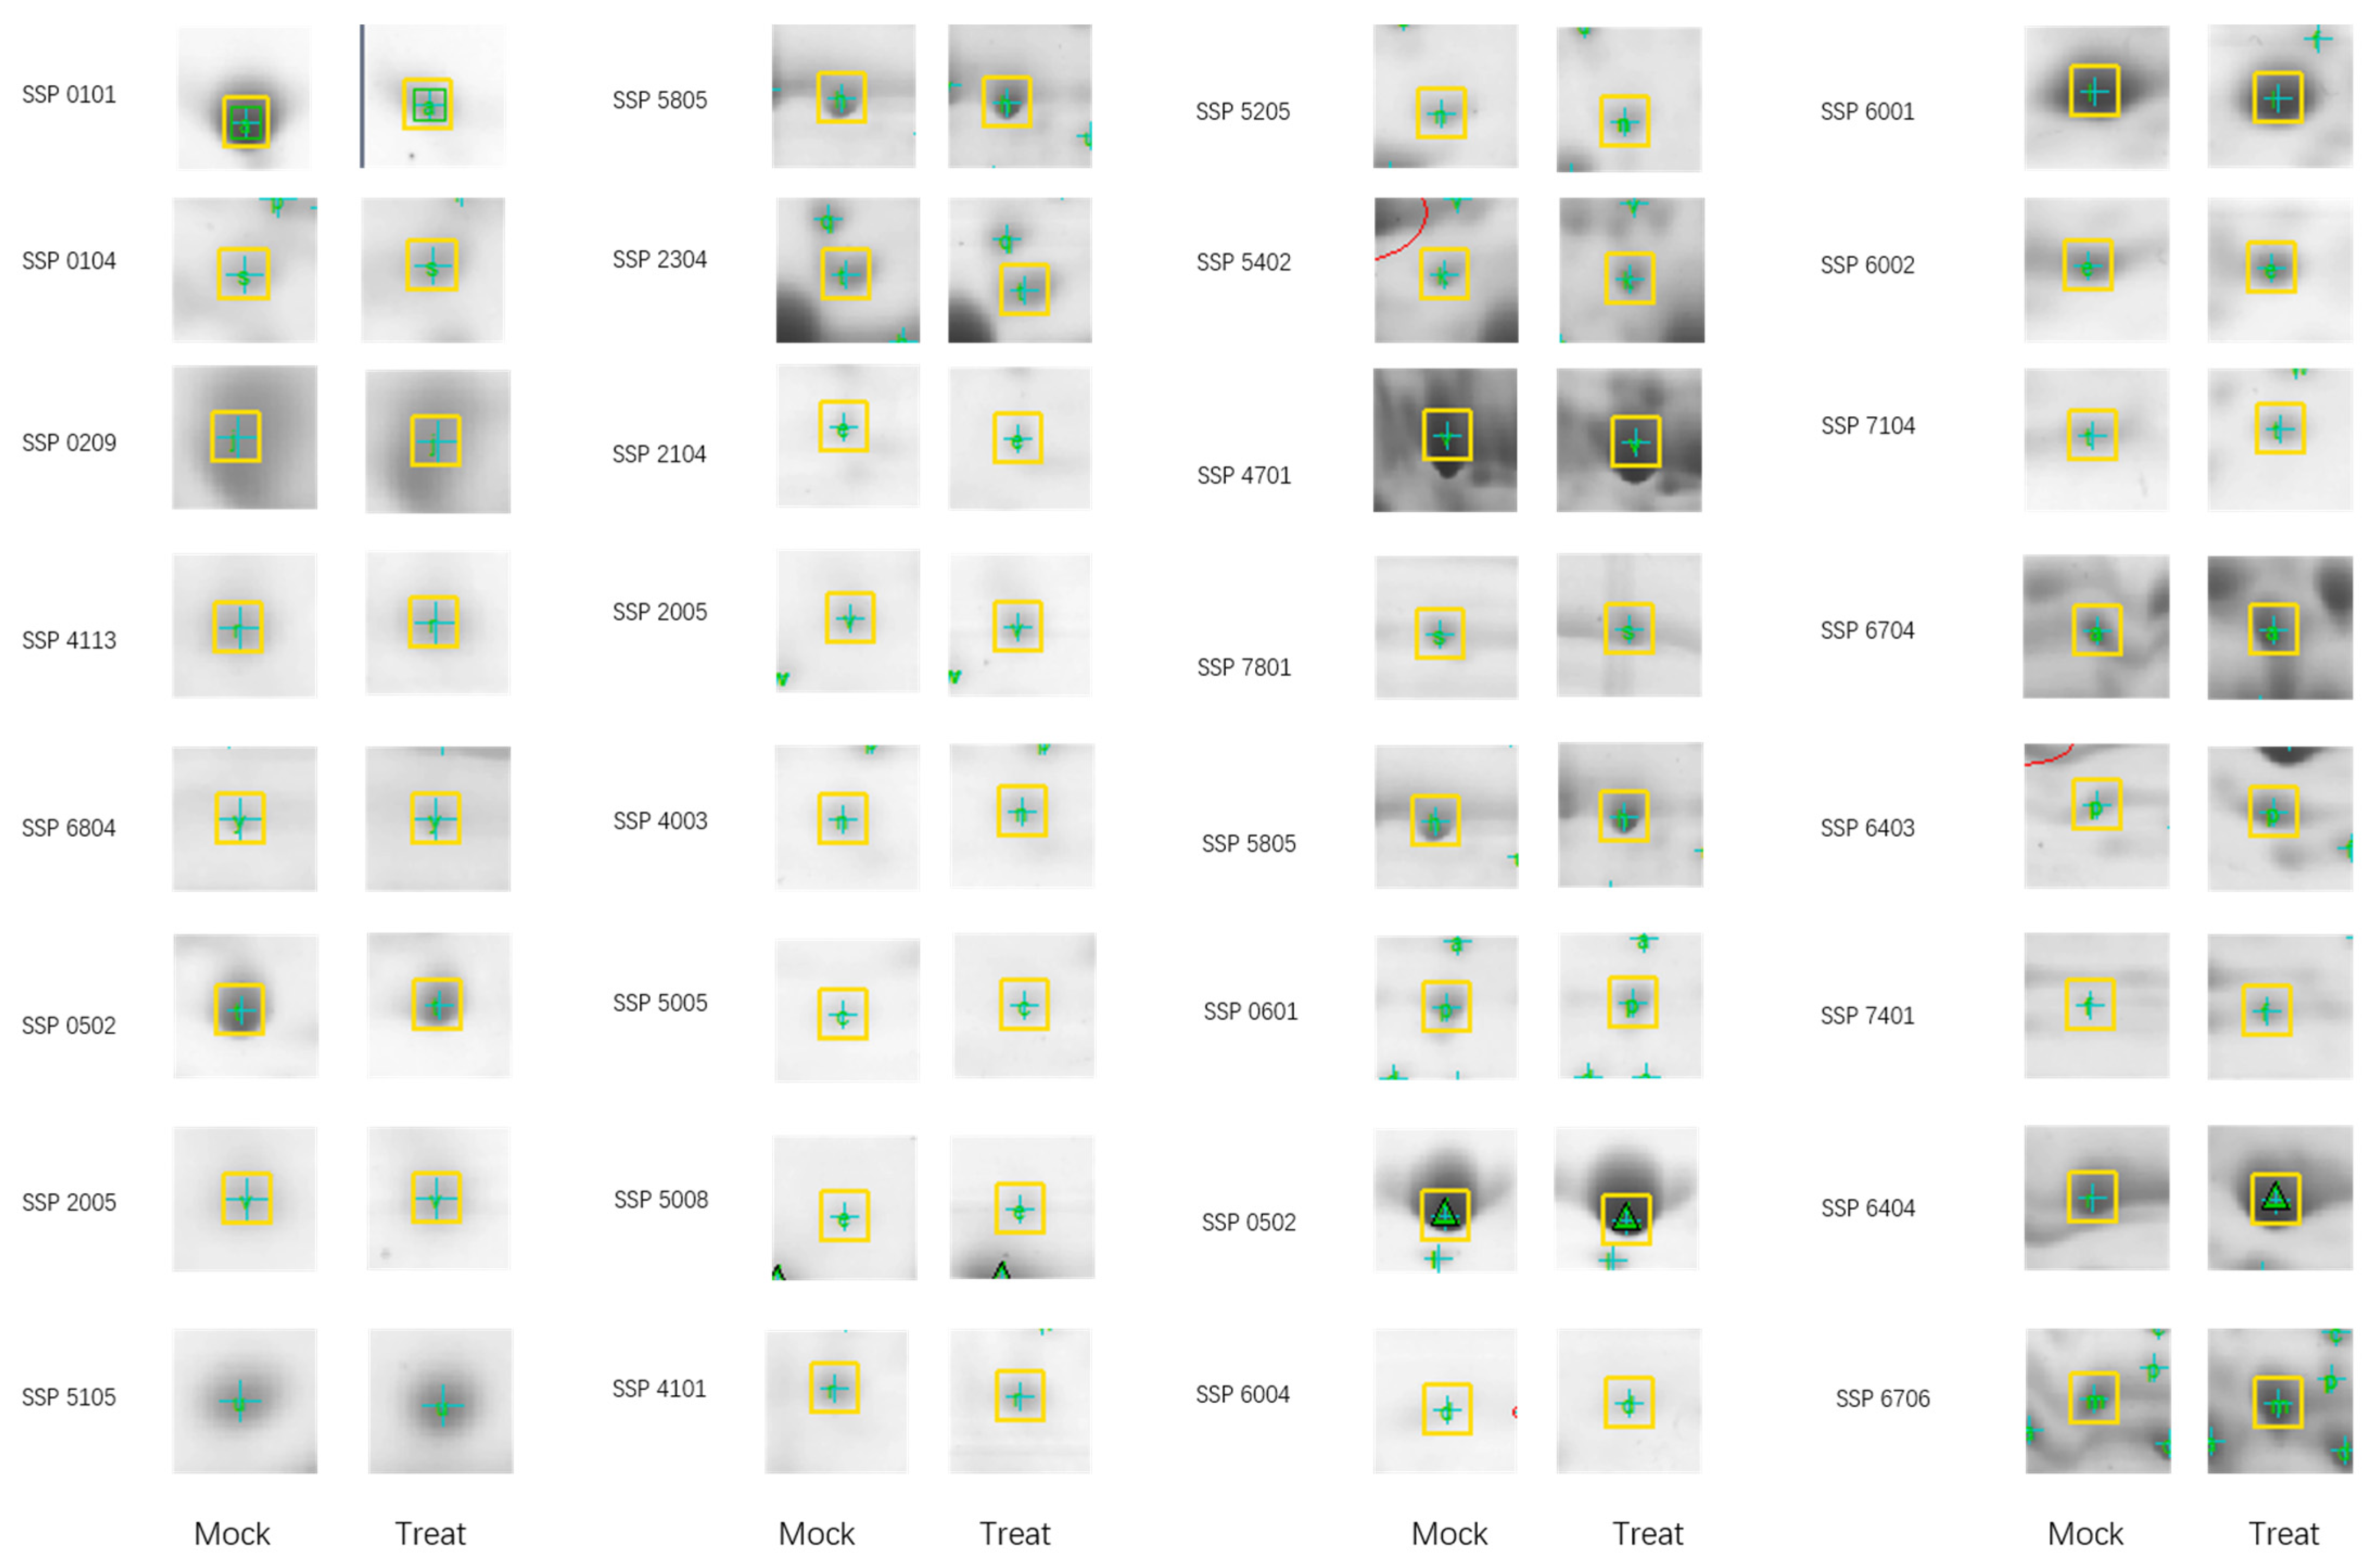
Figure 4. Two-D gel analysis with proteins isolated from the leaves of control sorghum seedlings (Mock) or the leaves of PEG-6000 treated sorghum seedlings (Treat) and harvested at 24 h post treatment. A comparison of 40 randomly selected protein spots is illustrated in Figure 4. The complete set of protein spot comparisons is presented in Supplementary Figure S1. Protein spot (Automatic allocation of protein serial number by PDQuest Software) with altered expression levels (fold change > 2.0, quality score >80, p < 0.05) and were selected for MALDI-TOF-TOF analysis.
Plants 15 01255 g004
Figure 5. The frequency distribution for the 43 identified proteins in the leaves of sorghum seedlings within functional categories determined based on their biological functions (A) and subcellular localization (B).
Plants 15 01255 g005
Table 1. Average number of protein spots of sorghum leaf revealed after 2DE of sorghum seedlings treated with 10% PEG-6000 at 24 h post treatment. Total numbers of up- or down-regulated spots were obtained after matching between control (CK) and treated with 10% PEG-6000 gels. Results are means of three independent replicates.
Mock PEG Treated
Total number of spots708613
Replicates 321
Up-regulated (Quality score > 80 and fold > 2.0) 36
Up-regulated (Quality score < 80 and fold > 2.0) 35
Down-regulated (Quality score > 80 and fold > 2.0) 18
Down-regulated (Quality score < 80 and fold > 2.0) 33
Other spots (fold < 2.0)  199
Table 2. Up-regulated protein spots of sorghum seedlings treated with PEG-6000 imitation drought stress at 24 h post treatment identified by PMF query. Criteria of selection for identification were a 2.0 folds change compared to the mock and a Mascot quality score of over 80. All values are means from three independent experiments.
Spot No
(SSP) a
Protein Function bSubcellular Location cGene/Locus dMock Average QtyPEG-6000 Treated
Average Qty
Fold
Change e
0104ATP-dependent helicase activity, hydrolase activity, DNA binding, protein binding, ATP bindingnucleolus, cytoplasmSb03g004420266.2 ± 19.2533.9 ± 22.12.01
0206Failed to identifyunknownN1087.2 ± 79.12173.1 ± 191.72.00
1009carotenoid biosynthetic process, chlorophyll biosynthetic process unsaturated fatty acid biosynthetic processchloroplast thylakoid membrane, thylakoid lumenSb03g006310230.0 ± 33.6467 ± 130.52.03
1109acid phosphatase activityunknownSb09g005960118.8 ± 21.3244.3 ± 51.42.06
1113Failed to identifyunknownN244.3 ± 42.7494.2 ± 77.32.02
1206acid phosphatase activityunknownSb09g0059601610.4 ± 364.73269.5 ± 582.72.03
2005Failed to identifyunknownN256.6 ± 13.3518.9 ± 85.12.02
2104Failed to identifyunknownN126.3 ± 17.7255.6 ± 11.92.02
2304Initiation factor, protein biosynthesisCytoplasmSb09g026780378.4 ± 94.4781.3 ± 124.32.05
2704Protein import into mitochondrial intermembrane space, ‘de novo’ protein folding, protein refoldingCytosolSb10g001120318.1 ± 65.9782.4 ± 134.32.46
3103translation elongation factor activity, translational elongation, peptide biosynthetic processCytoplasmSb08g002610603.5 ± 22.21259.9 ± 86.12.09
3208Defense responseChloroplast stroma, apoplast, thylakoidSb09g001130419.7 ± 102.3865.8 ± 206.52.06
3702ATPase activity, metalloendopeptidase
activity, proteolysis
chloroplast envelope, chloroplast thylakoid membraneSb10g026830713.8 ± 21.61519.7 ± 242.42.13
4003Failed to identifyunknownN185.4 ± 11.8425.1 ± 32.12.29
4006Failed to identifyunknownN184.4 ± 12.6381.3 ± 74.82.07
4101Failed to identifyunknownN256.5 ± 27.3521.2 ± 56.42.03
5001Electron transport, transport,
oxidation-reduction process
chloroplast thylakoid membrane, chloroplast envelope, plasma membraneSb09g020820637.0 ± 44.23275.9 ± 670.15.14
5005malate metabolic process, pyruvate metabolic processchloroplastSb03g003230174.4 ± 37.0400.5 ± 32.02.30
5006ATPase activity, metalloendopeptidase
activity, proteolysis
chloroplast envelope, chloroplast thylakoid membraneSb10g026830237.0 ± 11.6504.6 ± 32.92.13
5008Actin filament bindingplasma membrane100812191157.7 ± 36.6343.9 ± 78.72.18
5105Photosynthesis, Calvin cycle,
Carbon dioxide fixation, Photorespiration
chloroplastSb01g038810492.2 ± 51.01080.0 ± 167.32.19
5402protoporphyrinogen IX biosynthetic process,
Porphyrin biosynthesis
chloroplast envelope, chloroplast stromarbcl137.3 ± 8.6302.8 ± 93.52.21
5805Chaperone, protein metabolic processchloroplastSb06g01459087.4 ± 9.7428.1 ± 53.24.90
6002Failed to identifyunknown 698.6 ± 41.11489.0 ± 143.52.13
6004BAH domain, chromatin binding,
transcription, DNA-templated
nucleusSb01g028380244.5 ± 40.8495.0 ± 78.92.02
6403protein binding, serine-type endopeptidase
activity, proteolysis
chloroplast thylakoid, nucleus, thylakoid lumenSb09g028940235.8 ± 35.9700.1 ± 31.52.97
6404carbohydrate metabolic process, malate metabolic process, tricarboxylic acid cycle, oxidation-reduction processapoplast, plasma membrane, vacuole, chloroplast stromaSb01g019280985.5 ± 51.31997.5 ± 103.22.03
6704oxidoreductase activity, iron-sulfur cluster binding, heme binding, response to nitratemitochondrion, apoplast, chloroplast stromaSb04g034160403.1 ± 42.3808.8 ± 82.62.01
6706beta-glucosidase activity carbohydrate metabolic processCytoplasmSb08g007610806.8 ± 58.01644.1 ± 185.32.04
6804mRNA processing, tRNA processingchloroplastAFV0944171.9 ± 7.0149.4 ± 14.92.08
7301cysteine biosynthetic process from serine, Amino-acid biosynthesisCytoplasmNP_001105469434.3 ± 35.6931.6 ± 17.42.15
7303Failed to identifyunknownN2306.3 ± 199.75789.2 ± 434.92.51
7601Starch biosynthesis, glycogen biosynthetic processChloroplastSb01g008940249.6 ± 17.3501.5 ± 23.12.01
7801ATP synthesis coupled electron transport, response to oxidative stresschloroplast, mitochondrial respiratory chain complex ISb01g010210239.2 ± 16.9546.8 ± 30.42.30
8303uncharacterized proteinunknownSb03g008870514.5 ± 62.71043.1 ± 73.42.03
9105uncharacterized proteinunknownSelmodraft_442983241.1 ± 35.7554.9 ± 66.32.30
Note: a SSP: Automatic allocation of protein serial number by PDQuest, spot no: spot number. b Function were identified using Phytozome v11.0 with Sorghum bicolor v3.1 (https://phytozome.jgi.doe.gov/pz/portal.html#!search?show=BLAST&method=Org_Sbicolor, accessed on 5 August 2024) genome annotation project databases and SIB Bioinformatic resource portal (http://www.expasy.org/proteomics, accessed on 5 August 2024) with UniProtKB Complete proteome (http://www.uniprot.org/, accessed on 8 April 2026) annotation project database. c Subcellular location was identified using SIB Bioinformatic resource portal (http://www.expasy.org/proteomics, accessed on 5 August 2024) with UniProtKB Complete proteome (http://www.uniprot.org/, accessed on 5 August 2024) annotation project databases. d Gene locus were identified using Phytozome v11.0 with Sorghum bicolor v3.1 (https://phytozome.jgi.doe.gov/pz/portal.html#!search?show=BLAST&method=Org_Sbicolor, accessed on 5 August 2024) genome annotation project databases and SIB Bioinformatic resource portal (http://www.expasy.org/proteomics, accessed on 5 August 2024) with UniProtKB Complete proteome (http://www.uniprot.org/, accessed on 8 April 2026) annotation project database. e Fold change = PEG treated average Qty/Mock average Qty. Qty: Normalized protein spot quantity.
Table 3. Down-regulated protein spots of sorghum seedlings treated with PEG-6000 imitate drought stress at 24 h post treatment identified by PMF query. Criteria of selection for identification were a 0.5 folds change compared to the mock and a Mascot quality score of over 80. All values are means from three independent experiments.
Spot No (SSP) aProtein Function bSubcellular Location cGene/Locus dMock Average QtyPEG-6000 Treated
Average Qty
Fold
Change e
0101proton-transporting ATP synthase activity, rotational mechanism, ATP synthesis coupled proton transportchloroplast thylakoid membrane.Sb04g0278102152.2 ± 117.5742.8 ± 4.50.35
0209protein kinase activity, protein phosphorylation, regulation of transcription, DNA-templatedIntracellularSb08g018240500.6 ± 47.5249.6 ± 13.80.50
0502peptidyl-prolyl cis-trans isomerase activity, protein peptidyl-prolyl isomerization, protein foldingchloroplast stroma, chloroplast thylakoid membrane, thylakoid lumenSb07g0193203192.0 ± 585.21562.2 ± 277.90.49
0601signal transduction, defense responsecytosolicBra022850351.3 ± 61.5173.2 ± 17.00.49
2804cellular response to unfolded protein, protein refoldingcytosol, nucleolusSb01g0395301154.3 ± 116.9491.2 ± 18.60.43
2805cellular response to unfolded protein, protein refoldingcytoplasmSb08g018750687.2 ± 134.3269.0 ± 39.10.39
3005Hydrolase, Protease, Serine protease, proteolysisunknownChlncdraft_575551425.7 ± 104.3665.7 ± 53.00.47
4113Failed to identifyunknownN364.7 ± 60.7138.7 ± 37.10.38
4201intracellular signal transduction, cyclic nucleotide biosynthetic processIntracellularMicpun_559321307.3 ± 121.1611.0 ± 87.30.47
4701malate metabolic process, pyruvate metabolic processchloroplastSb03g0032301244.4 ± 198.6310.9 ± 58.30.25
4806Pentose-phosphate shuntcytosolSb10g0022203106.1 ± 234.41066.9 ± 62.80.34
5101ribosome biogenesis, translationlarge ribosomal subunitSb01g038810966.1 ± 44.7481.9 ± 41.00.5
5806Pentose-phosphate shuntcytosolSb10g002220619.4 ± 47.9294.4 ± 31.00.48
6001electron transport, transport, oxidation-reduction processchloroplast thylakoid membrane, chloroplast envelope, plasma membraneSb09g0208203528.1 ± 185.81587.5 ± 348.60.45
7104cutin biosynthetic process, dephosphorylationTransmembrane, integral component of membrane, MembraneSb01g008880715.0 ± 67.3342.2 ± 19.70.48
7907Failed to identifyunknownN252.1 ± 21.5119.9 ± 9.40.48
8201O-acetyltransferase activityGolgi apparatusSb07g0224202002.2 ± 202.8856.5 ± 78.30.43
9603hydrogen peroxide catabolic process, response to oxidative stressCytoplasmSb04g0011303145.6 ± 509.9827.8 ± 108.80.26
Note: a Automatic allocation of protein serial number by PDQuest. b Function were identified using Phytozome v11.0 with Sorghum bicolor v3.1 (https://phytozome.jgi.doe.gov/pz/portal.html#!search?show=BLAST&method=Org_Sbicolor, accessed on 8 April 2026) genome annotation project databases and SIB Bioinformatic resource portal (http://www.expasy.org/proteomics, accessed on 8 April 2026) with UniProtKB Complete proteome (http://www.uniprot.org/, accessed on 8 April 2026) annotation project database. c Subcellular location was identified using SIB Bioinformatic resource portal (http://www.expasy.org/proteomics, accessed on 8 April 2026) with UniProtKB Complete proteome (http://www.uniprot.org/, accessed on 8 April 2026) annotation project databases. d Gene locus were identified using Phytozome v11.0 with Sorghum bicolor v3.1 (https://phytozome.jgi.doe.gov/pz/portal.html#!search?show=BLAST&method=Org_Sbicolor, accessed on 8 April 2026) genome annotation project databases and SIB Bioinformatic resource portal (http://www.expasy.org/proteomics, accessed on 8 April 2026) with UniProtKB Complete proteome (http://www.uniprot.org/, accessed on 8 April 2026) annotation project database. e Fold change = PEG treated average Qty/Mock average Qty.
Table 4. Protein identification from 2-DE gels by Peptide Mass Fingerprint.
Spot No
(SSP) a
Protein Identification bMascot Score cMatched PeptideSequence
Coverage (%) d
Estimated
Mw(kDa)/PI e
Experimental Mw(kDa)/PI fGene/Locus gAccession No hTaxonomy i
0101ATP synthase delta chain, chloroplast precursor12084426.7/4.8422.3/4.20Sb04g027810XP_002454273Sorghum bicolor
0104Uncharacterized protein89112337.2/7.2325.3/4.75Sb03g004420XP_002455105Sorghum bicolor
0209Uncharacterized protein77121886.6/6.5828.7/4.69Sb08g018240XP_002442325Sorghum bicolor
0502PPIase cyclophilin-type domain-containing protein204265746.7/4.8341.7/4.58Sb07g019320XP_002444271Sorghum bicolor
0601Disease resistance protein861416104.3/5.8257.9/4.60Bra022850ACP30600Brassica rapa subsp. pekinensis
1009Uncharacterized protein9485320.6/5.5914.1/4.79Sb03g006310XP_002455210Sorghum bicolor
1109Uncharacterized protein111124629.4/5.1525.3/5.00Sb09g005960XP_002439412Sorghum bicolor
1206Uncharacterized protein131155129.4/5.1527.7/4.83Sb09g005960XP_002439412Sorghum bicolor
2304Eukaryotic translation initiation factor 3 subunit F (eIF-3f)96133547.1/8.1130.2/5.26Sb09g026780KXG22419Sorghum bicolor
2704Uncharacterized protein281355961.9/5.4762.7/5.17Sb10g001120XP_002437709Sorghum bicolor
2804Uncharacterized protein163233971.4/5.0977.1/5.10Sb01g039530XP_002468097Sorghum bicolor
2805Uncharacterized protein186284971.4/5.1378.8/5.15Sb08g018750XP_002442353Sorghum bicolor
3005Peptidase S1 domain-containing protein81122467.1/9.8116.8/5.31Chlncdraft_57555EFN56680Chlorella variabilis
3103Uncharacterized protein84113426.5/8.521.8/5.37Sb08g002610XP_002442770Sorghum bicolor
3208NAD(P)-bd_dom domain-containing protein134114231.9/6.9929.6/5.27Sb09g001130XP_002439133Sorghum bicolor
3702AAA domain-containing protein228365372.6/5.6868.6/5.27Sb10g026830KXG20578Sorghum bicolor
4201Guanylate cyclase domain-containing protein74231418.9/6.3827.1/5.39Micpun_55932XP_002499691Micromonas sp. RCC299
4701Malic enzyme151263969.9/6.2360.7/5.55Sb03g003230XP_002455030Sorghum bicolor
4806Transletolase_1 domain-containing protein203294969.1/5.4180.1/5.51Sb10g002220KXG19207Sorghum bicolor
5001Cytochrome b6-f complex iron-sulfur subunit (EC: 7.1.1.6)8964024.3/8.2018.1/5.54Sb09g020820XP_002441121Sorghum bicolor
5005Malic enzyme82142669.9/6.2316.0/5.72Sb03g003230XP_002455030Sorghum bicolor
5006AAA domain-containing protein218334772.6/5.6812.5/5.65Sb10g026830KXG20578Sorghum bicolor
5008NAB domain-containing protein77271420.8/5.2918.3/5.71100812191XP_003556062Glycine max
5101Uncharacterized protein134166324.4/8.7322.8/5.53Sb01g038810XP_002465435Sorghum bicolor
5105Rubisco large subunit
RuBisCO large chain family (EC = 4.1.1.39)
89103127.3/7.9823.9/5.76rbclAFC75624Premna microphylla
5402Uroporphyrinogen decarboxylase119143743.5/6.9838.6/5.76Sb01g036030XP_002467895Sorghum bicolor
5805UVR domain-containing protein2733940102.2/6.3291.7/5.75Sb06g014590XP_002447724Sorghum bicolor
5806Transletolase_1 domain-containing protein108163669.1/5.4180.1/5.65Sb10g002220KXG19207Sorghum bicolor
6001Cytochrome b6-f complex iron-sulfur subunit (EC: 7.1.1.6)94104324.3/8.2018.2/5.71Sb09g020820XP_002441121Sorghum bicolor
6004Uncharacterized protein73151614.8/6.7116.7/5.67Sb01g028380KXG38864Sorghum bicolor
6403PDZ domain-containing protein109102745.0/8.3436.6/5.87Sb09g028940 OQU78439Sorghum bicolor
6404Malate dehydrogenase (EC = 1.1.1.37)106174635.8/5.7637.9/5.87Sb01g019280XP_002467079Sorghum bicolor
6704Uncharacterized protein165304166.4/6.3362.9/5.81Sb04g034160XP_002454602Sorghum bicolor
6706Uncharacterized protein149144235.4/6.4226.0/6.10Sb08g007610XP_002443073Sorghum bicolor
6804Maturase K85102334.2/9.5077.7/5.91N/AAFV09441Drimia delagoensis
7104PlsC domain-containing protein87102255.8/9.1026.0/6.10Sb01g008880XP_002463916Sorghum bicolor
7301Cysteine synthase (EC = 2.5.1.47)107255134.3/5.9133.4/5.92Cys2NP_001105469Zea mays
7601Glucose-1-phosphate adenylyltransferase (EC = 2.7.7.27)194204755.7/8.3351.1/5.95Sb01g008940XP_002463921Sorghum bicolor
7801Uncharacterized protein109253881.7/6.0081.7/6.04Sb01g010210XP_002463995Sorghum bicolor
8201PMR5N domain-containing protein7672539.2/8.5925.8/6.43Sb07g022420XP_002444474Sorghum bicolor
8303Uncharacterized protein7783431.6/6.0631.6/6.34Sb03g008870XP_002457532Sorghum bicolor
9105Putative uncharacterized protein80133940.0/5.3024.6/6.89Selmodraft_442983XP_002976022Selaginella moellendorffii
9603Catalase
(EC=1.11.1.6)
257316454.2/6.7157.9/6.86Sb04g001130OQU84208Sorghum bicolor
Note: a Automatic allocation of protein serial number by PDQuest. b,h,i Estimates based on NCBInr by Mascot procedure (in the Viridiplantae library). c Scores greater than 73 were considered significant (p < 0.05). d The highest matching value of sequence coverage. e Calculated by MS. Mw: Molecular weight. f Estimates based on 2D-gel data. PI: isoelectric point. g Gene locus were identified using Phytozome v11.0 with Sorghum bicolor v3.1 (https://phytozome.jgi.doe.gov/pz/portal.html#!search?show=BLAST&method=Org_Sbicolor, accessed on 8 April 2026) genome annotation project databases and SIB Bioinformatic resource portal (http://www.expasy.org/proteomics, accessed on 8 April 2026) with UniProtKB Complete proteome (http://www.uniprot.org/, accessed on 8 April 2026) annotation project database.
Table 5. The 43 identified proteins in the leaves of sorghum seedlings within functional categories based on their biological functions and subcellular localization.
CategoriesClassification BasisProtein Spot Serial Number (Total 43)
Biological functionTranscription & regulation0104 ↑, 0209 ↓, 4201 ↓, 6004 ↑, 6804 ↑
Protein synthesis/processing/degradation0502 ↓, 2304 ↑, 2804 ↓, 2805 ↓, 3005 ↓, 3103 ↑,
3702 ↑, 5006 ↑, 5101 ↓, 5805 ↑, 6403 ↑
Photosynthesis1009 ↑, 2704 ↑, 4806 ↓, 5001 ↑, 5105 ↑, 5402 ↑,
5806 ↓, 6001 ↓
Energy metabolism0101 ↓, 7801 ↑
Carbohydrate metabolism4701 ↓, 5005 ↑, 6404 ↑, 6706 ↑, 7601 ↑
Defense responses0601 ↓, 3208 ↑, 9603 ↓
Lipid membrane metabolism7104 ↓, 8201 ↓
Amino acid biosynthesis6704 ↑, 7301 ↑
Uncharacterized protein1109 ↑, 1206 ↑, 5008 ↑, 8303 ↑, 9105 ↑
Subcellular localizationCytoplasm0104 ↑, 2304 ↑, 2805 ↓, 6706 ↑, 7301 ↑, 9603 ↓, 3103 ↑
Chloroplast3702 ↑, 4701 ↓, 5001 ↑, 5005 ↑, 5006 ↑, 5105 ↑,
5402 ↑, 5805 ↑, 6404 ↑, 6804 ↑, 7601 ↑, 7801 ↑
Chloroplast stroma0502 ↓, 3208 ↑, 5402 ↑, 6404 ↑, 6704 ↑
Chloroplast thylakoid membrane0101 ↓, 0502 ↓, 1009 ↑, 3208 ↑, 3702 ↑, 5001 ↑,
5006 ↑, 6001 ↓, 6403 ↑
Nucleus0104 ↑, 2804 ↓, 6004 ↑, 6403 ↑
Mitochondrion6704 ↑, 7801 ↑
Cell membrane5001 ↑, 6001 ↓, 6404 ↑, 7104 ↓
Ribosome5101 ↓
Intracellular0209 ↓, 4201 ↓
cytosol0601 ↓, 2704 ↑, 2804 ↓, 4806 ↓, 5806 ↓
Golgi apparatus8201 ↓
apoplast3208 ↑, 6404 ↑, 6704 ↑
Uncharacterized1109 ↑, 1206 ↑, 3005 ↓, 8303 ↑, 9105 ↑
Note: The upward-pointing arrows indicate protein spots that were upregulated under PEG-induced drought stress; the downward-pointing arrows indicate protein spots that were downregulated under PEG-induced drought stress.
Disclaimer/Publisher’s Note: The statements, opinions and data contained in all publications are solely those of the individual author(s) and contributor(s) and not of MDPI and/or the editor(s). MDPI and/or the editor(s) disclaim responsibility for any injury to people or property resulting from any ideas, methods, instructions or products referred to in the content.