1. Introduction
Macadamia spp. is an economically important woody oil crop that has attracted increasing attention because of its high nutritional value and broad potential for industrial utilization. Native to Australia,
M. integrifolia is now widely cultivated in Australia, China, South Africa, Kenya, the United States (Hawaii), and several other tropical and subtropical regions worldwide. Its kernels are rich in monounsaturated fatty acids, proteins, dietary fiber, vitamins, minerals, and antioxidant compounds, making
M. integrifolia one of the highest-value edible nuts in the global market. Owing to its high nutritional quality and broad applications in the food, cosmetic, and health industries,
M. integrifolia has become a valuable commercial crop in many producing countries. Consequently, improving fruit quality and understanding the molecular mechanisms underlying shell development are of considerable importance for breeding and industrial production [
1,
2,
3]. In
M. integrifolia fruit, the shell serves as the main protective tissue enclosing the seed and is essential for maintaining structural integrity and mechanical strength. Its physical properties directly influence fruit harvesting, transportation, storage, and shelling efficiency [
2,
3]. Shell hardening is a critical developmental process that is generally accompanied by secondary cell wall thickening and lignin deposition, both of which are central to the formation of nut fruit structure [
4]. Although previous studies have examined shell metabolism and transcriptomic variation, as well as pericarp formation and metabolic changes during pericarp development in
M. integrifolia, integrated analyses of coordinated pericarp and shell development remain scarce. This limitation has hindered a more comprehensive understanding of the molecular mechanisms underlying shell hardening [
4].
Previous studies have demonstrated that the formation of hardened shell tissues in nuts and drupes is closely associated with phenylpropanoid metabolism and its downstream lignin biosynthetic pathway, and that this process often displays pronounced stage-specific transcriptional patterns during fruit development [
5,
6,
7]. As fruit development progresses, functional differentiation among tissues becomes increasingly evident. Outer tissues such as the pericarp generally retain photosynthetic capacity and primary metabolic activity, whereas mechanically protective tissues are more strongly engaged in cell wall assembly and secondary metabolism [
8]. In
M. integrifolia, however, comprehensive evidence remains lacking regarding the transcriptional division of labor between the pericarp and shell throughout development and their respective contributions to shell hardening. Although previous studies have provided insights into phenolic and flavonoid metabolism in the shell or endocarp, as well as the metabolic characteristics of pericarp development [
9,
10], several important questions remain unresolved. In particular, the critical developmental windows during which transcriptomic reprogramming occurs during shell hardening, the patterns of tissue-specific expression divergence, and the coordinated regulation of core metabolic pathways have yet to be systematically elucidated using multi-stage transcriptomic data.
Recent years have witnessed substantial progress in understanding structural formation in nut fruits [
4,
11,
12]. Studies in species such as walnut (
Juglans regia) and iron walnut (
Juglans sigillata) have shown that genes involved in phenylpropanoid metabolism and cell wall biogenesis are markedly upregulated during shell formation, with expression typically peaking at intermediate developmental stages. Lignin deposition has likewise been recognized as a major determinant of structural reinforcement in fruits such as walnut and winter jujube [
5,
6,
13]. In addition, multi-omics studies have highlighted the coordinated involvement of hormone signaling, redox regulation, and secondary metabolism during fruit development [
9,
10,
12,
14]. Together, these findings have advanced the molecular understanding of fruit structural formation from multiple perspectives [
9,
10]. However, most previous studies have focused on individual tissues or specific developmental stages, and systematic comparisons of coordinated pericarp and shell development remain limited [
5,
6,
9,
10]. Although differential expression analysis has been widely applied, the integration of transcriptional changes at the co-expression network level is still relatively limited, which restricts a more comprehensive understanding of the regulatory mechanisms underlying complex developmental traits [
14,
15,
16]. In
M. integrifolia, existing research has mainly focused on genomic resources and metabolic variation, whereas the transcriptional regulatory networks associated with shell hardening remain largely unexplored [
9]. Therefore, integrating multi-stage transcriptomic data with co-expression network analysis is necessary to clarify the expression characteristics and regulatory relationships underlying shell hardening [
14,
15,
16].
To address these knowledge gaps, the present study aimed to systematically characterize the transcriptomic dynamics underlying M. integrifolia shell hardening by integrating comparative transcriptome analysis with weighted gene co-expression network analysis (WGCNA). Specifically, we sought to identify tissue-specific expression patterns, key developmental stages, biological pathways, and candidate hub genes associated with shell development. ranscriptome sequencing of green pericarp (husk) and shell tissues collected at three developmental stages. Sequencing quality and global expression patterns were first evaluated to characterize the overall transcriptomic landscape. Differential expression analysis was then conducted to identify tissue- and stage-specific transcriptional variation, followed by Gene Ontology (GO) and Kyoto Encyclopedia of Genes and Genomes (KEGG) enrichment analyses to determine the major biological processes and metabolic pathways involved. WGCNA was subsequently employed to construct co-expression networks, identify key functional modules, and screen hub genes associated with shell hardening. These findings provide new insights into the molecular mechanisms underlying shell structural formation in M. integrifolia.
2. Materials and Methods
2.1. Plant Materials and Sample Preparation
The materials were collected from the main cultivated M. integrifolia variety (HAES900), at the Ministry of Agriculture Jinghong Macadamia Germplasm Resource Nursery, Xishuangbanna, Yunnan Province, China (22.013188° N, 100.776066° E). The orchard was managed under conventional intensive cultivation, with a row spacing of 5 m and a plant spacing of 7 m. All sampled trees were 14 years old, vigorous, free of visible pests and diseases, and exhibited uniform growth.
According to fruit developmental progression, samples were collected at 30, 50, and 80 days after flowering (DAF). The corresponding pericarp (husk) samples were designated H-1, H-2, and H-3, and the corresponding shell samples were designated S-1, S-2, and S-3, respectively. For each tissue at each developmental stage, three biological replicates were collected, with each replicate obtained from a different individual tree, giving a total of 18 samples. At each sampling time point, fruits of normal size and consistent growth were randomly harvested from the sun-exposed side of the middle canopy. The pericarp and shell tissues were immediately separated on ice. The kernel and membranous inner seed coat were carefully removed to avoid cross-contamination between tissues. The target tissues were then cut into pieces of approximately 0.5–1.0 cm, immediately frozen in liquid nitrogen, and stored at −80 °C until RNA extraction and transcriptome sequencing.
2.2. Total RNA Extraction and Quality Assessment
Both pericarp and shell tissues are rich in polyphenols, polysaccharides, and cell wall components. Therefore, all sample processing steps were carried out under low-temperature conditions. Approximately 100 mg of frozen tissue from each sample was ground into a fine powder in liquid nitrogen, and an appropriate amount of polyvinylpyrrolidone (PVP) was added during grinding to reduce interference from polyphenolic compounds. Total RNA was extracted using the RNAprep Pure Plant Plus Kit (Polysaccharides & Polyphenolics-rich; Catalog No. DP441, TIANGEN Biotech, Beijing, China) according to the manufacturer’s instructions, including lysis, purification, and on-column DNase I digestion to remove residual genomic DNA.
RNA quality was evaluated using a NanoDrop spectrophotometer (Thermo Fisher Scientific, Wilmington, DE, USA) to assess purity (OD260/OD280 and OD260/OD230), a Qubit fluorometer (Thermo Fisher Scientific, Waltham, MA, USA) to determine RNA concentration, and 1% agarose gel electrophoresis to examine RNA integrity. The RNA integrity number (RIN) was further determined using an Agilent 2100 Bioanalyzer (Agilent Technologies, Santa Clara, CA, USA). Only RNA samples meeting the following criteria were used for subsequent library construction: RIN ≥ 7.0, OD260/OD280 between 1.8 and 2.2, and OD260/OD230 > 2.0 [
17,
18].
2.3. Library Construction and Illumina Sequencing
For each sample, 1–2 μg of high-quality total RNA was used for strand-specific mRNA library construction. Poly(A)+ mRNA was enriched using oligo(dT)-coated magnetic beads and then fragmented into suitable sizes in the presence of divalent cations. First-strand cDNA was synthesized using random primers, and dUTP was incorporated during second-strand synthesis to maintain strand specificity. The resulting cDNA was then subjected to end repair, A-tailing, adapter ligation, fragment size selection, and PCR amplification to generate sequencing libraries with an insert size of approximately 300 bp [
19,
20]. Library quality was assessed using an Agilent 2100 Bioanalyzer and a Qubit fluorometer, after which paired-end sequencing (PE150) was performed on the Illumina NovaSeq 6000 platform (Illumina, San Diego, CA, USA).
2.4. Sequencing Data Quality Control and Filtering
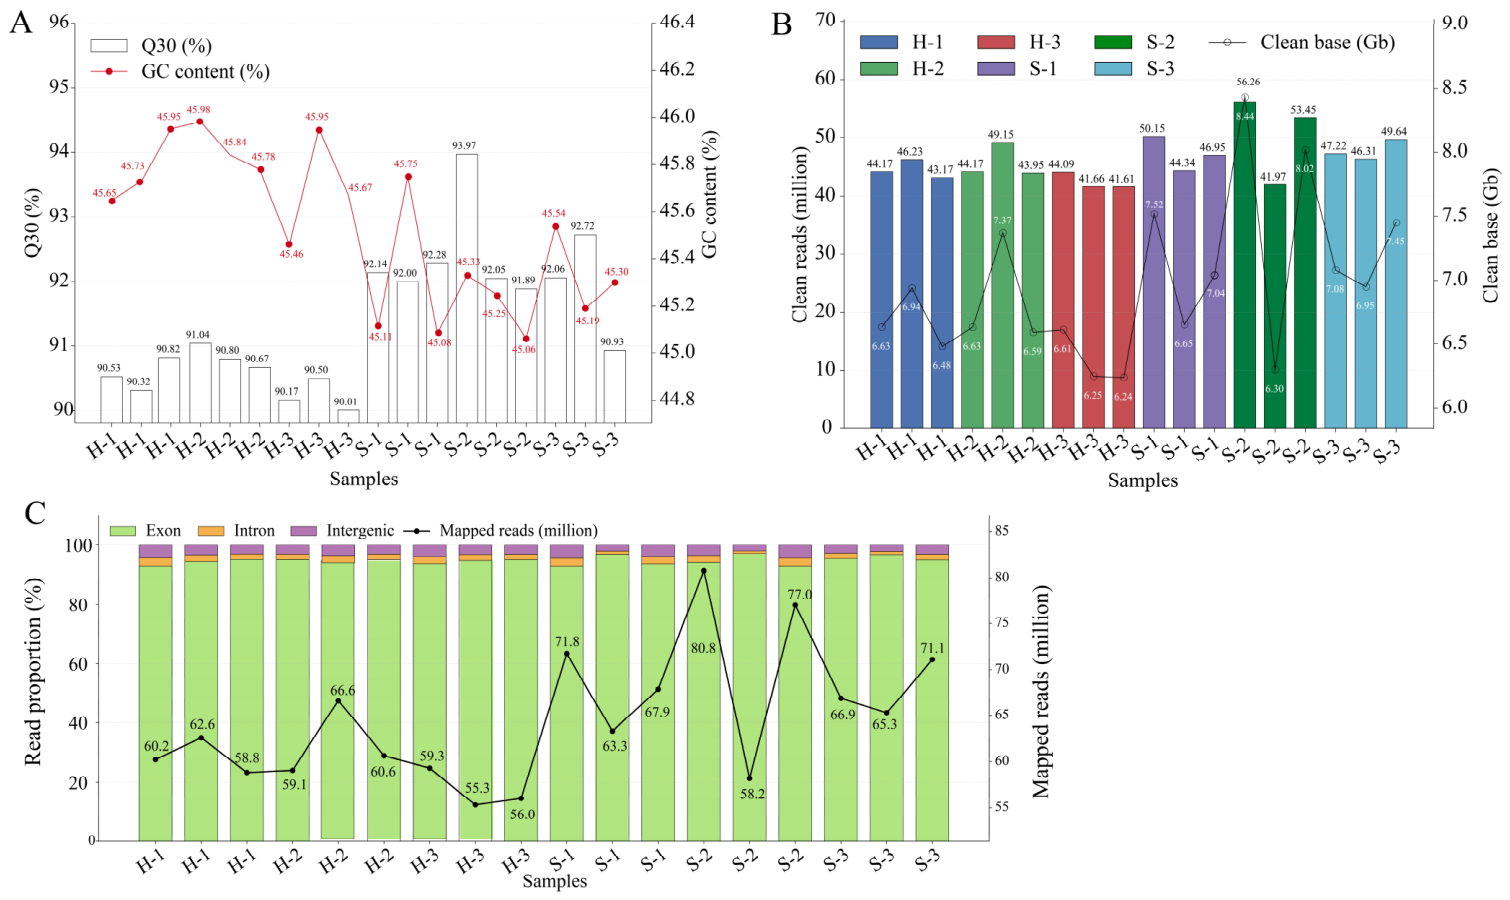
After raw sequencing data were generated in FASTQ format, fastp v0.23.2 was used for adapter trimming, low-quality read filtering, and quality assessment. During this process, reads containing adapter contamination, excessive ambiguous bases (N), or low-quality bases were removed to obtain clean reads. The number of clean reads, Q30 values, and GC content were then calculated for each sample to evaluate sequencing quality [
21,
22].
2.5. Read Alignment and Expression Quantification
The quality-filtered clean reads were aligned to the
Macadamia integrifolia reference genome assembly SCU_Mint_v3, which was obtained from the NCBI RefSeq database under accession number GCF_013358625.1. The genome sequence file and structural annotation file used in this study were GCF_013358625.1_SCU_Mint_v3_genomic.fna and GCF_013358625.1_SCU_Mint_v3_genomic.gff, respectively. Read mapping was performed using HISAT2 v2.1.0 with default parameters [
23]. Based on the reference genome annotation file, featureCounts v2.0.1 was used to quantify the number of reads mapped to each gene, thereby generating a gene-level raw count matrix for subsequent differential expression analysis [
21]. In addition, the overall mapping rate, uniquely mapped read rate, and the distribution of reads across exon, intron, and intergenic regions were calculated for each sample based on the alignment results and genome annotation file. These metrics were used to comprehensively assess the suitability of the reference genome for transcriptome analysis and the completeness of genome annotation.
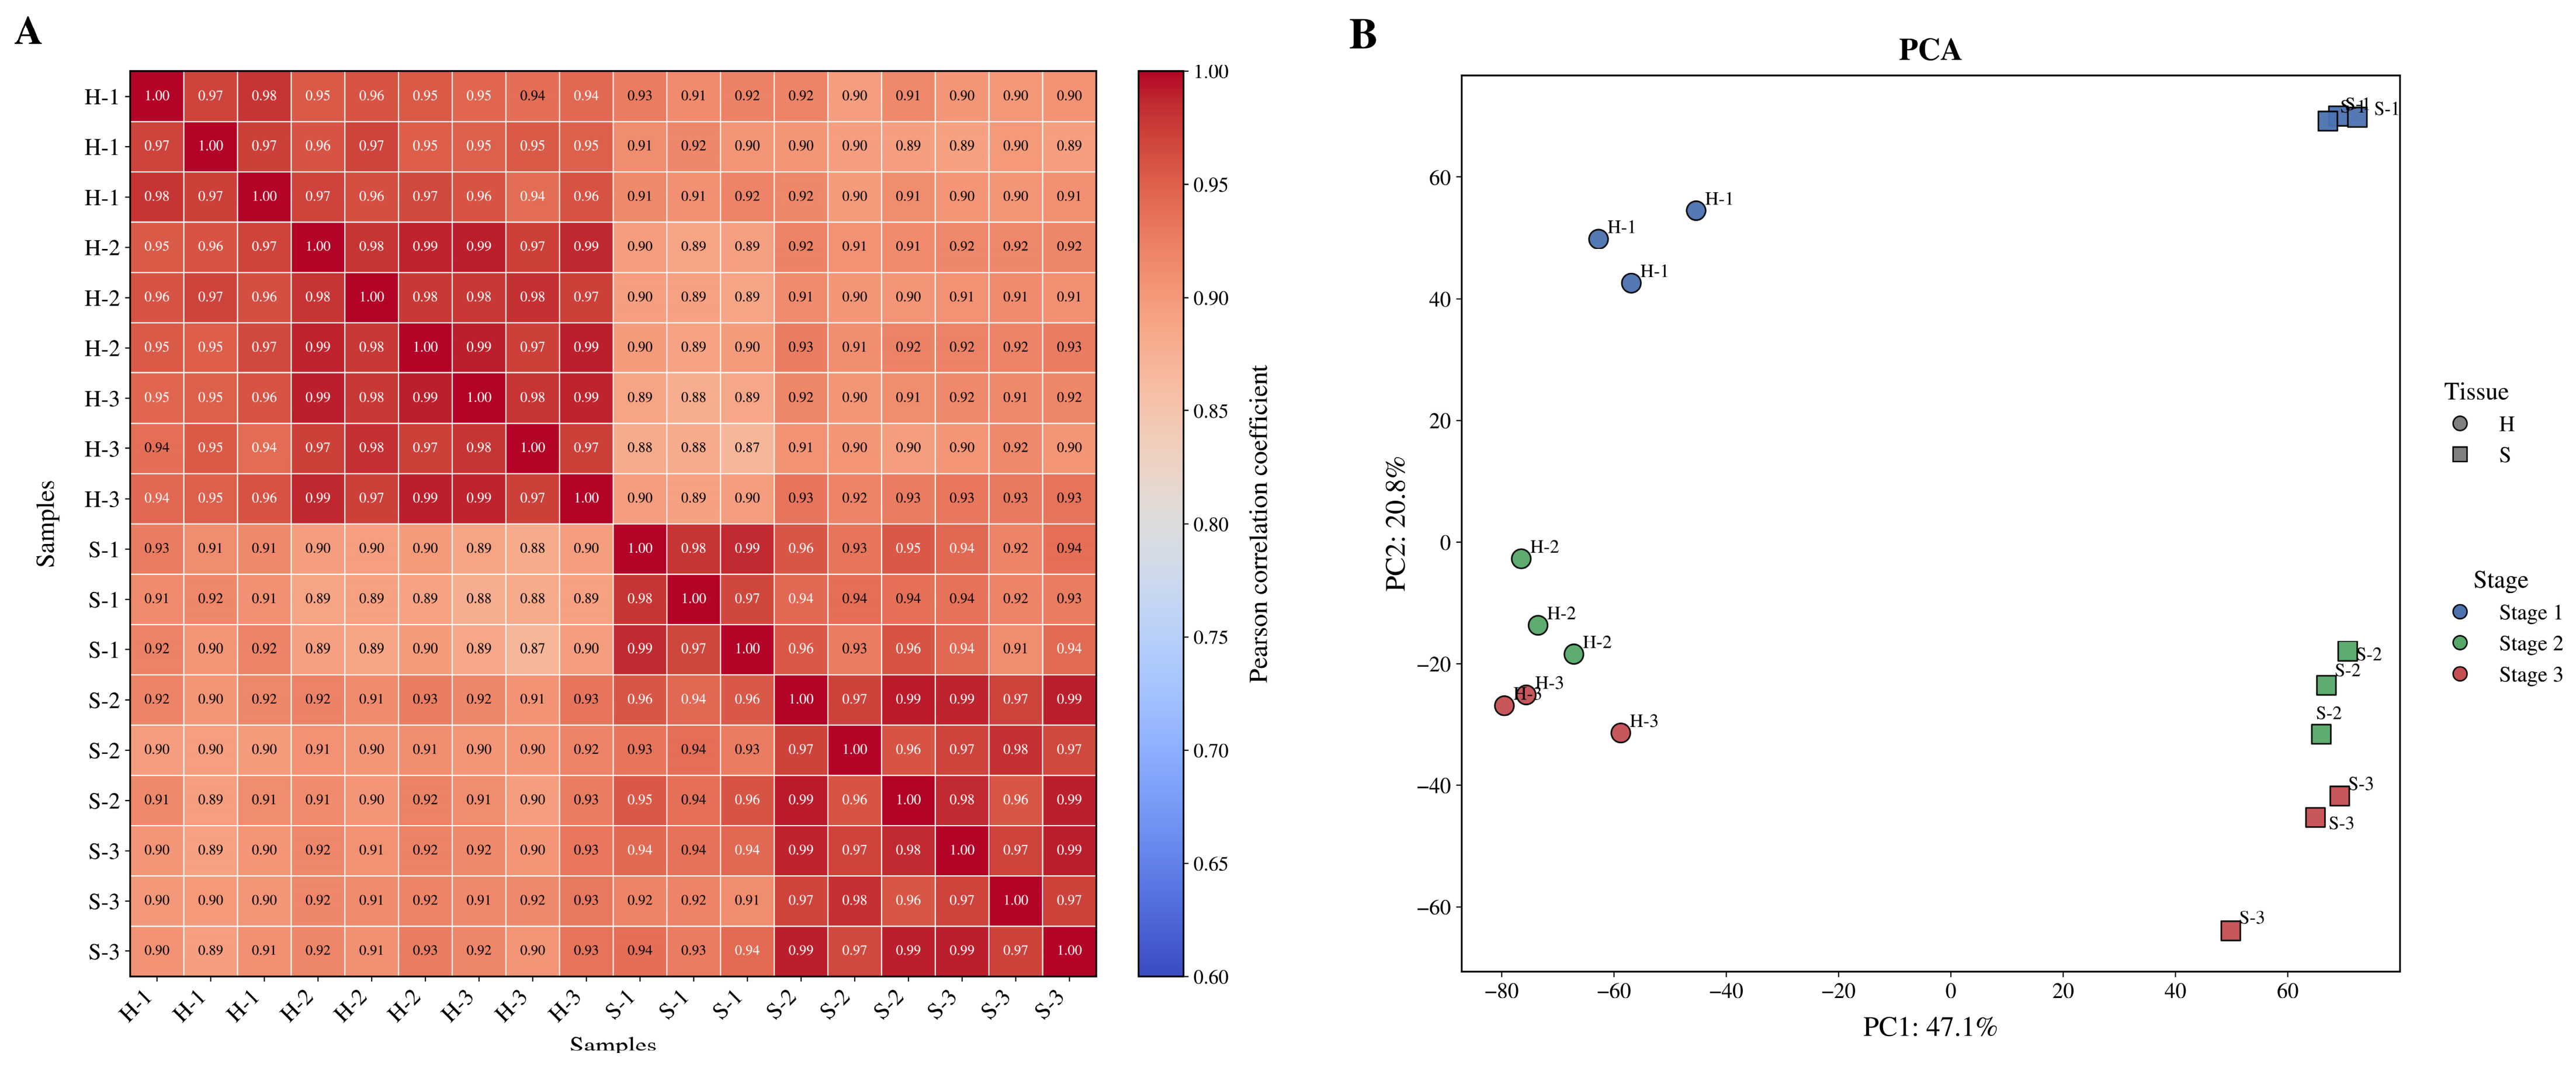
To support downstream sample correlation analysis, principal component analysis (PCA), and co-expression network analysis, the raw count matrix was further normalized. Correlation analysis and PCA were performed using the variance-stabilizing transformation (VST) matrix generated by DESeq2 v1.38.3, whereas WGCNA was conducted using the normalized expression matrix for network construction [
21,
24].
2.6. Identification of Differentially Expressed Genes
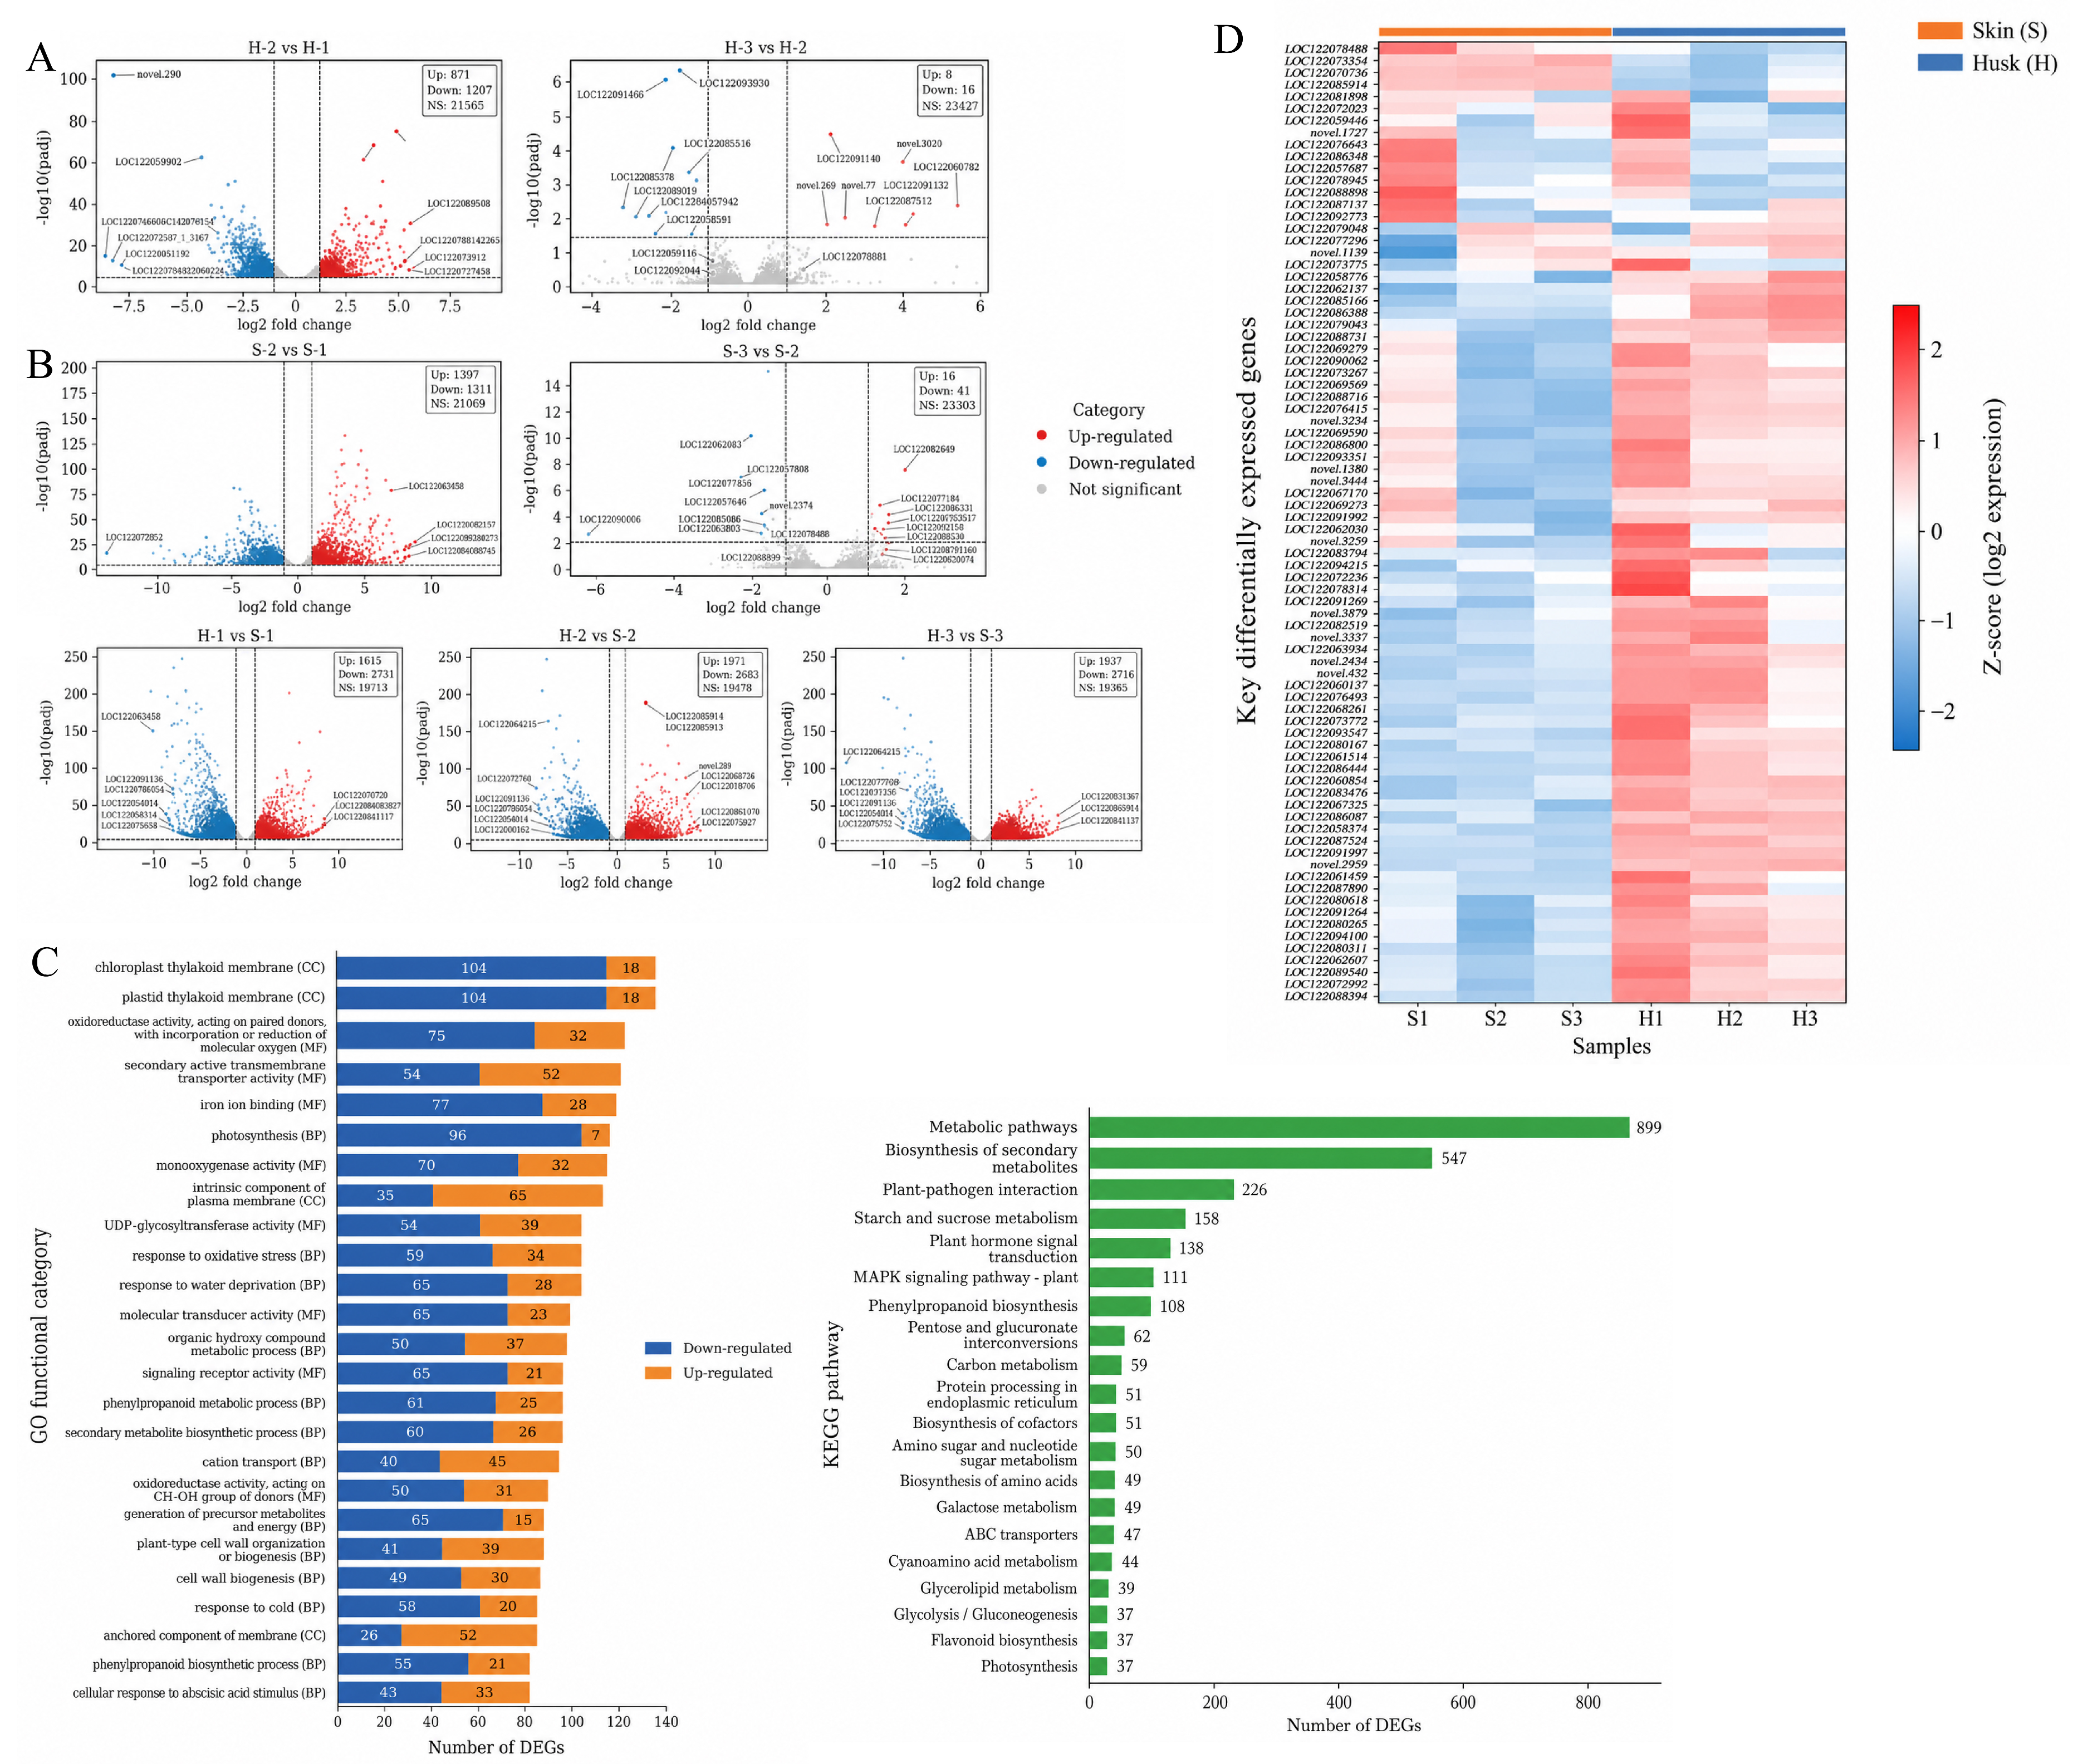
Differentially expressed genes (DEGs) were identified using the DESeq2 package in the R environment. DESeq2 models RNA-seq raw count data using a negative binomial distribution and improves the robustness of differential expression analysis through dispersion estimation and shrinkage [
25]. The gene-level raw count matrix generated by featureCounts was used as input for pairwise comparisons between pericarp and shell tissues at the same developmental stage, as well as between different developmental stages within the same tissue. Statistical significance was assessed using the Wald test, and
p values were adjusted for multiple testing using the Benjamini–Hochberg method. Genes with an FDR ≤ 0.05 and an absolute log2 fold change (|log2FoldChange|) ≥ 1 were considered significantly differentially expressed [
25,
26].
2.7. Functional Annotation and Enrichment Analysis
Functional annotation of the complete gene set and target gene sets was performed based on the
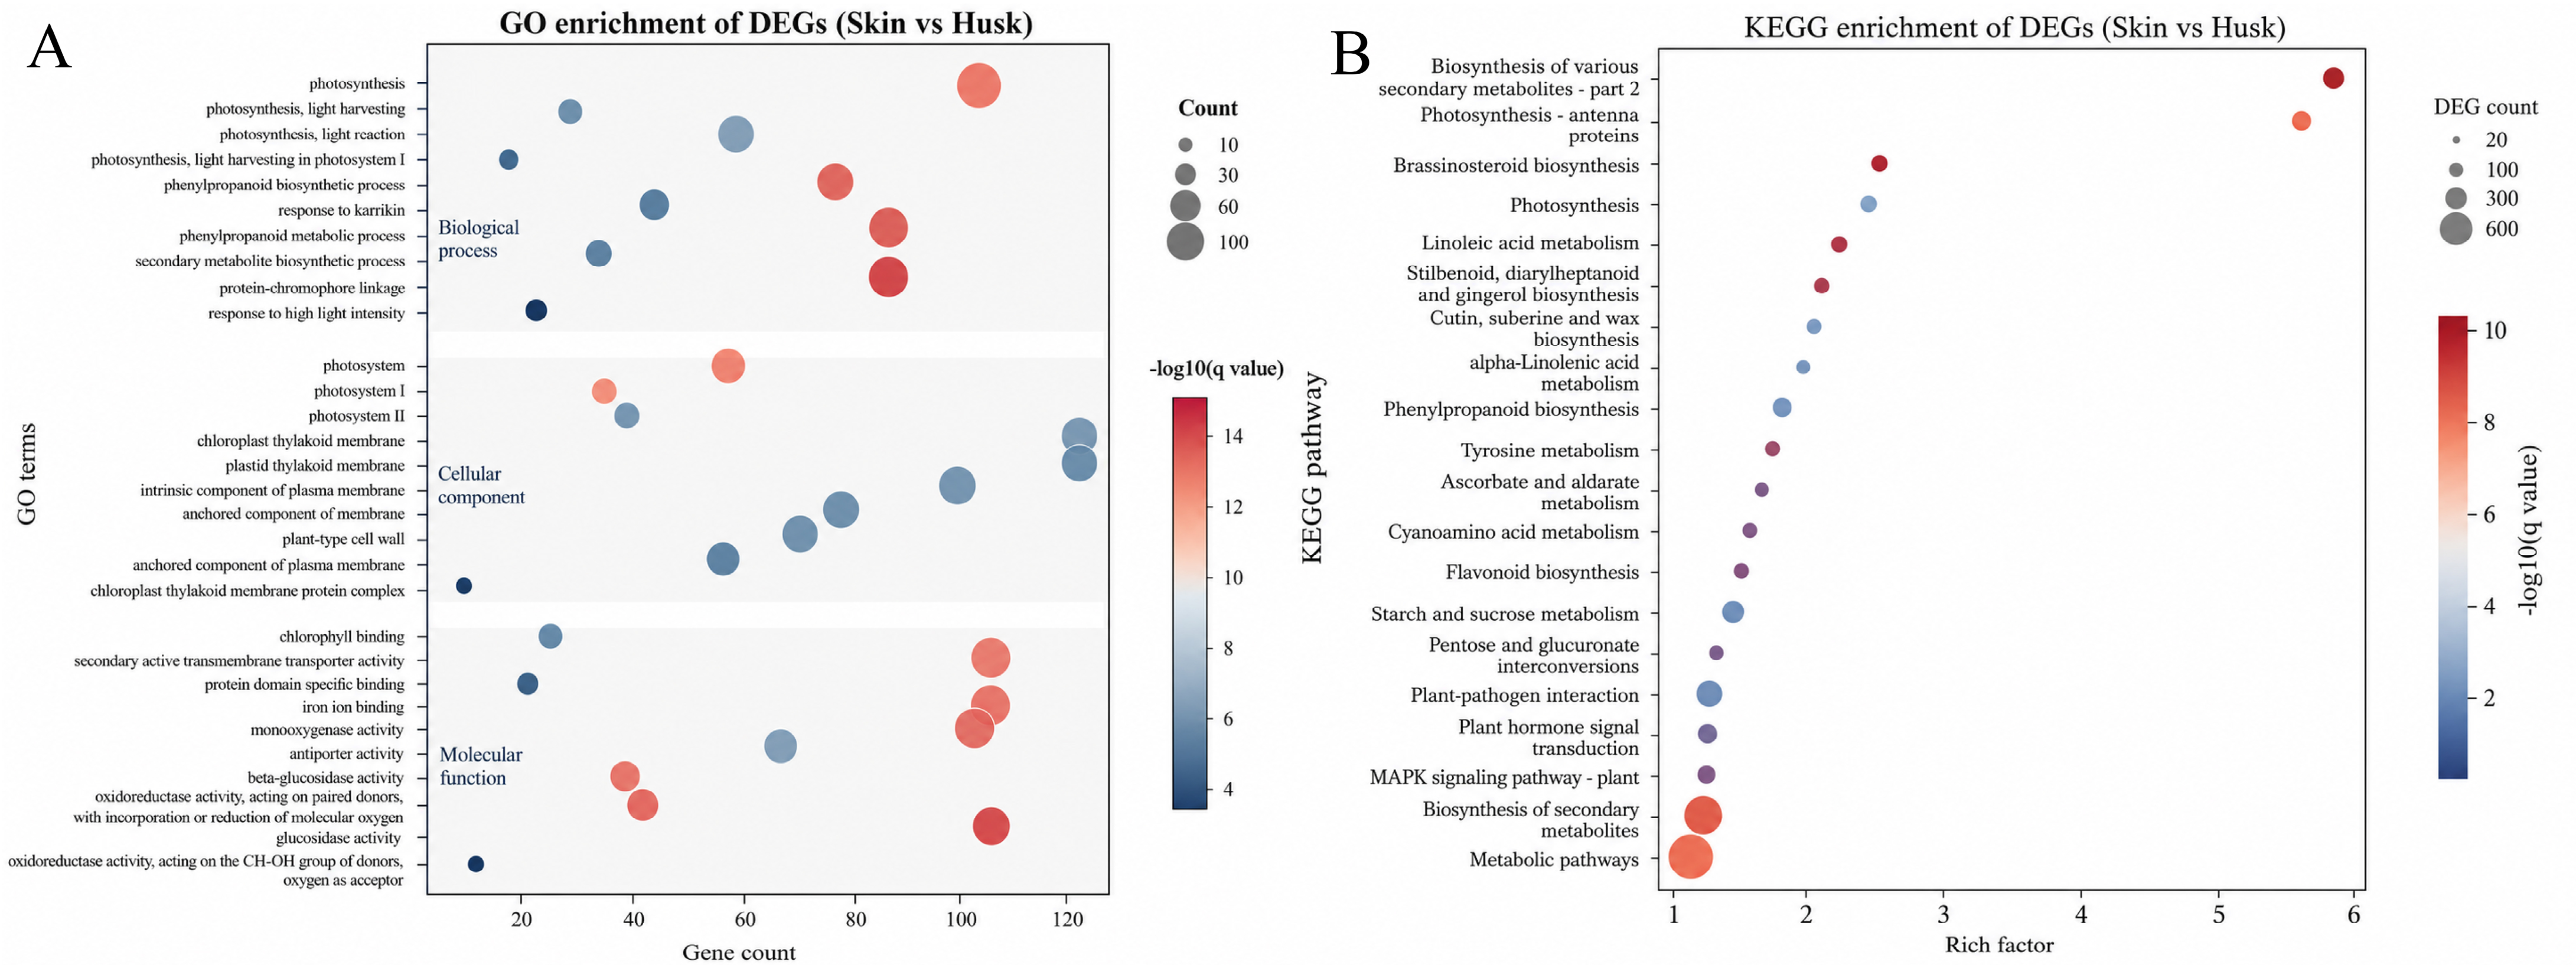
M. integrifolia reference genome annotation in combination with the NR, Swiss-Prot, Pfam, Gene Ontology (GO), and Kyoto Encyclopedia of Genes and Genomes (KEGG) databases. GO classification and enrichment analyses, together with KEGG pathway enrichment analyses, were conducted separately for the identified DEGs and for genes within key WGCNA modules. The complete set of expressed genes detected across all RNA-seq samples was used as the background gene set for both GO and KEGG enrichment analyses. Statistical significance was evaluated using the hypergeometric test or Fisher’s exact test,
p values were adjusted for multiple testing using the Benjamini–Hochberg (BH) procedure to control the false discovery rate (FDR), and GO and KEGG terms with an adjusted
p value (FDR) < 0.05 were considered significantly enriched [
27,
28].
2.8. Weighted Gene Co-Expression Network Analysis (WGCNA)
To identify gene sets showing coordinated expression changes during shell development and to detect co-expression modules significantly associated with the middle and late stages of shell development, a weighted gene co-expression network was constructed using a normalized FPKM expression matrix. Before network construction, genes with low expression levels (FPKM < 1 in more than 50% of samples) were removed, and genes with low expression variability were further filtered using the varFilter function implemented in the R package genefilter (v1.80.3). Specifically, genes ranked within the top 50% based on expression variance across samples were retained for subsequent WGCNA. Network construction was performed in R (v4.2.2) using the WGCNA package. The soft-thresholding power was selected according to the scale-free topology criterion, and a soft-thresholding power of β = 6 was used for subsequent network construction. Pearson correlation coefficients between genes were first transformed into an adjacency matrix, after which a topological overlap matrix (TOM) was calculated [
14]. Co-expression modules were then identified by hierarchical clustering combined with the Dynamic Tree Cut algorithm using a deepSplit value of 2 and a minimum module size of 30 genes, and different modules were distinguished by different colors [
15,
16]. Module eigengenes were subsequently calculated and correlated with sample traits, including tissue type, developmental stage, and days after flowering (DAF), using Pearson correlation analysis. Module-trait relationships with
p < 0.05 were considered statistically significant.
After the module eigengene was calculated for each module, correlation analyses were performed between module eigengenes and sample traits, including tissue type (pericarp/shell), developmental stage, and days after flowering (DAF), to identify modules significantly associated with shell development. Candidate hub genes within each module were screened on the basis of intramodular connectivity (kWithin), with genes showing higher kWithin values considered as highly connected candidate hub genes within the corresponding modules, and their potential functions were further interpreted in combination with GO and KEGG annotation results [
15,
16].
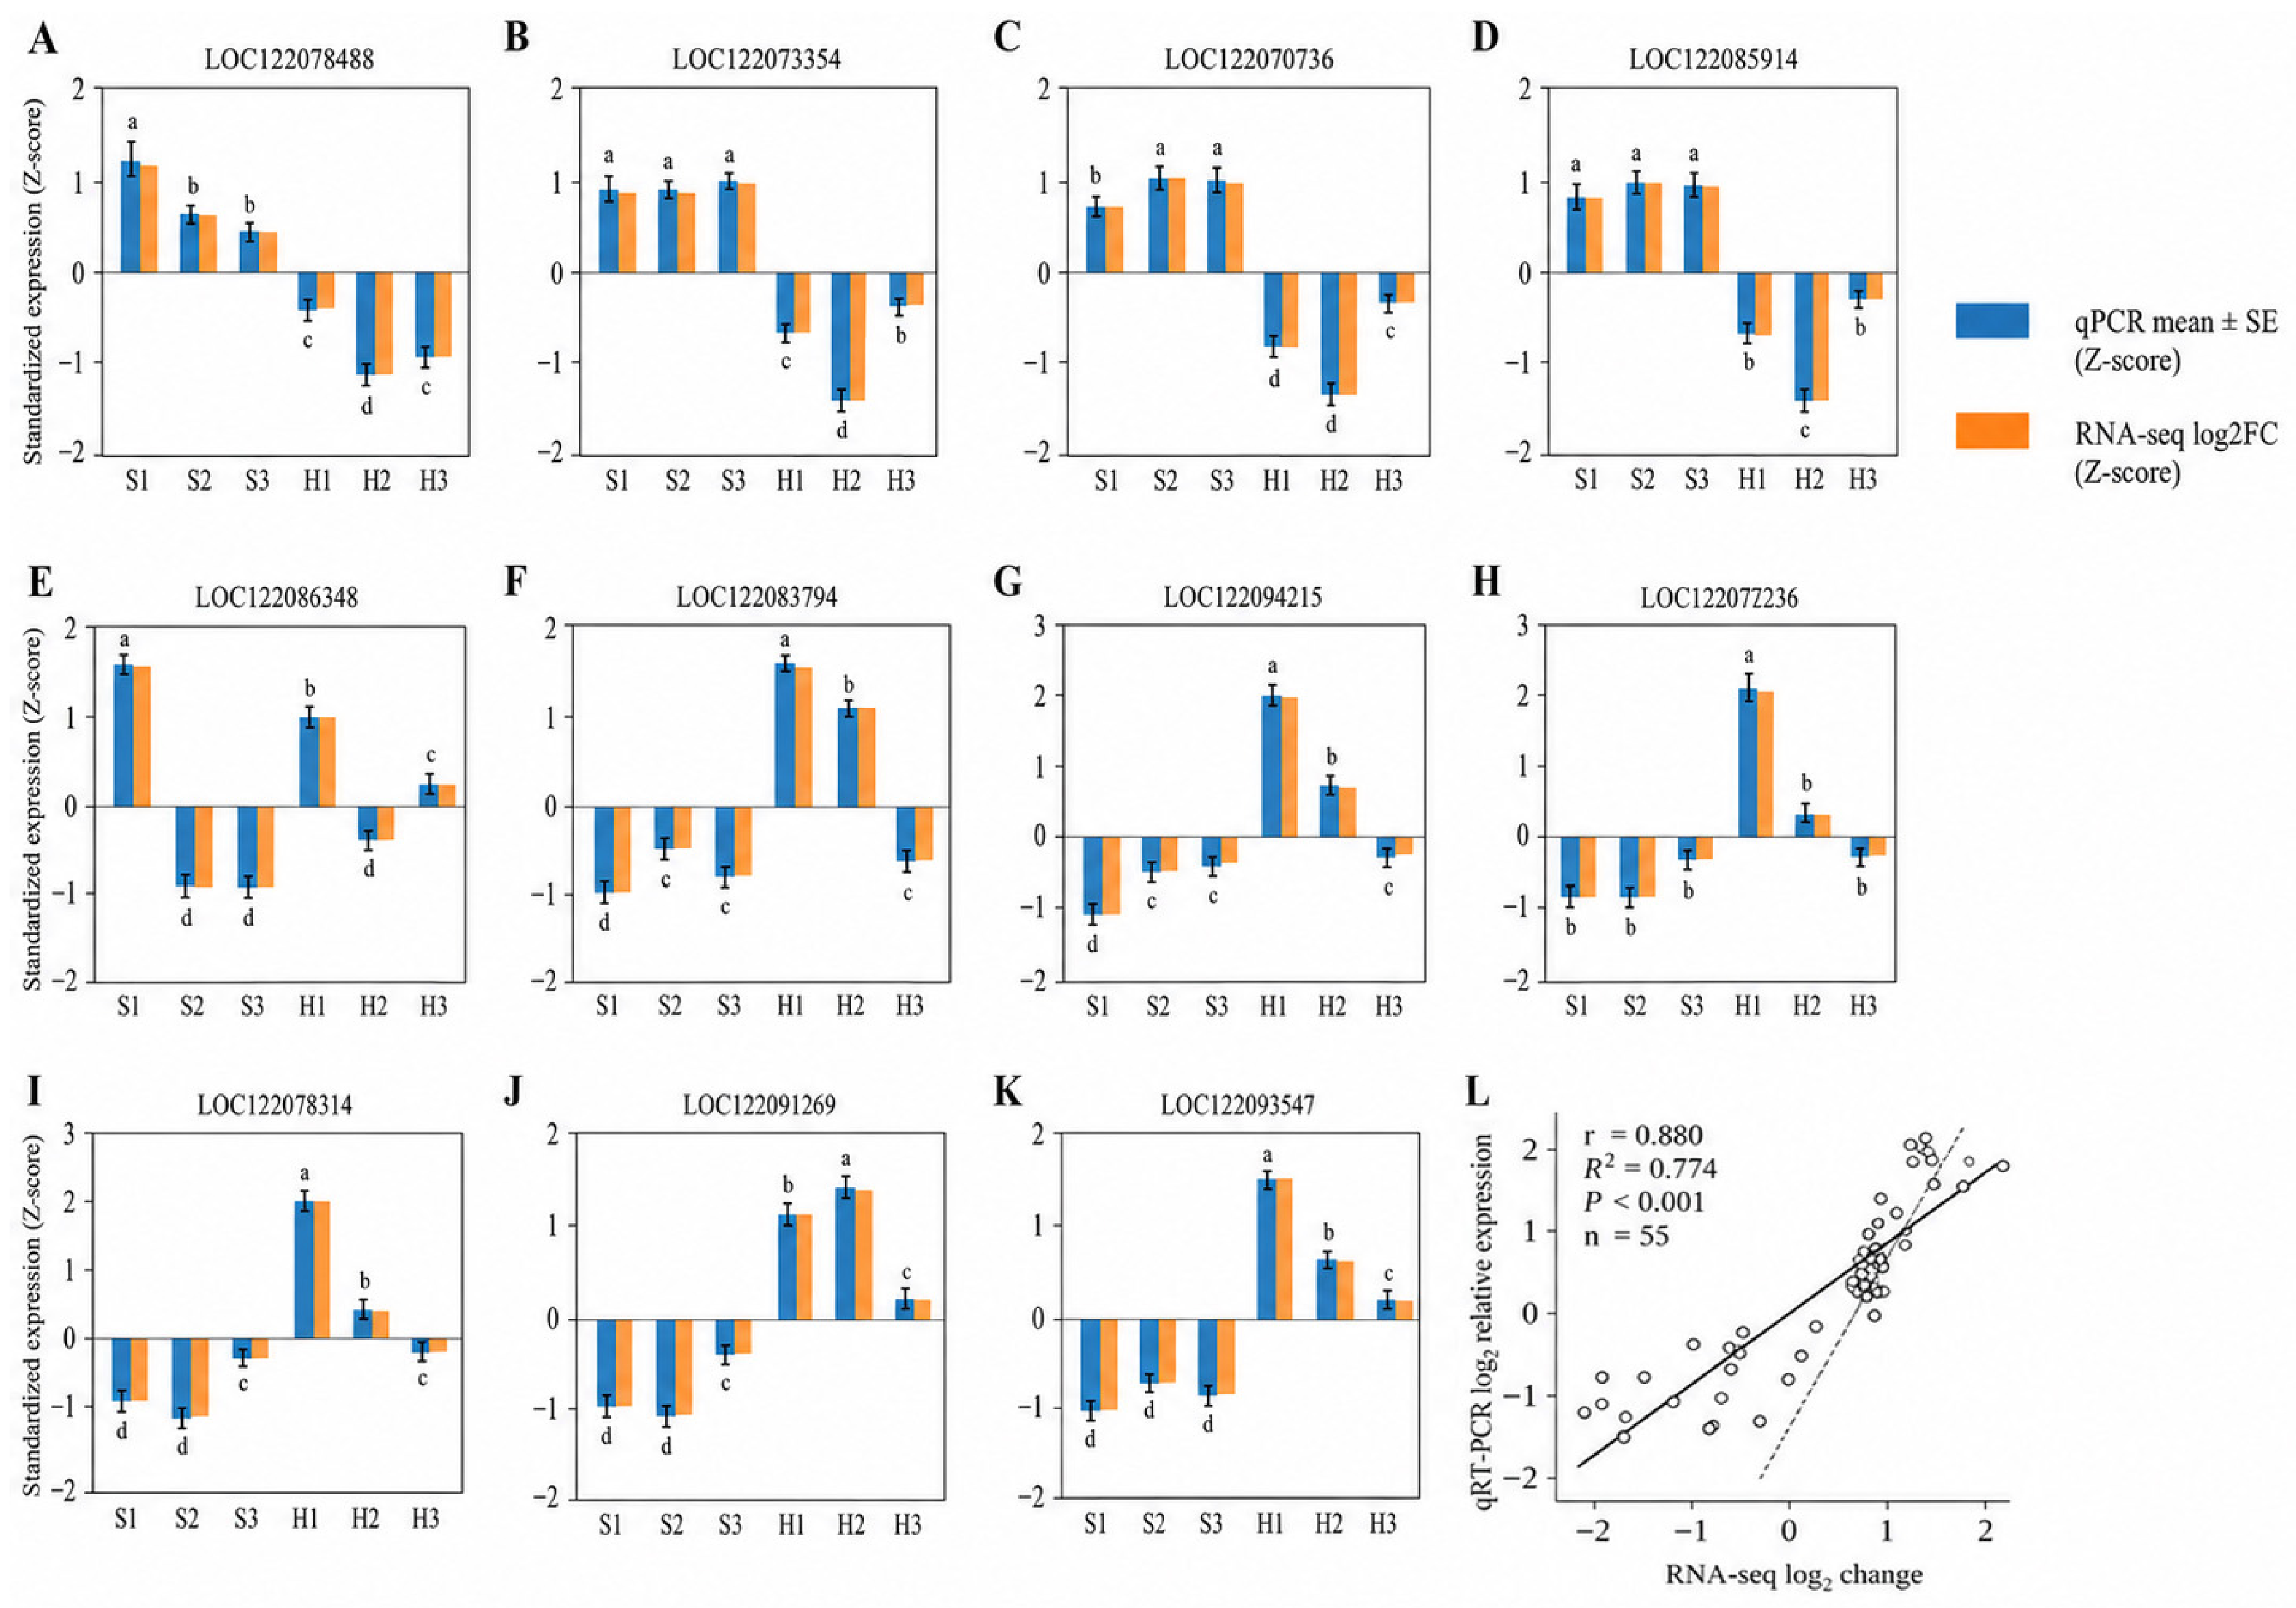
2.9. Quantitative Real-Time PCR Validation
Eleven genes (
Supplementary Text S1) were selected for quantitative real-time PCR (qRT-PCR) validation of the RNA-seq results, and their primer sequences and amplification characteristics are provided in
Table S1. Total RNA extracted from the same biological samples used for RNA-seq was reverse-transcribed using the PrimeScript™ RT Reagent Kit with gDNA Eraser (Takara Bio, Dalian, China). Gene-specific primers were designed using Primer3, with expected amplicon sizes of 80–200 bp. The actin gene (
ACT) was used as the internal reference gene because of its reported expression stability in
Macadamia integrifolia [
29]. The
ACT primer sequences were 5′-GAGGAGAGGATCTGTCGTAAA-3′ (forward) and 5′-GATAACAAGGAGAGGCCAAAG-3′ (reverse). qRT-PCR was performed using TB Green
® Premix Ex Taq™ II (Takara Bio Inc., Kusatsu, Shiga, Japan) on a QuantStudio™ 5 Real-Time PCR System (Applied Biosystems, Foster City, CA, USA). Each 20 μL reaction contained 10 μL of 2× premix, 0.8 μL each of the forward and reverse primers, 2 μL of diluted cDNA, and 6.4 μL of nuclease-free water. The thermal cycling conditions were 95 °C for 30 s, followed by 40 cycles of 95 °C for 5 s and 60 °C for 30 s. Amplification specificity was confirmed by melting-curve analysis and no-template controls. Primer efficiencies were evaluated using five-fold serial dilutions of pooled cDNA. In accordance with the MIQE 2.0 guidelines [
30], only primer pairs with amplification efficiencies of 90–110% and
were used. Three biological replicates, each comprising three technical replicates, were analyzed. Relative expression levels were calculated using the
method, with
ACT as the internal reference gene and the S1 shell sample as the calibrator [
31].
4. Discussion
The results of this study indicate that the critical transcriptional window for shell development in macadamia (
Macadamia spp.) occurs between 30 and 50 days after flowering. During this period, the number of differentially expressed genes between adjacent developmental stages in both shell and husk tissues was substantially higher than that observed during the 50–80 DAF interval, when expression changes became markedly less pronounced. This pattern suggests that the core regulatory programs underlying late-stage tissue characteristics are largely established by the middle stage of development. Such a temporal pattern is consistent with developmental features reported in other highly lignified fruit tissues [
5]. In peach (
Prunus persica) [
7], endocarp lignification occurs mainly during the early to middle stages of development, with genes involved in phenylpropanoid and lignin biosynthesis showing strong but transient induction, followed by a relatively stable maintenance phase. A similar pattern has been reported in walnut, in which the major lignification program of the endocarp is largely completed during the early to middle stages of fruit development, whereas subsequent development is mainly associated with structural maintenance [
13]. However, comparisons of developmental timing among different species should be interpreted cautiously because developmental stages are defined using different criteria, including days after flowering (DAF), morphological characteristics, and anatomical changes. Therefore, the similarities observed between
M. integrifolia, peach, and walnut likely reflect conserved regulatory processes associated with lignification and secondary cell wall formation rather than directly equivalent developmental time points. More broadly, transcriptomic studies of fruit development have shown that key structural formation is often concentrated within a transcriptional reprogramming window during mid-development [
4]. In this respect,
M. integrifolia resembles these species in that shell reinforcement is initiated not during late maturation, but earlier, during tissue differentiation and rapid wall formation. However,
M. integrifolia also shows a distinct feature: although transcriptional changes between adjacent stages decrease at later developmental stages, the pronounced separation between husk and shell is maintained. This persistent divergence between tissues suggests that the late stage is not merely a static maturation phase, but rather a period during which the mechanical strength and barrier functions of the shell continue to be maintained [
7,
32]. Compared with previous transcriptomic studies in walnut and iron walnut, which mainly emphasized stage-specific activation of lignin biosynthesis and phenylpropanoid metabolism during shell formation [
5,
6,
13], our results further demonstrate that distinct transcriptional programs between husk and shell are maintained throughout development, suggesting coordinated but tissue-specific regulatory mechanisms underlying shell hardening.
Husk and shell maintained pronounced expression differences across all three corresponding developmental stages. The clear separation observed in both the PCA and correlation heatmap further suggests that these two tissues enter distinct transcriptional trajectories early in development, rather than representing different degrees of differentiation along a single developmental path. At the mature stage, the comparison between husk samples (H-3) and shell samples (S-3) revealed pronounced tissue-specific functional divergence. Genes preferentially expressed in the shell were mainly associated with cell wall organization, lignin metabolism, extracellular-region functions, and redox-related processes, whereas genes preferentially expressed in the husk were more strongly associated with photosynthesis, chloroplast organization, and lipid metabolism. KEGG enrichment further demonstrated that phenylpropanoid biosynthesis and secondary metabolism were among the major pathways contributing to the transcriptional divergence between the two tissues. These findings are consistent with previous studies in walnut and other lignified fruit species, which have identified phenylpropanoid metabolism and lignin biosynthesis as conserved processes underlying shell hardening [
5,
6,
13]. However, most previous studies focused primarily on differential gene expression or metabolic changes at individual developmental stages of
M. integrifolia fruits [
9,
10]. In contrast, the present study combined multi-stage transcriptome profiling with WGCNA, allowing the identification of shell-associated co-expression modules and candidate hub genes that potentially coordinate shell development. This integrative strategy extends previous transcriptomic studies by providing a systems-level view of co-expression networks underlying shell hardening in
M. integrifolia. Taken together, these results indicate that the observed tissue-specific expression pattern reflects not merely the activation of individual metabolic pathways, but a coordinated molecular program underlying functional specialization between the husk and shell [
9,
10]. Such inter-tissue differentiation is consistent with observations in fruits such as peach (
Prunus persica) [
7] and
Camellia chekiangoleosa [
33], in which endocarp or shell tissues preferentially undergo secondary cell wall deposition and lignification, whereas outer tissues retain stronger features related to assimilation, pigment accumulation, or active primary metabolism. In
M. integrifolia, this division of labor remains highly pronounced even at the mature stage. This sustained divergence is likely related to the greater mechanical strength required of the
M. integrifolia shell, its more complex shell-layer microstructure, and the need to preserve long-term protective functions during late fruit maturation, thereby preventing attenuation of the structural boundary between tissues as ripening proceeds [
34].
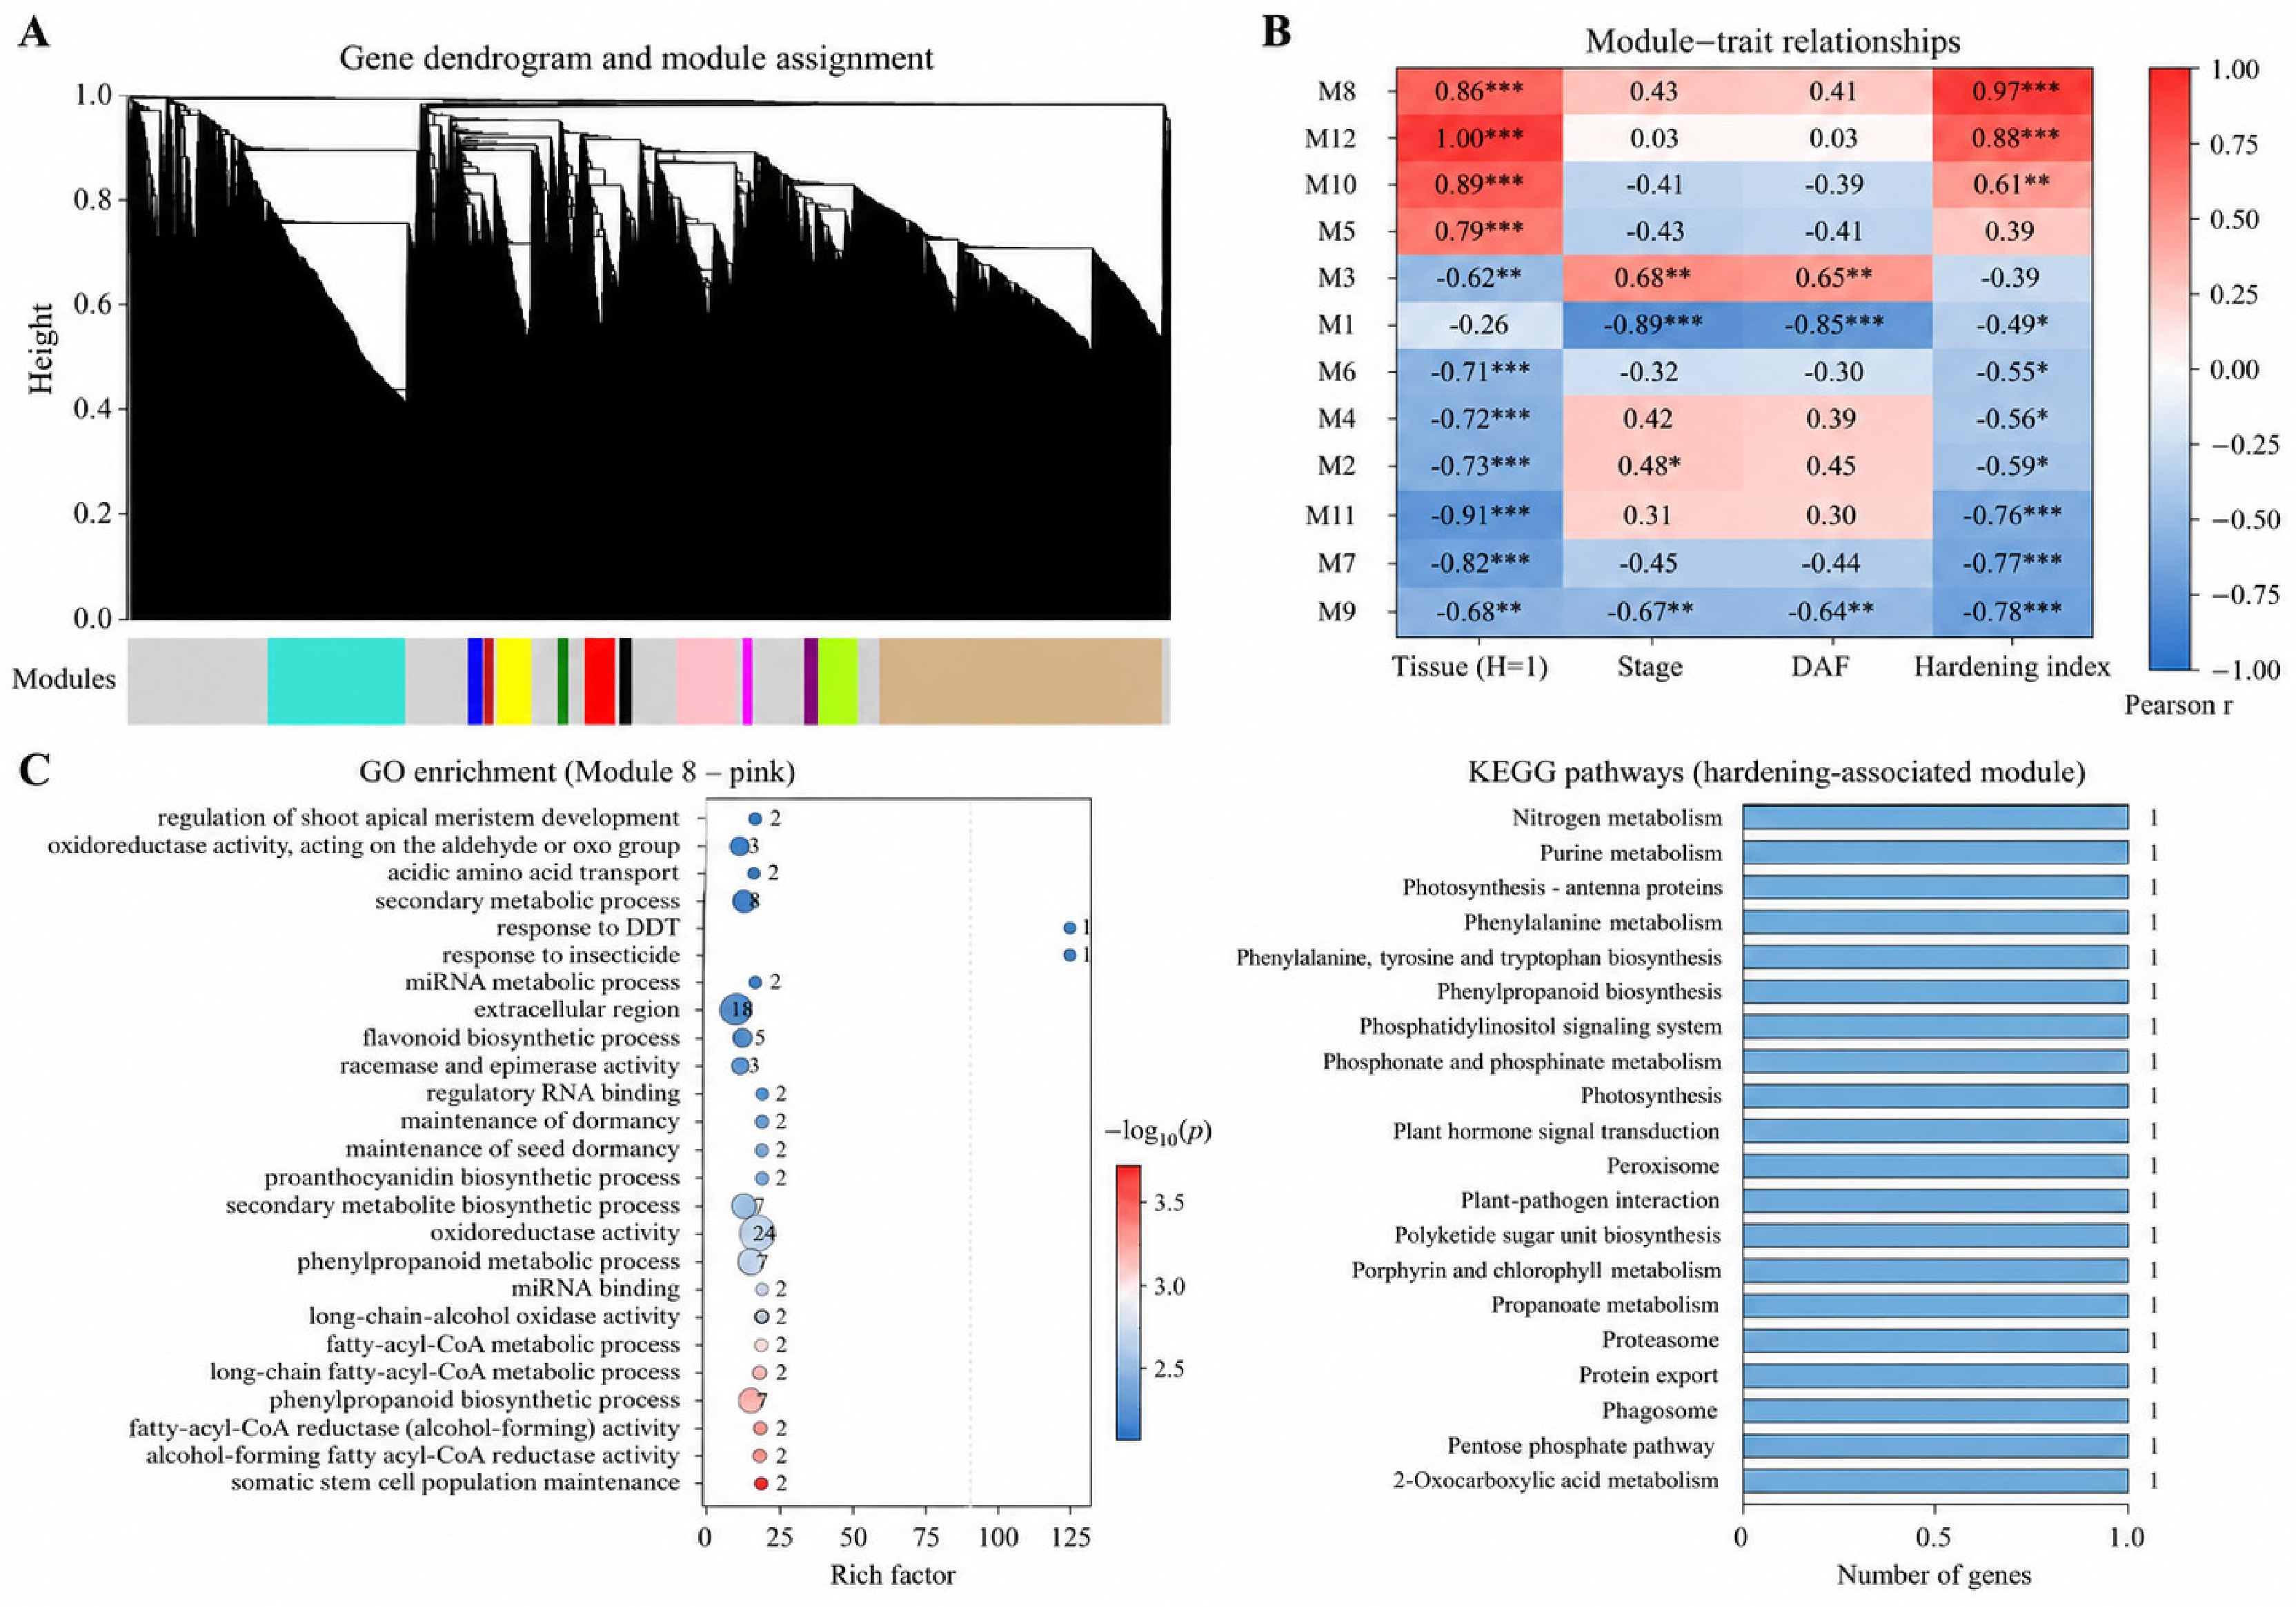
GO/KEGG enrichment analysis and WGCNA further integrated this process into a coordinated network involving phenylpropanoid metabolism, secondary metabolism, cell wall organization, extracellular region functions, and redox-related processes. The persistent enrichment of phenylpropanoid biosynthesis suggests that the supply of lignin precursors occupies a central position in shell development, consistent with previous studies on endocarp lignification in walnut (
Juglans regia L.) [
5] and stone cell lignification in
Camellia oleifera fruits [
35]. Lignin accumulation is therefore not an isolated event, but part of a structural assembly process that proceeds in coordination with cellulose and hemicellulose deposition as well as upstream transcriptional regulation [
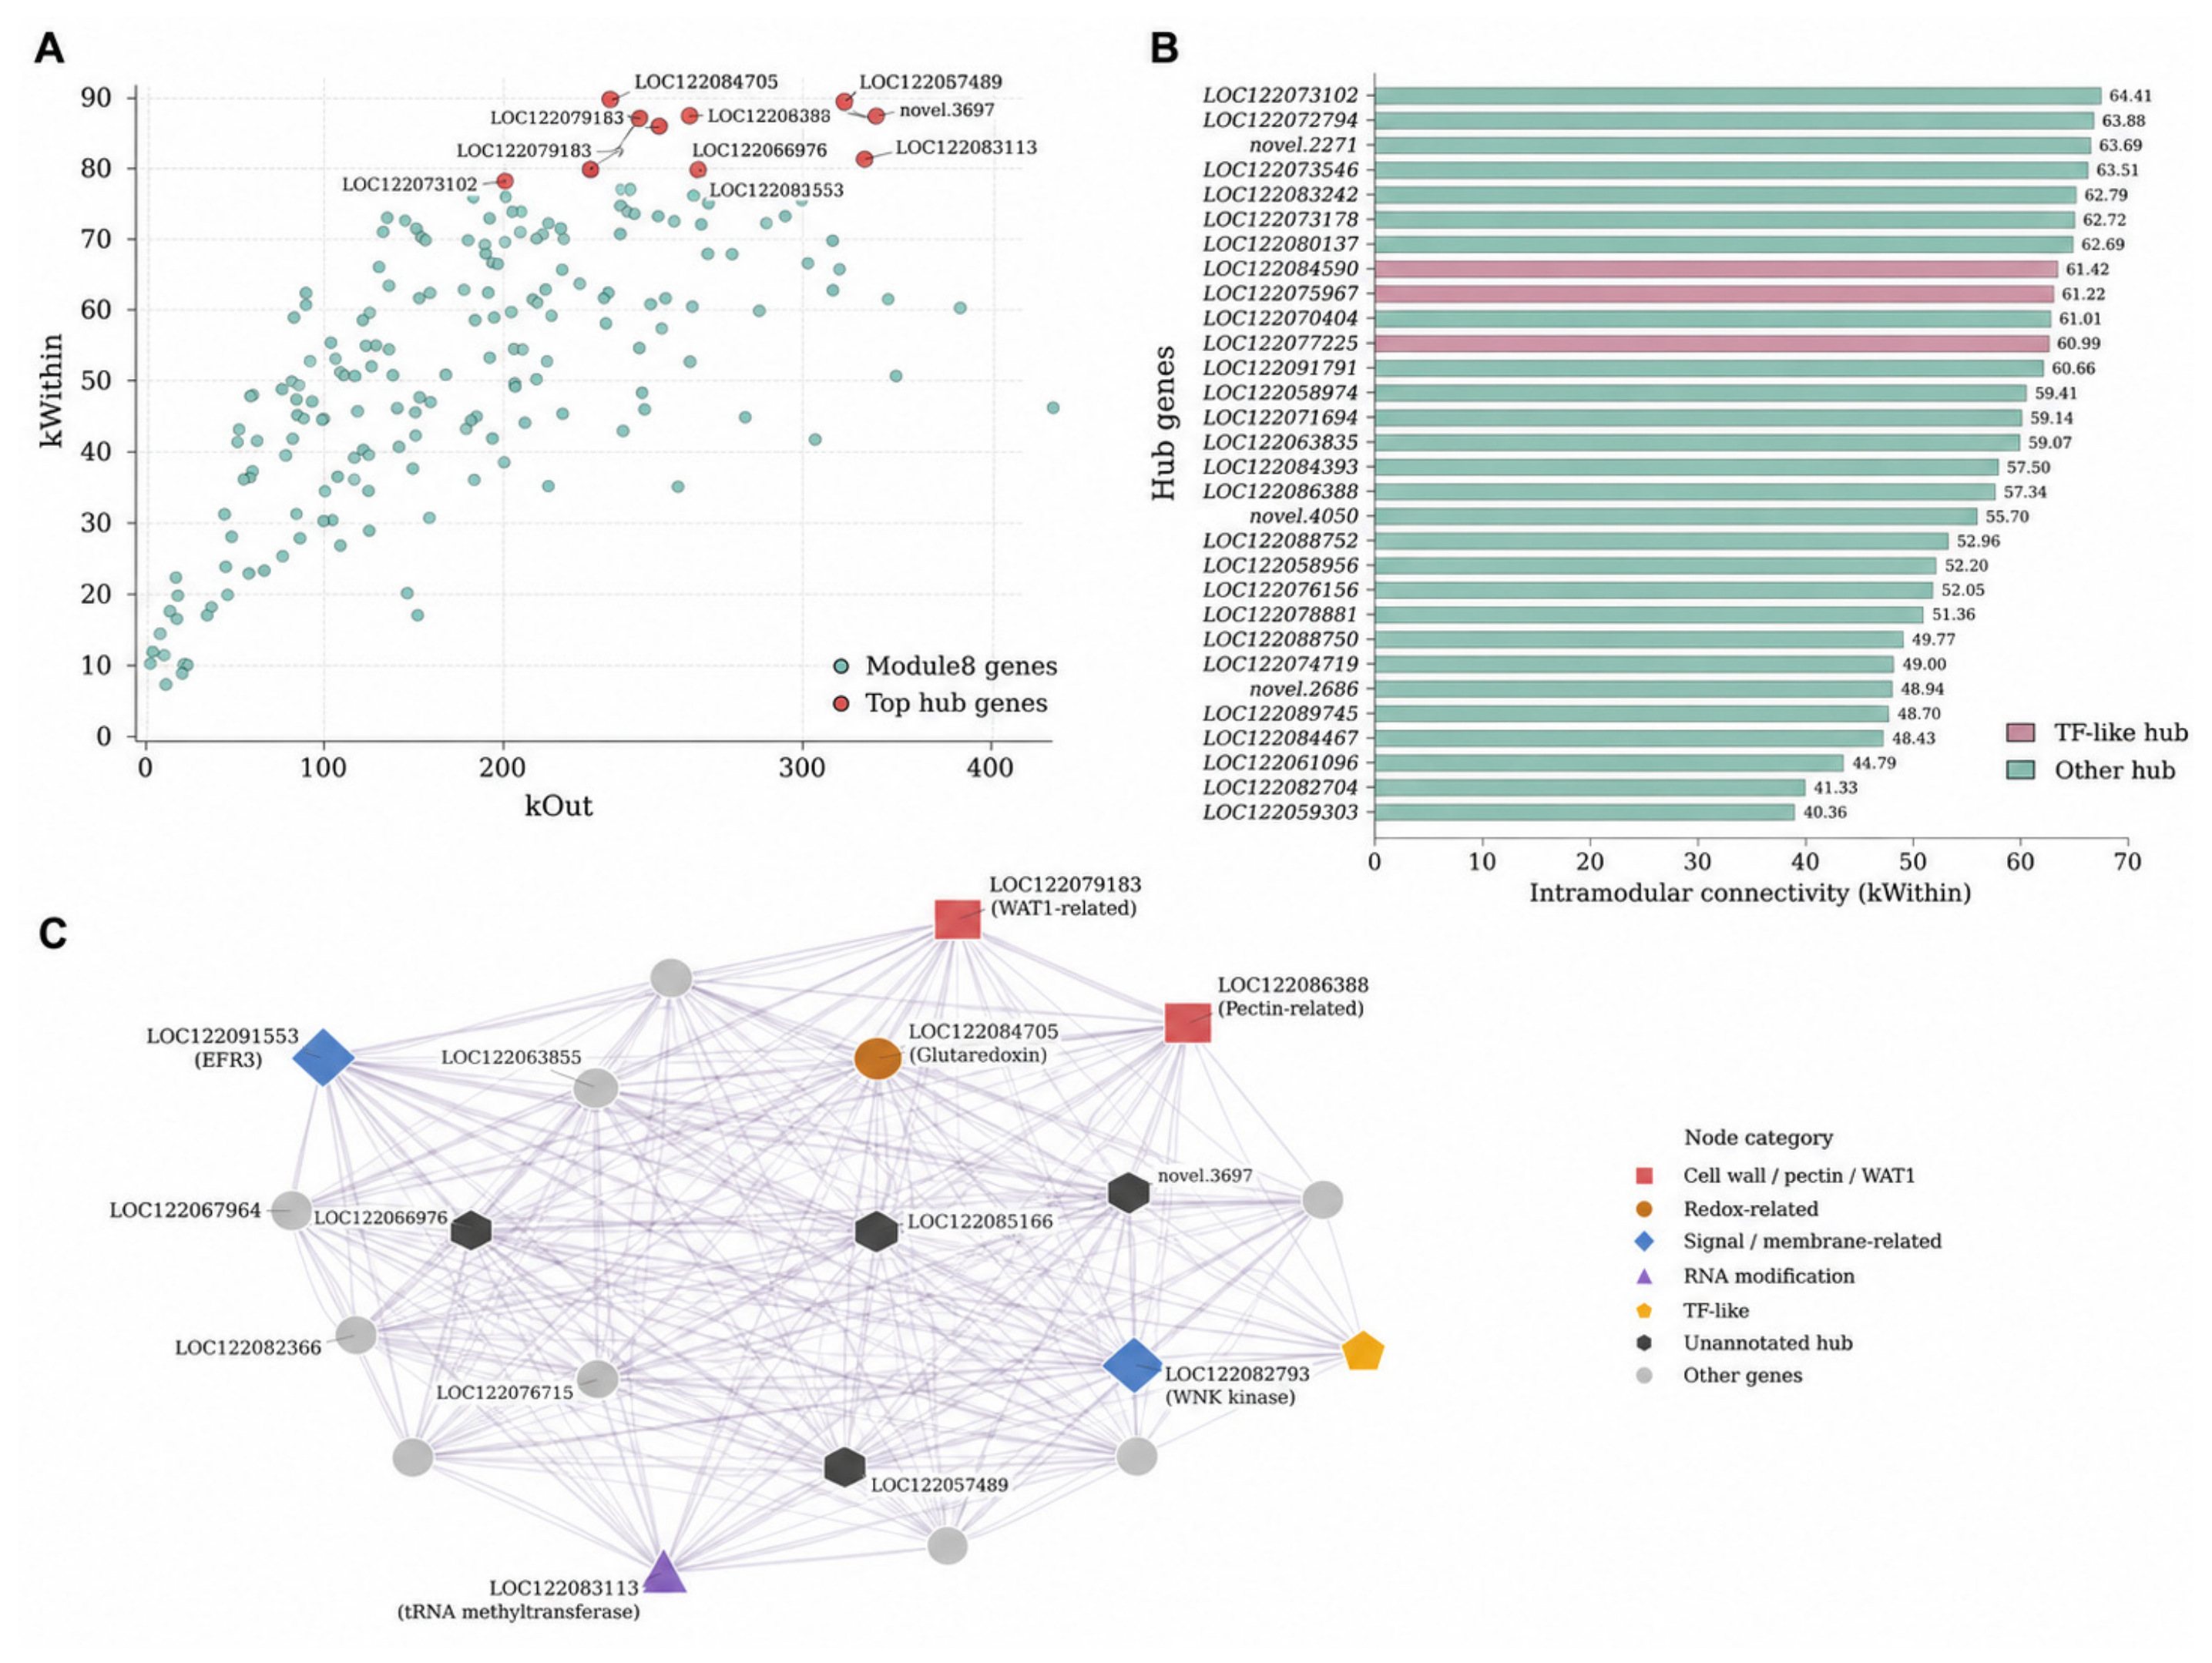
36]. The M8 module was significantly associated with middle and late shell samples and was enriched in phenylpropanoid biosynthesis, secondary metabolite biosynthetic processes, extracellular region functions, and oxidoreductase activity. Candidate hub genes identified within this module were not restricted to typical lignin structural enzymes, but also included genes encoding a WAT1-related protein, a pectin modification-related protein, a glutaredoxin family protein, a WNK-type protein kinase, and an EFR3 membrane-associated protein. These findings suggest that middle-to-late shell development represents a coordinated co-expression program initiated during mid-development and maintained into later stages, rather than a simple accumulation of scattered differentially expressed genes [
36]. Similar modular characteristics have also been reported in endocarp studies of
Juglans sigillata [
6], in which lignin biosynthesis-related genes frequently form highly correlated co-expression modules together with upstream master regulators such as NAC and MYB transcription factors, structural enzyme-encoding genes, and genes involved in cell wall polymer biosynthesis, showing strong associations with specific developmental stages or tissue types [
6,
9].
5. Conclusions
Based on transcriptomic analyses of husk and shell development in macadamia (Macadamia spp.), this study systematically characterized the expression divergence between the two tissue types across different developmental stages and clarified the molecular basis associated with shell layer formation. The results showed that major transcriptomic reprogramming in both husk and shell occurred predominantly between 30 and 50 days after flowering, whereas the number of differentially expressed genes declined sharply during the 50–80 DAF interval. This finding indicates that the key molecular events underlying late-stage tissue differentiation and shell layer formation take place mainly during mid-development. Differential expression and enrichment analyses further showed that genes associated with shell development were mainly involved in phenylpropanoid metabolism, secondary metabolism, cell wall organization, extracellular region functions, redox-related processes, and plant hormone signal transduction. Weighted gene co-expression network analysis identified a co-expression module significantly associated with middle-to-late shell development, in which genes were predominantly enriched in phenylpropanoid metabolism, redox-related processes, and extracellular region functions. From this module, several high-connectivity candidate hub genes were identified, including those encoding a glutaredoxin family protein (LOC122084705), a WNK-type protein kinase (LOC122082793), a tRNA methyltransferase-related protein (LOC122083113), an EFR3 membrane-associated protein (LOC122091553), a pectin modification-related protein (LOC122086388), and a WAT1-related protein (LOC122079183). Collectively, these findings indicate that M. integrifolia shell formation is a coordinated process involving cell wall remodeling, secondary metabolism, redox homeostasis, and signaling regulation. By integrating temporal transcriptomic profiling with co-expression network analysis, this study identifies the key developmental stages and major molecular regulatory features of shell formation, thereby providing a theoretical basis for further elucidation of shell developmental mechanisms and for the functional validation of candidate genes.



 and
and