Article

A Multilocus Integrative Framework to Reassess Species Boundaries Within the Cystoseira Sensu Stricto Complex (Fucales, Phaeophyceae)


by
Sara D’Ambros Burchio
1,2,*,
Alberto Pallavicini
1,3,
Lucia Muggia
1,
Ilaria Pagana
2,4,
Giovanni Furnari
4,
Samuele Greco
1,
Elettra Chiarabelli
1,
Fiorella Florian
1,
Jose Valdazo
5,6,
Ricardo Haroun
5,
Anna Maria Mannino
3,7,
Zahira Belattmania
8,
Raquel Sanchez de Pedro
9,
Polytimi Ioli Lardi
10,
Maria Salomidi
10,
Ljiljana Iveša
11,
Claudio Battelli
12 and
Annalisa Falace
1,2,3
1
Department of Life Sciences, University of Trieste, Via Licio Giorgieri 10, 34127 Trieste, Italy
2
Consorzio Nazionale Interuniversitario per le Scienze del Mare (CoNISMa), Piazzale Flaminio 9, 00196 Roma, Italy
3
National Biodiversity Future Center (NBFC), Piazza Marina 61, 90133 Palermo, Italy
4
Department of Biological, Geological and Environmental Sciences, University of Catania, Via Empedocle 58, 95123 Catania, Italy
5
Biodiversity & Conservation Research Group, ECOAQUA—University of Las Palmas de Gran Canaria, 35016 Las Palmas de Gran Canaria, Spain
6
Pélagos Blue Restoration S.L., Centro de Innovación Marino Marítimo, Edificio Fundación Puerto Las Palmas, Muelle de Sta. Catalina, s/n, 35008 Las Palmas de Gran Canaria, Spain
7
Department of Biological, Chemical and Pharmaceutical Sciences and Technologies, University of Palermo, Piazza Marina 61, 90127 Palermo, Italy
8
Phycology, Blue Biodiversity and Biotechnology RU, Laboratory of Plant Biotechnology, Ecology and Ecosystem Valorization—CNRST Labeled Research Unit N.10, Faculty of Sciences, University Chouaib Doukkali, El Jadida 24000, Morocco
9
Department de Botánica y Fisiología Vegetal, Campus de Teatinos, Universidad de Málaga, Andalucía Tech, 29010 Málaga, Spain
10
Hellenic Centre of Marine Research (HCMR), Institute of Oceanography (IO), 19013 Anavyssos, Attica, Greece
11
Ruđer Bošković Institute, Center for Marine Research, 52210 Rovinj, Croatia
12
Slovenian Museum of Natural History, Prešernova Cesta 20, 1000 Ljubljana, Slovenia
*
Author to whom correspondence should be addressed.
Plants 2026, 15(14), 2237; https://doi.org/10.3390/plants15142237
Submission received: 10 June 2026 / Revised: 6 July 2026 / Accepted: 9 July 2026 / Published: 22 July 2026
(This article belongs to the Section Plant Systematics, Taxonomy, Nomenclature and Classification)

Abstract

Cystoseira sensu lato (s.l.) (Fucales, Phaeophyceae) form structurally complex marine forests along the warm-temperate coasts of the Mediterranean Sea and the eastern Atlantic Ocean. They are experiencing widespread decline, yet their conservation and restoration are hindered by taxonomic uncertainty. Within Cystoseira sensu stricto (s.s.), species boundaries among taxa traditionally referred to as C. compressa, C. foeniculacea, C. humilis (including the C. canariensis morphotype), and C. pustulata have long been debated due to the high plasticity and partial overlap of diagnostic morphological traits. Here we reassess species boundaries within the Cystoseira s.s. complex using an integrative approach combining morphology, ecology, and multilocus genetic data. We collected specimens from 20 sites spanning the Mediterranean–Atlantic distribution. Genomic DNA was extracted from 220 specimens and Sanger sequencing generated 243 new sequences (ITS2: n = 99; cox1: n = 88; rbcL–rbcS: n = 56). We inferred single-locus and concatenated phylogenies, reconstructed haplotype networks, and applied multiple single-locus species delimitation approaches to test the robustness of inferred boundaries. We consistently recovered two primary lineages corresponding to C. foeniculacea and a C. compressa complex, the latter including specimens historically identified as C. pustulata and the C. humilis with the C. canariensis morphotype. Within an integrative framework that prioritises cross-locus concordance and diagnosability, we recognise two species-level lineages in Cystoseira s.s. and treat the morpho-ecologically coherent entities within C. compressa at the variety rank. Accordingly, we propose the new status and combination Cystoseira compressa var. pustulata (Ercegović) D’Ambros Burchio & Falace, comb. et stat. nov.

1. Introduction

Brown macroalgae of the genus Cystoseira sensu lato (s.l.) (Fucales, Phaeophyceae) form extensive marine forests along the warm-temperate coasts of the Mediterranean Sea and the eastern Atlantic Ocean [1,2,3,4]. As ecosystem engineers [5], these canopy-forming assemblages create complex three-dimensional habitats that support high biodiversity and provide multiple ecosystem services [6,7,8]. In recent decades, Cystoseira s.l. forests have experienced widespread decline across much of their range [9,10,11,12], driven by multiple anthropogenic stressors, including eutrophication, habitat degradation, and ocean warming [9,13,14]. Within this declining group, taxonomic uncertainty remains a major obstacle to accurate biodiversity assessment and effective conservation planning, particularly for morphologically complex lineages.
Accurate species identification within Cystoseira s.l. is notoriously challenging due to pronounced phenotypic plasticity [15,16,17], ongoing or recent speciation [18,19], and frequent hybridisation [19,20]. Nevertheless, robust taxonomy is a prerequisite for detecting shifts in species distributions, documenting local extinctions, and defining conservation priorities, particularly for habitat-forming taxa undergoing rapid ecological change, such as Cystoseira s.l. [21,22,23]. The limitations of morphology-based taxonomy have therefore prompted increasing use of molecular approaches to delineate species boundaries and clarify evolutionary relationships within the group [1,17,24,25,26,27,28,29,30].
While molecular data have greatly improved taxonomic resolution in Cystoseira s.l., their application has not always been consistent across studies, and species boundaries remain unstable in several complexes. Molecular phylogenetic studies have shown that Cystoseira s.l., as traditionally circumscribed, represents a polyphyletic assemblage [17]. Based on multilocus evidence, Draisma et al. [17] proposed a major taxonomic reorganisation of the family Sargassaceae, reinstating the genera Stephanocystis Trevisan, Polycladia Montagne, and Sirophysalis Kützing for species in the North Pacific, western Indian Ocean, and Indo-Pacific regions, respectively. Although these authors suggested that the European representatives of Cystoseira should also be segregated into multiple genera, they did not formally propose new combinations. Subsequent phylogenetic analyses focusing on European taxa refined this framework. Orellana et al. [1] restricted Cystoseira sensu stricto (s.s.) to a single well-supported clade and resurrected the historical genera Carpodesmia Greville and Treptacantha Kützing for the remaining Mediterranean-Atlantic species. Shortly thereafter, Molinari and Guiry [26] clarified that the correct names for these genera are Ericaria Stackhouse and Gongolaria Boehmer, which have nomenclatural priority over Carpodesmia and Treptacantha, respectively. More recently, Neiva et al. [27] corroborated this generic framework using cox1 barcoding data from the northeastern Atlantic and western Mediterranean, while highlighting several unresolved species complexes.
Despite these advances, resolution of species complexes requires an integrative taxonomic framework that explicitly combines multiple lines of evidence. Different studies have applied heterogeneous analytical strategies, with some combining genetic analyses and morphology [1,31,32], while others have relied exclusively on molecular data. Furthermore, marker choice has varied according to the taxonomic scale investigated. For example, the plastid-encoded psbA gene has been used primarily to infer higher-level relationships, whereas mitochondrial markers such as mt23S and the mt23S–tRNA^Val spacer have proved informative at the genus level [1,17]. At the species level, most studies have relied on the mitochondrial cox1 gene [1,25,27,32]. In other Phaeophyceae, however, plastid (rbcL–rbcS) and nuclear (ITS2) markers have been shown to provide complementary resolution for species delimitation and intraspecific analyses [33,34]. This heterogeneity in marker choice and analytical frameworks has hampered comparability among studies, highlighting the need for a standardised multilocus approach.
Among the taxa currently included within Cystoseira s.s., we focus here on four entities presently treated at species rank: C. compressa (Esper) Gerloff & Nizamuddin, C. foeniculacea (Linnaeus) Greville, C. humilis Schousboe ex Kützing (with the morphology of C. canariensis Sauvageau), and C. pustulata (Ercegović) Neiva & Serrão. Their taxonomic history is complicated by pronounced morphological plasticity and partially overlapping distributions, which have led to frequent misidentifications and unstable classifications [35,36,37,38]. Traditional diagnostic traits, including branch compression, aerocyst development, and cryptostomata morphology, are highly plastic and strongly influenced by environmental conditions such as hydrodynamic exposure, light availability, and tidal regime, often obscuring species boundaries.
Consequently, multiple taxonomic revisions have produced conflicting interpretations and descriptions without fully resolving the status of these entities [16,35,38,39,40,41,42]. Neiva et al. [27] recently reassessed the group using cox1, supporting recognition of four taxa within Cystoseira s.s.; however, reliance on a single locus may be insufficient where shallow divergence, hybridisation, and morphological overlap coexist [20,43]. A multilocus approach, explicitly integrated with morphological and ecological traits, is therefore preferable to robustly delineate species boundaries and to test whether the currently recognised taxa represent independent evolutionary lineages.
To address these issues, we applied a multilocus phylogenetic analysis of three complementary DNA markers (cox1, rbcL–rbcS, ITS2) and integrated it with detailed morphological analyses and ecological data. In doing this we aim to: (i) reassess species boundaries within Cystoseira s.s., using congruent multilocus phylogenetic and species delimitation analyses; (ii) evaluate the taxonomic significance of morpho-ecological differentiation within the C. compressa complex; and (iii) provide a robust, reproducible reference framework to support biodiversity monitoring, conservation, and restoration of declining Cystoseira forests.

2. Materials and Methods

2.1. Specimen Collections and Morphological Identification

Between 2023 and 2024, a total of 250 specimens of Cystoseira s.s. were collected from 20 sites across the Atlantic and Mediterranean regions (Table S1; Figure S1). Sampling was designed to capture the broadest possible morphological, ecological, and geographic variation across the range of the target taxa. The selected localities reflect the currently known distribution of these entities, as well as the accessibility of populations during the study period. From each population, approximately 10 thalli located a few metres apart were collected, and for each specimen, approximately 1 g of apical fronds was carefully cleaned of epiphytes and preserved in silica gel for subsequent genetic analyses. For morphological identification, four thalli per population were examined, described and identified using dichotomous keys and morphological descriptions [35,39,40,41,44]. Diagnostic characters were documented photographically, and representative voucher specimens were preserved as exsiccate. Specimens displaying protruding crypts on primary branches were rehydrated, sectioned in a Leica CM1860 cryostat (Leica Biosystem, Nussloch, Germany), and subsequently photographed using a Zeiss Primostar 3 microscope (Carl Zeiss AG, Oberkochen, Germany).

2.2. Molecular Analyses

Genomic DNA (gDNA) was successfully extracted from 220 macroalgal specimens using a protocol optimised for polysaccharide-rich macroalgal tissues. Approximately 10 mg of dried tissue was mechanically disrupted using a VWR® Bead Mill homogeniser (VWR International, Radnor, PA, USA) with three stainless-steel beads (⌀ 2 mm). Approximately 2 mg of homogenised tissue powder was then incubated in 20 µL of lysis solution prepared with the PCRBIO Rapid Extract PCR Kit (PCR Biosystems Ltd., London, UK), following the manufacturer’s instructions. Not all collected specimens yielded amplifiable DNA for all markers, resulting in different sample sizes across molecular analyses.
PCR amplification targeted three genetic markers (Table 1): the mitochondrial cox1 gene, the plastid-encoded rbcL-rbcS intergenic spacer (ribulose-1,5-bisphosphate carboxylase/oxygenase, RuBisCO), and the nuclear ribosomal ITS2 region. The cox1 fragment was amplified using two primers newly designed in this study, specifically for the genus Cystoseira s.l. (COI_CYSTOsl_F and COI_CYSTOsl_R) to minimise the co-amplification of epiphytic contaminants. Despite thorough cleaning of samples prior to DNA extraction, contaminant sequences were initially detected; therefore, genus-specific primers were developed to improve amplification specificity. The fragment including the rbcL-rbcS intergenic spacer was retrieved using a primer located on the RuBisCO large subunit (rbcLRH3F; [45]) and one on the RuBisCO small subunit (rbcS139R; [46]). The ITS2 fragment was amplified using the primer pair 5.8S BF and 25BR2 [47].
The amplification reactions were performed in a final volume of 20 µL containing 10 µL of 2× PCRBIO Ultra Mix (PCR Biosystems Ltd., London, UK), 1 µL of gDNA (diluted 1:100 to 1:1000) and 0.6 µL of each 10 μM forward and reverse primer.
PCR products were checked on 1.5% TAE agarose gels to verify successful DNA amplification and then purified with ExoSAP-IT™ PCR Product Cleanup Reagent (Thermo Fisher Scientific, Waltham, MA, USA) according to the manufacturer’s instructions. The quality and quantity of purified PCR products were assessed with a Nanodrop 2000 spectrophotometer (Thermo Fisher Scientific, Waltham, MA, USA). The final products were Sanger-sequenced by Eurofins Genomics (Ebersberg, Germany).
Out of the 220 extracted specimens, 180 amplified successfully for at least one of the three markers. However, among these 180, 50 were subsequently discarded due to ambiguous chromatograms, double peaks, or very short/low-quality sequences that could not be confidently aligned. Therefore, we obtained 120 usable specimens for at least one marker, yielding a total of 243 new sequences across the three loci.

2.3. Phylogenetic and Species Delimitation Analyses

Chromatograms were edited using the software package QIAGEN CLC Genomics Workbench v.25.0.1 (QIAGEN, Hilden, Germany). Sequence identity was verified through BLASTn similarity searches in GenBank [48]. Individual gene alignments were generated with QIAGEN CLC Genomics Workbench, and sequences were manually trimmed to uniform lengths. Outgroups were selected within Stephanocystis (Sargassaceae) based on the availability of homologous sequences for each locus. Because the same Stephanocystis taxon was not available for all markers, we used the closest available Stephanocystis sequences per locus: S. hakodatensis (voucher AB043673) for ITS2, S. osmundacea (voucher AY183897) for rbcL-rbcS, and Stephanocystis sp. (voucher OK480526) for cox1. For cox1, the phylogeny of our specimens was inferred in conjunction with selected homologous sequences retrieved from GenBank (complete list provided in Supplementary Information, Table S2). In contrast, for rbcL-rbcS and ITS2, no sequences of Cystoseira s.s. were available in public repositories; therefore, analyses of these markers were based exclusively on sequences generated in this study. To remove redundancy, gene alignments were clustered using CD-HIT [49] with a similarity threshold of 100%. For each alignment, the best-fitting nucleotide substitution model (HKY + G for cox1, T92 + G for rbcL-rbcS, T92 for ITS2) was identified with MEGA11 v.11.0.13 [50]. Phylogenetic trees were inferred using both Bayesian Inference (BI) and Maximum Likelihood (ML) approaches. BI analyses were performed in MrBayes v.3.2.7 [51], with four chains run for 1,000,000 generations, sampling every 1000 generations, yielding 1000 trees. After discarding 25% as burn-in, 750 trees were retained to compute a 50% majority-rule consensus tree with posterior probabilities. ML analyses were run in RAxML-NG v1.2.2 [52]. For each alignment, the best-scoring ML tree was inferred from a random parsimony starting tree under the selected substitution model. Node support was assessed using 100 non-parametric bootstrap replicates, and bootstrap values were mapped onto the final ML tree. In addition to single-locus phylogenies, concatenated alignments were generated to infer multilocus trees. Two concatenated datasets were assembled: one comprising 35 specimens for which all three markers (ITS2, rbcL–rbcS, and cox1) were available, and a second including 79 specimens represented by at least two markers. BI and ML analyses of concatenated datasets were conducted using the same settings described above. Final tree visualisations were created with iTOL: Interactive Tree Of Life [53] to annotate and graphically refine the phylogenies.
To visualise intraspecific variation and the geographic distribution of haplotypes, we reconstructed haplotype networks separately for each single-locus alignment in PopART v1.7 [54], employing the TCS algorithm (Templeton–Crandall–Sing). Alignments were exported in NEXUS format. Gaps (“–”) were treated as informative characters and missing data were coded as “?”. In the resulting networks, each haplotype was represented as a node proportional in size to its frequency, with edges corresponding to the minimum number of mutational steps between haplotypes. Individuals were colour-coded by sampling locality. For the cox1 haplotype network, only sequences generated in this study were included, to ensure full traceability to morphologically validated voucher specimens and to avoid potential biases introduced by misidentified or inconsistently annotated sequences in public repositories.
Species delimitation was assessed using three complementary approaches: ABGD/ASAP (Automatic Barcode Gap Discovery for primary species delimitation, [55]; Assemble Species by Automatic Partitioning [56]), PTP (Poisson Tree Processes; [57]), and GMYC (General Mixed Yule Coalescent; [58]). All methods were applied independently to the ITS2, rbcL–rbcS, and cox1 alignments. ABGD and ASAP analyses were run via the online web server (https://spartexplorer.mnhn.fr/, accessed on 13 March 2025) using both the Jukes–Cantor (JC69) and Kimura two-parameter (K80) substitution models. PTP analyses were based on both ML trees (inferred with RAxML-NG) and Bayesian trees (inferred with MrBayes) using the bPTP web server (http://species.h-its.org/ptp/, accessed on 13 March 2025). For GMYC delimitation, ultrametric gene trees were inferred in BEAST v1.10.5 [59] under all combinations of strict or uncorrelated lognormal relaxed clocks and Yule or coalescent (constant-size) tree priors. Convergence was assessed using Tracer v1.7.1, ensuring effective sample sizes (ESS) greater than 200 for all parameters. Posterior tree distributions were summarised in TreeAnnotator by applying a 10% burn-in and selecting the Maximum Clade Credibility (MCC) tree with mean node heights. The single-threshold GMYC model was then applied to the annotated MCC ultrametric trees to infer species boundaries based on shifts in branching rates using the GMYC web server (https://species.h-its.org/gmyc, accessed on 14 March 2025).

3. Results

3.1. Alignment Characterisation

A total of 243 new sequences were generated: 99 for ITS2, 88 for cox1, and 56 for rbcL-rbcS (Table S1), from specimens collected at 20 sites across the Mediterranean and Atlantic regions (Table S1, Figure S1). Combined with publicly available data, a total of 325 Cystoseira s.s. sequences were analysed, including 82 cox1 sequences retrieved from GenBank (Table S2). Final single-locus alignments, carefully trimmed to ensure consistent sequence lengths, comprised 1063 bp for rbcL–rbcS, 1046 bp for cox1, and 356 bp for ITS2. Two concatenated multi-locus alignments were also assembled, each 2465 bp in length: the first included 35 specimens for which all three markers were successfully amplified, while the second comprised 79 specimens represented by at least two of the three markers. Among the three markers, cox1 had the highest proportion of parsimony-informative sites relative to alignment length (65 sites; 6.2%), followed by ITS2 (17 sites; 4.8%) and rbcL–rbcS (22 sites; 2.1%). Due to differential amplification success across markers, the number of sequences for each taxon varied among loci; accordingly, comparisons of intraspecific genetic variation and haplotype diversity across markers were interpreted with this imbalance in mind.

3.2. Species Delimitation Methods, Inter-And Intraspecific Diversity and Barcode Gap

Analyses of the three single-locus alignments and their corresponding phylogenetic trees yielded largely congruent results across delimitation methods. Both ABGD/ASAP and PTP consistently recovered two species within Cystoseira s.s. (Table 2), corresponding to C. foeniculacea and C. compressa. The latter included specimens traditionally assigned to C. humilis (with the morphology of C. canariensis) and C. pustulata, hereafter referred to as the C. compressa complex. In contrast, GMYC analyses yielded locus-dependent outcomes. A single species was inferred for ITS2, two species for rbcL-rbcS (C. foeniculacea vs. the C. compressa complex) and five species for cox1 (C. foeniculacea, C. compressa 1, C. compressa 2, C. humilis, and C. pustulata) (Table 2). This variability highlights the sensitivity of GMYC to marker-specific signal and tree structure, particularly in groups characterised by shallow divergence. This interpretation is further supported by the low per-locus sequence dissimilarity observed among the three entities within the C. compressa complex. Mean pairwise dissimilarity ranged from 0.131% to 0.377% in rbcL-rbcS, from 0.822% to 0.964% in cox1, and from 0.000% to 0.283% in ITS2, confirming that divergence within the complex is shallow and marker-dependent. Following Levring’s [36] taxonomic treatment, C. canariensis is currently regarded as a synonym of C. humilis; however, in our view this conspecificity requires further confirmation (see Discussion). Hereafter, the lineage corresponding to C. canariensis (=C. humilis?) is referred to as C. morphotype canariensis.
Considering the most frequently inferred delimitation outcome, namely the recognition of two species (C. foeniculacea and the C. compressa complex), minimum interspecific genetic distances exceeded maximum intraspecific genetic distances across all three markers, clearly indicating a barcode gap (Figure 1). For cox1 and rbcL-rbcS, minimum interspecific distances were approximately twice the corresponding maximum intraspecific values (0.0359 vs. 0.0156 for cox1; 0.0133 vs. 0.0060 for rbcL-rbcS). The ITS2 alignment showed an even greater separation, with inter- and intraspecific distances differing by nearly an order of magnitude (0.0407 vs. 0.0056).
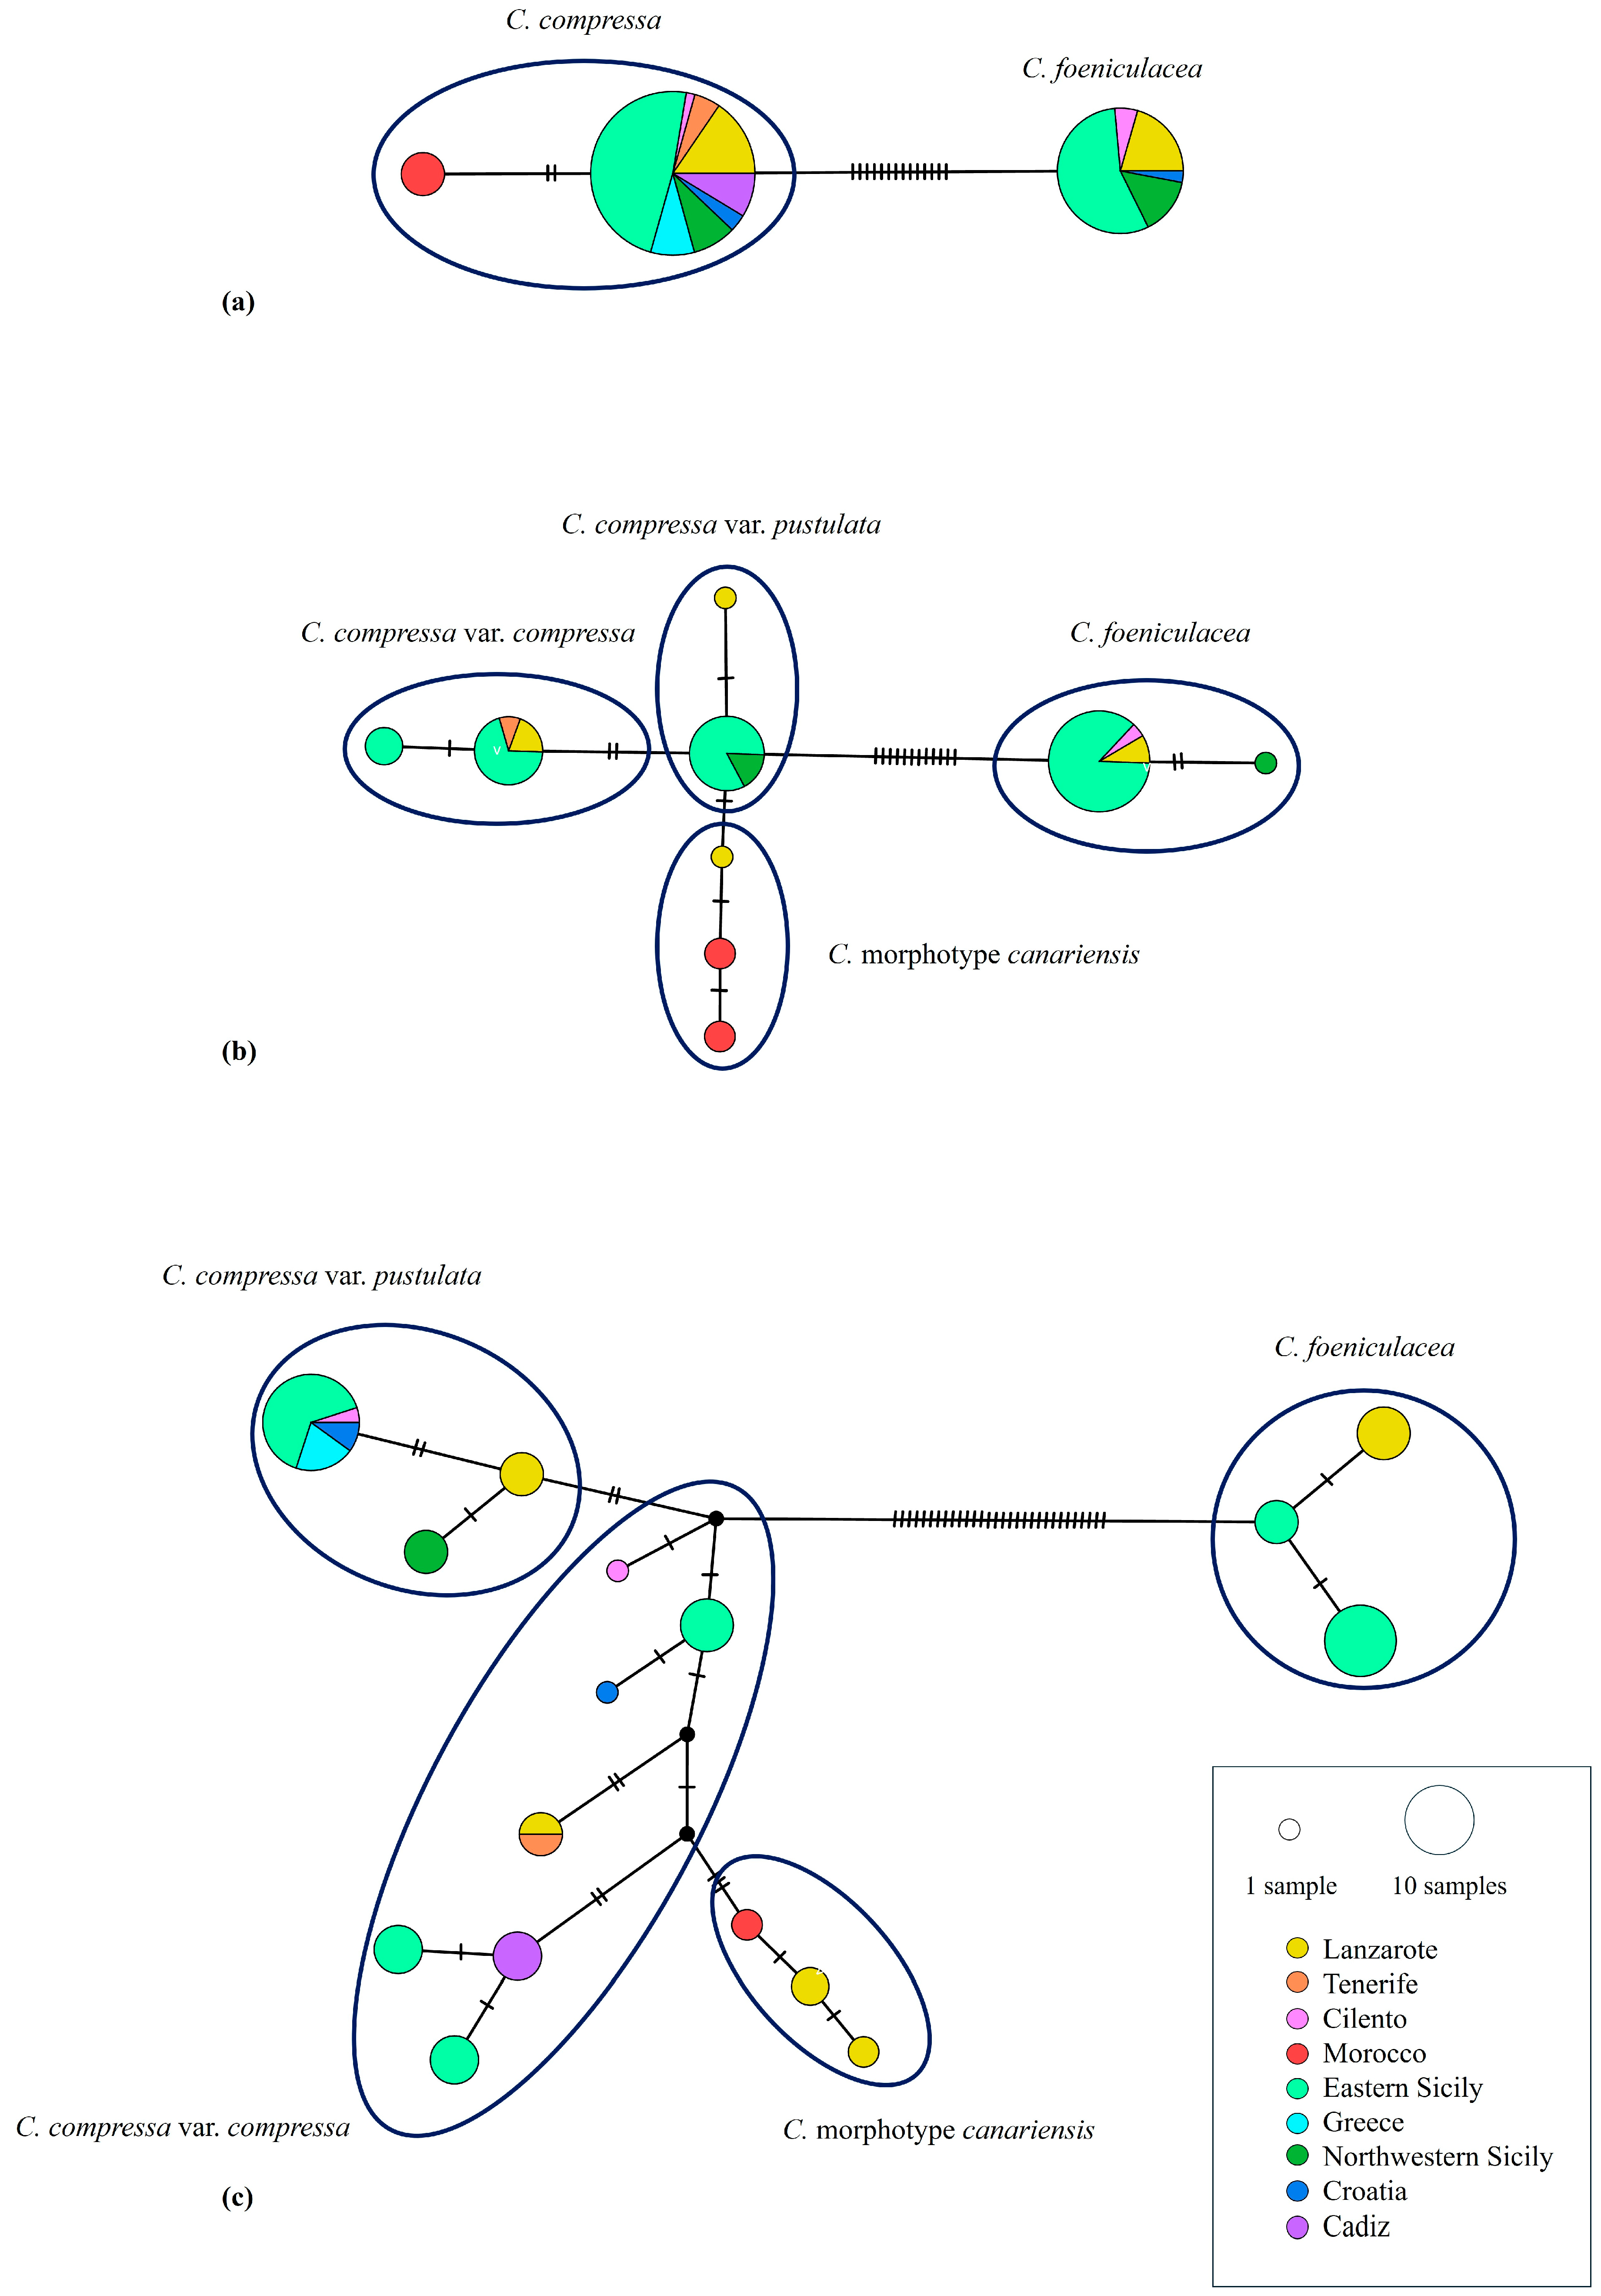
Despite method- and locus-dependent differences in resolution (particularly in GMYC partitions), all three loci consistently supported the same primary split between C. foeniculacea and the C. compressa complex. This concordance across mitochondrial, plastid, and nuclear markers provides robust evidence for the presence of two main evolutionary lineages within Cystoseira s.s., whereas finer subdivisions within the C. compressa complex lack consistent support across methods and markers.

3.3. Phylogenetic Trees and Haplotype Networks

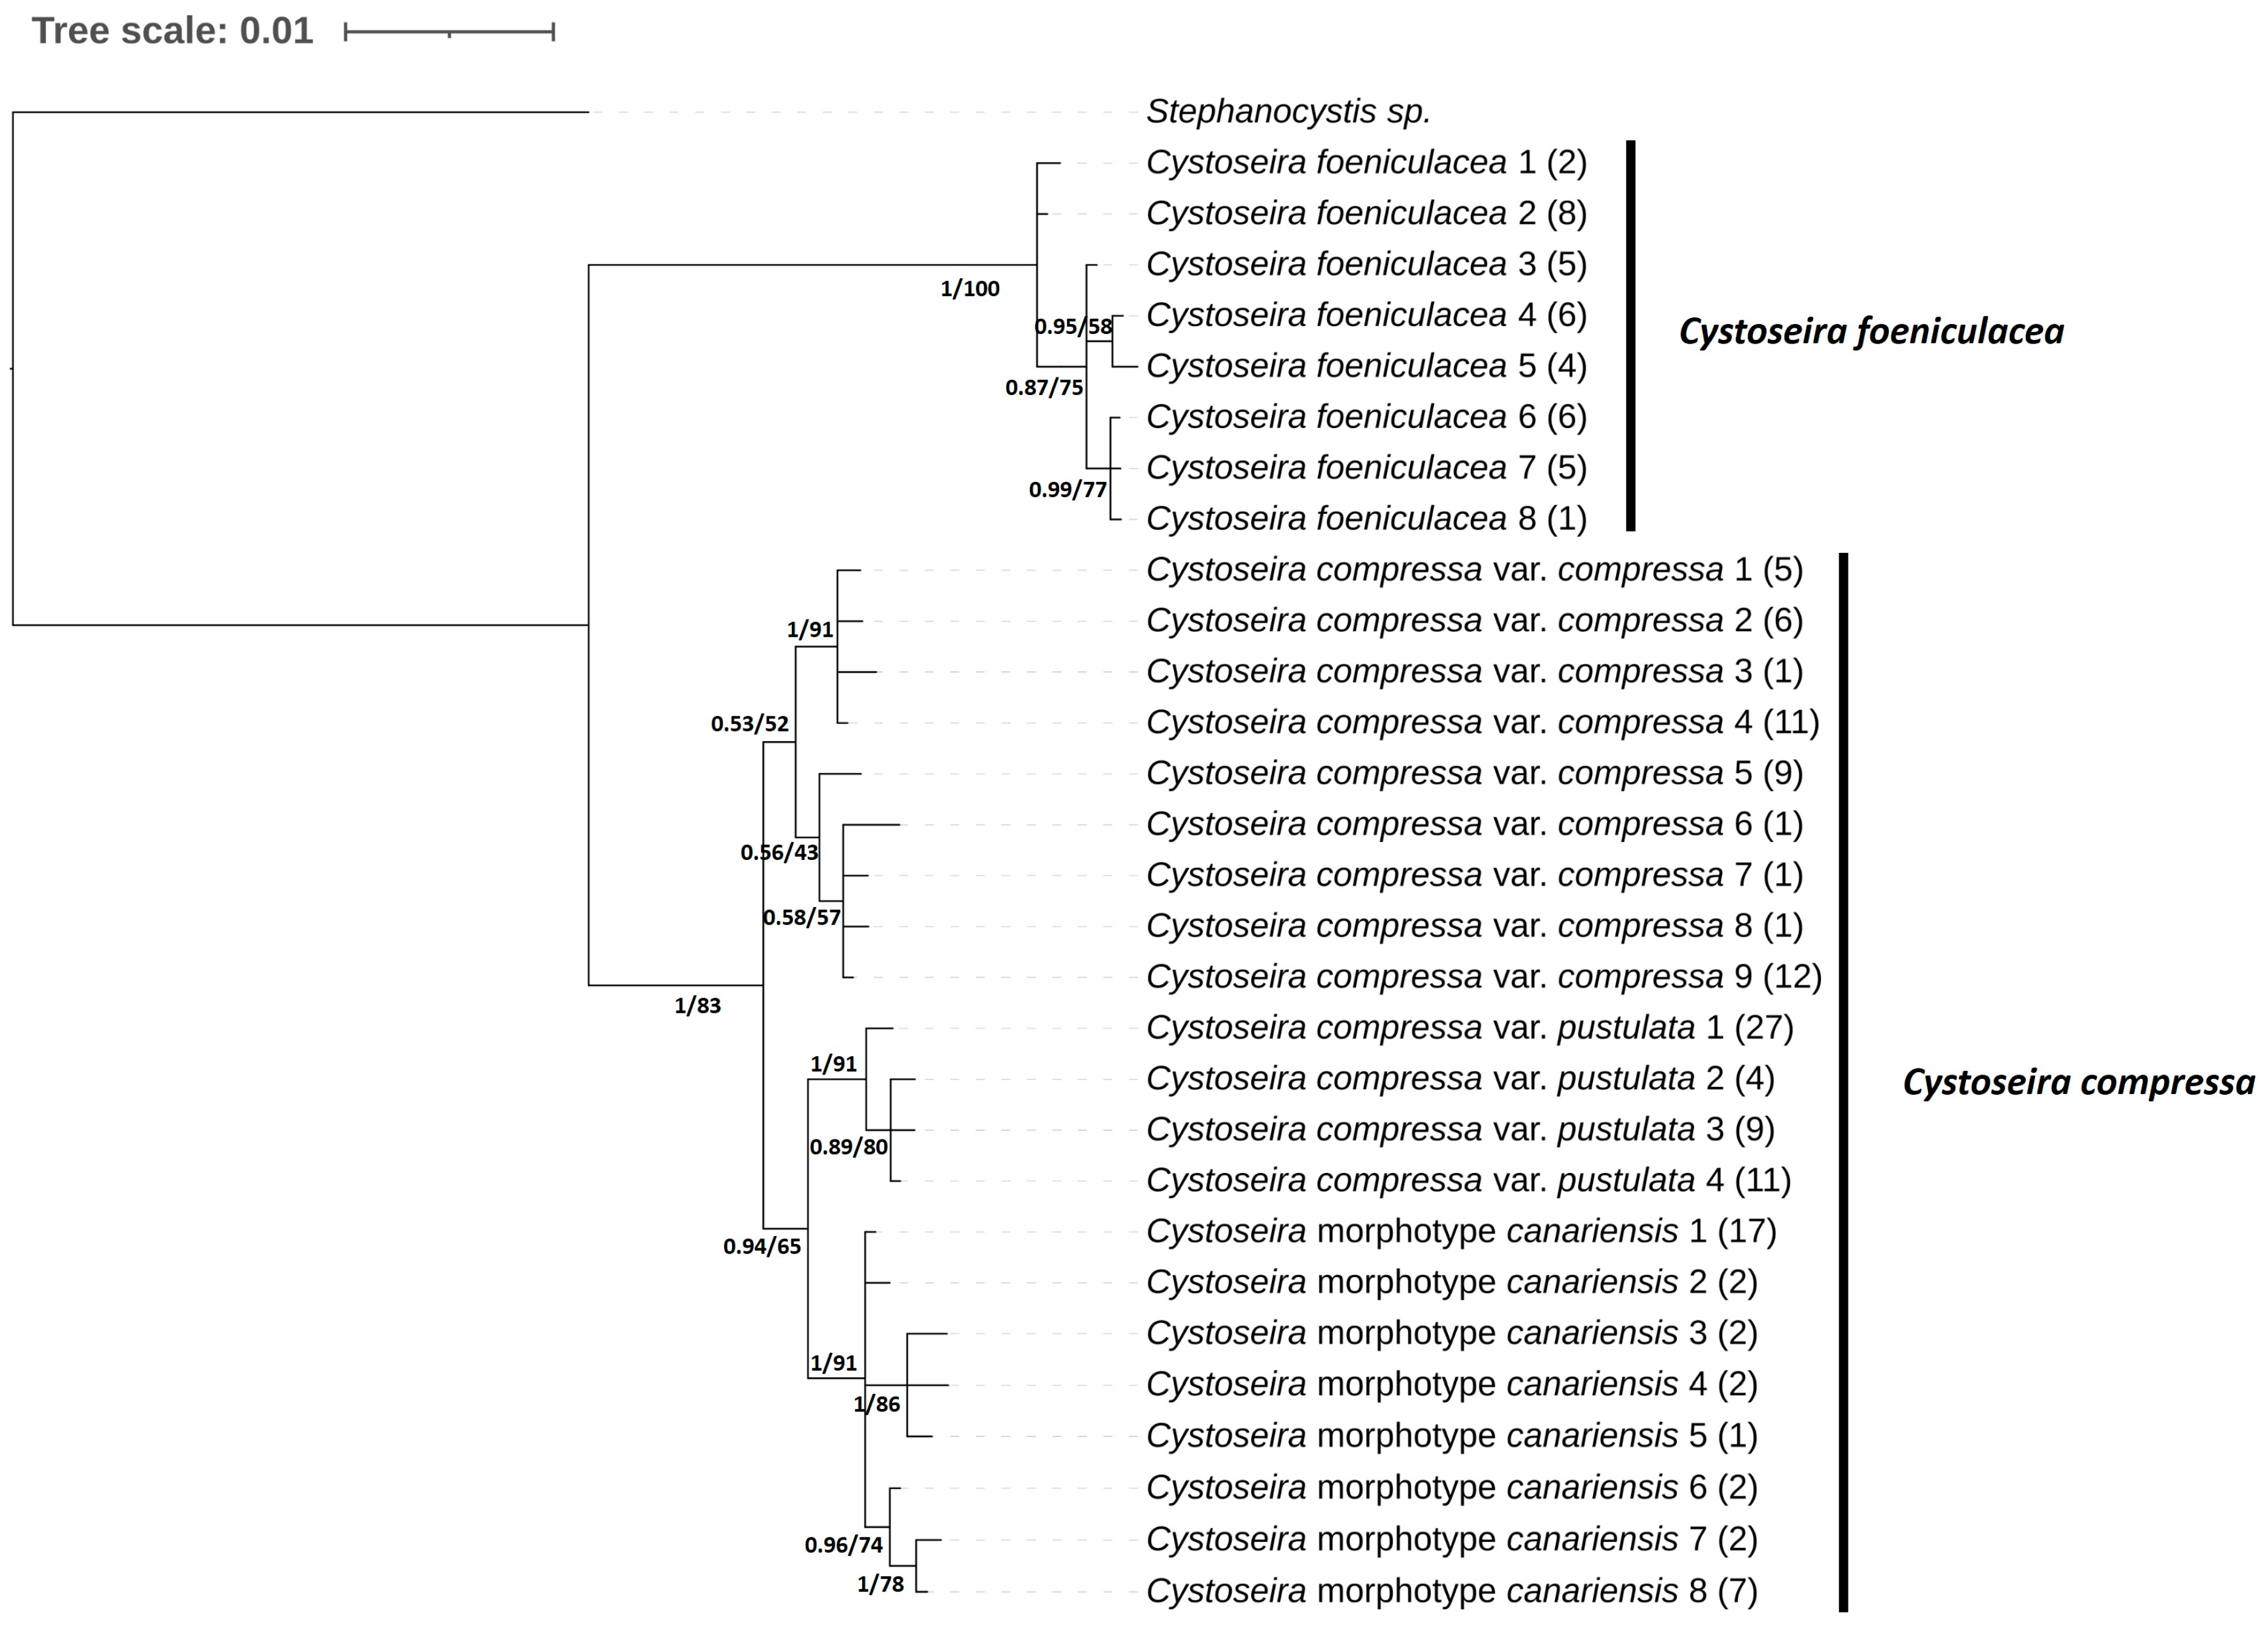
The number of haplotypes varied notably among markers, with three detected for ITS2, nine for rbcL-rbcS, and 29 for cox1. Both ML and BI phylogenetic analyses consistently resolved Cystoseira s.s. into two well-supported clades, corresponding to C. foeniculacea and the C. compressa complex.
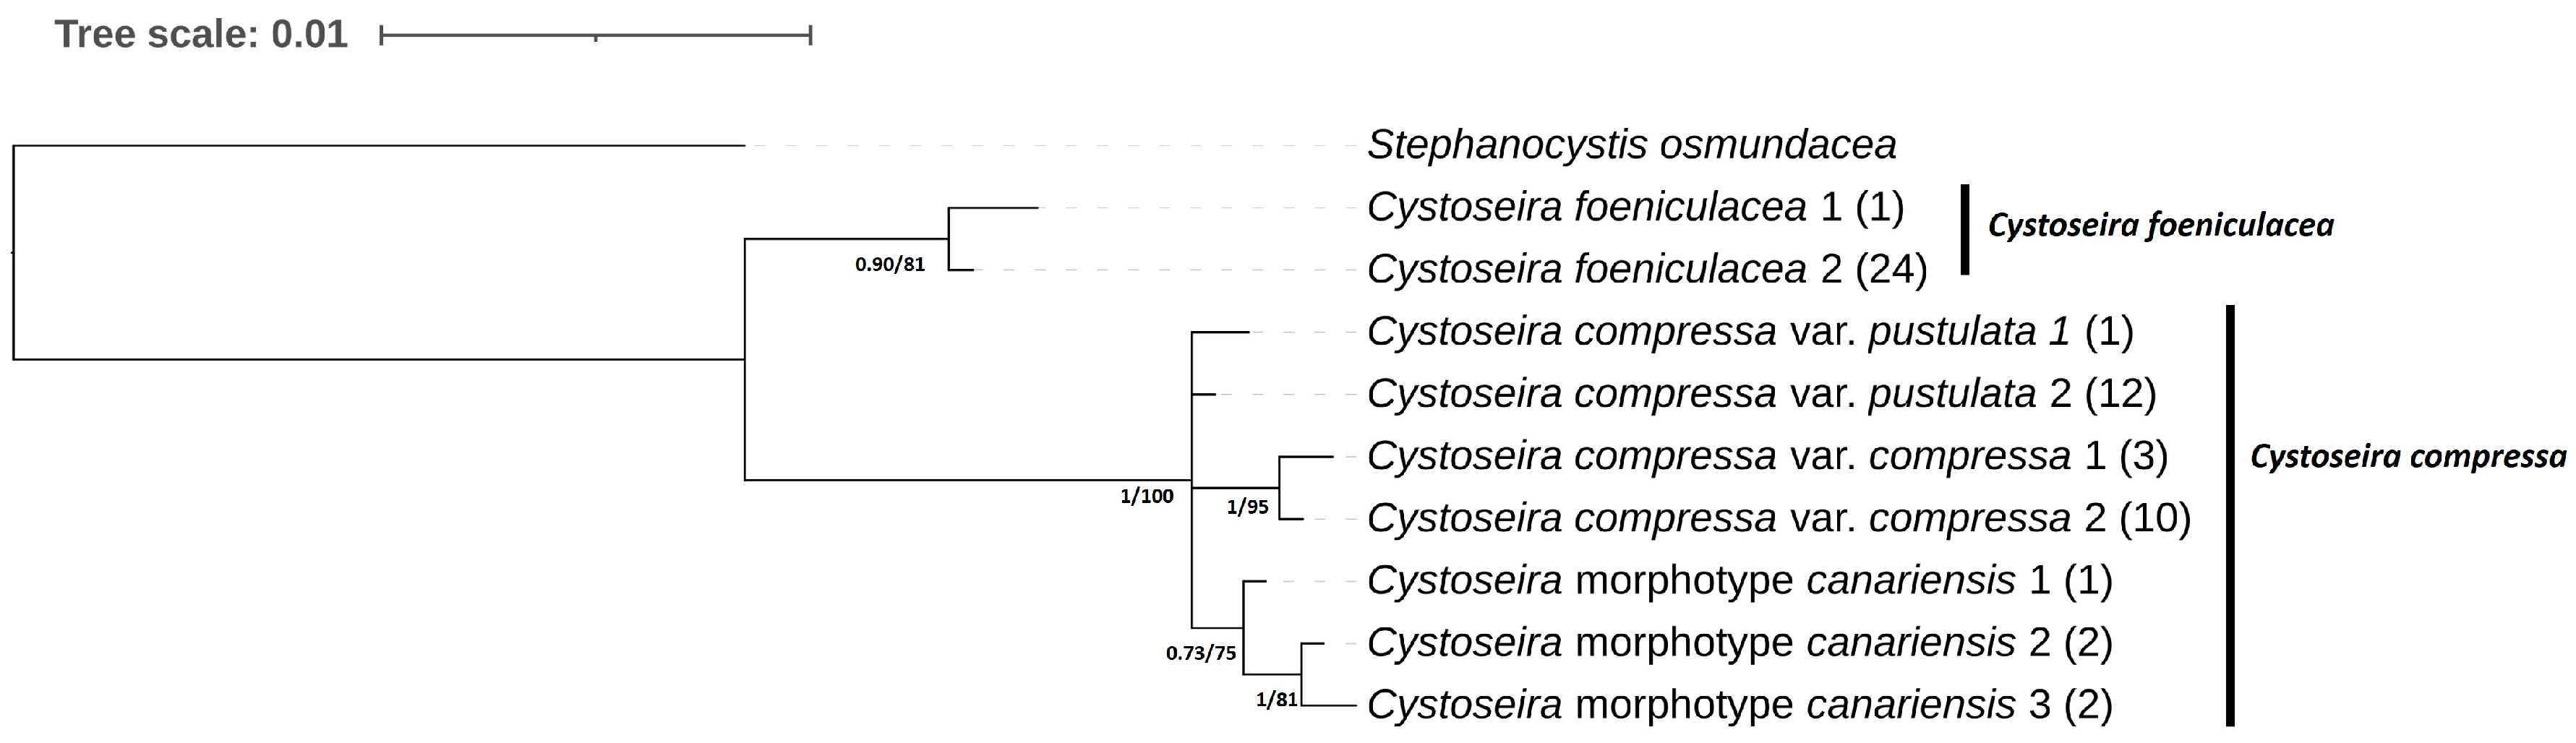
The cox1 phylogenetic trees (Figure 2) recovered eight haplotypes for C. foeniculacea and 21 for the C. compressa complex, encompassing specimens from across the Atlantic and Mediterranean regions (Spain, Portugal, Italy, Croatia, France, Morocco, Israel, Greece, Malta).
Within the C. compressa complex, some clades were recovered only as short branches with low support, suggesting subtle but weakly supported genetic differentiation. These patterns indicate limited phylogenetic resolution among closely related haplotypes and shallow genetic differentiation, consistent with recent divergence and/or incomplete lineage sorting.
The cox1 haplotype network (Figure 3c), based exclusively on sequences generated in this study, further illustrates the close genetic relationships within the complex, with only a small number of mutational steps separating haplotypes and no clear discontinuities indicating discrete haplogroups. The rbcL–rbcS phylogenies and corresponding haplotype network (Figure 4 and Figure 3b) identified two haplotypes for C. foeniculacea and seven for the C. compressa complex, within the latter, the three morpho-ecological entities were connected through an unresolved node (Figure 4). In contrast, ITS2 phylogenies recovered only a single haplotype for C. foeniculacea and two for the C. compressa complex, one of which comprised exclusively C. morphotype canariensis specimens from the Atlantic coast of Morocco (Figure 5 and Figure 3a).
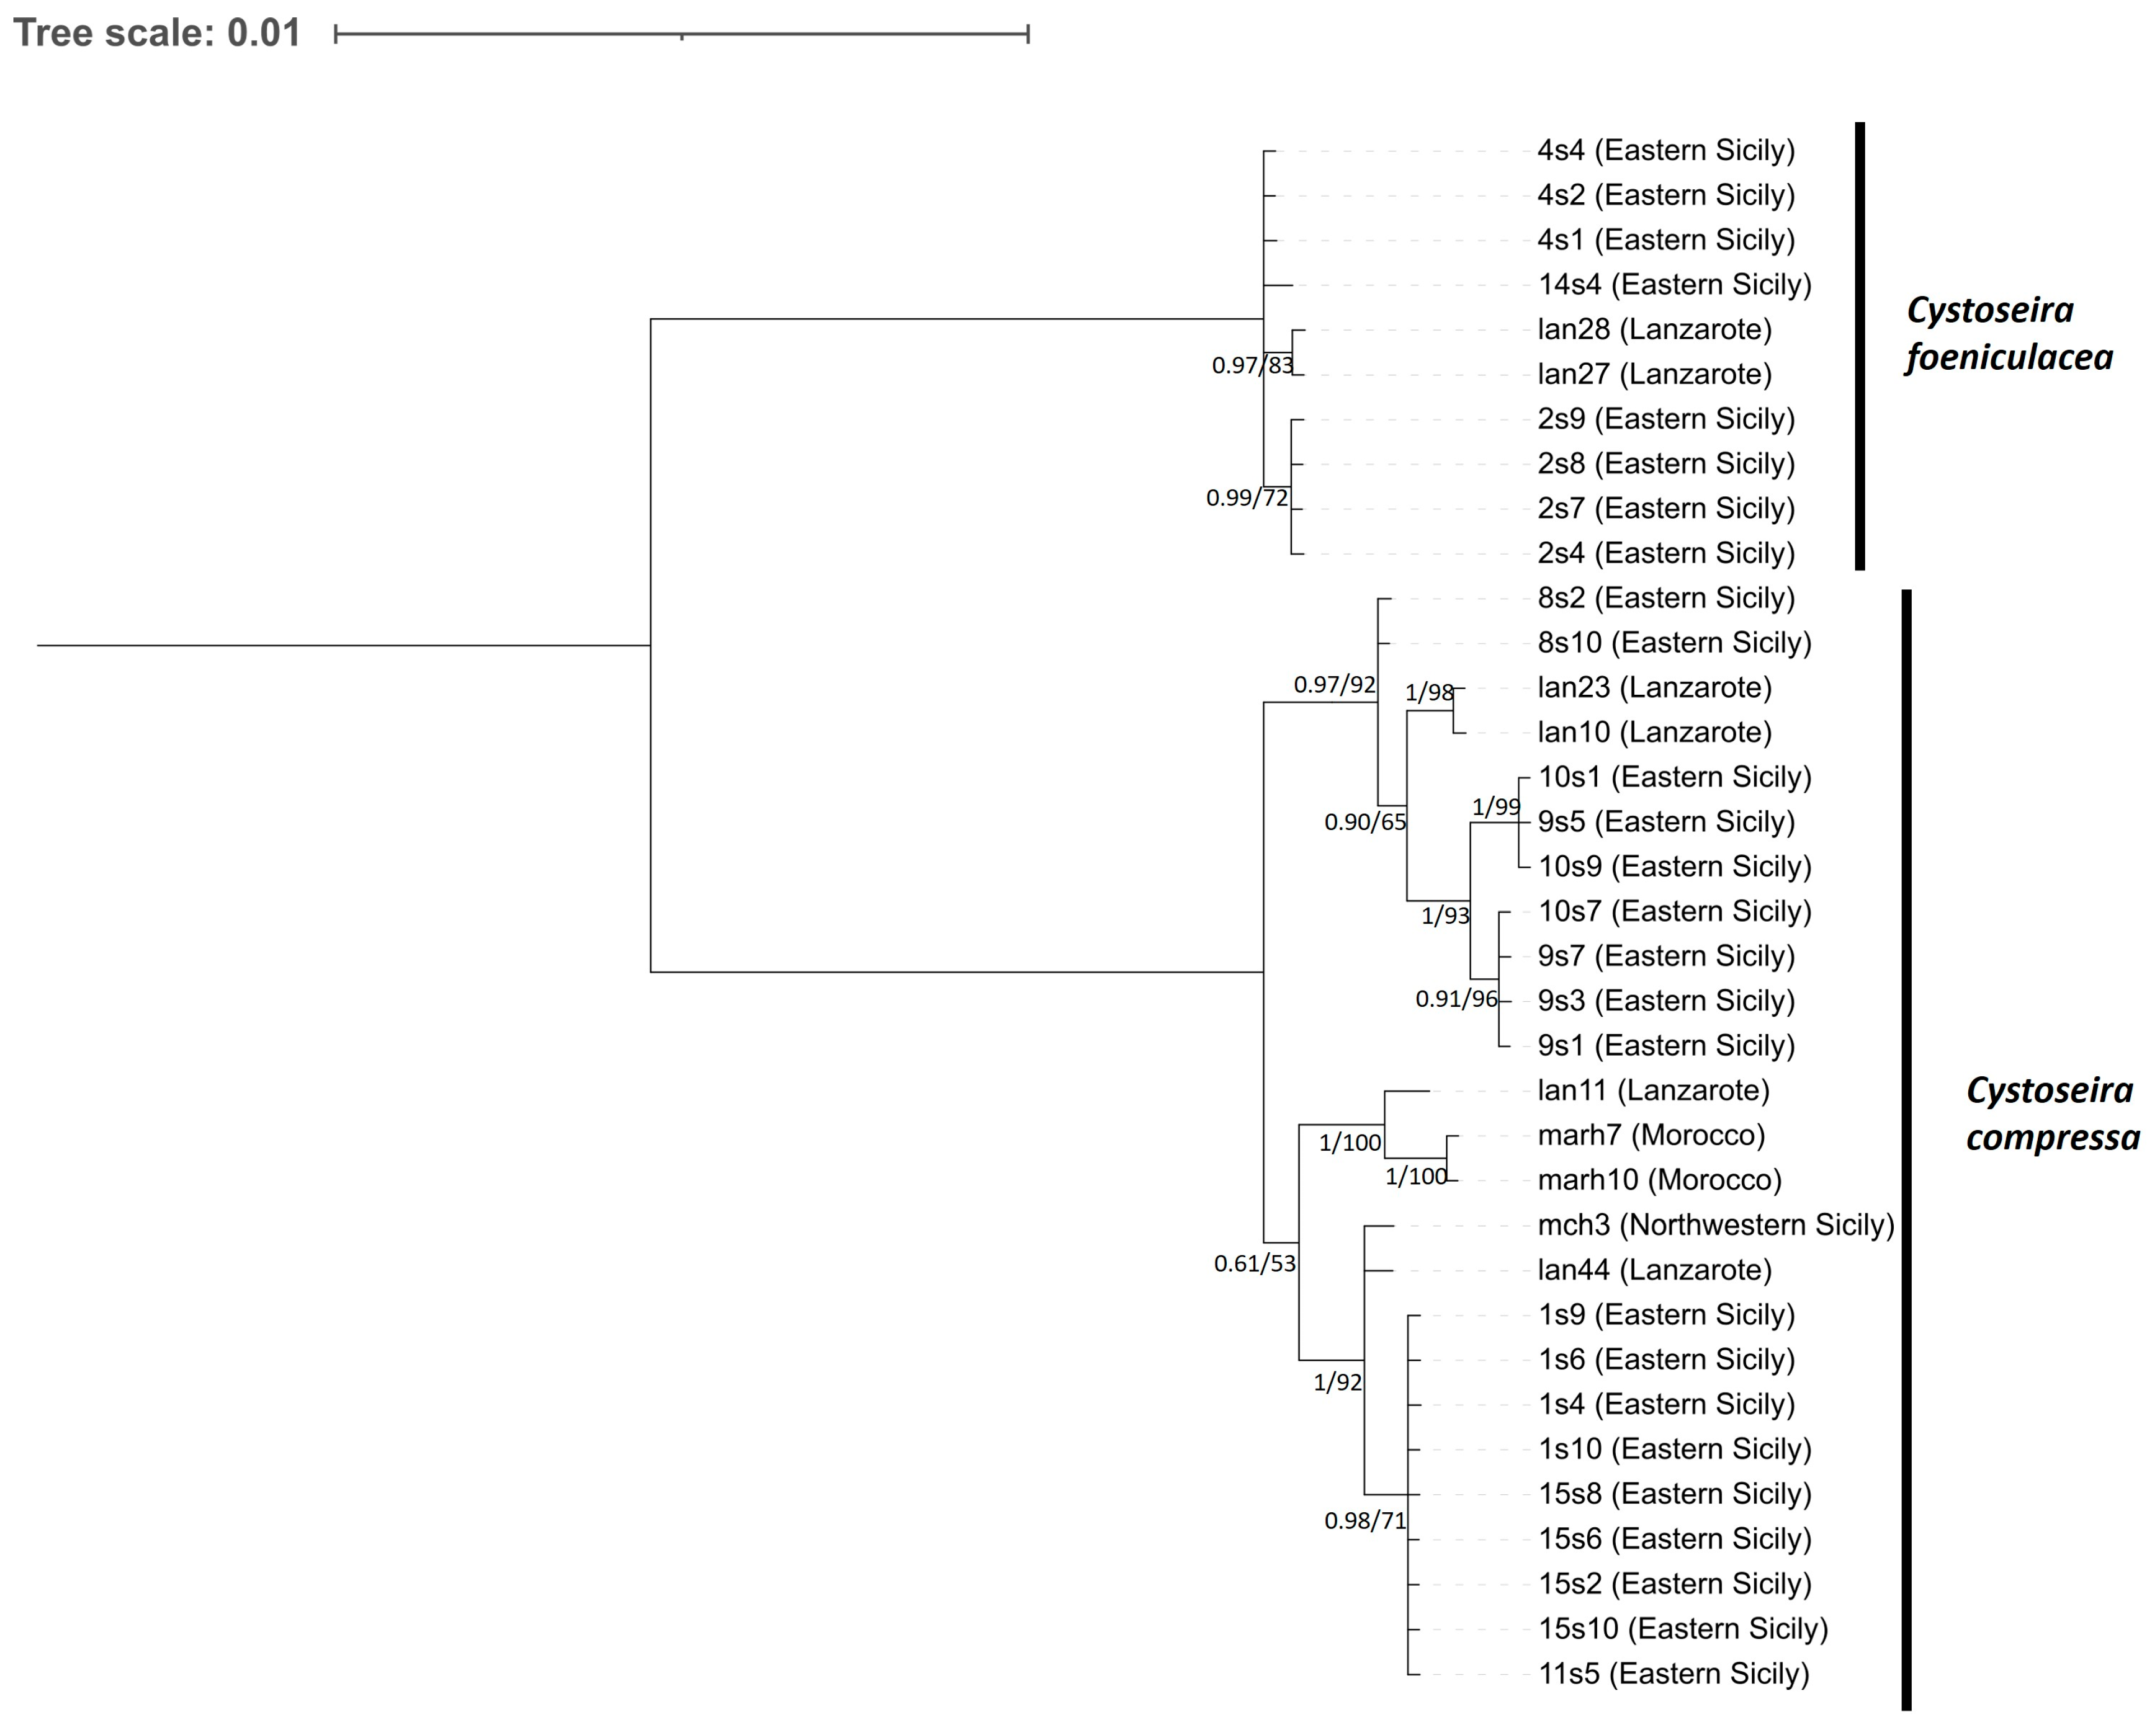
ML and BI analyses of the concatenated multilocus alignment based on the larger dataset of 79 specimens (each represented by at least two markers) failed to resolve internal relationships within the C. compressa complex, which appeared as an unresolved node in the Bayesian phylogeny (Figure S2). We attribute this result to the amount of missing data inherent in this larger dataset. By contrast, restricting the analysis to the 35 specimens with complete multilocus data (Figure 6, Table S1) produced a robust topology that closely mirrored the cox1 phylogeny (Figure 2).
Across all analyses, two strongly supported clades were consistently recovered, corresponding to C. foeniculacea and the C. compressa complex; within an integrative framework incorporating molecular, morphological, and ecological evidence (see Table S3), the latter is best interpreted as comprising the autonym plus two additional intraspecific lineages treated here at varietal rank (var. pustulata and C. morphotype canariensis).

3.4. Morphological Analyses and Ecological Observations

3.4.1. Cystoseira foeniculacea (Linnaeus) Greville

Specimens resolved by molecular data as C. foeniculacea corresponded morphologically to either the autonym C. foeniculacea f. foeniculacea, C. foeniculacea f. latiramosa (Ercegović) Gómez Garreta, Barceló, Ribera & Rull Lluch or C. foeniculacea f. tenuiramosa (Ercegović) Gómez Garreta, Barceló, Ribera & Rull Lluch. Despite their clearly distinct morphologies, no genetic differentiation was detected among specimens attributable to the three morphological forms; accordingly, they are collectively referred to as C. foeniculacea in the phylogenetic trees and haplotype networks presented herein.
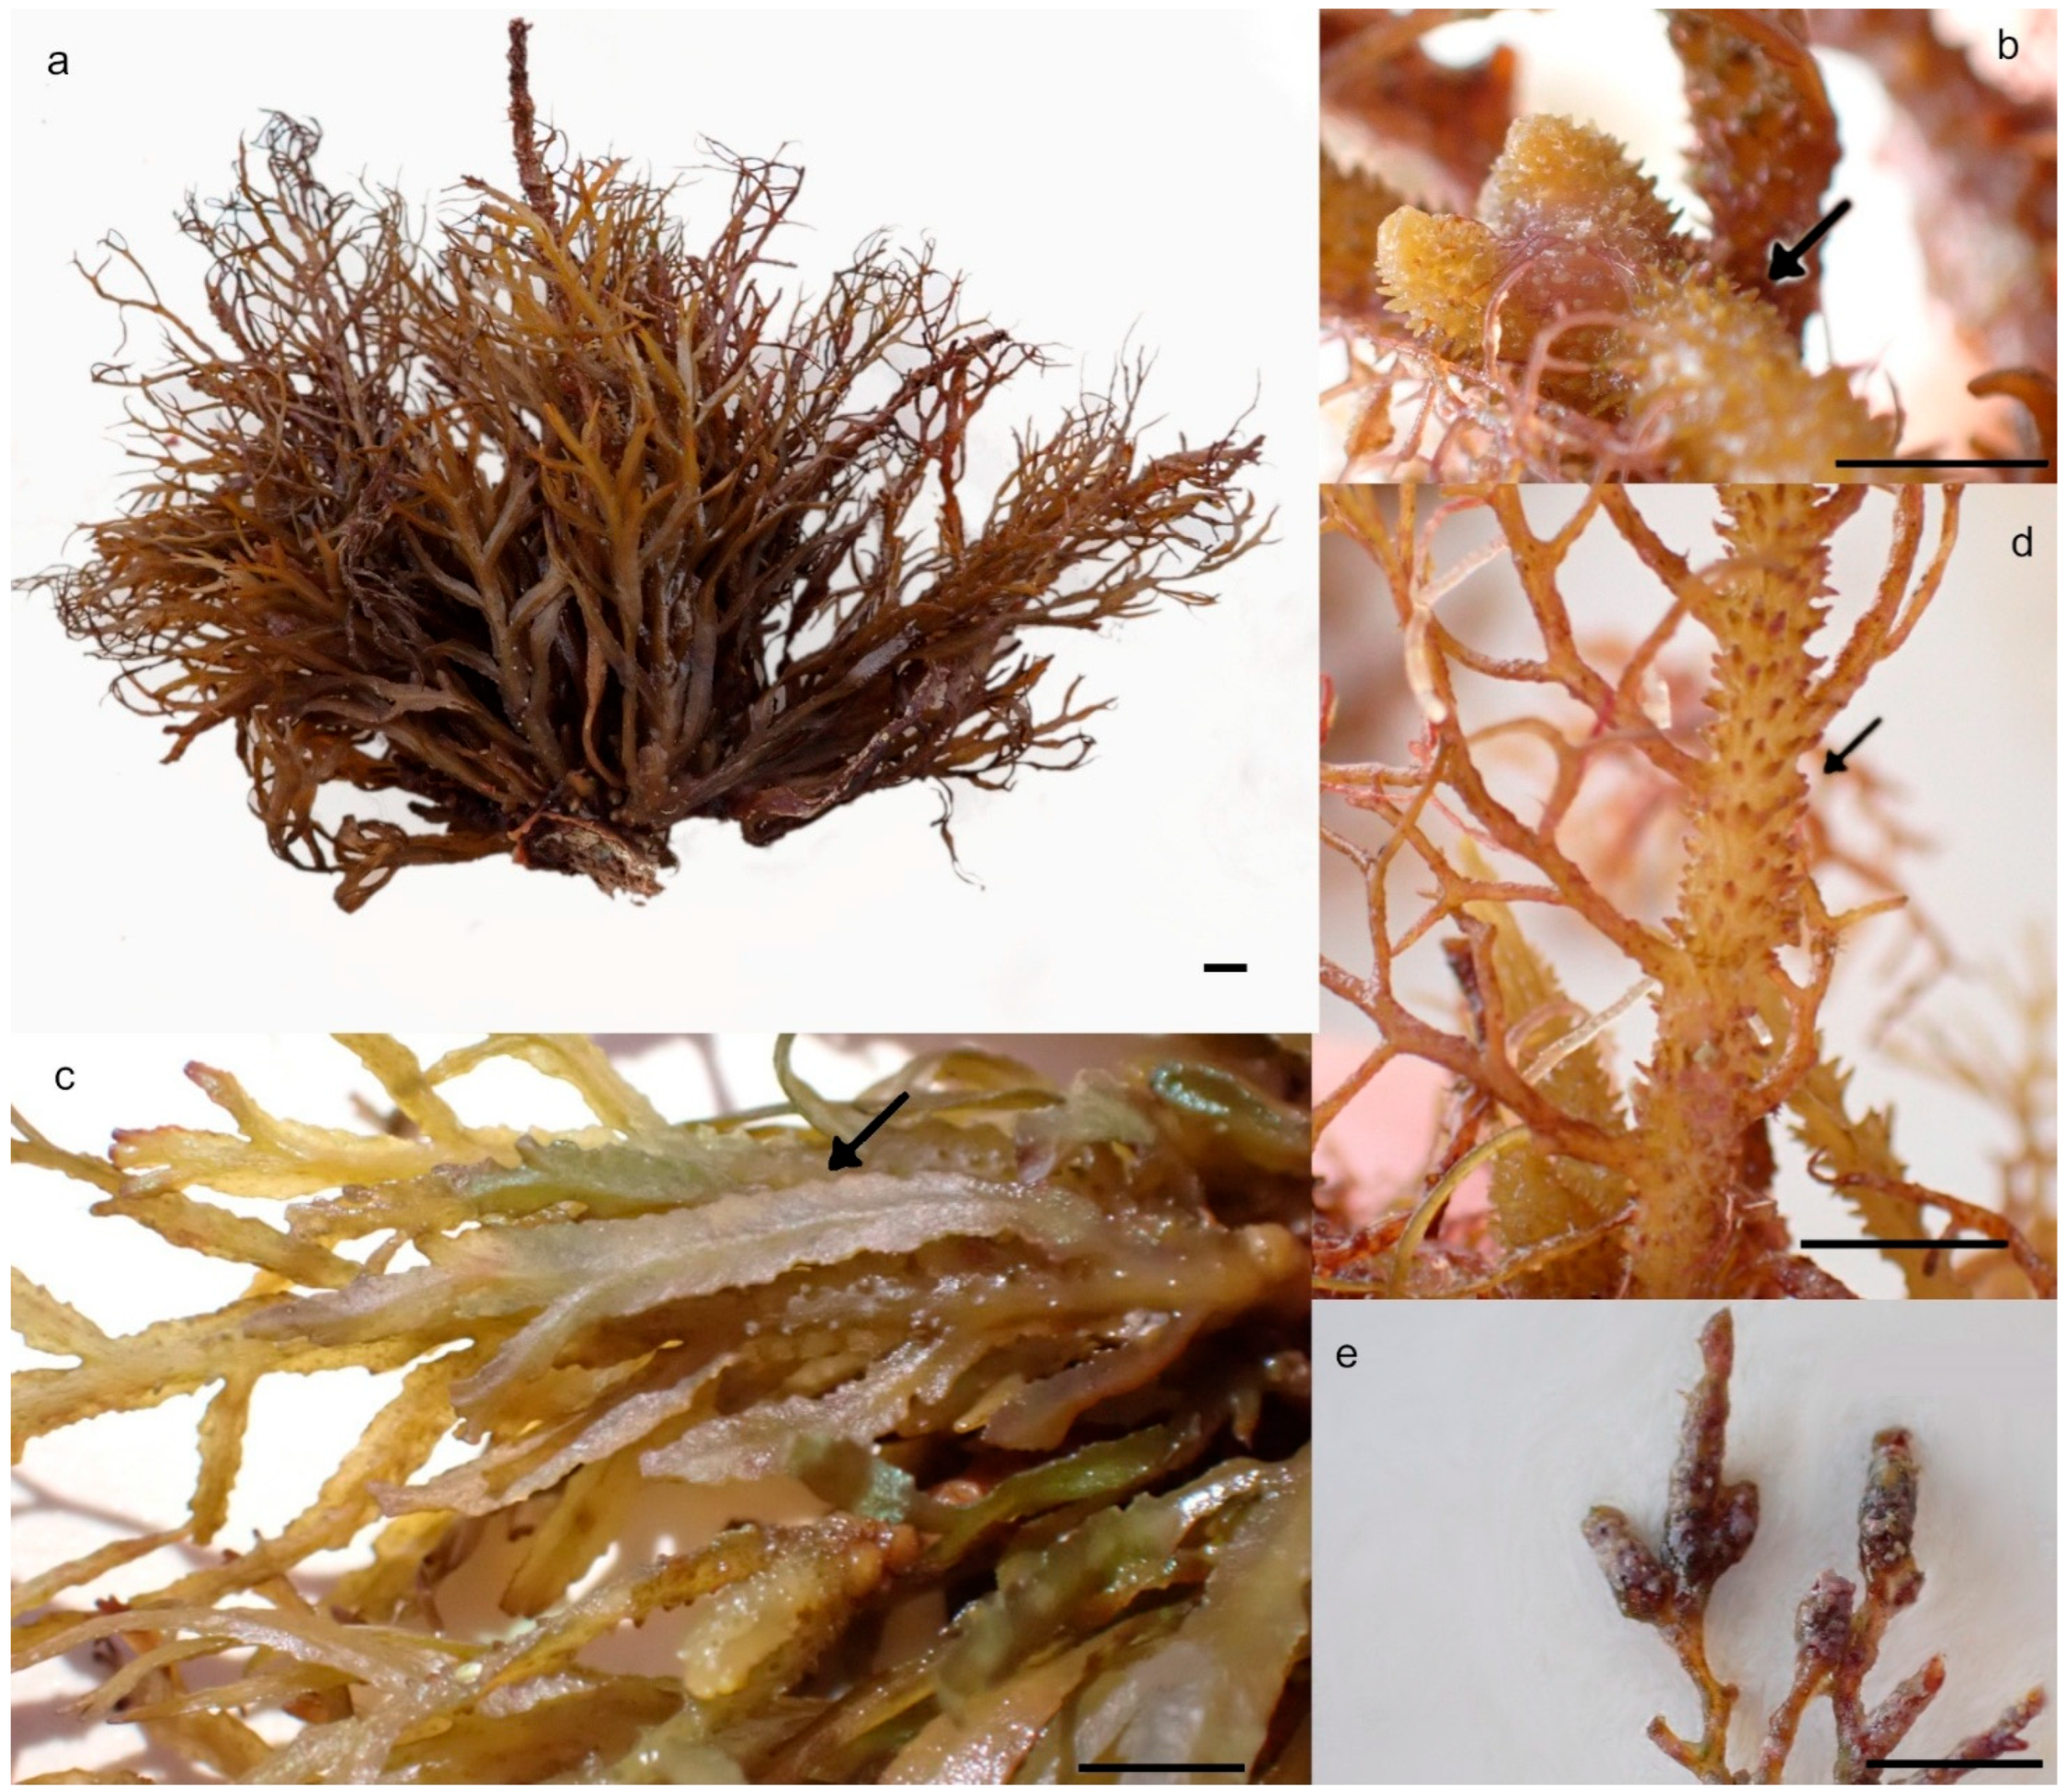
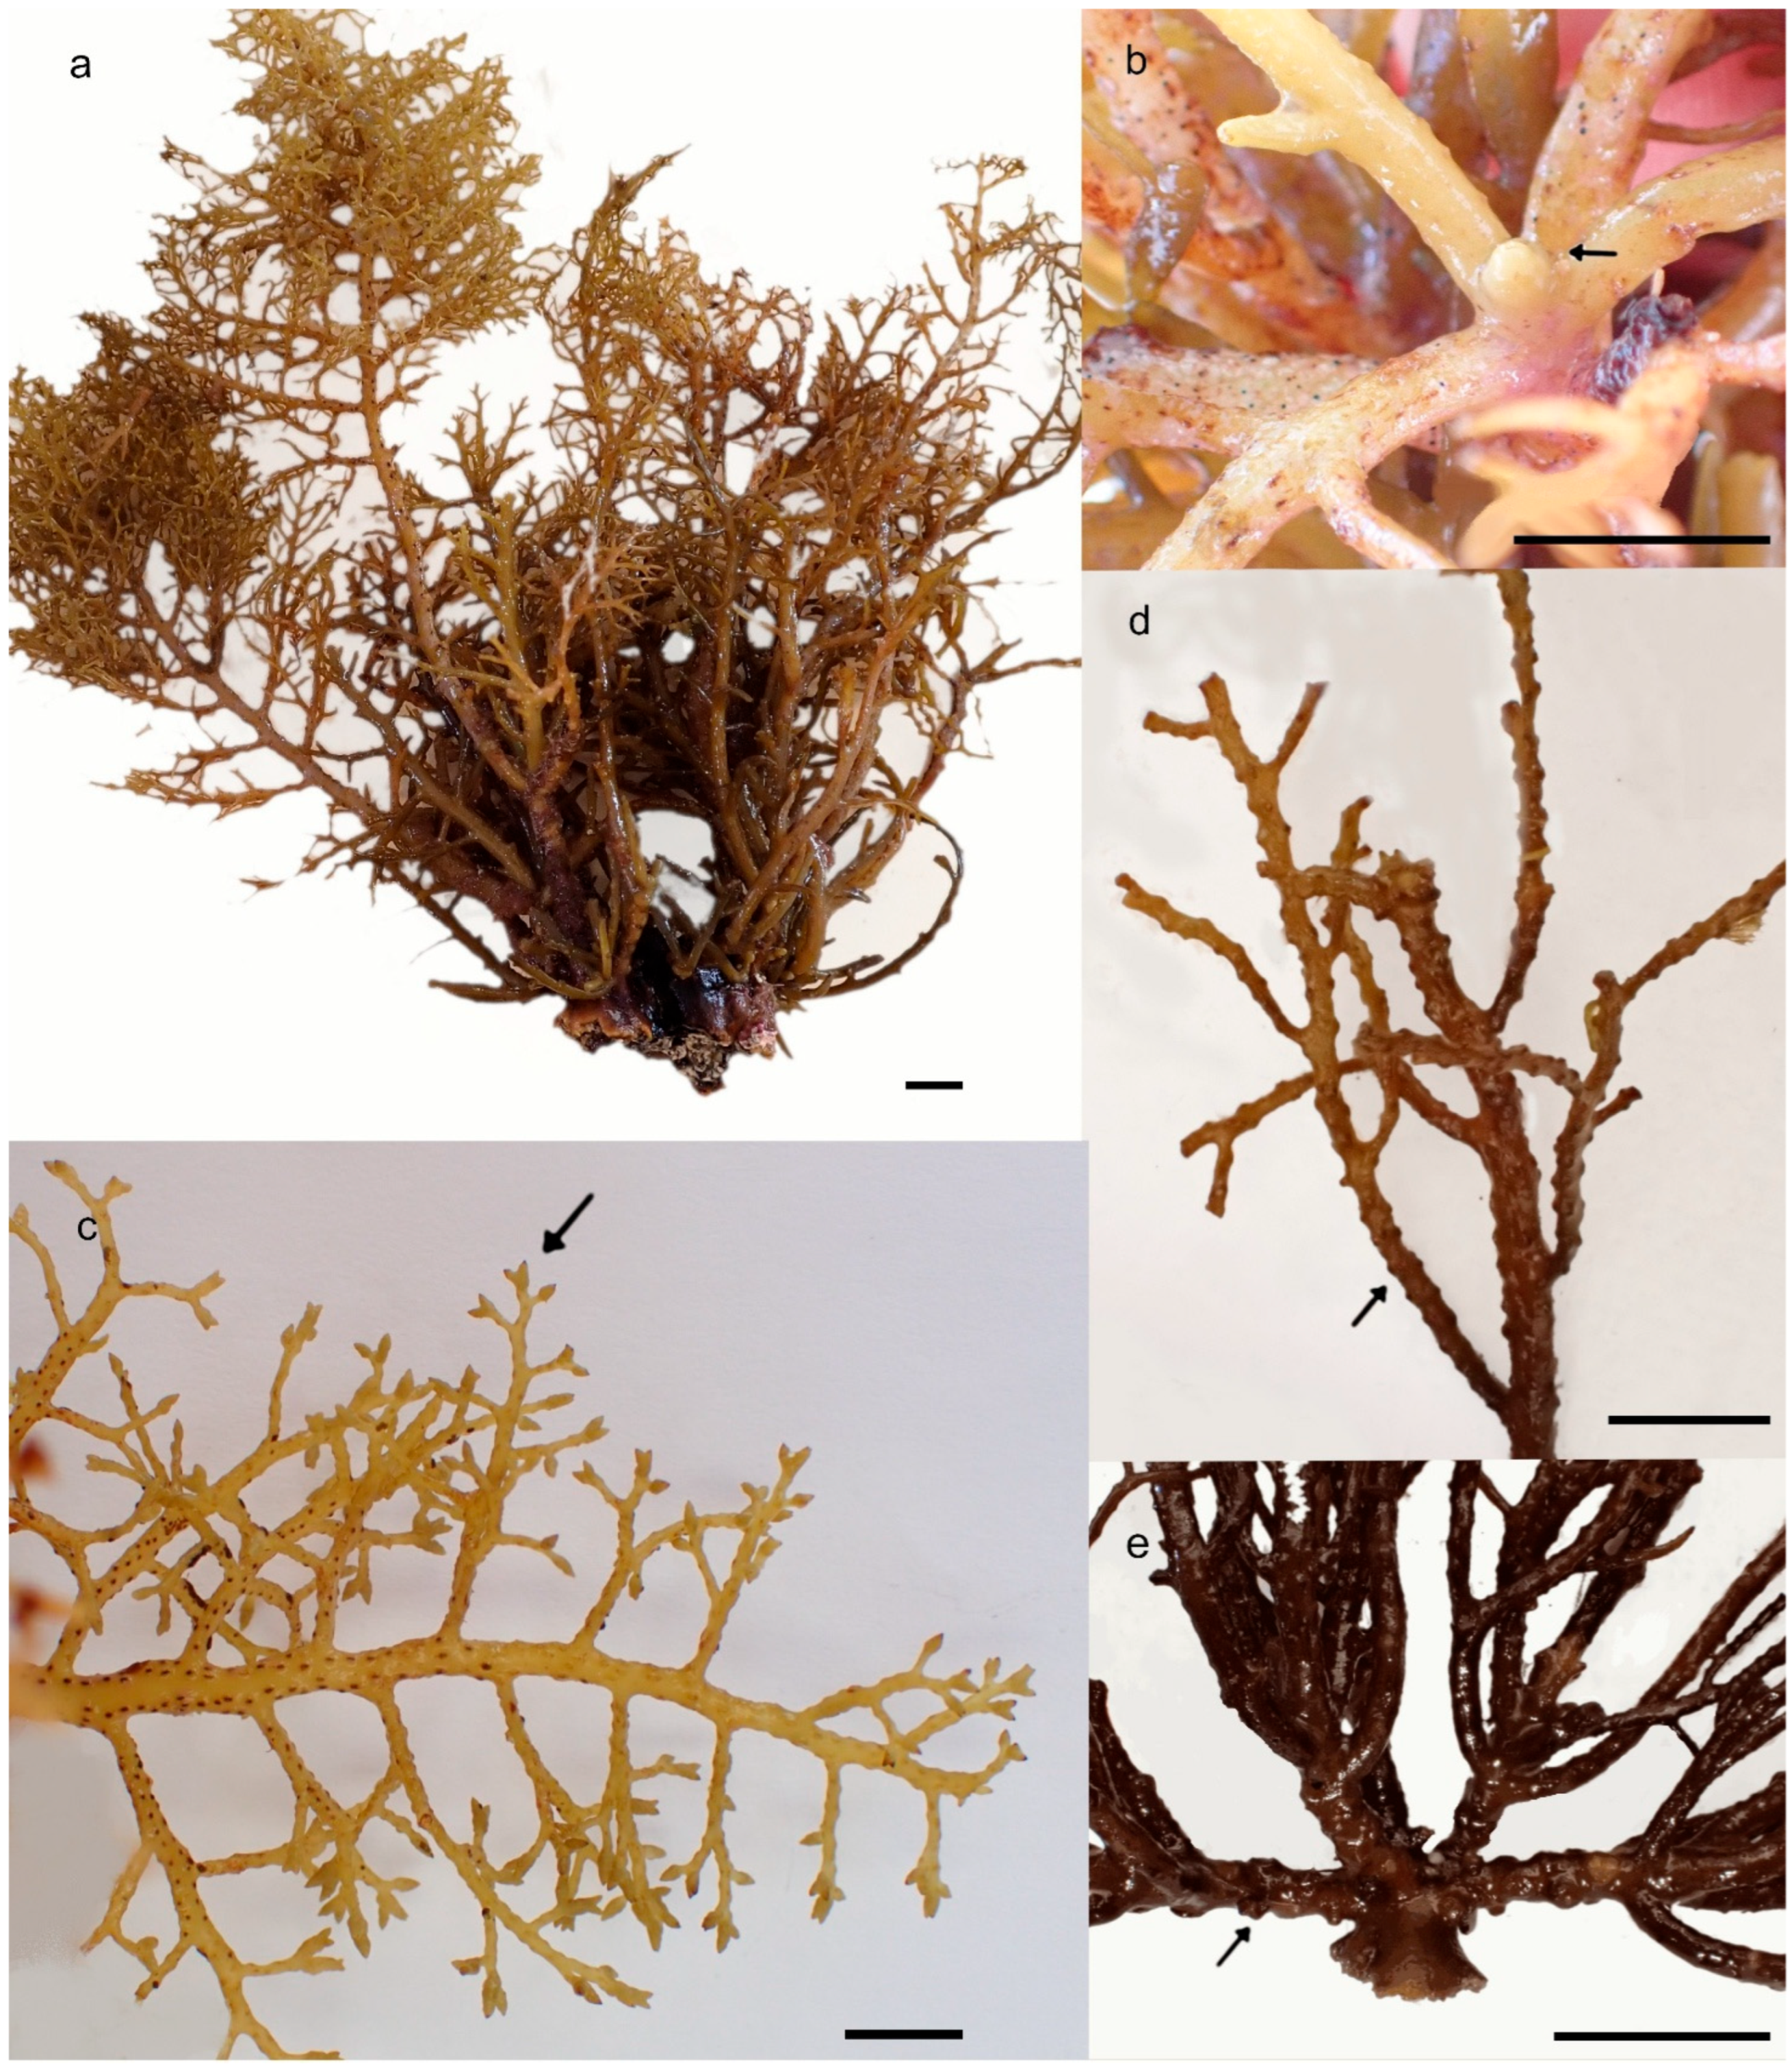
Thalli of C. foeniculacea f. foeniculacea have a conical to discoid holdfast, from which cylindrical cauloids arise (Figure 7a). Apices are slightly protruding and bear small thorns (Figure 7b). Some primary branches are compressed, with crenate to denticulate margins and a conspicuous median rib (Figure 7c). The most distinctive feature of this form, the roughened surface of the primary axes due to numerous thorns, was consistently observed (Figure 7d). Receptacles are elongate, cylindrical, simple or occasionally forked, occurring either solitary or in compact clusters (Figure 7e).
Thalli assignable to C. foeniculacea f. latiramosa exhibit compressed primary and secondary branches with conspicuously toothed margins and a distinct median rib, whereas C. foeniculacea f. tenuiramosa is characterised by cylindrical cauloids and primary branches, with higher-order axes filiform and delicate.
No specimens referable to Cystoseira foeniculacea f. schiffneri (Hamel) Gómez Garreta, Barceló, Ribera & Rull Lluch, reinstated at species rank as C. schiffneri Hamel by Bouafif et al. [38] (p. 144), were detected in our samples. Both its taxonomic reinstatement and its classical record from the Stagnone di Marsala, Sicily (reported in Giaccone et al. [60] as C. ercegovicii Giaccone nom. inval.) are currently based exclusively on morphological evidence in the absence of molecular data. Targeted resampling and sequencing at type localities will be required to resolve its taxonomic status and geographic distribution.

3.4.2. Cystoseira Compressa Complex

DNA-based assignments placed specimens within the C. compressa complex whose morphologies corresponded to the traditional diagnoses of C. compressa, C. pustulata, and C. canariensis (traditionally treated as a synonym of C. humilis, but see above), as well as several intermediate morphotypes. In some cases, diagnostic traits traditionally used to distinguish C. canariensis (=C. humilis?) from C. pustulata, or C. compressa from C. pustulata, were weakly expressed, overlapping or combined in intermediate ways, making unambiguous assignment based on morphology alone difficult. The morphological accounts provided below (see also Table S3) should therefore be regarded as representing the typical expressions of each variety rather than discrete, non-overlapping character sets. Although the three entities show recurrent and recognisable morpho-ecological patterns, considerable phenotypic variability occurs both within and among populations, and intermediate morphologies frequently encountered. This partial morphological overlap, together with the shallow genetic divergence detected among entities, supports their interpretation as varieties rather than distinct species.

3.4.3. C. compressa Var. compressa

Thalli assigned to the autonym exhibited the diagnostic characters of the basionym Fucus compressus Esper, later transferred to the genus Cystoseira by Gerloff and Nizamuddin [61] (p. 342) as C. compressa.
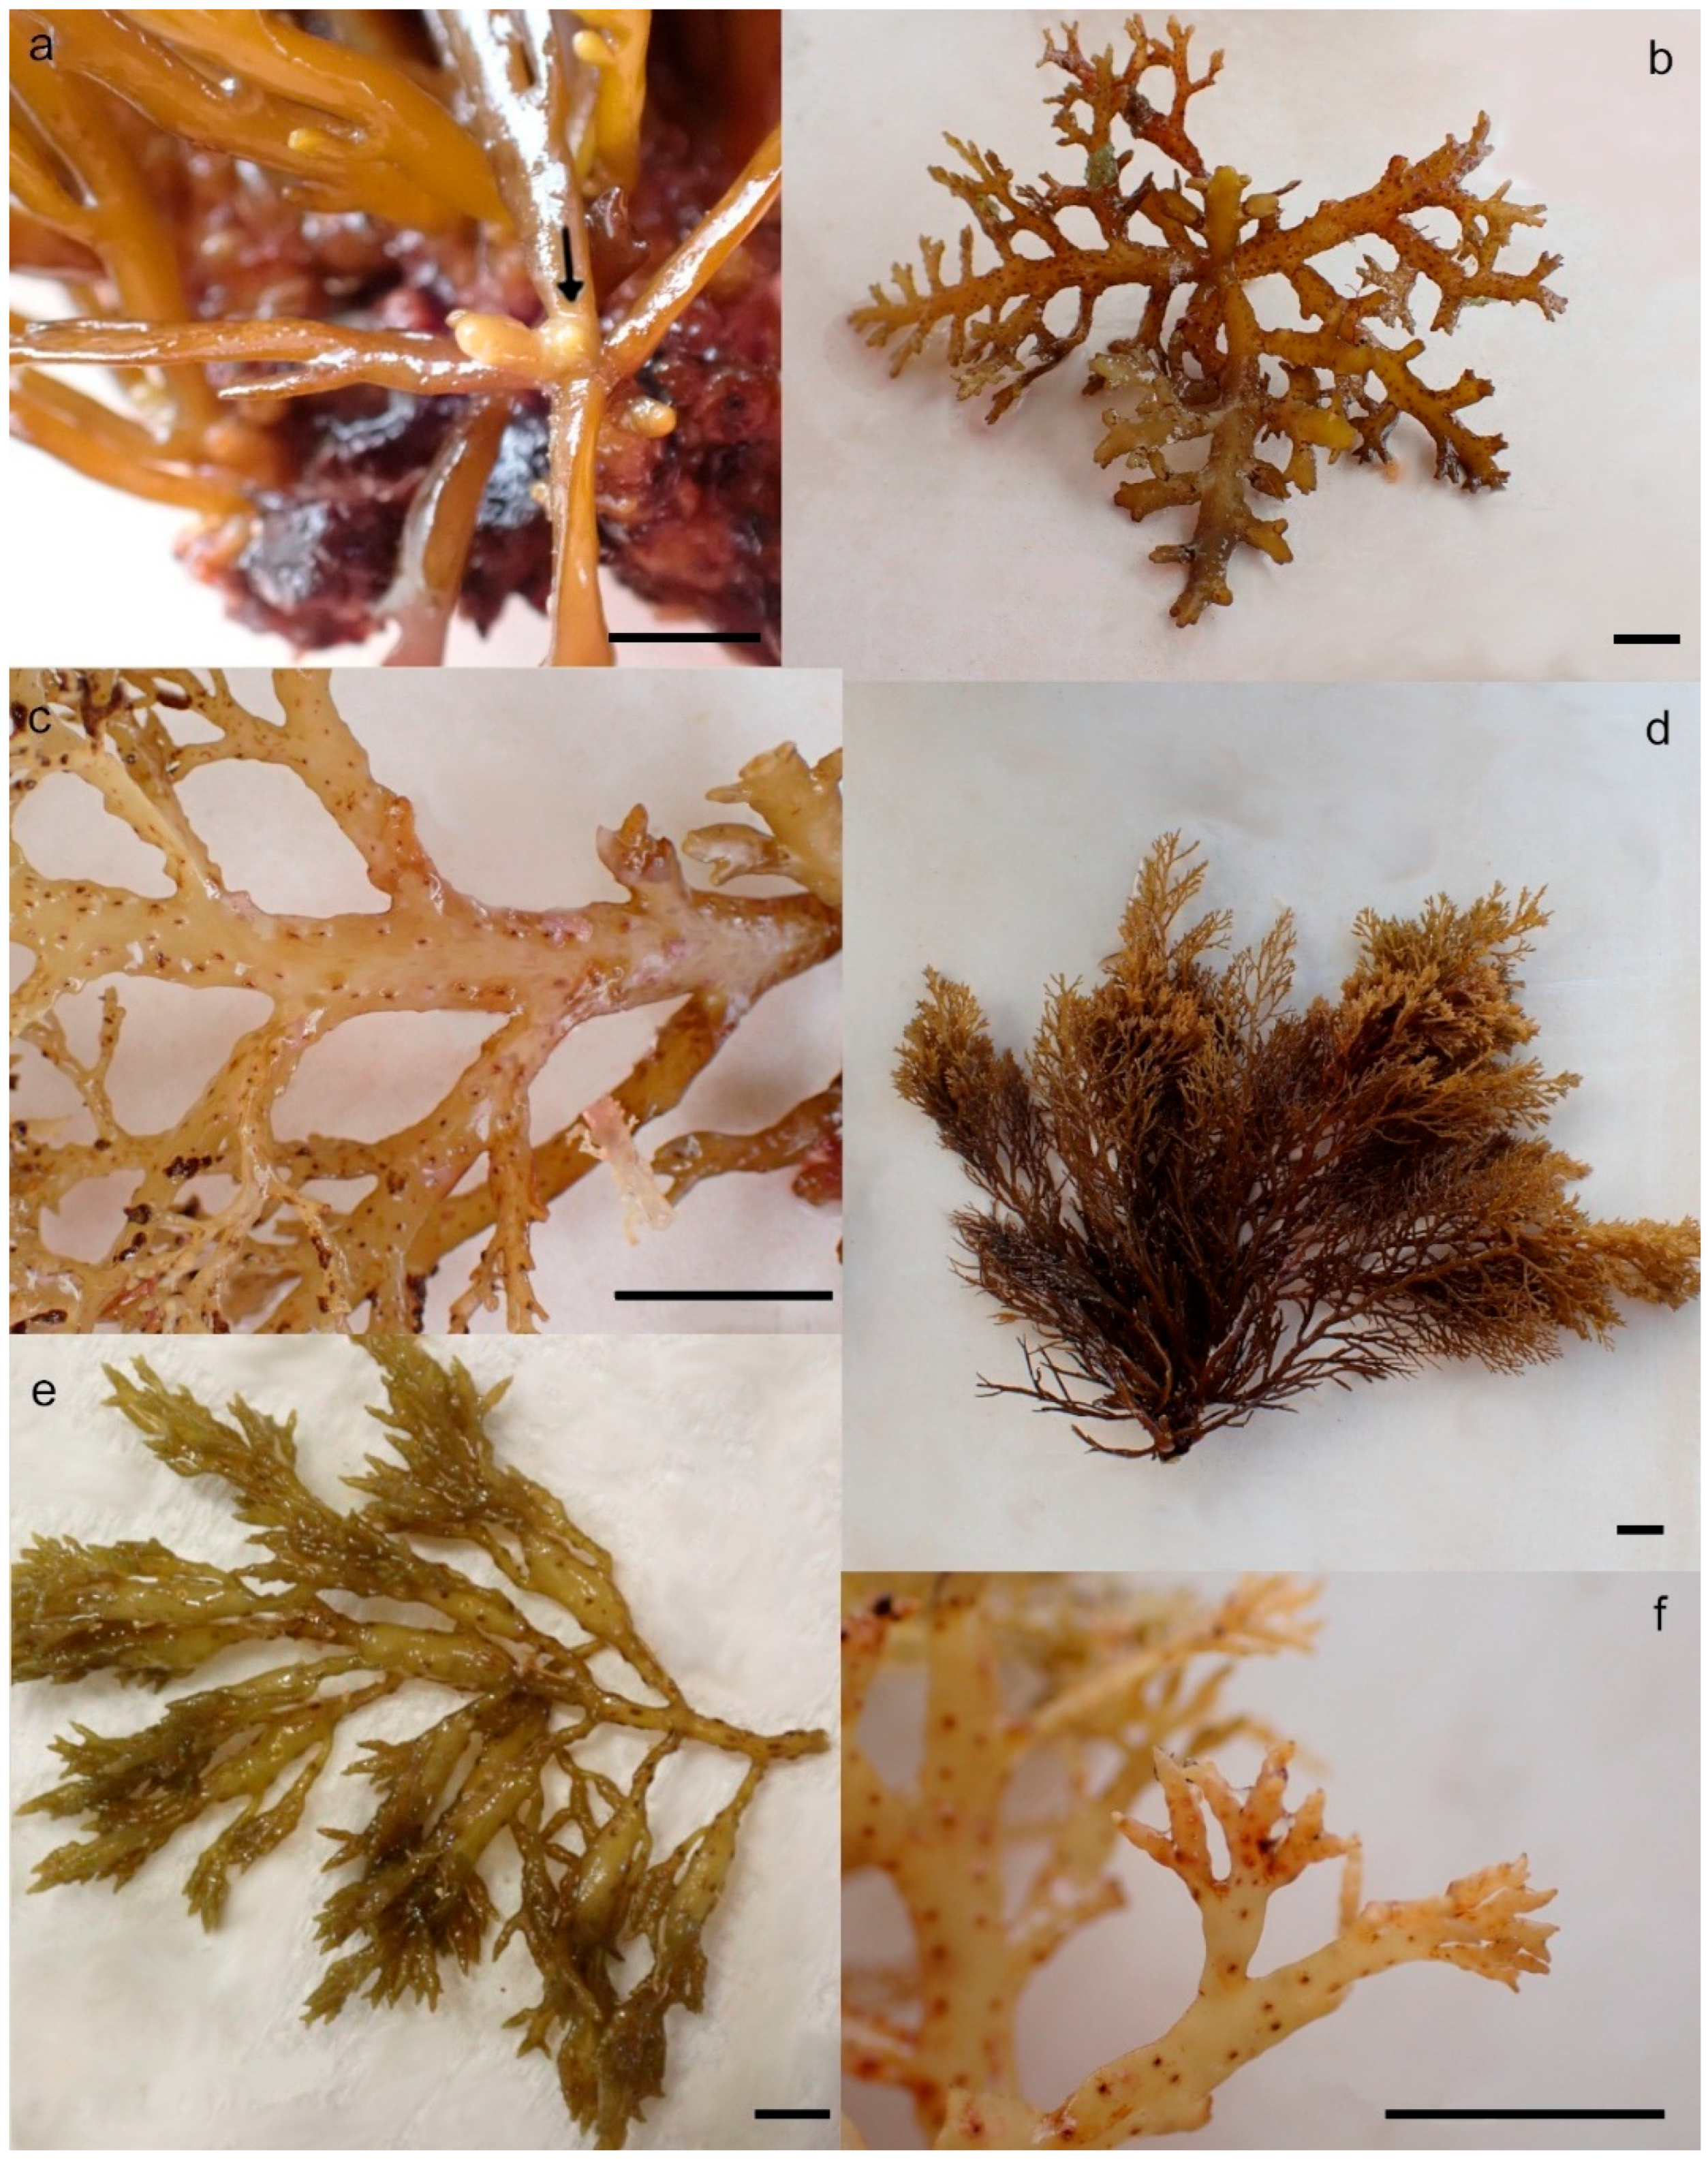
Thalli are caespitose, attached by a relatively small, compact, discoid holdfast; cauloids are short (1–3 cm), cylindrical or slightly flattened, with smooth and prominent apices (Figure 8a), often ramified near the base. Fronds are yellowish- to dark-brown, non-iridescent. Frond morphology follows a marked seasonal trajectory [35,62], consistently observed in both Mediterranean and Atlantic specimens. During winter, thalli are reduced, forming short, flattened, distichously branched primary axes arranged in a rosette-like habit (Figure 8b) with smooth margins and rounded apices; a distinct midrib is visible in both primary and secondary axes, and cryptostomata are arranged in two parallel rows from base to apex (Figure 8c). In spring–summer, thalli become erect, well-developed and highly ramified, particularly in the apical region (Figure 8d). Primary axes, flattened at the base and cylindrical distally, elongate to 20–40 cm, reaching up to 1 m in highly sheltered sites. Secondary and higher-order branches are slender (1.5–2 mm), cylindrical, simple or sparsely branched, frequently bifid, and arranged alternately and distichously. Cryptostomata are abundant, regularly distributed around the circumference, not, or only slightly, protruding, and already visible on primary axes. Aerocysts are usually present (Figure 8e), numerous, and variable in size, ranging from small (3–6 × 1–2 mm) to large (8–10 mm), mostly subterminal and isolated or arranged in series of two to three. Receptacles are terminal, compact, fusiform to lanceolate-fusiform (1–10 × 0.5–1 mm), simple or bi- to trifurcate (Figure 8f), and occasionally briefly pedicellate on aerocysts.
Thalli typically inhabit the upper infralittoral zone (0–5 m), occurring in both exposed and sheltered areas (including bay-heads), and are also found in intertidal rock pools. Exposure to wave action strongly influences thallus size, with plants remaining small in wave-exposed sites but growing large (50–60 cm) in sheltered localities.

3.4.4. C. compressa Var. pustulata Comb. Nov.

Thalli morphologically examined and molecularly assigned to C. compressa var. pustulata are characterised by a more slender and delicate habit than C. compressa var. compressa, with cylindrical branching, and closely match the description of C. abrotanifolia (Linnaeus) C. Agardh subsp. pustulata Ercegović [39]. Plants form erect fronds, usually 10–30 cm high, yellowish to light brown, and never iridescent. A small, compact, discoid holdfast gives rise to short cauloids (1–3 cm) bearing smooth, slightly protruding apices (Figure 9a,b). In some specimens, basal protuberances corresponding to scars left by shed deciduous branches are evident (Figure 9e). Primary branches are mostly cylindrical or slightly compressed at the base (2–2.5 mm wide) and often begin branching in their lower half. Secondary and higher-order branches are slender (1.5–2 mm), cylindrical, simple or sparsely branched, and may occasionally be arranged distichously. Cryptostomata are abundant (Figure 9d), conspicuous, and evenly distributed around the circumference of all axes, already evident on primaries; they are never pedicellate. Aerocysts are usually absent, or, when present, very small (2–3 mm). Receptacles are terminal, compact, fusiform (1–2 × 0.5 mm), simple or rarely bifurcate (Figure 9c). In contrast to var. compressa, no pronounced seasonal phenological variation was observed. During autumn-winter, fronds remain cylindrical, short and weakly developed, never forming the rosette-like habit, whereas vigorous growth occurs in spring-summer, in agreement with the original observations of Ercegović [39]. This variety inhabits shallow infralittoral rocky substrates (0.5–5 m) and tide pools; in the Mediterranean, it generally occurs deeper than var. compressa, sometimes reaching 20–30 m.

3.4.5. Cystoseira Morphotype canariensis

All specimens molecularly assigned to C. morphotype canariensis correspond morphologically to C. canariensis as described by Sauvageau [40] (p. 468).
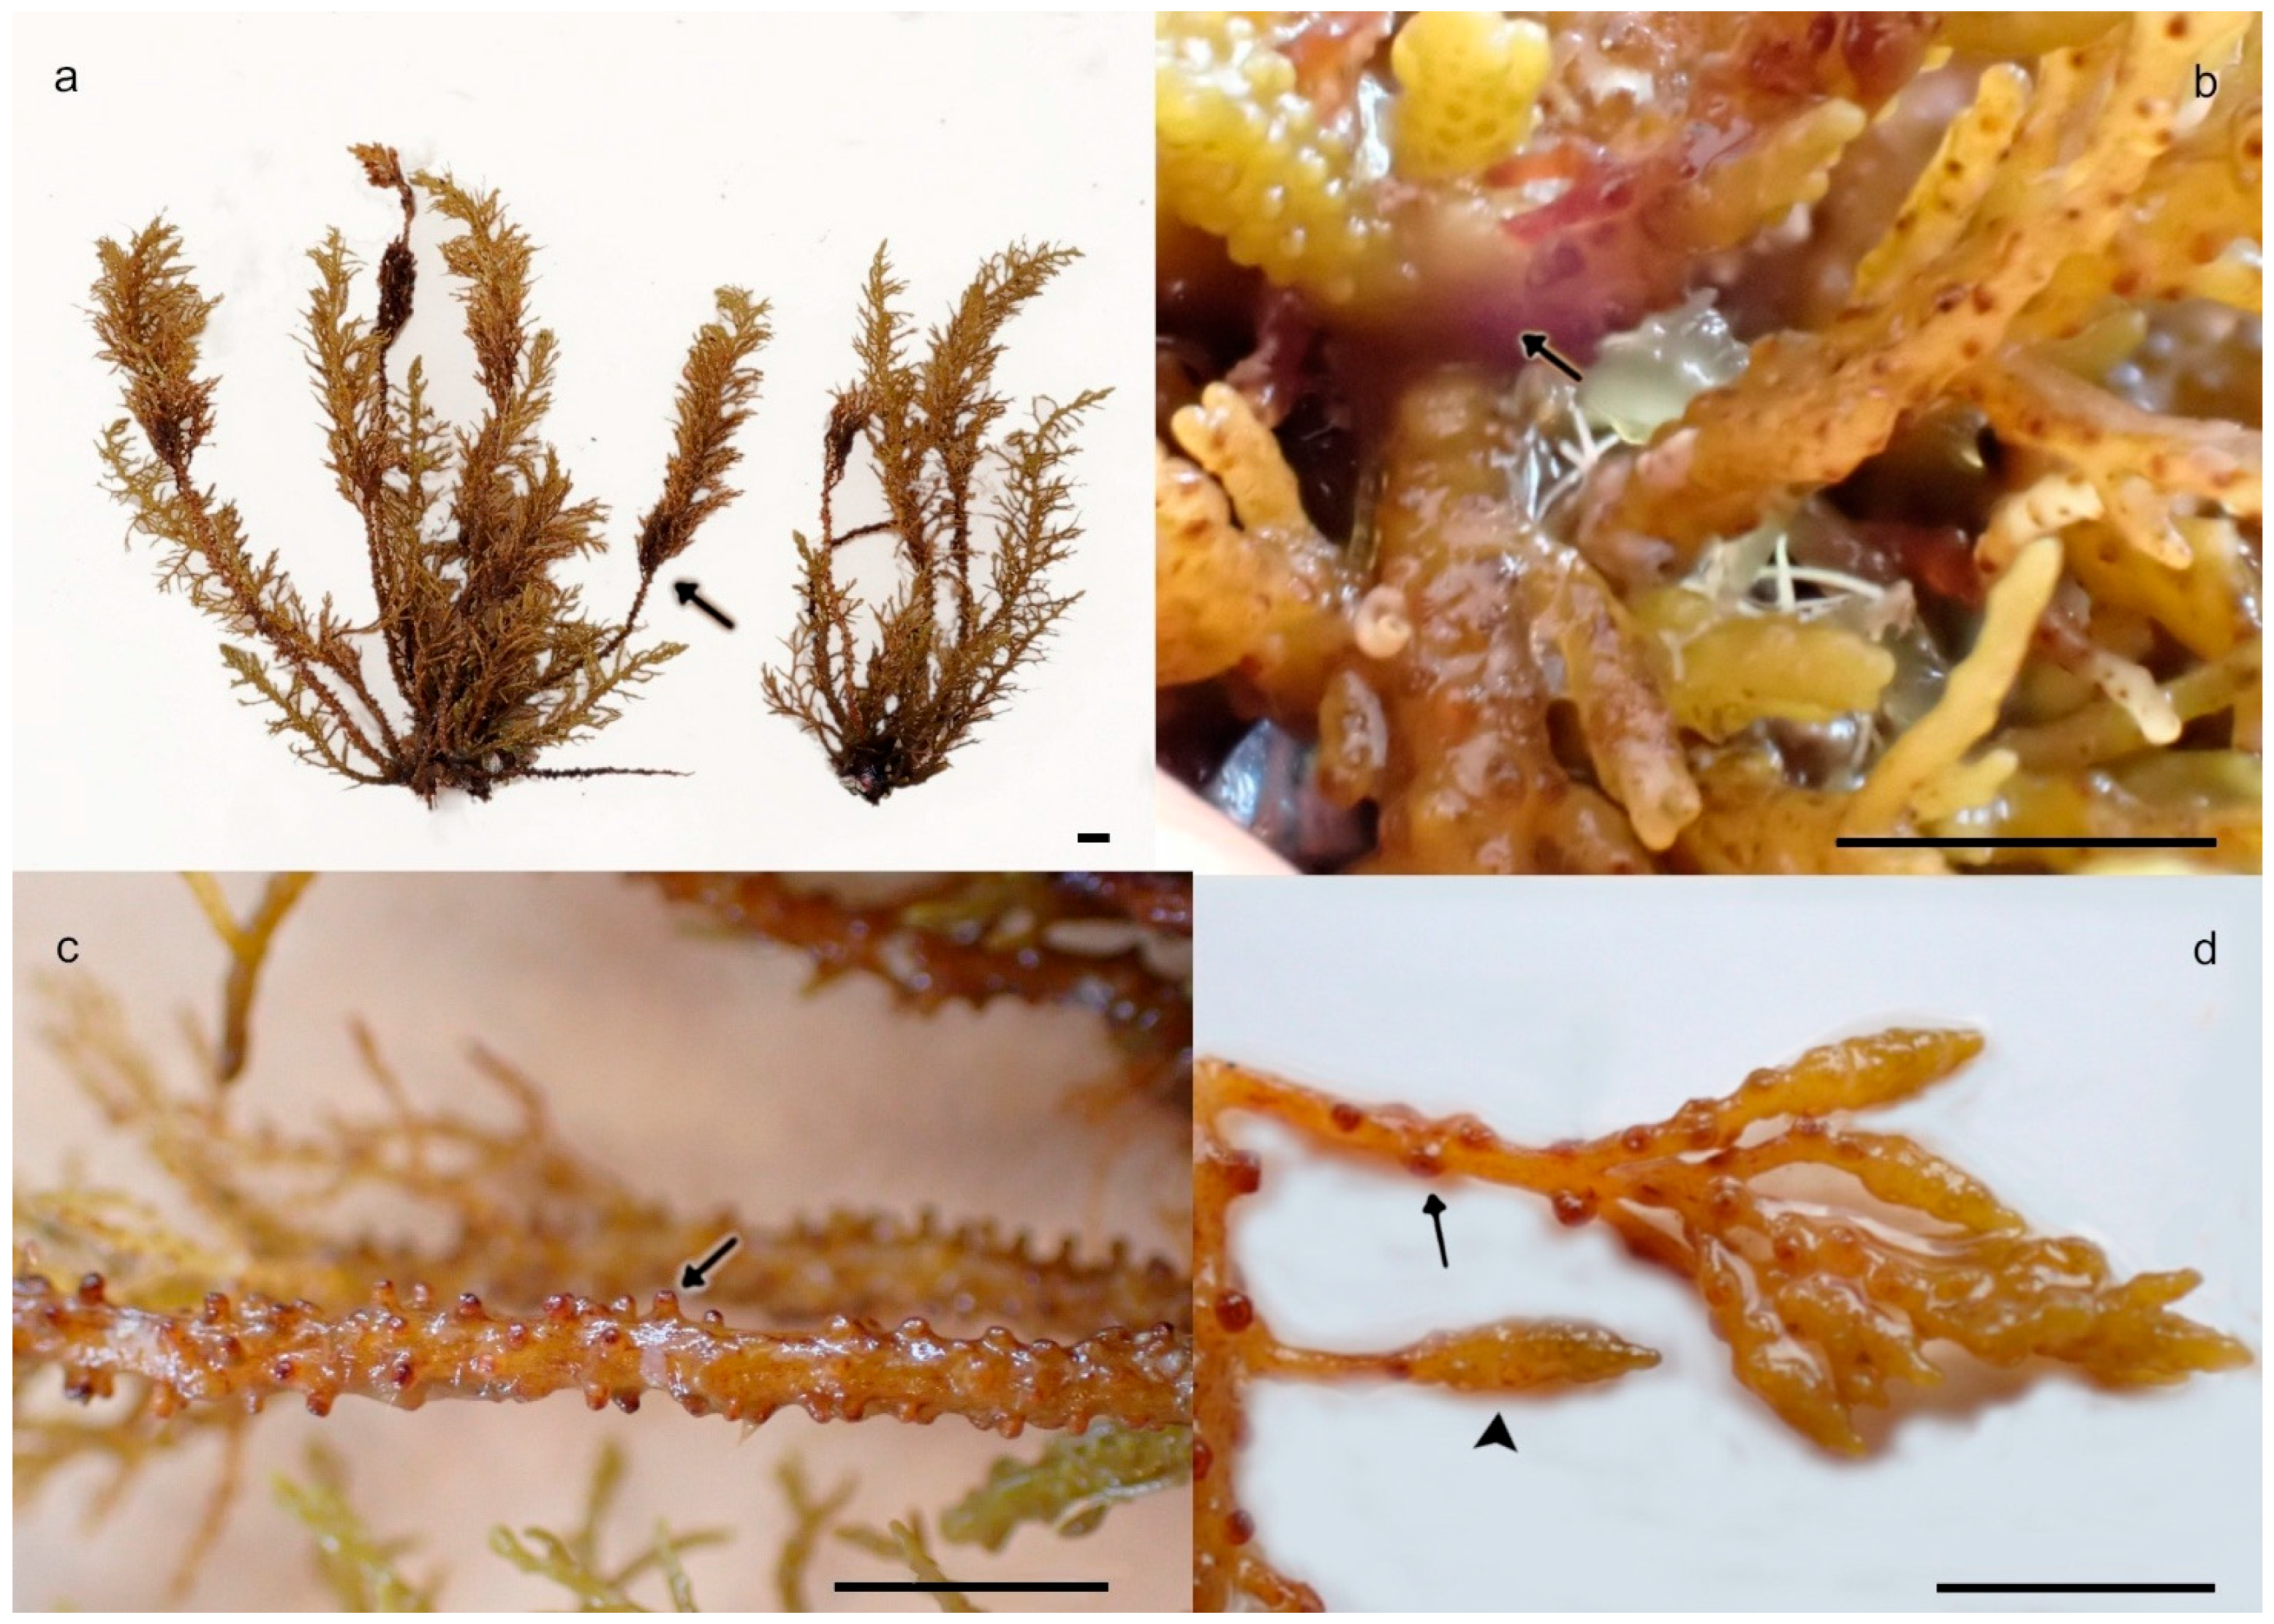
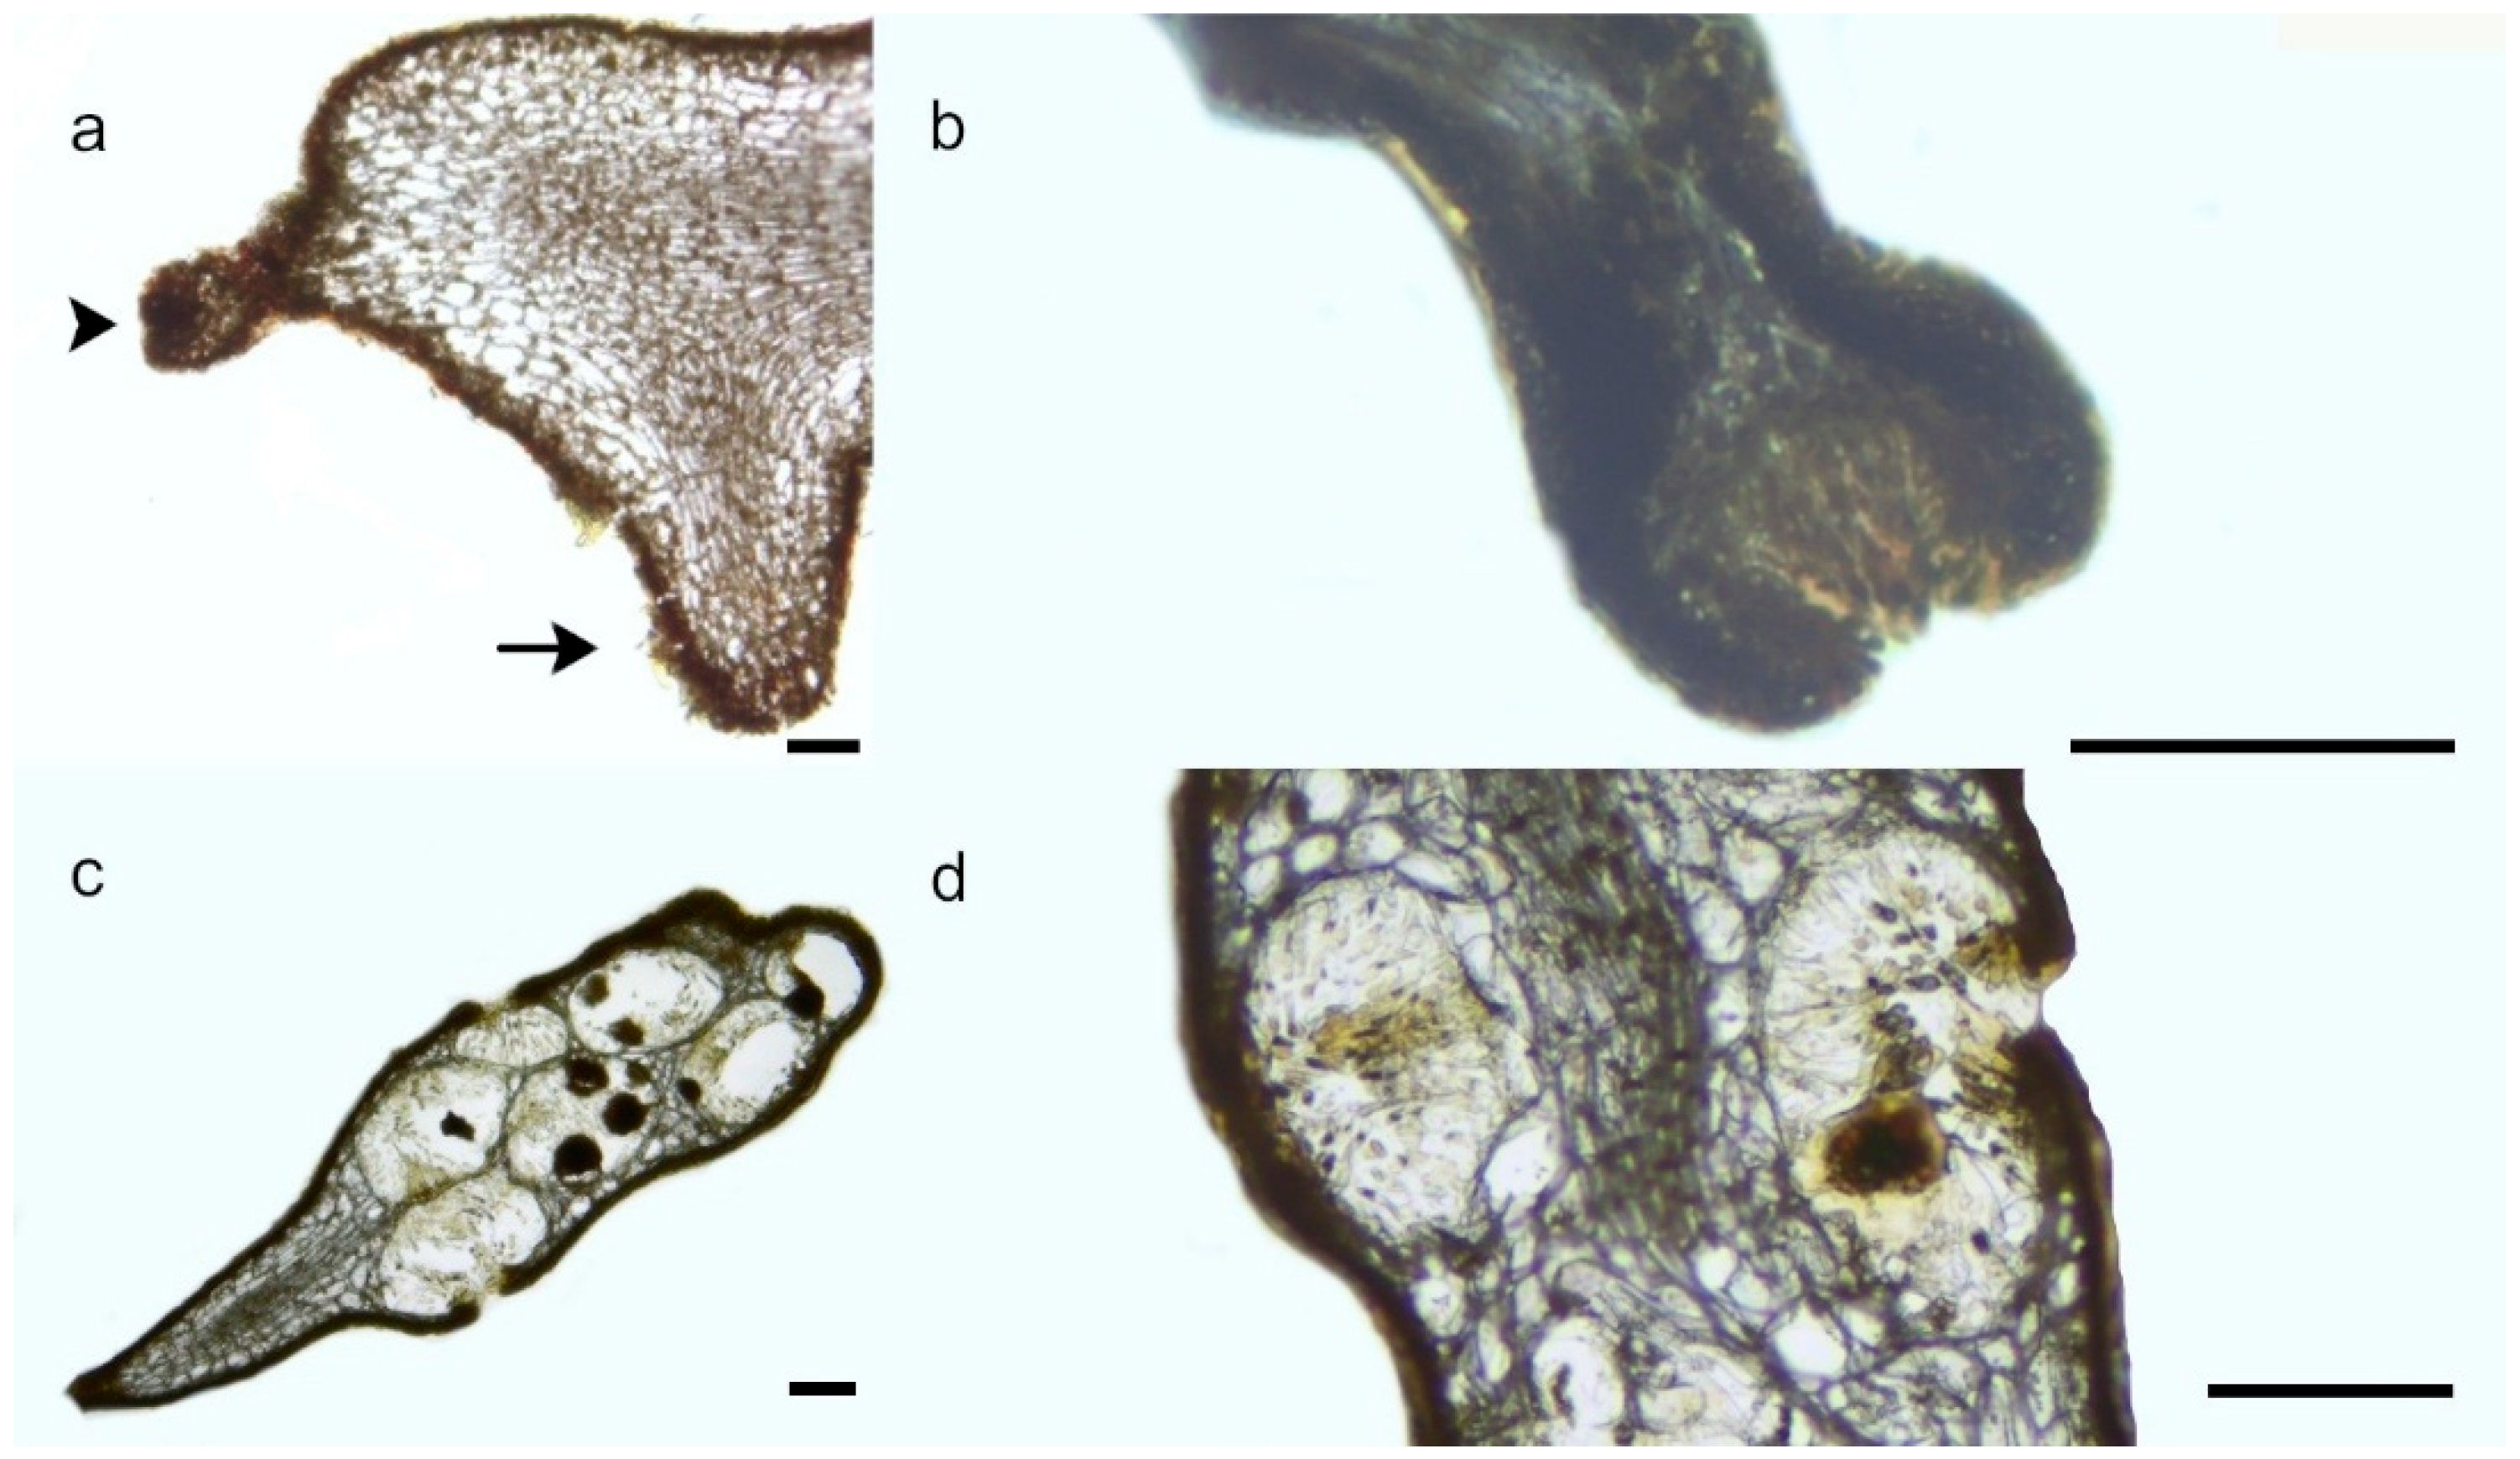
Thalli form turfs, are never iridescent and completely lack aerocysts (Figure 10a). They are attached by a compact discoid holdfast, from which several short, stout, erect cauloids (1–3 cm long) arise with smooth, slightly protruding apices (Figure 10b). Fallen branches leave prominent circular scars that do not give rise to adventitious shoots. Two to five erect primary branches (10–25 cm long) develop, strictly cylindrical and never flattened, (even at juvenile stages), progressively attenuating towards the apices; basal portions become rapidly denuded during growth. Primary branches bear numerous cylindrical crypt-bearing pedicels (0.4–0.6 mm long), a diagnostic feature of this entity (Figure 10c and Figure 11a,b). These pedicels, abruptly truncated and terminating in a single piliferous crypt, represent the most distinctive morphological trait separating this entity from the other varieties within the complex. Secondary branches bear abundant crypts with markedly protruding ostioles, imparting a distinctly nodose surface (Figure 10d). First-order laterals are slender, short, and simple, whereas second-order branches reach 2–4 cm, are frequently branched once or twice, and gradually decrease in size distally. Tertiary laterals are delicate, often curved, and terminate in short pedicels. Laterals are inserted irregularly, although tertiary axes tend to be arranged in two opposite rows. Fertility is restricted to the terminal portions of the primary branches; secondary branchlets in these distal zones bear receptacles of variable size and form, simple or sparingly branched, slightly tuberculate to fusiform (Figure 10d and Figure 11c,d).
Ecologically, this variety is confined to the Atlantic, where it inhabits shallow intertidal rock pools in the Canary Islands. In deeper and more permanently submerged pools, thalli exhibit a dwarf growth form, with cauloids approximately 1 cm long and primary branches 2–5 cm in length, bearing scattered or distichous secondary laterals, often simple, with abundant protruding crypts and terminal receptacles. Specimens collected in Morocco are more robustly developed and occur in shallow rock pools of the upper intertidal zone.

4. Discussion

4.1. Evidence for Two Species-Level Lineages and Intraspecific Diversification in Cystoseira s.s.

Our multilocus phylogenetic analyses support the recognition of two species-level lineages within Cystoseira s.s., corresponding to C. foeniculacea and C. compressa. Within C. compressa, both C. pustulata and C. morphotype canariensis (i.e., specimens with the morphology traditionally attributed to C. canariensis) are best interpreted as intraspecific lineages rather than independent species. Accordingly, we propose their treatment at varietal rank, while formally establishing a new combination only for C. pustulata, pending clarification of the conspecificity between C. canariensis and C. humilis. This pattern is consistent with a scenario of recent or ongoing diversification, in which morpho-ecological differentiation has progressed further than genomic lineage sorting at the analysed molecular markers. This taxonomic interpretation is primarily based on the pattern of genetic discontinuity observed across the three molecular markers. The barcode gap identified in our dataset (Figure 1) consistently separates C. foeniculacea from the C. compressa complex, with interspecific divergence markedly exceeding the range of intraspecific variation. By contrast, pairwise divergences among the three morpho-ecological entities within the C. compressa complex remain low across all markers falling far below the interspecific threshold that distinguishes the two main lineages (see Results 3.2).
In this study, the use of multiple species-delimitation methods, which could be sensitive to sampling density and phylogenetic reconstruction uncertainty, was intended not as stand-alone criteria for taxonomic decisions, but as a comparative tool to test the robustness of inferred boundaries across markers. Their inclusion was also motivated by the fact that recent taxonomic changes within Cystoseira s.s., including the elevation of C. pustulata to species rank [27], relied in part on similar analytical frameworks. In this context, both PTP and ABGD/ASAP consistently recovered only two species across all three markers, whereas GMYC yielded highly locus-dependent outcomes, ranging from one to five putative species. The least conservative GMYC partition would imply splitting Cystoseira s.s. into five entities, exceeding the four taxa previously recognised; conversely, the most conservative outcome collapsed all Cystoseira s.s. into a single species. Such instability reflects a well-documented limitation of GMYC, which is prone to oversplitting in datasets characterised by shallow divergence, incomplete lineage sorting, or large alignments [63,64]. Accordingly, GMYC results are best interpreted here as an exploratory signal of divergence heterogeneity, highlighting putative cryptic lineages, rather than as evidence for formal species recognition. Talavera et al. [64] reported substantial sensitivity and failure rates under several conditions, concluding that GMYC partitions should not be equated with species sensu stricto, but instead regarded as “candidate” species requiring corroboration. By contrast, the strong congruence between ABGD/ASAP and PTP results, combined with the recovery of a clear and consistent barcode gap between inter- and intraspecific distances across all three markers, provides robust support for recognising only two species-level lineages within Cystoseira s.s. Our taxonomic interpretation does not rest solely on these delimitation methods, but on the combined evaluation of diagnosability, phylogenetic relationship, and the absence of evidence for independently evolving species-level lineages within the C. compressa complex. In all cases, the barcode gap consistently observed in cox1, rbcL–rbcS, and ITS2 indicates that genetic divergence between the two main lineages (C. foeniculacea vs. the C. compressa complex) consistently exceeds variation within each lineage.
Our results contrast with those of Neiva et al. [27], who relied exclusively on cox1 and elevated C. compressa subsp. pustulata to species rank despite the absence of a clear barcode gap and inconsistent outcomes across the delimitation methods applied. Instead, our findings are more consistent with de Sousa et al. [25], who observed that the autonym of C. compressa branched off from C. compressa subsp. pustulata and C. humilis without significant support values, acknowledging the close phylogenetic affinity of the latter two and proposing their synonymy.
Additional instability is evident in the treatment of C. aurantia Kützing by Orellana et al. [1], later re-identified as C. pustulata by Neiva et al. [27]. Our analyses instead place these sequences closer to C. compressa var. compressa, further illustrating how shallow divergence and morphological plasticity can lead to inconsistent taxonomic interpretations when single markers are used in isolation.

4.2. Morphological Plasticity and Consistent Ecological Differentiation Within the C. compressa Complex

Genetic distances among the three entities traditionally recognised as C. compressa, C. pustulata, and C. morphotype canariensis are consistently low and often marker-dependent (Figure 2, Figure 3, Figure 4 and Figure 5). This pattern mirrors the morphological evidence, which reveals pronounced plasticity in diagnostic traits, such as branch compression, presence and distribution of aerocysts, and cryptostomata structure, both in our material and in previous studies [16,35,38,39,40]. Expression of these traits frequently overlaps among populations in our material, and previous taxonomic studies have suggested that their development may vary in relation to environmental conditions such as light availability, hydrodynamic exposure, and tidal regime [16,35,38,39,40]. For instance, aerocysts or cryptostomata may be conspicuous in sheltered subtidal habitats but strongly reduced or absent in highly exposed intertidal sites, blurring the distinction between C. compressa var. compressa and C. compressa var. pustulata. Such environmentally mediated phenotypic variability has historically fuelled inconsistent taxonomic interpretations and contributed to species inflation within the complex. From a cladistic standpoint, none of these traits constitutes a fixed apomorphy: their continuous, overlapping variation does not provide the discrete character-state discontinuities expected for independently evolving species-level lineages.
Remarkably similar patterns have been documented in other Fucales, such as in Sargassum from the Mexican Atlantic, where molecular analyses collapsed ten morphologically distinct species into a single polytomy with very low genetic divergence [65].
The taxonomic status of C. humilis and C. canariensis is particularly emblematic of this problem. C. canariensis was originally described by Sauvageau [40] from the Canary Islands as forming dense turfs in shallow rock pools, with short erect cauloids, strictly cylindrical primary branches, and pedicellate cryptostomata. Although Sauvageau regarded it as distinct, Levring [36] (p.81; see also Price et al., [37]) later treated it as conspecific with C. humilis. Nevertheless, none of the morpho-anatomical accounts of C. humilis (e.g., [35,41,42,44]) explicitly report the distinctive diagnostic suite of characters observed in our material, which closely matches Sauvageau’s original description of C. canariensis.
Despite this variability and partial overlap in individual traits, our integrative framework reveals three morpho-ecological patterns that are consistently recognisable across broad geographic and ecological gradients. C. compressa var. compressa develops larger fronds with basal flattening and aerocysts, dominating intertidal and upper subtidal zones. C. compressa var. pustulata occupies shallow subtidal habitats down to 10–20 m and is characterised by slender, cylindrical fronds with protruding cryptostomata and limited seasonal phenological variation. C. morphotype canariensis forms dense turfs restricted to the Atlantic, characterised by pedicellate cryptostomata and confinement to tide pools and sheltered environments.
Crucially, although these entities exhibit morphological and ecological differentiation, the boundaries between them are not sharply discrete, as some specimens display intermediate character states and cannot be assigned unambiguously on the basis of morphology alone. In this context, morphology supports differentiation within the complex, but does not reveal a level of discontinuity comparable to that observed between the two main species-level lineages (i.e., C. foeniculacea vs. the C. compressa complex). This combination of evidence argues against their recognition as independent species under a phylogenetic species concept, while fully justifying their treatment as varieties. Recognition at variety rank therefore acknowledges ecologically meaningful diversity while avoiding unsupported species inflation.
In this sense, C. compressa var. compressa, C. compressa var. pustulata, and C. morphotype canariensis represent stable, geographically and ecologically coherent taxonomic units that reconcile phenotypic distinctiveness with a conservative and evolutionarily sound interpretation of species boundaries.

4.3. Performance of Molecular Markers and Implications for Future Taxonomic Research

Among the three markers used, cox1 emerged as the most variable locus, in agreement with previous studies on Cystoseira s.l. and related fucoid algae [1,17,25,27,32]. Although additional loci such as 23S rDNA, 23S–tRNA^Val, psbA, nad1, and psaA have been employed in earlier phylogenetic studies, these markers have generally shown limited resolution at the species-level and were therefore not included in the present analyses. Instead, we combined cox1 with two non-coding regions, the plastid rbcL–rbcS intergenic spacer and the nuclear ITS2 region, both of which have been successfully applied for species delimitation and intraspecific assessments in Phaeophyceae [30,33,34,47]. The rationale for this multilocus design was to integrate markers evolving at different rates and under different inheritance models, thereby maximising the likelihood of detecting both deep and shallow evolutionary signals. The lower variability observed in rbcL–rbcS and ITS2 does not necessarily imply poor taxonomic resolution, as a few base pair differences may reflect strong sequence conservation rather than insufficient discriminatory power.
The congruent recovery of two main evolutionary lineages across mitochondrial, plastid, and nuclear markers demonstrates that a multilocus framework provides a more reliable basis for taxonomic decisions than single-locus approaches, particularly in groups characterised by shallow divergence, morphological plasticity, and potential hybridisation.
Nevertheless, amplification success rates varied considerably among markers, reflecting both the inherent difficulties of working with brown algal DNA and differences in primer specificity. The particularly low yield for rbcL-rbcS is largely attributable to the use of primers originally designed for other algae (i.e., Rhodophyta for the forward primer and Ectocarpales, Phaeophyceae for the reverse primer). Their suboptimal specificity may have facilitated the preferential amplification of co-extracted epiphytic DNA over that of the target. These technical challenges were compounded by the intrinsic properties of brown macroalgae, which are rich in polysaccharides and polyphenols that interfere with DNA extraction and PCR amplification, particularly when field preservation conditions are suboptimal. Despite careful cleaning of all specimens prior to processing, microscopic or cryptic epiphytes can be easily overlooked, often resulting in mixed chromatograms and unusable sequences.
Looking ahead, taxonomic work on Cystoseira s.l. should prioritise the development of additional nuclear markers and the design of genus-specific primers, as well as optimising extraction protocols to enhance template quality, thereby improving amplification success and phylogenetic resolution. While mitochondrial cox1 remains highly informative, its resolution alone is insufficient to disentangle recent or ongoing divergence processes. Expanding the suite of independent nuclear loci therefore represents a critical first step towards stabilising species boundaries. The multilocus approach adopted here has provided a valuable baseline framework; nevertheless, like any marker-limited approach, it does not permit the detection of heterozygosity, recombination, or fine-scale population structure which are aspects that would require higher genomic coverage. A transition toward genomic-scale data, such as RAD-seq, whole-genome resequencing, or target enrichment approaches, will be particularly valuable for quantifying admixture in zones of co-occurrence, testing hypotheses of ecological differentiation, and detecting ongoing gene flow within the C. compressa complex.
Another pressing issue concerns the misidentification of specimens in earlier studies, which has resulted in incorrectly named sequences in public repositories such as GenBank and, consequently, unstable phylogenetic reconstructions. Systematic re-evaluation of existing databases, anchored to morphologically validated reference material, is urgently needed. Indeed, in recent years, similar initiatives have also been proposed for other macroalgal groups [66]. Equally essential is the molecular analysis of type material using standardised and reproducible protocols. The absence of genetic data from nomenclatural types continues to hinder the resolution of long-standing taxonomic ambiguities in Cystoseira s.l. and integrating DNA data from historical collections with rigorous morphological reassessment will be indispensable to firmly anchor molecular clades to valid names.
Finally, beyond Cystoseira s.s., comprehensive reassessment of other segregated genera (e.g., Ericaria, Gongolaria) within an integrative multilocus framework is required to establish a coherent taxonomy for the entire clade. Coordinated efforts, combining new markers, curated sequence databases, analyses of type material, and fine-scale population studies will be essential to stabilise the taxonomy of Cystoseira s.l. and to define genotype-phenotype-environment relationships, thereby providing a robust foundation for biodiversity monitoring, ecological research, and conservation of these foundational marine forests.

4.4. Nomenclatural Novelties

The congruence of molecular, morphological, and ecological evidence supports the recognition of only two species-level lineages within Cystoseira s.s., corresponding to C. foeniculacea and C. compressa. Within C. compressa, however, consistent morpho-ecological differentiation warrants formal taxonomic recognition below the species rank, while remaining fully compatible with the shallow and marker-dependent genetic divergence observed.
Accordingly, two varieties in addition to the autonym are recognised within C. compressa, only one of which is formally proposed here, pending clarification of the taxonomic status and typification of C. canariensis relative to C. humilis. This conservative approach ensures nomenclatural stability while acknowledging ecologically meaningful diversity.
Cystoseira compressa (Esper) Gerloff et Nizamuddin var. pustulata (Ercegović) D’Ambros Burchio & Falace comb. et stat. nov.
Basionym: Cystoseira abrotanifolia subsp. pustulata Ercegović 1952: 113. Fauna et Flora Adriatica. Sur les Cystoseira adriatiques. Leur morphologie, écologie et évolution. Vol. 2: 1–212. Institut d’ Océanographie et de Pêche, Split.
Homotypic synonym: Cystoseira compressa subsp. pustulata (Ercegović) Verlaque.
Note: Based on combined morphological, reproductive, ecological, and molecular evidence, recognition at varietal rank is considered more appropriate than subspecies or species rank, as it captures consistent phenotypic differentiation without implying unsupported evolutionary independence.
It should also be noted that Verlaque [67] (p. 191) published the name C. compressa var. pustulata Ercegović (sic!), without explicitly designating it as a new combination; consequently, that name, which should be credited to Ercegović ex Verlaque, is invalidly published.

Supplementary Materials

The following supporting information can be downloaded at: https://www.mdpi.com/article/10.3390/plants15142237/s1. Figure S1: Sampling sites across the Atlantic Ocean (panel A) and Mediterranean Sea (panel B). Figure S2: Multilocus Bayesian Inference (BI) and Maximum Likelihood (ML) consensus tree based on the concatenated dataset (at leaITS2 + rbcL–rbcS + cox1) with missing data for Cystoseira s.s. Numbers near nodes indicate Bayesian posterior probabilities (left) and ML bootstrap support values (right). Table S1: List of samples used for phylogenetic and morphologic analyses; Table S2: List of additional sequences used for the cox1 phylogenetic tree and species delimitation methods; Table S3: Morphological characters of the three varieties of Cystoseira compressa. File S1: sequence clustered in the cox1 phylogenetic tree; File S2: sequence clustered in the rbcL-rbcS phylogenetic tree; File S3: sequence clustered in the ITS2 phylogenetic tree.

Author Contributions

Conceptualization, S.D.B., A.P. and A.F.; Methodology, S.D.B., A.P., I.P., G.F., S.G., E.C., F.F. and A.F.; Validation, S.D.B., A.P., L.M., G.F. and A.F.; Formal analysis, S.D.B., A.P., L.M., I.P., G.F., S.G., E.C., F.F. and A.F.; Investigation, S.D.B., A.P., L.M., I.P., G.F., S.G., E.C., F.F., J.V., R.H., A.M.M., Z.B., R.S.d.P., P.I.L., M.S., L.I., C.B. and A.F.; Resources, A.P., J.V., R.H., A.M.M., Z.B., R.S.d.P., P.I.L., M.S., L.I., C.B. and A.F.; Data curation, S.D.B., A.P., I.P. and A.F.; Writing—original draft, S.D.B., A.P., L.M., I.P., G.F., E.C., A.M.M. and A.F.; Writing—review & editing, S.D.B., A.P., L.M., I.P., G.F., S.G., E.C., F.F., J.V., R.H., A.M.M., Z.B., R.S.d.P., P.I.L., M.S., L.I., C.B. and A.F.; Visualization, S.D.B., A.P., L.M., I.P., S.G., E.C., A.M.M., R.S.d.P. and A.F.; Supervision, A.P. and A.F.; Project administration, A.F.; Funding acquisition, A.P. and A.F. All authors have read and agreed to the published version of the manuscript.

Funding

The authors acknowledge the support of the “National Biodiversity Future Center—NBFC” funded under the National Recovery and Resilience Plan (NRRP), Mission 4 Component 2 Investment 1.4—Call for tender No.3138 of December 16, 2021, rectified by Decree n.3175 of December 18, 2021 of Italian Ministry of University and Research funded by the European Union—NextGenerationEU; Award Number: Project code CN_00000033, Concession Decree No.1034 of June 17, 2022 adopted by the Italian Ministry of University and Research, CUP D33C22000960007; and the support of the project OCEAN CITIZEN (“Marine forest coastal restoration: an underwater gardening socio-ecological plan”, Horizon Europe HORIZON-MISS-2021-OCEAN-02-01, Contract Number 101093910).

Data Availability Statement

The data presented in this study are available in the article and Supplementary Materials. The genetic sequences generated in this study have been deposited in GenBank under the accession numbers reported in the Supplementary Materials and will become publicly available upon publication.

Conflicts of Interest

The authors declare no conflicts of interest.

Abbreviations

cox1: cytochrome oxidase 1; ITS2, internal transcribed spacer 2; RuBisCO, ribulose-1,5-bisphosphate carboxylase/oxygenase; rbcL-rbcS, RuBisCO large-small subunits; psbA, photosystem II protein D1; mt23S, mitochondrial 23S; mt23S–tRNA^Val, mitochondrial 23S–tRNA^Val spacer; PCR, Polymerase Chain Reaction; TAE, Tris-Acetate-EDTA; HKY, Hasegawa-Kishino-Yano; T92, Tamura 3-parameter; G, gamma; BI, Bayesian Inference; ML, Maximum Likelihood; ABGD, Automatic Barcode Gap Discovery for primary species delimitation; ASAP, Assemble Species by Automatic Partitioning; PTP, Poisson Tree Processes; GMYC, General Mixed Yule Coalescent.

References

  1. Orellana, S.; Hernández, M.; Sansón, M. Diversity of Cystoseira sensu lato (Fucales, Phaeophyceae) in the eastern Atlantic and Mediterranean based on morphological and DNA evidence, including Carpodesmia gen. emend. and Treptacantha gen. emend. Eur. J. Phycol. 2019, 54, 447–465. [Google Scholar] [CrossRef] [Scilit]
  2. Blanfuné, A.; Boudouresque, C.F.; Verlaque, M.; Thibaut, T. The fate of Cystoseira crinita, a forest-forming Fucale (Phaeophyceae, Stramenopiles), in France (North Western Mediterranean Sea). Estuar. Coast. Shelf Sci. 2016, 181, 196–208. [Google Scholar] [CrossRef] [Scilit]
  3. Rožić, S.; Puizina, J.; Šamanić, I.; Žuljević, A.; Antolić, B. Molecular identification of the brown algae, Cystoseira spp. (Phaeophyceae, Fucales) from the Adriatic Sea—Preliminary results. Acta Adriat. 2012, 53, 447–456. [Google Scholar]
  4. Sangil, C.; Sansón, M.; Afonso-Carrillo, J. Spatial variation patterns of subtidal seaweed assemblages along a subtropical oceanic archipelago: Thermal gradient vs herbivore pressure. Estuar. Coast. Shelf Sci. 2011, 94, 322–333. [Google Scholar] [CrossRef] [Scilit]
  5. Jones, C.G.; Lawton, J.H.; Shachak, M. Organisms as ecosystem engineers. Oikos 1994, 69, 373. [Google Scholar] [CrossRef] [Scilit] [PubMed]
  6. Mancuso, F.P.; Milazzo, M.; Chemello, R. Decreasing patch-size of Cystoseira forests reduces the diversity of their associated molluscan assemblage in Mediterranean rocky reefs. Estuar. Coast. Shelf Sci. 2021, 250, 107163. [Google Scholar] [CrossRef] [Scilit]
  7. Ballesteros, E.; Sala, E.; Garrabou, J.; Zabala, M. Community structure and frond size distribution of a deep water stand of Cystoseira spinosa (Phaeophyta) in the Northwestern Mediterranean. Eur. J. Phycol. 1998, 33, 121–128. [Google Scholar] [CrossRef] [Scilit]
  8. Cannarozzi, L.; Rigo, I.; Ruggeri, F.; Asnaghi, V.; Chiantore, M.; Falace, A.; Bordoni, R.; Vassallo, P.; Paoli, C.; Bevilacqua, S. Ericaria amentacea natural capital: The hidden treasure of Mediterranean midlittoral environments. Environ. Sustain. Indic. 2025, 28, 100918. [Google Scholar] [CrossRef] [Scilit]
  9. Thibaut, T.; Blanfuné, A.; Boudouresque, C.F.; Verlaque, M. Decline and local extinction of Fucales in French Riviera: The harbinger of future extinctions? Mediterr. Mar. Sci. 2014, 16, 206. [Google Scholar] [CrossRef] [Scilit]
  10. Thibaut, T.; Pinedo, S.; Torras, X.; Ballesteros, E. Long-term decline of the populations of Fucales (Cystoseira spp. and Sargassum spp.) in the Albères coast (France, North-western Mediterranean). Mar. Pollut. Bull. 2005, 50, 1472–1489. [Google Scholar] [CrossRef] [Scilit] [PubMed]
  11. Mineur, F.; Arenas, F.; Assis, J.; Davies, A.J.; Engelen, A.H.; Fernandes, F.; Malta, E.; Thibaut, T.; Van Nguyen, T.; Vaz-Pinto, F.; et al. European seaweeds under pressure: Consequences for communities and ecosystem functioning. J. Sea Res. 2015, 98, 91–108. [Google Scholar] [CrossRef] [Scilit]
  12. Fabbrizzi, E.; Scardi, M.; Ballesteros, E.; Benedetti-Cecchi, L.; Cebrian, E.; Ceccherelli, G.; De Leo, F.; Deidun, A.; Guarnieri, G.; Falace, A.; et al. Modeling macroalgal forest distribution at Mediterranean scale: Present status, drivers of changes and insights for conservation and management. Front. Mar. Sci. 2020, 7, 20. [Google Scholar] [CrossRef] [Scilit]
  13. Bulleri, F.; Pedicini, L.; Bertocci, I.; Ravaglioli, C. The impact of a marine heatwave on the productivity and carbon budget of a NW Mediterranean seaweed forest. Mar. Pollut. Bull. 2025, 212, 117595. [Google Scholar] [CrossRef] [Scilit] [PubMed]
  14. Beck, M.; Airoldi, L. Loss, status and trends for coastal marine habitats of Europe. In Oceanography and Marine Biology: An Annual Review; CRC Press: Boca Raton, FL, USA, 2007; pp. 345–405. [Google Scholar]
  15. Falace, A.; Manfrin, C.; Furnari, G.; D’Ambros Burchio, S.; Pallavicini, A.; Descourvières, E.; Kaleb, S.; Lokovšek, A.; Grech, D.; Alongi, G. Contribution to the knowledge of Gongolaria barbata (Sargassaceae, Fucales) from the Mediterranean: Insights into infraspecific diversity. Phytotaxa 2024, 635, 191–205. [Google Scholar] [CrossRef] [Scilit]
  16. Roberts, M. Studies on marine algae of the British Isles. 3. The genus Cystoseira. Brit. Phycol. Bull. 1967, 3, 345–366. [Google Scholar] [CrossRef] [Scilit]
  17. Draisma, S.G.A.; Ballesteros, E.; Rousseau, F.; Thibaut, T. DNA sequence data demonstrate the polyphyly of the genus Cystoseira and other Sargassaceae genera (Phaeophyceae). J. Phycol. 2010, 46, 1329–1345. [Google Scholar] [CrossRef] [Scilit]
  18. Amico, V. Marine brown algae of family Cystoseiraceae: Chemistry and chemotaxonomy. Phytochemistry 1995, 39, 1257–1279. [Google Scholar] [CrossRef] [Scilit]
  19. Roberts, M. Active speciation in the taxonomy of the genus Cystoseira C. Ag. In Modern Approaches to the Taxonomy of Red and Brown Algae; Irvine, D.E.G., Price, J.H., Eds.; Academic Press: London, UK, 1978; pp. 399–422. [Google Scholar]
  20. Bermejo, R.; Chefaoui, R.M.; Engelen, A.H.; Buonomo, R.; Neiva, J.; Ferreira-Costa, J.; Pearson, G.A.; Marbà, N.; Duarte, C.M.; Airoldi, L.; et al. Marine forests of the Mediterranean-Atlantic Cystoseira tamariscifolia complex show a southern Iberian genetic hotspot and no reproductive isolation in parapatry. Sci. Rep. 2018, 8, 10427. [Google Scholar] [CrossRef] [Scilit] [PubMed]
  21. Bortolus, A. Error cascades in the biological sciences: The unwanted consequences of using bad taxonomy in ecology. Ambio 2008, 37, 114–118. [Google Scholar] [CrossRef] [Scilit]
  22. Ensing, D.J.; Moffat, C.E.; Pither, J. Taxonomic identification errors generate misleading ecological niche model predictions of an invasive hawkweed. Botany 2013, 91, 137–147. [Google Scholar] [CrossRef] [Scilit]
  23. Aubry, K.B.; Raley, C.M.; McKelvey, K.S. The importance of data quality for generating reliable distribution models for rare, elusive, and cryptic species. PLoS ONE 2017, 12, e0179152. [Google Scholar] [CrossRef] [Scilit] [PubMed]
  24. de Reviers, B.; Rousseau, F.; Draisma, S.G.A. Classification of the Phaeophyceae from past to present and current challenges. In Unravelling the Algae: The Past, Present, and Future of Algal Systematics; Brodie, J., Lewis, J., Eds.; CRC Press: Boca Raton, FL, USA, 2007; pp. 267–284. [Google Scholar]
  25. de Sousa, C.B.; Cox, C.J.; Brito, L.; Pavão, M.M.; Pereira, H.; Ferreira, A.; Ginja, C.; Campino, L.; Bermejo, R.; Parente, M.; et al. Improved phylogeny of brown algae Cystoseira (Fucales) from the Atlantic-Mediterranean region based on mitochondrial sequences. PLoS ONE 2019, 14, e0210143. [Google Scholar] [CrossRef] [Scilit] [PubMed]
  26. Molinari, E.; Guiry, M.D. Reinstatement of the genera Gongolaria Boehmer and Ericaria Stackhouse (Sargassaceae, Phaeophyceae). Not. Algarum 2020, 172, 456. [Google Scholar]
  27. Neiva, J.; Bermejo, R.; Medrano, A.; Capdevila, P.; Milla-Figueras, D.; Afonso, P.; Ballesteros, E.; Sabour, B.; Serio, D.; Nóbrega, E.; et al. DNA barcoding reveals cryptic diversity, taxonomic conflicts and novel biogeographical insights in Cystoseira s.l. (Phaeophyceae). Eur. J. Phycol. 2022, 58, 351–375. [Google Scholar] [CrossRef] [Scilit]
  28. Jégou, C.; Culioli, G.; Kervarec, N.; Simon, G.; Stiger-Pouvreau, V. LC/ESI-MSn and 1H HR-MAS NMR analytical methods as useful taxonomical tools within the genus Cystoseira C. Agardh (Fucales; Phaeophyceae). Talanta 2010, 83, 613–622. [Google Scholar] [CrossRef] [Scilit] [PubMed]
  29. Stiger, V.; Horiguchi, T.; Yoshida, T.; Coleman, A.W.; Masuda, M. Phylogenetic relationships within the genus Sargassum (Fucales, Phaeophyceae), inferred from ITS-2 nrDNA, with an emphasis on the taxonomic subdivision of the genus. Phycol. Res. 2003, 51, 1–10. [Google Scholar] [CrossRef]
  30. Stiger, V.; Horiguchi, T.; Yoshida, T.; Coleman, A.W.; Masuda, M. Phylogenetic relationships of Sargassum (Sargassaceae, Phaeophyceae) with reference to a taxonomic revision of the section Phyllocystae based on ITS-2 nrDNA sequences. Phycol. Res. 2000, 48, 251–260. [Google Scholar] [CrossRef] [Scilit]
  31. Jódar-Pérez, A.B.; Terradas-Fernández, M.; López-Moya, F.; Asensio-Berbegal, L.; López-Llorca, L.V. Multidisciplinary Analysis of Cystoseira sensu lato (SE Spain) Suggest a Complex Colonization of the Mediterranean. J. Mar. Sci. Eng. 2020, 8, 961. [Google Scholar] [CrossRef] [Scilit]
  32. Sadogurska, S.S.; Neiva, J.; Falace, A.; Serrão, E.A.; Israel, Á. The genus Cystoseira s.l. (Ochrophyta, Fucales, Sargassaceae) in the Black Sea: Morphological variability and molecular taxonomy of Gongolaria barbata and endemic Ericaria crinita f. bosphorica comb. nov. Phytotaxa 2021, 480, 1–21. [Google Scholar] [CrossRef] [Scilit]
  33. Phillips, N.E.; Smith, C.M.; Morden, C.W. Testing systematic concepts of Sargassum (Fucales, Phaeophyceae) using portions of the rbcLS operon. Phycol. Res. 2005, 53, 1–10. [Google Scholar] [CrossRef]
  34. Vitales, D.; Aragay, J.; Garnatje, T.; Gómez Garreta, A.; Rull Lluch, J. Phylogeography of Dictyota fasciola and Dictyota mediterranea (Dictyotales, Phaeophyceae): Unexpected patterns on the Atlantic-Mediterranean marine transition and taxonomic implications. PeerJ 2019, 7, e6916. [Google Scholar] [CrossRef] [Scilit] [PubMed]
  35. Gómez Garreta, A.; Barcelo, I.; Martí, M.C.; Ribera Siguán, M.A.; Rull Lluch, J. Cystoseira C. Agardh. In Flora Phycologica Iberica; 1 Fucales; Universidad de Murcia: Murcia, Spain, 2001; Volume 1, pp. 99–166. [Google Scholar]
  36. Levring, T. The marine algae of the Archipelago of Madeira. Bol. Mus. Munic. Funchal 1974, 28, 5–111. [Google Scholar]
  37. Price, J.H.; John, D.M.; Lawson, G.W. Seaweeds of the western coast of tropical Africa and adjacent islands: A critical assessment. II. Phaeophyta. Bull. Br. Mus. Nat. Hist. (Bot.) 1978, 6, 87–182. [Google Scholar] [CrossRef] [Scilit]
  38. Bouafif, C.; Verlaque, M.; Langar, H. New contribution to the knowledge of the genus Cystoseira C. Agardh in the Mediterranean Sea, with the reinstatement of species rank for C. schiffneri Hamel. Cryptogamie 2016, 37, 133–154. [Google Scholar] [CrossRef] [Scilit]
  39. Ercegovic, A. Fauna et Flora Adriatica. Sur les Cystoseira Adriatiques. Leur Morphologie, Écologie et Évolution; Institut d’Océanographie et de Peche: Split, Croatia, 1952; Volume 2. [Google Scholar]
  40. Sauvageau, C. A propos des Cystoseira de Banyuls et Guéthary. Bull. Stn. Biol. Arcachon 1912, 14, 133–556. [Google Scholar]
  41. Cormaci, M.; Furnari, G.; Catra, M.; Alongi, G.; Giaccone, G. Flora Marina Bentonica del Mediterraneo: Phaeophyceae; Bollettino dell’Accademia Gioenia di Scienze Naturali di Catania: Catania, Italy, 2012; Volume 45. [Google Scholar]
  42. Blanfuné, A.; Verlaque, M.; Boudouresque, C.-F.; Rozis, E.; Thibaut, T. Les Forêts Marines de France et de Méditerranée; Presses Universitaires de Provence: Aix en Provence, France, 2022. [Google Scholar]
  43. Larraín, M.A.; González, P.; Pérez, C.; Araneda, C. Comparison between single and multi-locus approaches for specimen identification in Mytilus mussels. Sci. Rep. 2019, 9, 19714. [Google Scholar] [CrossRef] [Scilit] [PubMed]
  44. Hamel, G. Phéophycées de France; Publié par L’auteur: Paris, France, 1939. [Google Scholar]
  45. Hanyuda, T.; Suzawa, Y.; Suzawa, T.; Arai, S.; Sato, H.; Ueda, K.; Kumano, S. Biogeography and taxonomy of Batrachospermum helminthosum Bory (Batrachospermales, Rhodophyta) in Japan inferred from rbcL gene sequences. J. Phycol. 2004, 40, 581–588. [Google Scholar] [CrossRef] [Scilit]
  46. Peters, A.; Ramirez, M.E. Molecular phylogeny of small brown algae, with special reference to the systematic position of Caepidium antarcticum (adenocystaceae, ectocarpales). Cryptogam. Algol. 2001, 22, 187–200. [Google Scholar] [CrossRef] [Scilit]
  47. Yoshida, T.; Stiger, V.; Horiguchi, T. Sargassum boreale sp. nov. (Fucales, Phaeophyceae) from Hokkaido, Japan. Phycol. Res. 2000, 48, 125–131. [Google Scholar] [CrossRef]
  48. Altschul, S.F.; Gish, W.; Miller, W.; Myers, E.W.; Lipman, D.J. Basic local alignment search tool. J. Mol. Biol. 1990, 215, 403–410. [Google Scholar] [CrossRef] [PubMed]
  49. Li, W.; Godzik, A. Cd-hit: A fast program for clustering and comparing large sets of protein or nucleotide sequences. Bioinformatics 2006, 22, 1658–1659. [Google Scholar] [CrossRef] [Scilit] [PubMed]
  50. Tamura, K.; Stecher, G.; Kumar, S. MEGA11: Molecular Evolutionary Genetics Analysis Version 11. Mol. Biol. Evol. 2021, 38, 3022–3027. [Google Scholar] [CrossRef] [Scilit] [PubMed]
  51. Ronquist, F.; Teslenko, M.; van der Mark, P.; Ayres, D.L.; Darling, A.; Höhna, S.; Larget, B.; Liu, L.; Suchard, M.A.; Huelsenbeck, J.P. MrBayes 3.2: Efficient Bayesian Phylogenetic Inference and Model Choice Across a Large Model Space. Syst. Biol. 2012, 61, 539–542. [Google Scholar] [CrossRef] [Scilit] [PubMed]
  52. Kozlov, A.M.; Darriba, D.; Flouri, T.; Morel, B.; Stamatakis, A. RAxML-NG: A fast, scalable and user-friendly tool for maximum likelihood phylogenetic inference. Bioinformatics 2019, 35, 4453–4455. [Google Scholar] [CrossRef] [Scilit] [PubMed]
  53. Letunic, I.; Bork, P. Interactive Tree Of Life (iTOL) v5: An online tool for phylogenetic tree display and annotation. Nucleic Acids Res. 2021, 49, W293–W296. [Google Scholar] [CrossRef] [Scilit] [PubMed]
  54. Leigh, J.W.; Bryant, D. POPART: Full-feature software for haplotype network construction. Methods Ecol. Evol. 2015, 6, 1110–1116. [Google Scholar] [CrossRef] [Scilit]
  55. Puillandre, N.; Lambert, A.; Brouillet, S.; Achaz, G. ABGD, Automatic Barcode Gap Discovery for primary species delimitation. Mol. Ecol. 2012, 21, 1864–1877. [Google Scholar] [CrossRef] [Scilit] [PubMed]
  56. Puillandre, N.; Brouillet, S.; Achaz, G. ASAP: Assemble species by automatic partitioning. Mol. Ecol. Resour. 2021, 21, 609–620. [Google Scholar] [CrossRef] [Scilit] [PubMed]
  57. Zhang, J.; Kapli, P.; Pavlidis, P.; Stamatakis, A. A general species delimitation method with applications to phylogenetic placements. Bioinformatics 2013, 29, 2869–2876. [Google Scholar] [CrossRef] [Scilit] [PubMed]
  58. Pons, J.; Barraclough, T.G.; Gomez-Zurita, J.; Cardoso, A.; Duran, D.P.; Hazell, S.; Kamoun, S.; Sumlin, W.D.; Vogler, A.P. Sequence-Based Species Delimitation for the DNA Taxonomy of Undescribed Insects. Syst. Biol. 2006, 55, 595–609. [Google Scholar] [CrossRef] [Scilit] [PubMed]
  59. Suchard, M.A.; Lemey, P.; Baele, G.; Ayres, D.L.; Drummond, A.J.; Rambaut, A. Bayesian phylogenetic and phylodynamic data integration using BEAST 1.10. Virus Evol. 2018, 4, vey016. [Google Scholar] [CrossRef] [Scilit] [PubMed]
  60. Giaccone, G.B.A. Le Cistoseire e la vegetazione sommersa del Mediterraneo. Atti R. Ist. Veneto Sci. Lett. Arti 1973, 131, 59–103. [Google Scholar]
  61. Gerloff, J.; Nizamuddin, M. Bemerkungen zur Nomenklatur einiger Arten der Gattung Cystoseira C. Ag. Nova Hedwig. 1975, 26, 341–348. [Google Scholar] [CrossRef] [Scilit]
  62. Falace, A.; Zanelli, E.; Bressan, G. Morphological and reproductive phenology of Cystoseira compressa (Esper) Gerloff & Nizamuddin (Fucales, fucophyceae) in the Gulf of Trieste (North Adriatic Sea). Ann. Ser. Hist. Nat. 2005, 15, 71–78. [Google Scholar]
  63. Verbruggen, H.; Uthanumallian, K.; Powrie, F.; Jalali, T.; Cremen, C.; Preuss, M.; Duchene, S.; Diaz-Tapia, P. Scaling Up Species Delimitation from DNA Barcodes to Whole Organelle Genomes: Strong Evidence for Discordance Among Genes and Methods for the Red Alga Dasyclonium. Mol. Ecol. Resour. 2025, 25, e14132. [Google Scholar] [CrossRef] [Scilit] [PubMed]
  64. Talavera, G.; Dincă, V.; Vila, R. Factors affecting species delimitations with the GMYC model: Insights from a butterfly survey. Methods Ecol. Evol. 2013, 4, 1101–1110. [Google Scholar] [CrossRef] [Scilit]
  65. González-Nieto, D.; Oliveira, M.C.; Núñez Resendiz, M.L.; Dreckmann, K.M.; Mateo-Cid, L.E.; Sentíes, A. Molecular assessment of the genus Sargassum (Fucales, Phaeophyceae) from the Mexican coasts of the Gulf of Mexico and Caribbean, with the description of S. xochitlae sp. nov. Phytotaxa 2020, 461, 254–274. [Google Scholar] [CrossRef] [Scilit]
  66. Draisma, S.G.A.; Sauvage, T. A tufA reference sequence library for the green algal genus Caulerpa (Bryopsidales). Jeju J. Isl. Sci. 2024, 1, 1–11. [Google Scholar]
  67. Verlaque, M. Végétation marine de la Corse (Méditerranée) VII. Documents pour la flore des algues. Bot. Mar. 1988, 31, 187–194. [Google Scholar] [CrossRef] [Scilit]
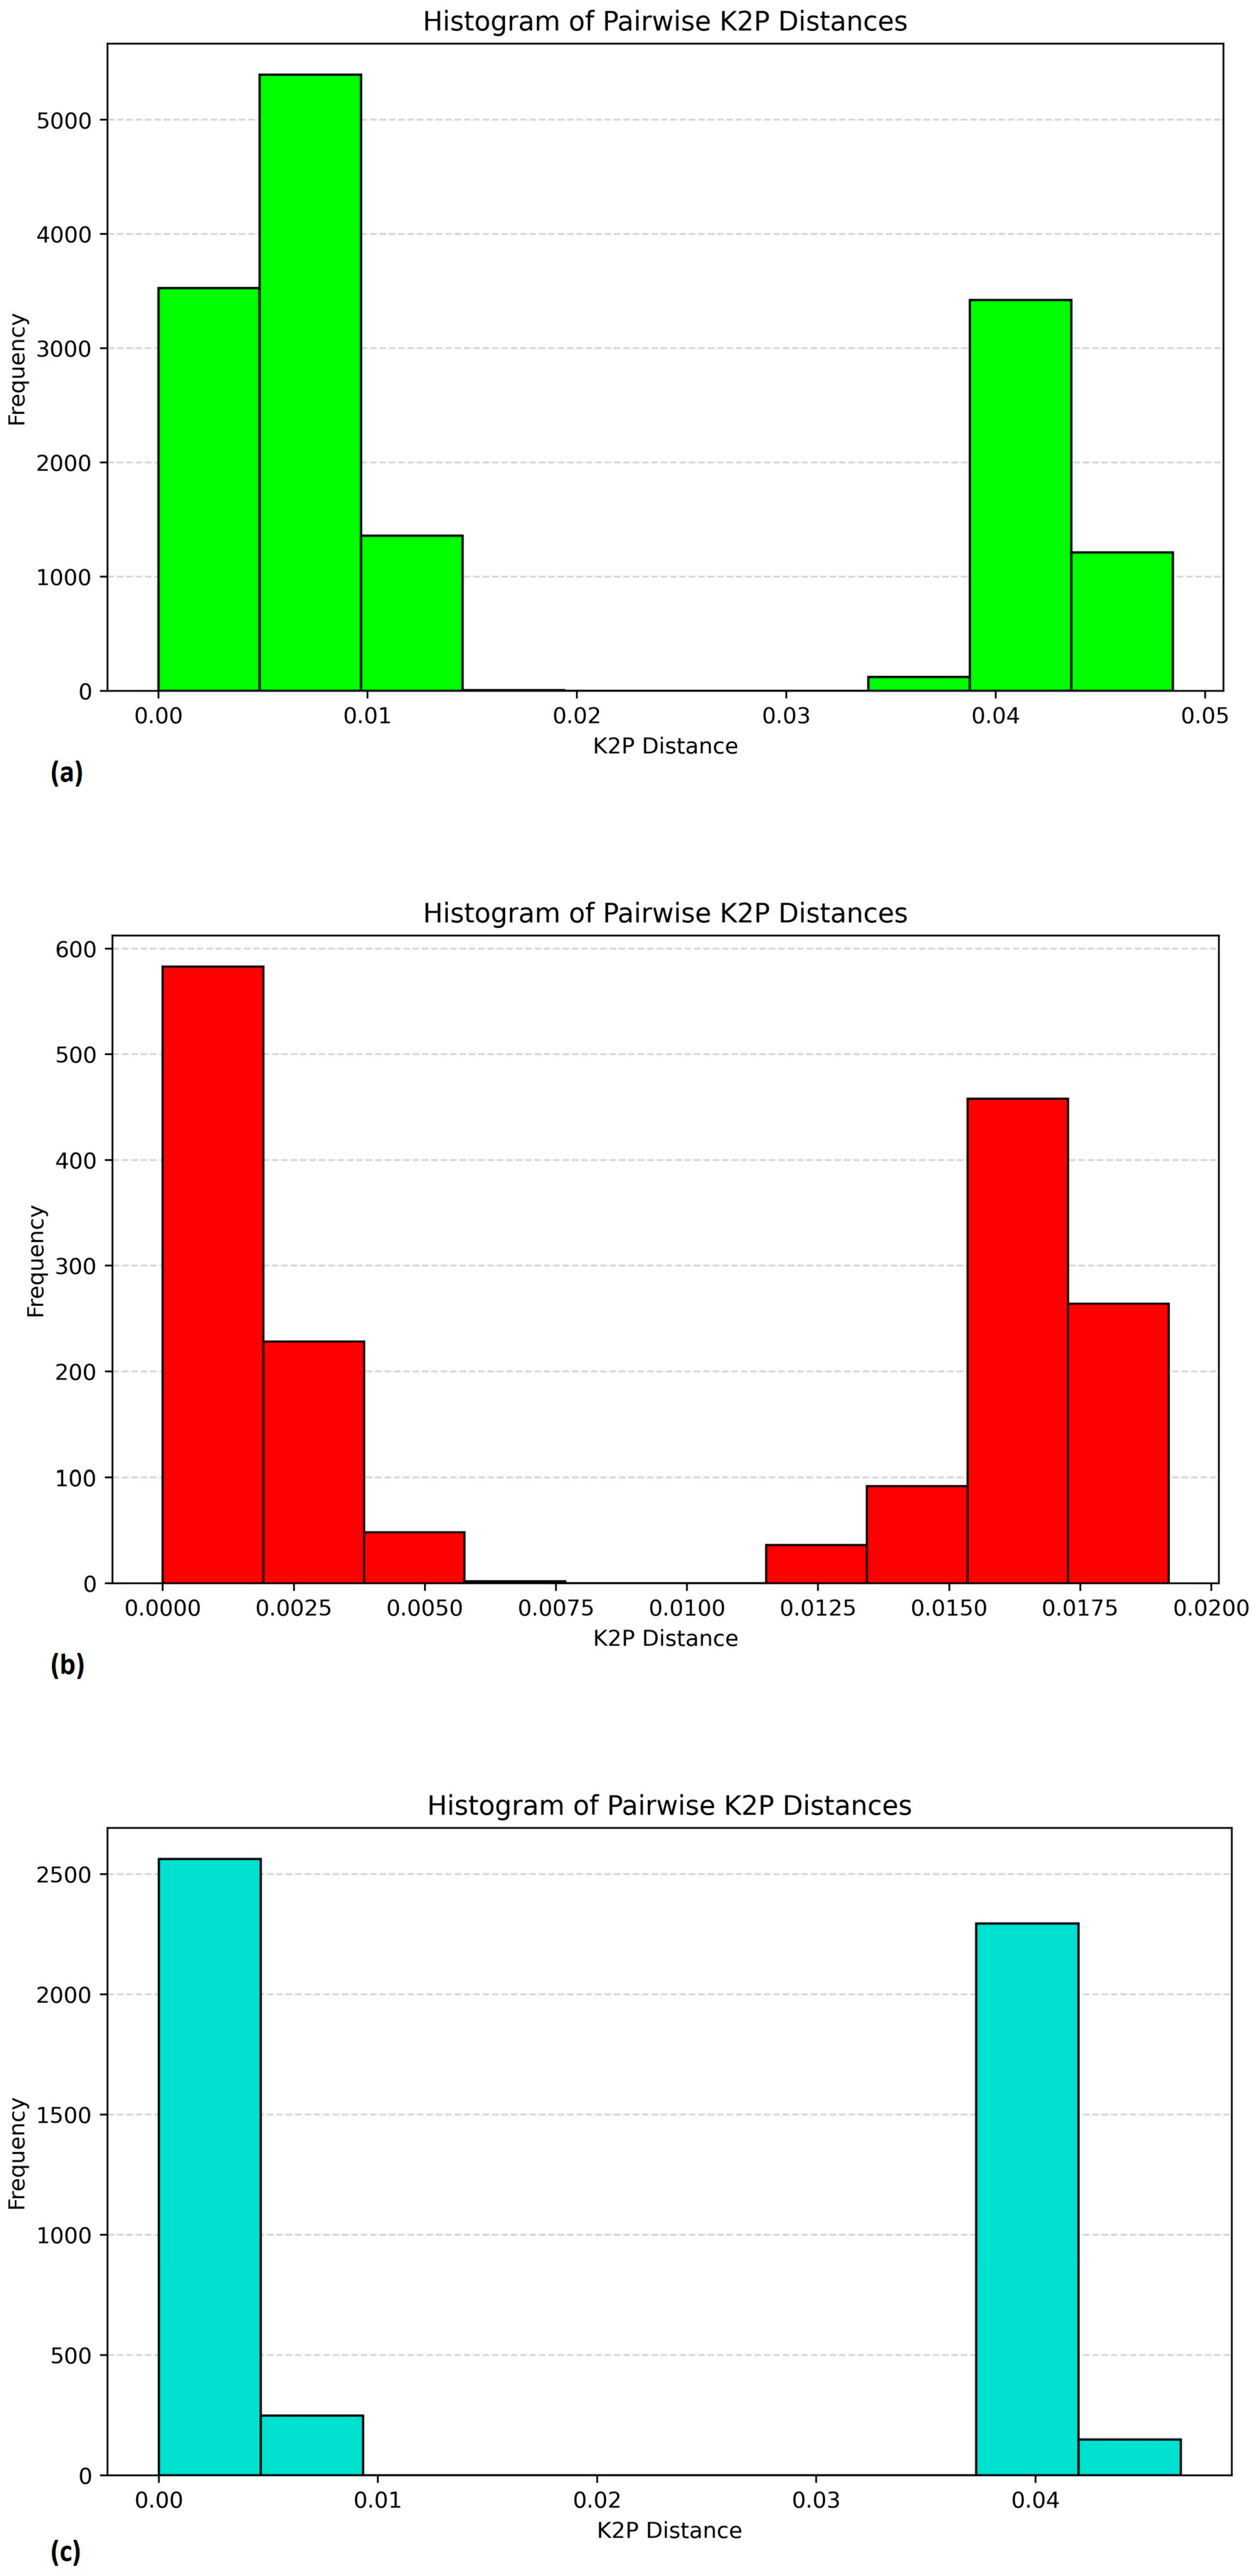
Figure 1. Intra-(left) and interspecific (right) pairwise K2P distances and barcoding gaps in Cystoseira s.s. across the three genetic markers: (a) cox1 (b) rbcL-rbcS (c) ITS2.
Plants 15 02237 g001
Figure 2. Bayesian Inference (BI) and Maximum Likelihood (ML) consensus tree based on the mitochondrial cox1 marker for Cystoseira s.s. Numbers near nodes indicate Bayesian posterior probabilities (left) and ML bootstrap support values (right). Number in parentheses represent the number of identical sequences per haplotype. The complete list of sequences is provided in Supplementary File S1.
Plants 15 02237 g002
Figure 3. Haplotype networks of Cystoseira sensu stricto based on single-locus datasets. (a) ITS2 haplotype network (b) rbcL–rbcS haplotype network (c) cox1 haplotype network, based exclusively on sequences generated in this study. In all networks, each circle represents a unique haplotype, with circle size proportional to haplotype frequency. Small black dots indicate unsampled or inferred intermediate haplotypes. Ticks on the lines connecting haplotypes represent single mutational steps. Haplotypes are colour-coded according to sampling locality, illustrating the geographic distribution of genetic variation within and among lineages. Across all loci, haplotypes cluster into two main groups corresponding to Cystoseira foeniculacea and the C. compressa complex, while internal structure within the C. compressa complex is characterised by shallow divergence and limited haplotype separation.
Plants 15 02237 g003
Figure 4. Bayesian Inference (BI) and Maximum Likelihood (ML) tree based on the plastidial rbcL-rbcS intergenic spacer for Cystoseira s.s. Numbers near the nodes indicate Bayesian posterior probabilities (left) and ML bootstrap support values (right). Number in parentheses represents the number of identical sequences per haplotype. The complete list of sequences is provided in Supplementary File S2.
Plants 15 02237 g004
Figure 5. Bayesian Inference (BI) and Maximum Likelihood (ML) consensus tree based on the nuclear ribosomal ITS2 region for Cystoseira s.s. Numbers near the nodes are Bayesian posterior probabilities (left) and ML bootstrap support values (right). Number in parentheses represents the number of identical sequences per haplotype. The complete list of sequences is provided in Supplementary File S3.
Plants 15 02237 g005
Figure 6. Multilocus Bayesian Inference (BI) and Maximum Likelihood (ML) consensus tree based on the concatenated dataset (ITS2 + rbcL–rbcS + cox1) for Cystoseira s.s. GenBank accession numbers are listed in Table S1. Numbers near nodes indicate Bayesian posterior probabilities (left) and ML bootstrap support values (right).
Plants 15 02237 g006
Figure 7. Cystoseira foeniculacea: (a) habit; (b) slightly protruding apex with small thorns; (c) compressed branches with crenate to denticulate margins and conspicuous midrib; (d) primary branches with numerous thorns; (e) receptacles. Scale bar = 1cm.
Plants 15 02237 g007
Figure 8. Cystoseira compressa var. compressa (a) smooth and prominent apex; (b) winter habit; (c) branches with prominent cryptostomata; (d) spring-summer habit; (e) aerocysts; (f) terminal receptacles. Scale bars = 0.5 cm (a,c,e,f) and 1 cm (d).
Plants 15 02237 g008
Figure 9. Cystoseira compressa var. pustulata (a) habit; (b) smooth and prominent apex; (c) terminal receptacles; (d) branches with prominent cryptostomata; (e) base of cauloids with protuberances from the stumps of deciduous branches. Scale bars = 1 cm (a,c,e) and 0.5 cm (b,d).
Plants 15 02237 g009
Figure 10. Cystoseira morphotype canariensis: (a) habit with secondary branches arising from the upper two-thirds of the primary branches; (b) slightly protruding apex; (c) primary branches with conspicuous pedicellate, truncated cryptostomata; (d) receptacles (arrowhead) and crypts (arrow). Scale bars = 1 cm (a,d) and 0.5 cm (b,c).
Plants 15 02237 g010
Figure 11. Cystoseira morphotype canariensis sections: (a) cryptostomata (arrowhead) and branch (arrow); (b) cryptostomata; (c) receptacle; (d) detail of receptacle. Scale bar = 0.14 mm.
Plants 15 02237 g011
Table 1. Primers used to amplify gDNA, alongside their sequences, references and PCR conditions.
Primer NamePrimer Sequence 5′→3′Amplicon Length (bp)SourceThermal Profiles
COI_CYSTOsl_F/COI_CYSTOsl_RF: 5′-GGTACMGCGATGTCYGTTCT-3′
R: 5′-TGNCCTAAAATYTCHGGATA-3′
1140This study 95 °C 1′; 40 cycles: 95 °C 15″, 55 °C 30″, 72 °C 1′; 72 °C 5′
rbcLRH3F/rbcS139RF: 5′-TTAAYTCTCARCCDTTYATGCG-3′
R: 5′-AGACCCCATAATTCCCAATA-3′
1155[45,46]95 °C 1′; 40 cycles: 95 °C 15″, 52 °C 20″, 72 °C 1′; 72 °C 5′
5.8S BF/25 BR2F: 5′-GATGAAGAACGCAGCGAAATGCGAT-3′
R: 5′-TCCTCCGCTTAGTTATATGCTTAA-3′
467[47]95 °C 1′; 33 cycles: 95 °C 15″, 62 °C 20″, 72 °C 30″; 72 °C 5′
Table 2. Results of species delimitation methods. The table reports the number of putative species inferred from each marker using ABGD/ASAP, PTP, and GMYC.
ABGD/ASAPPTPGMYC
JC69K80MLBayesSCSYRCRY
ITS222221111
rbcL-rbcS22222222
cox122225555
JC69: Jukes-Cantor distance; K80: Kimura two-parameter distance; PTP ML: Maximum Likelihood partition; PTP Bayes: Bayesian partition with highest posterior support; GMYC S/R: strict or relaxed molecular clock; C/Y: coalescent (constant size) or Yule tree prior.
Disclaimer/Publisher’s Note: The statements, opinions and data contained in all publications are solely those of the individual author(s) and contributor(s) and not of MDPI and/or the editor(s). MDPI and/or the editor(s) disclaim responsibility for any injury to people or property resulting from any ideas, methods, instructions or products referred to in the content.