1. Introduction
Climate change and ongoing desertification are among the most critical global environmental challenges, profoundly affecting ecosystem stability, agricultural productivity, and food security [
1,
2]. Arid and semi-arid regions are particularly vulnerable due to low precipitation, high evapotranspiration, and poor soil fertility [
3,
4]. In Central Asia, especially in Kazakhstan, deserts and semi-deserts occupy more than 50% of the national territory, making sustainable agriculture extremely challenging [
5]. These fragile ecosystems are highly sensitive to climatic fluctuations, and their degradation leads to reduced vegetation cover, increased soil erosion, and declining agricultural outputs [
6]. Consequently, there is an urgent need to identify resilient plant species capable of both ecological restoration and agricultural utilization in arid environments.
A prominent representative of these desert ecosystems is
Agriophyllum squarrosum (L.) Moq., an annual psammophytic species commonly referred to as sand rice, which flourishes across the arid landscapes of Central Asia, northern China, and Mongolia [
7,
8]. The species is characterized by high levels of environmental plasticity, enabling persistence in habitats defined by hyperaridity, steep thermal gradients, and frequent aeolian sand deposition [
9,
10]. It functions as a pioneer species on mobile dunes, where its biomass can reduce wind velocity by up to 90%, thereby contributing to sand stabilization and ecosystem restoration [
11]. Moreover, its extensive root system, with lateral roots reaching up to 5 m in length, enhances soil structure and nutrient cycling in otherwise infertile sandy soils [
8]. These ecological functions position
A. squarrosum as a key species for combating desertification and restoring degraded landscapes [
12].
In addition to its ecological importance, sand rice has gained increasing attention as a potential food crop for arid and marginal lands [
13]. Its seeds possess a highly favorable nutritional profile, combining relatively high protein, lipid, and carbohydrate contents. Specifically, sand rice seeds contain approximately 23.2% protein, 9.7% lipids, and up to 45% carbohydrates (dry weight) [
14]. Other reports indicate similar values, with about 23% protein, 9% lipids, 45% carbohydrates, 8% crude fiber, and 5% ash, highlighting its balanced composition [
15,
16]. This nutrient composition is comparable to that of legumes in protein content while maintaining caloric values similar to those of cereals, making sand rice a unique pseudocereal with dual nutritional advantages [
17].
Previous studies have reported the presence of numerous essential and non-essential amino acids in
A. squarrosum seeds, highlighting their nutritional potential [
13,
14,
15]. However, the present study was not designed to provide a comprehensive amino acid characterization and therefore focuses only on amino acids reliably quantified above the analytical LOQ.
Despite these advantageous properties,
A. squarrosum remains largely undomesticated. Although it has been consumed for over 1300 years in parts of Central Asia and China, its cultivation has not been systematically improved. Several agronomic constraints hinder its domestication, including small seed size (typically 1.3–2.0 mm in length), seed shattering, asynchronous maturation, and variable yield. Under natural conditions, the seed yield of sand rice ranges from 21 to 66 kg/ha [
14,
18]. Even though breeding efforts have demonstrated that the yield of selected wild sand rice millet in the Tengger Desert can reach 1281 kg/ha [
19], these improvements remain limited and inconsistent across environments. Therefore, further research is needed to identify and select superior genotypes with improved morphological and biochemical traits.
Seed morphometric parameters are a critical component of domestication and adaptation. Traits such as seed size, shape, and mass influence dispersal, germination, and seedling establishment, particularly in desert environments where successful recruitment depends on rapid responses to sporadic rainfall events [
10]. In
A. squarrosum, seeds are small, lightweight, and adapted for wind dispersal, reflecting their ecological strategy as a pioneer species. However, significant intraspecific variation in seed morphometric traits has been reported across populations, suggesting high phenotypic plasticity and potential for selection [
10]. Understanding this variability is essential for identifying desirable traits for breeding, particularly those associated with increased seed size and yield.
Equally important is the biochemical composition of seeds, which determines their nutritional quality and potential applications. In addition to proteins and lipids, sand rice seeds contain starch (approximately 43.85% of seed weight) and a wide range of bioactive compounds, including phenolic acids and flavonoids [
15]. Metabolomic analyses have identified more than 400 metabolites, including amino acids, fatty acids, organic acids, and antioxidants [
15]. These compounds contribute not only to nutritional value but also to health-promoting properties, such as antioxidant and anti-inflammatory effects. However, most studies have focused on individual aspects of seed composition, and comprehensive analyses integrating morphometric and biochemical traits remain limited.
In Kazakhstan and Central Asia, this knowledge gap is particularly pronounced. Although the region represents a major part of the natural distribution of
A. squarrosum, studies on its phenotypic and biochemical diversity remain scarce. Given the environmental heterogeneity of the region—including variations in temperature, precipitation, and soil properties—natural populations are expected to exhibit substantial variation in morphometric and biochemical traits. Recent molecular assessments support this potential: DNA barcoding using ITS and
matK markers has confirmed species identity while revealing distinct genetic partitions among geographically distant Kazakh populations, including those separated by up to 1300 km in the western and southeastern regions [
8]. Furthermore, the development of novel polymorphic SSR markers has facilitated high-resolution interspecific and intraspecific analyses, demonstrating clear segregation between
A. squarrosum and the sympatric
Agriophyllum minus Fisch. & C.A. Mey. While current data indicate high interspecific but relatively low intraspecific genetic diversity, the identification of these informative loci provides a critical framework for population structure analysis [
20]. Such genetic and biochemical variation represents a valuable resource for selection and breeding, particularly in the development of climate-resilient crops with nutritional profiles—characterized by high lipid and protein content—comparable to legumes and wheat.
Recent studies highlight the need to integrate morphological and biochemical traits to support the domestication of underutilized species such as sand rice. Understanding relationships between seed size and nutrient composition is essential for selecting genotypes with high yield, nutritional quality, and stress tolerance.
This study provides a comprehensive analysis of seed traits in A. squarrosum, with particular emphasis placed on seed morphometric traits, amino acid profiles, total protein, and moisture contents. Intraspecific variation and regional adaptation were assessed using natural populations sourced from across Kazakhstan. Significant variability among these populations is expected, and variation in nutritional characteristics was evaluated among populations.
The specific objectives of this study were (i) to characterize the variability of seed morphometric traits in A. squarrosum populations from three regions of Kazakhstan; (ii) to determine seed biochemical composition, including total protein, moisture content, and amino acid profiles, and evaluate their nutritional quality; (iii) to investigate the relationships between seed morphometric and biochemical traits; and (iv) to identify promising populations for potential domestication and breeding programs.
2. Results
2.1. Study Area and Environmental Conditions
The sampled populations of
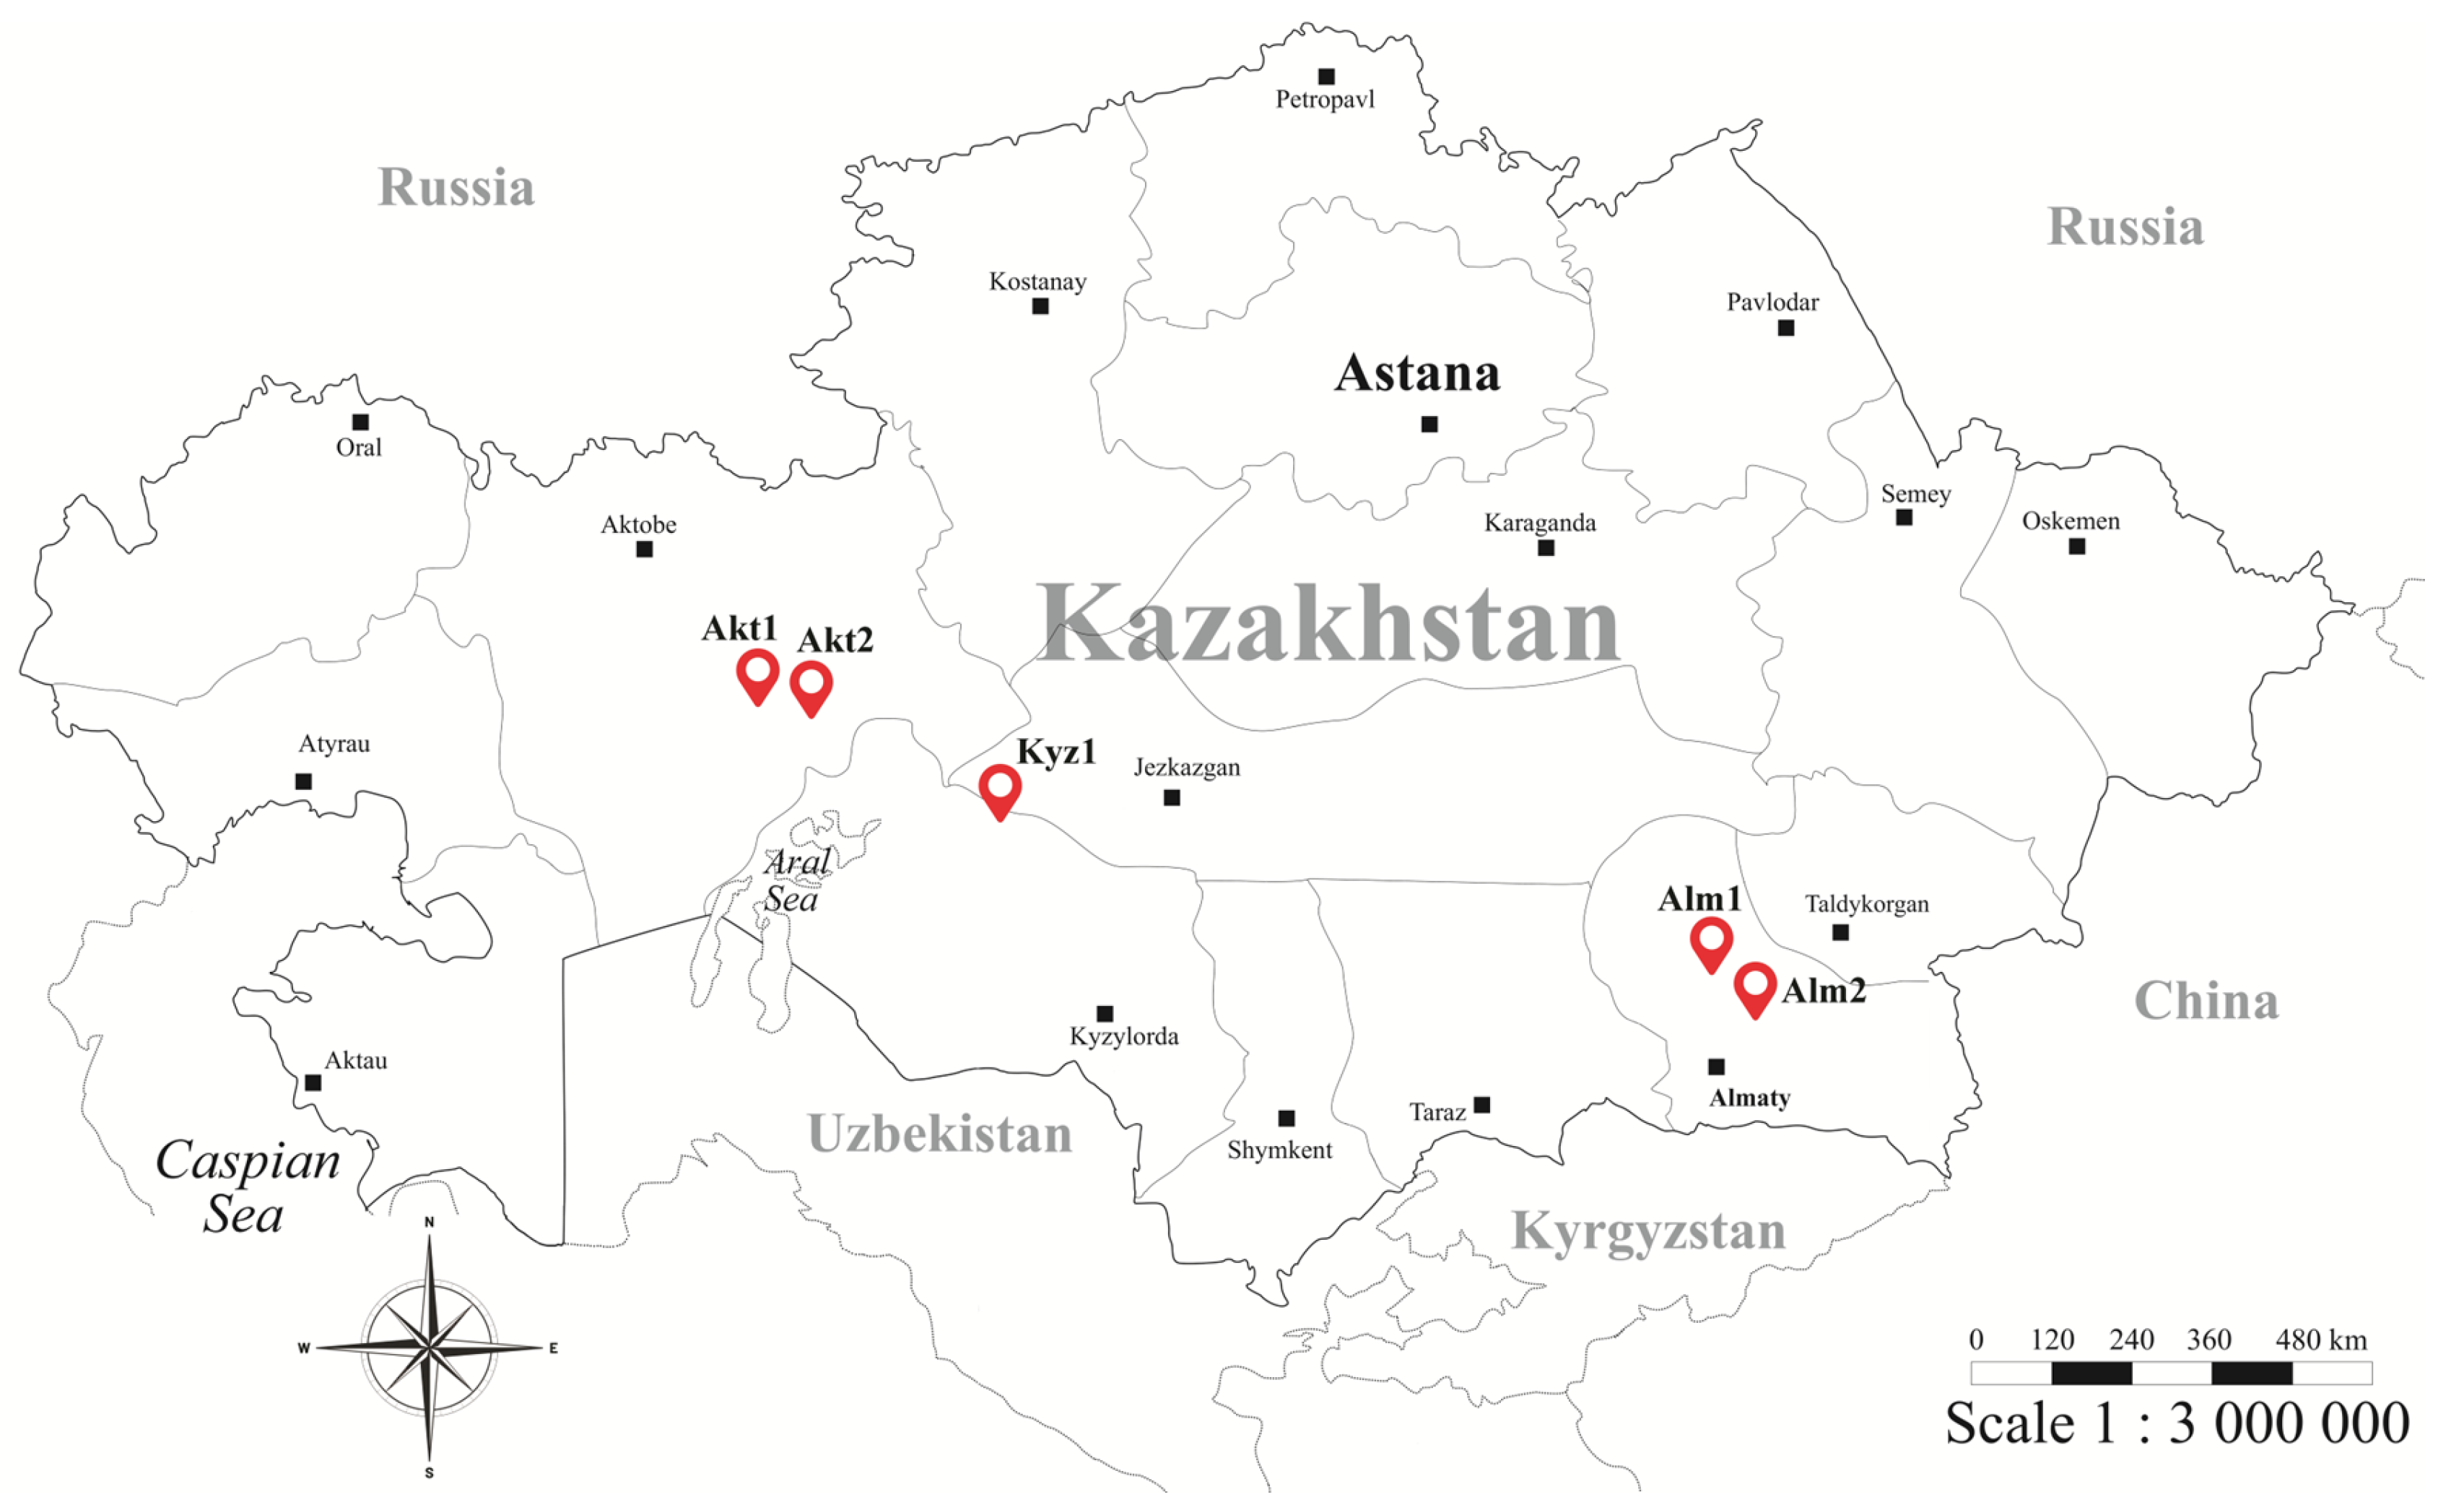
A. squarrosum were distributed across three regions of Kazakhstan: Aktobe, Almaty, and Kyzylorda. Sampling sites were geographically distinguished, spanning western, southeastern, and southern Kazakhstan, respectively (
Figure 1).
In total, 34 individual plant accessions were collected from five populations: 7 from Akt1, 7 from Akt2, 6 from Alm1, 6 from Alm2, and 8 from Kyz1. Climatic conditions were recorded during the 2025 growing season for each population, when the studied plants completed their life cycle (
Table 1).
The five A. squarrosum sampling sites displayed distinct seasonal patterns in temperature and precipitation. Mean annual temperature (MAT) ranged from +5.1 °C at Akt1 to +9.1 °C at Kyz1, with the coldest conditions in January and the warmest in July. Mean annual precipitation (MAP) varied from 107.5 mm at Kyz1 to 138.4 mm at Alm2, following a bimodal distribution with spring peaks (mainly April–May) and increased moisture in late autumn and winter. The summer months were markedly arid, with the lowest rainfall, especially in July and August.
2.2. Seed Morphometric Variation
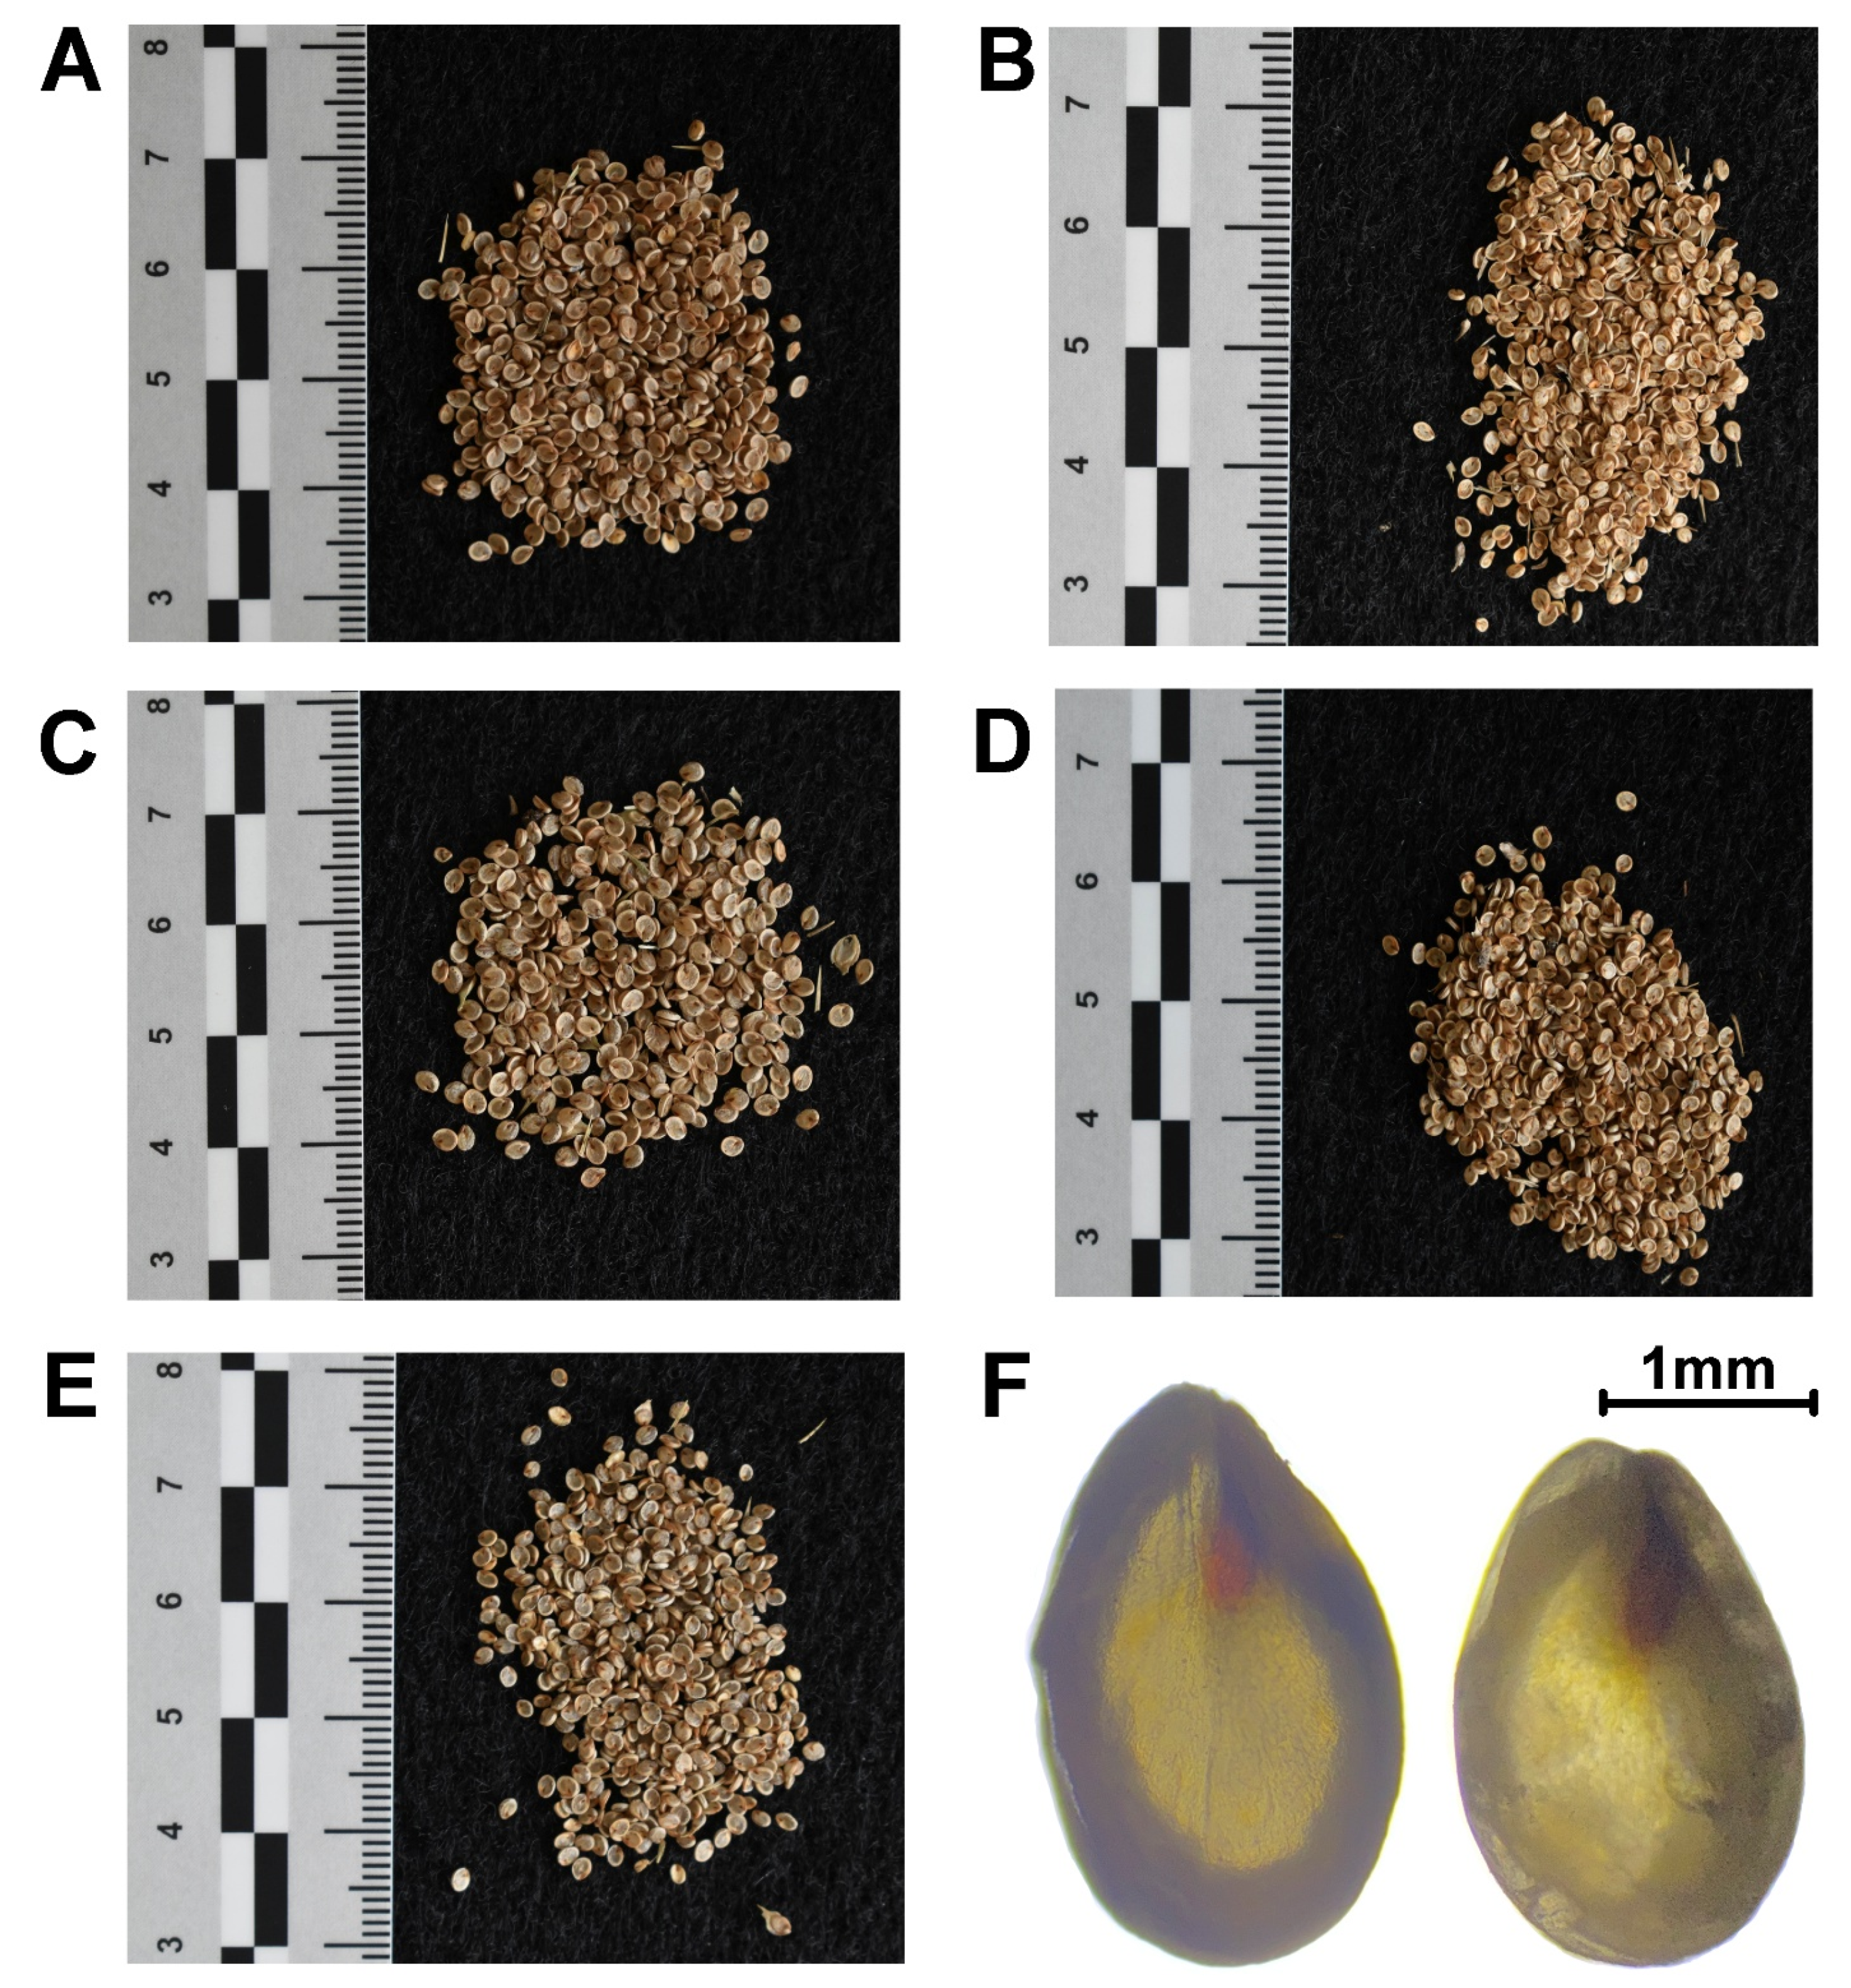
Visual inspection of the
A. squarrosum seed samples across the five study sites revealed a consistent light-brown coloration and a uniform surface texture (
Figure 2A–E). The seeds from all populations exhibited the characteristic oval-to-elliptical morphology typical of the species, with a distinct, slightly translucent outer coat and a well-defined internal structure (
Figure 2F).
Despite this overall morphological uniformity, seeds of
A. squarrosum showed pronounced morphometric differentiation in all measured traits (
Table 2). Morphometric values presented in
Table S1 correspond to accession-level means calculated from measurements of 100–150 seeds per accession.
Across the entire dataset, seed length ranged from 1.87 to 2.67 mm, with a mean of 2.13 mm and moderate variability (CV = 9.84%). Seed width varied from 1.51 to 2.02 mm, with a mean of 1.71 mm and relatively low variability (CV = 7.09%). Seed circularity exhibited the lowest variation among traits (CV = 4.71%), with values ranging from 1.10 to 1.25, indicating a generally stable seed shape. In contrast, thousand-seed weight (TSW) showed the highest variability (CV = 17.98%), ranging from 1.22 to 2.54 g, reflecting substantial differences in seed mass among populations.
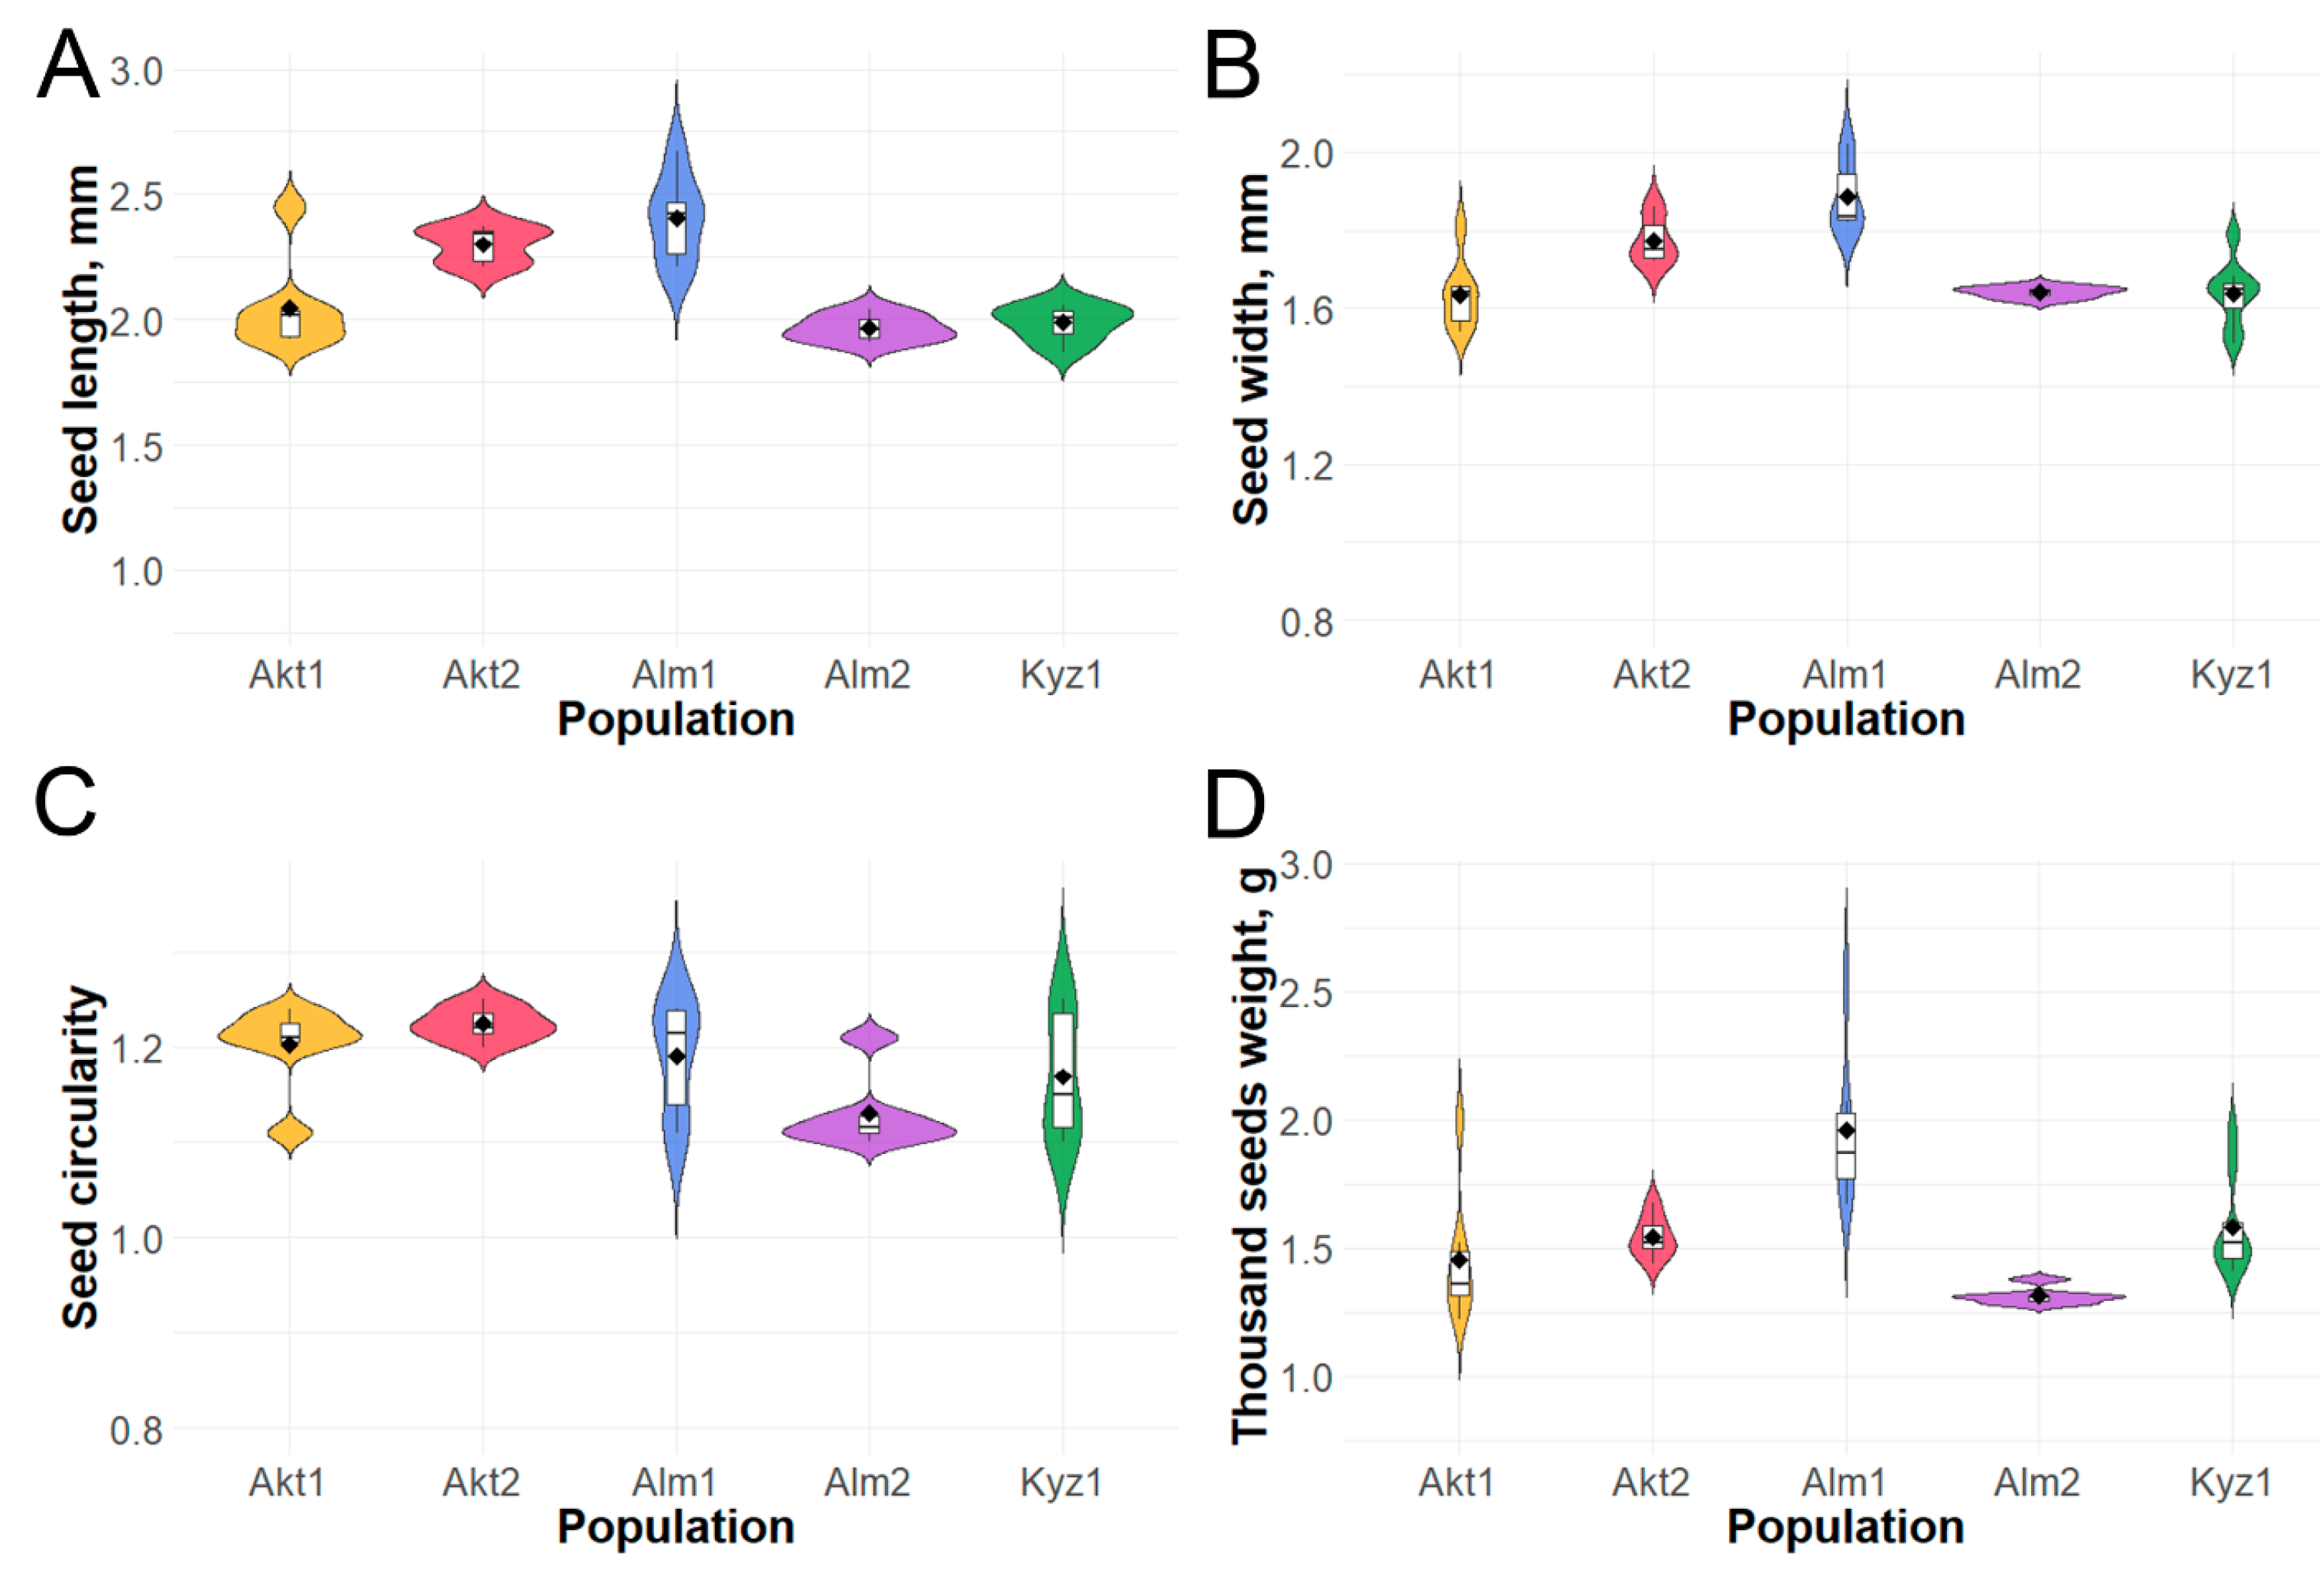
At the population level, seed length ranged from 1.9 to 2.7 mm, with Alm1 showing the greatest median length (2.4 mm) and considerable within-population spread, while Akt1, Alm2, and Kyz1 had the lowest median values (2.0 mm) with moderate dispersion (
Figure 3A).
Seed width ranged from 1.5 to 2.0 mm across all populations, with Alm1 displaying the highest median (1.8 mm) and Akt1 the lowest (1.6 mm); all populations showed relatively symmetrical distributions without extreme outliers (
Figure 3B). Seed circularity medians were consistently high across populations, particularly in Akt1 and Akt2 (1.2), indicating limited variation in seed shape (
Figure 3C). TSW ranged from 1.1 g (Akt1) to 2.7 g (Alm1), with Alm1 displaying both the highest median and the greatest variance, whereas Alm2 showed the most compact distribution (
Figure 3D).
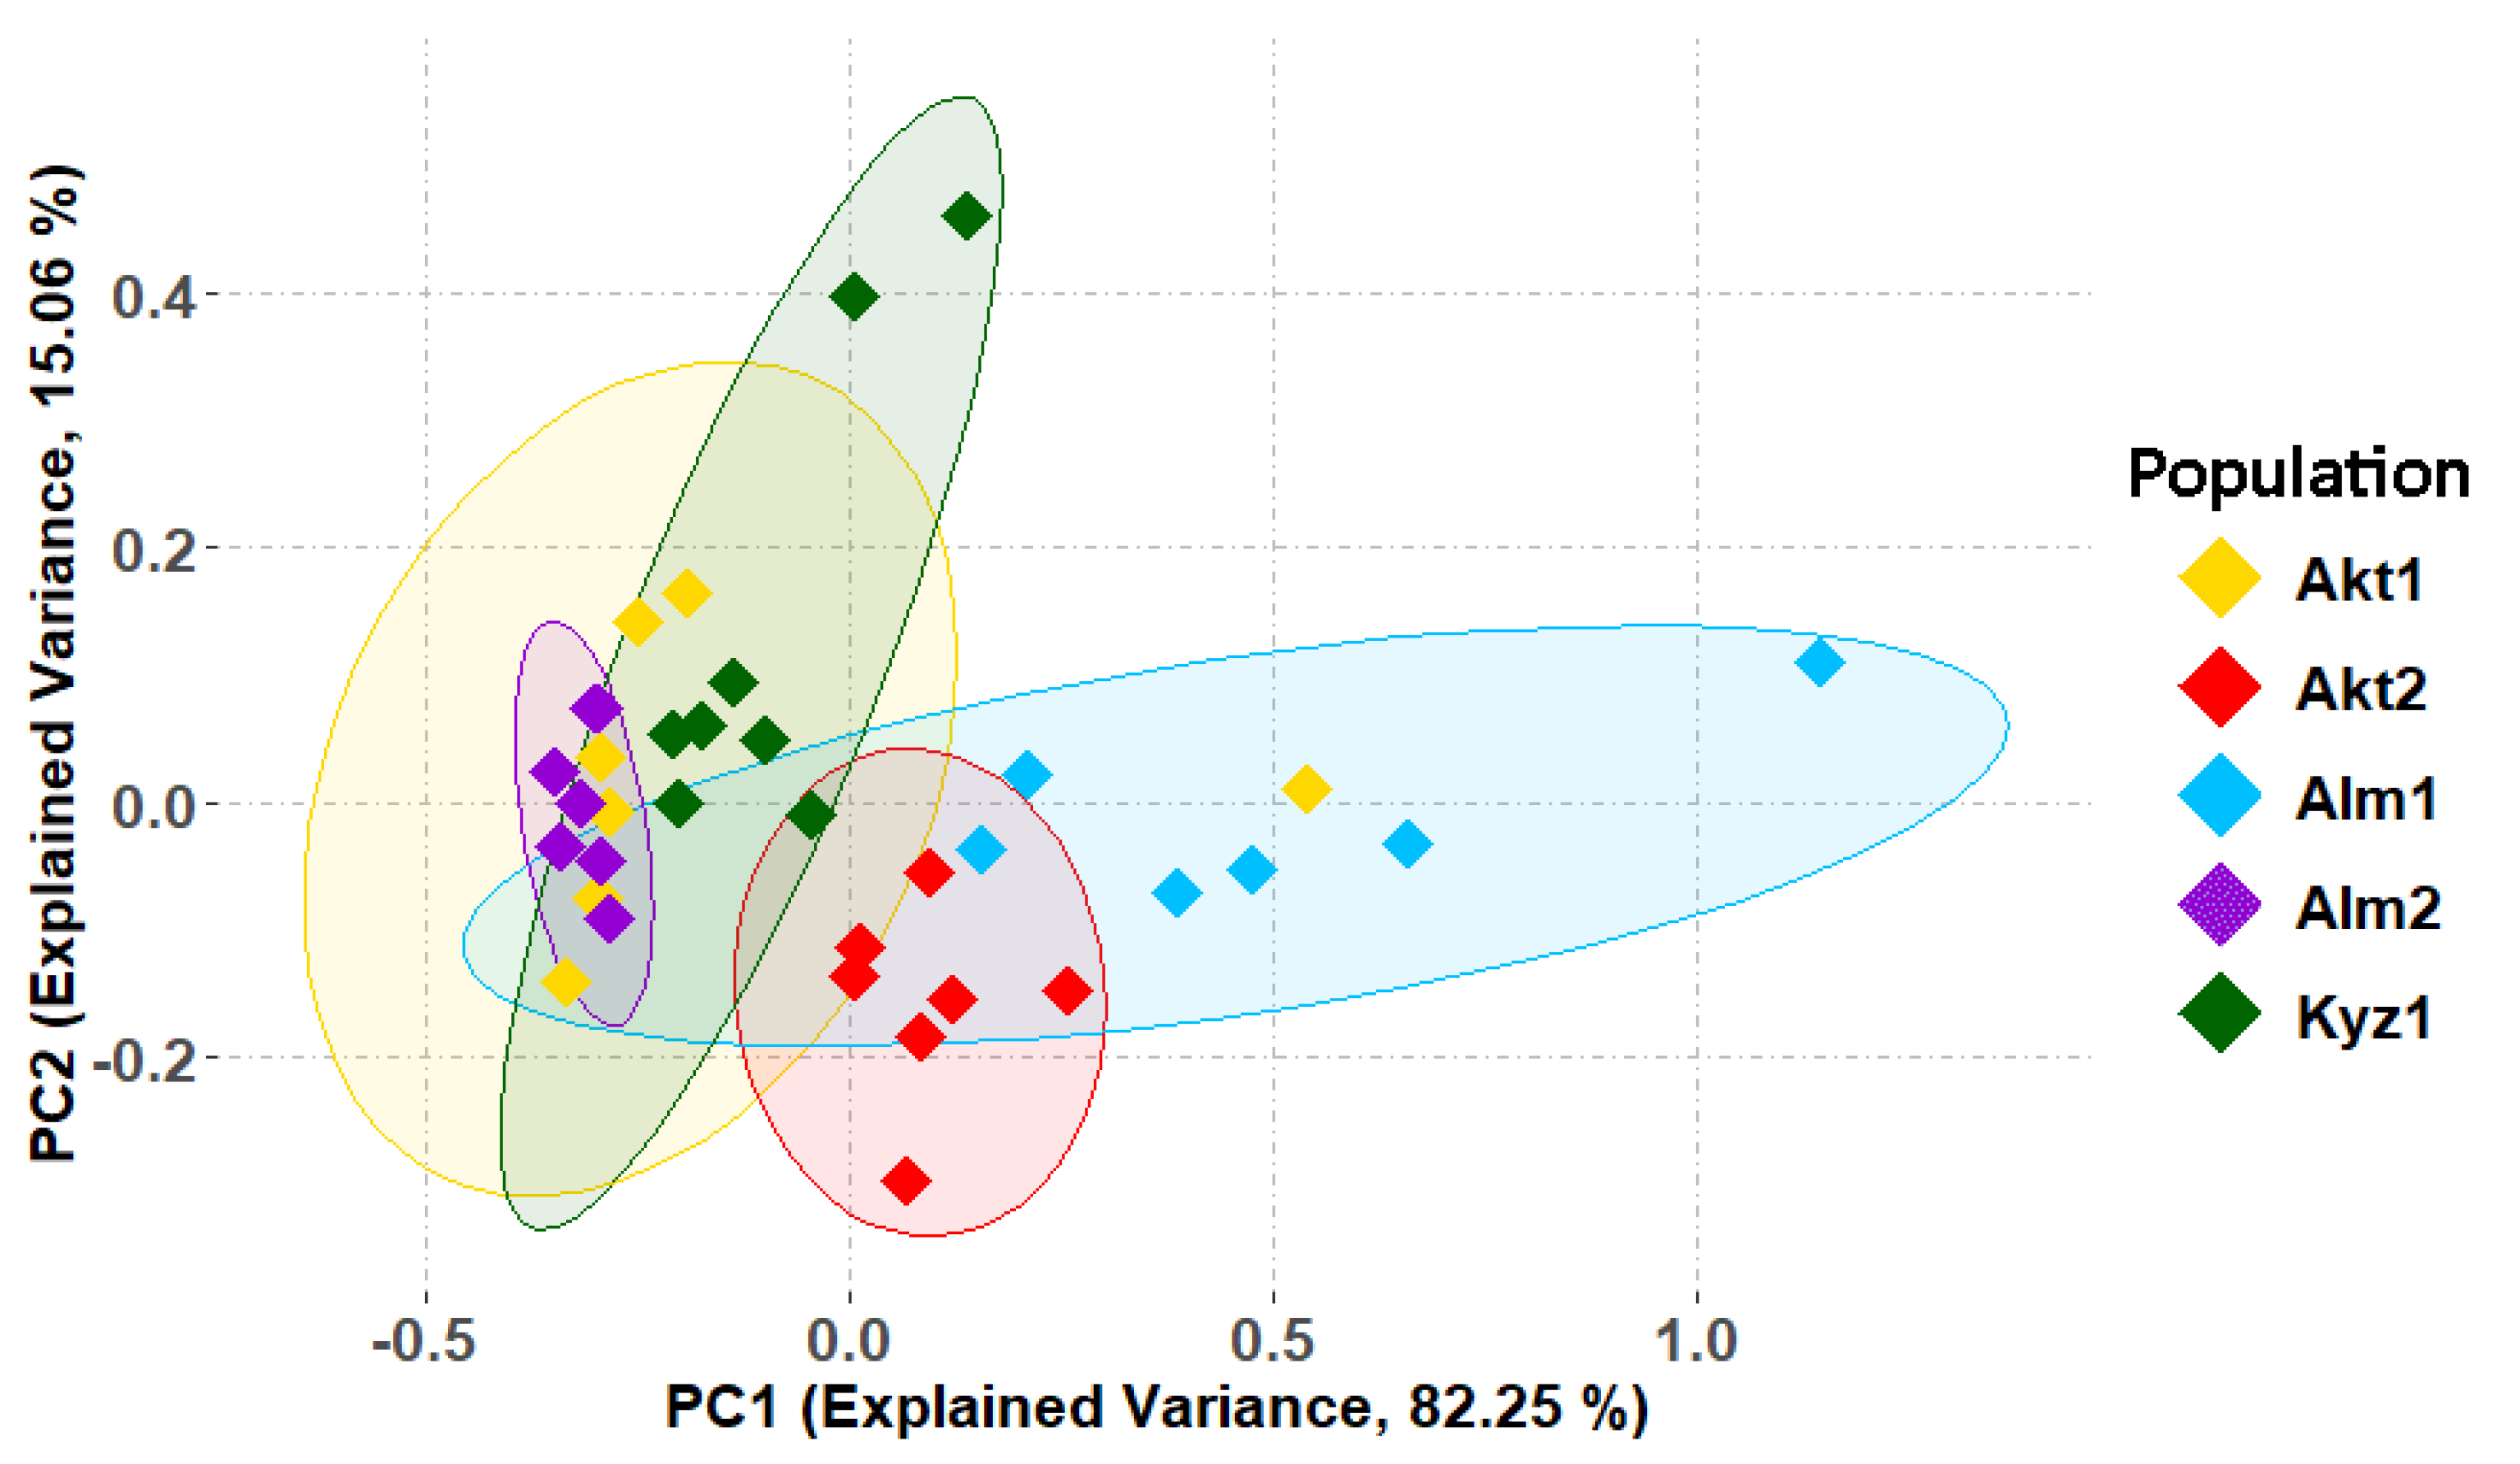
Principal component analysis (PCA) of the four morphometric traits revealed that PC1 accounted for 82.25% of the total variance, while PC2 explained an additional 15.06%, together capturing 97.31% of the total variance (
Figure 4).
Along PC1, the populations showed clear separation: Alm1 and Akt2 were positioned toward positive values, indicating distinct morphometric profiles compared to the other groups. Conversely, Alm2 and the majority of Akt1 and Kyz1 individuals clustered within the negative PC1 region. Along PC2, most samples remained near the zero axis, though two Kyz1 individuals were distinctly elevated toward the positive extreme, and one Akt2 individual showed a notable negative deviation. Overall, the high cumulative variance explained by the first two axes indicates strong differentiation based on seed morphometric traits. The separation among populations observed in the PCA ordination was further supported by PERMANOVA, which revealed highly significant morphometric differentiation among populations (R2 = 0.597, F = 10.735, p = 0.001).
2.3. Seed Biochemical Variation
The seed biochemical profile of
A. squarrosum was characterized across five populations, with a focus on moisture content, total protein content, and amino acid composition. Out of the 20 standard amino acids analyzed, five were consistently detected above the quantification limit across samples (
Table S2). Descriptive statistics for biochemical traits revealed substantial variation among the components analyzed (
Table 3).
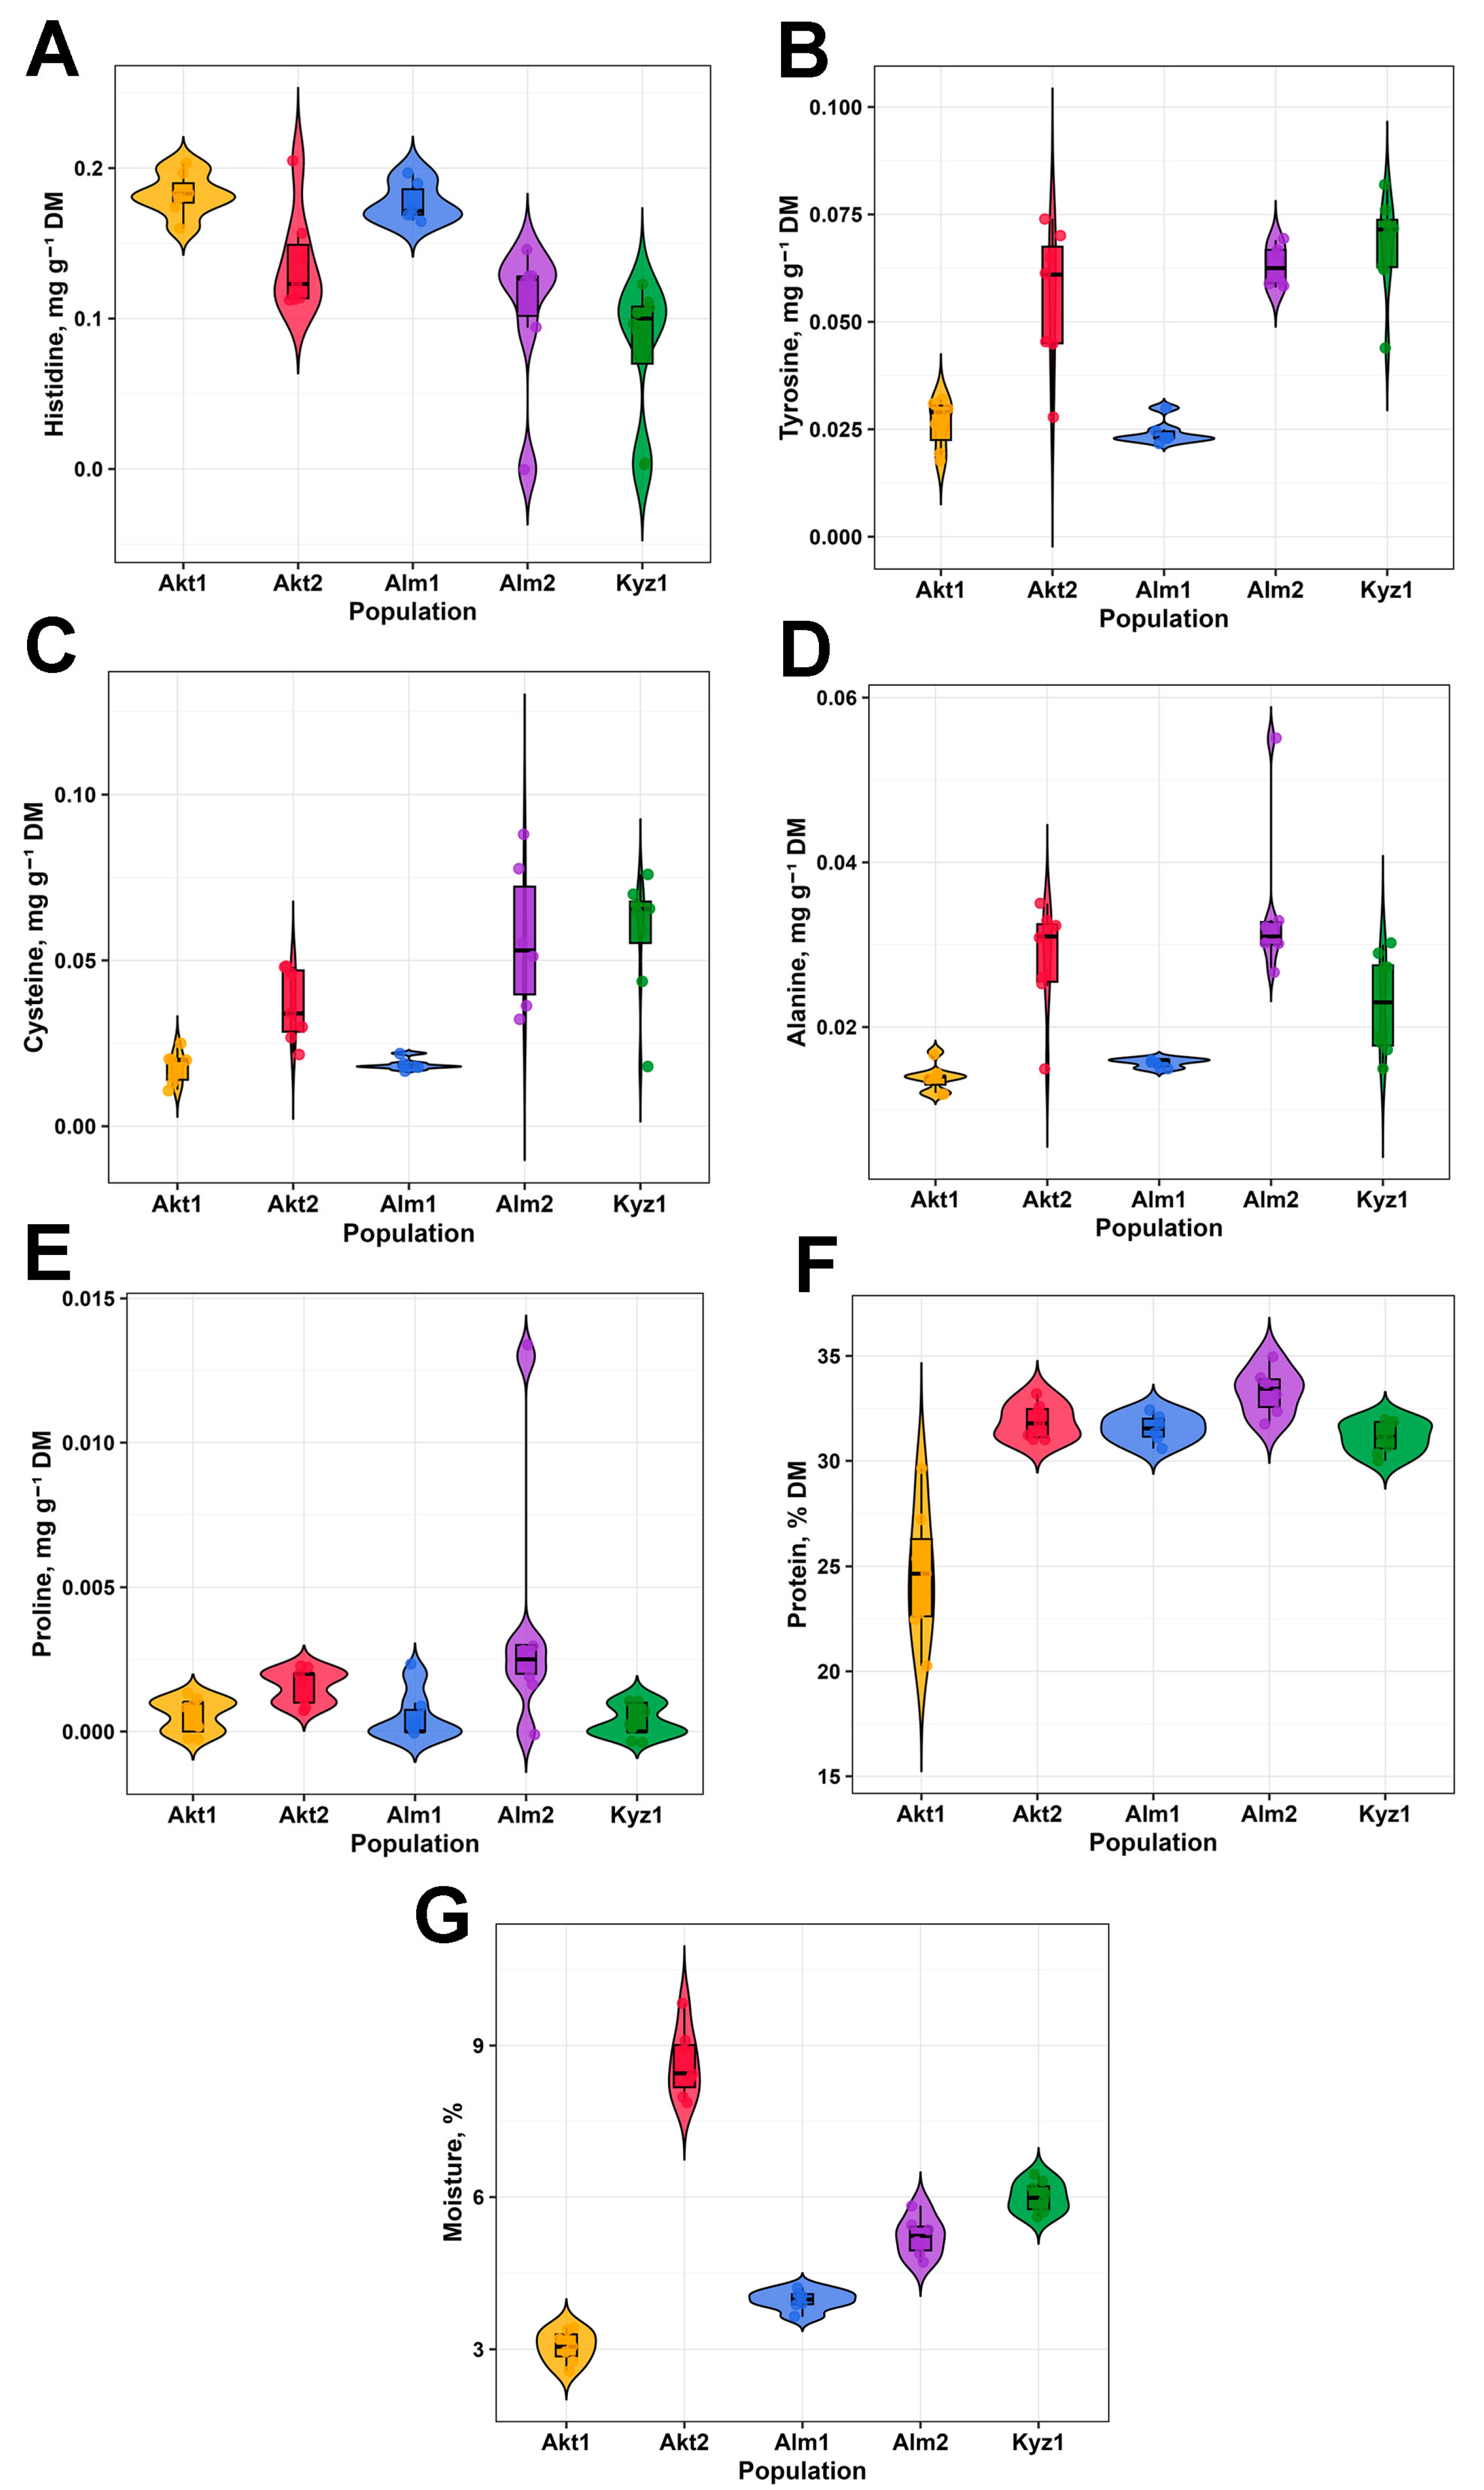
Among the amino acids quantified above the analytical LOQ, histidine showed the highest mean concentration (0.134 mg g−1 DM), followed by tyrosine (0.048 mg g−1), cysteine (0.038 mg g−1 DM), alanine (0.023 mg g−1 DM), and proline (0.001 mg g−1 DM). Variability differed markedly among amino acids, with cysteine (CV = 58.3%) and tyrosine (CV = 43.41%) showing high dispersion, and alanine also exhibiting considerable variability (CV = 41.5%). Histidine was comparatively more stable (CV = 40.23%). Proline displayed extremely high relative variability (CV = 174.9%). However, this value should be interpreted with caution because proline was present at trace or near-detection levels in most samples. Among non-amino acid traits, total protein content showed relatively low variability (CV = 11.29%), whereas moisture content was more variable (CV = 36.86%), indicating differences in seed water status among populations.
At the population level, histidine (
Figure 5A) exhibited the highest concentrations, with medians ranging from 0.183 mg g
−1 DM in Akt1 and Alm1 to 0.177 mg g
−1 DM mg g
−1 in Akt1.
Tyrosine (
Figure 5B) showed intermediate levels, reaching the highest medians in Kyz1 and Alm2 (>0.06 mg g
−1 DM) and the lowest in Alm1 (0.02 mg g
−1 DM). Cysteine (
Figure 5C) followed a similar pattern, with the highest median in Kyz1 (0.058 mg g
−1 DM), whereas Akt1 and Alm1 exhibited the lowest values (<0.020 mg g
−1 DM). Alanine (
Figure 5D) concentrations ranged from 0.014 mg g
−1 DM in Akt1 to 0.035 mg g
−1 DM in Alm2, with the greatest variability observed in Akt2 and Alm2. Proline (
Figure 5E) occurred at trace concentrations among the detected amino acids (<0.005 mg g
−1 DM), with values remaining close to the analytical detection threshold in most samples. Alm2 showed the highest median and widest distribution, whereas Akt1, Alm1, and Kyz1 exhibited near-zero values.
Total protein content (
Figure 5F) was relatively high in Akt2, Alm1, Alm2, and Kyz1, with median values ranging from 31.121% DM to 33.318% DM, whereas Akt1 exhibited a lower median (24.627% DM) and greater variability (20.26–29.64% DM). Seed moisture content (
Figure 5G) varied substantially among populations, from 3.1% in Akt1 to 8.5% in Akt2, with intermediate median values in Alm1 (4.0%), Alm2 (5.2%), and Kyz1 (6.0%), all of which showed relatively low within-population variance. Overall, these results demonstrate pronounced inter-population differentiation in seed biochemical traits, reflecting distinct metabolic profiles among
A. squarrosum populations.
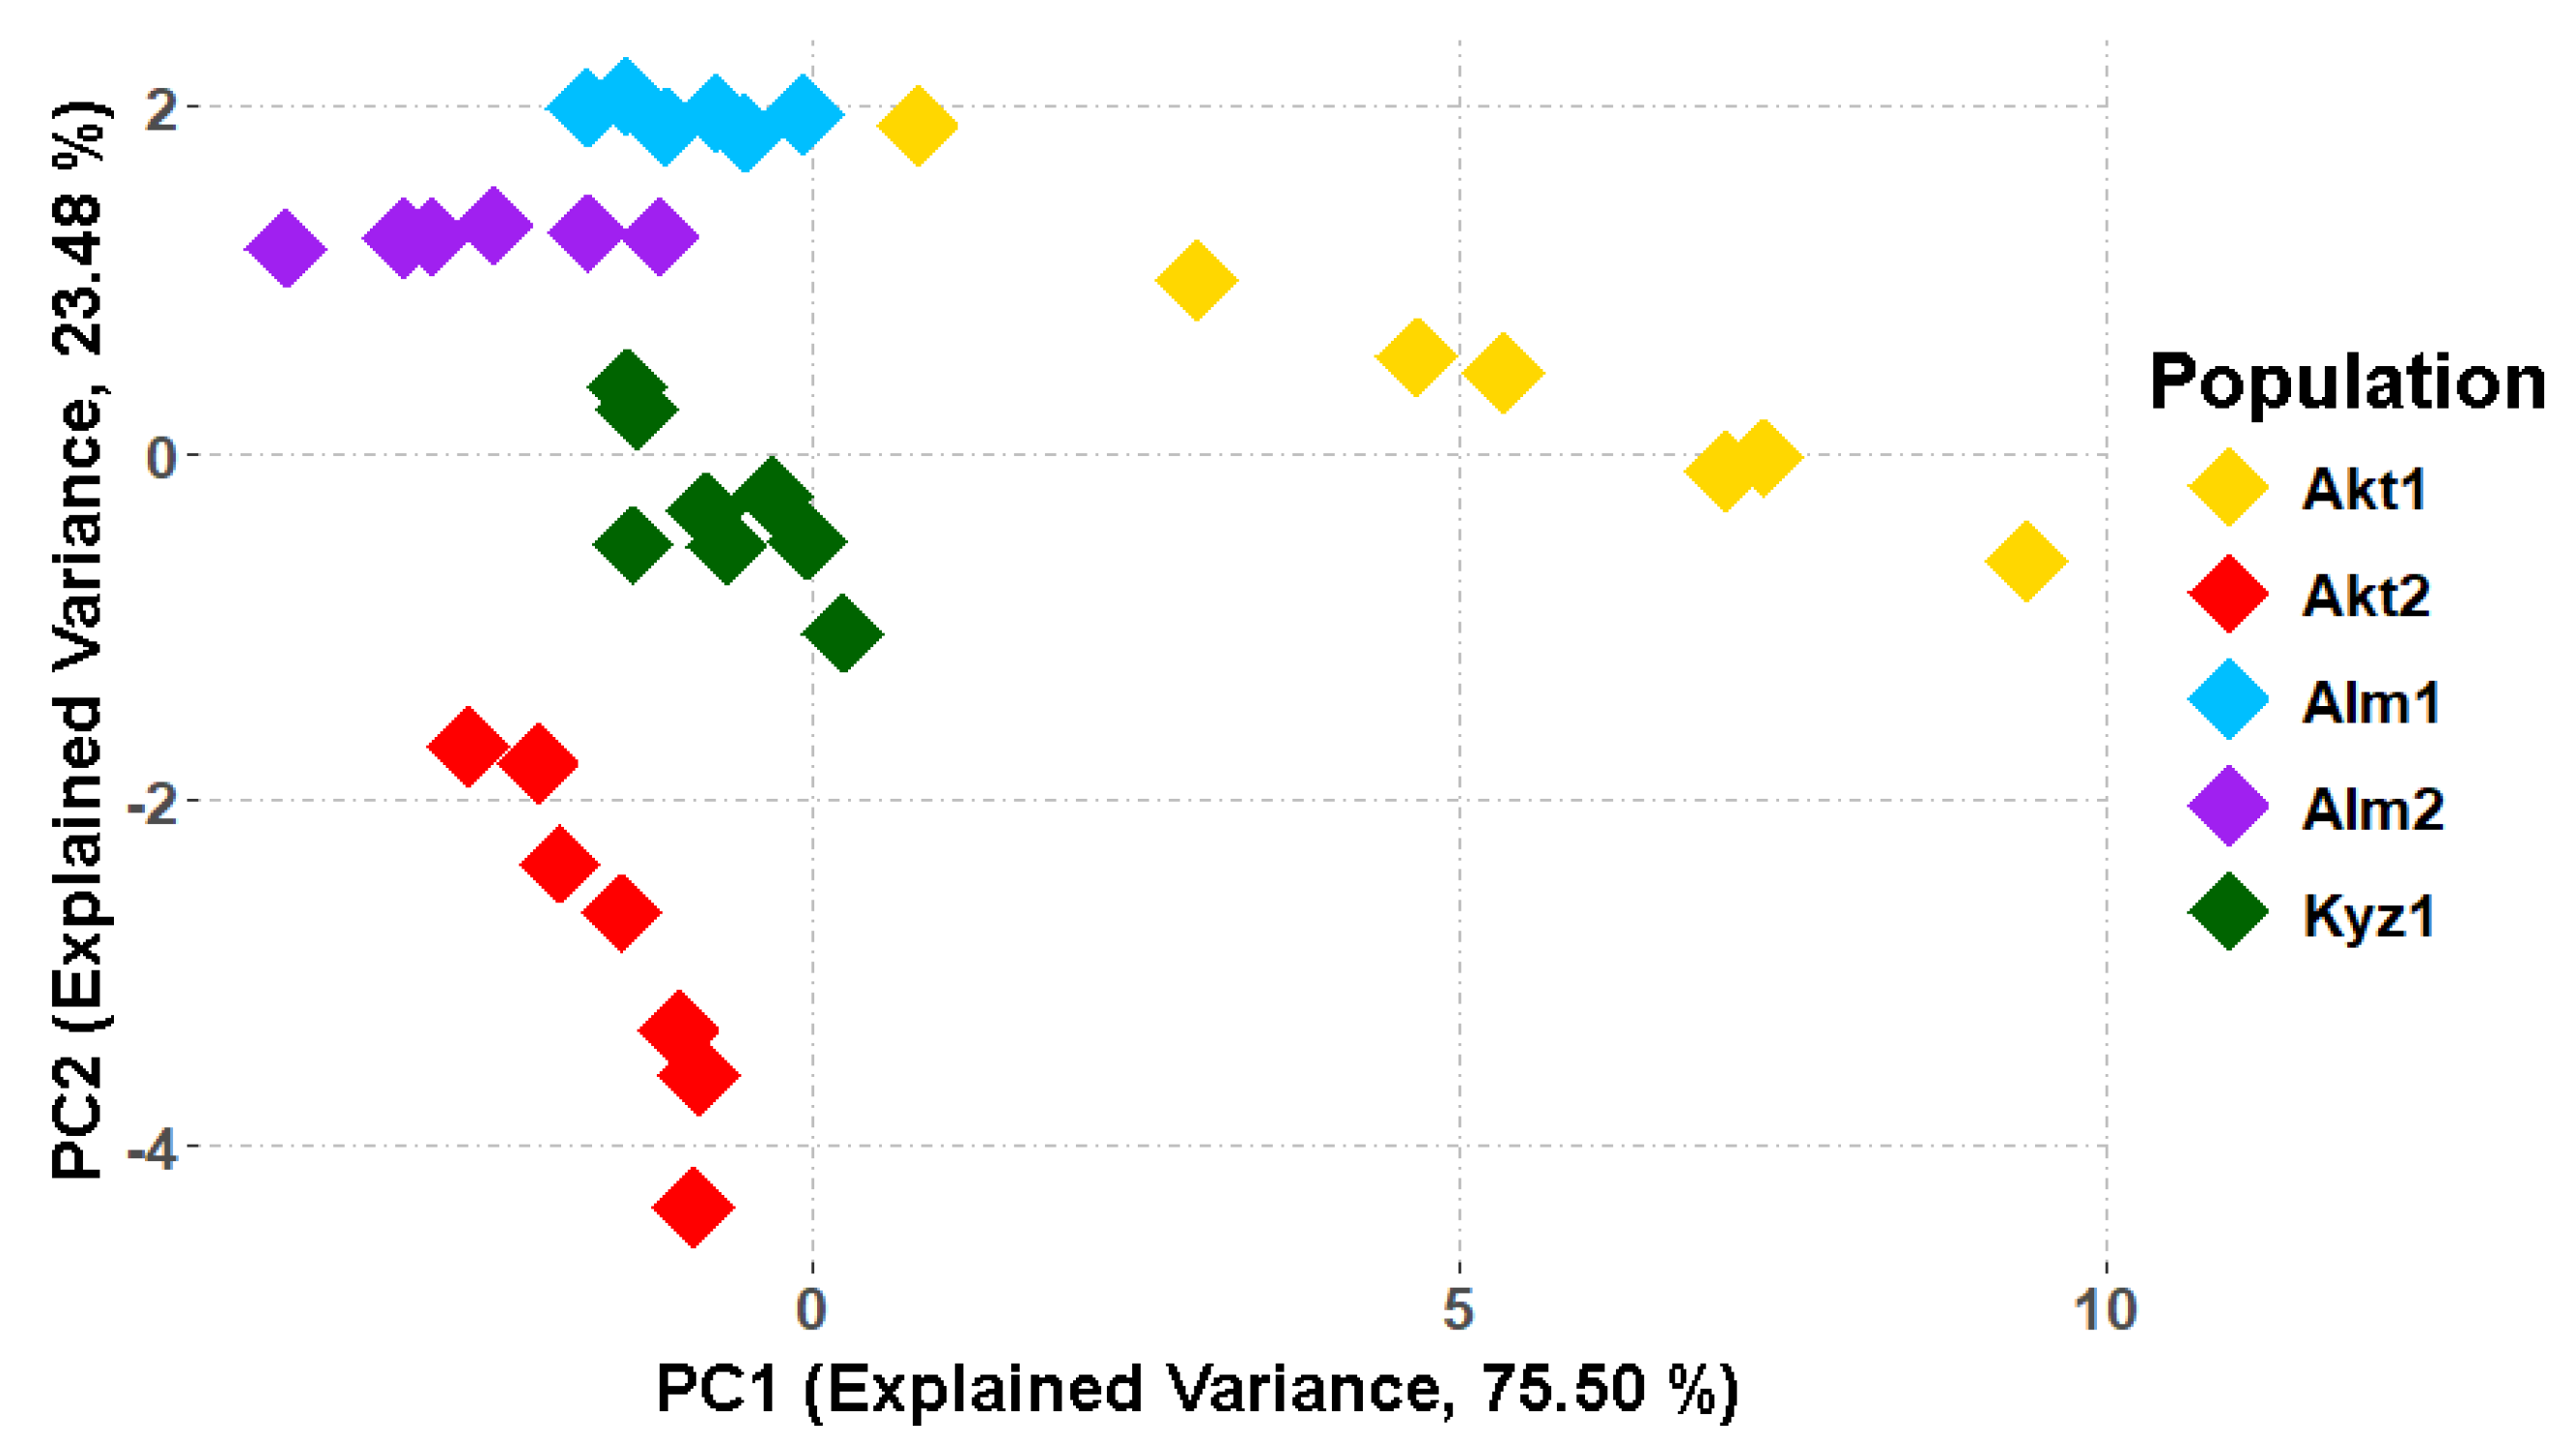
PCA of the seven biochemical traits revealed that PC1 explained 75.50% and PC2 23.48% of the total variance, jointly accounting for 98.98% (
Figure 6).
Along the PC1 axis, the Akt1 population was strongly separated toward positive values, indicating a distinct biochemical profile compared to the other groups, which predominantly clustered in the negative PC1 region. Along PC2, a clear vertical stratification was observed: Alm1 and Alm2 occupied the most positive scores, while Akt2 was significantly displaced toward negative values, reflecting divergent biochemical compositions. Kyz1 maintained an intermediate position near the PC2 origin. In general, the PCA reveals structured differentiation, with Akt1 and Akt2 representing the most compositionally divergent populations among the A. squarrosum germplasm studied.
2.4. Trait Relationships and Phenotypic Structure of Populations
The phenotypic structure and trait interrelationships among the five
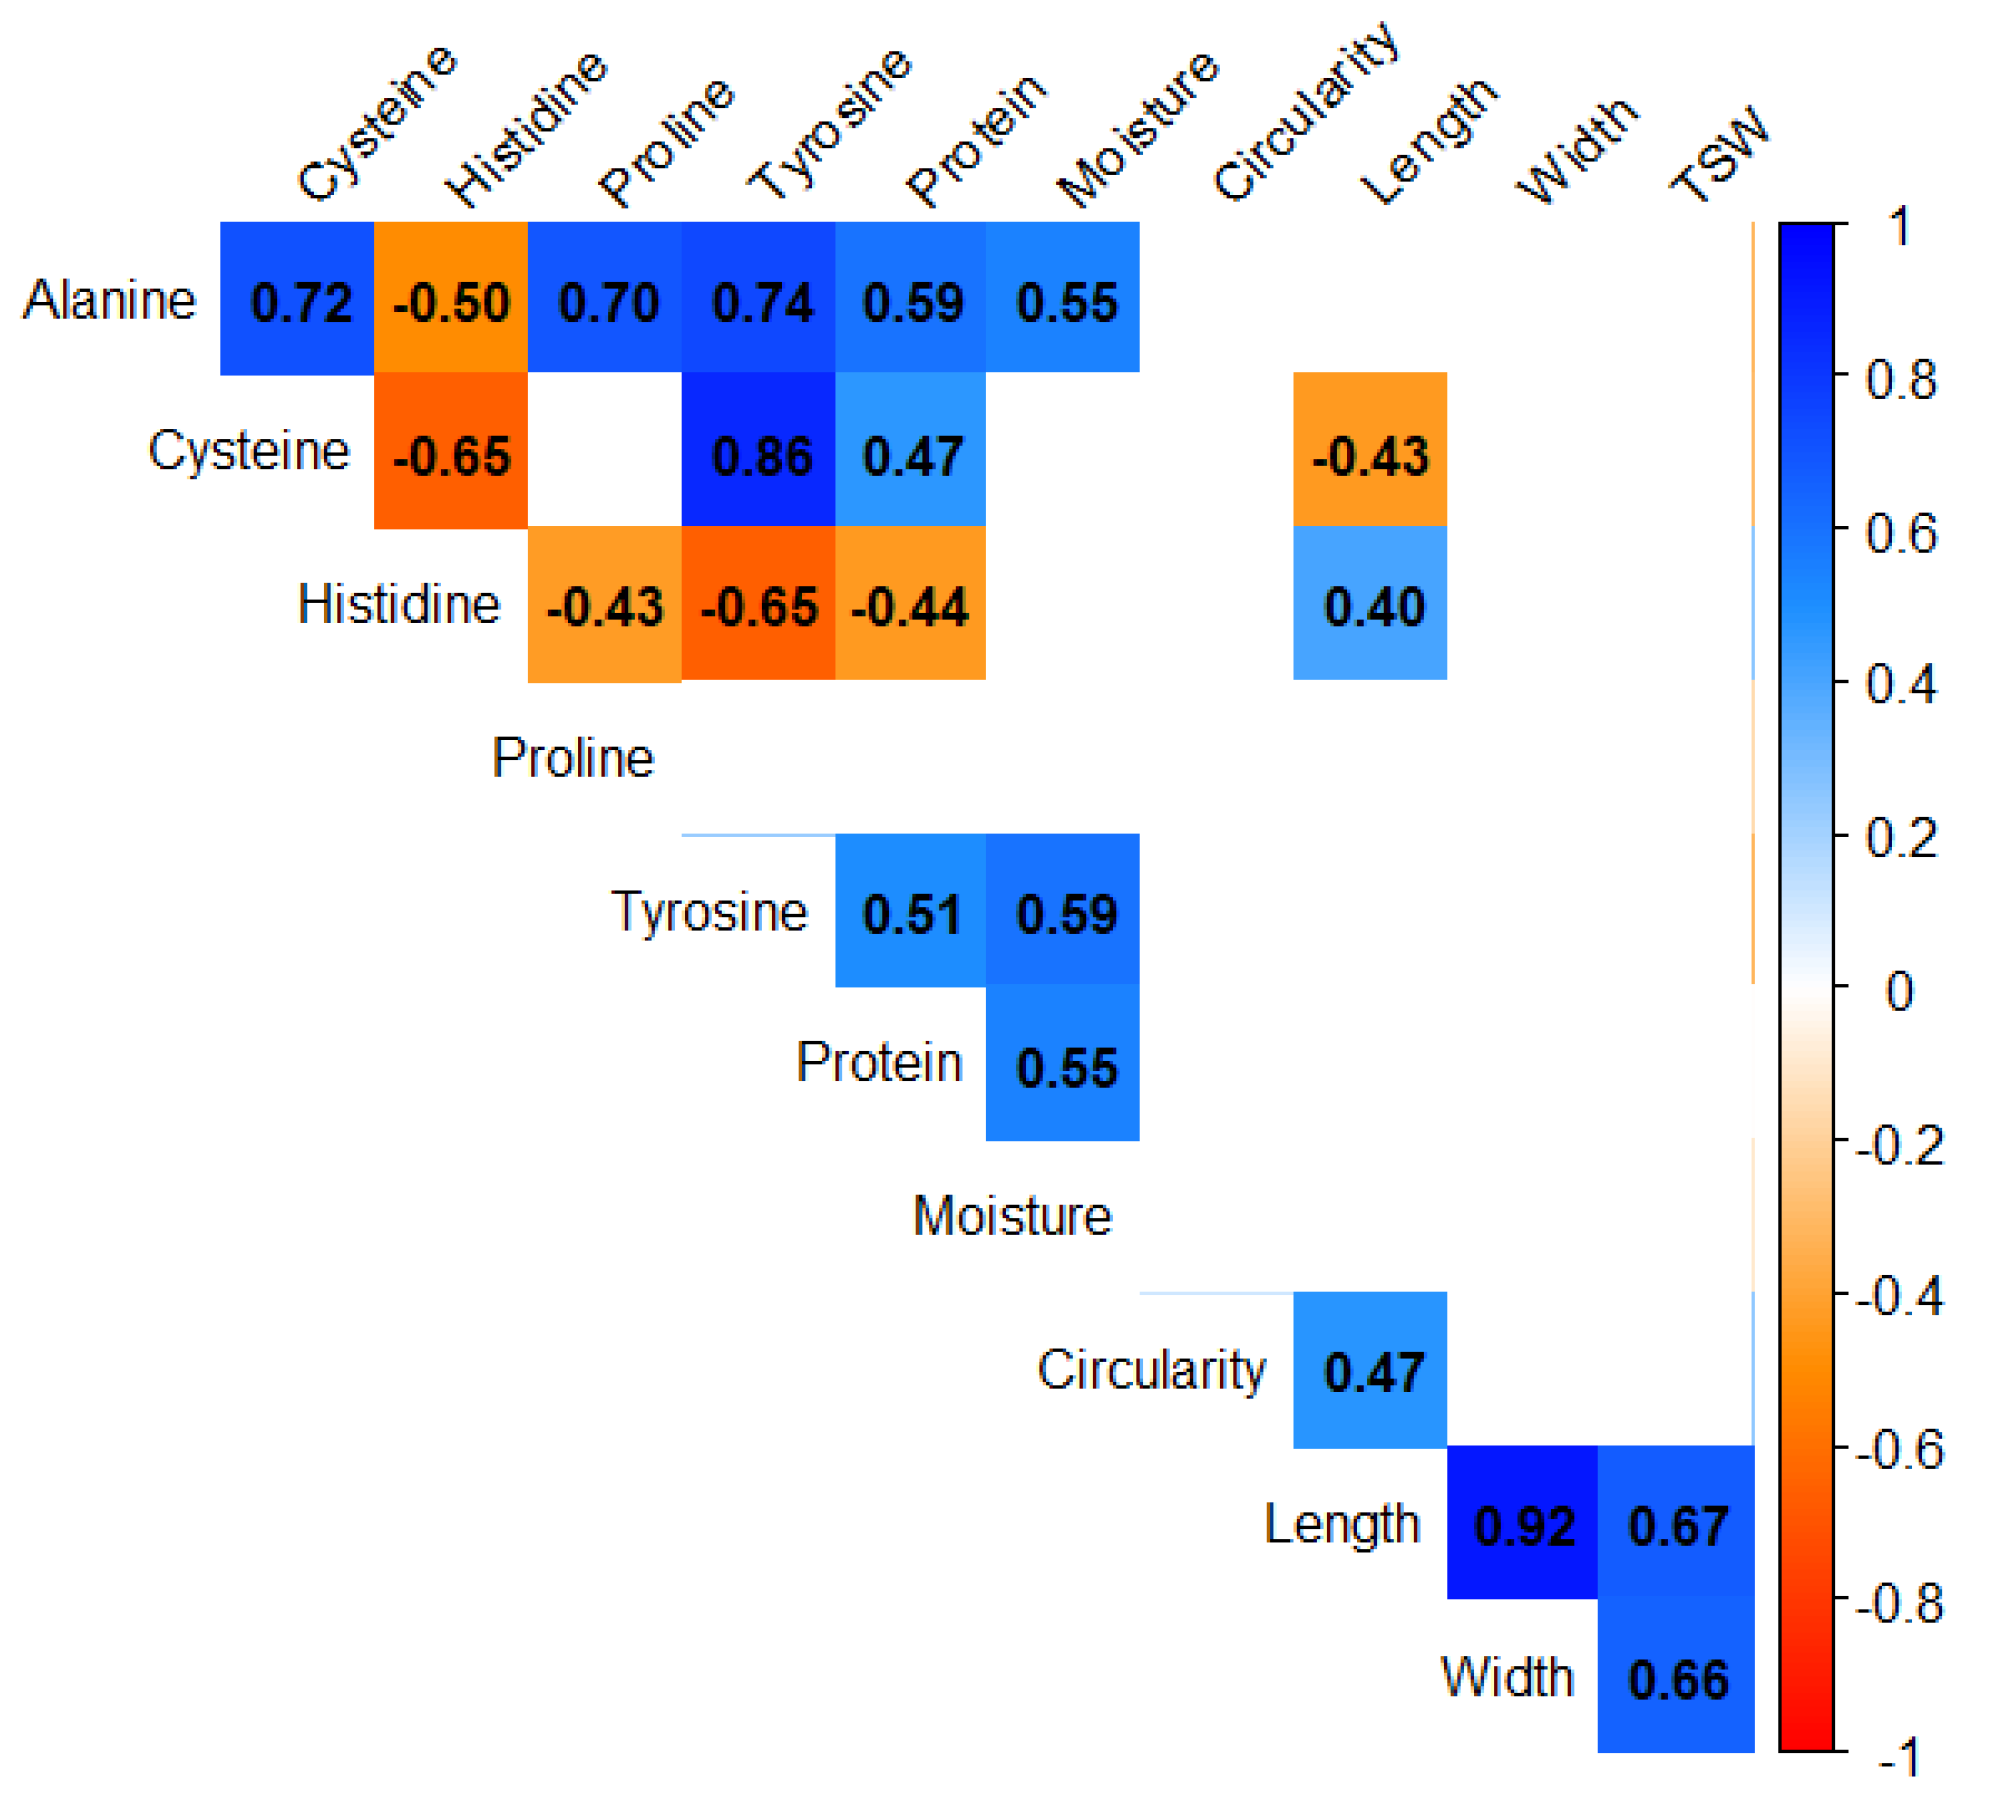
A. squarrosum populations were characterized through comprehensive correlation and hierarchical clustering analyses. Pearson correlation analysis of seed morphometric and biochemical traits revealed a structured pattern of positive and negative associations (
Figure 7).
Among biochemical traits, the strongest positive correlations remaining significant after FDR correction were observed between cysteine and tyrosine (r = 0.86), alanine and tyrosine (r = 0.74), alanine and cysteine (r = 0.72), and alanine and proline (r = 0.70), indicating coordinated variation among these amino acids across populations. Histidine was negatively correlated with the other four amino acids (r = −0.43 to −0.65) and with protein content (r = −0.44). The negative correlations between histidine and other amino acids, as well as protein content, may indicate differential nitrogen allocation among amino acid biosynthetic pathways, potentially reflecting adaptive metabolic regulation under arid environmental conditions. Overall, these patterns suggest coordinated regulation among specific amino acids, in contrast to antagonistic relationships with histidine, indicating distinct metabolic pathways that underlie seed composition.
Among morphometric traits, seed length, seed width, and TSW were strongly positively correlated with each other (r = 0.66–0.92), whereas circularity showed a moderate positive correlation only with seed length (r = 0.47). When examining cross-category relationships, seed length was negatively correlated with cysteine (r = −0.43) but showed a stable, moderate positive correlation with histidine (r = 0.40). Protein content showed no significant correlation with any morphometric trait, and seed width showed no significant correlation with any biochemical trait.
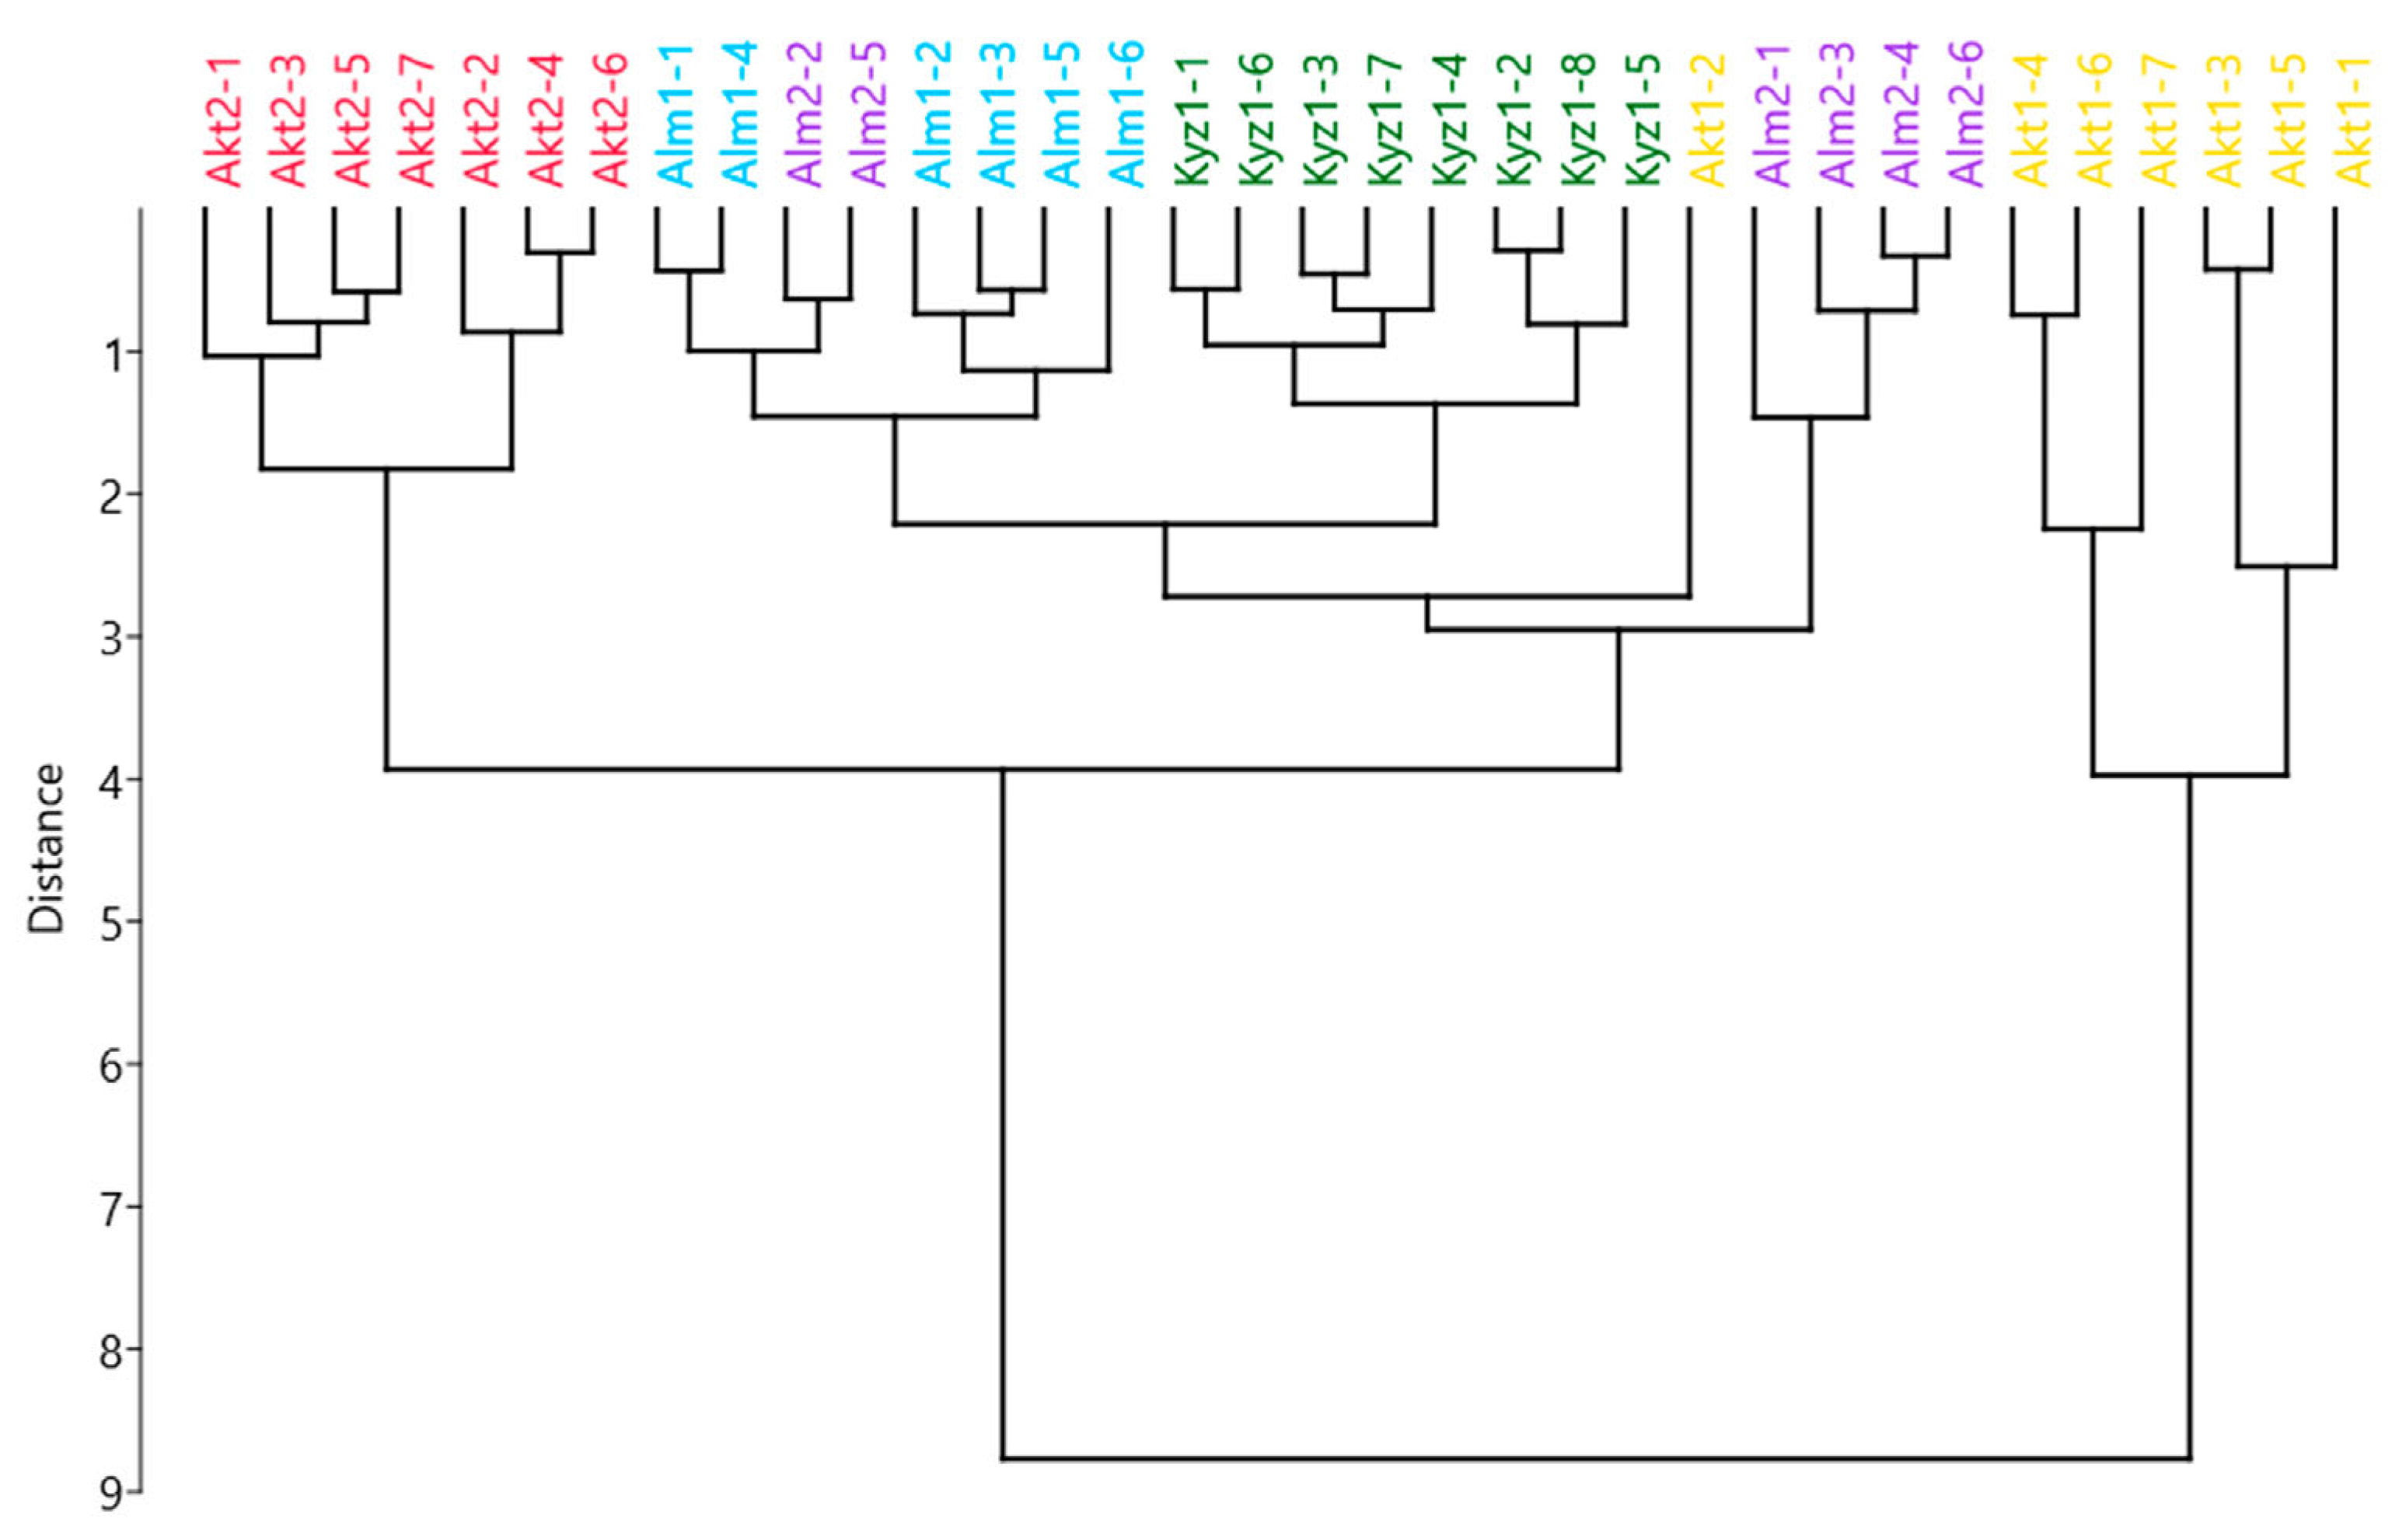
The Neighbor-joining (NJ) tree based on all integrated traits revealed partial phenotypic structuring broadly consistent with population identity, though without complete separation (
Figure 8).
Two major hierarchical groupings were observed at a distance of 8.8, at which point the Akt1 population was clearly separated from all other accessions, forming a distinct and well-defined cluster on the root baseline. At a distance of 4.0, the remaining accessions split into two secondary major macro-clusters: one predominantly comprising the Akt2 population on the far left, and another encompassing the Alm1, Alm2, and Kyz1 complex. Further subdivision within the latter complex at a distance of 2.8 revealed the separation of a distinct subgroup, comprising the majority of Alm2 accessions (Alm2-1, Alm2-3, Alm2-4, and Alm2-6). At a distance of 2.3, the Alm1 accessions formed a tight, standalone cluster that embedded the remaining Alm2 outliers (Alm2-2 and Alm2-5), while the Kyz1 population formed a highly homogeneous neighbor group at a distance of 1.5. Overall, Akt1 represents the most phenotypically divergent population in this dataset, whereas Alm1, Alm2, and Kyz1 demonstrate the highest phenotypic similarity, characterized by integrated sub-clustering patterns.
2.5. Integrated Multivariate Analysis of Population Differentiation
To comprehensively evaluate phenotypic differentiation, trait–environment relationships, and overall population performance, a series of multivariate and integrative analyses were conducted. Multivariate analysis of variance (MANOVA) revealed highly significant population-level differentiation across all trait categories (
Table 4).
The combined dataset showed the strongest statistical separation (Pillai’s Trace = 3.3926, p < 2.2 × 10⁻¹⁶), followed closely by biochemical traits (Pillai’s Trace = 2.9514, p < 2.2 × 10⁻¹⁶) and morphometric traits (Pillai’s Trace = 1.5492, p = 5.09 × 10⁻⁷), confirming distinct phenotypic structuring in multivariate space.
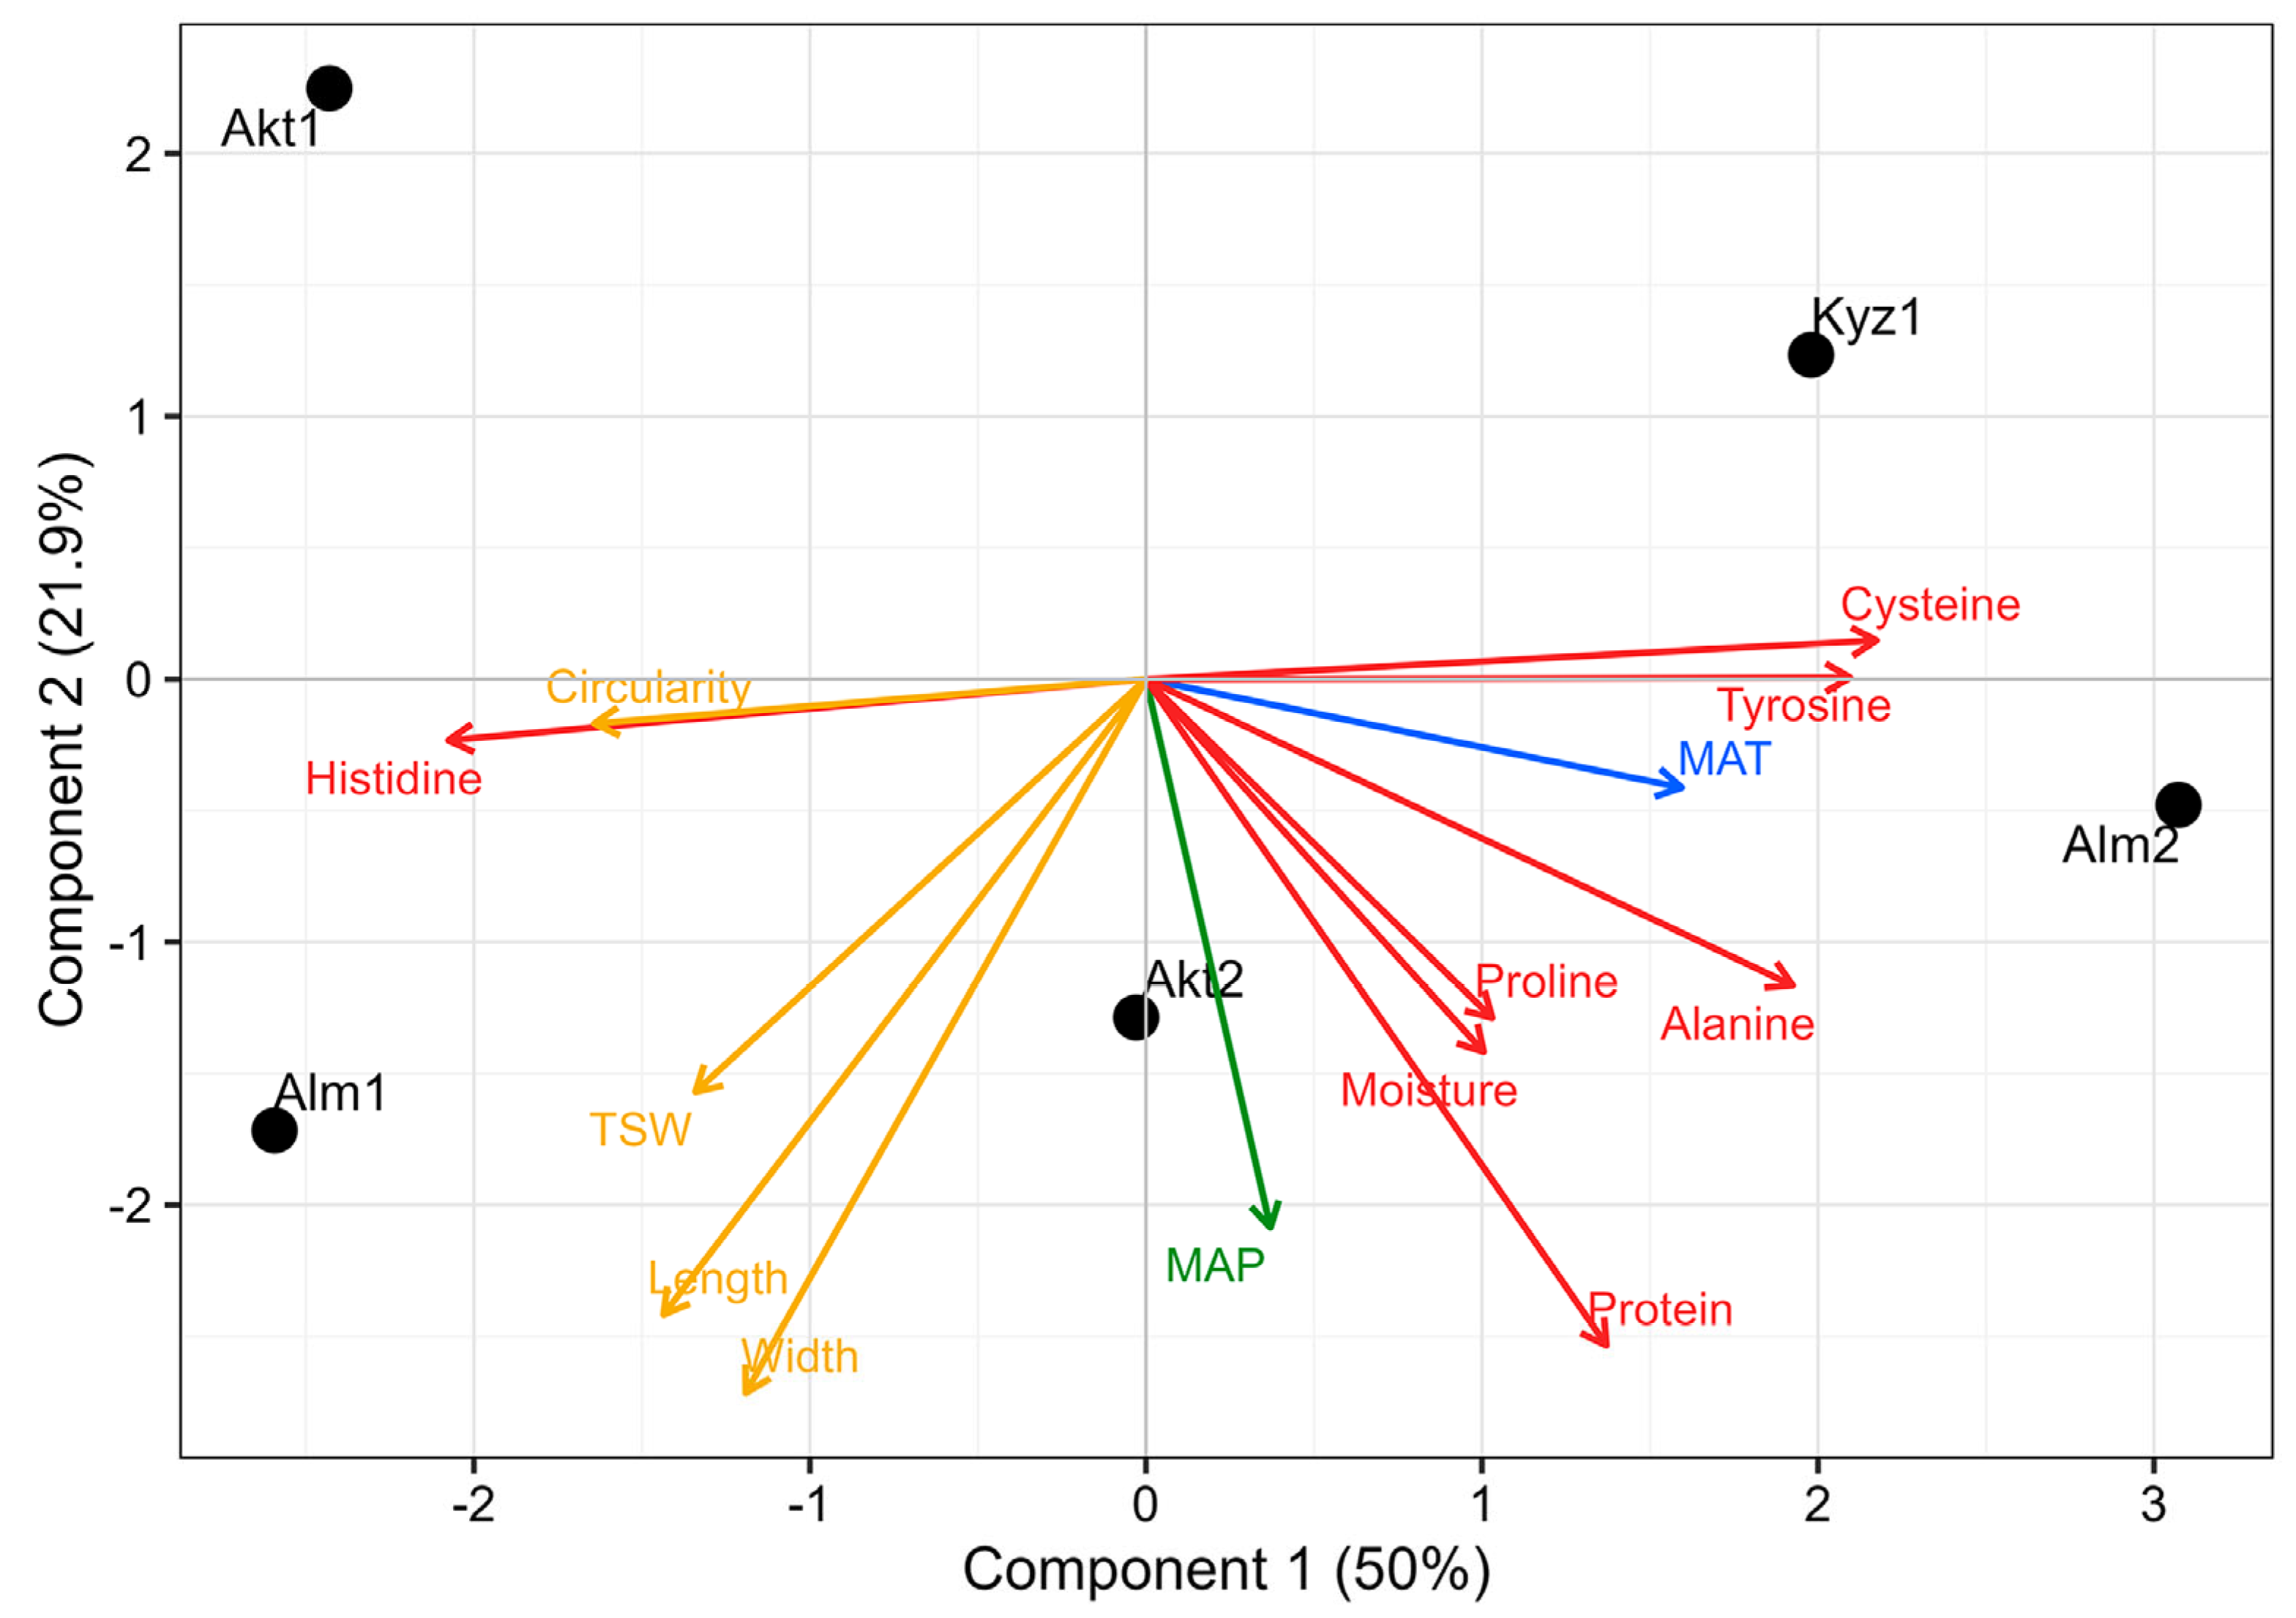
The relationship between integrated traits and climatic factors was further characterized using a partial least squares (PLS) biplot (
Figure 9).
Although the first two components explained 71.9% of the variance in climatic variables (R2X) and from 1.6% to 88.9% of the variance in specific phenotypic traits, leave-one-out cross-validation (LOOCV) yielded negative Q2 values. This low predictive power is directly attributable to the limited number of environments analyzed (n = 5), thereby positioning the PLS framework strictly as a descriptive tool for visualizing climate–trait trends rather than as a predictive model.
Within this ordination space, Component 1 (50%) separated the biochemical and morphometric trait complexes. Specifically, total protein content, moisture, and the majority of amino acids (alanine, proline, cysteine, and tyrosine) loaded positively along Component 1, showing a directional alignment with the climatic drivers (MAP and MAT). Among these, MAT was positioned closer to the cysteine and tyrosine vectors, while MAP displayed a downward orientation towards the Akt2 population. Conversely, histidine and all seed morphometric traits (length, width, TSW, and circularity) loaded negatively along Component 1, demonstrating an antagonistic relationship with both total protein content and the analyzed environmental factors. In terms of population clustering, Alm1 was closely associated with the morphometric trait complex (specifically TSW and length), Alm2 tracked closely with the cysteine/tyrosine cluster, and Akt1 formed an isolated group in the upper-left quadrant, inversely oriented to the primary climatic vectors.
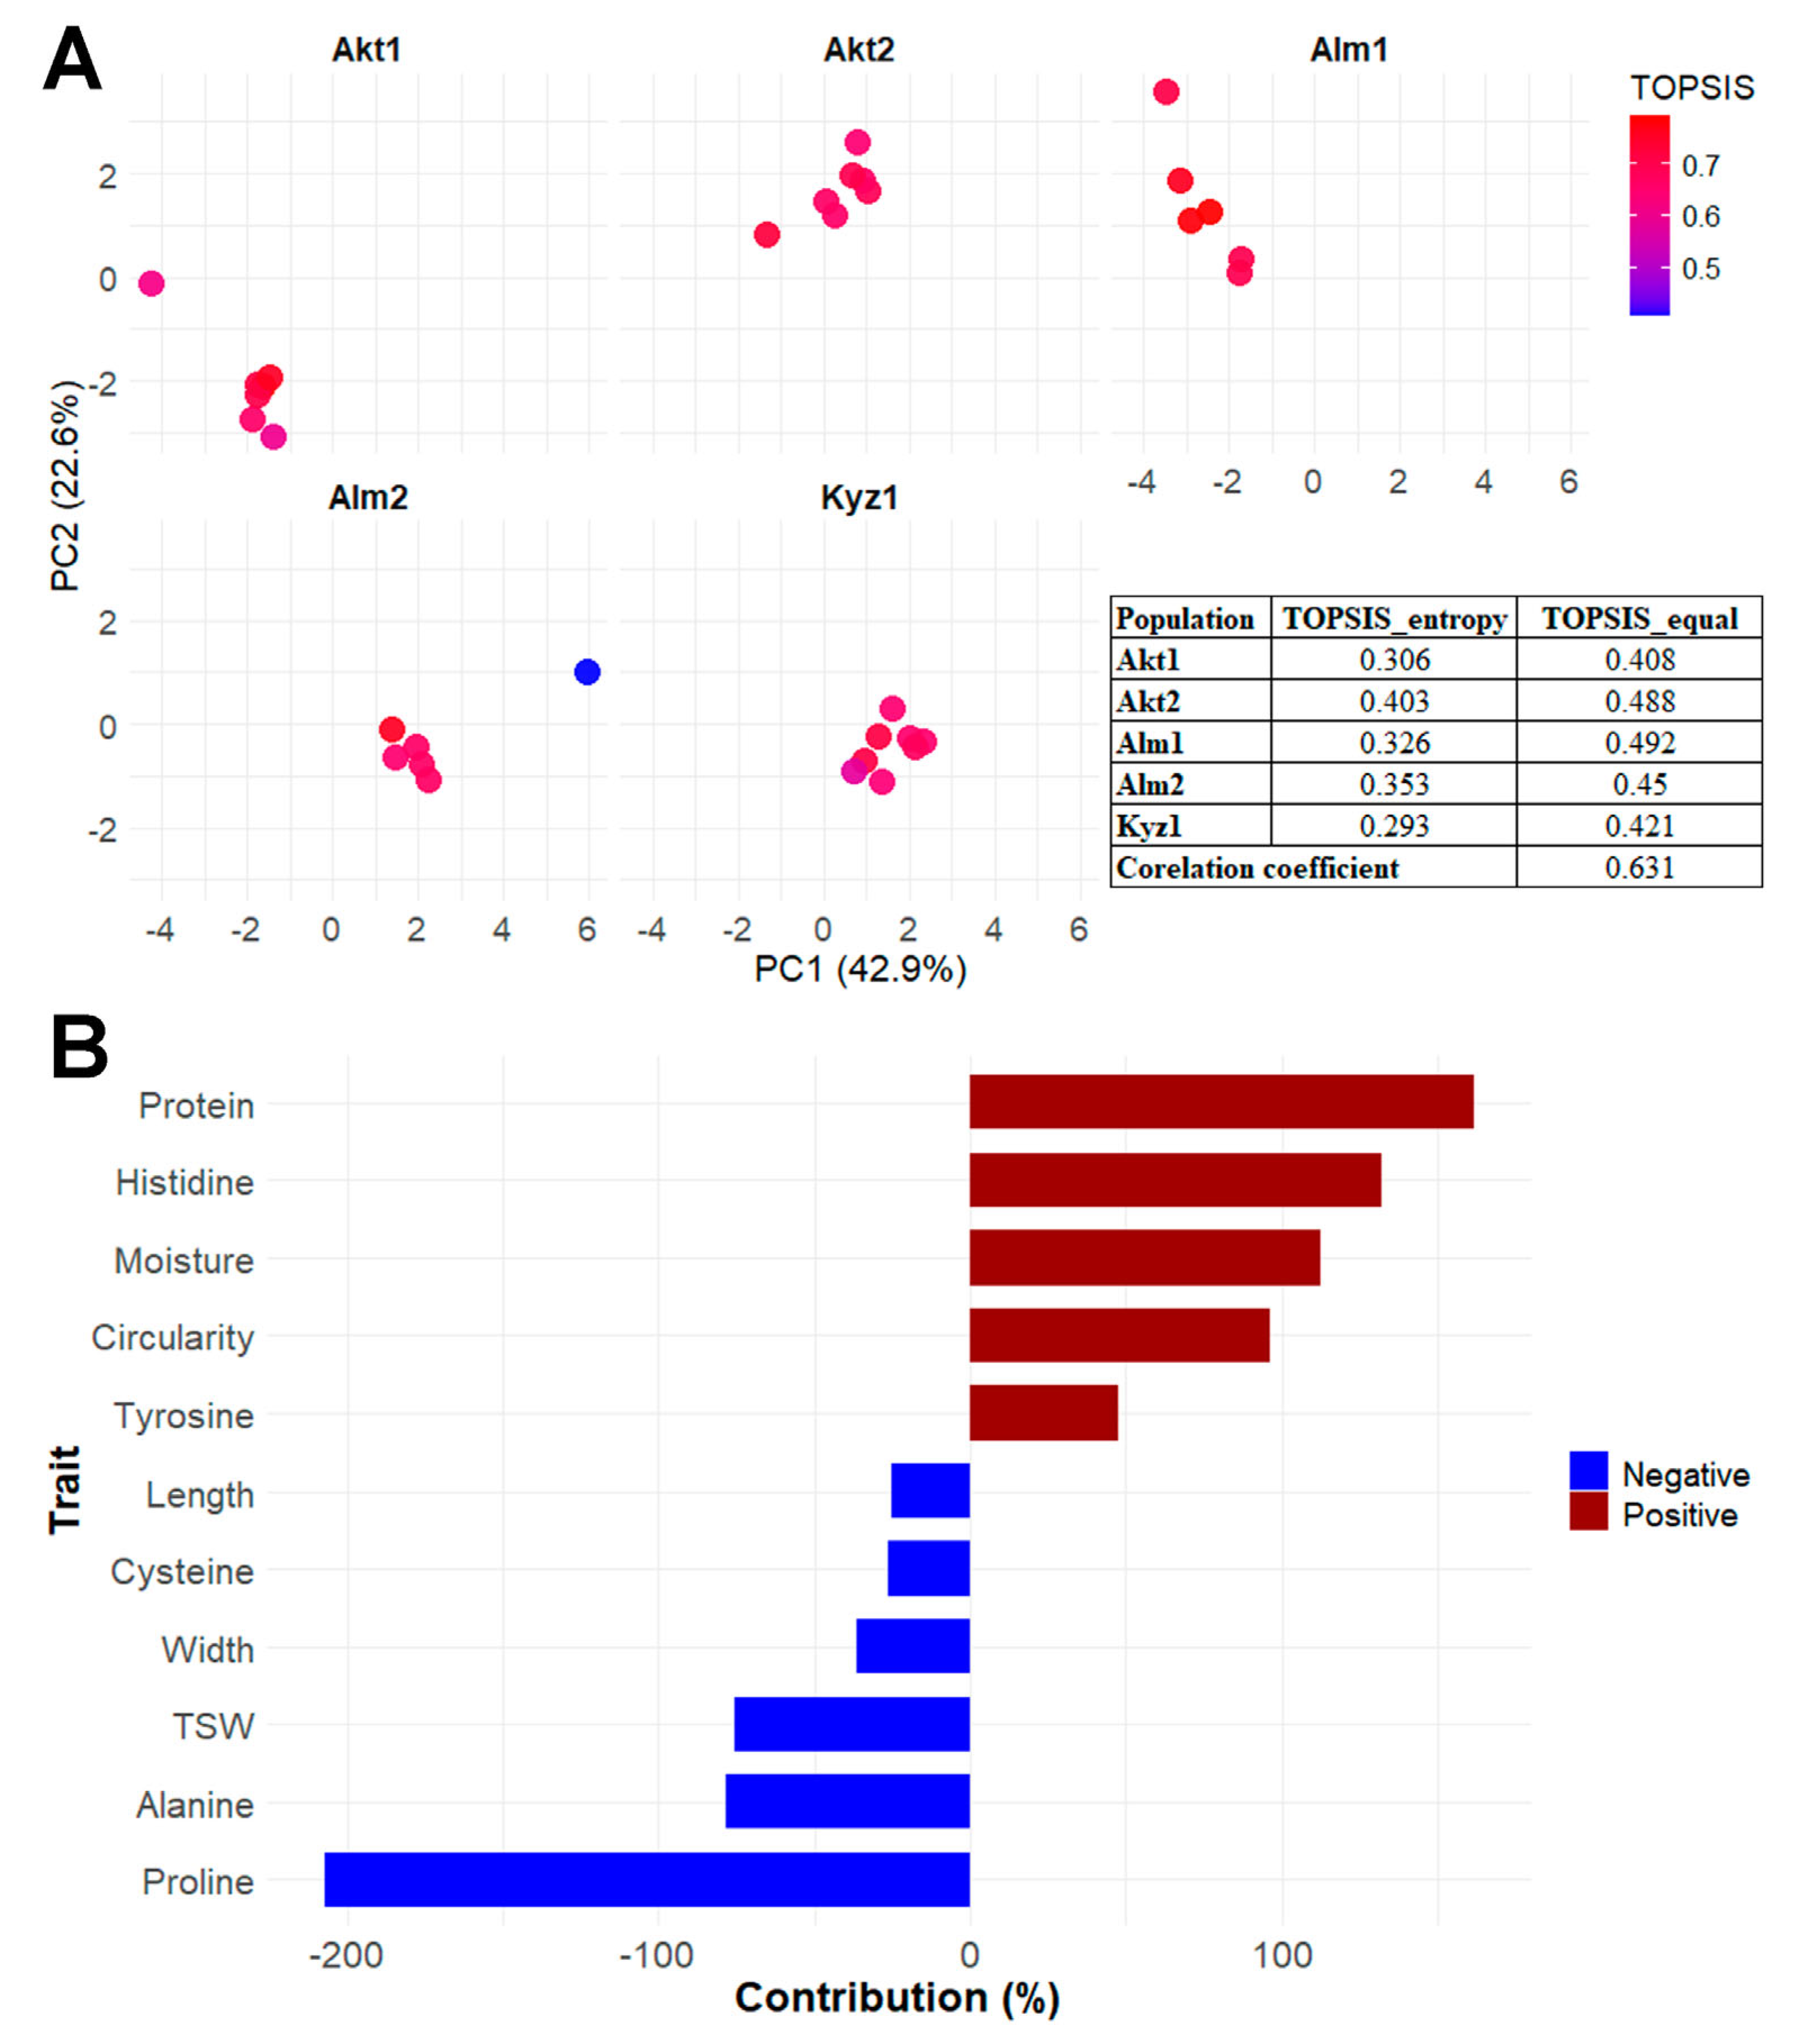
A comparative multi-criteria evaluation combining PCA and the Technique for Order Preference by Similarity to Ideal Solution (TOPSIS) framework revealed structured phenotypic variation and differences in rankings among the studied genotypes (
Figure 10).
The first two principal components accounted for 65.5% of the total variance, with PC1 explaining 42.9% and PC2 explaining 22.6% (
Figure 10A). In the Alm1 panel, high-scoring genotypes consistently grouped at elevated PC2 values. Conversely, the Alm2 population contained a distinct low-scoring outlier positioned deep in the upper-right quadrant of the ordination space.
The inset table provides a rigorous population-level comparison between entropy-weighted (TOPSIS_entropy) and equal-weighted (TOPSIS_equal) approaches (
Figure 10A). For TOPSIS_entropy, the highest integrated value was observed in Akt2 (0.403), followed by Alm2 (0.353) and Alm1 (0.326). Under the TOPSIS_equal approach, Alm1 (0.492) and Akt2 (0.488) exhibited the highest scores. A moderate positive correlation (
r = 0.631) was observed between the two scoring techniques, indicating partial consistency between weighting schemes while also highlighting differences in the relative contribution of individual traits.
To determine the underlying drivers of this ordination structure, a trait contribution analysis was conducted (
Figure 10B). Total protein content emerged as the primary positive driver of the observed phenotypic variance (contributing more than 150%), followed by histidine, moisture content, seed circularity, and tyrosine. Conversely, proline content acted as the dominant negative contributor (exceeding −200%), with alanine, TSW, seed width, cysteine, and seed length also pulling the variance in the negative direction. These results indicate that the top-performing accessions identified by TOPSIS are characterized by a synergistic optimization of high protein/histidine concentration and distinct seed circularity, rather than a mere increase in linear morphometric parameters such as length or width. The difference between entropy-weighted and equal-weighted rankings indicates that population performance is partly influenced by the weighting strategy, although Akt2 and Alm1 consistently ranked among the highest-performing populations.
4. Materials and Methods
4.1. Plant Material and Sampling
Five natural populations of A. squarrosum were sampled across three ecologically distinct regions of Kazakhstan—Aktobe (Akt1, Akt2), Almaty (Alm1, Alm2), and Kyzylorda (Kyz1)—in 2025. These regions represent western, southeastern, and southern arid zones of Kazakhstan, characterized by sandy desert soils typical for the natural habitat of A. squarrosum. Geographic coordinates of sampling sites were recorded using a handheld GPS device Garmin eTrex 10 (Garmin Corporation, New Taipei City, Taiwan).
At each site, mature seeds were collected from randomly selected individual plants per population to capture within-population variability, with each plant considered a biological replicate. A total of 34 individual plants (accessions) were sampled across the five populations, including 7 accessions from Akt1, 7 from Akt2, 6 from Alm1, 6 from Alm2, and 8 from Kyz1. To further minimize the probability of sampling closely related individuals, mature plants were collected at a minimum distance of 20 m from one another whenever local population density permitted. Following collection, the seeds were thoroughly air-dried, cleaned to remove the husks, and stored in paper bags at room temperature until further analysis.
Climatic parameters were summarized to describe environmental conditions at each sampling location. Monthly temperature (°C) and precipitation (mm) data for five sampling sites were obtained from publicly available climatic databases [
37]. Since
A. squarrosum is an annual species with a single-season life cycle, climatic data from 2025 were used to reflect the actual environmental conditions during the plants’ growth and seed development.
4.2. Morphometry and Biochemical Analysis of Seeds
Seed morphometric traits were quantified using the MARViN ProLine seed analyzer (MARViTECH GmbH, Wittenburg, Germany) through high-resolution digital imaging and automated image analysis software. For each accession (individual plant), 100–150 mature seeds were randomly selected and scanned under standardized conditions to measure the mean length (mm), width (mm), and circularity [(seed perimeter2)/(4π × area)]. Thousand-seed weight (TSW, g) was determined for each accession.
Moisture (%) and crude protein (%) content in seeds were determined using an Infralum FT-12 NIR analyzer (Lumex, Saint Petersburg, Russia) in accordance with ISO 12099:2017 [
38]. Cleaned samples (50 g) were scanned in triplicate over the 800–2500 nm range, and spectral data were processed using Spectralab software (Lumex, Saint Petersburg, Russia) with PLS regression. Protein values were estimated using NIR spectroscopy calibrated with PLS regression and therefore represent indirect analytical estimates rather than direct determinations obtained by wet-chemistry methods such as Kjeldahl analysis. Total protein content was subsequently expressed on a dry-matter basis using the measured moisture content for each accession. Micrographs of seeds were obtained with Levenhuk MED D10T LCD (Levenhuk Inc., Moscow, Russia).
4.3. Amino Acid Profiling
Amino acid profiling was conducted using High-Performance Liquid Chromatography (HPLC). All analyses were performed in triplicate to ensure analytical reproducibility. HPLC-grade methanol, acetonitrile, isopropanol, phenylisothiocyanate (PITC), trimethylamine (TEA), sodium acetate, and amino acid standards (LAA21) were obtained from Sigma-Aldrich (St. Louis, MO, USA). Standard stock solutions of 20 amino acids (1 mg/mL) were diluted to five concentration levels ranging from 0.01 to 1.0 mg/mL to construct calibration curves, which demonstrated high linearity (R2 > 0.990). Limits of detection (LOD) and quantification (LOQ) were determined for each amino acid based on signal-to-noise ratios of 3 and 10, respectively. Method precision was evaluated through repeated injections of standards, yielding relative standard deviations (RSD) below 5%. L-nor leucine was used as an internal standard.
Seed samples were ground into a homogeneous fine powder using mill IKA A10 (IKA-Werke GmbH & Co, Staufen, Germany) and subsequently defatted with n-hexane in a Soxhlet apparatus for 8 h to eliminate lipid interference. Total protein hydrolysis was carried out following the AOAC 982.30 protocol [
39]. A 100 mg aliquot of the defatted sample was hydrolyzed in 10 mL of 6 M HCl supplemented with 0.1% phenol. To prevent oxidative degradation of labile amino acids, hydrolysis tubes were purged with nitrogen (N
2) and vacuum-sealed prior to incubation at 110 ± 1 °C for 24 h. After hydrolysis, samples were filtered through a 0.22 µm PTFE membrane, evaporated to dryness under vacuum at 50 °C, and reconstituted in 0.1 M HCl.
It should be noted that acid hydrolysis with 6 M HCl may partially degrade certain amino acids, particularly tryptophan, and sulfur-containing amino acids may also be partially affected despite the protective measures employed. Tryptophan is largely degraded under acidic hydrolysis conditions, whereas accurate quantification of sulfur-containing amino acids (methionine and cysteine/cystine) typically requires prior performic acid oxidation, which was not performed in the present study. Furthermore, several amino acids were present at concentrations below the analytical limit of quantification (LOQ), preventing their reliable determination across all samples. Consequently, only amino acids consistently detected above the LOQ were included in subsequent statistical analyses.
Amino acids were derivatized to PITC derivatives using the Pico-Tag method. The derivatization reagent consisted of PITC, TEA, and isopropanol in a 1:1:8 (v/v/v) ratio. An aliquot of 100 µL of each sample was dried, reacted with 20 µL of the derivatization reagent for 20 min at room temperature, and subsequently vacuum-dried to remove excess reagents. The resulting PTC derivatives were reconstituted in the initial mobile phase prior to analysis.
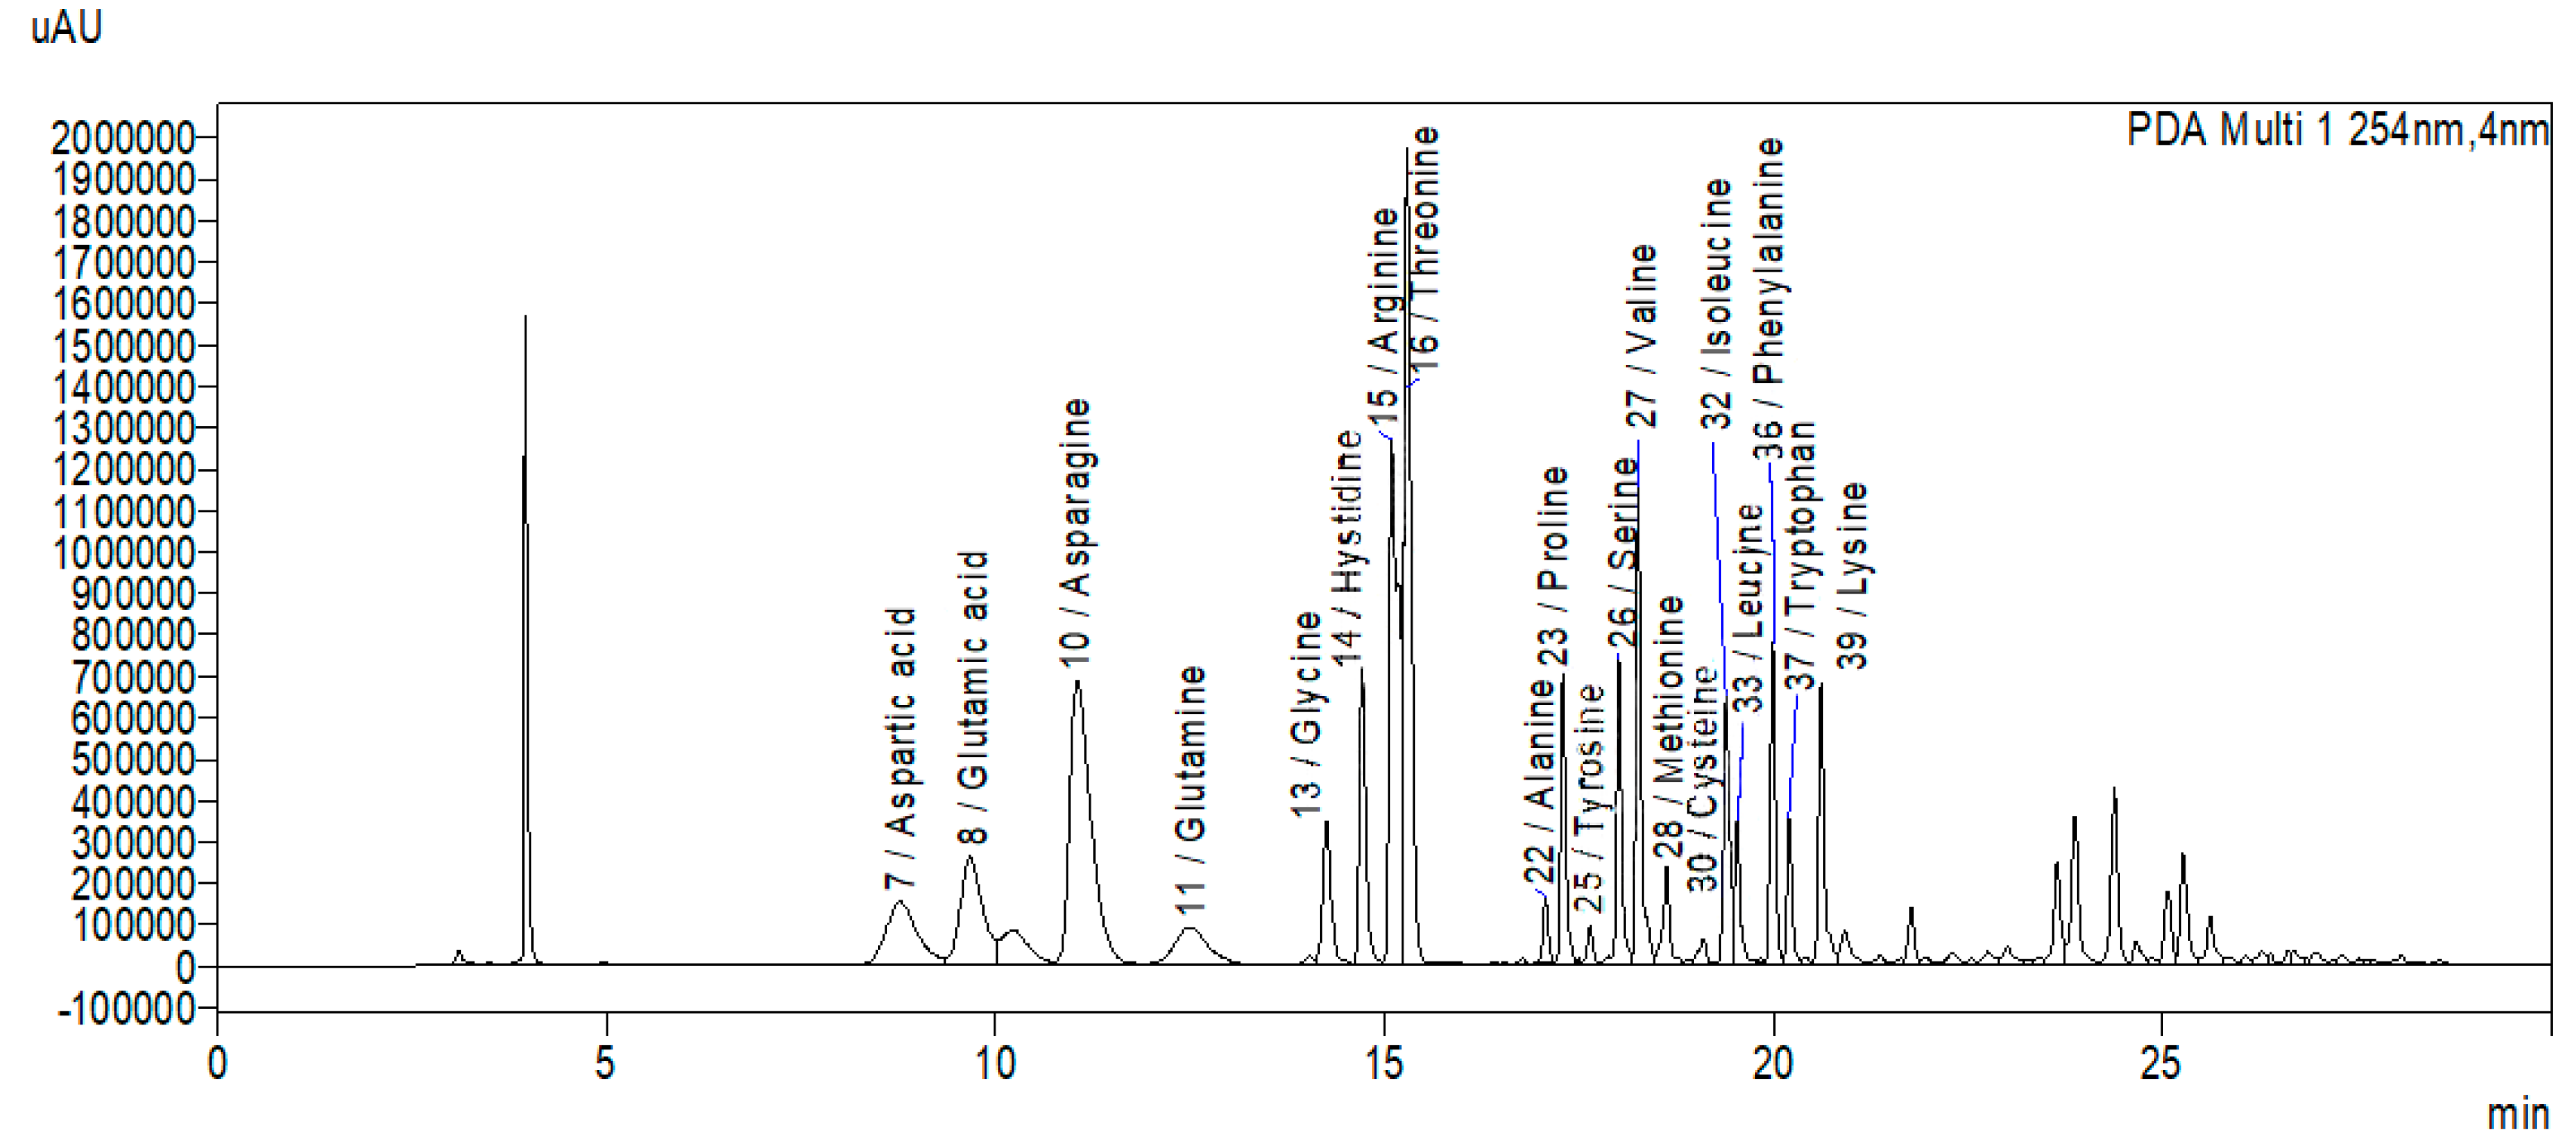
Chromatographic separation was performed using a Shimadzu Nexera LC-40D XR system equipped with an SPD-M40 photodiode array (PDA) detector (Shimadzu Corporation, Kyoto, Japan). Separation was achieved on a Supelco Discovery C18 column (250 mm × 4.6 mm, 5 µm) (Sigma-Aldrich/Merck, Bellefonte, PA, USA) maintained at 40 °C. The mobile phase consisted of acetonitrile (99.9%) with 0.1% acetic acid (mobile phase A) and deionized water (99.9%) containing 0.1% acetic acid and 0.1 M sodium acetate (mobile phase B). A gradient elution program was applied at a flow rate of 1.0 mL/min as follows: 0.0–7.5 min, 5% A/95% B; 7.5–20.0 min, linear gradient from 5% to 50% A; 20.0–25.0 min, linear gradient from 50% to 80% A; and 25.0–30.0 min, re-equilibration from 80% to 5% A. Detection was carried out at 254 nm with spectral confirmation in 200–400 nm (
Figure 11). Amino acid and protein concentrations were expressed on a dry matter basis (mg g
−1 DM) using the measured moisture content for each accession.
4.4. Multivariate and Multi-Criteria Analysis of Phenotypic Traits
Statistical analyses were performed to evaluate variation and relationships among seed morphometric and biochemical traits. Basic descriptive statistics, including minimum, maximum, mean, standard error (SE), standard deviation (SD), variance, and coefficient of variation (CV), were calculated for all measured traits.
The PCA was performed separately for two groups of traits: seed morphometry (length, width, circularity, and TSW) and biochemical traits (amino acids, total protein, and moisture content). Because of the relatively small sample size, PCA was used primarily as an exploratory ordination method to visualize phenotypic structure rather than for formal inference. To further evaluate population differentiation, a permutational multivariate analysis of variance (PERMANOVA) based on Euclidean distances and 999 permutations was performed. Pairwise relationships among traits were evaluated using Pearson’s correlation coefficients (
r at
p < 0.05). To account for multiple testing,
p-values obtained from Pearson correlation analyses were adjusted using the FDR procedure, and only correlations with adjusted
p < 0.05 were considered significant. Phenotypic relationships among individual samples were further explored using the NJ clustering approach based on Euclidean distance matrices derived from integrated phenotypic traits in PAST4 [
40].
MANOVA was performed to test for significant differences among populations based on seed morphometry and biochemical traits. Assumptions of multivariate normality and homogeneity of covariance matrices were evaluated prior to analysis. Multivariate significance was assessed using Pillai’s Trace statistic [
41].
A PLS regression analysis was performed to evaluate the relationships between climatic variables and seed traits. MAP and MAT were used as predictor variables, while morphometric and biochemical seed traits were used as response variables. Variables were mean-centered and unit variance scaled prior to analysis. Model performance was evaluated using R2X, R2Y, and Q2 statistics. The PLS model was fitted with two components and validated using leave-one-out cross-validation (LOOCV) to assess the strength of climate–trait associations.
TOPSIS was used to evaluate the overall performance of accessions across all traits. The traits were treated as benefit criteria, except moisture content, which was considered a cost criterion. The decision matrix was normalized using min–max normalization to remove scale effects. Two weighting schemes were applied. In the entropy-weighted approach (TOPSIS_entropy), criterion weights were calculated according to Shannon entropy theory [
42], allowing objective weighting based on trait variability and information content. In the equal-weighted approach (TOPSIS_equal), all traits were assigned identical weights. For both approaches, ideal and anti-ideal solutions were defined, Euclidean distances from each accession to these reference points were calculated, and a relative closeness coefficient was obtained as the final TOPSIS score. Accessions were ranked according to this coefficient, with higher values indicating superior overall performance. Rankings obtained under the two weighting schemes were subsequently compared to assess the influence of trait weighting on genotype evaluation.
All analyses and plots were carried out in R v. 4.6.0 [
43] using the packages igraph, corrplot, vegan, stats, biotools, candisc, pls, dplyr, and ggplot2.





 ,
,