Article

Genome-Wide Analysis of PP2C Gene Family and Identification of DlPP2C1 as an ABA-Responsive Candidate Regulator During Early Somatic Embryogenesis in Longan (Dimocarpus longan Lour.)


1
Institute of Horticultural Biotechnology, Fujian Agriculture and Forestry University, Fuzhou 350002, China
2
Key Laboratory of Genetics, Breeding and Multiple Utilization of Crops, Ministry of Education, Fujian Agriculture and Forestry University, Fuzhou 350002, China
3
Institut de la Recherche Interdisciplinaire de Toulouse, IRIT-ARI, 31300 Toulouse, France
*
Author to whom correspondence should be addressed.
Plants 2026, 15(11), 1659; https://doi.org/10.3390/plants15111659
Submission received: 21 April 2026 / Revised: 10 May 2026 / Accepted: 14 May 2026 / Published: 28 May 2026
(This article belongs to the Section Plant Genetics, Genomics and Biotechnology)

Abstract

PP2C (protein phosphatases 2C) are key regulators of abscisic acid (ABA) signaling that play a crucial role in plant stress responses. Our analysis identified 71 DlPP2C genes in Dimocarpus longan, which were classified into distinct subgroups based on phylogenetic relationships with Arabidopsis thaliana and Oryza sativa. Structural analysis demonstrated conserved motif composition and gene organization within subgroups, while chromosomal distribution and synteny analysis revealed that segmental duplication events contributed to the expansion of this gene family. Promoter analysis uncovered several cis-acting elements related to hormone and stress responsiveness, especially abscisic acid-responsive elements (ABREs), suggesting that DlPP2C genes may play a role in ABA signaling pathways. Furthermore, we examined the ABA-responsive expression profiles of DlPP2C genes under exogenous ABA treatments. The expression patterns were dynamic and dose- and time-dependent, with several genes showing peak expression at 10 μM ABA after 16 h. The DlPP2C1 in particular displayed a strong transcriptional response, indicating its potential role in ABA regulation. While overexpression and GUS staining assays revealed enhanced activity under ABA treatment, further supporting the involvement of PP2C in ABA-responsive regulation, further mechanistic studies are needed for a full characterization. Finally, RNA sequencing analysis revealed a total of 1799 differentially expressed genes in response to ABA, with a prevalence of downregulated genes, showing extensive transcriptional reprogramming. Functional enrichment analysis demonstrated that these genes were largely associated with plant hormone signaling, stress response, and metabolic pathways. Weighted gene co-expression network analysis revealed a total of 32 key gene modules associated with ABA signaling. Collectively, our findings propose that DlPP2C genes, especially DlPP2C1, play a key role in ABA-mediated regulatory networks and provide valuable insights into stress adaptation mechanisms, especially during early somatic embryogenesis in longan.

1. Introduction

Protein phosphatase 2C (PP2C), commonly known as metal-dependent-type protein phosphatases, has serine or threonine as its dephosphorylation site. In comparison to other protein phosphatases, the regulatory subunits are absent in PP2C, making it a monomeric enzyme whose activity depends on Mg2+ or Mn2+. PP2C may lose its activity when Mg2+ or Mn2+ are replaced with other ions such as CA2+ and Zn2+ [1]. The initial report on the PP2C gene family was published in relation to Arabidopsis thaliana and Oryza sativa in early 2008. According to that report, a total of 80 and 90 PP2C genes were found in Arabidopsis thaliana and Oryza sativa, respectively [2].
Longan, also known as “dragon’s eye” or Dimocarpus longan, is a tropical evergreen tree indigenous to Southeast Asia, particularly southern China, Taiwan, and Vietnam. It is closely related to Lychee and Rambutan and is a member of the Sapindaceae family. Significant progress has been made in the molecular research of D. longan, mainly due to genome sequencing initiatives [3]. In longan, somatic embryogenesis has been investigated thoroughly as a model system for regenerating woody plants. To identify the molecular mechanisms underlying embryo development, research has focused on molecular biology and proteomics during somatic embryogenesis, employing methods such as gene cloning, real-time quantitative PCR, and two-dimensional electrophoresis [4,5]. Furthermore, studies on the PP2C gene family have demonstrated its functional significance and evolutionary conservation across several plant species [6]. Techniques for tissue culture have been crucial to the conservation and multiplication of D. longan. These techniques benefit the mass propagation of superior genotypes and conserve cultivars at risk of extinction [7,8].
Previously published studies have shown that the conserved catalytic domains of PP2C in plants are mostly centered at the C terminus, whereas the N terminus serves as an extension zone with weak conservation and varying lengths, resulting in the different functioning of PP2C [9,10]. The clade A PP2C in Arabidopsis serves as a negative regulator in ABA signal transduction pathways. For instance, the AtABI1 (a clade A PP2C member) has a conserved sequence at its C terminus, which forms a ternary complex with the ABA receptor (PYL) and SnRK2 kinases, thereby modulating downstream stress activities [11].
Genome sequencing and various bioinformatics software have provided basic yet powerful tools for the identification and analysis of gene families. At present, a large number of gene families have been identified and characterized at the whole-genome level, including TF families in Dimocarpus longan, including (bZIP, B3, ARF, ABI, MYB and NAC) [12,13,14,15,16]. PP2Cs are well organized as key negative regulators in core ABA signaling pathways, modulating the activities of downstream kinases and transcription factors to fine-tune plant responses to environmental stimuli. Although PP2C gene families have been extensively characterized in several model crop species, including grape (Vitis vinifera L.) [17], litchi (Litchi Chinensis Sonn.) [18], cucumber [19], strawberries (Fragaria ananassa) [20], peanut (Arachis hypogaea) [21] and soyabean (Glycine max) [22], but their deification and functional roles in Dimocarpus longan remain largely unexplored.
Here, a total of 71 DlPP2C genes were identified, and a comprehensive genome-wide analysis was performed to investigate their structural features, evolutionary relationships, and expression patterns. Furthermore, we functionally characterized DlPP2C1 using transient overexpression and GUS assays and integrated transcriptomic analysis to elucidate its role in the ABA-responsive regulatory cascade. Our findings provide new insights into the molecular mechanisms underlying ABA signaling during early somatic embryogenesis in longan and establish a foundation for future studies on stress adaptation and genetic improvement of this economically important fruit crop.

2. Results

2.1. Physicochemical Properties Analysis of DlPP2C Gene Family

Based on the physicochemical properties, the structural features, and possible functional properties of the 71 PP2C proteins detected in Dimocarpus longan were analyzed. These were the amino acid length, molecular weight (MW), isoelectric point (pI), instability index (II), aliphatic index (AI), grand average of hydropathicity (GRAVY), and predicted subcellular localization (Table 1). The sizes of the DlPP2C proteins differed significantly, ranging from 155 amino acids (DIPP2C54) to 1018 amino acids (DIPP2C69), with a molecular weight of 17,163.21 Da to 28,459.06 kDa, respectively. Most plant proteins are usually in the 10–100 Da diameter range; however, because of its comparatively large size, DIPP2C69 might have a more complicated structure, possibly enclosing more functional domains or regulatory regions than smaller proteins like DIPP2C33. The estimated isoelectric points were between 4.83 (DIPP2C52) and 8.91 (DIPP2C34), indicating a high variation in the charge features of the proteins. The pI values of most of the DlPP2C proteins were below 7, implying that they are mainly acidic. This property could enable them to be soluble and exercise their activity in intracellular organelles like the chloroplasts and the cytoplasm. The instability index was used to estimate protein stability, which varied significantly among DlPP2Cs, with a range of 31.26 (DlPP2C5) to 65.62 (DlPP2C30). Proteins that have an instability index above 40 are normally regarded as unstable, and therefore, a significant percentage of DlPP2C proteins might be less stable in vitro. Conversely, the aliphatic index (AI), a measure of the volume of aliphatic side chains (a measure of stability), ranged between 68.07 (DIPP2C1) and 101.12 (DIPP2C41). It is worth noting that a higher AI value is an indicator of increased structural stability, which means that a portion of DlPP2C proteins can maintain stability in different environmental conditions despite increased instability index. The GRAVY values were above −0.579 (DIPP2C5) and below 0.013 (DIPP2C56). The existence of negative GRAVY values implies that the majority of the proteins of DlPP2C are hydrophilic, which is a property commonly linked with soluble proteins that have a role in intracellular signaling. This finding is in line with the overall functional role of PP2C proteins in the plant signaling pathways. Subcellular localization prediction revealed that DlPP2C proteins are spread throughout various cellular compartments, such as the nucleus, cytosol, chloroplasts, mitochondria, vacuoles, and the plasma membrane. Such a large-scale localization pattern indicates that the DlPP2C proteins are involved in numerous biological processes, primarily in signal transduction and stress response, as well as metabolic processes.

2.2. Evolutionary Analysis of the PP2C Gene Family

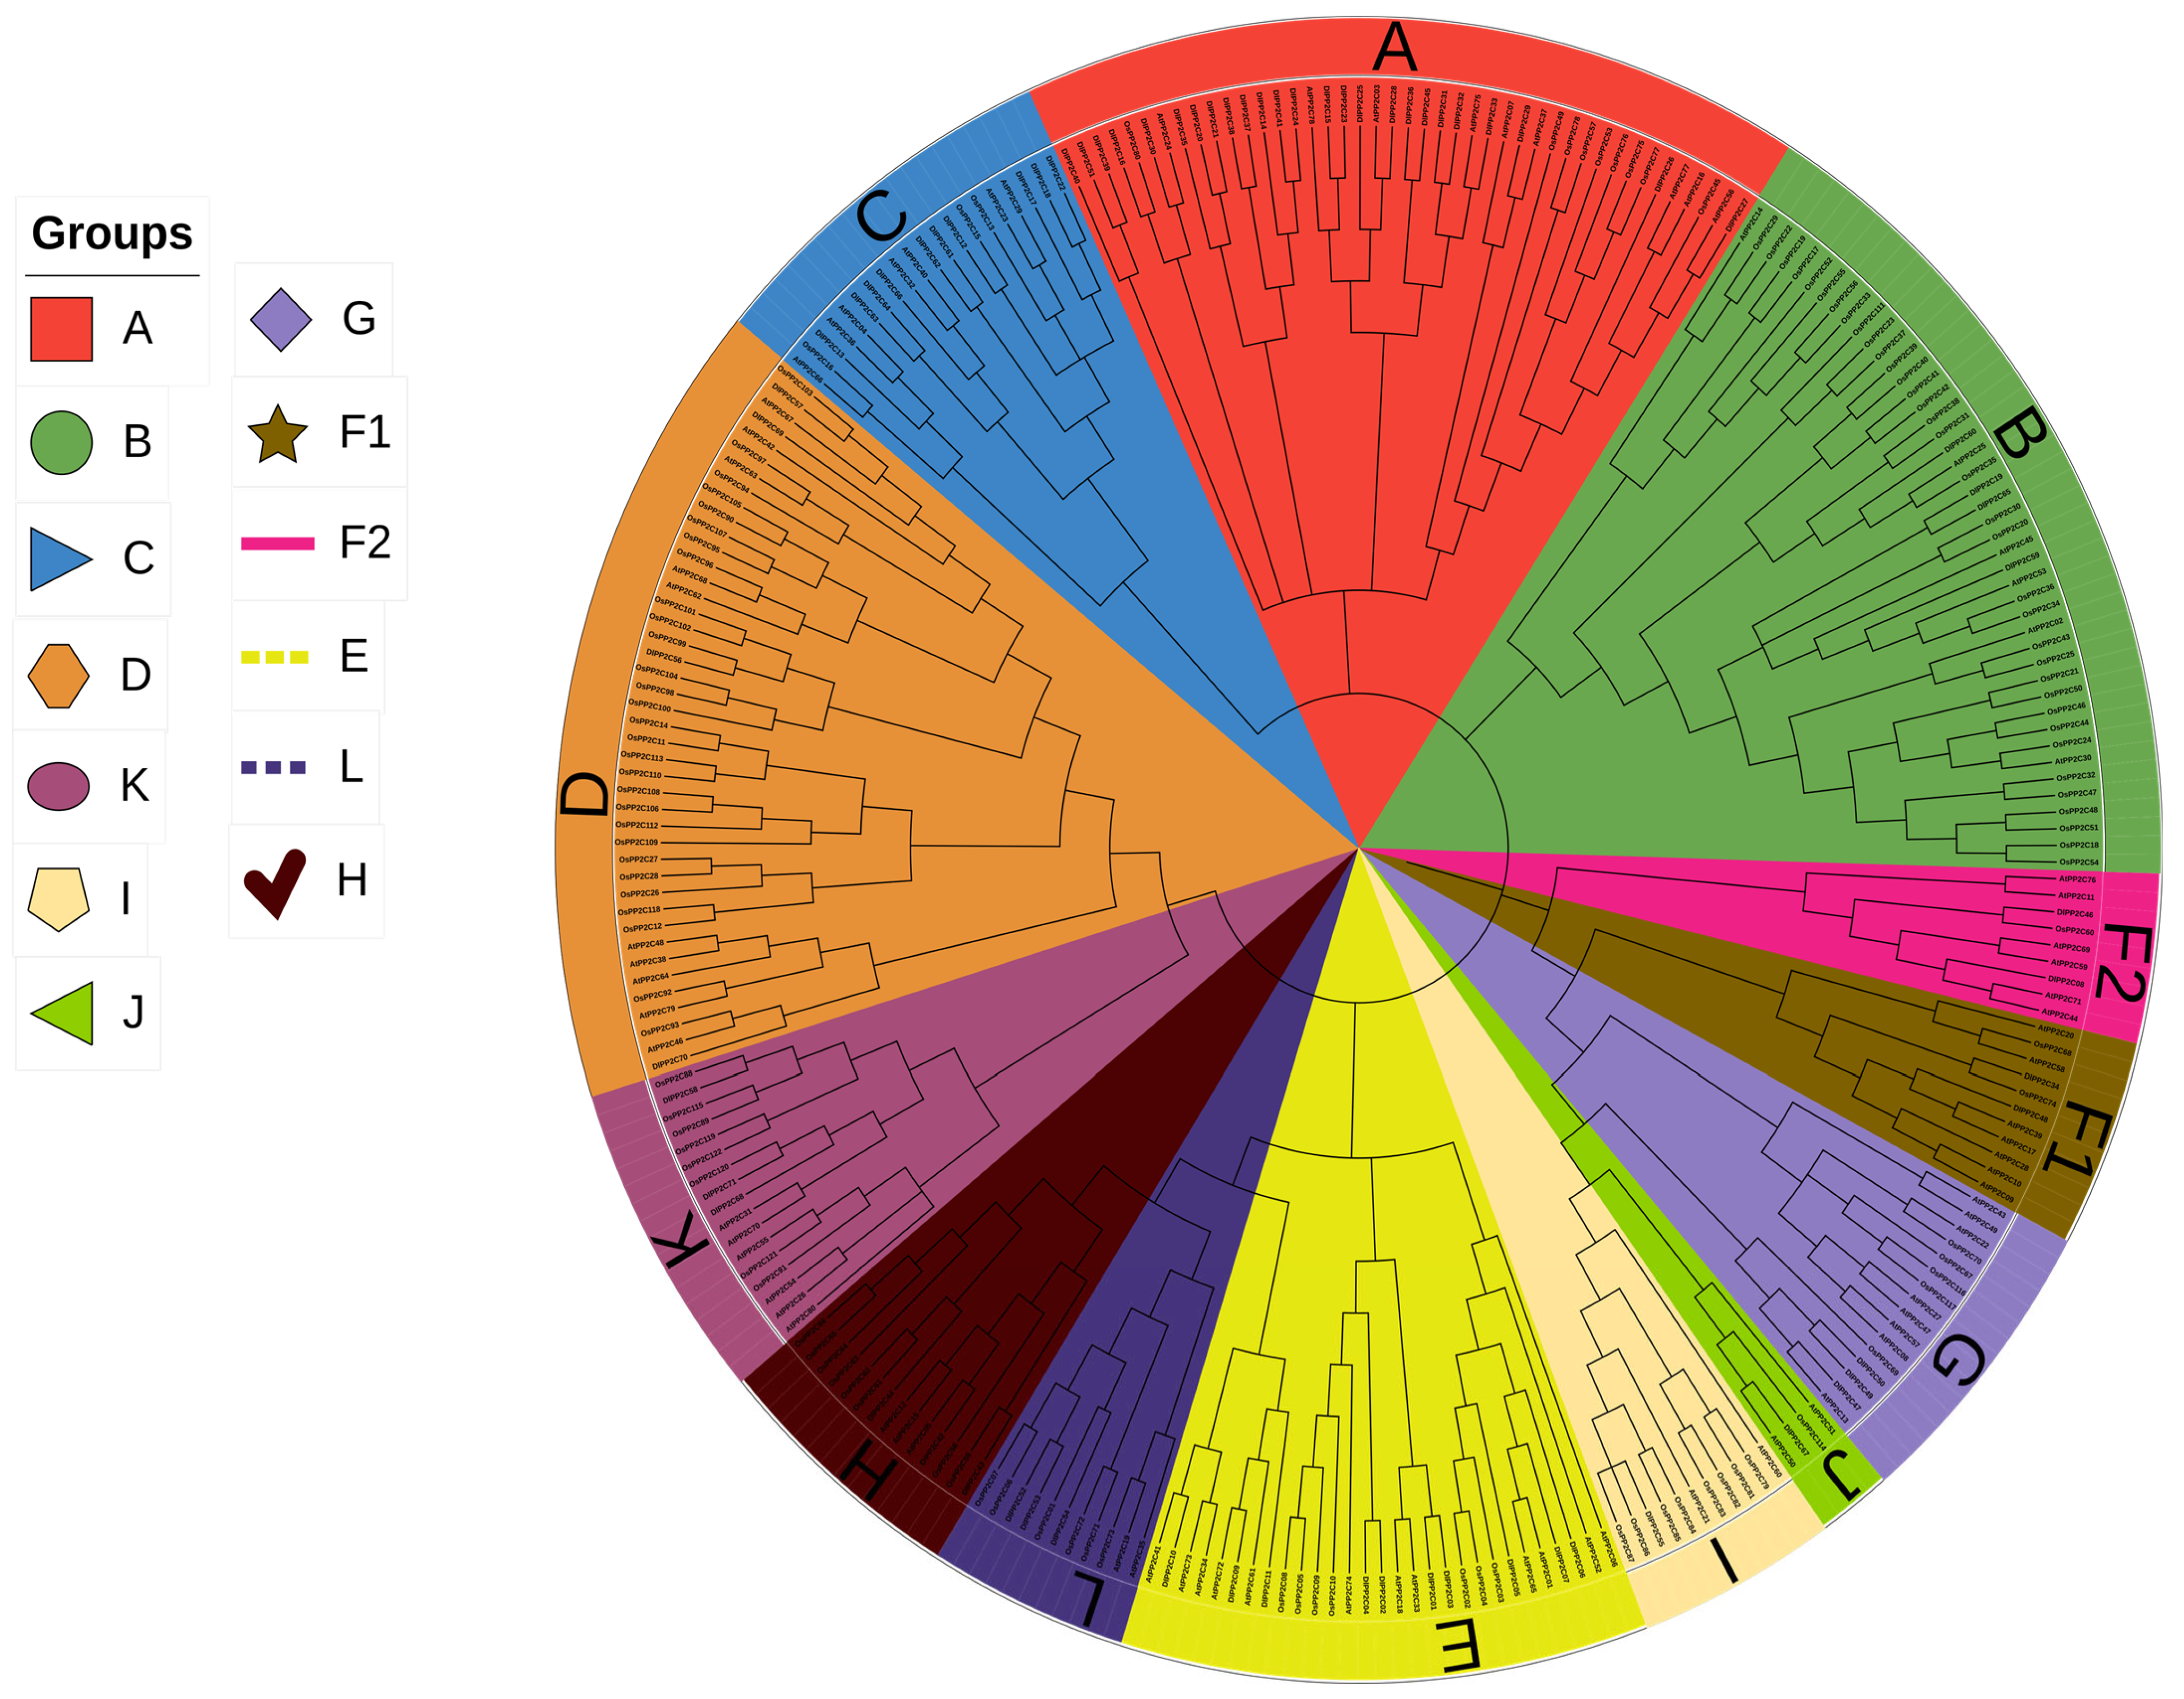
In order to render the patterns of evolution and possible diversification of the DlPP2C gene family in terms of functionality, a phylogenetic tree was built using the multiple sequence alignment of the conserved PP2C catalytic domain. PP2C proteins of Dimocarpus longan, Arabidopsis thaliana, and Oryza sativa, belonging to dicot and monocot species, were analyzed. According to the phylogenetic topology, these PP2C proteins were divided into various clades (A–L). Each clade has a distinctive color, which indicates the evolutionary divergence of the proteins and their evolutionary subgroups (Figure 1). D. longan contains 71 PP2C genes, which is similar to the 80 reported members in A. thaliana but significantly lower than the 90 reported members in rice. The phylogenetic tree also revealed that the major clades did not have an even number of DlPP2C members. Clade A comprised the most members, 25 DlPP2C, and clade D had 1 DlPP2C. Clades F1 and F2 comprised four proteins of the DlPP2C group, and one of them was the smallest, consisting of one DlPP2C protein. Interestingly, DlPP2C was found in all the clades (A–L), and there was no significant decrease in PP2C in longan. The DlPP2C proteins within a clade were further clustered with their homologs of either A. thaliana or O. sativa, indicating that the large subfamilies of PP2C are very conserved across dicot and monocot species. This conserved phylogenetic distribution suggests that the split of PP2C genes probably preceded the split of those plants’ lineages. The fact that all major subgroups have representatives in longan is another argument in favor of the functional conservativity of PP2C proteins. On the whole, phylogenetic connections give important information on the evolutionary conservation and possible functional similarity of DlPP2C proteins with their homologs in model plant species.

2.3. PP2C Gene Clustering and Distribution of Chromosomes in Longan

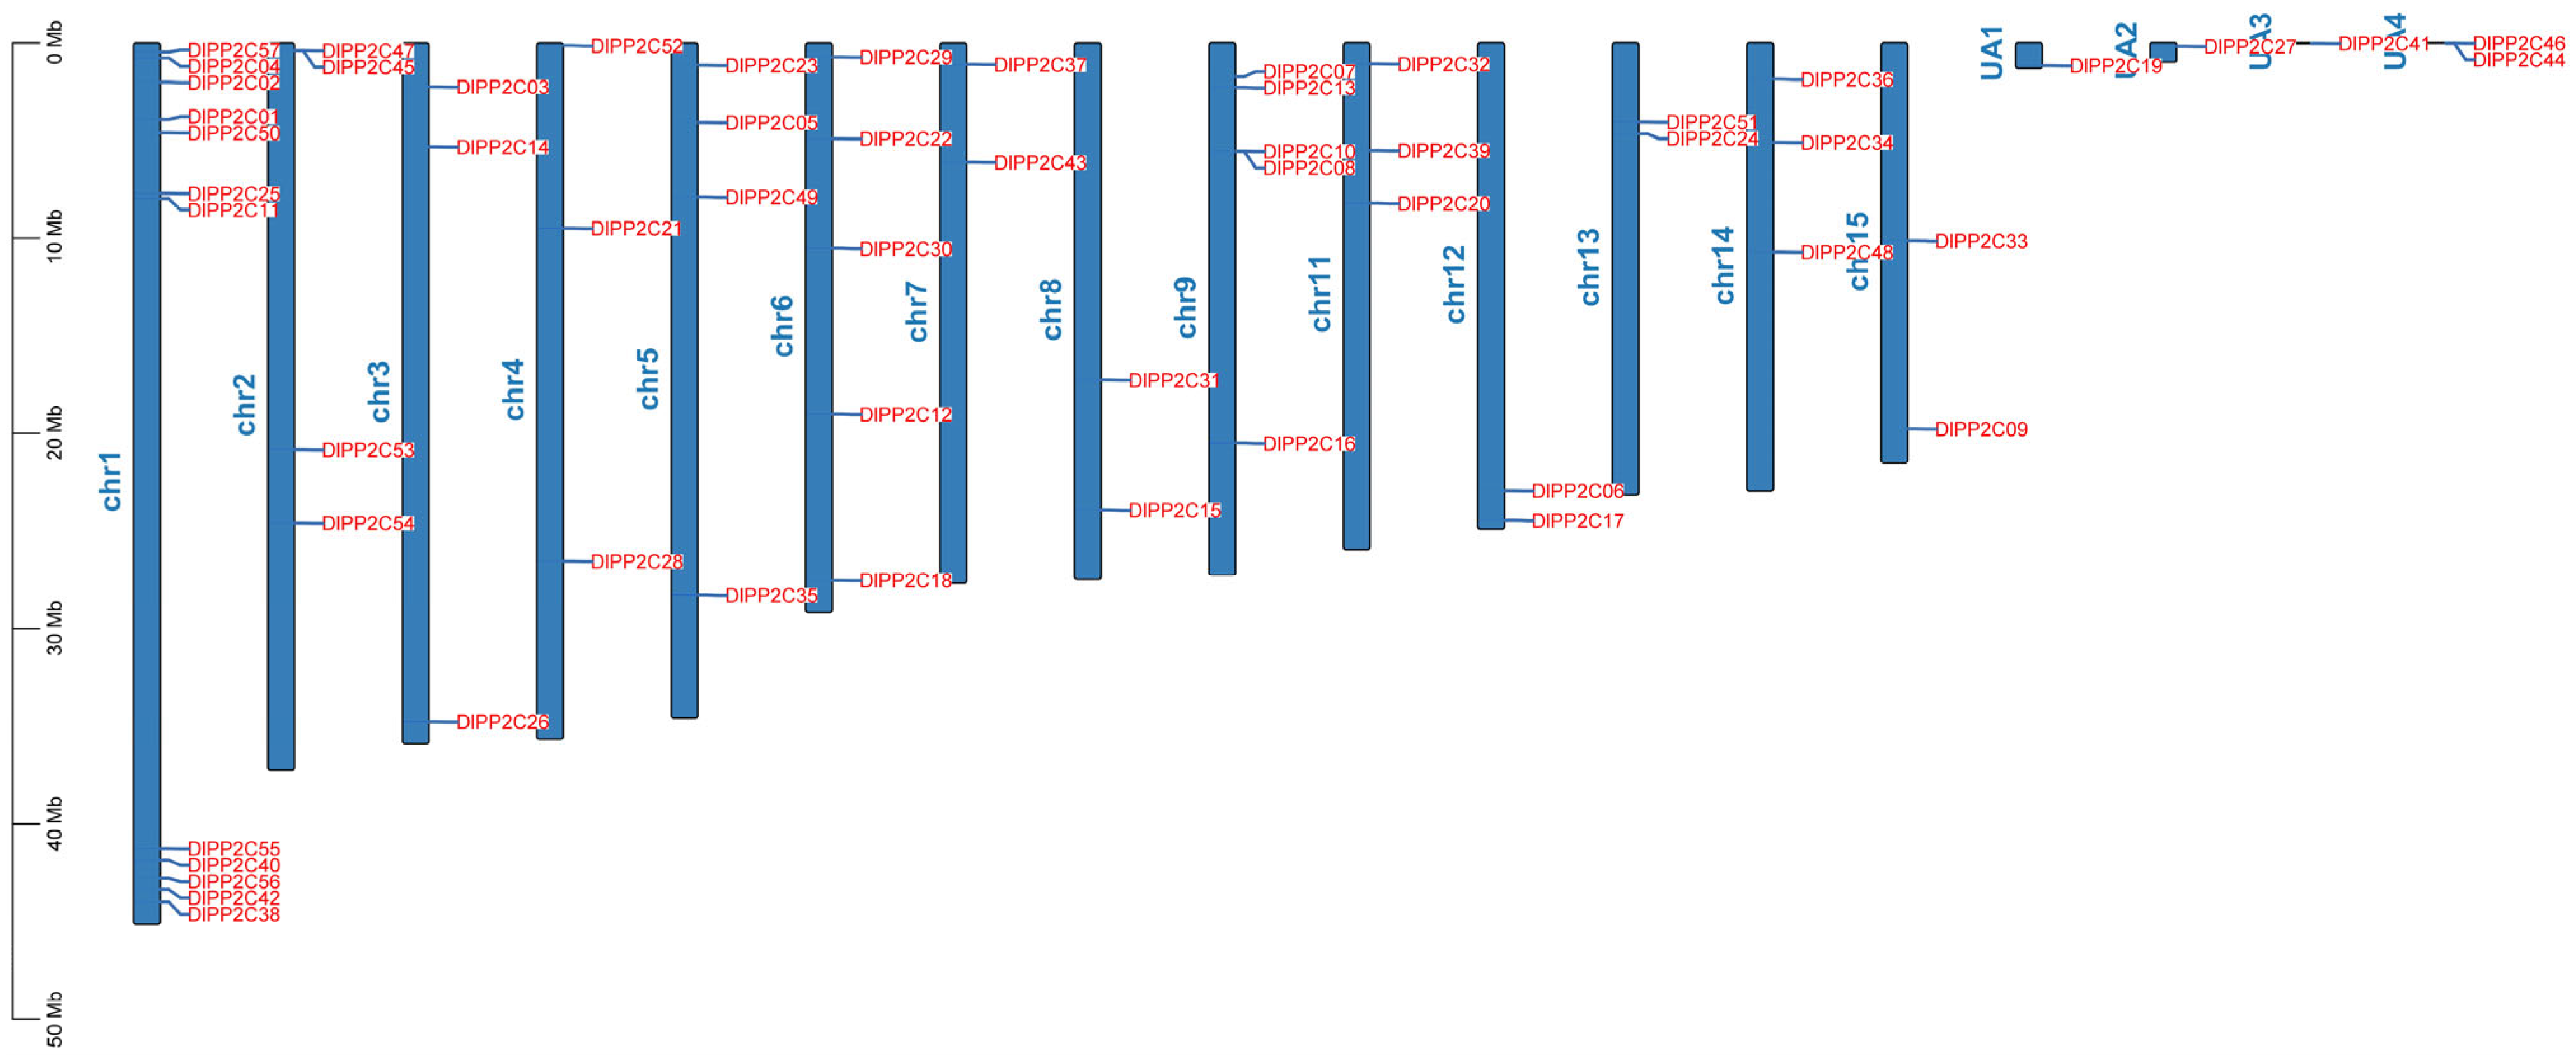
After the discovery of the PP2C gene family, 71 possible DlPP2C genes have been mapped onto the longan genome and systematically renamed according to their position in the chromosome and physical order, from DlPP2C1 to DlPP2C71. The genes of DlPP2C were unevenly distributed in the chromosomes, and there were local instances of gene clustering. It is worth noting that DlPP2C genes were evenly spread in various chromosomes, even though their abundance was extremely uneven. A total of fifteen DlPP2C genes were found on chromosome 1, whereas only two DlPP2C genes were observed on chromosome 15. Moreover, there were 2 DlPP2C gene members in chromosomes 3, 4, 11, and 14, but 2 genes on chromosomes 7, 8, 12, and 13. Such a non-random pattern of distribution indicates that specific areas of the chromosomes can be PP2C-enriched loci. Furthermore, a total of 5 DlPP2C genes were found in unanchored (UA) scaffolds, which illustrates that the genes are present in the assembled genome, but their actual chromosomal positions were not determined (Figure 2). Comprehensively, chromosomal localization analysis offers important data that lead to the understanding of the genomic organization of the DIPP2C gene family. The difference in the number and distribution of the genes on the chromosomes may reflect lineage-specific expansion patterns that may either be related to evolutionary adaptation or the functional specialty of PP2C genes in longan. The comprehensive details are shown in Supplementary Table S1, showing chromosomes, gene count, and gene density.

2.4. Synteny Analysis and Chromosomal Duplication of DlPP2C Genes

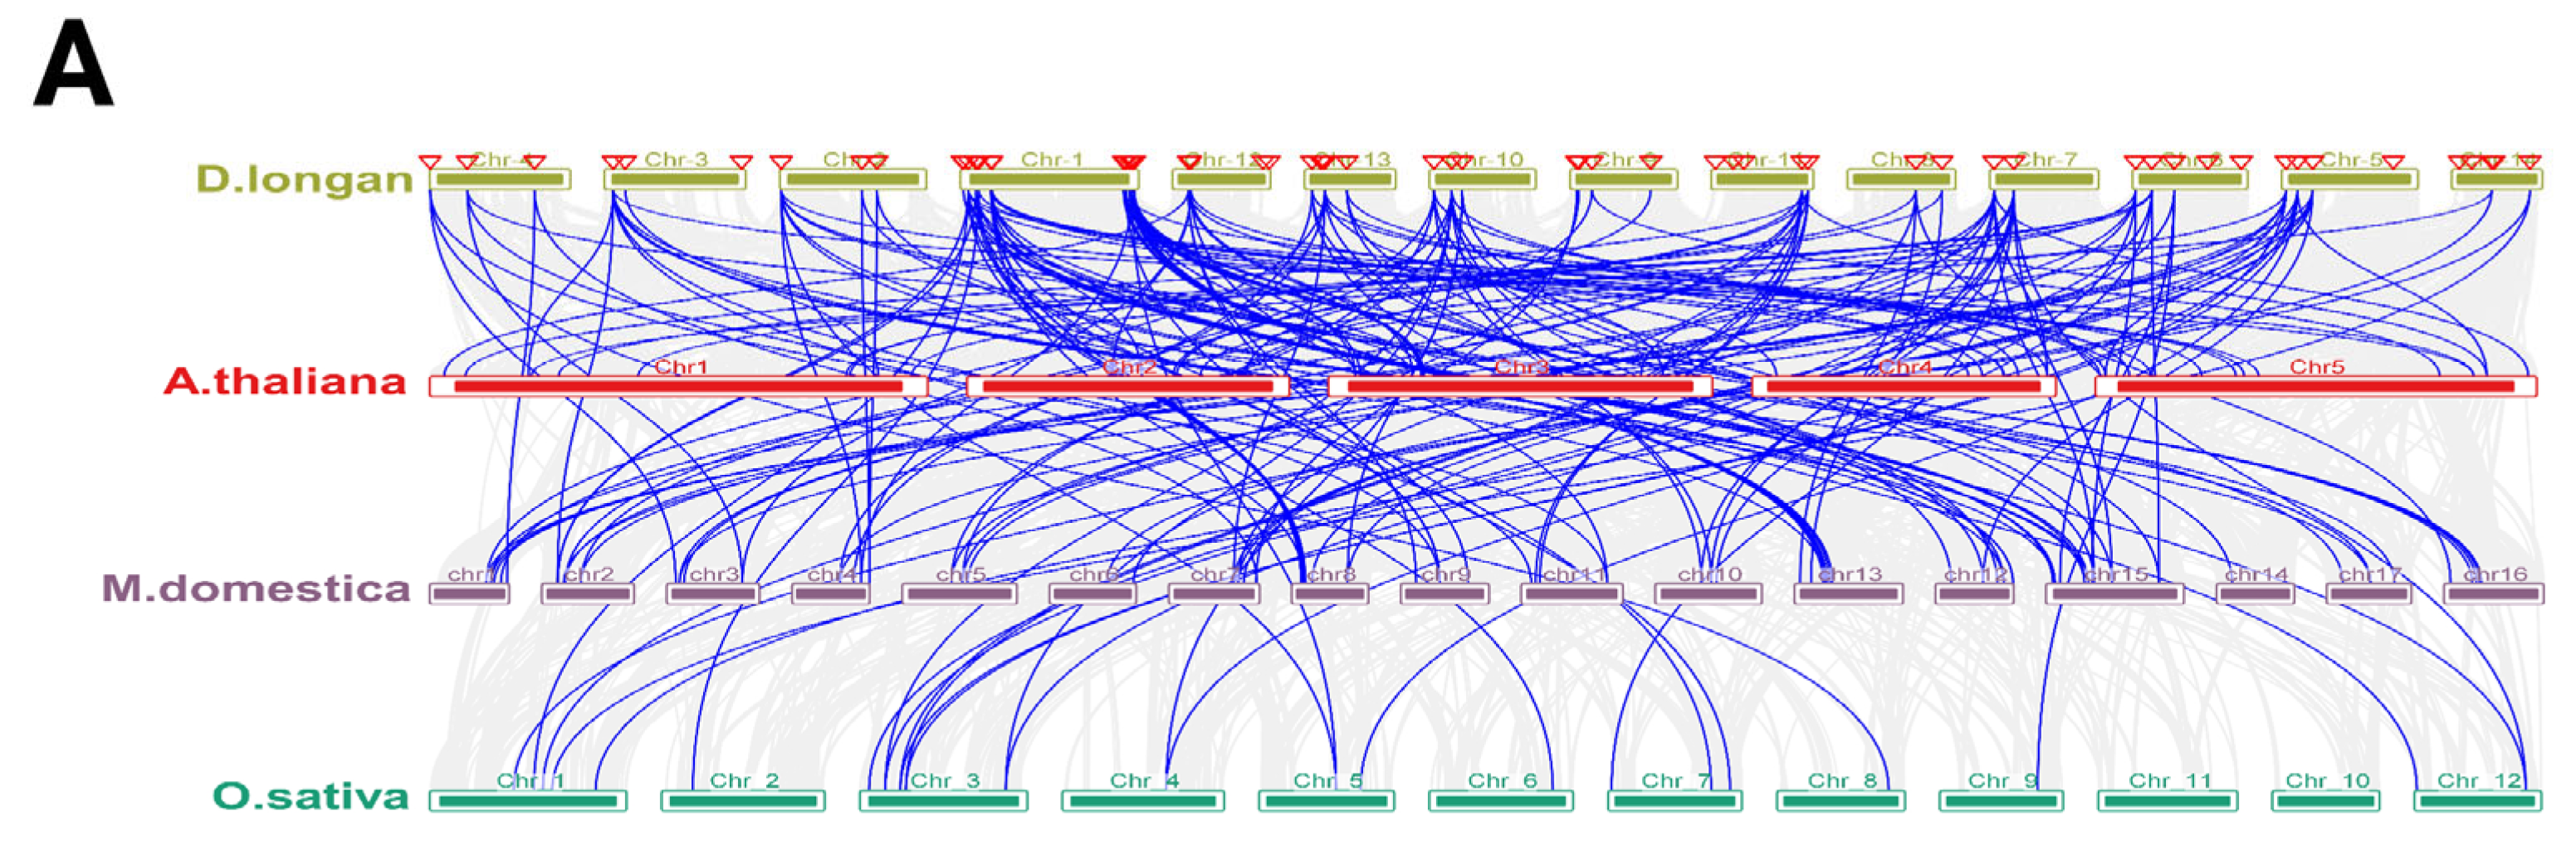
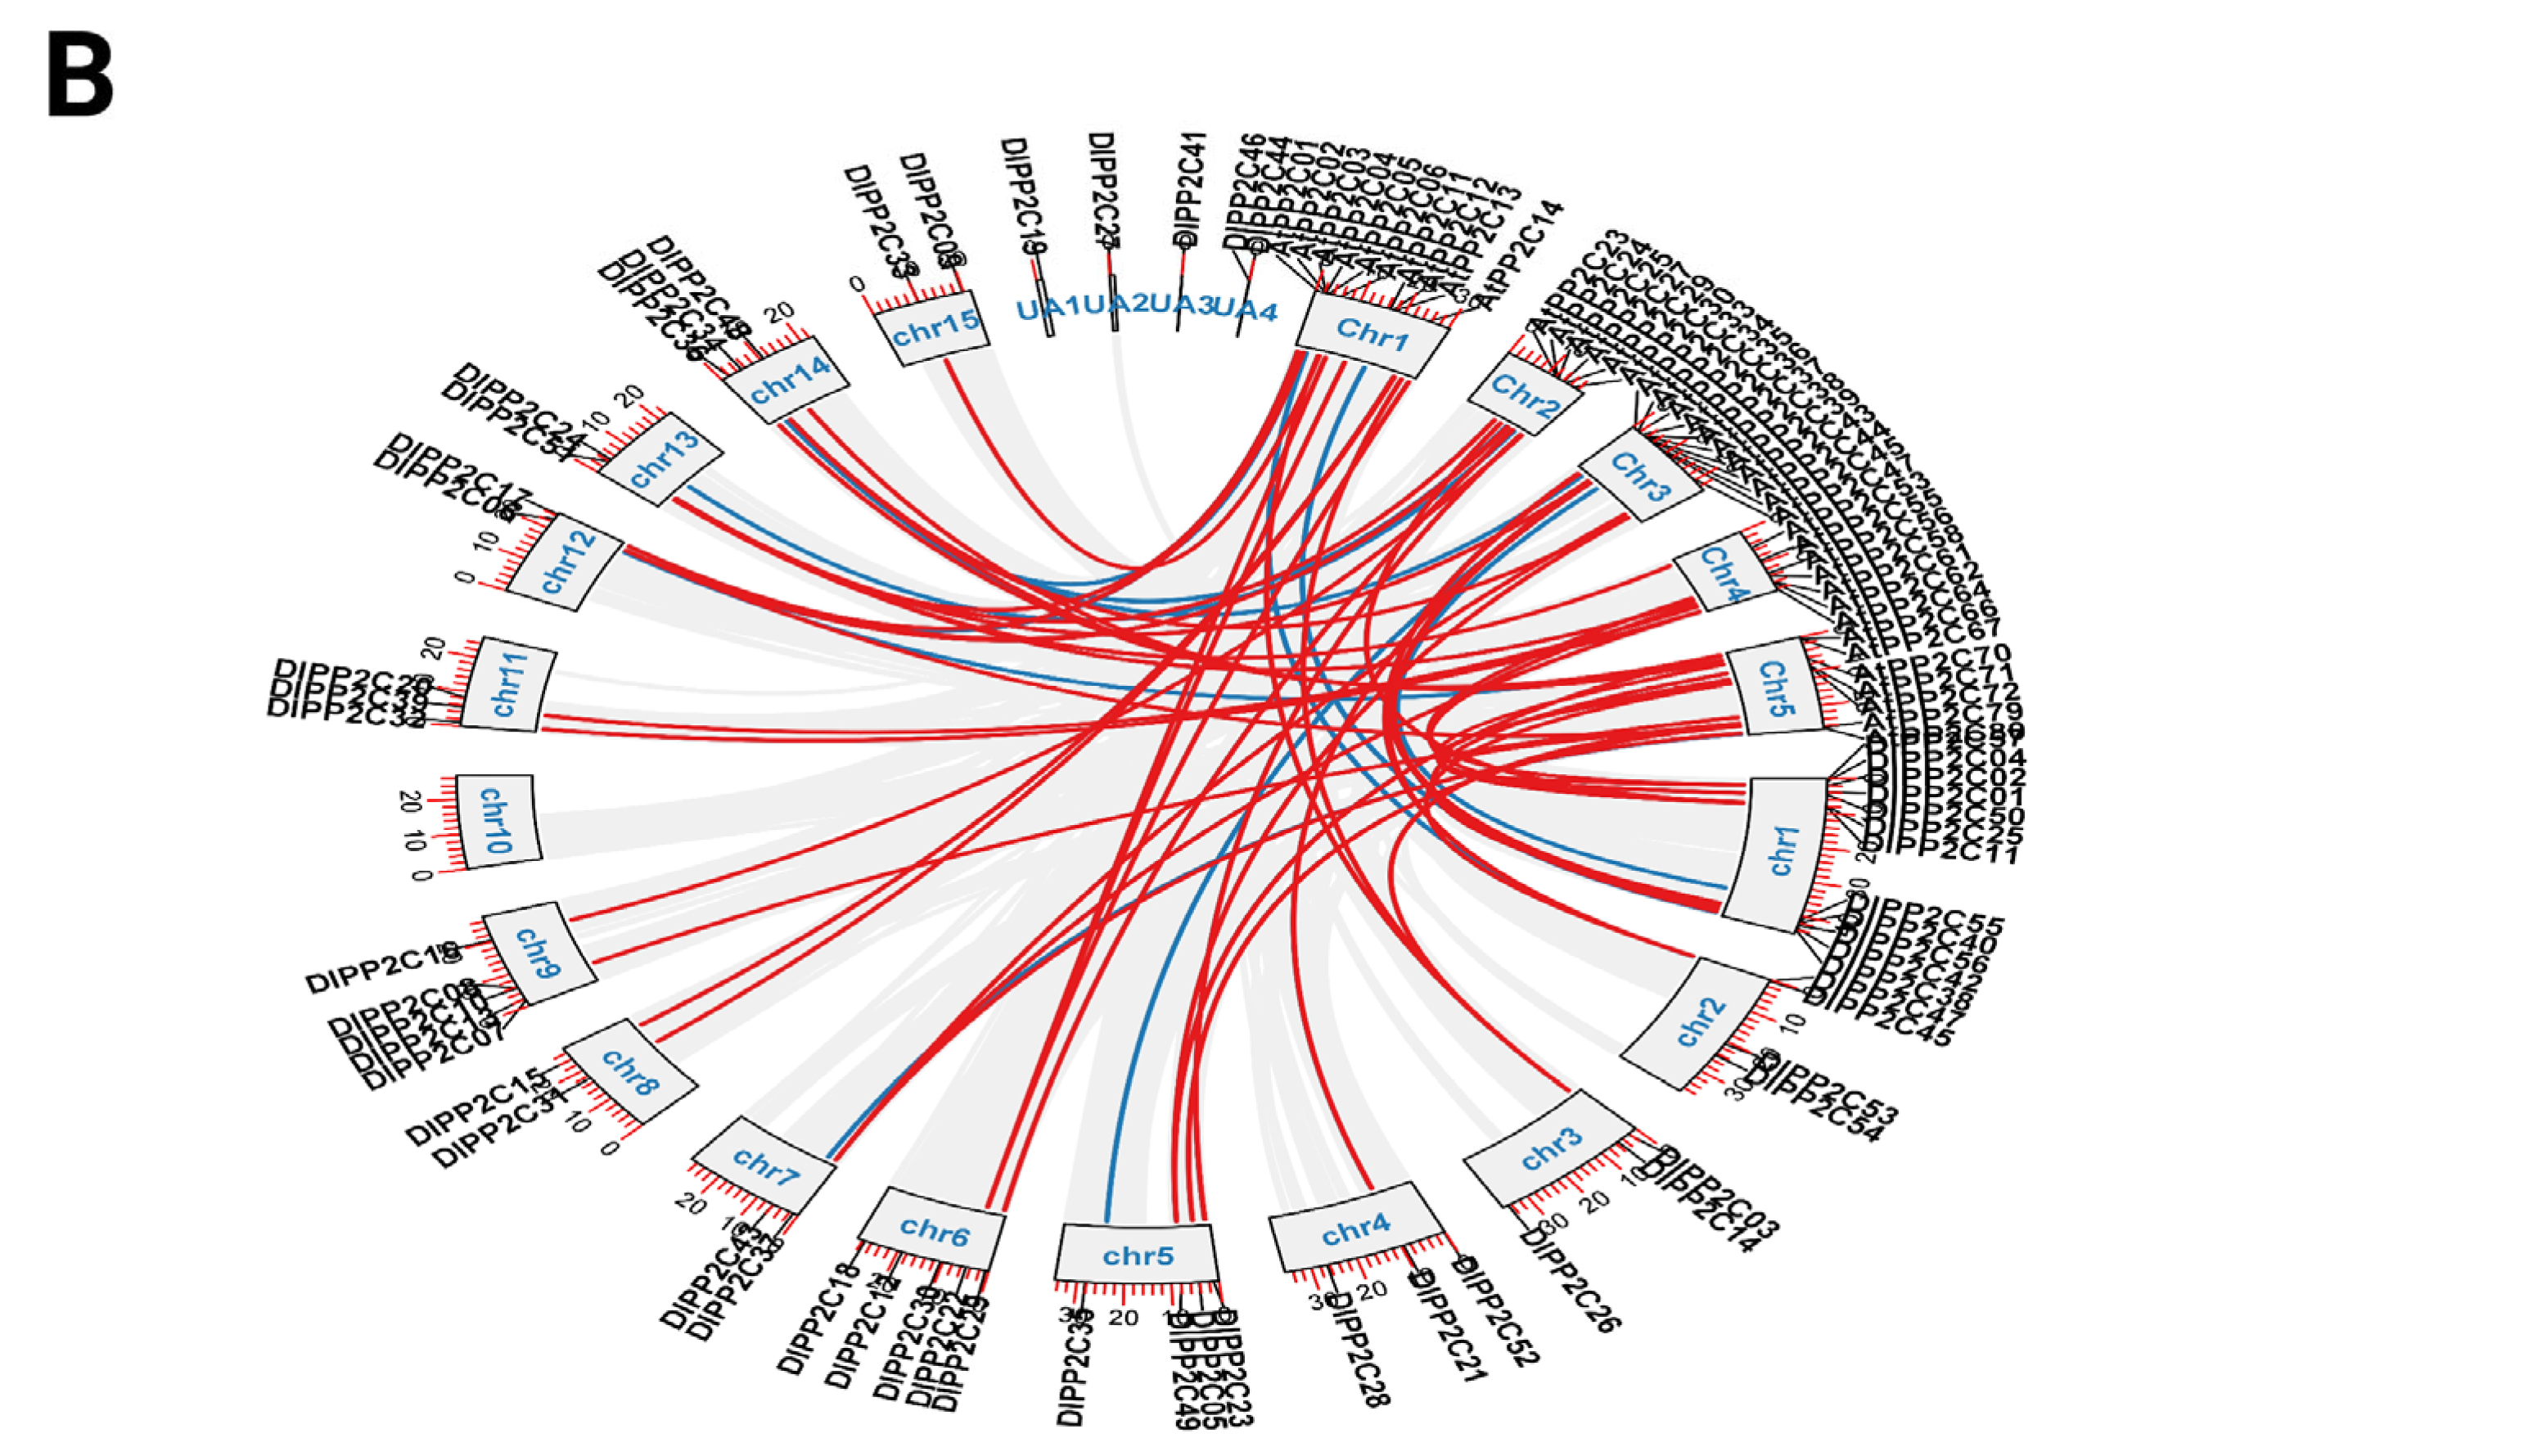
In order to further evaluate the pattern of evolutionary conservation and duplication of the DlPP2C gene family, synteny analysis was conducted to compare Dimocarpus longan, Malus domestica Borkh, and the model plant representatives of dicot and monocot species, Arabidopsis thaliana and Oryza sativa (Figure 3). This analysis demonstrated the presence of massive collinearity among the DlPP2C genes in the longan genome, with many intrachromosomal relationships (Figure 3A). The majority of the duplicated DlPP2C gene copies occurred on other chromosomes; thus, it is possible that segmental duplication or whole-genome duplication (WGD) might be the major driving force behind the expansion of the PP2C gene family in longan. Conversely, the number of duplicated gene pairs in close proximity was few, which is another sign that tandem duplication has been a rather minor process. Interestingly, chromosome 9 showed the highest number of collinearity interactions with chromosomes 5, 7, and 8, and so it is possible that the chromosome might be a hot spot of PP2C gene expansion. Also, multiple DlPP2C genes were found within unanchored (UA) genomic regions. But even though these sequences are not yet attached to particular chromosomes, their existence indicates that the sequences can add to the general diversity of the PP2C gene family. Incomplete genome assembly or structural complexity may also hide the true picture of the spread of the PP2C gene because similar associations with unanchored regions were also found in Arabidopsis thaliana (Figure 3B). Overall, the synteny analysis demonstrates the role of the events of segmental and whole-genome duplication in the development and evolution of the DlPP2C gene family. The existing results can provide meaningful information about the evolutionary dynamics and structural preservation of PP2C genes in the plant species.

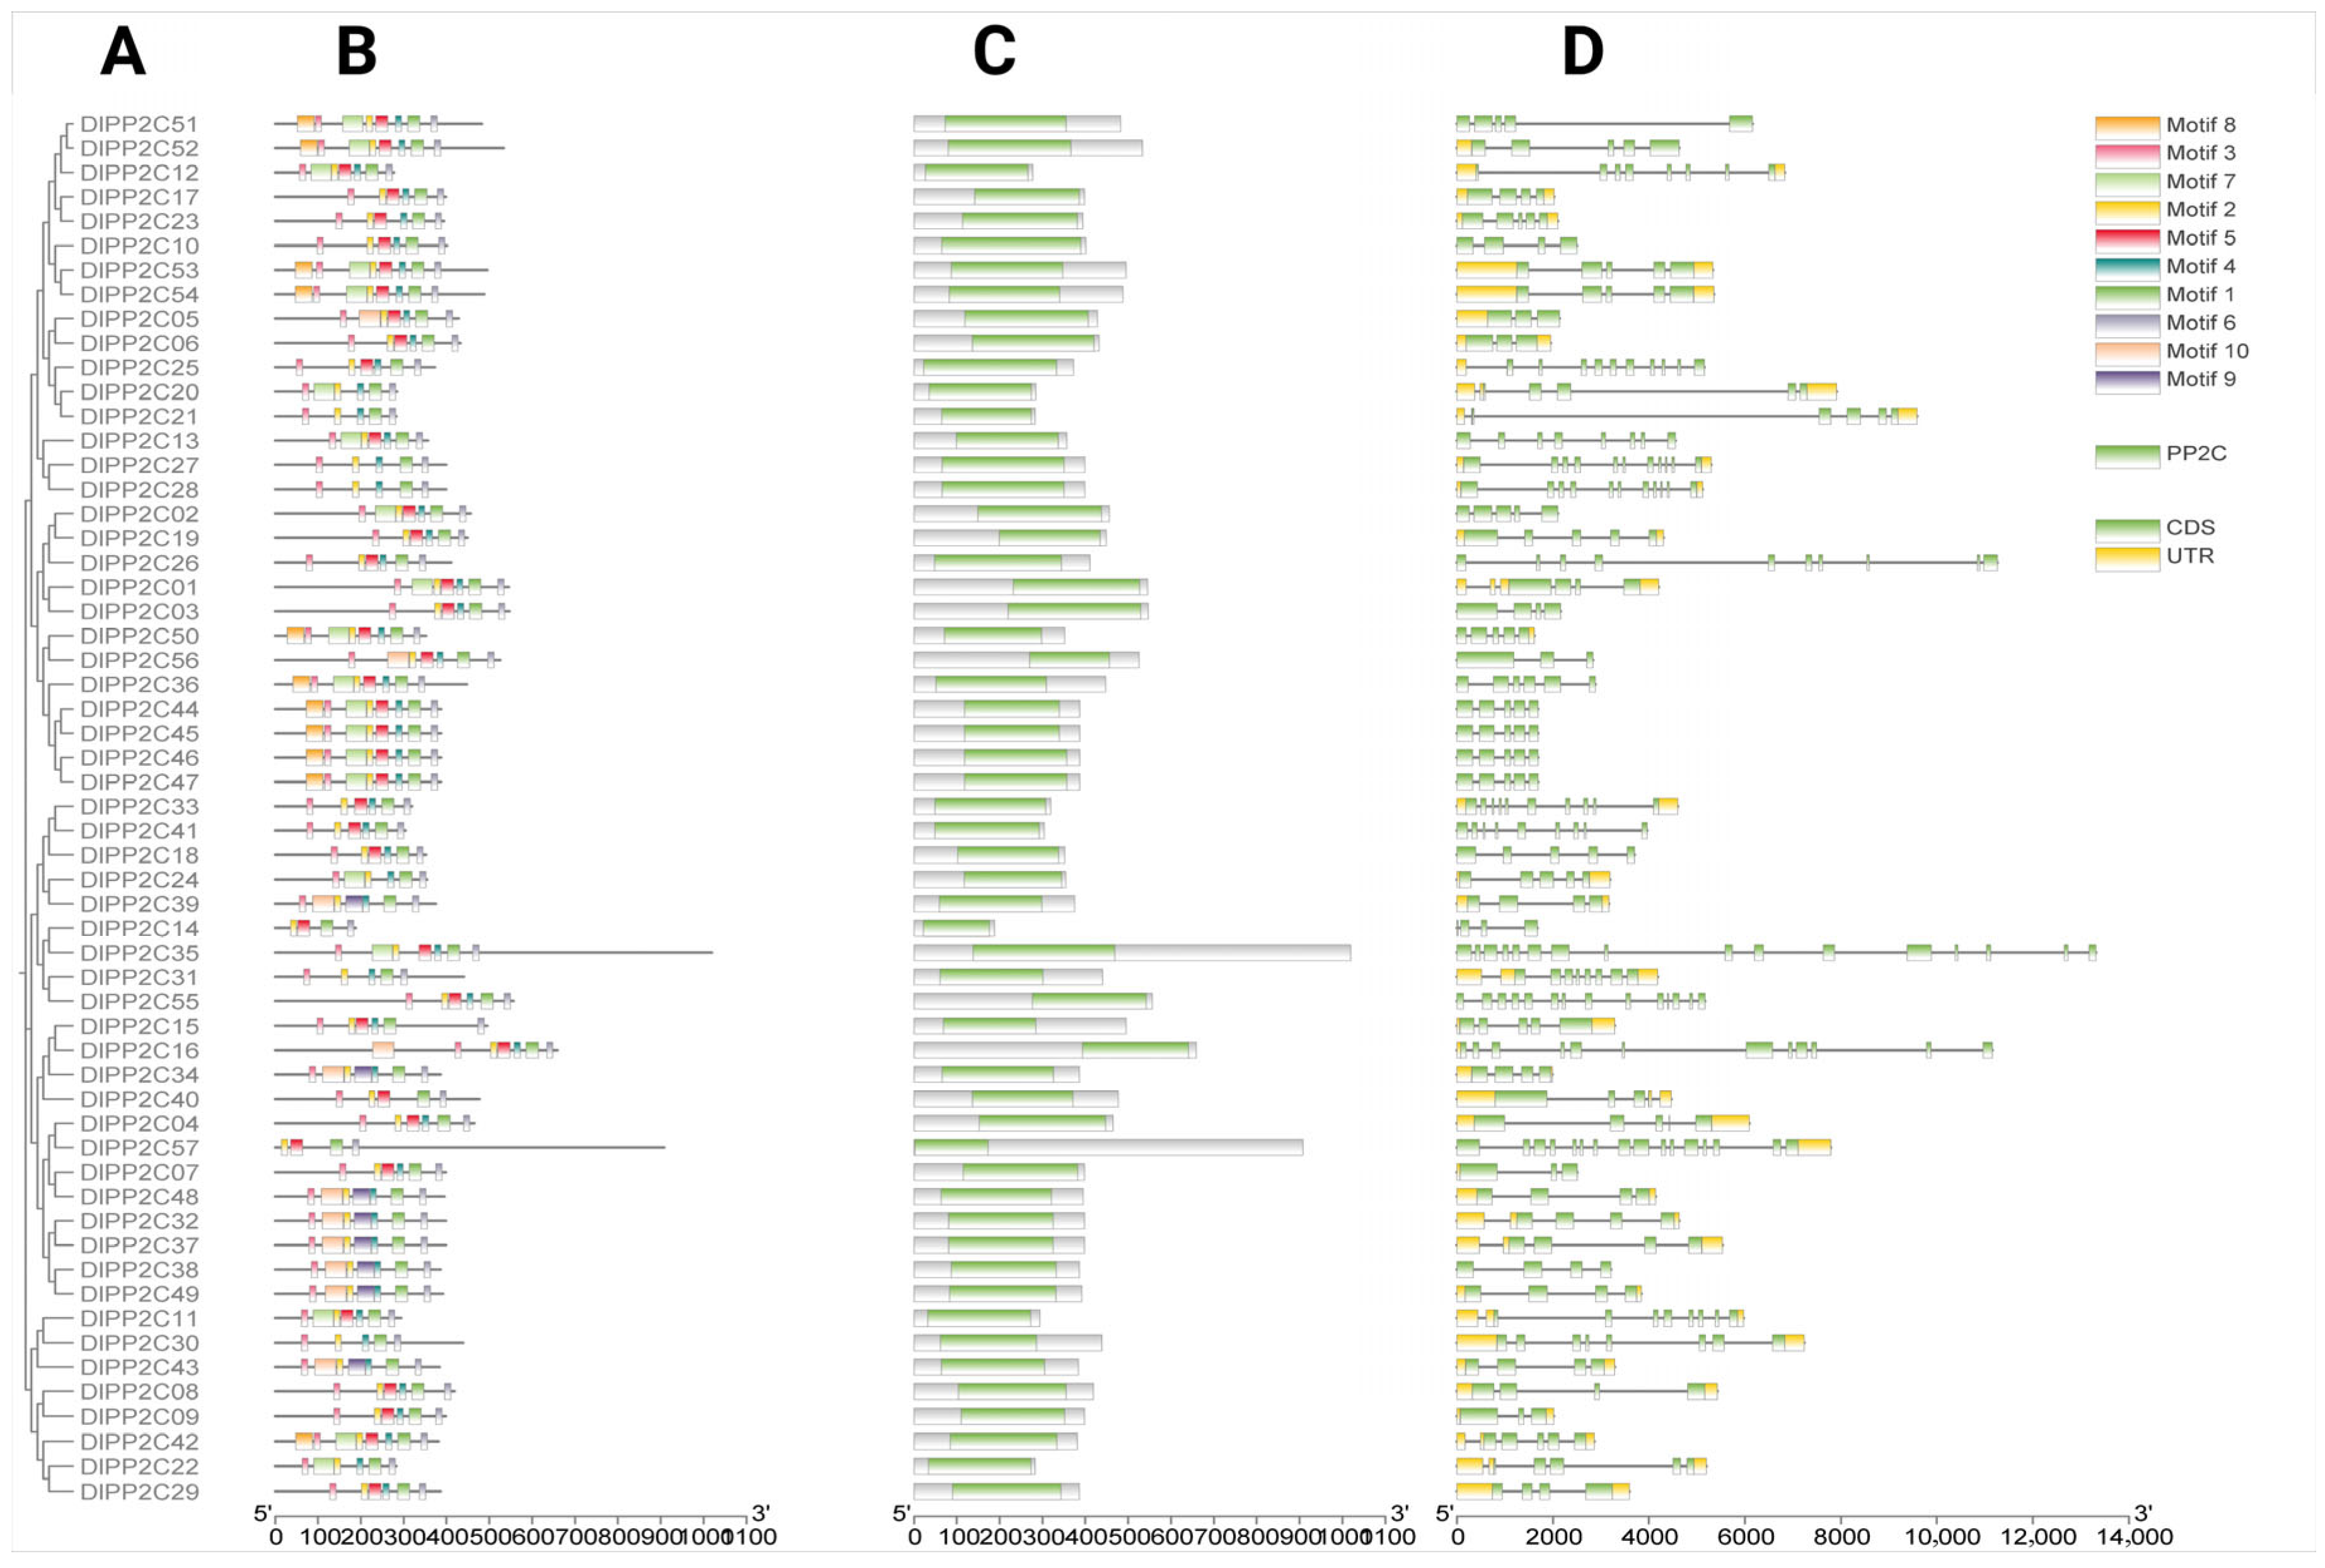
2.5. Gene Structure and Conserved Motifs and Domains Analysis of the DlPP2C Gene Family

Combined phylogenetic, conserved motif, domain analysis, and gene structure analysis allowed further analysis of the structural and evolutionary associations of the DIPP2C gene family (Figure 4). The conserved motif distribution analysis showed that proteins of DIPP2Cs have some common motifs that are similar to the conserved functional regions and are necessary for catalytic activity. It is also noteworthy that members of the same evolutionary subgroup had similar motif compositions, which indicated functional preservation, but the differences in the motif arrangement among subgroups could suggest a functional divergence. Domain analysis also revealed that all DlPP2C proteins have conserved PP2C catalytic domains, which are critical in their phosphatase activity. These conservation domains in the family of genes emphasize their central role in conserving core biochemical functions, and minor structural differences could help to explain the differences in substrate specificity or regulatory interactions. Analysis of the gene structure reveals the arrangement of the coding sequences (CDS) and untranslated regions (UTRs) in DIPP2C genes. Regions associated with protein encoding (the CDS regions) had patterns that were relatively conserved across highly related genes. Conversely, it was found that the length and structure of UTRs varied, and this can lead to post-transcriptional regulation, such as mRNA stability and translational efficiency. Taken as a whole, the homogeneity in the structure of genes among subgroups suggests both functionality and diversification in the DlPP2C family.

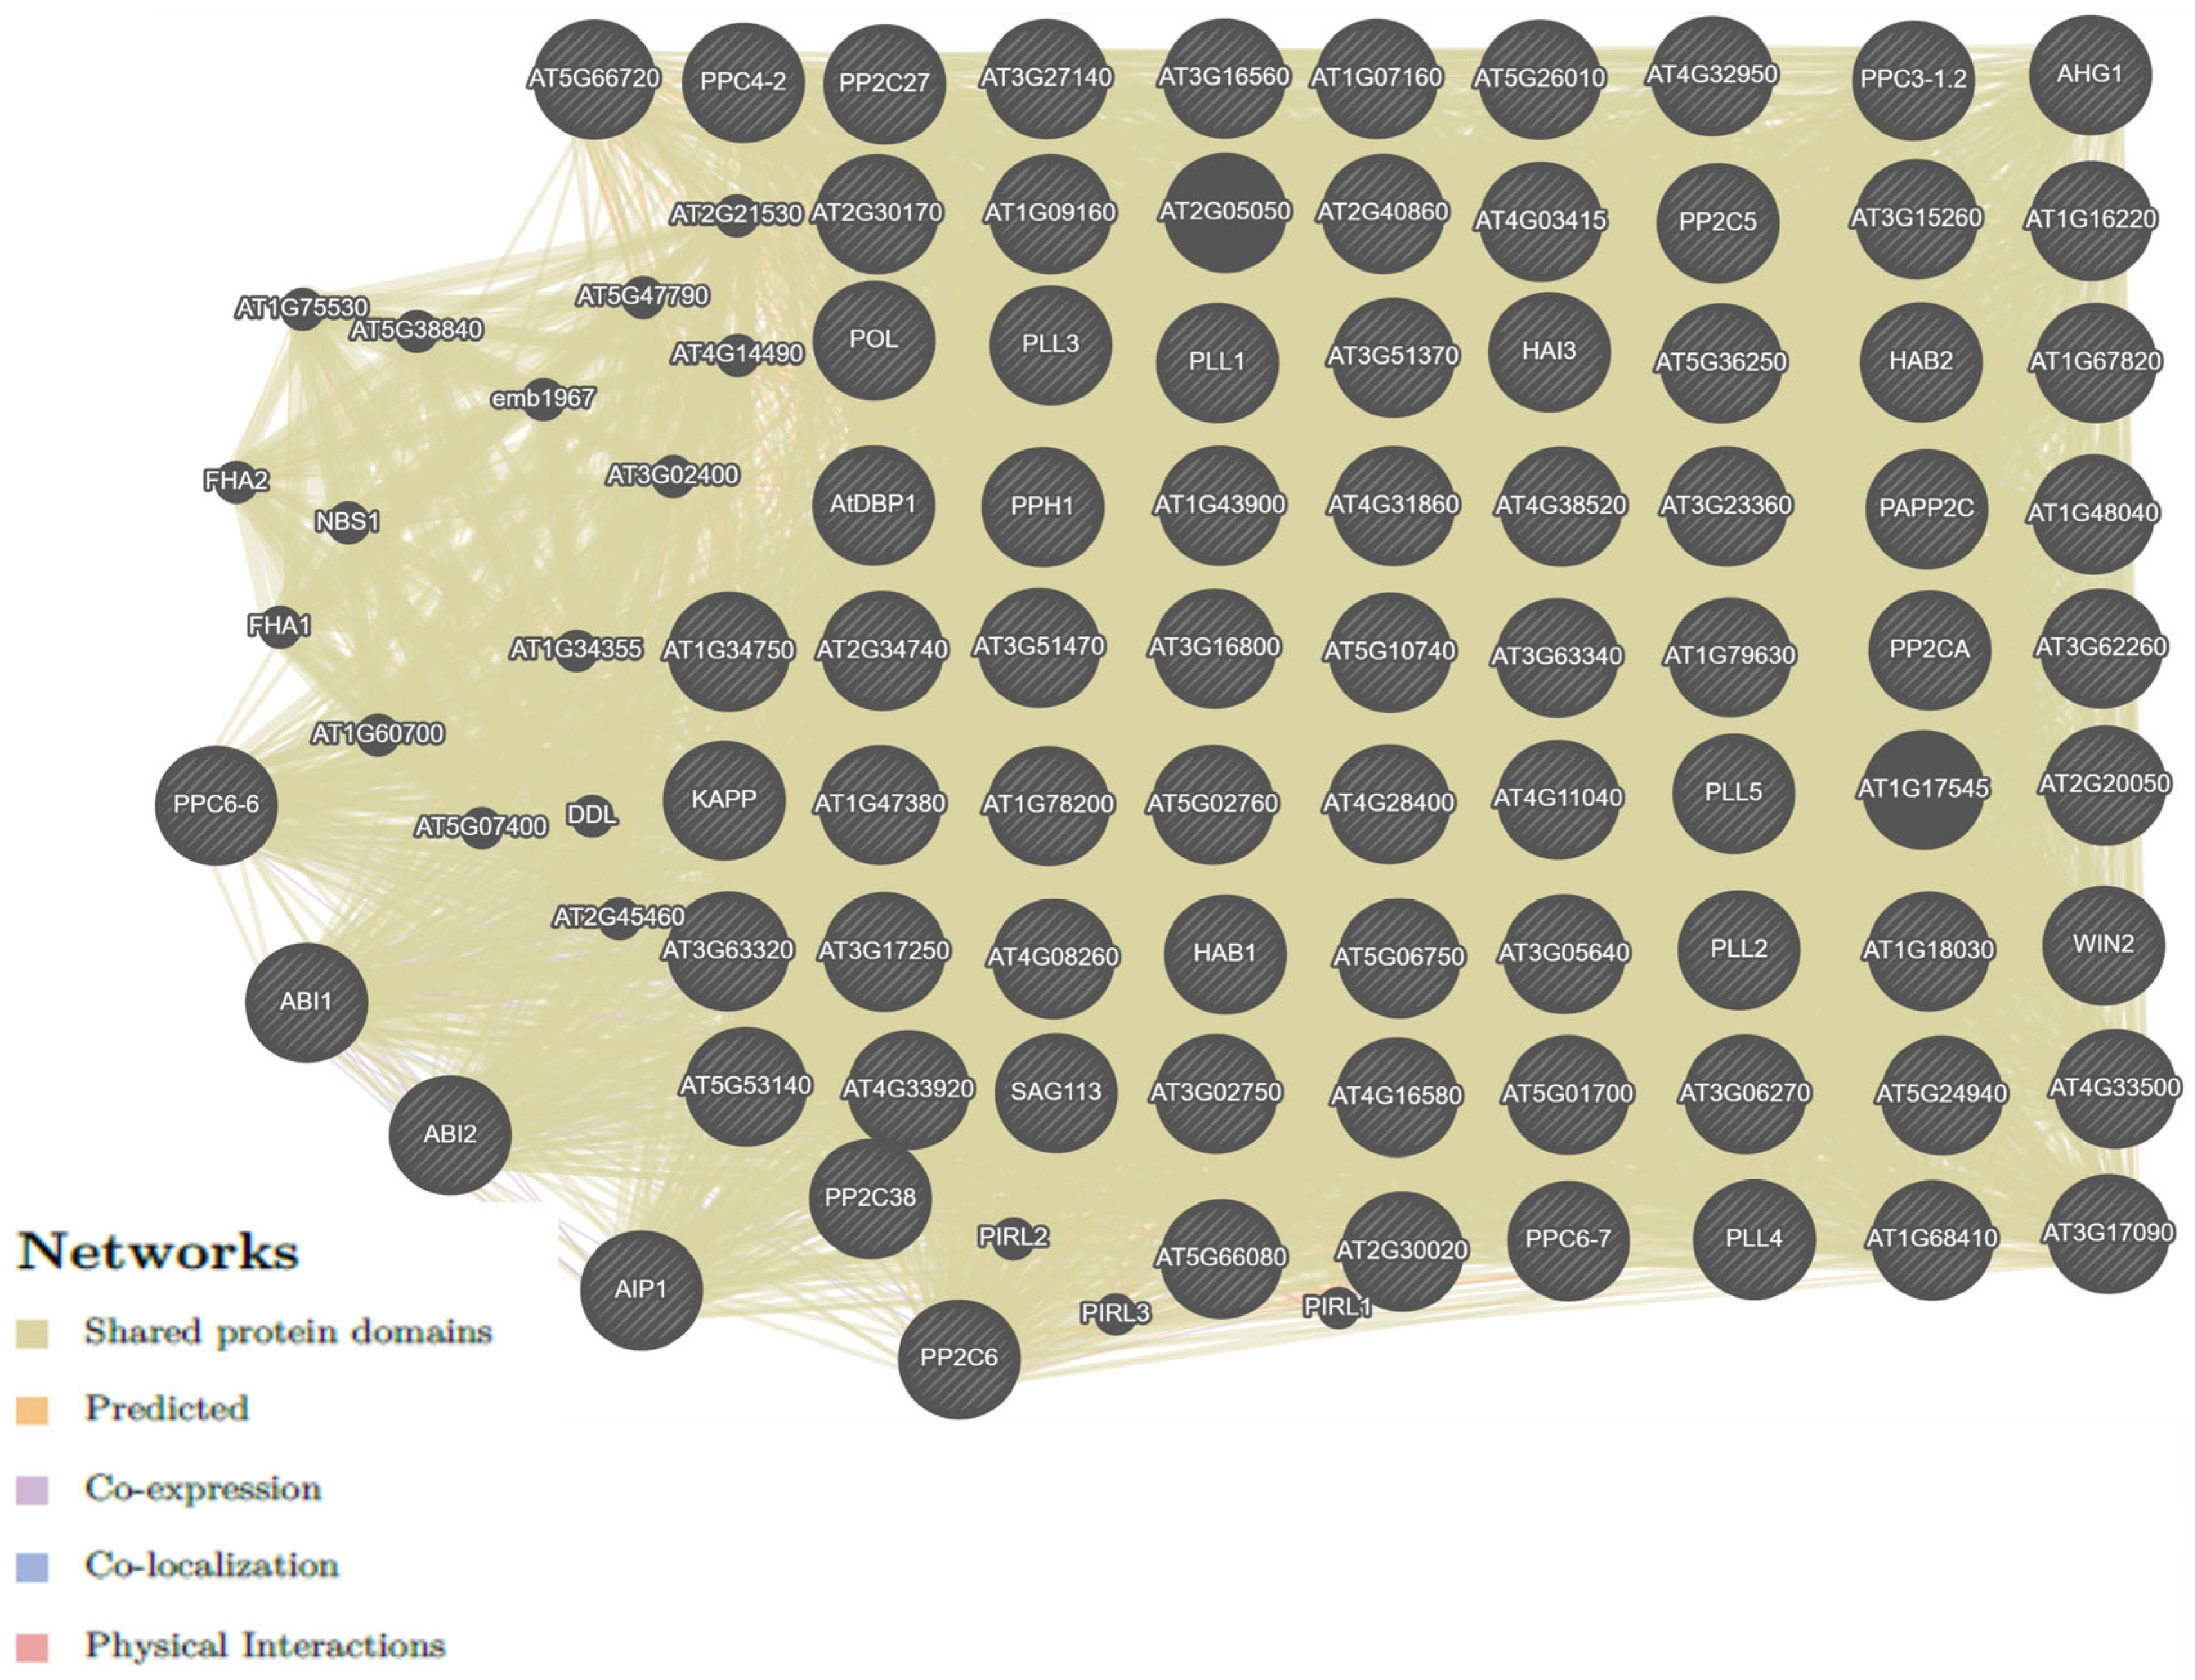
2.6. Protein–Protein Interaction (PPI) Analysis of PP2C Gene Family in Longan

In order to investigate the potential functional regulatory networks involved in DlPP2Cs, a protein–protein interaction (PPI) network was built, based on Arabidopsis thaliana orthologous proteins via the online database GeneMANIA (https://genemania.org) (accessed on 1 May 2026) using default parameters (Figure 5). The corresponding DlPP2C proteins, which have high similarity to those of Arabidopsis thaliana, were denoted as STRING proteins, while each individual node represents all the proteins relevant to a specific protein-coding gene locus. The PPI network shows a complex feature, and some of the DIPP2C proteins provide broad connectivity. It is noteworthy that DlPP2C12, DlPP2C18, and DlPP2C29 have more patterns of interaction, implying that these proteins may be the key to a number of cell events. Interaction pattern annotation showed that DIPP2C proteins could be implicated in a number of biological pathways, such as signal transduction, stress response, metabolic control, and cellular homeostasis. The high connectivity of the network indicates that the DlPP2C proteins may serve as significant parts of the protein complexes in order to organize responses in the cell. A detailed report has been provided in Supplementary Table S2.

2.7. Cis-Acting Elements Analysis of the PP2C Gene Family in D. longan

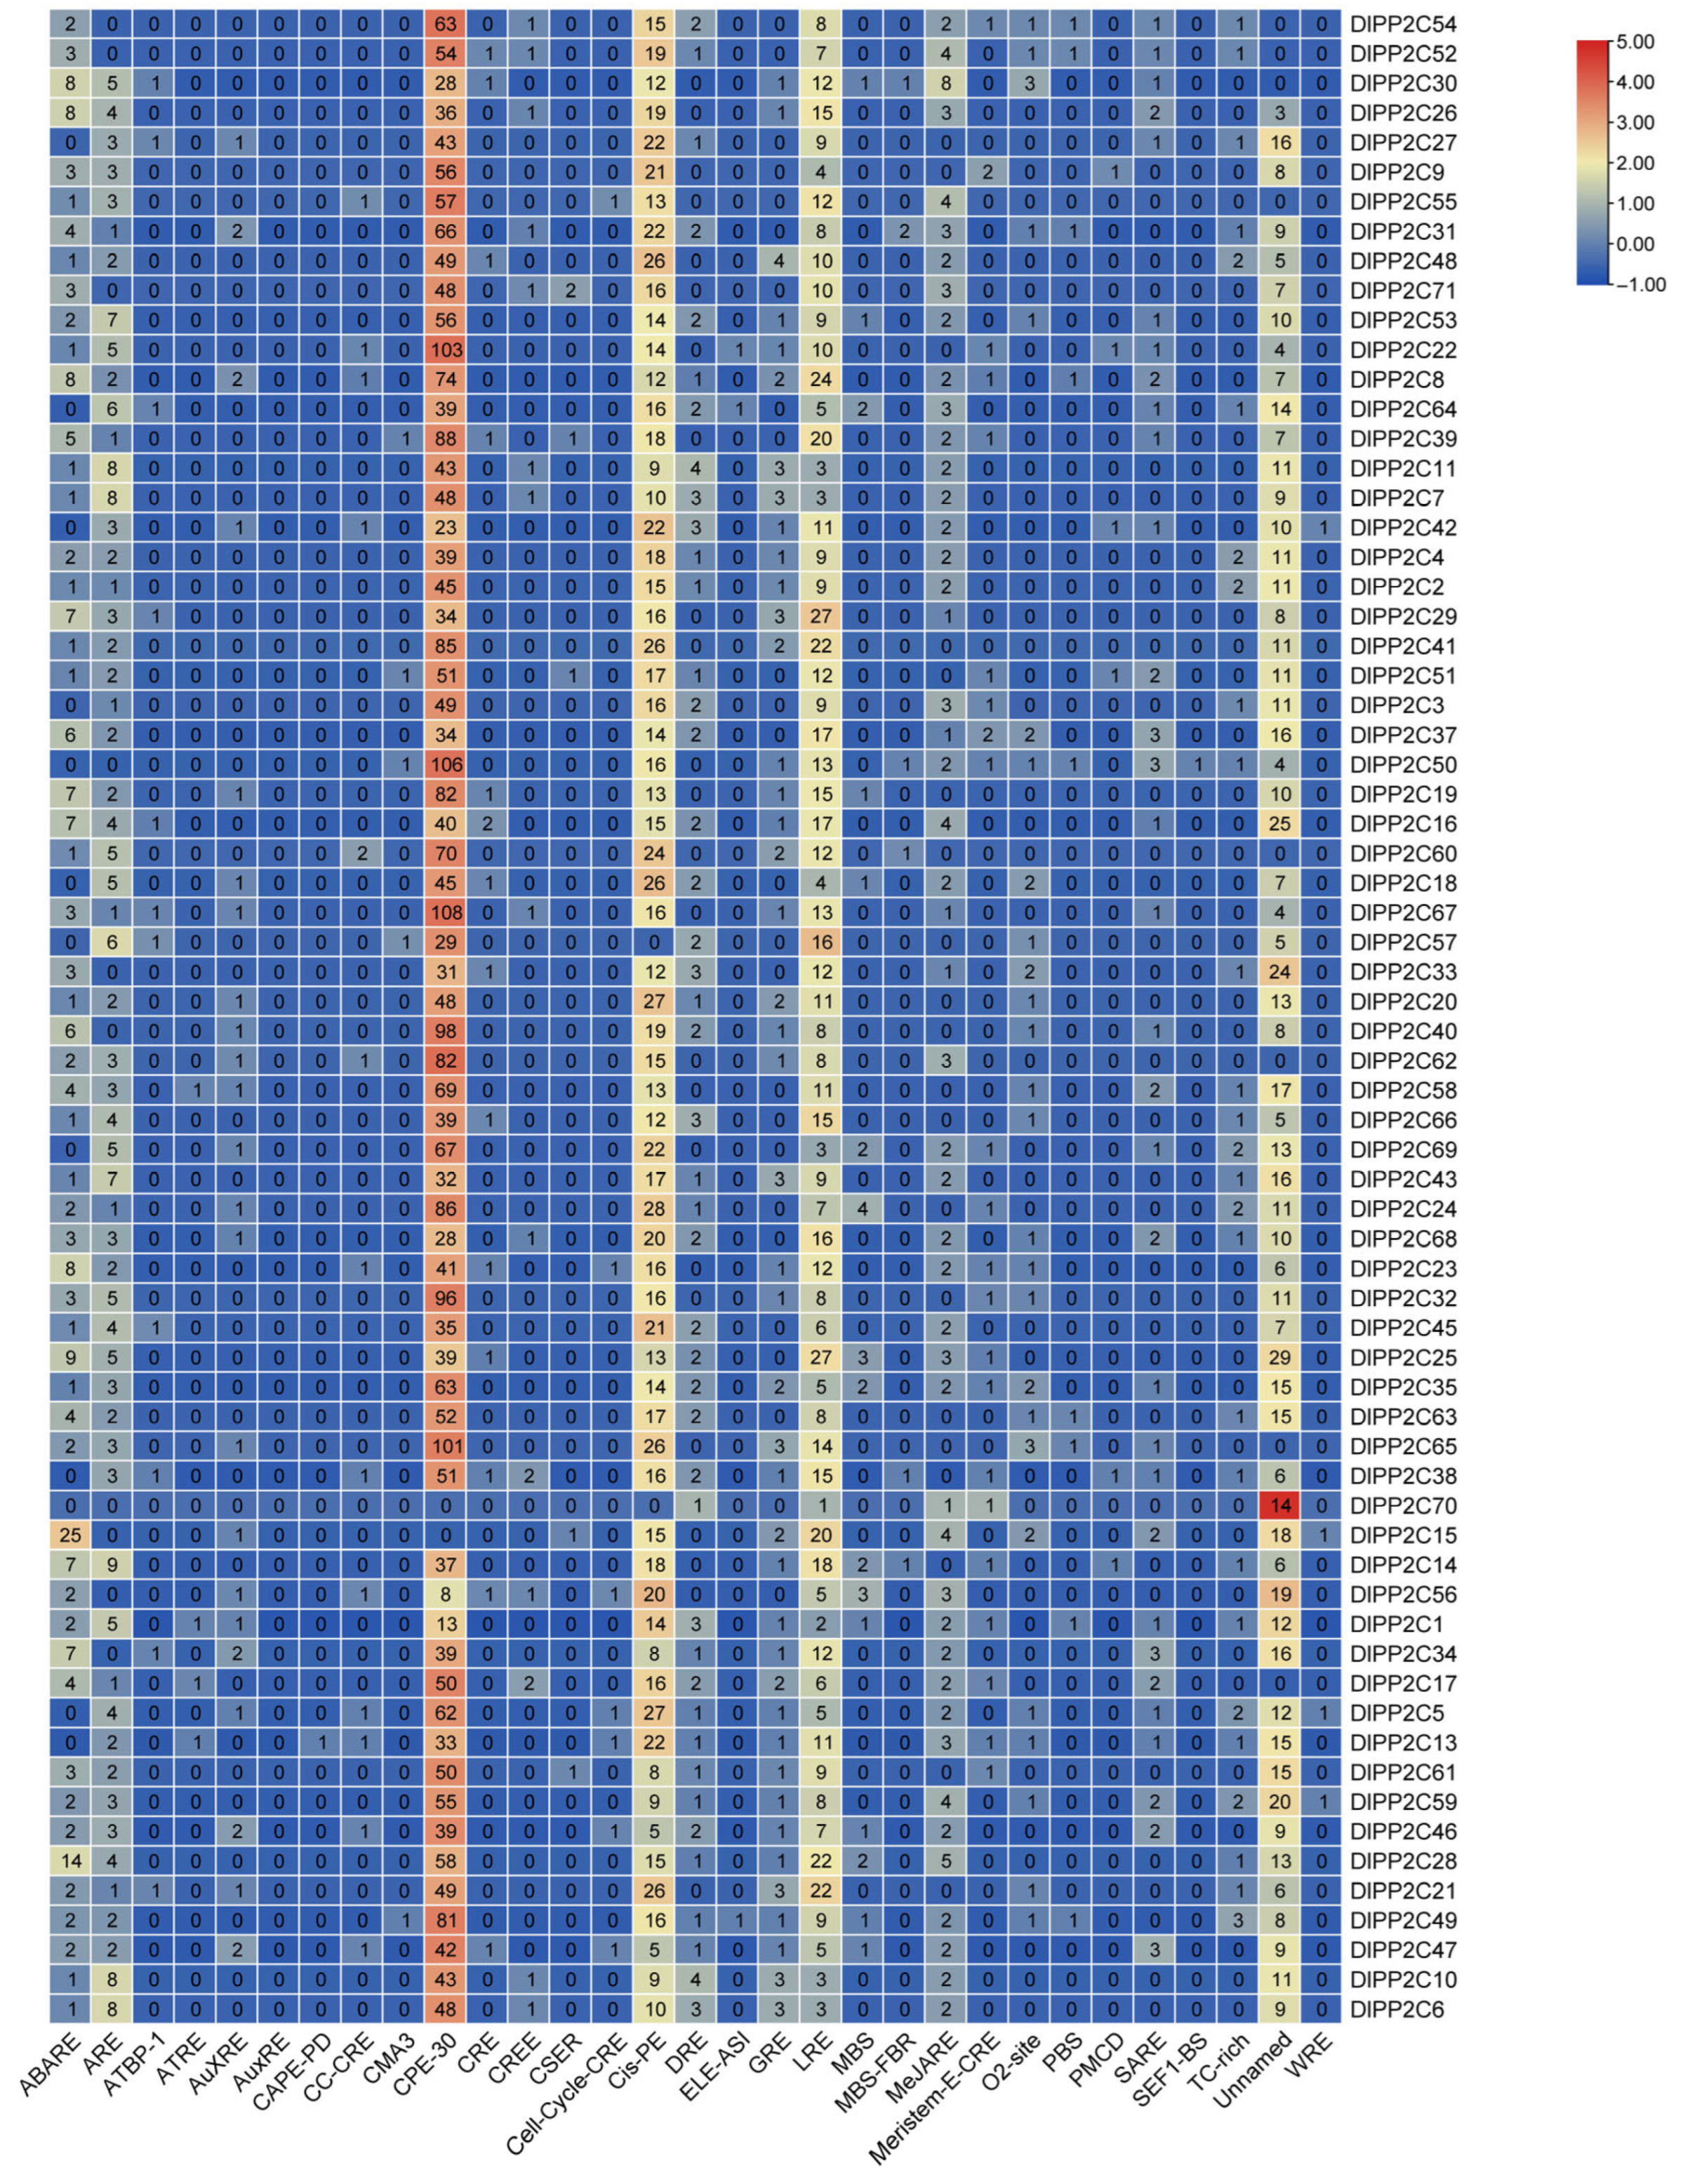
In an attempt to understand the possible transcriptional regulation of the DlPP2C gene family, 2000 bp upstream promoter regions have been studied in order to identify putative cis-acting regulatory factors (Supplementary Table S1). The promoters of DlPP2C genes had a large number of cis-elements linked to hormone responsiveness, stress responses, and developmental regulation. These included hormone-responsive elements, including abscisic acid-responsive elements (ABREs) and auxin-responsive elements (AuxREs). Specifically, the abundance of ABRE motifs suggests that many genes of DlPP2C participate in ABA-dependent processes. A higher number of CPE-30, which is a cytoplasmic binding element, was clearly seen in our findings (Figure 6). Moreover, various stress-dependent cis-elements were highly distributed, such as dehydration-responsive element (DRE), MYB binding sites (MBS-FBR), TC-rich repeats, MeJA-responsive element (MeJARE), and wound-responsive element (WRE). These findings suggest that DlPP2C genes can be linked to responses to abiotic stresses, such as drought, salinity, and oxidative stress, and biotic stress-related signaling (Supplementary Table S3). Furthermore, the promoters contained several cis-elements associated with developmental and cellular regulation, including CMA3, SEF1-BS, PMCD, CRE, and CC-CRE, and thus suggested their roles in growth, tissue differentiation, and circadian regulation. It is interesting to note that genes with similar cis-element composition tended to cluster in certain phylogenetic subsets, suggesting that transcription was regulated. By and large, the analysis of cis-regulatory elements indicates that the DlPP2C genes have complex regulatory structures that allow them to combine hormonal and environmental cues. These functional predictions, however, are found through the analysis of promoters in silico and need further experimental verification.

2.8. Expression Analysis of the DlPP2C Gene Family in Response to Exogenous ABA Treatment

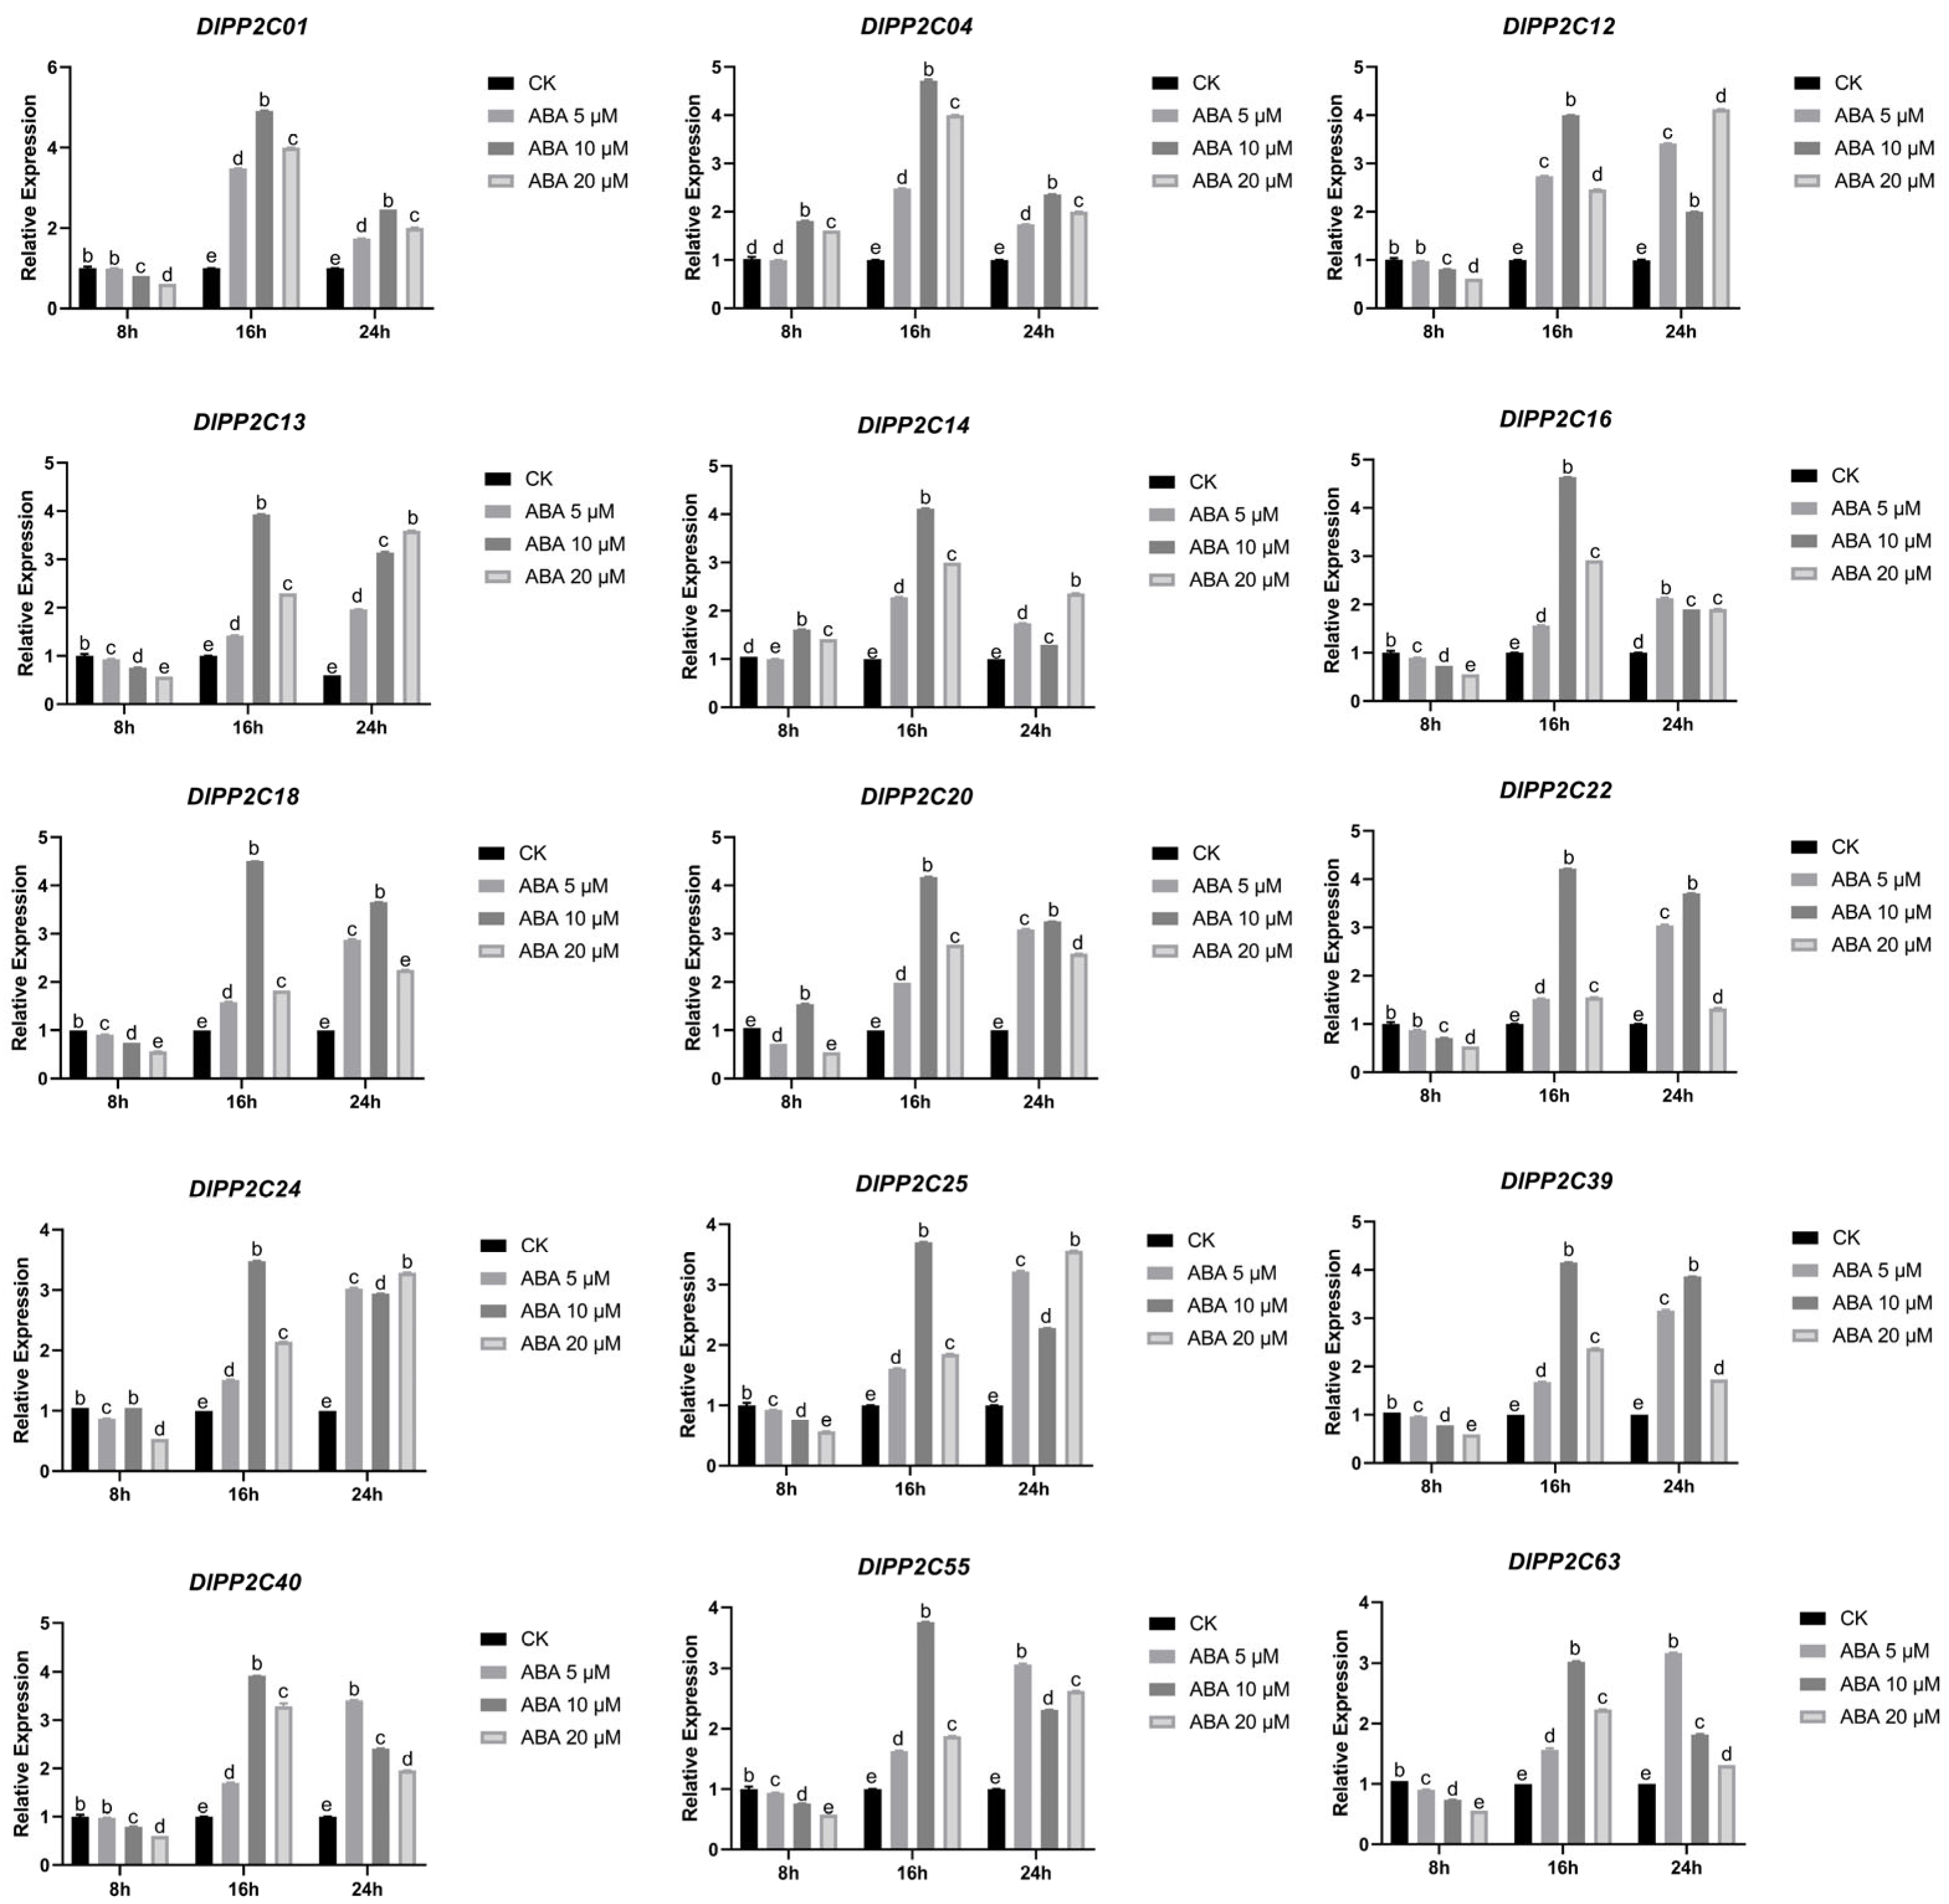
The heatmap demonstrates the expression profile of the DlPP2C genes after ABA (Abscisic Acid) treatment. A number of genes, such as DlPP2C1 and DlPP2C25, are highly expressed, which means that they are tangled in stress or response pathways mediated by ABA (Supplementary Figure S1). On the other hand, other genes like DlPP2C28 and DlPP2C38 show lower levels of expression, implying that they are not so imperative in ABA signaling. The study of the effect of DlPP2C genes during ABA signal response was performed using longan embryogenic callus subjected to various concentrations of abscisic acid (5 µM, 10 µM, and 20 µM) at different time intervals (8 h, 16 h, and 24 h). The transcriptional response of the genes of interest (DlPP2C) to ABA treatment was then evaluated through RT-qPCR expression of the gene. The results showed that the selected DlPP2C genes displayed dynamic and dose-dependent patterns of expression in response to exogenous ABA treatment. There were many genes that showed significant changes in transcription under various treatment conditions, indicating that they are sensitive to ABA concentration and duration of exposure. Interestingly, ABA treatment of 16 h at 10 µM concentration triggered the most significant levels of several DlPP2C gene expression, indicating that intermediate levels of concentration and intermediate exposure time are the most effective for stimulating a PP2C-mediated signaling response. In particular, DlPP2C1 had a strong and consistent response to ABA treatment, with its expression being significantly different at various time points, implying its possible involvement as a key regulator in ABA signaling (Figure 7).
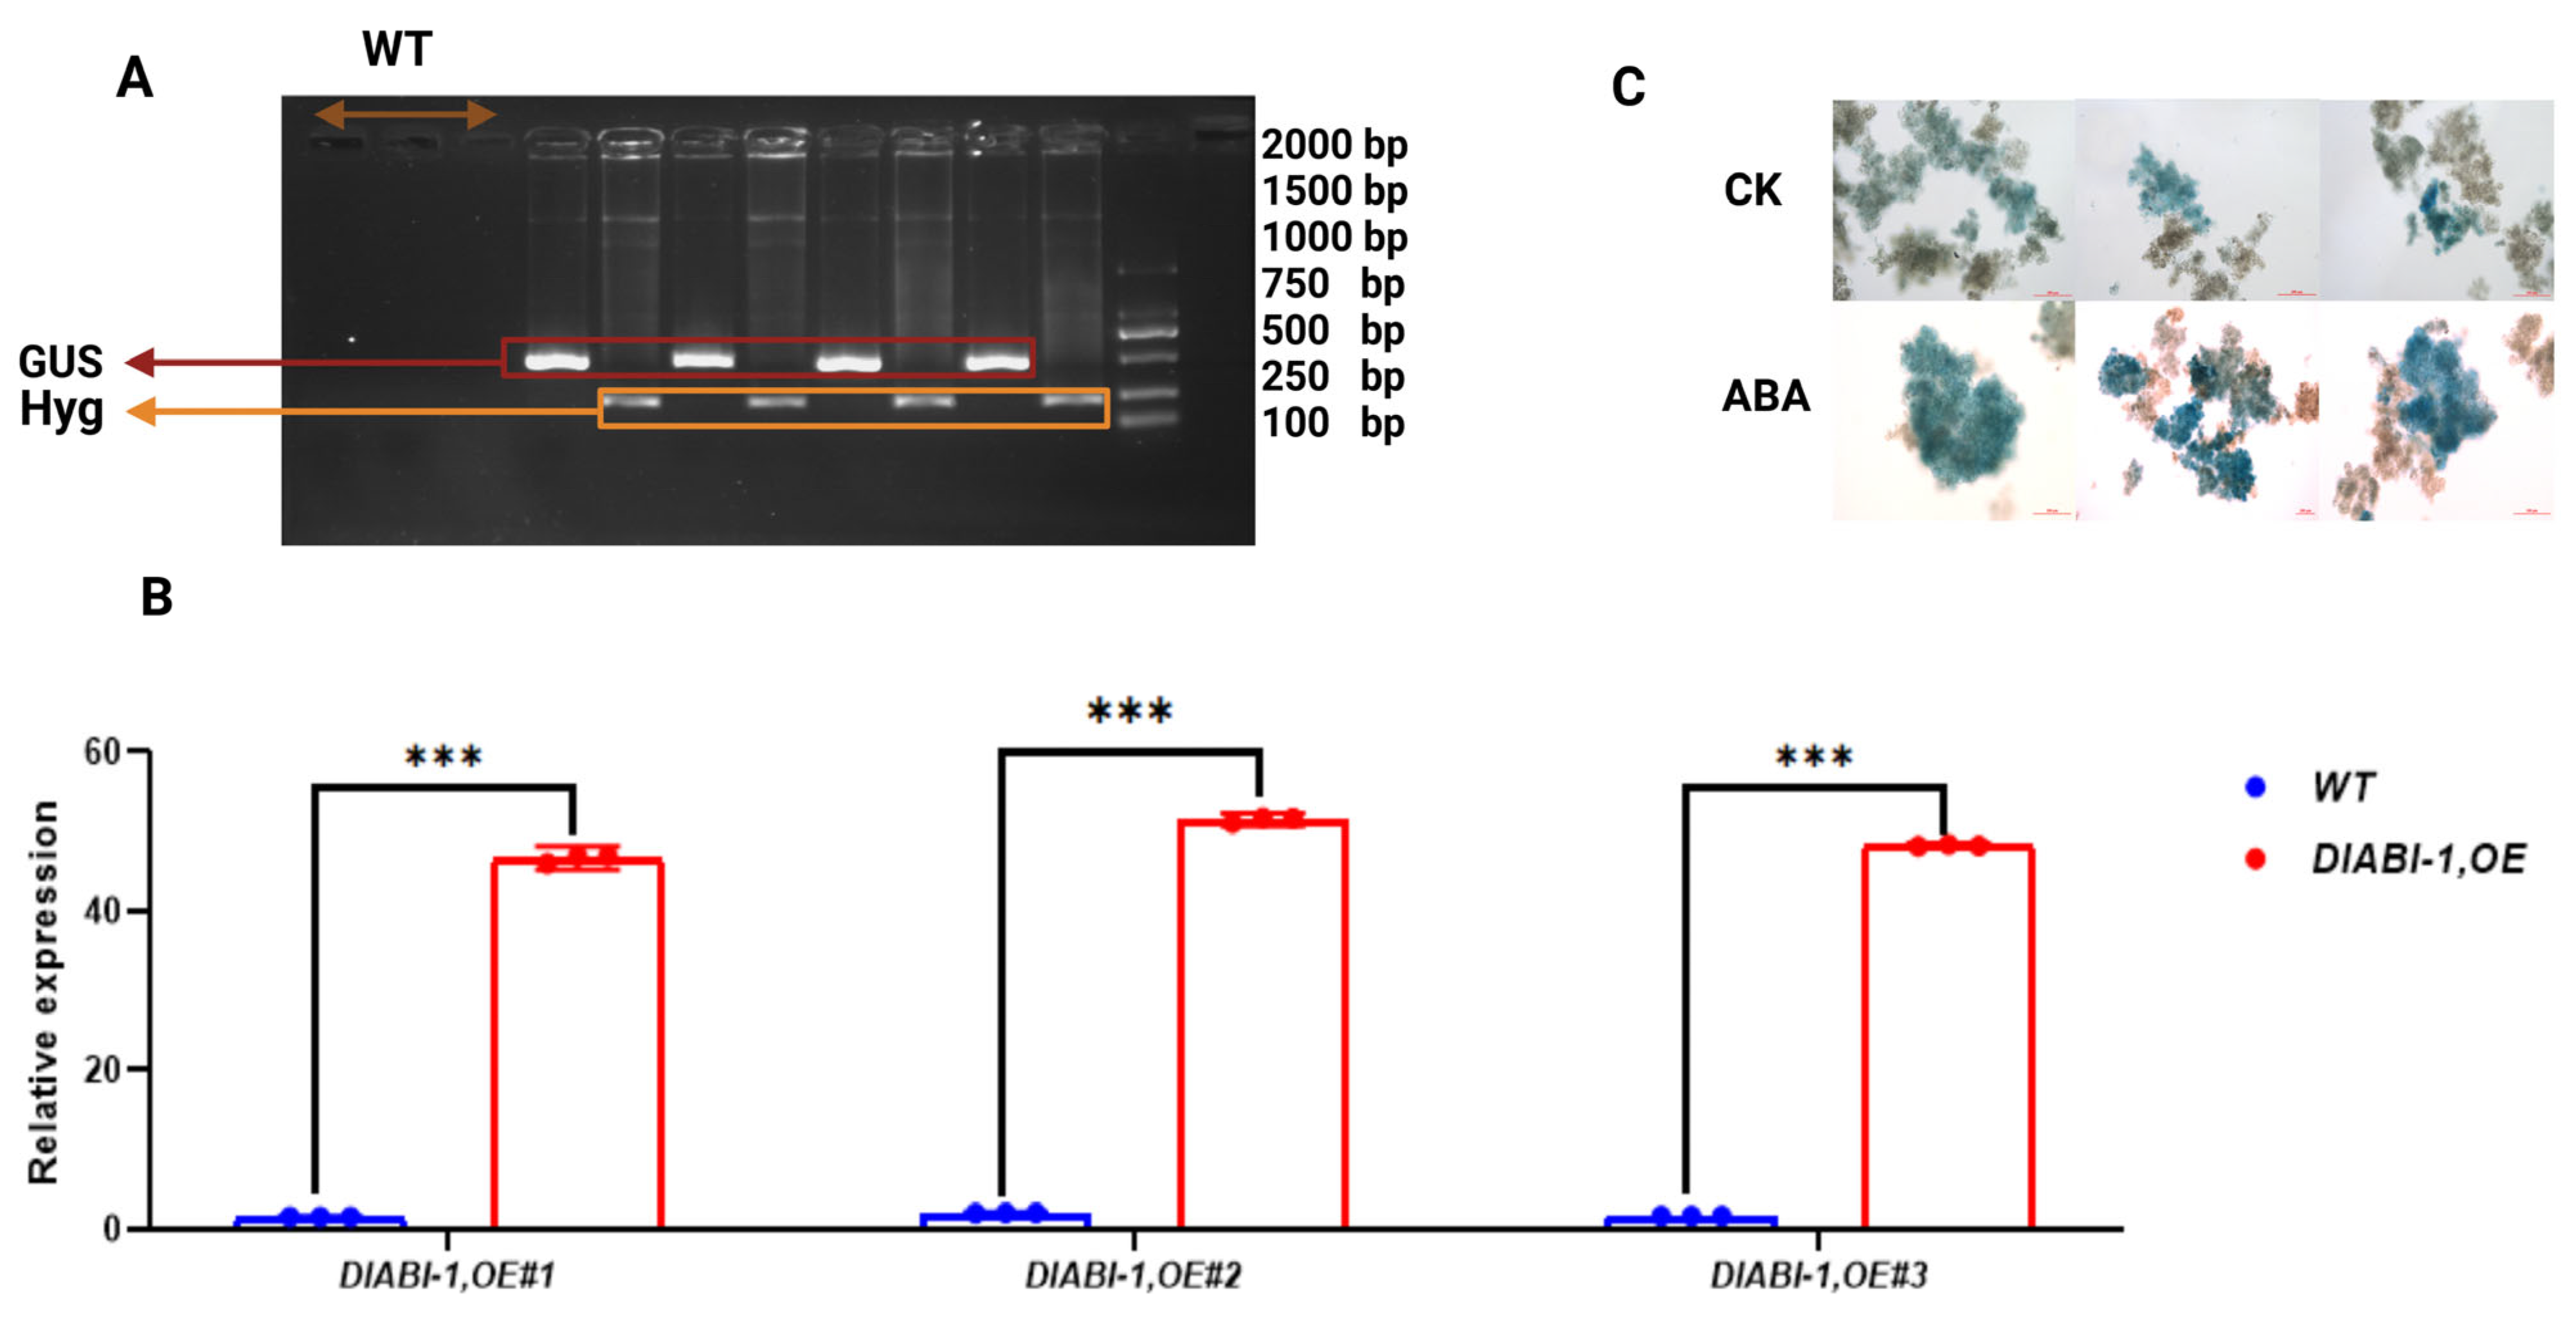
This was also confirmed by GUS staining of the DlPP2C1 line of overexpression, which exhibited increased activity in the presence of ABA, indicating its efficient role in ABA-responsive regulation (Figure 8). Moreover, other DlPP2C genes demonstrated varied functions with respect to expression; some were prematurely induced at 8h and gradually decreased with the time interval (16–24 h), which indicates functional separation among the genes in the gene family. The difference in expression patterns of DlPP2C members revealed that they might have different functions in regulation during ABA signaling.

2.9. Weighted Gene Co-Expression Network (WGCNA) Analysis

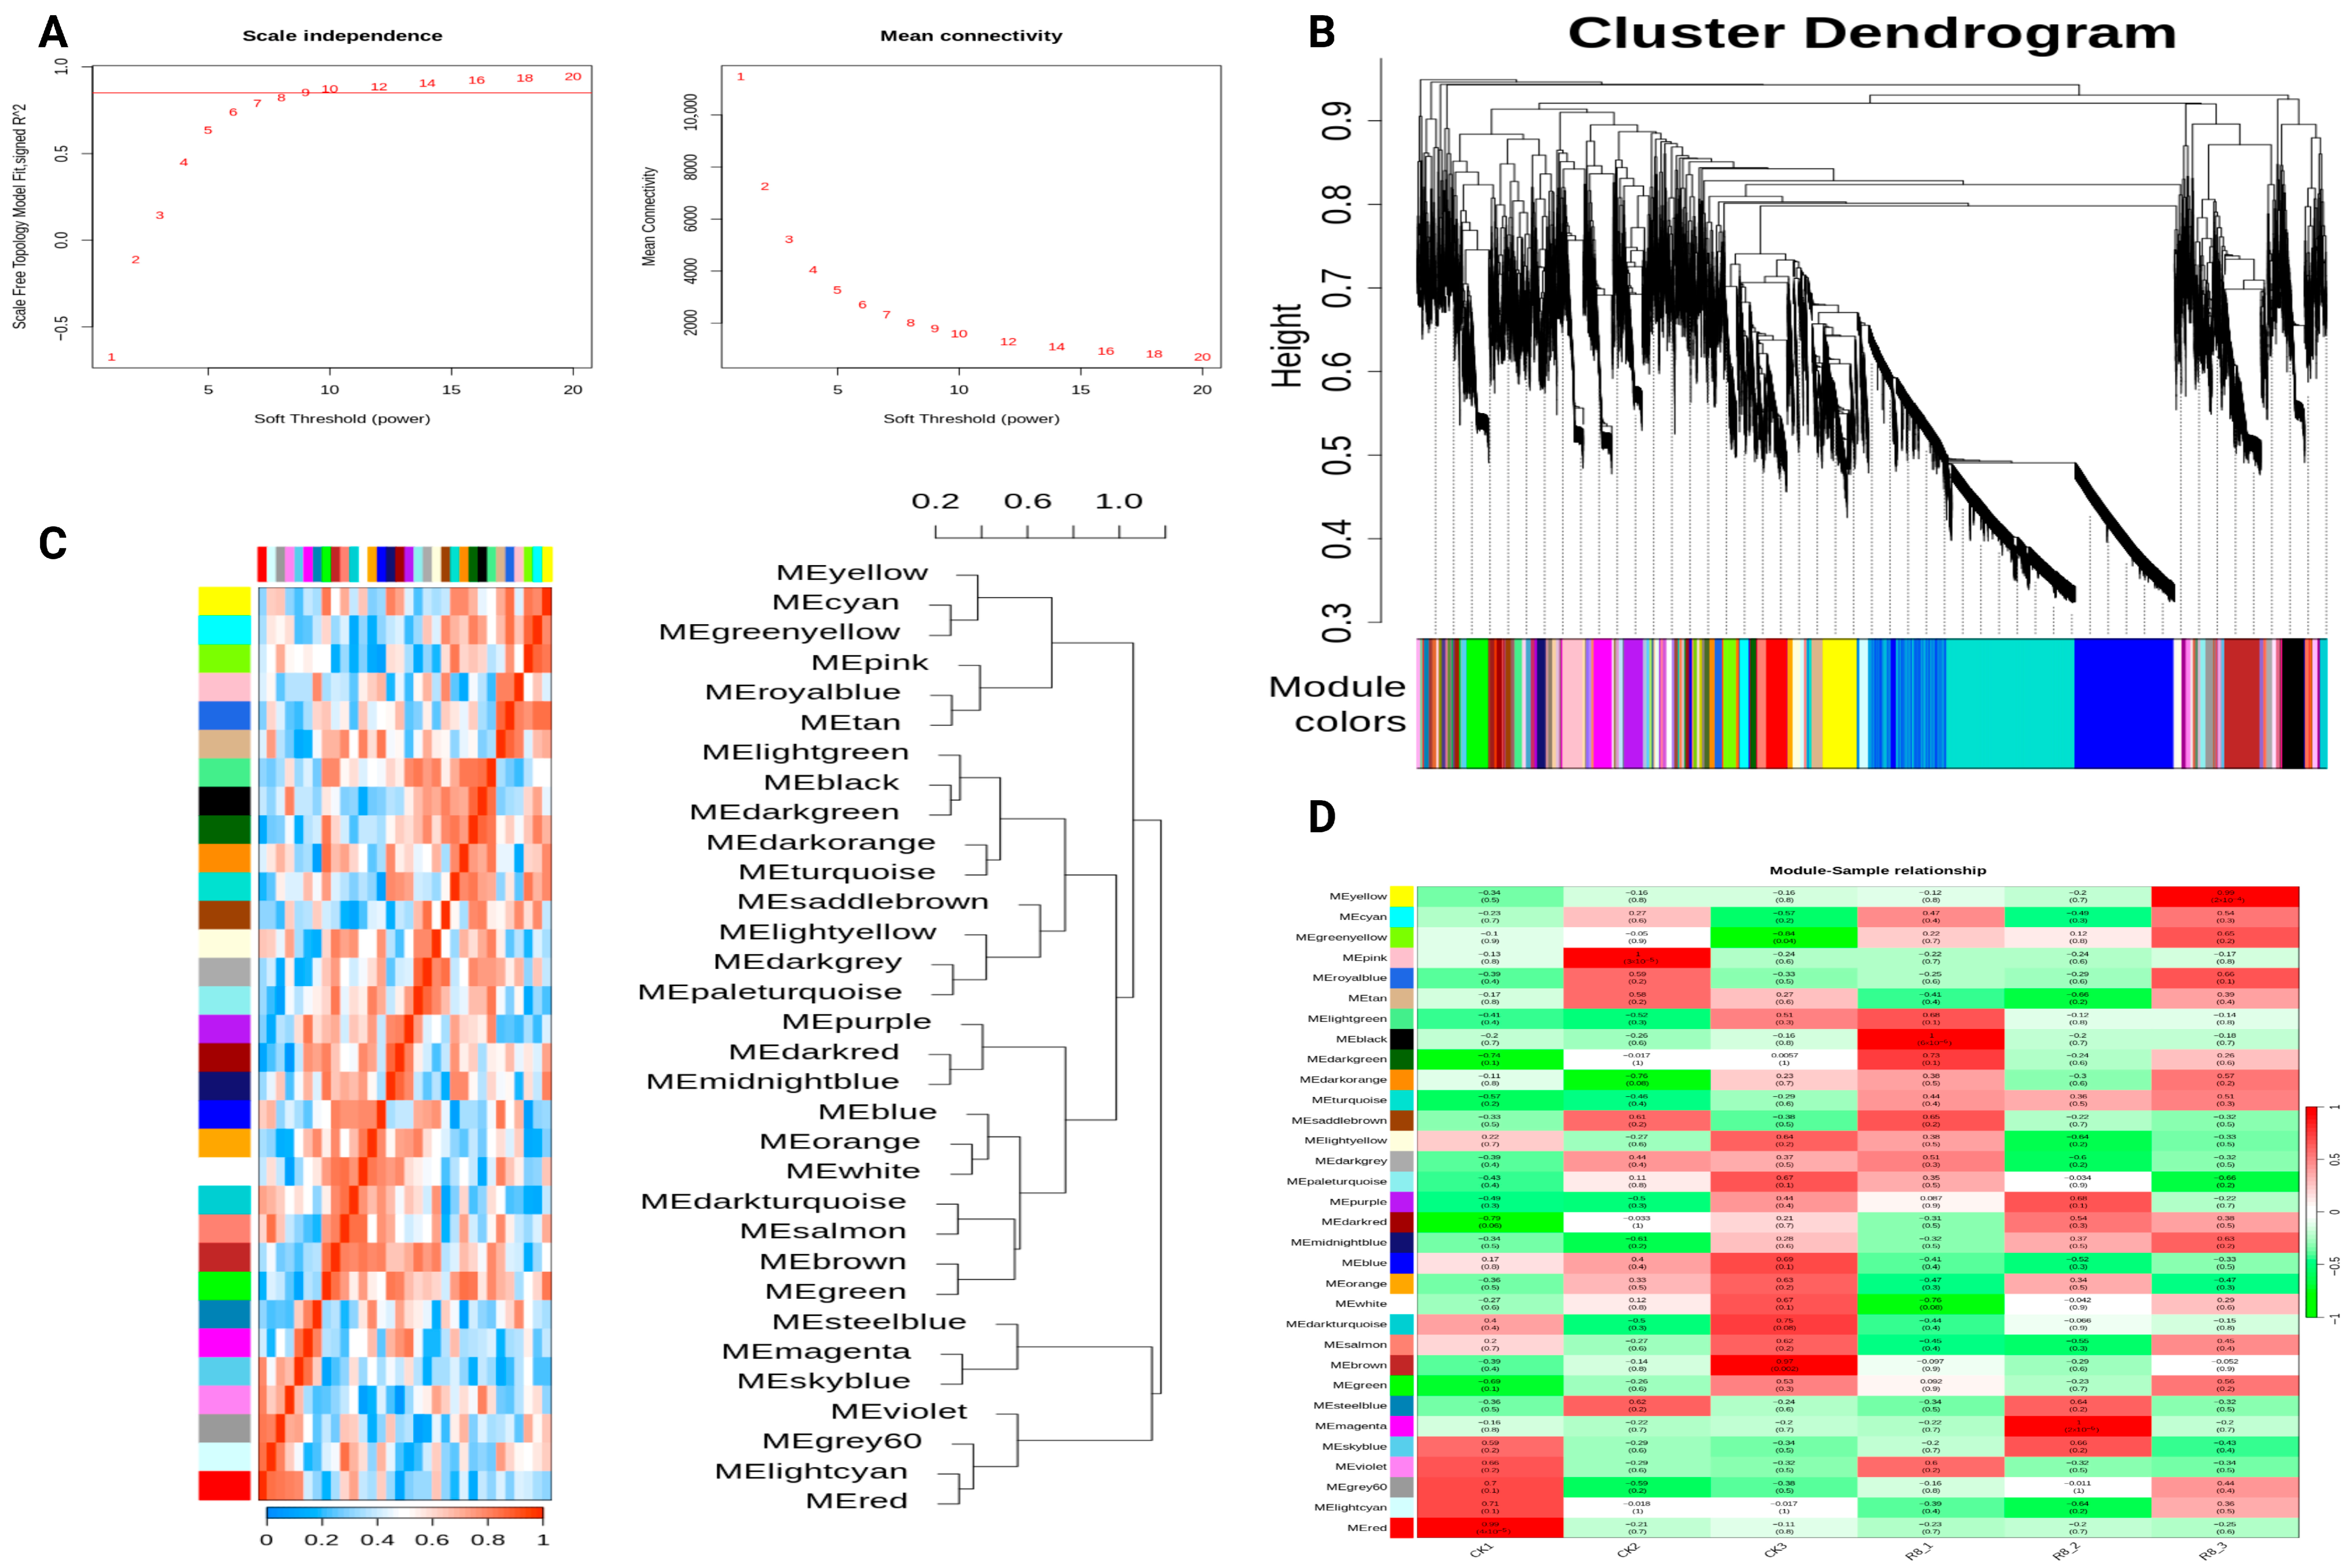
To further investigate the functional relationship and regulatory networks of the DlPP2C gene family, we performed WGCNA (weighted gene co-expression network analysis) rather than a DEG (differentially expressed gene) analysis or GSEA (gene set enrichment analysis) for a comprehensive gene expression study. The analysis was performed by setting soft threshold level values, known as R2 values, for power selection, as shown in the left graph of Figure 9A. Higher R2 values indicate a better fit of the model, whereas the right graph depicts the average number of connections per node, where lower values are ideal for a scaleless network.
The resulting cluster dendrogram of genes is shown in Figure 9B. A total of 32 modules were screened, and their relationships with the samples are illustrated in Figure 9C, while several identified modules were found to be correlated with key traits, including ABA responsiveness. Each row in the figure represents a different gene co-expression module, and each column represents a different phenotype. The value corresponds to the correlation coefficient, and the colors (red and green) indicate positive and negative correlations, respectively. The value in parentheses is the significant p-value. A total of 25 longan PP2Cs, including DlPP2C1, were found in the turquoise module, while the other DlPP2C genes are unevenly distributed in other modules (Supplementary Table S4). The heatmap clustering of different modules is presented in Figure 9C. The deeper the color of the module, the stronger the correlation and vice versa. The correlation heatmap demonstrating the module–sample correlation is presented in Figure 9D. Modules showing a strong relationship with samples may indicate significant associations and suggest the need for further functional studies. The network heatmap plot for all genes is shown in Supplementary Figure S2.

2.10. Transcriptomic Sequencing and Analysis of the DlPP2C Gene Family in Response Exogenous to ABA Treatment

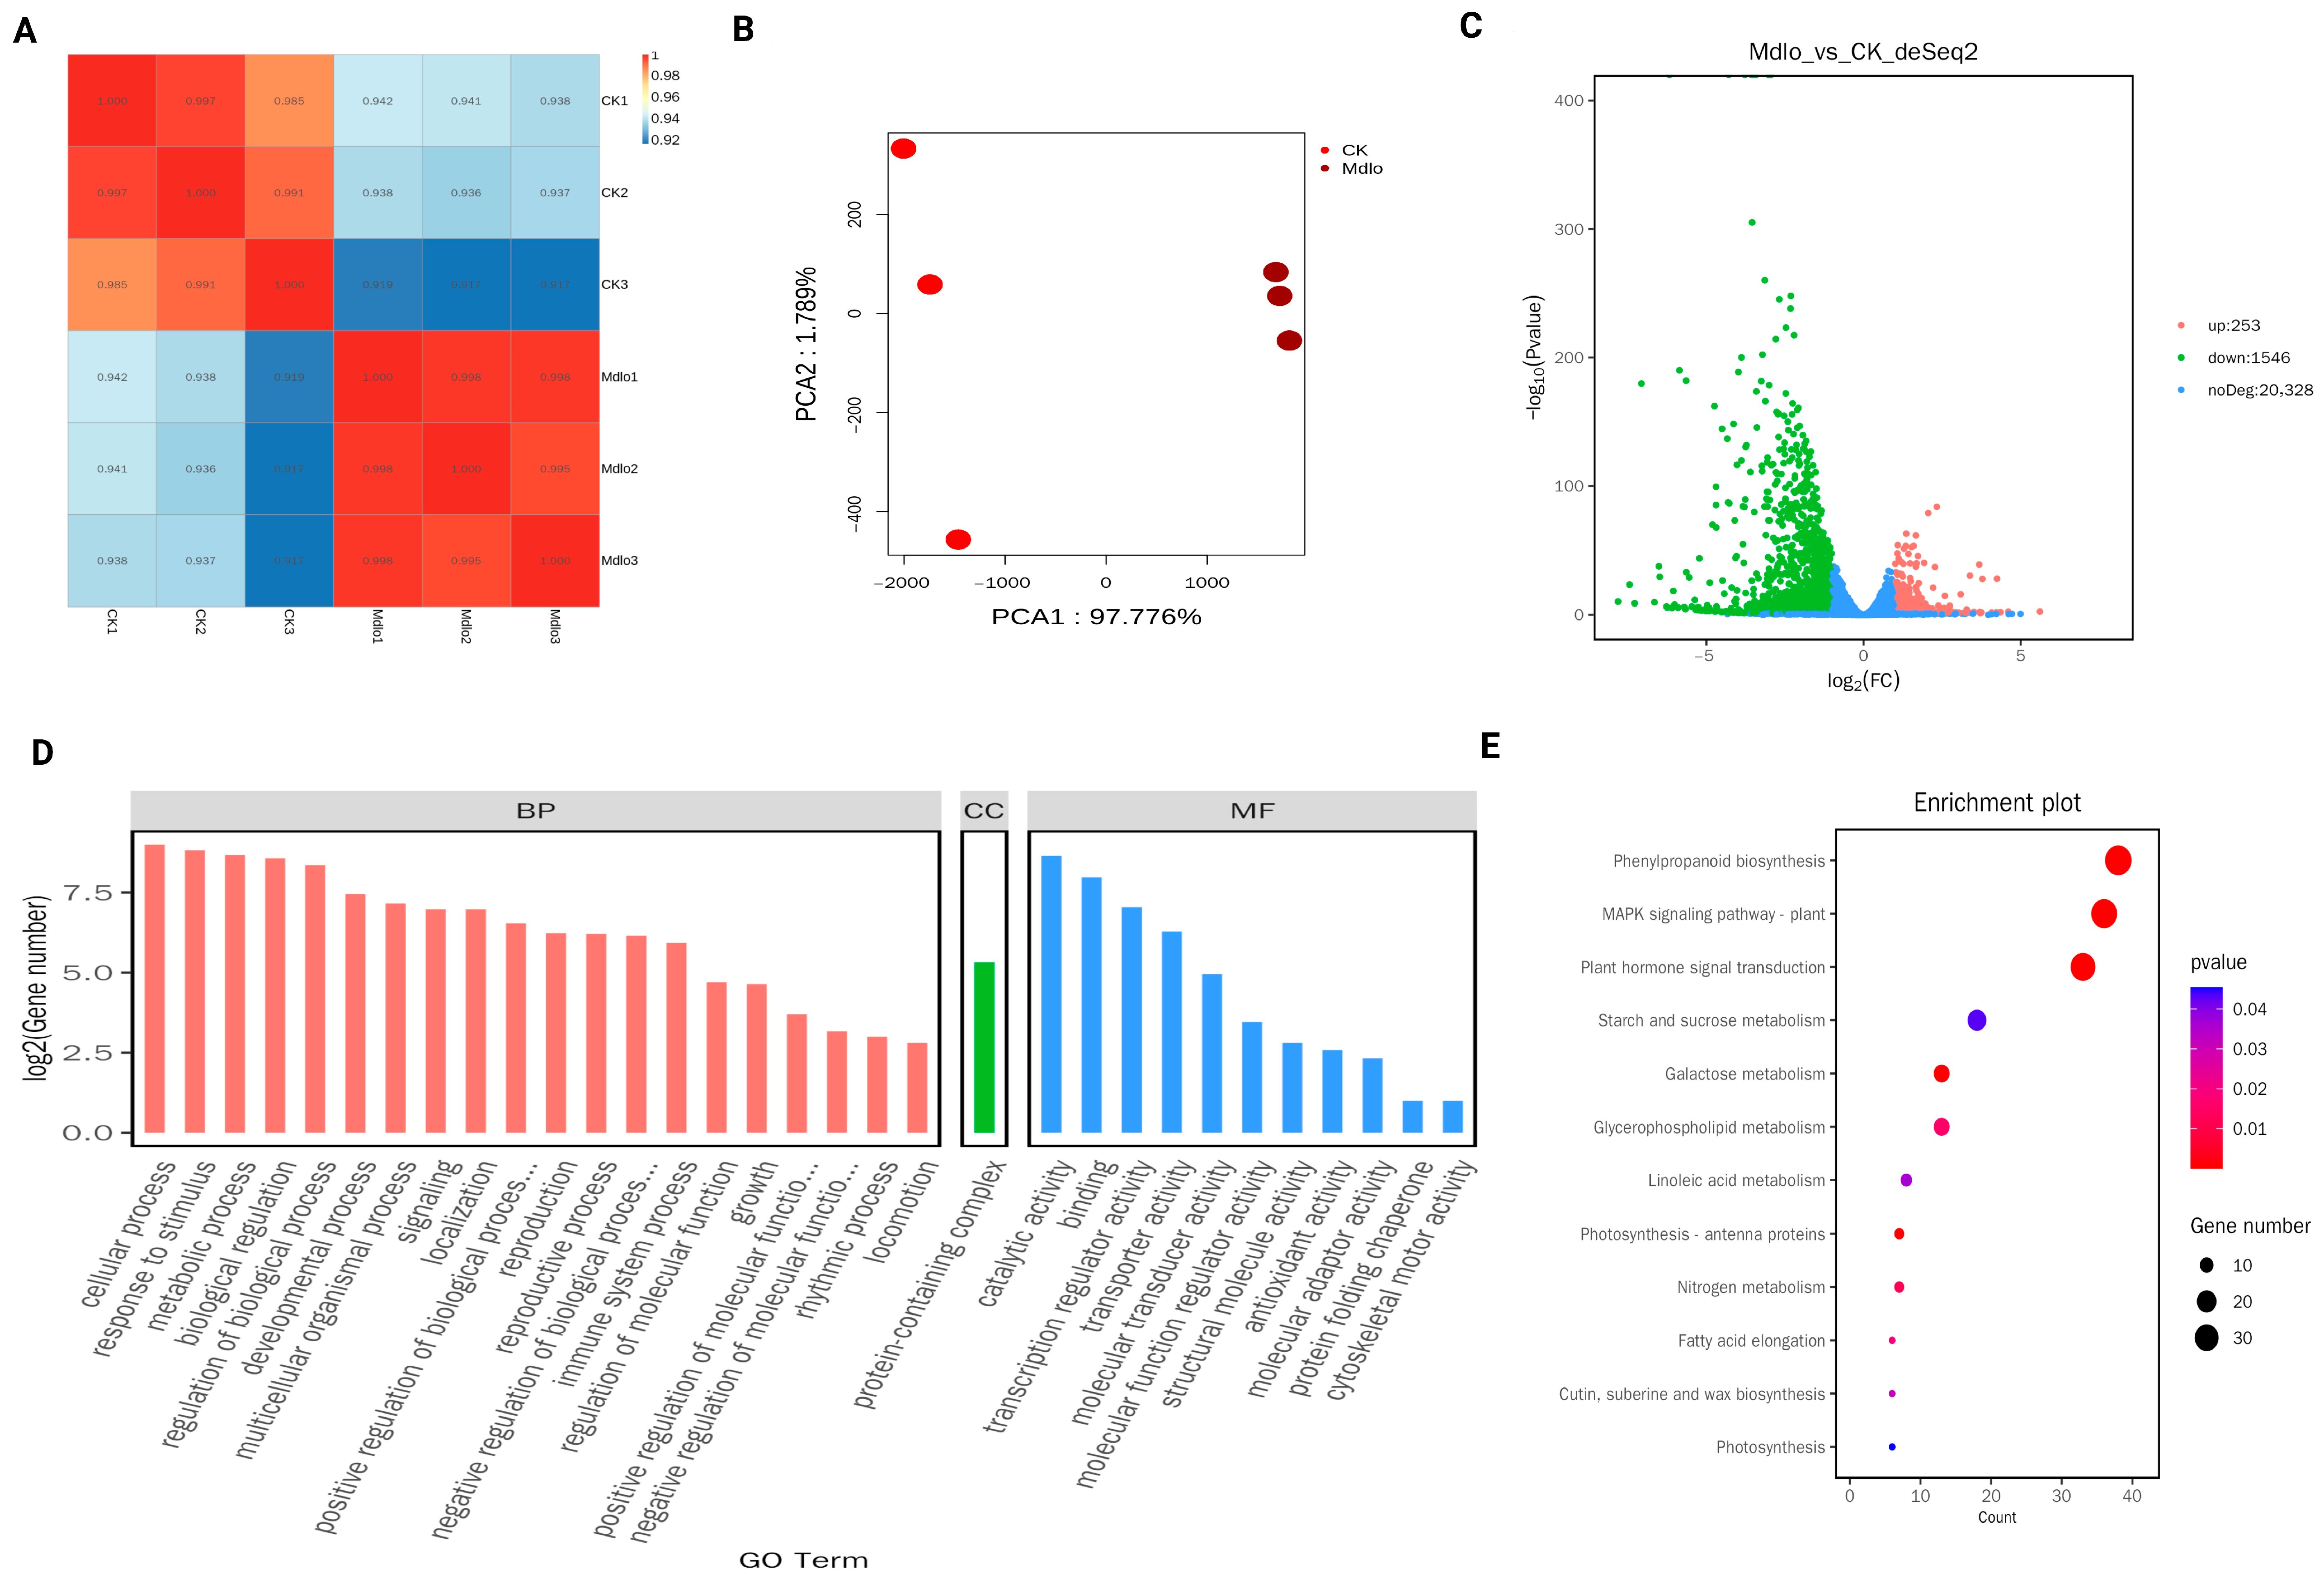
Moreover, the transcriptome (RNA-seq) results of the ABA-treated and control longan EC showed vast transcriptional reprogramming. The sample correlation analysis revealed that there were high correlation coefficients between biological replicates that showed good data consistency (Figure 10A). Principal component analysis (PCA) also revealed that there was a distinct difference between control and ABA-treated groups (Figure 10B), indicating that ABA treatment may have caused a considerable amount of transcriptional change. A total of 1799 differentially expressed genes (DEGs) were identified in the course of differential expression (DEA) analysis, comprising 253 upregulated and 1546 downregulated genes (Figure 10C). The over-representation of downregulated genes shows that ABA treatment induces widespread transcriptional repression in longan callus. To further investigate the idea of the functional significance of these DEGs, Gene Ontology (GO) enrichment analysis was conducted (Figure 10D), and the enrichment in biological process was significantly related to stress response, metabolic regulation, and cellular process. In addition, KEGG pathway enrichment analysis (Figure 10E) indicated that the DEGs mainly participated in pathways of phenylpropanoid biosynthesis, MAPK signaling, and plant hormone signal transduction, respectively. The details of the individual genes involved in each pathway can be found in Supplementary Table S5.
The RNA-seq findings were in line with the RT-qPCR results, which indicate that DlPP2C genes are involved in the regulation of ABA-responsive transcriptional networks. Collectively, these findings postulate the vitality of the ABA-induced DlPP2C genes that are of prime importance in the coordination of ABA-induced gene expression and ABA-induced stress adaptation in longan callus. The validation of RNA sequencing data was done by performing RT-qPCR analysis on selected up-regulated and down-regulated genes, which shows that these genes were generally consistent with the transcriptomic data, indicating high reliability (Supplementary Figure S3).

3. Discussion

This study presents the first thorough genome-wide analysis of the PP2C gene family in Dimocarpus longan, a tropical fruit species of enormous economic and therapeutic relevance. Identifying 71 PP2C genes offers vital insights into their probable functions in regulating Longan’s growth, development, and stress responses [23,24]. Phylogenetic analysis showed that longan PP2C genes are organized into thirteen primary clades (A–L), in a way comparable to Arabidopsis thaliana and Oryza sativa, which are model dicot and monocot plants, respectively. This clustering demonstrates that the PP2C gene family underwent early evolutionary diversity well before the split between monocots and dicots [2,23,24]. Chromosomal mapping of the longan PP2C genes indicated an unequal distribution among numerous super-scaffolds, with various clusters of genes detected nearby. The clustering of PP2C genes across these scaffolds indicates potential gene duplication events, a primary process by which gene families increase and diversify [23,25]. Synteny’s research further confirmed the findings from the Circos plot by indicating conserved collinear areas between Longan and numerous other plant species, including Arabidopsis and Oryza sativa [3]. This comparative genomic study demonstrated the evolutionary and functional significance of key PP2C loci, supporting the concept that these genes have been conserved across numerous plant taxa [23,25]. These conserved domains demonstrate that longan PP2Cs share core structural properties with other PP2C proteins throughout plants [26]. Additionally, changes in exon–intron arrangement suggest that some genes may have undergone structural modifications to enable more complex control. The discovery of kinase-like domains in specific longan PP2C genes suggests that these genes likely participate in unique signaling pathways that are specific to this species [27]. Protein–protein interaction network analysis identified a closely connected cluster of PP2C proteins likely engaged in the abscisic acid (ABA) signaling pathway, a vital mechanism for Longan’s adaptation to abiotic challenges such as drought and cold stress [28]. Gene structure and conserved motif analysis of longan PP2C genes indicated the existence of essential functional domains, including the PP2C catalytic domain and kinase-like regions. The predominance of this cluster fits with the well-established role of PP2Cs as negative regulators of ABA-mediated stress responses [29]. The network analysis revealed that these PP2Cs are likely interacting to modify ABA signaling in a coordinated manner, which is necessary for Longan’s ability to respond to altering environmental conditions [30]. Cis-acting element analysis showed a variety of hormone-responsive and stress-related regulatory motifs inside the promoters of longan PP2C genes. Elements such as ABRE (ABA-responsive), MeJARE (methyl jasmonate-responsive), and others related to gibberellin and auxin signaling were prevalent, supporting the concept that longan PP2Cs are major integrators of numerous hormonal and environmental signals [31]. The distribution of these elements illustrated that PP2Cs of D. longan have the ability to effectively interfere with multiple signaling pathways, which allows the plants to respond to both external and internal stimuli. These cis-acting areas show how PP2C genes are regulated in response to shifting environmental factors, indicating how adaptable these genes are in facilitating adaptive reactions [32].
Abscisic acid (ABA) plays a central role in regulating plant growth, development, and stress adaptation, with clade A protein phosphatase 2C (PP2C) proteins functioning as key negative regulators in the ABA signaling pathway. In this study, several DlPP2C genes exhibited dynamic transcriptional responses to exogenous ABA treatment in longan embryogenic callus, with 10 μM ABA at 16 h inducing peak expression levels, particularly for DlPP2C1. This time- and dose-dependent response is consistent with previous findings in longan embryogenic tissues, where hormone-induced transcriptional regulation has been shown to occur in a temporally dynamic manner [33,34]. Our findings are further supported by similar studies conducted previously, where time- and dose-dependent responses were shown to be consistent in longa EC and where hormonal-induced transcriptional regulation has been shown to occur in a temporally dynamic manner [28,35,36]. DlPP2C1, which is ABA-responsive, may function similarly to ABI1-like PP2Cs in model plants. Remarkably, despite their inhibitory role at the protein level, both ABI1 and ABI2 genes are transcriptionally induced by ABA, establishing part of the negative feedback regulatory loop [37,38], which permits plants to fine-tune ABA signaling intensity and halt redundant responses under continued stress conditions. The expression patterns revealed in the current study, especially for DlPP2C1, align with this conserved regulatory model. The higher expression patterns of DlPP2C under exogenous ABA treatment, particularly at intermediate time intervals, may reflect its involvement in feedback diminution of ABA signaling [24]. This claim was further supported by the preliminary findings of GUS staining, where the higher GUS activity in the DlPP2C1 OE line under ABA treatment was recorded, which indicates that the gene is transcriptionally activated in response to ABA. In addition to expression and introductory functional validation, RNA sequence analysis revealed an extensive transcriptional reprogramming in response to exogenous ABA treatment, with a predominance of downregulated genes. This universal repression pattern suggests that ABA may primarily suppress growth-related metabolic processes while triggering a subset of stress-responsive pathways. Analogous reports have already been published in other plant systems, where ABA induces a large-scale reorganization of gene expression to aid stress adaptation [39,40].

4. Materials and Methods

4.1. Identification and Physicochemical Properties of DlPP2C Proteins

The protein sequences of Arabidopsis thaliana PP2C family members were obtained from TAIR (https://www.arabidopsis.org/), (accessed on 17 March 2026) [41], while the rice PP2C sequences were retrieved EnsemblPlants (https://plants.ensembl.org/), (accessed on 17 March 2026) [42]. Firstly, the Arabidopsis thaliana PP2C amino acid sequences were used as a query and probe to download the HHZ D. longan third-generation genome from the National Center for Biotechnology Information (NCBI) Sequence Read Archive (SRA) database (SRR17675476). The TBtools software (v 2.420) [43] was used for searching possible DlPP2C sequences and further screened by two-way blast at NCBI. The PP2C conserved structural domains of the screened members were reconfirmed by using the HMMER online software (https://www.ebi.ac.uk/Tools/hmmer/search/phmmer), (accessed on 17 March 2026) [44]. Finally, the preliminarily identified members were compared with the HHZ D. longan third-generation genome to search for any omissions and confirmed the existence of a total of 71 DlPP2C gene family members, which are renamed in reference to Arabidopsis thaliana nomenclature for the DlPP2C gene family. The online software ExPASy (https://web.expasy.org/protparam/), (accessed on 17 March 2026) [45] was used to determine the number of amino acids (AA), molecular weight (MW), isoelectric point (pI), instability index (II), aliphatic index (AI), and grand average of hydropathicity (GRAVY) of DlPP2C family proteins, while the subcellular localization predictions were done using WoLF PSORT (https://wolfpsort.hgc.jp/), (accessed on 17 March 2026) [46].

4.2. Phylogenetic Tree, Conserved Motif, and Gene Structure of DlPP2C Family Members

The evolutionary tree between Arabidopsis thaliana, rice, and longan (using full-length protein sequences) was constructed by using the maximum likelihood (ML) algorithm (bootstrap number set to 1000) with TBtools software (V 2.420), while branches with bootstrap support ≥70% were considered well supported. [47]. The online interactive software iTOL (https://itol.embl.de/), (accessed on 19 March 2026), was used to edit and visualize the phylogenetic tree [48]. The conserved motifs of DlPP2C proteins were identified using the Multiple Em for motif Elicitation (MEME) suite (http://meme-suite.org/), (accessed on 19 March 2026) [49]. The full-length amino acid sequences of DlPP2C proteins were submitted to MEME; the maximum number of motifs was set to 10, the optimum motif width ranged from 6 to 50 residues, and other parameters were kept at default settings. The coding sequences (CDS) were aligned with their corresponding genomic DNA sequences to analyze exon–intron organization of DlPP2C genes, while the diagrams were generated using the Gene Structure Display Server (GSDS V 2.0) (http://gsds.gao-lab.org/), (accessed on 19 March 2026) [50].

4.3. PP2C Gene Clustering, Distribution of Chromosomes, Cis-Elements Analysis, and Synteny Visualization of DlPP2C Genes

The genome annotation (GFF/GTF) information files of Dimocarpus longan were used to determine chromosomal distribution of DlPP2C genes. The TBtools software (version 2.420) was utilized for mapping DlPP2C genes onto their respective chromosomes. PlantCARE (http://bioinformatics.psb.ugent.be/webtools/plantcare/html/), (accessed on 19 March 2026), was used to analyze the cis-acting element prediction [51]. For synteny analysis, MCScanX analysis between D. longan, Arabidopsis thaliana (L.) Heynh., and Oryza sativa subsp. japonica Kato, with an E-value threshold of 1e−3, was performed using the TBtools software v 2.420 (https://github.com/CJ-Chen/TBtools-II, accessed on 28 March 2026).

4.4. Protein–Protein (PPI) Interaction Network Analysis

The GeneMANIA database was used to predict the potential interaction relationships of DlPP2C proteins [52]. The DlPP2C protein sequences were first used to identify homologous proteins in Arabidopsis thaliana due to the limited annotation of Dimocarpus longan.

4.5. Plant Materials, ABA Treatments, and Expression Analysis

For the current study, we used embryogenic callus (EC) of D. longan Lour-Honghezi. Samples of 0.2 g EC were treated with ABA in MS medium provided by Coolaber manufacturer, Beijing city, China, after 20 days of proliferation at concentrations of 5 μM, 10 μM, and 20 μM. Treated materials were incubated in a dark environment at 25 °C for three time intervals of 8 h, 16 h, and 24 h. EC in MS medium without ABA treatment was used as a control. For each treatment, three biological replicates were performed, and samples were collected and frozen in liquid nitrogen and stored at −80 °C in a refrigerator.

4.6. The qRT-PCR Analysis

The TransZol Up kit provided by TransGen (Beijing, China) was used for the total RNA extraction from samples following the instruction manual. The cDNA synthesis was completed using Revertaid Master Mix (Thermo Fisher Scientific, Shanghai, China), and qRT-PCR was performed on the Roche Light Cycler 96 instrument with 10-fold diluted cDNA as an amplification template. UBIQUITIN (UBQ) was used as an internal reference [53,54]. Data calculations were performed according to 2−ΔΔCt [54], and graphs were generated using GraphPad Prism 8.0.2 software. DNAMAN 6.0 software was used to design the qRT-PCR primers (Supplementary Table S6).

4.7. RNA Sequencing and Analysis

Based on the comprehensive assessment and expression outcomes, which aimed to capture the most biologically informative, reproducible, and interpretable transcriptomic response, the samples treated with 10 µM ABA (labeled as Mdlo) for 16 h and a control group (CK) with three independent biological replicates were subjected to RNA sequencing analysis (Biomarker Biotechnology Co., Ltd., Beijing, China). Total RNA was sequenced for the six groups of longan embryogenic cultures. The purity and concentration of RNA were assessed using a Nanodrop 2000 spectrophotometer, and RNA integrity was verified using the Agilent 2100/Lab Chip GX [54,55,56]. After samples passed quality control, library construction and mRNA transcriptome sequencing were carried out. HISAT2 (Hierarchical Indexing for Spliced Alignment of Transcripts) software was used to quickly and accurately compare the clean reads with the reference genome, and to acquire corresponding information for the reads on the reference genome [57]. The reads were then assembled using String Tie to reconstruct the transcriptome for subsequent analysis [58]. The genes were annotated for various analyses, including DEGs and KEGG [59]. The thresholds of |log2(fold change)| > 1 and FDR < 0.01 were used to filter DEGs. GO and bioinformatics analysis were conducted according to the methods described as follows [60]. The weighted gene co-expression network analysis (WGCNA) was performed using the R package (version 1.74). The data from the ABA treatment for 16 h at 10 µM and the control were imported into the WGCNA package. The correlation-based associations between gene modules were set to 15 and calculated, and analysis was performed using default settings.

4.8. Transient Transformation of D. longan Embryogenic Callus

The DNAMAN 9.0 software was used to design the specific amplification primers at the 3′ and 5 ends of the Dlo000068 (DlPP2C1) CDS sequence, which were cloned into the pCAMBIA1301-35-GUS vector (Supplementary Table S7). The bacterial solution comprising the recombinant plasmid was activated, and cells were gathered by centrifugation at 7800 r/min for a duration of 10 min. The collected cells were further resuspended by using an MS suspension medium containing 30 g/L sucrose, 200 mM AS, and 100 mM MgCl2 in the infiltration solution. The OD600 was adjusted between 0.6 and 0.8. The 15-day-old D. longan EC was co-cultured with Rhizobium radiobacter for 30 min; the sap was then filtered and transferred to MS solid media for 3 d. The wild type (WT), having an empty vector, and the pCAMBIA1301-35-GUS were taken as control checks, whereas transient overexpression DlPP2C cell lines were labeled as DlPP2C1-OE#1,2,3.

4.9. GUS Staining and PCR Amplification

A measure of 0.1 g each of the transiently transformed pCAMBIA1301 and pCAAMBIA1301:DlPP2C1: GUS(OE1-OE3) cell lines was collected. After freezing in liquid nitrogen, the samples were stored in −80 °C refrigerator for further analysis. Following the instructions mentioned on the GUS staining kit provided by Huayueyang Biotechnology, China, the GUS staining on the transgenic materials was completed. The fluorescence microscope (LEICA DMI8, Wetzlar, Germany) was used to obtain and observe the images of the GUS-stained D. longan EC transgenic cells under a 20x field of view. For the DNA extraction from both WT and overexpression cell lines after transient transformation, the Plant Genomic DNA Kit (ThermoFisher, Waltham, MA, USA) was used. PCR amplification using F/R primers of GUS and Hyg (Supplementary Table S3) was used for the identification of transgenic cell lines.

5. Conclusions

Our findings provide a comprehensive exploration of the PP2C gene family in Dimocarpus longan during early somatic embryogenesis. In the context of ABA signaling, both during development processes and under stress conditions, DlPP2C1 (ABI1) shows a significant response to ABA, which suggests that DlPP2C1 is an ABA-responsive regulator that influences gene expression in response to ABA. The uniformity between RNA-seq data and RT-qPCR findings strengthens the suggestion of the involvement of DlPP2C1 in ABA-mediated regulatory networks, but further studies are required to confirm whether it acts as a negative regulator or functions in another capacity within the ABA signaling cascade. Taken together, the evidence from ABA treatment assays, GUS staining findings, and transcriptomic outcomes suggests that DlPP2C1 responds to ABA and participates in ABA-mediated signaling during early somatic embryogenesis in Dimocarpus longan. Overall, our results provide new insights into the functional role of DlPP2C genes in ABA signaling, establishing a basis for future investigations into their roles in stress adaptation and application to other important plant species, particularly those with challenging micropropagation systems.

Supplementary Materials

The following supporting information can be downloaded at https://www.mdpi.com/article/10.3390/plants15111659/s1: Supplementary Figure S1. The heat map generated from the RNA sequencing FPKM values for DlPP2C genes with TBtools software v2.080 software under the ABA treatment of 16 h at 10 µM mM concentration. The control denoted with (CK) whereas ABA treated samples renamed as (Mdlo). Different colors on the scale bar represent different transcript levels. The data shown in the figure are the original FPKM value, with two decimal places selected. Supplementary Figure S2. The modular gene cluster heat map generated from the WGCNA (weighted gene co-expression network analysis). Each row and column represents a gene, and the darker the color of each point (white->yellow->red) represents the stronger the connectivity between the two genes corresponding to the row and column. Supplementary Figure S3. The relative expression of (A) Up-regulated and (B) Down-regulated DlPP2C genes in response to exogenous ABA treatments (10 µM) at time interval of (16 h), during early SE of longan determined by qRT-PCR. Values are the mean (n = 3) of three biological replicates. The data is plotted as fold change (2−ΔΔCT) relative to control, normalized to UBQ as internal reference. Graphpad prism 8 (v 10.0.0), software was used for plotting the graphs using one way ANOVA. Asterisks indicate significant differences (control vs. ABA treatments comparison) based on Tuckey’s t-test, “***” is p < 0.001. Supplementary Table S1: Gene count and Gene density of Chromosomes; Supplementary Table S2: The hypothetical predicted protein-protein interaction network model of DlPP2C gene family members displaying functional associations based on Arabidopsis thaliana as query. Each node stands for a protein whereas edges represent predicted interactions; Supplementary Table S3: Cis-acting element analysis of PP2C genes in longan. The 2 KB promoter sequences upstream of the DlPP2C initiation codon (ATG) of 71 DlPP2C genes were analyzed with PlantCARE; Supplementary Table S4: Hub of Genes for Each module; Supplementary Table S5: Genes in Each Pathway; Supplementary Table S6: Primers used; Supplementary Table S7: Vector construction primer sequences used.

Author Contributions

M.A. designed and performed the experiments, carried out statistical analyses, produced the figures and tables, and wrote the manuscript. H.M.U. and M.S. assisted with bioinformatics analysis. X.X. (Xiaoqiong Xu), C.Z., and S.L. assisted with morphological checks. Y.C., Y.H. and X.X. (Xu XuHan), revised the manuscript. Z.L. and Y.L. contributed to the creation of the concept and the funding acquisition. All authors have read and agreed to the published version of the manuscript.

Funding

This research was supported by the National Natural Science Foundation of China (32572999 and 31572088) and the Science and Technology Innovation Fund of Fujian Agriculture and Forestry University (KFB24103 and KFB22021XA).

Data Availability Statement

All relevant data are available within the manuscript and the Supplementary Materials.

Acknowledgments

The authors thank the Institute of Horticultural Biotechnology of Fujian Agriculture and Forestry University for facilitating this work and all the colleagues who contributed to the present research. All individuals included here have consented to this acknowledgment.

Conflicts of Interest

The authors declare no competing interests.

Abbreviations

The following abbreviations are used in this manuscript:
ABAAbscisic acid
PP2CProtein phosphatase 2C
ABIAbscisic acid-insensitive
WGCNAWeighted gene co-expression network analysis
GOGene Ontology
KEGGKyoto Encyclopedia of Genes and Genomes
DEGs Differentially expressed genes
UBQUBIQUITIN
SRASequence Read Archive
GSDSGene Structure Display Server

References

  1. Cohen, P. The Structure and Regulation of Protein Phosphatases. Annu. Rev. Biochem. 1989, 58, 453–508. [Google Scholar] [CrossRef]
  2. Xue, T.; Wang, D.; Zhang, S.; Ehlting, J.; Ni, F.; Jakab, S.; Zheng, C.; Zhong, Y. Genome-Wide and Expression Analysis of Protein Phosphatase 2C in Rice and Arabidopsis. BMC Genom. 2008, 9, 550. [Google Scholar] [CrossRef] [PubMed]
  3. Wang, J.; Li, J.; Li, Z.; Liu, B.; Zhang, L.; Guo, D.; Huang, S.; Qian, W.; Guo, L. Genomic Insights into Longan Evolution from a Chromosome-Level Genome Assembly and Population Genomics of Longan Accessions. Hortic. Res. 2022, 9, uhac021. [Google Scholar] [CrossRef]
  4. Liang, W.Y.; Chen, W.; Song, R.F.; Zhang, F. Advances in Embryo Development of Longan. Subtrop. Plant Sci. 2004, 33, 65. [Google Scholar]
  5. Chen, Y.; Lin, X.; Lai, Z. Advances in Somatic Embryogenesis of Dimocarpus longan Lour. Chin. J. Trop. Crop. 2020, 41, 1990–2002. [Google Scholar]
  6. Lin, Y.; Min, J.; Lai, R.; Wu, Z.; Chen, Y.; Yu, L.; Cheng, C.; Jin, Y.; Tian, Q.; Liu, Q. Genome-Wide Sequencing of Longan (Dimocarpus longan Lour.) Provides Insights into Molecular Basis of Its Polyphenol-Rich Characteristics. Gigascience 2017, 6, gix023. [Google Scholar] [CrossRef] [PubMed]
  7. El-Naby, M.E.-S.A. In Vitro Propagation for Conservation and Genetic Fidelity of the near Threatened Dimocarpus longan Plant. J. Genet. Eng. Biotechnol. 2022, 20, 130. [Google Scholar] [CrossRef]
  8. Lai, Z.X.; He, Y.; Chen, Y.T.; Cai, Y.Q.; Lai, C.C.; Lin, Y.L.; Lin, X.L.; Fang, Z.Z. Molecular Biology and Proteomics during Somatic Embryogenesis in Dimocarpus longan Lour. In Proceedings of the III International Symposium on Longan, Lychee, and other Fruit Trees in Sapindaceae Family 863, Fuzhou, China, 25–29 August 2008; pp. 95–102. [Google Scholar]
  9. Jung, C.; Nguyen, N.H.; Cheong, J.-J. Transcriptional Regulation of Protein Phosphatase 2C Genes to Modulate Abscisic Acid Signaling. Int. J. Mol. Sci. 2020, 21, 9517. [Google Scholar] [CrossRef]
  10. Ma, Y.; Szostkiewicz, I.; Korte, A.; Moes, D.; Yang, Y.; Christmann, A.; Grill, E. Regulators of PP2C Phosphatase Activity Function as Abscisic Acid Sensors. Science 2009, 324, 1064–1068. [Google Scholar] [CrossRef] [PubMed]
  11. Park, S.-Y.; Fung, P.; Nishimura, N.; Jensen, D.R.; Fujii, H.; Zhao, Y.; Lumba, S.; Santiago, J.; Rodrigues, A.; Chow, T.F. Abscisic Acid Inhibits Type 2C Protein Phosphatases via the PYR/PYL Family of START Proteins. Science 2009, 324, 1068–1071. [Google Scholar] [CrossRef]
  12. Zhai, T.; Guo, Y.; Yang, M.; Zhang, X.; Lin, Y.; Cai, D.; Lan, S.; Tang, M.; Ma, W.; Wang, S. The BZIP20 Transcription Factor Enhances Thermotolerance in Dimocarpus longan by Maintaining ROS Homeostasis and Involving the MeJA Pathway. Plant Physiol. Biochem. 2025, 223, 109869. [Google Scholar] [CrossRef]
  13. Tang, M.; Zhao, G.; Awais, M.; Gao, X.; Meng, W.; Lin, J.; Zhao, B.; Lai, Z.; Lin, Y.; Chen, Y. Genome-Wide Identification and Expression Analysis Reveals the B3 Superfamily Involved in Embryogenesis and Hormone Responses in Dimocarpus longan Lour. Int. J. Mol. Sci. 2023, 25, 127. [Google Scholar] [CrossRef]
  14. Peng, Y.; Fang, T.; Zhang, Y.; Zhang, M.; Zeng, L. Genome-Wide Identification and Expression Analysis of Auxin Response Factor (ARF) Gene Family in Longan (Dimocarpus longan L.). Plants 2020, 9, 221. [Google Scholar] [CrossRef]
  15. Lv, X.; Tian, S.; Huang, S.; Wei, J.; Han, D.; Li, J.; Guo, D.; Zhou, Y. Genome-Wide Identification of the Longan R2R3-MYB Gene Family and Its Role in Primary and Lateral Root. BMC Plant Biol. 2023, 23, 448. [Google Scholar] [CrossRef] [PubMed]
  16. Munir, N.; Yukun, C.; Xiaohui, C.; Nawaz, M.A.; Iftikhar, J.; Rizwan, H.M.; Xu, S.; Yuling, L.; Xuhan, X.; Zhongxiong, L. Genome-Wide Identification and Comprehensive Analyses of NAC Transcription Factor Gene Family and Expression Patterns during Somatic Embryogenesis in Dimocarpus longan Lour. Plant Physiol. Biochem. 2020, 157, 169–184. [Google Scholar] [CrossRef]
  17. Li, K.; Liu, K.; Wang, K.; Pang, Y.; Zhang, X.; Li, X.; Li, B. Comprehensive Analysis of the PP2C Gene Family in Grape (Vitis vinifera L.) and Identification of VvPP2C26 and VvPP2C41 as Negative Regulators of Fruit Ripening. Plants 2025, 14, 3827. [Google Scholar] [CrossRef]
  18. Yang, J.; Chen, R.; Liu, W.; Fan, C. Genome-Wide Identification, Phylogenetic Investigation and Abiotic Stress Responses Analysis of the PP2C Gene Family in Litchi (Litchi chinensis Sonn.). Front. Plant Sci. 2025, 16, 1547526. [Google Scholar] [CrossRef] [PubMed]
  19. Zhang, G.; Zhang, Z.; Luo, S.; Li, X.; Lyu, J.; Liu, Z.; Wan, Z.; Yu, J. Genome-Wide Identification and Expression Analysis of the Cucumber PP2C Gene Family. BMC Genom. 2022, 23, 563. [Google Scholar] [CrossRef]
  20. Guo, L.; Lu, S.; Liu, T.; Nai, G.; Ren, J.; Gou, H.; Chen, B.; Mao, J. Genome-Wide Identification and Abiotic Stress Response Analysis of PP2C Gene Family in Woodland and Pineapple Strawberries. Int. J. Mol. Sci. 2023, 24, 4049. [Google Scholar] [CrossRef]
  21. Wu, Z.; Luo, L.; Wan, Y.; Liu, F. Genome-Wide Characterization of the PP2C Gene Family in Peanut (Arachis hypogaea L.) and the Identification of Candidate Genes Involved in Salinity-Stress Response. Front. Plant Sci. 2023, 14, 1093913. [Google Scholar] [CrossRef] [PubMed]
  22. Zhang, Z.; Ali, S.; Zhang, T.; Wang, W.; Xie, L. Identification, Evolutionary and Expression Analysis of PYL-PP2C-SnRK2s Gene Families in Soybean. Plants 2020, 9, 1356. [Google Scholar] [CrossRef] [PubMed]
  23. Singh, A.; Pandey, A.; Srivastava, A.K.; Tran, L.-S.P.; Pandey, G.K. Plant Protein Phosphatases 2C: From Genomic Diversity to Functional Multiplicity and Importance in Stress Management. Crit. Rev. Biotechnol. 2016, 36, 1023–1035. [Google Scholar] [CrossRef]
  24. Cuming, A.C. Evolution of ABA Signaling Pathways. In Advances in Botanical Research; Elsevier: Amsterdam, The Netherlands, 2019; Volume 92, pp. 281–313. ISBN 0065-2296. [Google Scholar]
  25. Lammers, T.; Lavi, S. Role of Type 2C Protein Phosphatases in Growth Regulation and in Cellular Stress Signaling. Crit. Rev. Biochem. Mol. Biol. 2007, 42, 437–461. [Google Scholar] [CrossRef]
  26. Awais, M.; Xu, X.; Zhang, C.; Chen, Y.; Liu, S.; Lin, Y.; Lai, Z. Genome-Wide Identification of ABSCISIC ACID-INSENSITIVE (ABI) Genes and Their Response to MeJA During Early Somatic Embryogenesis in Longan (Dimocarpus longan L.). Plants 2025, 14, 3508. [Google Scholar] [CrossRef] [PubMed]
  27. Cao, J.; Jiang, M.; Li, P.; Chu, Z. Genome-Wide Identification and Evolutionary Analyses of the PP2C Gene Family with Their Expression Profiling in Response to Multiple Stresses in Brachypodium Distachyon. BMC Genom. 2016, 17, 175. [Google Scholar] [CrossRef]
  28. Wu, H.; Zhu, L.; Cai, G.; Lv, C.; Yang, H.; Ren, X.; Hu, B.; Zhou, X.; Jiang, T.; Xiang, Y. Genome-Wide Identification and Characterization of the PP2C Family from Zea Mays and Its Role in Long-Distance Signaling. Plants 2023, 12, 3153. [Google Scholar] [CrossRef] [PubMed]
  29. Zhang, Y.; Wang, R.-Q.; Wang, X.-Y.; Wei, S.-Y.; Li, H.; Deng, S.-L.; Liu, J.-H.; Wang, T.; Chen, L.-H.; He, F. Comprehensive Analysis of Clade A PP2C Family in Poplar Unveils PtrPP2C-9 as a Negative Regulator of Osmotic Stress Tolerance through ABF3/GBF3 Network. Plant Sci. 2026, 364, 112977. [Google Scholar] [CrossRef]
  30. Rodrigues, A.; Adamo, M.; Crozet, P.; Margalha, L.; Confraria, A.; Martinho, C.; Elias, A.; Rabissi, A.; Lumbreras, V.; González-Guzmán, M. ABI1 and PP2CA Phosphatases Are Negative Regulators of Snf1-Related Protein Kinase1 Signaling in Arabidopsis. Plant Cell 2013, 25, 3871–3884. [Google Scholar] [CrossRef]
  31. Chuong, N.N.; Hoang, X.L.T.; Nghia, D.H.T.; Dai, T.N.T.; Le Thi, V.-A.; Thao, N.P. Protein Phosphatase Type 2C Functions in Phytohormone-Dependent Pathways and in Plant Responses to Abiotic Stresses. Curr. Protein Pept. Sci. 2021, 22, 430–440. [Google Scholar] [CrossRef]
  32. Zhang, P.; Liu, D.; Ma, J.; Sun, C.; Wang, Z.; Zhu, Y.; Zhang, X.; Liu, Y. Genome-Wide Analysis and Expression Pattern of the ZoPP2C Gene Family in Zingiber Officinale Roscoe. BMC Genom. 2024, 25, 83. [Google Scholar] [CrossRef]
  33. Ghanizadeh, H.; Qamer, Z.; Zhang, Y.; Wang, A. The Multifaceted Roles of PP2C Phosphatases in Plant Growth, Signaling, and Response to Abiotic and Biotic Stress. Plant Commun. 2025, 6, 101457. [Google Scholar] [CrossRef]
  34. Chuong, N.N.; Nghia, D.H.T.; Le Thi, V.-A.; Tran, L.-S.P.; Hoang, X.L.T.; Thao, N.P. Type 2C Protein Phosphatases in Plant Signaling Pathways under Abiotic Stress. In Protein Phosphatases and Stress Management in Plants: Functional Genomic Perspective; Springer: Berlin/Heidelberg, Germany, 2020; pp. 67–82. [Google Scholar]
  35. Yu, X.; Han, J.; Wang, E.; Xiao, J.; Hu, R.; Yang, G.; He, G. Genome-Wide Identification and Homoeologous Expression Analysis of PP2C Genes in Wheat (Triticum aestivum L.). Front. Genet. 2019, 10, 561. [Google Scholar] [CrossRef]
  36. Zhang, B.; Chen, N.; Peng, X.; Shen, S. Identification of the PP2C Gene Family in Paper Mulberry (Broussonetia Papyrifera) and Its Roles in the Regulation Mechanism of the Response to Cold Stress. Biotechnol. Lett. 2021, 43, 1089–1102. [Google Scholar] [CrossRef]
  37. Corredoira, E.; Merkle, S.A.; Martínez, M.T.; Toribio, M.; Canhoto, J.M.; Correia, S.I.; Ballester, A.; Vieitez, A.M. Non-Zygotic Embryogenesis in Hardwood Species. CRC. Crit. Rev. Plant Sci. 2019, 38, 29–97. [Google Scholar] [CrossRef]
  38. Krzywińska, E.; Kulik, A.; Bucholc, M.; Fernandez, M.A.; Rodriguez, P.L.; Dobrowolska, G. Protein Phosphatase Type 2C PP2CA Together with ABI1 Inhibits SnRK2. 4 Activity and Regulates Plant Responses to Salinity. Plant Signal. Behav. 2016, 11, e1253647. [Google Scholar] [CrossRef] [PubMed]
  39. Sun, Z.; Li, S.; Chen, W.; Zhang, J.; Zhang, L.; Sun, W.; Wang, Z. Plant Dehydrins: Expression, Regulatory Networks, and Protective Roles in Plants Challenged by Abiotic Stress. Int. J. Mol. Sci. 2021, 22, 12619. [Google Scholar] [CrossRef] [PubMed]
  40. Li, R.; Zhu, F.; Duan, D. Function Analysis and Stress-Mediated Cis-Element Identification in the Promoter Region of VqMYB15. Plant Signal. Behav. 2020, 15, 1773664. [Google Scholar] [CrossRef]
  41. Rhee, S.Y.; Beavis, W.; Berardini, T.Z.; Chen, G.; Dixon, D.; Doyle, A.; Garcia-Hernandez, M.; Huala, E.; Lander, G.; Montoya, M. The Arabidopsis Information Resource (TAIR): A Model Organism Database Providing a Centralized, Curated Gateway to Arabidopsis Biology, Research Materials and Community. Nucleic Acids Res. 2003, 31, 224–228. [Google Scholar] [CrossRef] [PubMed]
  42. Yates, A.D.; Austine-Orimoloye, O.; Azov, A.G.; Barba, M.; Barnes, I.; Barrera-Enriquez, V.P.; Becker, A.; Bennett, R.; Berry, A.; Bhai, J. Ensembl 2026. Nucleic Acids Res. 2026, 54, D1053–D1060. [Google Scholar] [CrossRef]
  43. Chen, C.; Chen, H.; Zhang, Y.; Thomas, H.R.; Frank, M.H.; He, Y.; Xia, R. TBtools: An Integrative Toolkit Developed for Interactive Analyses of Big Biological Data. Mol. Plant 2020, 13, 1194–1202. [Google Scholar] [CrossRef]
  44. Potter, S.C.; Luciani, A.; Eddy, S.R.; Park, Y.; Lopez, R.; Finn, R.D. HMMER Web Server: 2018 Update. Nucleic Acids Res. 2018, 46, W200–W204. [Google Scholar] [CrossRef]
  45. Duvaud, S.; Gabella, C.; Lisacek, F.; Stockinger, H.; Ioannidis, V.; Durinx, C. Expasy, the Swiss Bioinformatics Resource Portal, as Designed by Its Users. Nucleic Acids Res. 2021, 49, W216–W227. [Google Scholar] [CrossRef] [PubMed]
  46. Horton, P.; Park, K.-J.; Obayashi, T.; Fujita, N.; Harada, H.; Adams-Collier, C.J.; Nakai, K. WoLF PSORT: Protein Localization Predictor. Nucleic Acids Res. 2007, 35, W585–W587. [Google Scholar] [CrossRef] [PubMed]
  47. Chen, C.; Chen, H.; He, Y.; Xia, R. TBtools, a Toolkit for Biologists Integrating Various Biological Data Handling Tools with a User-Friendly Interface. BioRxiv 2018, 289660, 289660. [Google Scholar]
  48. Letunic, I.; Bork, P. Interactive Tree of Life (ITOL) v6: Recent Updates to the Phylogenetic Tree Display and Annotation Tool. Nucleic Acids Res. 2024, 52, W78–W82. [Google Scholar] [CrossRef]
  49. Bailey, T.L.; Boden, M.; Buske, F.A.; Frith, M.; Grant, C.E.; Clementi, L.; Ren, J.; Li, W.W.; Noble, W.S. MEME SUITE: Tools for Motif Discovery and Searching. Nucleic Acids Res. 2009, 37, W202–W208. [Google Scholar] [CrossRef]
  50. Hu, B.; Jin, J.; Guo, A.-Y.; Zhang, H.; Luo, J.; Gao, G. GSDS 2.0: An Upgraded Gene Feature Visualization Server. Bioinformatics 2015, 31, 1296–1297. [Google Scholar] [CrossRef]
  51. Lescot, M.; Déhais, P.; Thijs, G.; Marchal, K.; Moreau, Y.; Van de Peer, Y.; Rouzé, P.; Rombauts, S. PlantCARE, a Database of Plant Cis-Acting Regulatory Elements and a Portal to Tools for in Silico Analysis of Promoter Sequences. Nucleic Acids Res. 2002, 30, 325–327. [Google Scholar] [CrossRef]
  52. Mostafavi, S.; Ray, D.; Warde-Farley, D.; Grouios, C.; Morris, Q. GeneMANIA: A Real-Time Multiple Association Network Integration Algorithm for Predicting Gene Function. Genome Biol. 2008, 9, S4. [Google Scholar] [CrossRef]
  53. Lin, Y.L.; Lai, Z.X. Reference Gene Selection for QPCR Analysis during Somatic Embryogenesis in Longan Tree. Plant Sci. 2010, 178, 359–365. [Google Scholar] [CrossRef]
  54. Livak, K.J.; Schmittgen, T.D. Analysis of Relative Gene Expression Data Using Real-Time Quantitative PCR and the 2−ΔΔCT Method. Methods 2001, 25, 402–408. [Google Scholar] [CrossRef] [PubMed]
  55. Trapnell, C.; Roberts, A.; Goff, L.; Pertea, G.; Kim, D.; Kelley, D.R.; Pimentel, H.; Salzberg, S.L.; Rinn, J.L.; Pachter, L. Differential Gene and Transcript Expression Analysis of RNA-Seq Experiments with TopHat and Cufflinks. Nat. Protoc. 2012, 7, 562–578. [Google Scholar] [CrossRef]
  56. Schroeder, A.; Mueller, O.; Stocker, S.; Salowsky, R.; Leiber, M.; Gassmann, M.; Lightfoot, S.; Menzel, W.; Granzow, M.; Ragg, T. The RIN: An RNA Integrity Number for Assigning Integrity Values to RNA Measurements. BMC Mol. Biol. 2006, 7, 3. [Google Scholar] [CrossRef]
  57. Kim, D.; Paggi, J.M.; Park, C.; Bennett, C.; Salzberg, S.L. Graph-Based Genome Alignment and Genotyping with HISAT2 and HISAT-Genotype. Nat. Biotechnol. 2019, 37, 907–915. [Google Scholar] [CrossRef]
  58. Pertea, M.; Pertea, G.M.; Antonescu, C.M.; Chang, T.-C.; Mendell, J.T.; Salzberg, S.L. StringTie Enables Improved Reconstruction of a Transcriptome from RNA-Seq Reads. Nat. Biotechnol. 2015, 33, 290–295. [Google Scholar] [CrossRef]
  59. Kanehisa, M.; Goto, S. KEGG: Kyoto Encyclopedia of Genes and Genomes. Nucleic Acids Res. 2000, 28, 27–30. [Google Scholar] [CrossRef] [PubMed]
  60. Love, M.I.; Huber, W.; Anders, S. Moderated Estimation of Fold Change and Dispersion for RNA-Seq Data with DESeq2. Genome Biol. 2014, 15, 550. [Google Scholar] [CrossRef]
Figure 1. The phylogenetic tree of PP2C gene family in three species, including D. longan, Arabidopsis thaliana, and Oryza sativa. The tree is divided into various clades (A–L), which consist of a unique set of PP2C gene family members of the species, displayed in different colors.
Plants 15 01659 g001
Figure 2. The chromosomal distribution of the DIPP2C gene family, where 15 chromosomes (Chr1-Chr 15) are clearly defined, with their genes being positioned in different locations on the chromosome. Unanchored (UA) regions contain additional DIPP2C genes, which is an indication that they are unassembled or that their genomic regions remain unresolved. The resulting diagram shows the physical locations of each family member (renamed according to standard homology-based nomenclature), illustrating that these evolutionarily related genes are distributed across multiple chromosomes.
Plants 15 01659 g002
Figure 3. (A) The synteny plot of the chromosomal localization of Arabidopsis thaliana, Dimocarpus longan, Malus domestica Borkh, and Oryza sativa. The blue lines represent the synteny between Arabidopsis and Longan, and the red lines mark the syntenic associations between Longan and Oryza sativa. The map highlights the preserved gene arrangement and genomic rearrangements among the species, and provides information on their evolutionary association and the maintenance of the genomic regions throughout evolution. (B) The Circos map of the locus of the PP2C genes in the chromosomes of Longan (denoted as “chr”) and Arabidopsis (denoted as “Chr”). The red lines represent the PP2C genes of Longan, and the blue lines are the PP2C genes of Arabidopsis. The unanchored regions (denoted as UA1, UA2, etc.) refer to loci of the chromosomes, which could have additional PP2C genes, but with diminished resolution.
Plants 15 01659 g003aPlants 15 01659 g003b
Figure 4. Illustration of a four-part study (from left to right) of the DIPP2C gene family, including evolutionary connections (A) phylogenetic tree, motif distributions (B), conserved domains (C), and coding sequences (CDS) and untranslated regions (UTRs) (D), highlighting the structural and functional diversity of the DlPP2C gene family.
Plants 15 01659 g004
Figure 5. The hypothetical protein–protein interaction network model of DlPP2C gene family members displaying functional associations based on Arabidopsis thaliana as query. Each node stands for a protein, whereas edges represent predicted interactions.
Plants 15 01659 g005
Figure 6. Cis-acting element analysis of PP2C genes in longan. The 2 KB promoter sequences upstream of the DlPP2C initiation codon (ATG) of 71 DlPP2C genes were analyzed with PlantCARE v1 software.
Plants 15 01659 g006
Figure 7. The relative expression of DlPP2C genes in response to exogenous ABA treatments (5 µM,10 µM, and 20 µM) at three time intervals (8 h, 16 h, and 24 h) during early SE of longan, determined by qRT-PCR. Values are the mean (n = 3) of three biological replicates. The data is plotted as fold change (2−ΔΔCT) relative to control, normalized to UBQ as internal reference. Graphpad Prism 8 (v 10.0.0) software was used for plotting the graphs using one-way ANOVA. Different letters above the bars indicate significant differences among treatments based on Tukey’s t-test (p ≤ 0.05).
Plants 15 01659 g007
Figure 8. Transient overexpression of D. longan EC and molecular identification. (A) PCR amplification of WT and DlPP2C1 transient overexpression cell lines displaying the GUS (225 bp) and Hyg (475 bp), and detection for the verification of amplified sequences. (B) Relative expression level of WT and DlPP2C1 transient overexpression cell line determined by qRT-PCR. Asterisks indicate significant differences (WT vs. OE comparison), “***” is p < 0.001. (C) GUS staining of WT and DlPP2C1 transiently overexpressed line. The fluorescence microscopy technique was used for capturing images with field of view set at 20×.
Plants 15 01659 g008
Figure 9. WGCNA (weighted gene co-expression network analysis) analysis. (A) Soft threshold selection. The scale independence was shown in the right graph, while the left graph presents mean connectivity. The horizontal coordinates of the two plots represent the value of the power index. (B) Module hierarchical clustering with a topologically heterogeneous matrix (TOM) set up to 1, to get the corresponding matrix of genetic non-similarity (dissTOM). (C) The heatmap of correlation between modules. The vertical coordinates represent the degree of difference in the node; each row and column in the lower half of the graph represents a module. (D) Association between samples and modules. Each row in the figure represents a different gene co-expression module, each column represents a different sample (control checks—CK1, CK2, and CK3; 10 µM ABA-treated samples—R1, R2, and R3). The value represents the correlation coefficient, and distinguishes the positive and negative correlations through red and green, respectively, and the value in the parentheses is the significant p-value.
Plants 15 01659 g009
Figure 10. Transcriptomic analysis and data quality assessment. (A) Correlation heatmap between samples. A closer R2 value to 1 indicates better reproducibility between the two samples. (B) PC1 and PC2 are two principal components; different colors represent different groups of biological replicates. (C) Volcano plot on differential expression. Each dot represents a gene. X-axis: log2Fold change in expression; Y-axis: −log10 (FDR) or −log10 (p-value). (D) GO classification of DEGs. X-axis: GO terms and classifications; Y-axis: Number of DEGs (genes) annotated to the term (right) and percentage of that in all DEGs (genes) (Left). (E) KEGG pathway enrichment on DEGs-Bubble chart. Each dot represents a KEGG pathway. Y-axis: pathway; X-axis: rich factor.
Plants 15 01659 g010
Table 1. Physicochemical properties of the PP2C gene family in D. longan. Columns detail the gene IDs list, number of amino acids (A.A), molecular weight (MW), isoelectric points (pI), instability index (II), aliphatic index (AI), grand average of hydropathicity (GRAVY), and predicted subcellular localization (SCL).
IDAAMWpIIIAIGRAVYSCL
DlPP2C148153,095.495.3746.3968.07−0.469Chlo
DlPP2C248753,534.055.6341.376.28−0.437Chlo
DlPP2C353258,738.964.9538.6981.43−0.367Cito
DlPP2C449454,353.025.5340.6178.16−0.403Chlo
DlPP2C544650,102.446.2931.2675.61−0.579Cyto
DlPP2C638642,984.756.3640.3576.53−0.279Chlo
DlPP2C738642,984.756.3640.3576.53−0.279Chlo
DlPP2C838041,976.537.9948.2681.08−0.31Chlo
DlPP2C935138,552.765.7144.3888.29−0.273Cyto
DlPP2C1038642,904.355.2841.1676.04−0.299Mito
DlPP2C1138642,904.355.2841.1676.04−0.299Mito
DlPP2C1271380,002.695.4443.3578.49−0.517Nucl
DlPP2C1370979,381.335.4145.2173.96−0.601Nucl
DlPP2C1439742,739.47.5360.4676.12−0.28Chlo
DlPP2C1543147,829.85.9761.4665.57−0.581Cyto
DlPP2C1642746,665.565.658.5877.82−0.417Nucl
DlPP2C1778686,793.155.3642.4879.21−0.474Chlo
DlPP2C1888298,099.085.9339.8768.21−0.56Nucl
DlPP2C1939342,503.36.3844.8983.77−0.188Chlo
DlPP2C2035138,708.115.8436.2286.58−0.329Nucl
DlPP2C2144849,649.688.2436.4985.87−0.376Mito
DlPP2C2252457,090.55.1747.3288.95−0.188Nucl
DlPP2C2339743,513.155.8846.4885.31−0.359Chlo
DlPP2C2449454,248.028.5944.1477.91−0.43Nucl
DlPP2C2541845,486.455.5662.7381.2−0.278Nucl
DlPP2C2645550,300.216.1249.4183.54−0.415Chlo
DlPP2C2754459,008.924.8944.0491.69−0.12Chlo
DlPP2C2839743,225.384.9655.7274.84−0.434Nucl
DlPP2C2954658,749.444.947.9193.35−0.167Chlo
DlPP2C3046451,427.315.5165.6282.28−0.258Chlo
DlPP2C3129331,518.875.0539.4977.92−0.327Cyto
DlPP2C3235639,302.945.2447.575.06−0.4Chlo
DlPP2C3327630,273.965.130.3682.28−0.244Cyto
DlPP2C3435339,479.48.9142.2391.42−0.219Chlo
DlPP2C3565873,053.466.1140.9193.31−0.187Cyto
DlPP2C3628231,023.037.7640.7482.98−0.413Cyto
DlPP2C3728231,011.195.6842.6189.18−0.296Cyto
DlPP2C3828330,887.896.7538.4182.37−0.385Nucl
DlPP2C3940644,250.345.0953.389.11−0.058Nucl
DlPP2C4039442,888.755.8749.5980.96−0.307Nucl
DlPP2C4118720,712.636.1538.64101.12−0.14Chlo
DlPP2C4242845,737.36.932.3486.33−0.111Chlo
DlPP2C4343947,181.988.2436.6786.86−0.174Chlo
DlPP2C4443847,673.465.1737.8782.58−0.193Cyto
DlPP2C4540044,478.728.1557.0477.5−0.357Chlo
DlPP2C4631835,003.538.2143.4483.43−0.393Cyto
DlPP2C4730333,325.78.2243.1984.65−0.364Cyto
DlPP2C4827731,547.179.6855.2475.63−0.467Chlo
DlPP2C4939843,428.375.7637.6293.87−0.114Chlo
DlPP2C5039843,331.265.7637.4591.91−0.129Chlo
DlPP2C5141044,560.115.0735.5279.98−0.348Chlo
DlPP2C52907100,000.674.8346.1796.37−0.09Plas
DlPP2C5347652,456.315.739.4382.23−0.214Chlo
DlPP2C5415517,163.216.8136.1262.32−0.517Nucl
DlPP2C5537241,033.065.4441.4771.34−0.422Nucl
DlPP2C5630632,961.165.0539.3192.060.013Chlo
DlPP2C5751455,360.656.2344.4580.04−0.227Mito
DlPP2C5845347,908.988.4840.1678.98−0.09Chlo
DlPP2C5939444,304.576.950.5496.24−0.199Mito
DlPP2C6039143,315.215.8537.4494.99−0.207Cyto
DlPP2C6138543,139.228.1242.6490.34−0.288Chlo
DlPP2C6239744,158.328.6748.5588.84−0.307Chlo
DlPP2C6339744,176.38.9448.6890.3−0.272Nucl
DlPP2C6438542,838.69738.9991.14−0.289Chlo
DlPP2C6537441,591.68.8643.5787.35−0.293Mito
DlPP2C6638342,310.975.7442.2389.32−0.193Chlo
DlPP2C671018114,972.385.6245.7480.42−0.382Vacu
DlPP2C6824326,329.38942.6798.35−0.016Cyto
DlPP2C6925828,459.064.942.6779.73−0.252Extr
DlPP2C7045448,976.754.7242.6288.24−0.137Chlo
DlPP2C7155561,220.535.5548.6287.48−0.235Chlo
Disclaimer/Publisher’s Note: The statements, opinions and data contained in all publications are solely those of the individual author(s) and contributor(s) and not of MDPI and/or the editor(s). MDPI and/or the editor(s) disclaim responsibility for any injury to people or property resulting from any ideas, methods, instructions or products referred to in the content.