Article

Aquorin Bioluminescence-Based Ca2+ Imaging Reveals Differential Calcium Signaling Responses to Abiotic Stresses in Physcomitrella patens

1
College of Life and Environmental Sciences, Hangzhou Normal University, Hangzhou 311121, China
2
Zhejiang Provincial Key Laboratory for Genetic Improvement and Quality Control of Medicinal Plants, Hangzhou Normal University, Hangzhou 311121, China
*
Authors to whom correspondence should be addressed.
Plants 2025, 14(8), 1178; https://doi.org/10.3390/plants14081178
Submission received: 7 March 2025 / Revised: 8 April 2025 / Accepted: 8 April 2025 / Published: 10 April 2025
(This article belongs to the Special Issue Crop Yield Improvement in Genetic and Biology Breeding)

Abstract

Calcium ions (Ca2+) are an important secondary messenger in plant signal transduction networks. The cytosolic free Ca2+ concentration ([Ca2+]i) of plants changes rapidly when they are subjected to different abiotic stresses, which drives calcium signaling. Although this process has been extensively studied in spermatophytes, the details of calcium signaling in bryophytes remains largely unknown. In our study, we reconstituted aequorin in the bryophyte Physcomitrella patens, optimized the percentage of ethanol in the Ca2+ discharging solution, and measured the [Ca2+]i changes induced by different stresses. In addition, we observed that the sources of Ca2+ accessed following exposure to cold, drought, salt, and oxidative stress were different. Furthermore, we showed that long-term saline environments could suppress the basal [Ca2+]i of P. patens, and the peak value of [Ca2+]i induced by different stresses was lower than that of plants growing in non-stressed environments. This is the first systematic study of calcium signaling in bryophytes, and we provided an efficient and convenient tool to study calcium signaling in response to different abiotic stresses in bryophytes.

1. Introduction

Bryophytes are an important component of biodiversity, with approximately 21,000 species worldwide [1,2]. These small plants often act as ecosystem pioneers, and they play other important roles in enabling the monitoring of environmental pollution, protecting soil and water resources, maintaining material cycles and energy flows, and sequestering carbon [3,4,5,6,7]. The ongoing environmental and climatic changes pose a high risk of extinction for some bryophytes [8]. Thus, the study of how bryophytes respond to environmental stress is of great theoretical and practical importance for the conservation and use of species resources and for the maintenance of ecological balance.
Over the course of their evolution, plants have adapted to environmental changes through a series of molecular mechanisms that couple stimulus signals to the specific physiological effects they induce. Calcium ions (Ca2+) are an important secondary messenger in plant signal transduction networks in response to a large number of environmental stimuli such as cold, drought, salt, and oxidative stress [9,10]. Upon exposure to environmental signals, Ca2+ enters the cell from calcium pools (both intracellular and extracellular) via Ca2+ channels and transporter proteins [11], resulting in a rapid increase in the concentration of cytosolic free Ca2+ ([Ca2+]i). This generates a unique Ca2+ signal that interacts with downstream effector proteins, such as calmodulin and calcium-dependent protein kinases, to activate their downstream targets and induce short- and long-term adaptive responses to specific environmental conditions [10,12,13,14]. Changes in [Ca2+]i are an early cellular response to specific environmental stimuli, and plants vary in their [Ca2+]i changes in response to different external stimuli [15]. Excessive [Ca2+]i is toxic to cells, and so plants maintain their [Ca2+]i homeostasis by transferring Ca2+ to organelles such as vesicles and the endoplasmic reticulum (ER) via Ca2+-ATPases and H+/Ca2+-antiporters [16,17,18].
As the [Ca2+]i signal is generated transiently, the effective detection of [Ca2+]i in real time is important for studying plant physiology. Genetically encoded calcium indicators (GECIs) are widely used to detect changes in [Ca2+]i in plants [19,20]. Aequorin, a calcium-sensitive photoprotein from the jellyfish Aequoria victoria [21], is formed from an oxygen molecule; a single polypeptide chain, apoaequorin; and a hydrophobic luminophore, coelenterazine [22,23]. Each apoaequorin binds three Ca2+ ions, which causes coelenterazine to dissociate from the complex and emit blue light at a wavelength of 469 nm [24]. The higher the [Ca2+]i, the stronger the luminescence; therefore, the [Ca2+]i can be deduced from the luminescence intensity.
In this paper, we transferred the apoaequorin cDNA into Physcomitrella patens and reconstituted aequorin in vitro. For the first time, we employed aequorin-based bioluminescence Ca2+ imaging to systematically explore the changes of [Ca2+]i in response to diverse environmental stresses in P. patens. Our findings provide a foundation for the future comparative studies of calcium signaling evolution between bryophytes and angiosperm models (Arabidopsis and rice) through the analysis of conserved and divergent response patterns.

2. Results

2.1. Production of Transgenic P. patens Expressing Apoaequorin

To examine the responses of [Ca2+]i to abiotic stresses, we prepared transgenic P. patens expressing apoaequorin under the control of the PpEF1-α promoter (Figure 1A). The heterologous expression of apoaequorin had no significant effect on the growth or development of moss (Supplementary Figure S1). The PCR and RT-PCR results indicated that the APOAEQUORIN gene was successfully inserted into specific sites in the genome of P. patens, and that it was successfully expressed under the PpEF1-α promoter (Figure 1B). All three transformants contained an insertion at the same location, and they did not differ substantially at the genomic level; thus, one transformant, AQ-OE1, was chosen for the subsequent calcium signaling assay.

2.2. Optimization of the Discharging Solution for Luminescence Imaging in P. patens

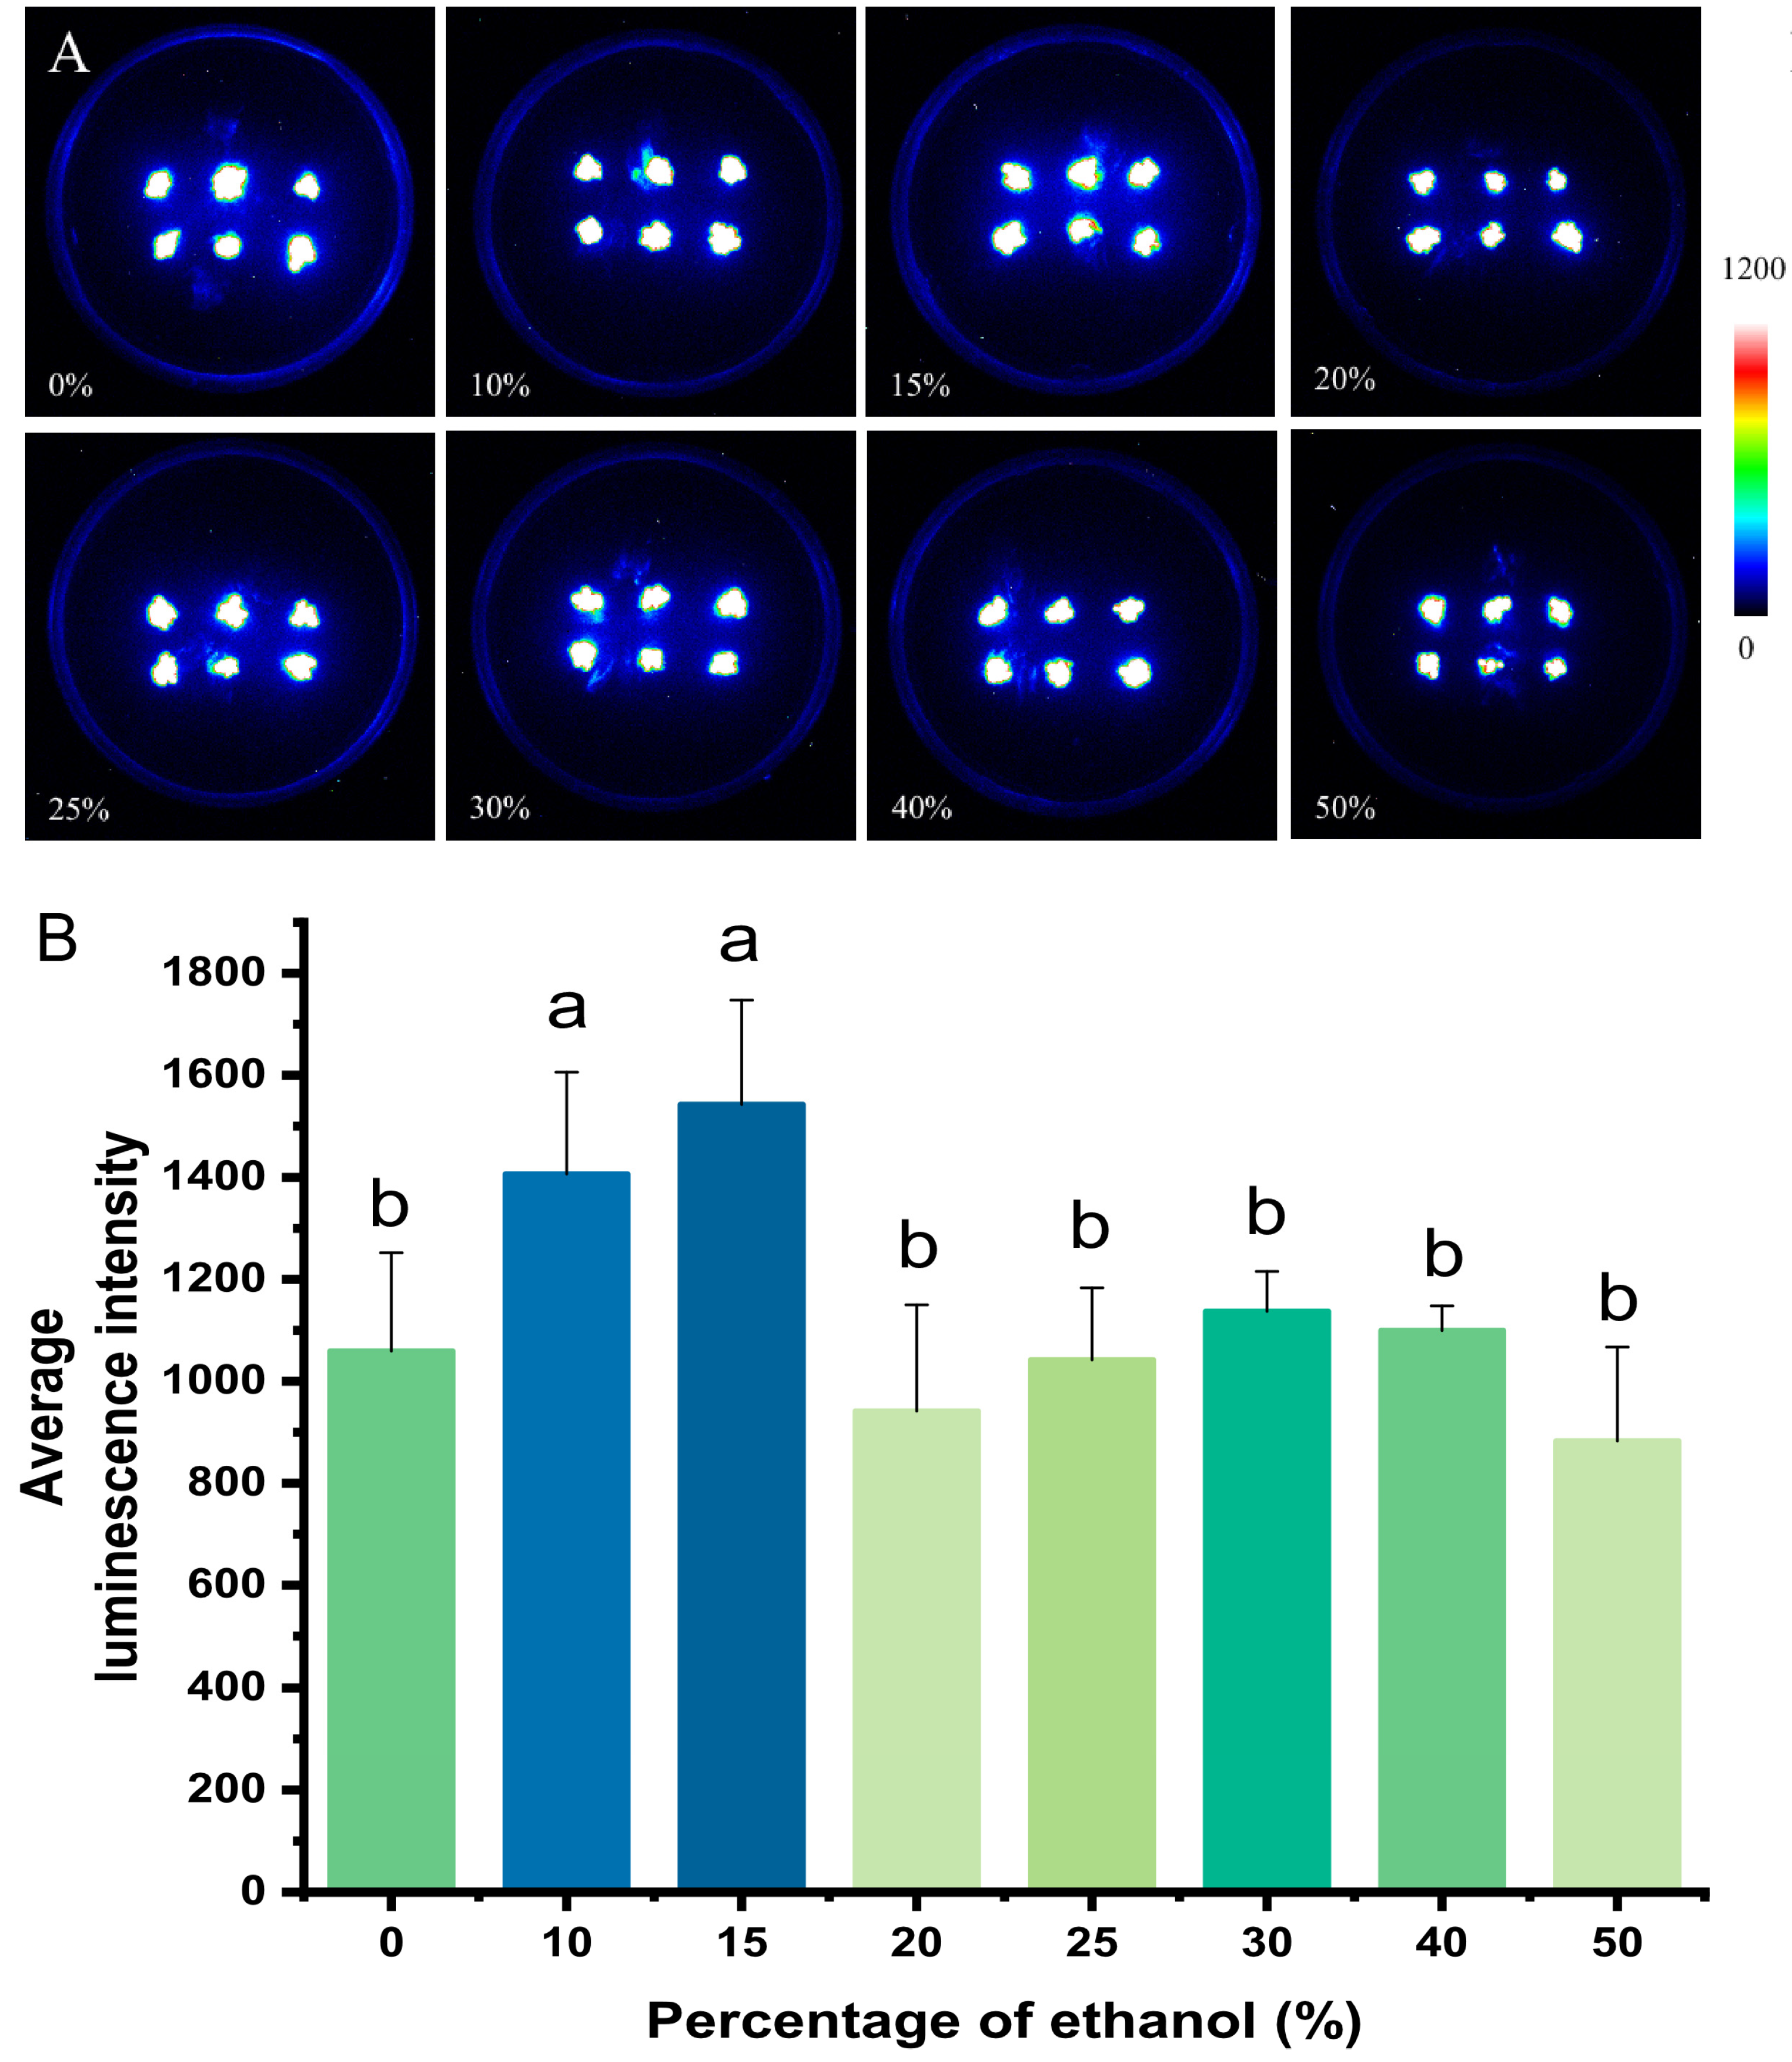
The discharging solution treatment causes the release of all intracellular Ca2+, which is important for the calculation of [Ca2+]i based on luminescence intensity. In this study, P. patens was treated with a series of discharging solution with different ethanol concentration gradients. At ethanol levels below 15%, the luminescence intensity increased significantly with increasing ethanol content; when the plants were treated with a discharging solution containing 15% ethanol, the plants emitted approximately 1.5 times more luminescence than when the discharging solution with 0% ethanol was used. The luminescence intensity was significantly lower in plants treated with a discharging solution containing more than 15% ethanol, although the intensity did not change significantly as the ethanol content increased above this threshold (Figure 2). A discharging solution with an ethanol content of 15% was thus used as the optimum treatment solution for P. patens.

2.3. Cold Induces an Immediate [Ca2+]i Spike in P. patens

The luminescence intensity was related to the degree of cold stress: the lower the temperature, the greater the luminescence intensity, with temperatures of 15 °C and below inducing a strong luminescence signal (Figure 3A). The luminescence signals under the 20 °C treatment and in the control (25 °C) were not significantly different, whereas the luminescence signals induced by 15 °C, 10 °C, 5 °C, and 0 °C were significantly different from those of the control (p < 0.001) (Figure 3B). The fluorescence values (L/Lmax) were consistent with the overall trend of average luminescence intensity, with L/Lmax increasing as the temperature decreased. A further analysis revealed no significant difference between the L/Lmax values under the control and 20 °C treatment or the 15 °C treatment, whereas the 10 °C, 5 °C, and 0 °C treatments caused a significant difference relative to the control (p < 0.01) (Figure 3B).
The basic parameters of the [Ca2+]i response were analyzed, revealing that the calcium signal in P. patens appeared quickly after the 5 °C and 0 °C treatment, with a significant increase in luminescence intensity and L/Lmax, which peaked after around 15 s (seconds). The maximum values of luminescence intensity and L/Lmax induced by the 0 °C treatment were 3.5 times and 5 times higher than those for the 5 °C treatment, respectively, and decreased rapidly within 30 s, followed by a return to basal levels within 3 min. In contrast, the peaks of luminescence intensity and L/Lmax induced by the 10 °C, 15 °C, and 20 °C treatments appeared later, at 60–75 s, and the increase was relatively weak compared with the resting state (Figure 3C,D). In general, the greater the degree of cold stress, the faster the appearance of the luminescence signal, and the greater the luminescence intensity and L/Lmax.

2.4. Drought Induces a [Ca2+]i Spike in P. patens

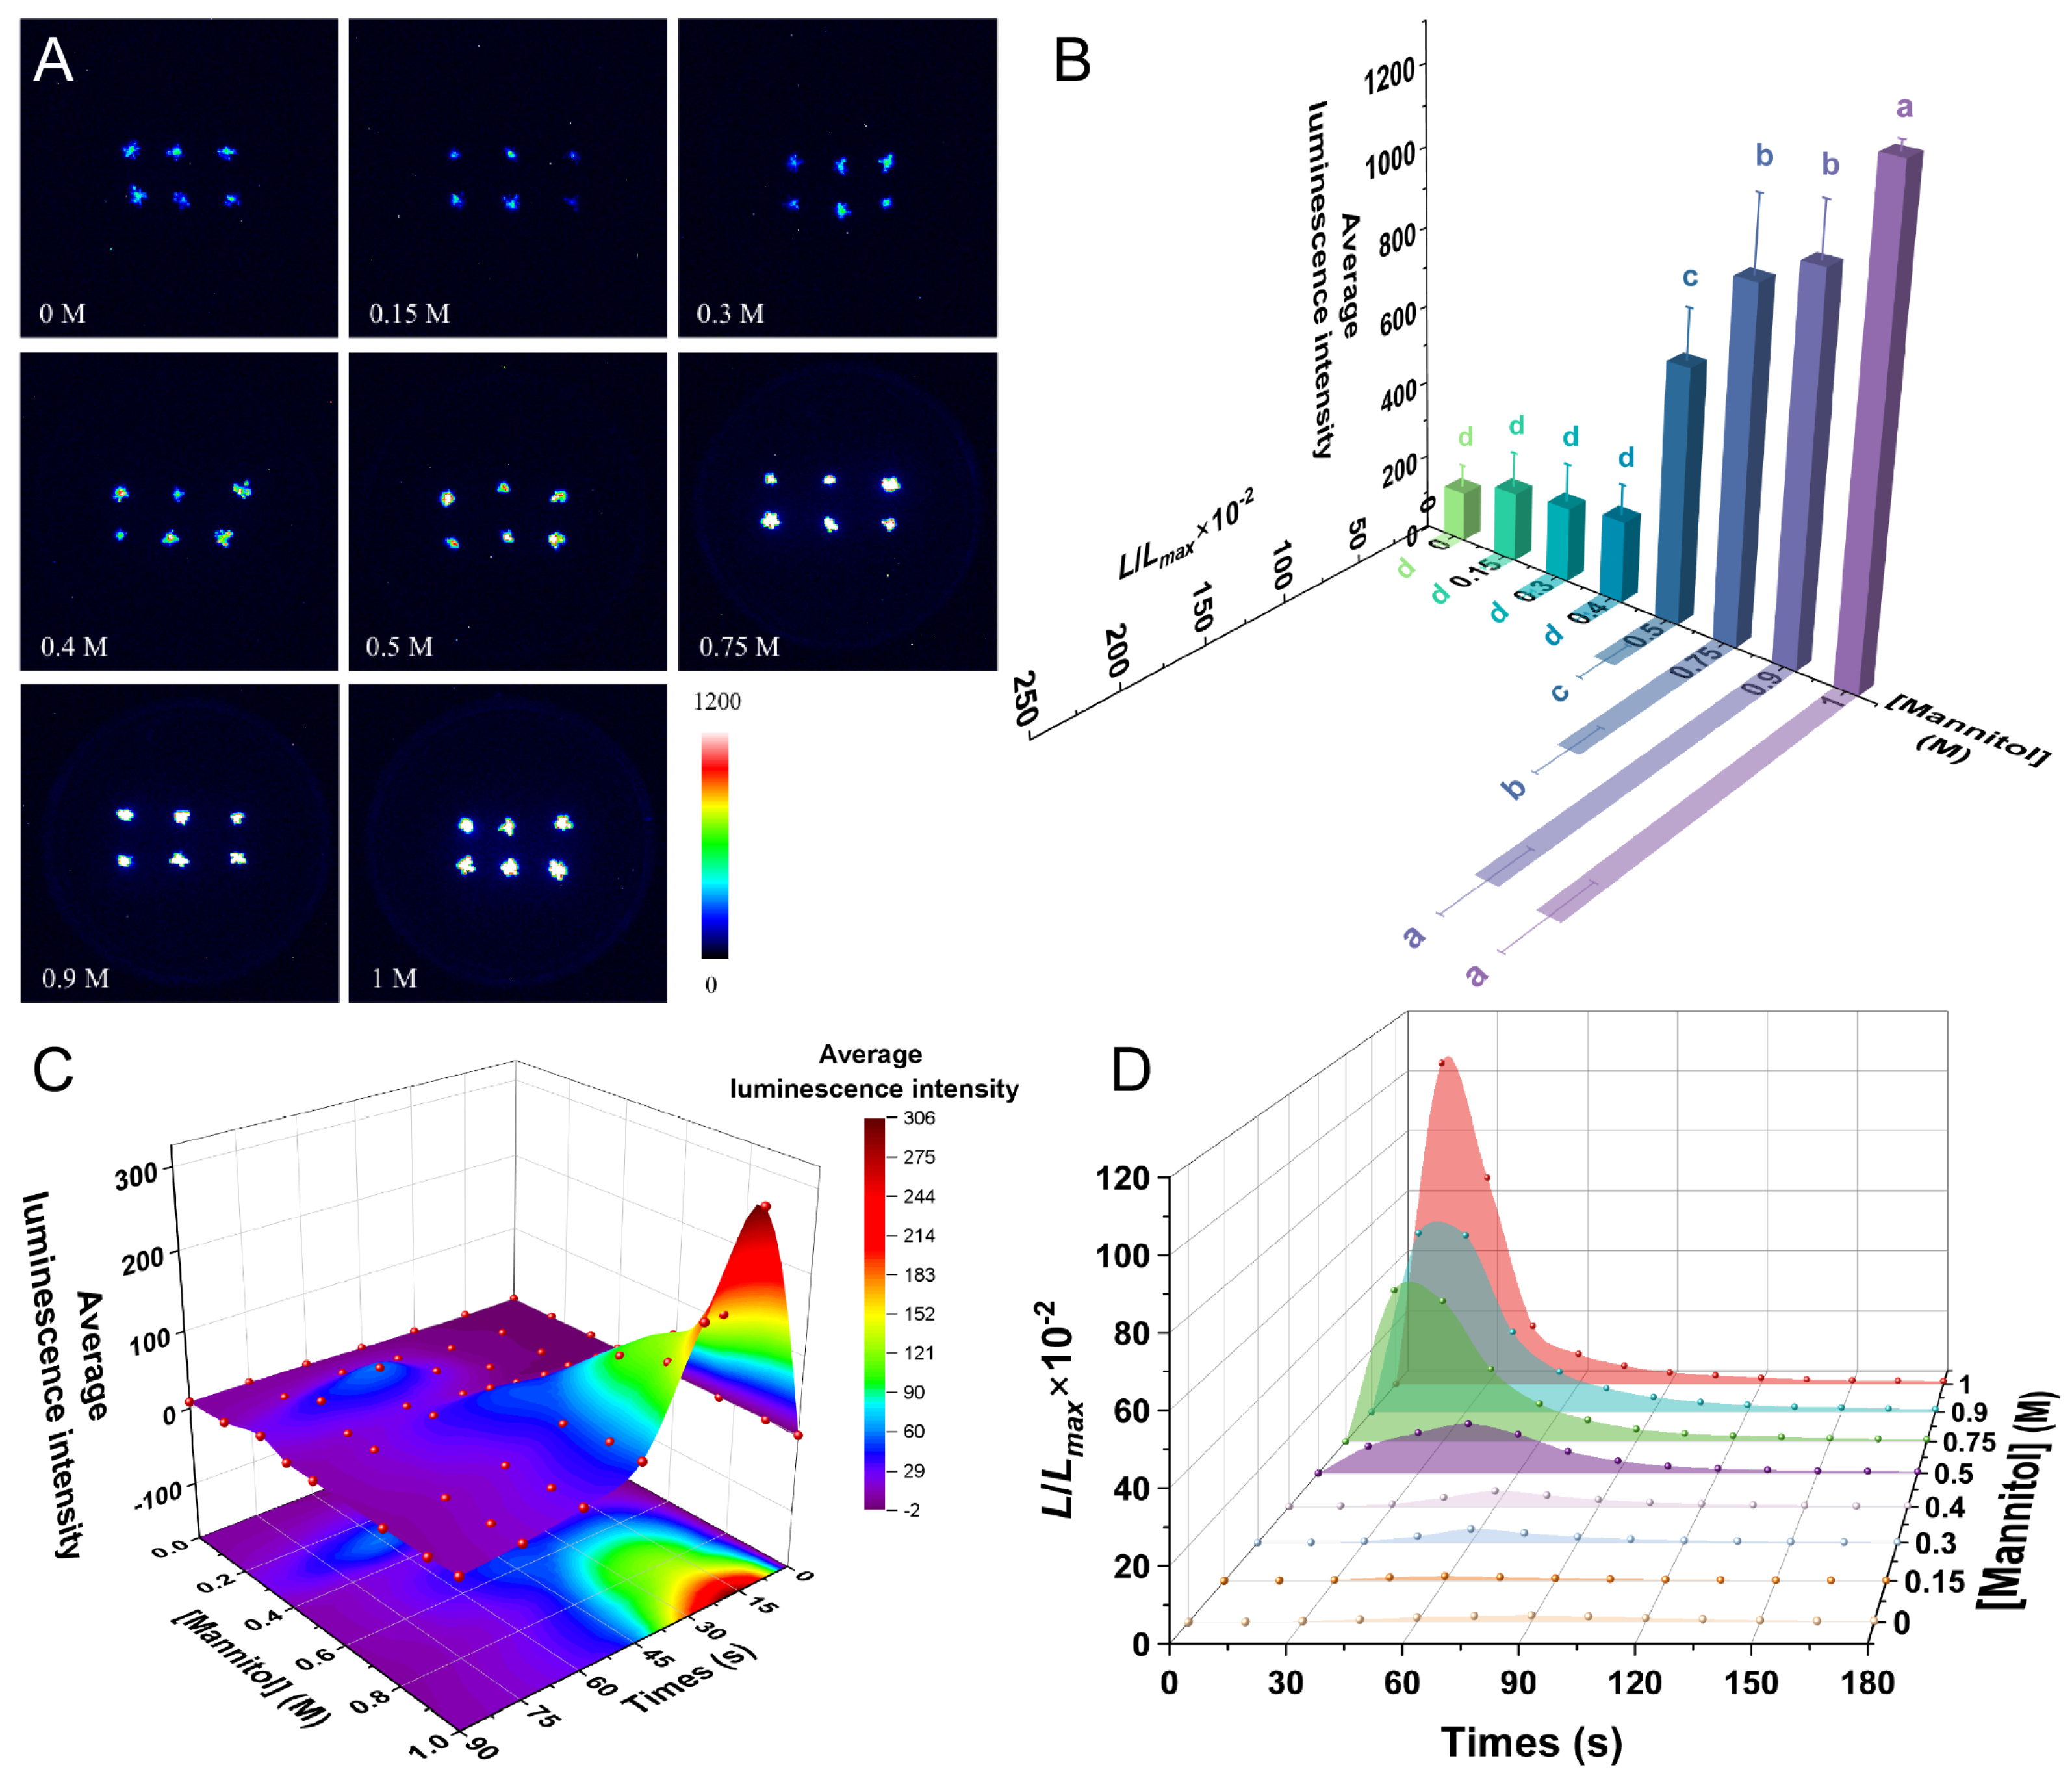
The greater the degree of drought stress, the stronger the luminescence signal (Figure 4A). There was no significant difference in the average luminescence intensity induced by treatments with lower concentrations of mannitol (0.15–0.3 M) when compared with the control group; however, the average luminescence intensity under 0.5–1 M mannitol was very different from that of the control group (p < 0.001). The luminescence intensity increased slowly in the range of 0–0.3 M (low-concentration) mannitol, whereas the higher mannitol concentrations caused a rapid increase in luminescence intensity (Figure 4B). The fluorescence value (L/Lmax) was consistent with the trend of average luminescence intensity, with no significant difference between the 0.15–0.4 M treatments and the control. When the concentration increased to 0.5 M, the L/Lmax increased to significantly more than the control group (p < 0.001), and further increases in mannitol rapidly increased the L/Lmax. In the range of 0.5–0.9 M mannitol, the L/Lmax values were significantly different for each mannitol concentration (p < 0.001), whereas the results of 0.9 M and 1 M treatment were similar (Figure 4B). Higher concentrations of mannitol (0.5–0.9 M) thus induced a large Ca2+ influx, rapidly increasing drought-induced [Ca2+]i, whereas mannitol treatments below this concentration range had little effect on the [Ca2+]i of P. patens. Mannitol concentrations above 0.9 M did not induce further increases in calcium signaling.
Drought stress triggered rapid [Ca2+]i transients in P. patens, with response kinetics and amplitude strongly dependent on mannitol concentration. After treatment with the 0.75–1 M mannitol solution, the luminescence intensity and the L/Lmax increased significantly, peaking after about 15 s. Most of the luminescence signals were collected in the first 90 s, and then slowly returned to the basic state within 3 min. By contrast, lower concentrations of 0.15–0.5 M mannitol induced a slower increase in luminescence, reaching a peak at about 45–60 s (Figure 4C,D).

2.5. NaCl Induces a [Ca2+]i Spike in P. patens

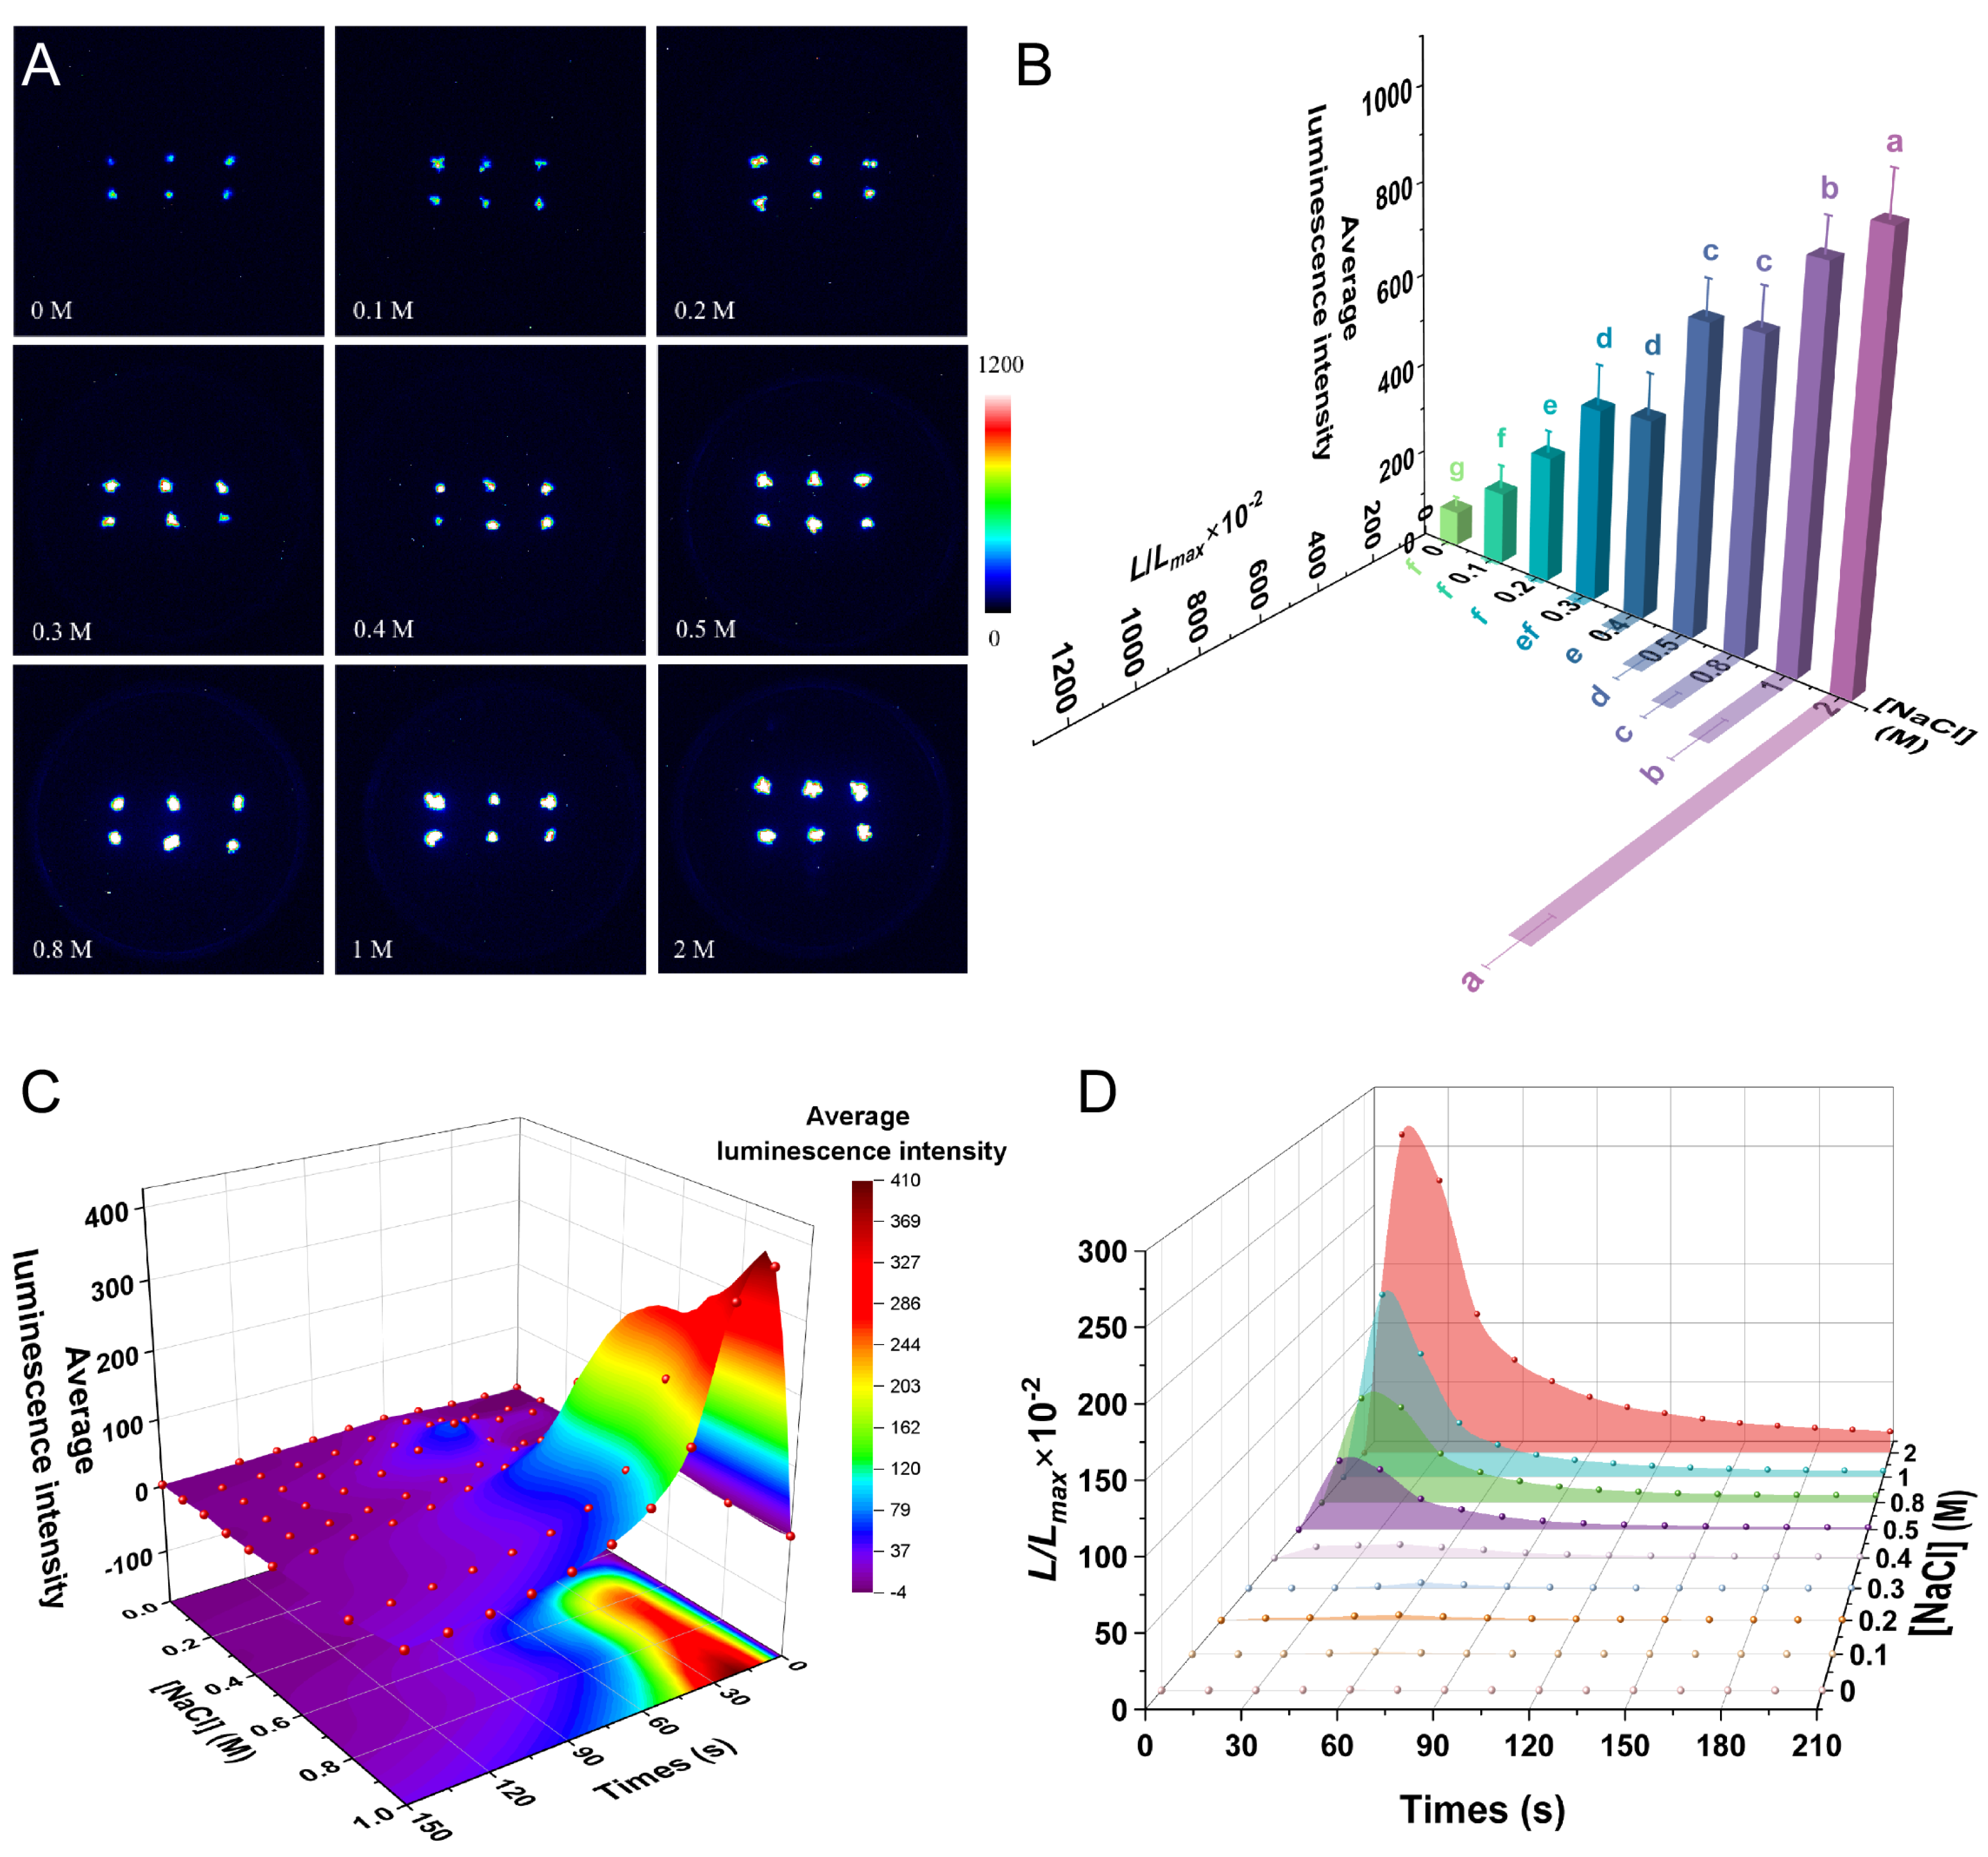
Similarly to the previous reports in rice [9], the [Ca2+]i-dependent luminescence signal was related to the degree of salt stress (Figure 5A); 0.1 M NaCl induced a significantly stronger average luminescence signal than the control (p < 0.05), and a highly significant difference was observed between the signals induced under the 0.1 M, 0.2 M, and 0.3 M NaCl treatments (p < 0.001), indicating that low concentrations of NaCl induced a rapid increase in [Ca2+]i-dependent luminescence signaling. The luminescence signal induced by 1 M NaCl was greater than those induced by the lower salt concentrations (p < 0.001), and 2 M NaCl induced a further significant increase in the luminescence signal compared with 1 M NaCl (p < 0.05) (Figure 5B). A detailed analysis of the L/Lmax results showed no significant difference for any of the 0.1–0.3 M NaCl treatments compared with the control, but a significant increase in L/Lmax under the 0.4 M NaCl treatment (p < 0.05). The L/Lmax increased significantly with increasing NaCl concentrations, with the 2 M NaCl treatment inducing the greatest L/Lmax value (p < 0.001), which was 3.3 times higher than that under the 1 M NaCl treatment (Figure 5B). This high value under the 2 M NaCl treatment may be caused by the abnormally low luminescence signal detected when these plants were treated with discharging solution. We verified this by treating the plants with 2 M NaCl solution for 30 s. Upon dissecting the leaves to make mounts and observing them under the microscope, we saw no difference in the leaf’s overall morphology. Despite this, there was a high efflux of cell contents and a high degree of coalescence in the material remaining in the cells, indicating that the cells had been damaged by the high NaCl concentration, thereby affecting the treatment results ( Supplementary Figure S2).
NaCl-induced [Ca2+]i transients exhibited concentration-dependent temporal patterns. The luminescence signals induced by the lower concentrations of 0.1–0.3 M NaCl appeared slowly, and the luminescence intensity and L/Lmax peaked at about 60 s before returning to the resting state at about 120 s. After the 0.4 M NaCl treatment, the luminescence intensity and L/Lmax reached a maximum at about 45 s, whereas the luminescence signal could not be detected by about 120 s. After treatment with 0.5–1 M NaCl, the luminescence signal peaked at about 15 s, initially decreased rapidly, and then slowly returned to a resting state. After the treatment with 2 M NaCl, the luminescence signal could still be detected after 210 s, indicating that the [Ca2+]i could not drop to basal levels and that the intracellular calcium transport system may be disrupted at this NaCl concentration (Figure 5C,D). This result is consistent with the previous results (Supplementary Figure S2), indicating that the cell structure is damaged by this high NaCl level, which also affects calcium signaling.

2.6. H2O2 Induced a [Ca2+]i Spike in P. patens

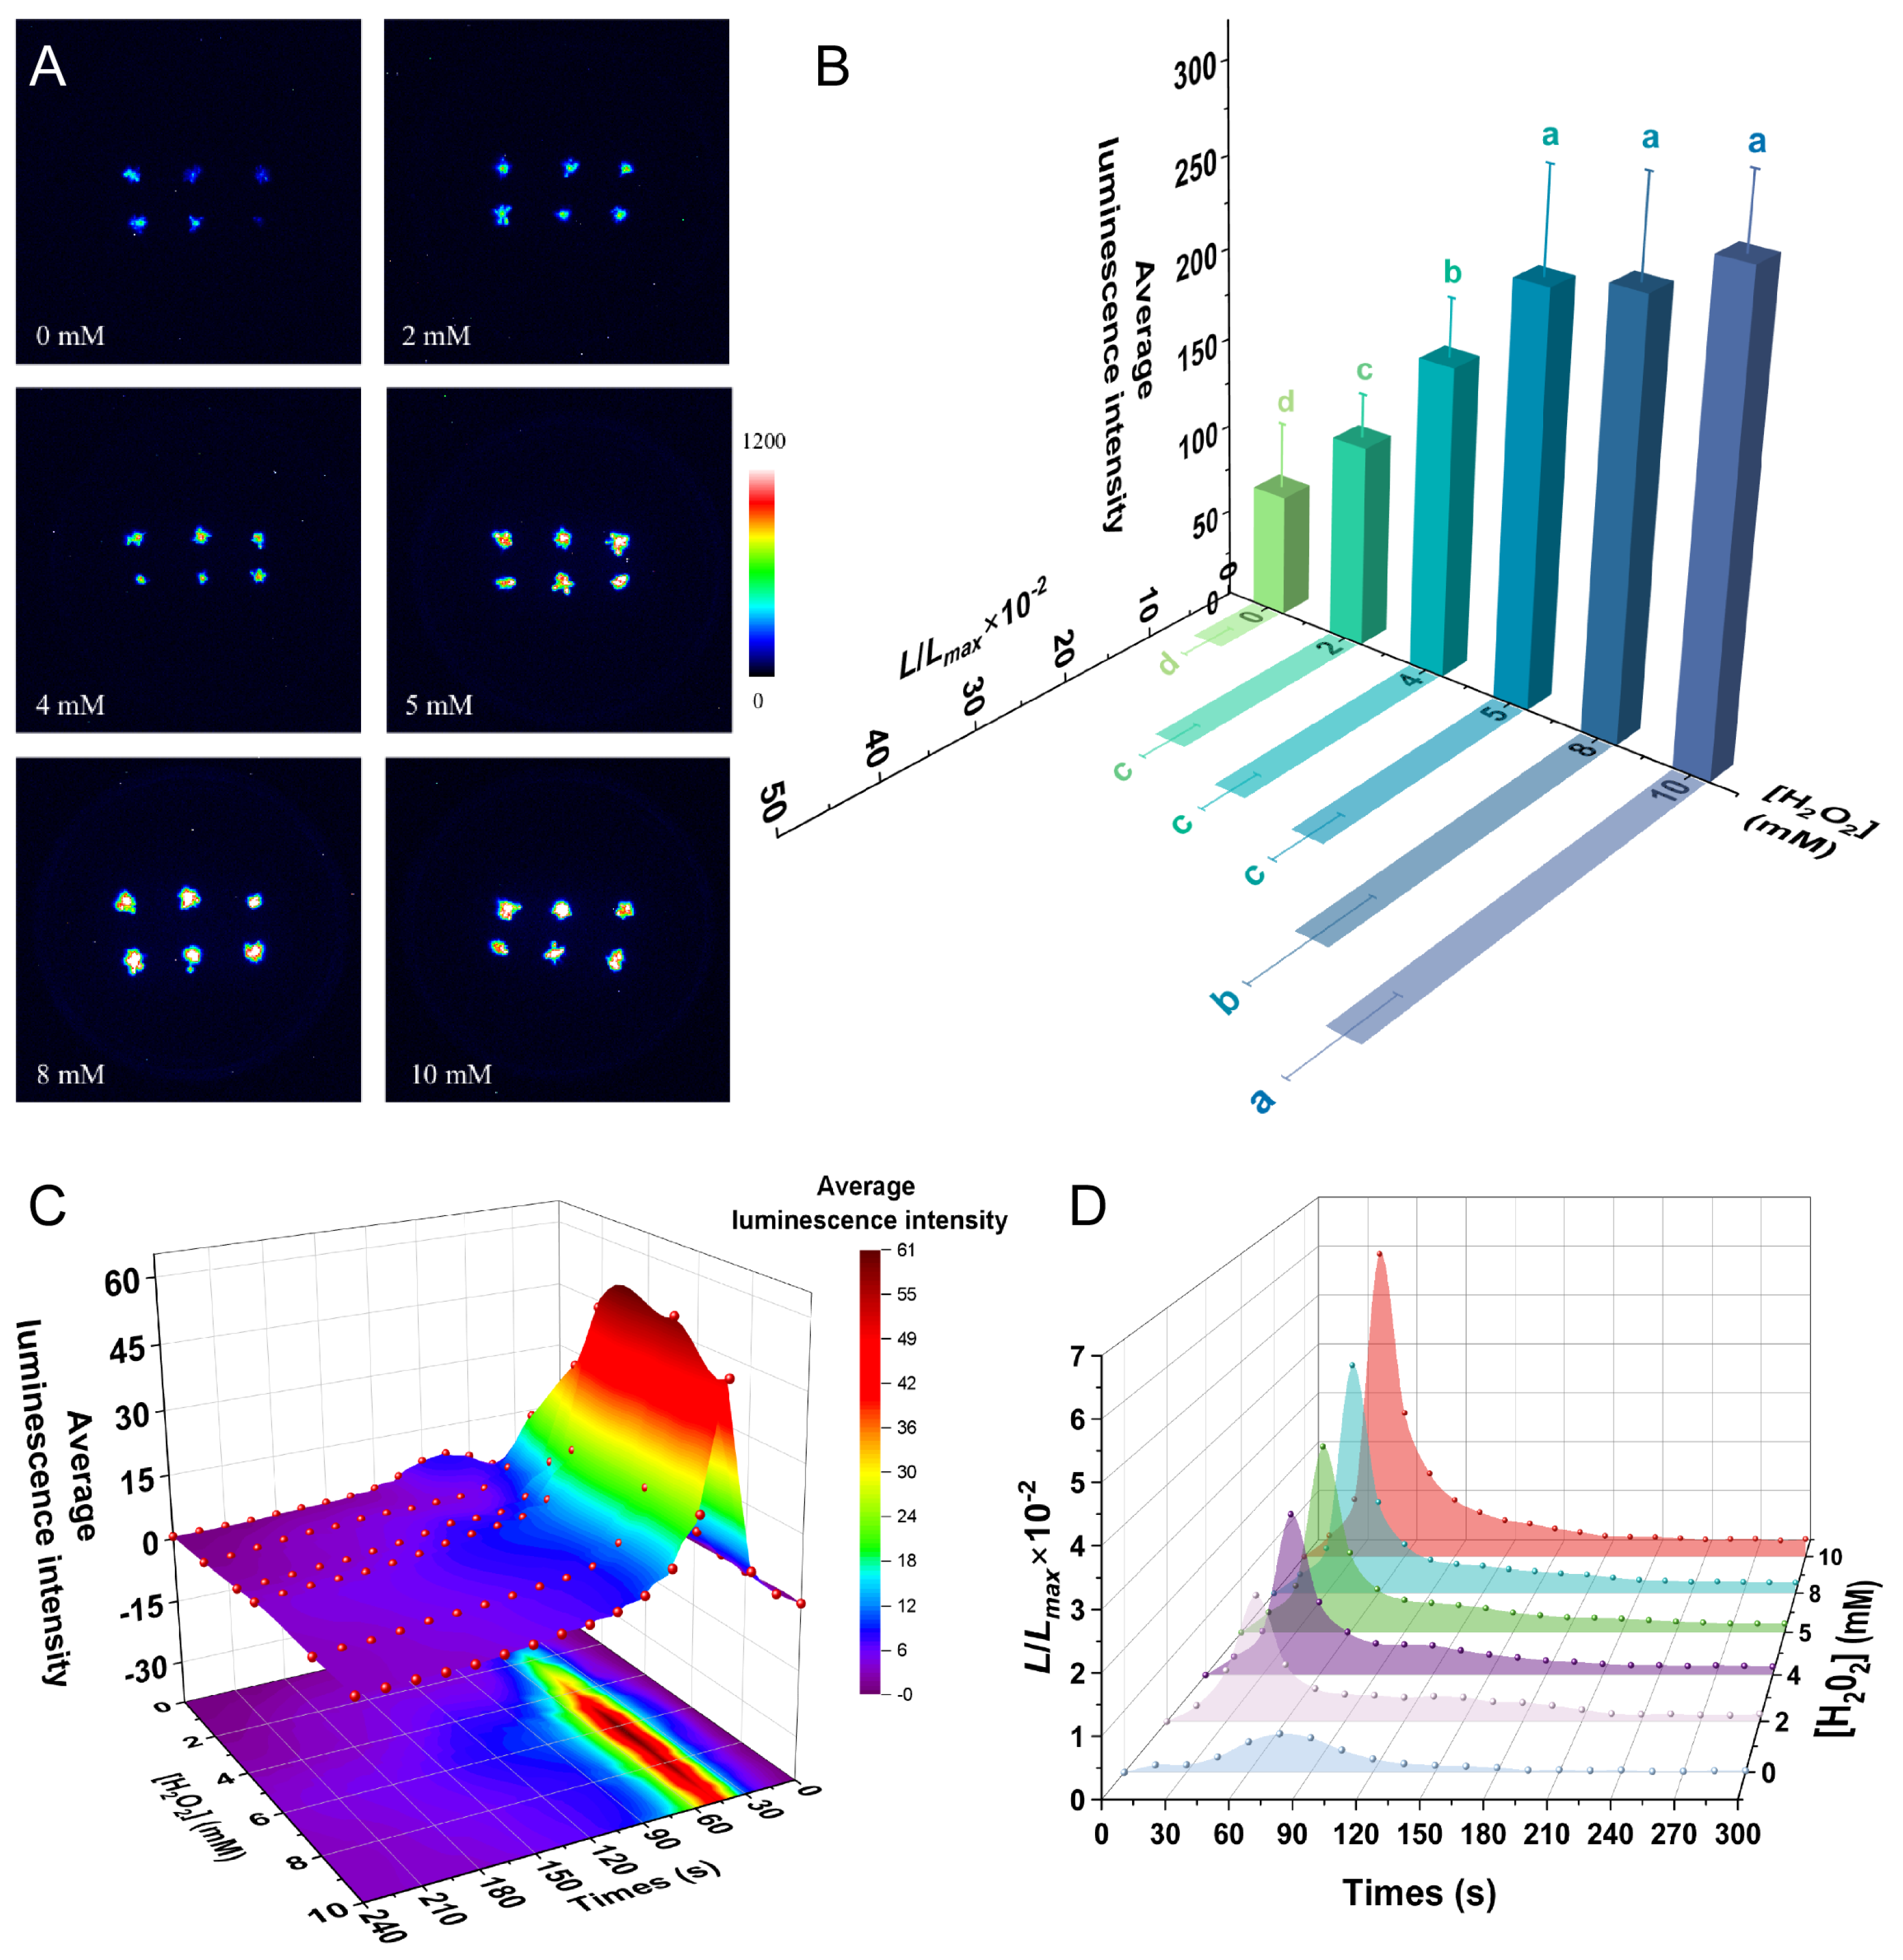
In this study, we used H2O2, a reactive oxygen species (ROS), to simulate the oxidation environment by detecting the changes in calcium signaling in response to different H2O2 concentrations. In general, the luminescence signal increased as the H2O2 concentration increased (Figure 6A). The 2 mM H2O2 treatment induced a luminescence signal significantly higher than that in the control group (p < 0.01), and 4 mM H2O2 induced a significantly greater signal than 2 mM H2O2 (p < 0.001) (Figure 6B). The 5 mM, 8 mM, and 10 mM H2O2 treatments induced luminescence signals that were similar to each other but significantly higher than those seem with the 4 mM H2O2 treatment (p < 0.01). The L/Lmax of P. patens in response to oxidative stress was consistent with the overall trend of average luminescence intensity (Figure 6B).
H2O2-induced [Ca2+]i transients exhibited distinct kinetic profiles compared to other stressors, characterized by delayed onset and prolonged duration. The average luminescence intensity and L/Lmax revealed that the H2O2-induced luminescence signal appeared slowly, peaking at about 45 s under the 2–10 mM H2O2 treatments, and then slowly decreased, returning after 4–5 min to the resting state, which was then maintained for a long time (Figure 6C,D). The dynamics of the H2O2-induced calcium signals differed from those induced by the other stresses analyzed, with the [Ca2+]i peaks appearing later, falling slowly, and taking longer to return to the resting state. In addition, we examined the effect of a 10 mM H2O2 treatment every 30 s over a longer time period (45 min). The luminescence signal was strongest in the first 2 min, with a weak luminescence signal observed at 3–4 min; no luminescence signal was collected in the subsequent 40 min (Supplementary Figure S3).

2.7. Different Sources of Ca2+ Induced by Various Stresses

Pharmacological inhibition experiments revealed distinct Ca2+ channel dependencies for different stress-induced [Ca2+]i responses. All the inhibitors examined had a significant dose-dependent effect on the cold-induced [Ca2+]i increase, and 1 mM GdCl3, LaCl3, neomycin and thapsigargin almost completely inhibited the [Ca2+]i increase (Figure 7A). In contrast to the significant effect of four inhibitors to cold (10 °C)-induced [Ca2+]i increase, GdCl3, neomycin and thapsigargin treatments had mild but significant effects on the drought (0.5 M mannitol)-induced [Ca2+]i increase, and LaCl3 showed no effect on the [Ca2+]i increase (Figure 7B). Similarly, only GdCl3 had a mild but significant effect on the NaCl (0.3 M)-induced [Ca2+]i increase (Figure 7C). For the H2O2 (5 mM)-induced [Ca2+]i increase, both 1 mM GdCl3 and 1 mM LaCl3 had a significant effect, and GdCl3 had a significant dose-dependent effect on the H2O2-induced [Ca2+]i increase (Figure 7D).
These results indicated that different sources of Ca2+ are used in the calcium signaling responses induced by cold, drought, NaCl, and H2O2 stress.

2.8. Saline Environment Impairs the Calcium Signaling in Response to Various Stresses in P. patens

Long-term salinity acclimation in P. patens elicited a modulation of basal [Ca2+]i levels. Overall, the basal [Ca2+]i decreased in the saline environment. In the media containing 0–50 mM NaCl, the basal [Ca2+]i decreased with increasing NaCl concentration, and when the concentration was increased to 60 and 70 mM NaCl, the basal [Ca2+]i increased slightly, but was not significantly different from that at 50 mM. At 80 mM NaCl, the mean fluorescence value was 0.94 × 10⁻², and it remained essentially unchanged as the concentration continued to increase (Supplementary Figure S4). The concentration of NaCl corresponding to half of the basal [Ca2+]i maximum was 20 mM, which we used as the optimum salt concentration for subsequent long-term salinity stress experiments.
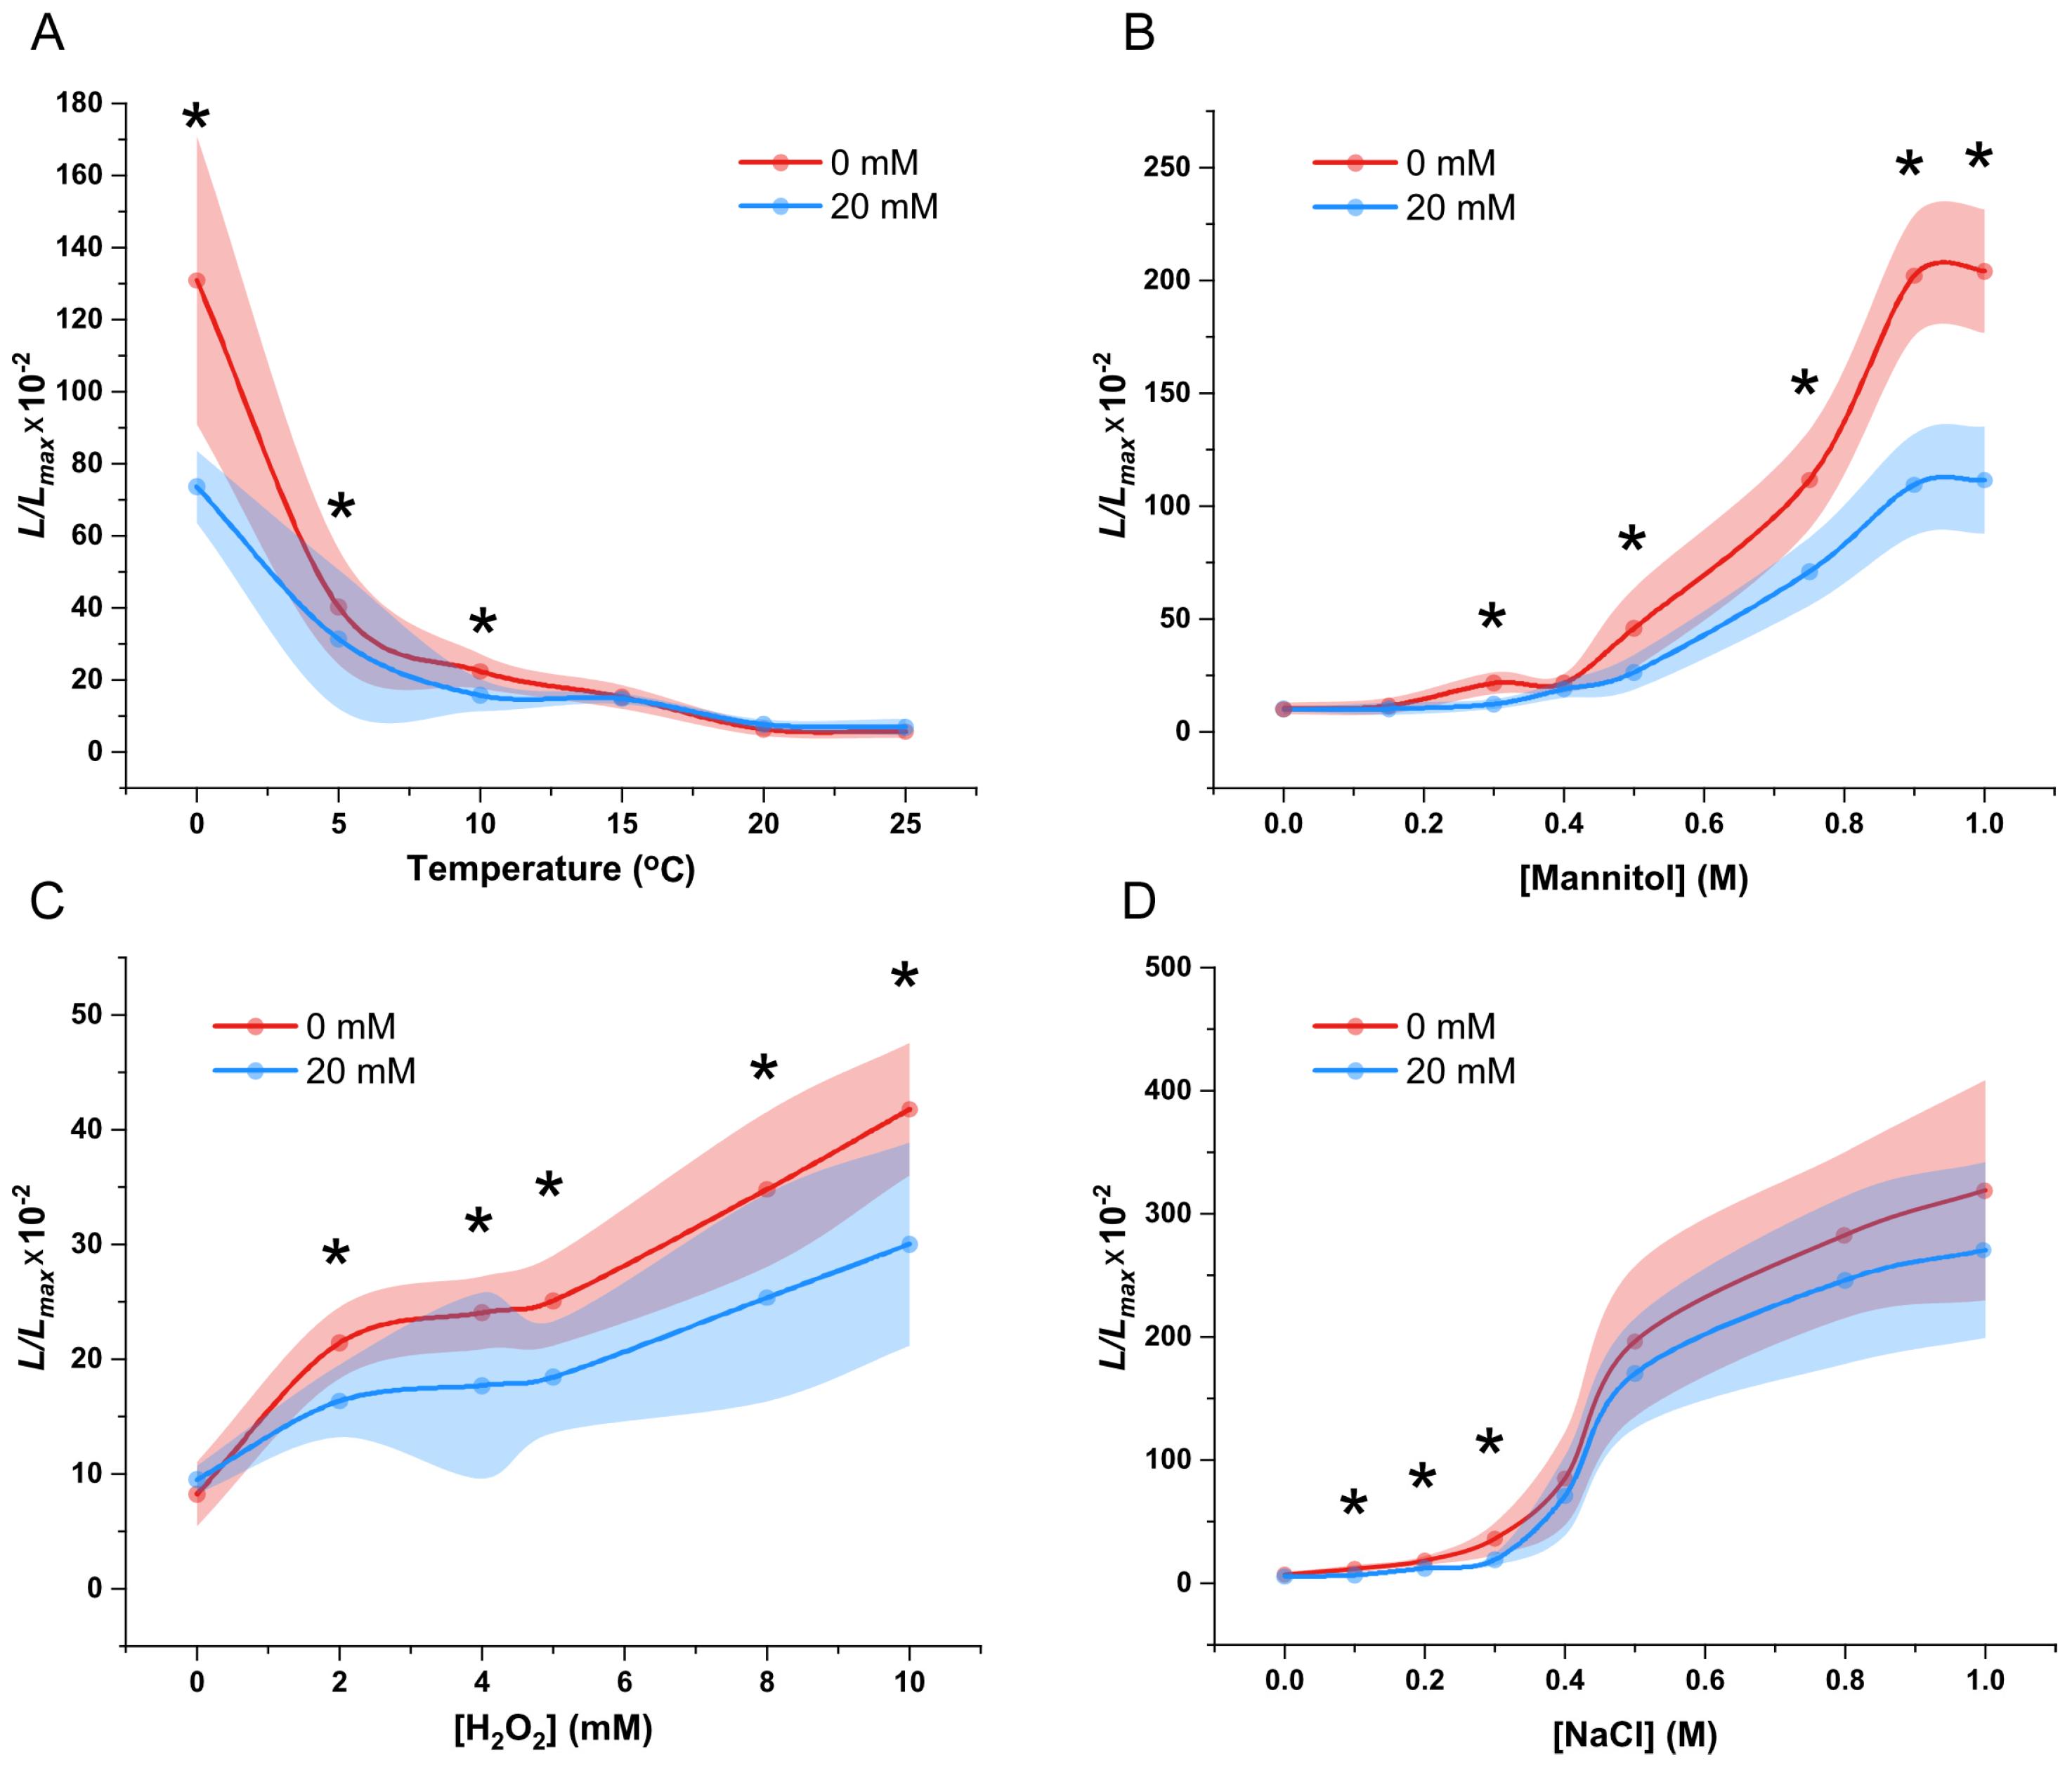
The fluorescence (L/Lmax) measurements revealed that cold stress triggered [Ca2+]i increases in 20 mM NaCl medium, showing a response pattern similar to NaCl-free conditions. However, P. patens grown under salt stress showed a significantly lower cold-induced [Ca2+]i increase at 0–10 °C compared to NaCl-free controls (Figure 8A). The drought-induced [Ca2+]i response in P. patens followed a concentration-dependent pattern under long-term saline conditions, similarly to the response observed in NaCl-free medium. While low mannitol concentrations (0.15 M and 0.4 M) elicited comparable [Ca2+]i elevations in both saline and control environments, significant divergence emerged at higher osmotic stress levels (>0.5 M) (Figure 8B). P. patens exhibited attenuated [Ca2+]i responses to H2O2 under saline conditions across all tested concentrations compared to NaCl-free controls. While the overall trend of oxidative stress-induced calcium signaling remained consistent between conditions, salt-adapted plants showed significantly reduced [Ca2+]i elevation magnitudes (Figure 8C).
Finally, we treated P. patens grown in a saline environment with different concentrations of NaCl. The fluorescence values showed that high NaCl concentrations (≥0.4 M) induced comparable [Ca2+]i responses in both salt-adapted and non-adapted plants, while significant differences emerged at lower concentrations (0.1–0.3 M), suggesting threshold-dependent signaling modulation by chronic salt stress (Figure 8D).

3. Discussion

Since the first transfer of apoaequorin cDNA into Nicotiana plumbaginifolia and its interaction with coelenterazine to reconstitute aequorin [25], aequorin has become an effective tool to study calcium signaling-mediated plant responses to various stresses [26]. In the present study, we improved the expression system and used the endogenous promoter PpEF1-α instead of the CaMV35S promoter to drive the stable expression of apoaequorin in P. patens. PpEF1-α promoter was considered to be more suitable for constructive expression in moss [27]. In addition to aequorin, other GECIs have also been used for Ca2+ detection, such as fluorescence resonance energy transfer (FRET) using Yellow Cameleon 2.1 (YC2.1) [28], YC2.12 [29], or the ultra-sensitive YC-Nano series [30]; however, these FRET-based Ca2+ indicators are complex to handle and have small measurement ranges. In addition, single-fluorescent calcium indicators, such as Camgaroos and GCaMPs, have also been used to detect changes in [Ca2+]i [31,32,33]. Although these fluorescence-based GECIs have high spatial and temporal resolution, they require exogenous excitation to produce a signal, whereas bioluminescence-based GECIs do not require exogenous excitation and emit light as long as the substrate is present, avoiding problems such as toxicity due to light exposure. We used a highly sensitive CCD camera to directly detect the bioluminescence. Thus, the field of view is large enough to compare the different samples in one treatment, and it is suitable to carry out a large scale screening experiment in Ca2+ signaling. Also, there is sufficient space between the samples and the camera, and it is convenient for us to treat the samples during experiment. Due to these advantages, we chose aequorin-based Ca2+ imaging to reflect the Ca2+ signaling characteristics in P. patens. In fact, by using this system, several external stimulus receptors were previously discovered in Arabidopsis [34,35,36].
The cold, drought, salt, and oxidative stressors used in this study represent environmental factors that seriously affect plant growth and development. Plants increase their [Ca2+]i upon sensing these abiotic stresses, as this process has been studied in depth in Arabidopsis and the related protein receptors have been screened [34,35,36]. In contrast, in bryophytes, a comprehensive investigation of the effect of these environmental stresses on calcium signaling using aequorin imaging is still lacking.
Whereas, in rice, the luminescence signal of aequorin can only be detected in the roots [9], P. patens has the advantage that the luminescence signal can be detected in the entire plant, which lacks specialized angiosperm structures such as roots, stems, or leaves. Although its chloroplasts produce chloroplast autofluorescence, our experimental preparation and manipulation phases were carried out in a dark environment, which greatly reduced the intensity of chloroplast autofluorescence so that it had little effect on the detection of changes in the calcium signal [9].
In Arabidopsis, the existing Ca2+ in the cells can be completely released using a discharging solution containing 10% ethanol [34]. In rice, a discharging solution of 25% ethanol was used [9]. In our study, the discharging solution was optimized for P. patens, and a discharging solution containing 15% ethanol was selected. This is because, from a histological point of view, the internal structure of the bryophytes is simple, and the epidermis, cortex, endodermis, and central cylinder of Arabidopsis are single-cell layers; in contrast, rice roots have an epidermis, a stromal tissue consisting of four tissues (exodermis, sclerenchyma cell layer, midcortex or mesodermis, and endodermis), and a central cylinder [37,38]. Rice roots, being more complex than Arabidopsis roots, require a greater ethanol concentration than Arabidopsis or P. patens to disrupt their cellular structure.
Low-temperature signaling in plants is dependent on Ca2+ signaling. Two Ca2+ channels, MID1-COMPLEMENTING ACTIVITY 1 (MAC1) and MAC2, were shown to interact and play a role in the low-temperature-induced transient Ca2+ increase in Arabidopsis [39]. CHILLING-TOLERANCE DIVERGENCE 1 (COLD1), a transmembrane protein located at the plasma membrane and ER, interacts with cold-responsive Ca2+ channels, thus playing a crucial role in the response to low temperature in rice [40]. We investigated the [Ca2+]i response induced by different levels of cold stress and determined that 10–20 °C did not induce significant calcium signaling, whereas 0–5 °C induced a rapid and significant increase in calcium signals (Figure 3). Similarly, low-temperature treatment at 0–4 °C could significantly induce calcium signaling responses in both rice and Arabidopsis [26,40]. This indicated similar sensing mechanisms among these plant species. In addition, compared with previous research, our research provided more information about the kinetics of the [Ca2+]i changes in P. patens [23].
Plants sense osmotic stress mainly through the hyperosmolality-gated Ca2+-permeable channel REDUCED HYPEROSMOLALITY-INDUCED Ca2+ INCREASE 1 (OSCA1), which in turn transmits signals downstream and plays a role in Ca2+-mediated osmotic signaling, prompting stomatal closure, plant wilting, and the inhibition of root growth [34]. In addition, CALCIUM PERMEABLE STRESS-GATED CATION CHANNEL 1 (CSC1) is also a Ca2+ channel regulated by osmotic stress [41]. For P. patens, drought stress had similar effects to cold stress in that low concentrations of mannitol had less of an effect on the increase in [Ca2+]i, whereas higher concentrations of mannitol induced a rapid increase in [Ca2+]i (Figure 4). These findings are similar to those obtained using YC3.60 to detect mannitol-induced calcium signals in P. patens [42]. However, when comparing the calcium signaling responses to osmotic stress between P. patens and Arabidopsis, we found that P. patens exhibited a less sensitive calcium signaling response under drought conditions. According to previous studies, 200 mM mannitol could significantly induce calcium signaling in Arabidopsis [26]. However, we found that even 400 mM mannitol failed to trigger calcium signaling in P. patens. As the pioneer plant species that first invaded land ecosystems, the insensitivity of P. patens in response to osmotic stress may indicate their distinct evolutionary traits, stress response pathways, cellular architecture, and ecological adaptation strategies.
In contrast to its insensitivity to drought, P. patens exhibited high sensitivity to salt stress, with 0.1 M NaCl treatment sufficient to trigger significant changes in calcium signaling. Similar results were observed in Arabidopsis [26]. However, in rice, 0.1 M NaCl treatment failed to induce noticeable calcium signaling changes [9]. Investigating the molecular mechanisms behind these varying salt stress sensitivities across different plant species will provide deeper insights into plant salt stress adaptation mechanisms. The 2 M NaCl treatment induced a very large fluorescence value, indicating that high-concentration NaCl may have had adverse effects on the cell structure of P. patens, preventing the moss from recovering to its basal state. Thus, before the discharging solution treatment, most of the Ca2+ had already been lost, meaning that Lmax did not reflect all the intracellular Ca2+. These results are very similar to those for the response of rice to salt stress [9].
ROS are associated with plant responses to stimuli, such as drought, salt, and low temperatures, and integrate stress signals [18]. Extracellular H2O2 (eH2O2) was shown to increase [Ca2+]i in N. plumbaginifolia [43]. The eH2O2-activated Ca2+ channels mediate the Ca2+ influx into protoplasts and cause an increase in the intact guard cell [Ca2+]i [44]. In Arabidopsis, the eH2O2-induced increase in [Ca2+]i is mediated by the cell surface receptor HYDROGEN-PEROXIDE-INDUCED Ca2+ INCREASES 1 (HPCA1) [36]. Here, we showed that oxidative treatments induced a sensitive reaction similar to salt stress, with significant calcium signaling induced by low concentrations of H2O2, suggesting that P. patens is sensitive to ROS. This highly sensitive calcium signaling response to ROS was also observed in Arabidopsis and rice [9,26]. Given the role of ROS as crucial signaling molecules in plants [18], we propose that ROS plays an important role in stress resistance mechanisms across various plant species. Despite these commonalities, there are subtle differences in calcium signaling responses to ROS stress across different plant species. In Arabidopsis, a second peak of the luminescence signal occurred 5–20 min after H2O2 treatment [26]. However, this phenomenon was not observed in rice or P. patens, and the underlying reasons remain to be further investigated [9].
Various environmental factors affect the Ca2+ channels in plants, thereby inducing a transient increase in [Ca2+]i [18]. The results of the present study showed that sufficient concentrations of GdCl3, LaCl3, neomycin, and thapsigargin almost completely inhibited the increase in [Ca2+]i in response to low temperatures. It is worth noting that the inhibitory effect of GdCl3 and LaCl3 was different for the mannitol-, NaCl-, and H2O2-induced [Ca2+]i responses, which suggest different properties for these two similar chemical inhibitors. All these results suggest that P. patens induces an increase in [Ca2+]i through different channels under different environmental stimuli.
In addition, consistent with the different sensitivities of P. patens and rice to NaCl treatment, the effects of inhibitors on were also different between these two species. In rice, all four inhibitors were able to suppress the NaCl-induced [Ca2+]i response to varying degrees, whereas in P. patens, only GdCl3 showed an inhibitory effect [9]. This indicated that the Ca2+ channels involved in NaCl-induced [Ca2+]i response are different between rice and P. patens. In contrast to the varying effects of different inhibitors on the NaCl-induced [Ca2+]i response in rice and P. patens, their effects on H2O2-induced [Ca2+]i response are quite similar. Both GdCl3 and LaCl3 showed significant inhibitory effects in rice and P. patens, while neomycin and thapsigargin had minimal effects. Considering the similar sensitivity of calcium signaling response to H2O2, we suggest that the Ca2+ channels involved in the H2O2-induced [Ca2+]i response may be the same in rice and moss.
Plants in the wild environment are often subjected to various combined stresses. Thus, we examined whether the response of plants to other stresses is altered under long-term salt stress environments, and observed that higher-magnitude changes in [Ca2+]i occur with increasing stress intensity, as was previously observed in Arabidopsis [45]. Although cold, drought, oxidative stress, and additional NaCl treatments still affected the [Ca2+]i of P. patens grown under prolonged salt stress, we observed that the moss was less sensitive to other stimuli than when grown under normal conditions. This phenomenon has been demonstrated in physiological experiments in other species [46,47,48]. Alternatively, because prolonged salt stress decreases the basal [Ca2+]i of P. patens, the [Ca2+]i increases under additional stimuli may have been of similar magnitude, although lower in their absolute values. This phenomenon therefore requires further elucidation in more detailed experiments.

4. Materials and Methods

4.1. Plant Materials and Growth Conditions

P. patens ‘Gransen’ was the wild-type (WT) strain. The moss was cultured on BCDATG medium with 0.5% (w/v) sucrose and 0.8% (w/v) agar at 25 °C under a 16 h light–8 h dark photoperiod and a light intensity of 50–80 µmol photons m−2 s−1. Protonemata of P. patens were grown on BCDATG medium under continuous white light [49].

4.2. Vector Construction and Transformation of P. patens

In order to generate P. patens efficiently expressing the intracellular Ca2+ indicator aequorin, the pTN182 vector plasmid was the basic skeleton. In order to search for genomic regions for exogenous DNA fragment insertion in P. patens, the PIG1 site was selected as previously described [50]. The upstream homologous arm, PIG1bL (949 bp), was amplified via PCR from the genomic DNA of P. patens using primers Left-F and Left-R, and cloned into the BamHI–SacI sites of the pTN182 plasmid; the resulting plasmid was named pTN182-LEFT. The apoaequorin cDNA along with the pea rbcS terminator were amplified via PCR from pCAMBIA1300-AQ [9] using the primers AQ-F and AQ-R, and cloned into the SalI–EcoRI sites of the pTN182-LEFT plasmid; the resulting plasmid was named pTN182-AQ-LEFT. The downstream homologous arm PIG1bR (1029 bp) and the endogenous PpEF1-α promoter were amplified via PCR from pPOG1 using the primers Right-P-F and Right-P-R, and cloned into the KpnI–XhoI sites of pTN182-AQ-LEFT; the resulting plasmid was named pTN182-RIGHT-AQ-LEFT. The DNA fragments for transformation via homologous recombination were amplified via PCR from the aequorin expression vector pTN182-RIGHT-AQ-LEFT using the primers Right-F and Left-R. The primers used to construct the plasmids and prepare the transformation fragment are listed in Supplementary Table S1.
The transformation was performed using the polyethylene glycol (PEG)-mediated method [51]. Briefly, 30 µg (20 µL) DNA fragments was added to the resuspension containing 5 × 10⁵ protoplasts and treated with PEG. Stably transformed strains were obtained by two successive cycles of incubation on a selective medium (the concentrations of G418 were 25 µg mL−1 and 50 µg mL−1, respectively) and nonselective medium. The surviving plants were verified using genomic PCR and RT-PCR. The primers used for the transformation validation are listed in Supplementary Table S1.

4.3. Aequorin Bioluminescence–Based Ca2+ Imaging

The [Ca2+]i was measured in P. patens expressing aequorin. The cormus of P. patens was grown on BCDATG medium in a 90 mm diameter round Petri dish for seven to nine days. A treatment of 250 µL of 10 µM coelenterazine (Prolume) was evenly applied to the plant materials 6–12 h before imaging and placed in the dark to reconstitute aequorin in vivo. The aequorin bioluminescence imaging was performed using a ChemiPro HT system (Roper Scientific, Trenton, NJ, USA), as described previously [34]. The luminescence images were analyzed using WinView/32 (v2.5.16, Roper Scientific) and ImageJ (v1.53k, https://imagej.net/ij/, accessed on 15 March 2024). The luminescence counts (L) [34,35] were recorded continuously for 3–5 min after treatment with the different abiotic stresses. For the optimization of the discharging solution in P. patens, we modified the discharging solution previously used for Arabidopsis (0.9 M CaCl2 and 10% anhydrous ethanol (v/v)) and rice (0.9 M CaCl2 and 25% anhydrous ethanol (v/v)) [9], and established a series of ethanol concentration gradients (0%, 10%, 15%, 20%, 25%, 30%, 40%, and 50%). P. patens was treated with discharging solutions containing different ethanol concentration gradients, and the luminescence signals were measured. The ethanol concentration that produced the highest luminescence intensity was determined as the optimal concentration for the discharging solution in this study.
To investigate the [Ca2+]i changes in P. patens in response to cold stress, pure water with different temperatures was used in the application of low temperature, and the luminescence of aequorin-based Ca2+ imaging under different temperature treatments was detected and compared. To study the changes of [Ca2+]i in response to drought, salt and ROS stresses, the solutions of varying concentrations of mannitol, NaCl and H2O2 were used to subject the P. patens to different stress treatments. The luminescence of aequorin-based Ca2+ imaging under different stresses was detected and compared. To investigate the dynamic process of [Ca2+]i induction by different stresses in P. patens over time, the plants were subjected to stress treatment at 0 s, the luminescence images were taken every 15 s after the treatment, and the images were taken continuously for 3–5 min. The chloroplast autofluorescence images were recorded continuously for 2 min after treatment with strong light for 30–60 s to determine the growth status and positioning of the plants. The total remaining aequorin luminescence counts (Lmax) [34,35] were recorded continuously for 3 min after treatment with the Ca2+ discharging solution to release all intracellular Ca2+. All experiments were conducted in the dark. In this experiment, the pure water of room temperature was the control to exclude the interference of the mechanical stimulation of P. patens.

4.4. Ca2+ Source Analysis

To investigate the sources of Ca2+ in the cold-, drought-, NaCl-, and H2O2- induced [Ca2+]i increases, we examined the [Ca2+]i increase in response to these abiotic stresses in the plants treated with different Ca2+ channel inhibitors. Plant materials were treated with different concentrations of the Ca2+ inhibitors GdCl3, LaCl3, neomycin, or thapsigargin for 1 h in the dark, after which they were subjected to a treatment consisting of 10 °C, 0.5 M mannitol, 0.3 M NaCl, and 5 mM H2O2. The L, Lmax, and chloroplast autofluorescence images were subsequently recorded.

4.5. Various Stress Treatments Under Long-Term Salt Stress

To analyze the effect of long-term salinity on the [Ca2+]i response of P. patens in response to various stresses, we first determined an appropriate salt environment for the culture of this species. P. patens was cultured on BCDATG medium supplemented with NaCl at 10 mM intervals, ranging from 0 to 100 mM, to simulate various salinities and incubated for 10 days, after which L was recorded for 30 min. The plants were then treated with discharging solution, and the luminescence signal was collected for 3 min. The fluorescence value (L/Lmax) was calculated to represent the basal [Ca2+]i. The NaCl concentration in the medium corresponding to half of the normal basal [Ca2+]i, i.e., the Kd value, was chosen as the optimum salt concentration. For the various stress treatments under long-term salt stress, solutions of varying concentrations were used to treat the P. patens grown on BCDATG medium with specific concentration of NaCl (based on the calculations, the concentration was ultimately determined to be 20 mM).

4.6. Statistical Analyses

For Figure 2B, Figure 3B, Figure 4B, Figure 5B and Figure 6B, one-way ANOVA was performed, followed by Tukey’s honestly significant difference (HSD) post hoc test (α = 0.05). To examine the effects of inhibitor type and concentration on the treatment outcomes, as well as their potential interaction (Figure 7), a two-way ANOVA was performed, followed by Tukey’s HSD post hoc test to identify significant differences among groups. The results of the multiple comparisons were represented using Tukey’s letters, where groups sharing the same letter indicate no significant difference, while different letters denote significant differences. To evaluate the significant differences between the long term NaCl-treated and control groups (Figure 8), the multiple regression analysis with categorical analyses were performed. Significant effects were further analyzed using Tukey’s HSD post hoc test, and results were represented using asterisks to denote significant differences. All statistical analyses were performed using Origin, and a significance level of p < 0.05 was applied.

5. Conclusions

In this research, we transferred the apoaequorin cDNA into P. patens and reconstituted aequorin in vitro. The ethanol concentration in the discharging solution was optimized to 15%, which was different from the concentrations used for rice and Arabidopsis. Next, the [Ca2+]i changes induced by cold, drought, salt, and oxidative stresses were measured and compared. In addition, the dynamic process of [Ca2+]i induction by different abiotic stresses over time was also investigated. The results showed that the characteristics of cold- and H2O2-induced [Ca2+]i changes in P. patens were similar to those in rice and Arabidopsis, while drought- and NaCl-induced [Ca2+]i changes in P. patens exhibited some differences compared to rice or Arabidopsis. This indicated the different Ca2+ channels involved in these processes in P. patens, which was partially proved by the different effects of Ca2+ channel inhibitors. Finally, the effect of long-term salinity on the [Ca2+]i response of P. patens to various stresses was evaluated, and we observed that long-term salinity suppressed the basal [Ca2+]i of P. patens, and the peak value of [Ca2+]i was lower than that of plants growing in non-stressed environments. This is the first systematic study of calcium signaling in bryophytes, and our research provided an efficient and convenient tool to study calcium signaling in bryophytes.
While this aequorin bioluminescence-based system offers a powerful approach for monitoring whole-plant calcium signaling in P. patens, its camera-based detection limits resolution to the organismal level, precluding cellular-scale analysis. Nevertheless, this tool opens new possibilities for investigating stress signaling mechanisms in bryophytes. Given that many environmental sensors have been identified through similar approaches in Arabidopsis [34,35,36], future studies could explore functional homologs in P. patens, particularly focusing on the unique NaCl response pathways suggested by our inhibitor experiments. The distinct pharmacological profiles observed between P. patens and angiosperms imply that bryophytes may possess novel calcium signaling components, making this far from a repetitive endeavor. Such comparative studies will not only deepen our understanding of stress adaptation in early land plants but may also reveal the evolutionarily conserved and divergent elements of calcium signaling networks.

Supplementary Materials

The following supporting information can be downloaded at: https://www.mdpi.com/article/10.3390/plants14081178/s1, Figure S1. Phenotypes of wild-type (WT) and transgenic AEQUORIN (AQ)-expressing P. patens plants. (A) Growth status of WT plants. (B) Growth status of AQ-expressing plants. (C) Morphologies of WT (left) and AQ-expressing (right) plants. (D) Leaf morphologies of WT (left) and AQ-expressing (right) plants. Figure S2. A high-concentration NaCl solution destroys P. patens cells. (A) The intracellular material efflux after a 30 s treatment with 2 M NaCl solution. (B) Highly condensed residual substances within leaf cells after a 30 s treatment with 2 M NaCl solution. Figure S3. Effect of high-concentration H2O2 on calcium signaling. (A) P. patens was treated with 10 mM H2O2, and the luminescence signals were collected 90 times at 30 s intervals after the treatment. The relationships between luminescence intensity and the pseudo-color images are scaled by a pseudo-color bar. (B) Time course of the L/Lmax to 10 mM H2O2. Six replicates were performed for each treatment. Figure S4. The varying basal [Ca2+]i levels under different salt environments. Table S1. Primers and sequences used in this paper.

Author Contributions

J.S., K.D., Z.Y. and J.N. conceived and designed the experiments. J.S. and Y.Z. performed the experiments. J.S., K.D., Z.Y. and J.N. analyzed the data. Y.W. contributed reagents, materials, and analytical tools. J.S., J.N. and Y.W. wrote the manuscript. All authors have read and agreed to the published version of the manuscript.

Funding

This research was funded by the National Natural Science Foundation of China (41571049, 32270215).

Data Availability Statement

The original contributions presented in this study are included in the article/Supplementary Materials. Further inquiries can be directed to the corresponding authors.

Acknowledgments

P. patens ‘Gransen’ was kindly provided by Y. Sun (East China Normal University).

Conflicts of Interest

The authors declare no conflicts of interest. The funders had no role in the design of the study; in the collection, analyses, or interpretation of data; in the writing of the manuscript; or in the decision to publish the results.

Abbreviations

The following abbreviations are used in this manuscript:
[Ca2+]icytosolic free Ca2+ concentration
ERendoplasmic reticulum
GECIgenetically encoded calcium indicator
ROSreactive oxygen species
FRETfluorescence resonance energy transfer
YCYellow Cameleon
SOSsalt overly sensitive

References

  1. Bisang, I.; Ehrlen, J.; Persson, C.; Hedenas, L. Family affiliation, sex ratio and sporophyte frequency in unisexual mosses. Bot. J. Linn. Soc. 2014, 174, 163–172. [Google Scholar] [CrossRef]
  2. Budke, J.M.; Bernard, E.C.; Gray, D.J.; Huttunen, S.; Piechulla, B.; Trigiano, R.N. Introduction to the special issue on bryophytes. Crit. Rev. Plant Sci. 2018, 37, 102–112. [Google Scholar] [CrossRef]
  3. Lindo, Z.; Nilsson, M.C.; Gundale, M.J. Bryophyte-cyanobacteria associations as regulators of the northern latitude carbon balance in response to global change. Glob. Change Biol. 2013, 19, 2022–2035. [Google Scholar] [CrossRef]
  4. Lenton, T.M.; Dahl, T.W.; Daines, S.J.; Mills, B.J.W.; Ozaki, K.; Saltzman, M.R.; Porada, P. Earliest land plants created modern levels of atmospheric oxygen. Proc. Natl. Acad. Sci. USA 2016, 113, 9704–9709. [Google Scholar] [CrossRef]
  5. Chen, F.; Ludwiczuk, A.; Wei, G.; Chen, X.L.; Crandall-Stotler, B.; Bowman, J.L. Terpenoid secondary metabolites in bryophytes: Chemical diversity, biosynthesis and biological functions. Crit. Rev. Plant Sci. 2018, 37, 210–231. [Google Scholar] [CrossRef]
  6. Benitez, A.; Armijos, L.; Calva, J. Monitoring air quality with transplanted bryophytes in a neotropical Andean city. Life 2021, 11, 821. [Google Scholar] [CrossRef]
  7. Fernandez-Pozo, N.; Haas, F.B.; Gould, S.B.; Rensing, S.A. An overview of bioinformatics, genomics, and transcriptomics resources for bryophytes. J. Exp. Bot. 2022, 73, 4291–4305. [Google Scholar] [CrossRef] [PubMed]
  8. Wu, J. The danger and indeterminacy of forfeiting perching space of bryophytes from climate shift: A case study for 115 species in China. Environ. Monit. Assess. 2022, 194, 233. [Google Scholar] [CrossRef] [PubMed]
  9. Zhang, Y.; Wang, Y.; Taylor, J.L.; Jiang, Z.; Zhang, S.; Mei, F.; Wu, Y.; Wu, P.; Ni, J. Aequorin-based luminescence imaging reveals differential calcium signalling responses to salt and reactive oxygen species in rice roots. J. Exp. Bot. 2015, 66, 2535–2545. [Google Scholar] [CrossRef]
  10. Bickerton, P.; Sello, S.; Brownlee, C.; Pittman, J.K.; Wheeler, G.L. Spatial and temporal specificity of Ca2+ signalling in Chlamydomonas reinhardtii in response to osmotic stress. New Phytol. 2016, 212, 920–933. [Google Scholar] [CrossRef]
  11. White, P.J. Calcium channels in higher plants. Biochim. Biophys. Acta 2000, 1465, 171–189. [Google Scholar] [CrossRef]
  12. Hetherington, A.M.; Brownlee, C. The generation of Ca2+ signals in plants. Annu. Rev. Plant Biol. 2004, 55, 401–427. [Google Scholar] [CrossRef] [PubMed]
  13. Kudla, J.; Becker, D.; Grill, E.; Hedrich, R.; Hippler, M.; Kummer, U.; Parniske, M.; Romeis, T.; Schumacher, K. Advances and current challenges in calcium signaling. New Phytol. 2018, 218, 414–431. [Google Scholar] [CrossRef] [PubMed]
  14. Liu, P.; Duan, Y.; Liu, C.; Xue, Q.; Guo, J.; Qi, T.; Kang, Z.; Guo, J. The calcium sensor TaCBL4 and its interacting protein TaCIPK5 are required for wheat resistance to stripe rust fungus. J. Exp. Bot. 2018, 69, 4443–4457. [Google Scholar] [CrossRef] [PubMed]
  15. Akaboshi, M.; Hashimoto, H.; Ishida, H.; Saijo, S.; Koizumi, N.; Sato, M.; Shimizu, T. The crystal structure of plant-specific calcium-binding protein AtCBL2 in complex with the regulatory domain of AtCIPK14. J. Mol. Biol. 2008, 377, 246–257. [Google Scholar] [CrossRef]
  16. Sze, H.; Liang, F.; Hwang, I.; Curran, A.C.; Harper, J.F. Diversity and regulation of plant Ca2+ pumps: Insights from expression in yeast. Annu. Rev. Plant Physiol. Plant Mol. Biol. 2000, 51, 433–462. [Google Scholar] [CrossRef]
  17. Hirschi, K. Vacuolar H+/Ca2+ transport: Who’s directing the traffic? Trends Plant Sci. 2001, 6, 100–104. [Google Scholar] [CrossRef]
  18. Lee, H.J.; Seo, P.J. Ca2+ talyzing initial responses to environmental stresses. Trends Plant Sci. 2021, 26, 849–870. [Google Scholar] [CrossRef]
  19. Vigani, G.; Costa, A. Harnessing the new emerging imaging technologies to uncover the role of Ca2+ signalling in plant nutrient homeostasis. Plant Cell Environ. 2019, 42, 2885–2901. [Google Scholar] [CrossRef]
  20. Krogman, W.; Sparks, J.A.; Blancaflor, E. Cell type-specific imaging of calcium signaling in Arabidopsis thaliana seedling roots using GCaMP3. Int. J. Mol. Sci. 2020, 21, 6385. [Google Scholar] [CrossRef]
  21. Shimomura, O.; Johnson, F.H.; Saiga, Y. Microdetermination of calcium by aequorin luminescence. Science 1963, 140, 1339–1340. [Google Scholar] [CrossRef] [PubMed]
  22. Shimomura, O.; Johnson, F.H.; Saiga, Y. Extraction, purification and properties of aequorin, a bioluminescent protein from the luminous hydromedusan, Aequorea. J. Cell Comp. Physiol. 1962, 59, 223–239. [Google Scholar] [CrossRef]
  23. Russell, A.J.; Knight, M.R.; Cove, D.J.; Knight, C.D.; Trewavas, A.J.; Wang, T.L. The moss, Physcomitrella patens, transformed with apoaequorin cDNA responds to cold shock, mechanical perturbation and pH with transient increases in cytoplasmic calcium. Transgenic Res. 1996, 5, 167–170. [Google Scholar] [CrossRef]
  24. Mithöfer, A.; Mazars, C. Aequorin-based measurements of intracellular Ca2+-signatures in plant cells. Biol. Proced. Online 2002, 4, 105–118. [Google Scholar] [CrossRef] [PubMed]
  25. Knight, M.R.; Campbell, A.K.; Smith, S.M.; Trewavas, A.J. Transgenic plant aequorin reports the effects of touch and cold-shock and elicitors on cytoplasmic calcium. Nature 1991, 352, 524–526. [Google Scholar] [CrossRef]
  26. Zhu, X.; Feng, Y.; Liang, G.; Liu, N.; Zhu, J.K. Aequorin-based luminescence imaging reveals stimulus- and tissue-specific Ca2+ dynamics in Arabidopsis plants. Mol. Plant 2013, 6, 444–455. [Google Scholar] [CrossRef]
  27. Kitagawa, M.; Fujita, T. Quantitative imaging of directional transport through plasmodesmata in moss protonemata via single-cell photoconversion of Dendra2. J. Plant Res. 2013, 126, 577–585. [Google Scholar] [CrossRef] [PubMed]
  28. Miyawaki, A.; Griesbeck, O.; Heim, R.; Tsien, R.Y. Dynamic and quantitative Ca2+ measurements using improved cameleons. Proc. Natl. Acad. Sci. USA 1999, 96, 2135–2140. [Google Scholar] [CrossRef]
  29. Nagai, T.; Ibata, K.; Park, E.S.; Kubota, M.; Mikoshiba, K.; Miyawaki, A. A variant of yellow fluorescent protein with fast and efficient maturation for cell-biological applications. Nat. Biotechnol. 2002, 20, 87–90. [Google Scholar] [CrossRef]
  30. Horikawa, K.; Yamada, Y.; Matsuda, T.; Kobayashi, K.; Hashimoto, M.; Matsu-ura, T.; Miyawaki, A.; Michikawa, T.; Mikoshiba, K.; Nagai, T. Spontaneous network activity visualized by ultrasensitive Ca2+ indicators, yellow Cameleon-Nano. Nat. Methods 2010, 7, 729–732. [Google Scholar] [CrossRef]
  31. Meyer, J.S.; Tullis, G.; Pierret, C.; Spears, K.M.; Morrison, J.A.; Kirk, M.D. Detection of calcium transients in embryonic stem cells and their differentiated progeny. Cell Mol. Neurobiol. 2009, 29, 1191–1203. [Google Scholar] [CrossRef]
  32. Kleist, T.; Cartwright, H.; Perera, A.; Christianson, M.; Lemaux, P.; Luan, S. Genetically encoded calcium indicators for fluorescence imaging in the moss Physcomitrella: GCaMP3 provides a bright new look. Plant Biotechnol. J. 2017, 15, 1235–1237. [Google Scholar] [CrossRef]
  33. Zhang, Y.; Rozsa, M.; Liang, Y.; Bushey, D.; Wei, Z.; Zheng, J.; Reep, D.; Broussard, G.J.; Tsang, A.; Tsegaye, G.; et al. Fast and sensitive GCaMP calcium indicators for imaging neural populations. Nature 2023, 615, 884–891. [Google Scholar] [CrossRef]
  34. Yuan, F.; Yang, H.; Xue, Y.; Kong, D.; Ye, R.; Li, C.; Zhang, J.; Theprungsirikul, L.; Shrift, T.; Krichilsky, B.; et al. OSCA1 mediates osmotic-stress-evoked Ca2+ increases vital for osmosensing in Arabidopsis. Nature 2014, 514, 367–371. [Google Scholar] [CrossRef]
  35. Jiang, Z.; Zhou, X.; Tao, M.; Yuan, F.; Liu, L.; Wu, F.; Wu, X.; Xiang, Y.; Niu, Y.; Liu, F.; et al. Plant cell-surface GIPC sphingolipids sense salt to trigger Ca2+ influx. Nature 2019, 572, 341–346. [Google Scholar] [CrossRef]
  36. Wu, F.; Chi, Y.; Jiang, Z.; Xu, Y.; Xie, L.; Huang, F.; Wan, D.; Ni, J.; Yuan, F.; Wu, X.; et al. Hydrogen peroxide sensor HPCA1 is an LRR receptor kinase in Arabidopsis. Nature 2020, 578, 577–581. [Google Scholar] [CrossRef]
  37. Dolan, L.; Janmaat, K.; Willemsen, V.; Linstead, P.; Poethig, S.; Roberts, K.; Scheres, B. Cellular organisation of the Arabidopsis thaliana root. Development 1993, 119, 71–84. [Google Scholar] [CrossRef]
  38. Rebouillat, J.; Dievart, A.; Verdeil, L.; Escoute, J.; Giese, G.; Breitler, C.; Gantet, P.; Espeout, S.; Guiderdoni, E.; Perin, C. Molecular genetics of rice root development. Rice 2009, 2, 15–34. [Google Scholar] [CrossRef]
  39. Mori, K.; Renhu, N.; Naito, M.; Nakamura, A.; Shiba, H.; Yamamoto, T.; Suzaki, T.; Iida, H.; Miura, K. Ca2+-permeable mechanosensitive channels MCA1 and MCA2 mediate cold-induced cytosolic Ca2+ increase and cold tolerance in Arabidopsis. Sci. Rep. 2018, 8, 550. [Google Scholar] [CrossRef]
  40. Ma, Y.; Dai, X.; Xu, Y.; Luo, W.; Zheng, X.; Zeng, D.; Pan, Y.; Lin, X.; Liu, H.; Zhang, D.; et al. COLD1 confers chilling tolerance in rice. Cell 2015, 160, 1209–1221. [Google Scholar] [CrossRef]
  41. Hou, C.; Tian, W.; Kleist, T.; He, K.; Garcia, V.; Bai, F.; Hao, Y.; Luan, S.; Li, L. DUF221 proteins are a family of osmosensitive calcium-permeable cation channels conserved across eukaryotes. Cell Res. 2014, 24, 632–635. [Google Scholar] [CrossRef]
  42. Storti, M.; Costa, A.; Golin, S.; Zottini, M.; Morosinotto, T.; Alboresi, A. Systemic calcium wave propagation in Physcomitrella patens. Plant Cell Physiol. 2018, 59, 1377–1384. [Google Scholar] [CrossRef]
  43. Price, A.H.; Taylor, A.; Ripley, S.J.; Griffiths, A.; Trewavas, A.J.; Knight, M.R. Oxidative signals in tobacco increase cytosolic calcium. Plant Cell 1994, 6, 1301–1310. [Google Scholar] [CrossRef]
  44. Pei, Z.M.; Murata, Y.; Benning, G.; Thomine, S.; Klüsener, B.; Allen, G.J.; Grill, E.; Schroeder, J.I. Calcium channels activated by hydrogen peroxide mediate abscisic acid signalling in guard cells. Nature 2000, 406, 731–734. [Google Scholar] [CrossRef]
  45. Liu, L.; Jiang, Z.; Zhang, S.; Zhao, H.; Yang, W.; Siedow, J.N.; Pei, Z.M. Both NaCl and H2O2 long-term stresses affect basal cytosolic Ca2+ levels but only NaCl alters cytosolic Ca2+ signatures in Arabidopsis. Front. Plant Sci. 2018, 9, 1390. [Google Scholar] [CrossRef]
  46. Queirós, F.; Rodrigues, J.A.; Almeida, J.M.; Almeida, D.P.; Fidalgo, F. Differential responses of the antioxidant defence system and ultrastructure in a salt-adapted potato cell line. Plant Physiol. Biochem. 2011, 49, 1410–1419. [Google Scholar] [CrossRef]
  47. Liu, L.; Li, H.; Li, N.; Li, S.X.; Guo, J.H.; Li, X.N. Parental salt priming improves the low temperature tolerance in wheat offspring via modulating the seed proteome. Plant Sci. 2022, 324, 111428. [Google Scholar] [CrossRef]
  48. Liu, L.; Zhang, P.; Feng, G.; Hou, W.; Liu, T.; Gai, Z.; Shen, Y.; Qiu, X.; Li, X. Salt priming induces low-temperature tolerance in sugar beet via xanthine metabolism. Plant Physiol. Biochem. 2023, 201, 107810. [Google Scholar] [CrossRef]
  49. Nishiyama, T.; Hiwatashi, Y.; Sakakibara, I.; Kato, M.; Hasebe, M. Tagged mutagenesis and gene-trap in the moss, Physcomitrella patens by shuttle mutagenesis. DNA Res. 2000, 7, 9–17. [Google Scholar] [CrossRef]
  50. Okano, Y.; Aono, N.; Hiwatashi, Y.; Murata, T.; Nishiyama, T.; Ishikawa, T.; Kubo, M.; Hasebe, M. A polycomb repressive complex 2 gene regulates apogamy and gives evolutionary insights into early land plant evolution. Proc. Natl. Acad. Sci. USA 2009, 106, 16321–16326. [Google Scholar] [CrossRef]
  51. Cove, D.J.; Perroud, P.F.; Charron, A.J.; McDaniel, S.F.; Khandelwal, A.; Quatrano, R.S. Transformation of the moss Physcomitrella patens using direct DNA uptake by protoplasts. Cold Spring Harb. Protoc. 2009, 2009, pdb.prot5143. [Google Scholar] [CrossRef] [PubMed]
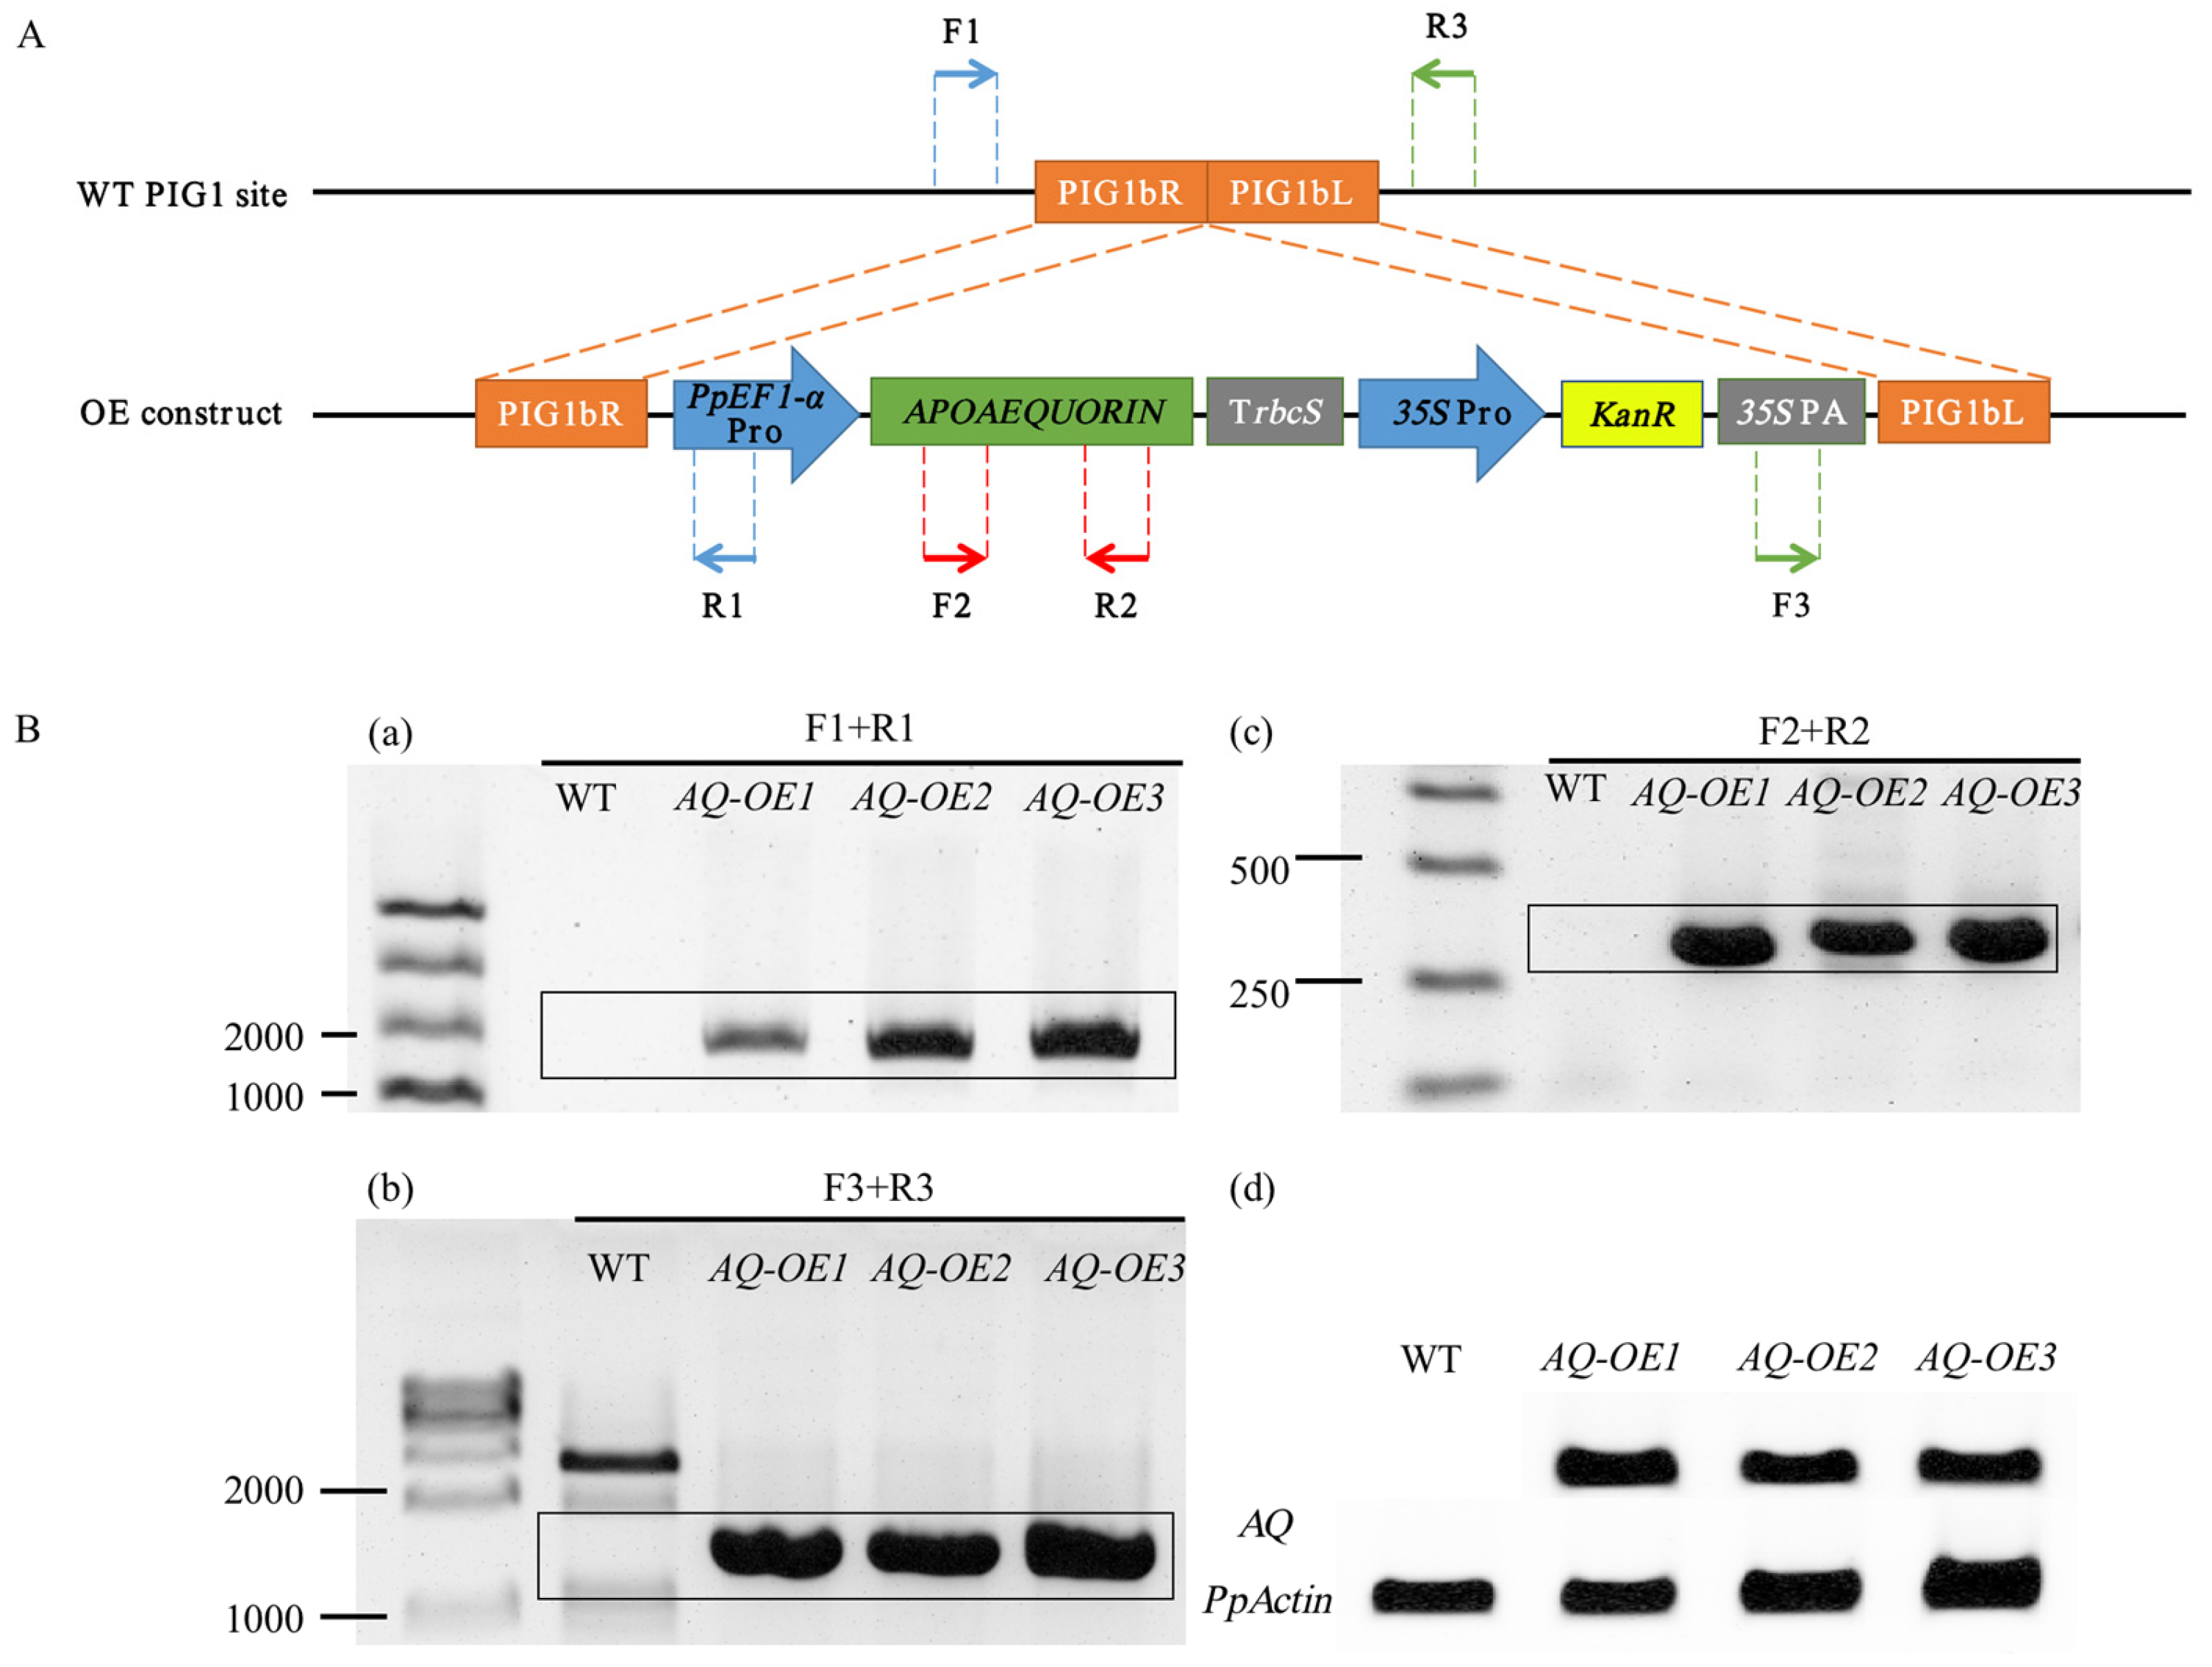
Figure 1. Recombinant expression of APOAEQUORIN in stable transgenic P. patens lines. (A) Schematic representation of the constructs for the expression of APOAEQUORIN. Arrows represent primers used in the PCR identification of transgenic lines. PIG1bR and PIG1bL are two adjacent DNA fragments of insertion site in P. patens. (B) Identification of transformants using a PCR analysis of genomic DNA isolated from the wild-type (WT) and transgenic lines and an RT-PCR detection of APOAEQUORIN expression in these plants. The PCR identification of the upstream homologous arm (a), downstream homologous arm (b), and APOAEQUORIN gene (c). RT-PCR detection of APOAEQUORIN expression (d).
Plants 14 01178 g001
Figure 2. Optimization of the discharging solution for P. patens. (A) Pseudo-color images of aequorin luminescence in P. patens treated with discharging solutions containing different percentages of ethanol. The relationships between luminescence intensity and the pseudo-color images are scaled by a pseudo-color bar. (B) Average luminescence intensity of every treatment. Data for independent experiments are shown (mean ± sd, n = 12, a one-way analysis of variance (ANOVA) with post hoc analysis was conducted. The number “n” indicates the number of tested plates with six clusters of the mosses. Different letters indicate significant differences).
Plants 14 01178 g002
Figure 3. Calcium signaling induced by cold stress. (A) Pseudo-color images of aequorin luminescence in P. patens treated with different temperatures. The relationships between luminescence intensity and the pseudo-color images are scaled by a pseudo-color bar. (B) Average luminescence intensity and L/Lmax of every treatment. Data for independent experiments are shown (mean ± sd, n = 12, one-way ANOVA. Different letters indicate significant differences). (C) Time course of the average luminescence intensity following treatments with different temperatures (0–60 s). (D) Time course of the L/Lmax following treatments with different temperatures (0–180 s). Six replicates were performed for each treatment.
Plants 14 01178 g003
Figure 4. Calcium signaling induced by drought. (A) Pseudo-color images of aequorin luminescence in P. patens treated with different concentrations of mannitol. The relationships between luminescence intensity and the pseudo-color images are scaled by a pseudo-color bar. (B) Average luminescence intensity and L/Lmax of every treatment. Data for independent experiments are shown (mean ± sd, n = 12, one-way ANOVA. Different letters indicate significant differences). (C) Time course of the average luminescence intensity following treatments with different concentrations of mannitol (0–90 s). (D) Time course of the L/Lmax following treatments with different concentrations of mannitol (0–180 s). Six replicates were performed for each treatment.
Plants 14 01178 g004
Figure 5. Calcium signaling induced by NaCl. (A) Pseudo-color images of aequorin luminescence in P. patens treated with different concentrations of NaCl. The relationships between luminescence intensity and the pseudo-color images are scaled by a pseudo-color bar. (B) Average luminescence intensity and L/Lmax of every treatment. Data for independent experiments are shown (mean ± sd, n = 12, one-way ANOVA. Different letters indicate significant differences). (C) Time course of the average luminescence intensity following treatments with different concentrations of NaCl (0–150 s). (D) Time course of the L/Lmax following treatments with different concentrations of NaCl (0–210 s). Six replicates were performed for each treatment.
Plants 14 01178 g005
Figure 6. Calcium signaling induced by oxidative stress. (A) Pseudo-color images of aequorin luminescence in P. patens treated with different concentrations of H2O2. The relationships between luminescence intensity and the pseudo-color images are scaled by a pseudo-color bar. (B) Average luminescence intensity and L/Lmax of every treatment. Data for independent experiments are shown (mean ± sd, n = 12, one-way ANOVA. Different letters indicate significant differences). (C) Time course of the average luminescence intensity following treatments with different concentrations of H2O2 (0–240 s). (D) Time course of the L/Lmax following treatments with different concentrations of H2O2 (0–300 s). Six replicates were performed for each treatment.
Plants 14 01178 g006
Figure 7. Effects of the different concentrations of Ca2+ inhibitors on the increase in [Ca2+]i. The effect of different concentrations of Ca2+ inhibitors on plants grown in abiotic stress conditions: 10 °C (A), 0.5 M mannitol solution (B), 0.3 M NaCl solution (C), and 5 mM H2O2 solution (D). The concentration gradients for inhibitors 0.1 mM, and 1 mM. Data for independent experiments are shown (mean ± sd, n = 12, one-way ANOVA. Different letters indicate significant differences).
Plants 14 01178 g007
Figure 8. Calcium signaling induced by cold, drought, oxidative, and salt stresses in plants grown under prolonged salt stress. The L/Lmax of P. patens in response to cold (A), drought (B), oxidative (C), and additional NaCl (D) stresses under salt-stressed and normal environments (mean ± sd, n = 12. Asterisks indicate significant differences).
Plants 14 01178 g008
Disclaimer/Publisher’s Note: The statements, opinions and data contained in all publications are solely those of the individual author(s) and contributor(s) and not of MDPI and/or the editor(s). MDPI and/or the editor(s) disclaim responsibility for any injury to people or property resulting from any ideas, methods, instructions or products referred to in the content.