Article

Supercritical CO2 Extraction of Bioactive Compounds from Corn Grains (Zea mays L., Hybrid Pri-15-7-16) with Metabolomic Profiling and Confocal Laser Microscopy

by
Mayya P. Razgonova
1,2,*,
Pavel A. Shinkaruk
2,
Anastasiia A. Maksimenko
2,
Anna B. Podvolotskaya
2 and
Liudmila A. Tekutyeva
2
1
N.I. Vavilov All-Russian Institute of Plant Genetic Resources, 42, 44 Bolshaya Morskaya, 190031 Saint Petersburg, Russia
2
Institute of Biotechnology, Bioengineering and Food Systems, Advanced Engineering School, Far Eastern Federal University, 10 Ajax Bay, Russky Island, 690922 Vladivostok, Russia
*
Author to whom correspondence should be addressed.
Plants 2025, 14(6), 913; https://doi.org/10.3390/plants14060913
Submission received: 29 December 2024 / Revised: 28 February 2025 / Accepted: 7 March 2025 / Published: 14 March 2025
(This article belongs to the Section Phytochemistry)

Abstract

This study aimed to optimize supercritical CO2 extraction conditions, analyze bioactive compounds, and visualize their distribution in corn grains (Zea mays L., hybrid Pri-15-7-16). The optimal extraction conditions were identified as a pressure of 200 bar and a temperature of 55 °C, yielding 2.2 mg/g of bioactive compounds. The distribution of autofluorescent compounds within corn grain tissues was visualized using confocal laser scanning microscopy. Image analysis showed that the pericarp and aleurone layer cell walls were rich in autofluorescent compounds, while the endosperm cell walls exhibited low autofluorescence. Metabolomic analysis, combining high-performance liquid chromatography and mass spectrometry, identified 44 compounds in the extracts, including 30 polyphenolic compounds from subgroups such as polyphenolic acids, flavones, flavan-3-ols, flavonols, and anthocyanidins as well as 14 compounds from other chemical groups, including amino acids and fatty acids.

1. Introduction

Vitamin D3 plays a crucial role in maintaining animal health by regulating calcium and phosphorus metabolism, bone formation, and immune function [1,2,3]. In dogs and cats, vitamin D3 is particularly important because they cannot synthesize it through sunlight exposure and must obtain it from their diet [2]. However, ensuring adequate vitamin D3 levels in animal feeds is challenging due to its sensitivity to environmental factors and low bioavailability [4,5].
Encapsulation and delivery systems for vitamin D3 are gaining importance in animal nutrition research [6]. These technologies protect the vitamin from environmental degradation, control its release, and enhance its bioavailability [7,8]. For instance, nanostructured lipid carriers have been developed for encapsulating vitamin D3, demonstrating increased stability and protection during digestion [6].
Different delivery systems significantly affect vitamin D3 bioavailability. A study comparing microencapsulated, micellar, and oil-based vitamin D3 supplements in laboratory rats showed that microencapsulated and oil-based forms were more bioavailable than micellar forms [4]. Specifically, the microencapsulated form exhibited a prolonged effect, maintaining elevated vitamin D3 levels for 14 days post-supplementation. Additionally, a study on dairy goats at the end of lactation showed that vitamin D3 encapsulated in sulfur-saturated coacervates of bovine lactoferrin–alginate complexes increased serum levels of 25-hydroxyvitamin D3 [25-(OH)-D3], lactoferrin, immunoglobulin A, and the immunomodulatory cytokine INF-γ [1]. Incorporating bioactive compounds of plant origin into delivery systems can further enhance vitamin D3 effectiveness through synergistic effects [9].
The use of bioactive plant compounds, particularly polyphenols, offers a promising strategy to improve vitamin stability and efficacy in animal diets. Polyphenols have garnered significant attention due to their antioxidant, anti-inflammatory, and antimicrobial properties [10,11,12,13,14]. They enhance nutrient stability and bioavailability by acting as natural preservatives, potentially protecting vitamin D3 from degradation during feed processing and storage, thereby improving its effectiveness in animal husbandry.
Moreover, plant polyphenols serve as natural antioxidants in animal feeds, promoting animal health and improving product quality. These compounds present viable alternatives to synthetic antioxidants in livestock feeding. Their inclusion in animal nutrition has been linked to improved growth performance, enhanced immune function, and better meat quality [15].
Among cereals, corn grains stand out for their exceptionally high polyphenol content, reaching 15.55 μmol/g. They also exhibit the highest overall antioxidant activity among common cereals such as rice, wheat, and oats, making them ideal for phytochemical and metabolomic studies [10,16,17].
Corn-derived phenolic compounds possess multifaceted protective properties, including radical scavenging, metal binding, and antioxidant activity. By reducing oxidative stress caused by free radical imbalances, polyphenols play a vital role in maintaining cellular health [10]. The antioxidant activity of corn polyphenols varies by variety, with colored corn containing significantly more polyphenols and anthocyanins than white or yellow corn. These pigmented varieties exhibit higher antioxidant activity due to their greater content of bioactive compounds [18,19,20,21]. A study by Feregrino-Pérez et al. (2024) [22] investigated the antioxidant activity and polyphenol content in corn grains and ears, revealing that corn ears generally contain higher levels of antioxidants and phenolic compounds than grains. Notably, the antioxidant capacity of purple corn ears is four to seven times higher than that of grain samples. Both grains and ears contain various phenolic compounds, including flavonoids, anthocyanins, and phenolic acids, with purple corn being particularly rich in anthocyanins [22].
The mechanisms by which phenolic compounds combat oxidative stress are diverse. They can directly neutralize reactive oxygen species, prevent their formation, or enhance the body’s innate antioxidant defense mechanisms to restore redox balance. The effectiveness of polyphenols in scavenging free radicals is attributed to their molecular structure, particularly the presence of aromatic rings and an extensive conjugated system rich in hydroxyl groups. Both the quantity and spatial arrangement of these hydroxyl groups significantly influence the antioxidant activity of these compounds [23,24].
Flavonoids function as exogenous antioxidants by neutralizing free radicals through various mechanisms, including enzyme inhibition and modulation of signaling pathways. Their antioxidant activity depends on their molecular structure, particularly the arrangement and quantity of hydroxyl groups. The antioxidant capacity of phenolic compounds follows the following order: simple phenolic acids < hydroxycinnamic acids < flavonols < flavan-3-ols < procyanidin dimers. Hydroxycinnamic acids exhibit stronger antioxidant effects than hydroxybenzoic acids due to their structural characteristics [10].
The application of supercritical fluid extraction for isolating phenolic compounds from natural plant materials represents a promising strategy in modern biotechnology. This method, particularly when utilizing CO2, serves as an effective and eco-friendly technique for extracting biologically active substances. Compared to traditional approaches such as Soxhlet extraction, supercritical CO2 offers several notable advantages: lower density and viscosity, higher diffusivity, and minimal environmental impact. A key benefit of this technique is its capacity for precise control of process parameters. By adjusting pressure and temperature, researchers can significantly enhance both the efficiency and selectivity of the extraction process, which is particularly important when dealing with complex plant matrices. Furthermore, a major advantage is the ability to obtain a solvent-free final product, as CO2 can be easily removed during depressurization, ensuring high extract purity [14,25,26,27,28,29,30,31,32,33,34].
These unique characteristics make supercritical CO2 extraction an especially attractive method for isolating bioactive compounds, including phenolic complexes, across various fields—from the food industry to pharmaceuticals. This approach opens new opportunities for developing innovative products with enhanced functional properties [25,26,28,29,30,35,36,37].
Screening various plant sources to identify valuable bioactive compounds, particularly polyphenolic complexes, for the production of vitamin biocomplexes intended for animal feed is one of the main research focuses. By studying natural antioxidants and developing innovative encapsulation methods, we aim to enhance the stability, bioavailability, and overall effectiveness of vitamin supplements in animal diets. This comprehensive approach has the potential to lead to the development of more effective vitamin formulations for livestock production, ultimately contributing to improved health and productivity in agricultural animals.
The objectives of this study were (1) to optimize supercritical CO2 extraction conditions for extracting bioactive compounds from corn grains (Zea mays L., hybrid Pri-15-7-16); (2) to analyze bioactive compounds in the extracts using high-performance liquid chromatography and mass spectrometry; and (3) to visualize the localization of phytochemical compounds in corn grain tissues using confocal laser scanning microscopy.

2. Results

2.1. Extraction of Bioactive Compounds

The extraction of bioactive compounds from corn grains was performed using two methods: maceration and supercritical CO2 extraction. Table 1 presents the yield of bioactive compounds extracted from corn grains (Zea mays L., hybrid Pri-15-7-16) under different temperature and pressure conditions during supercritical CO2 extraction. The temperature ranged from 31 °C to 60 °C, while the pressure varied from 50 to 250 bar. Yields ranged from a minimum of 0.30 mg/g (at 50 bar and 31 °C) to a maximum of 2.20 mg/g (at 200 bar and 55 °C).
In general, increasing pressure and temperature resulted in higher yields, with a peak yield of 2.20 mg/g observed at 200 bar and 55 °C, which was identified as the optimal extraction condition. However, yields slightly decreased at the highest temperature and pressure levels. Additionally, yields of 2.00 mg/g were recorded at both 200 bar/50 °C and 250 bar/55 °C (Table 1, Figure 1).

2.2. Identification of Bioactive Compounds

The identification of chemical compounds in extracts from corn grains (Zea mays L.) was conducted using metabolomic analysis, combining high-performance liquid chromatography and mass spectrometry methods. In the supercritical CO2 extracts of corn grains, 44 compounds were identified—30 belonging to the polyphenol group and 14 to other chemical groups. All identified compounds, along with their chemical formulas, molar masses, ion adducts ([M−H] and [M+H]+), and MS/MS fragmentation data (1st, 2nd, and 3rd order), are presented in Table A1 (Appendix A).

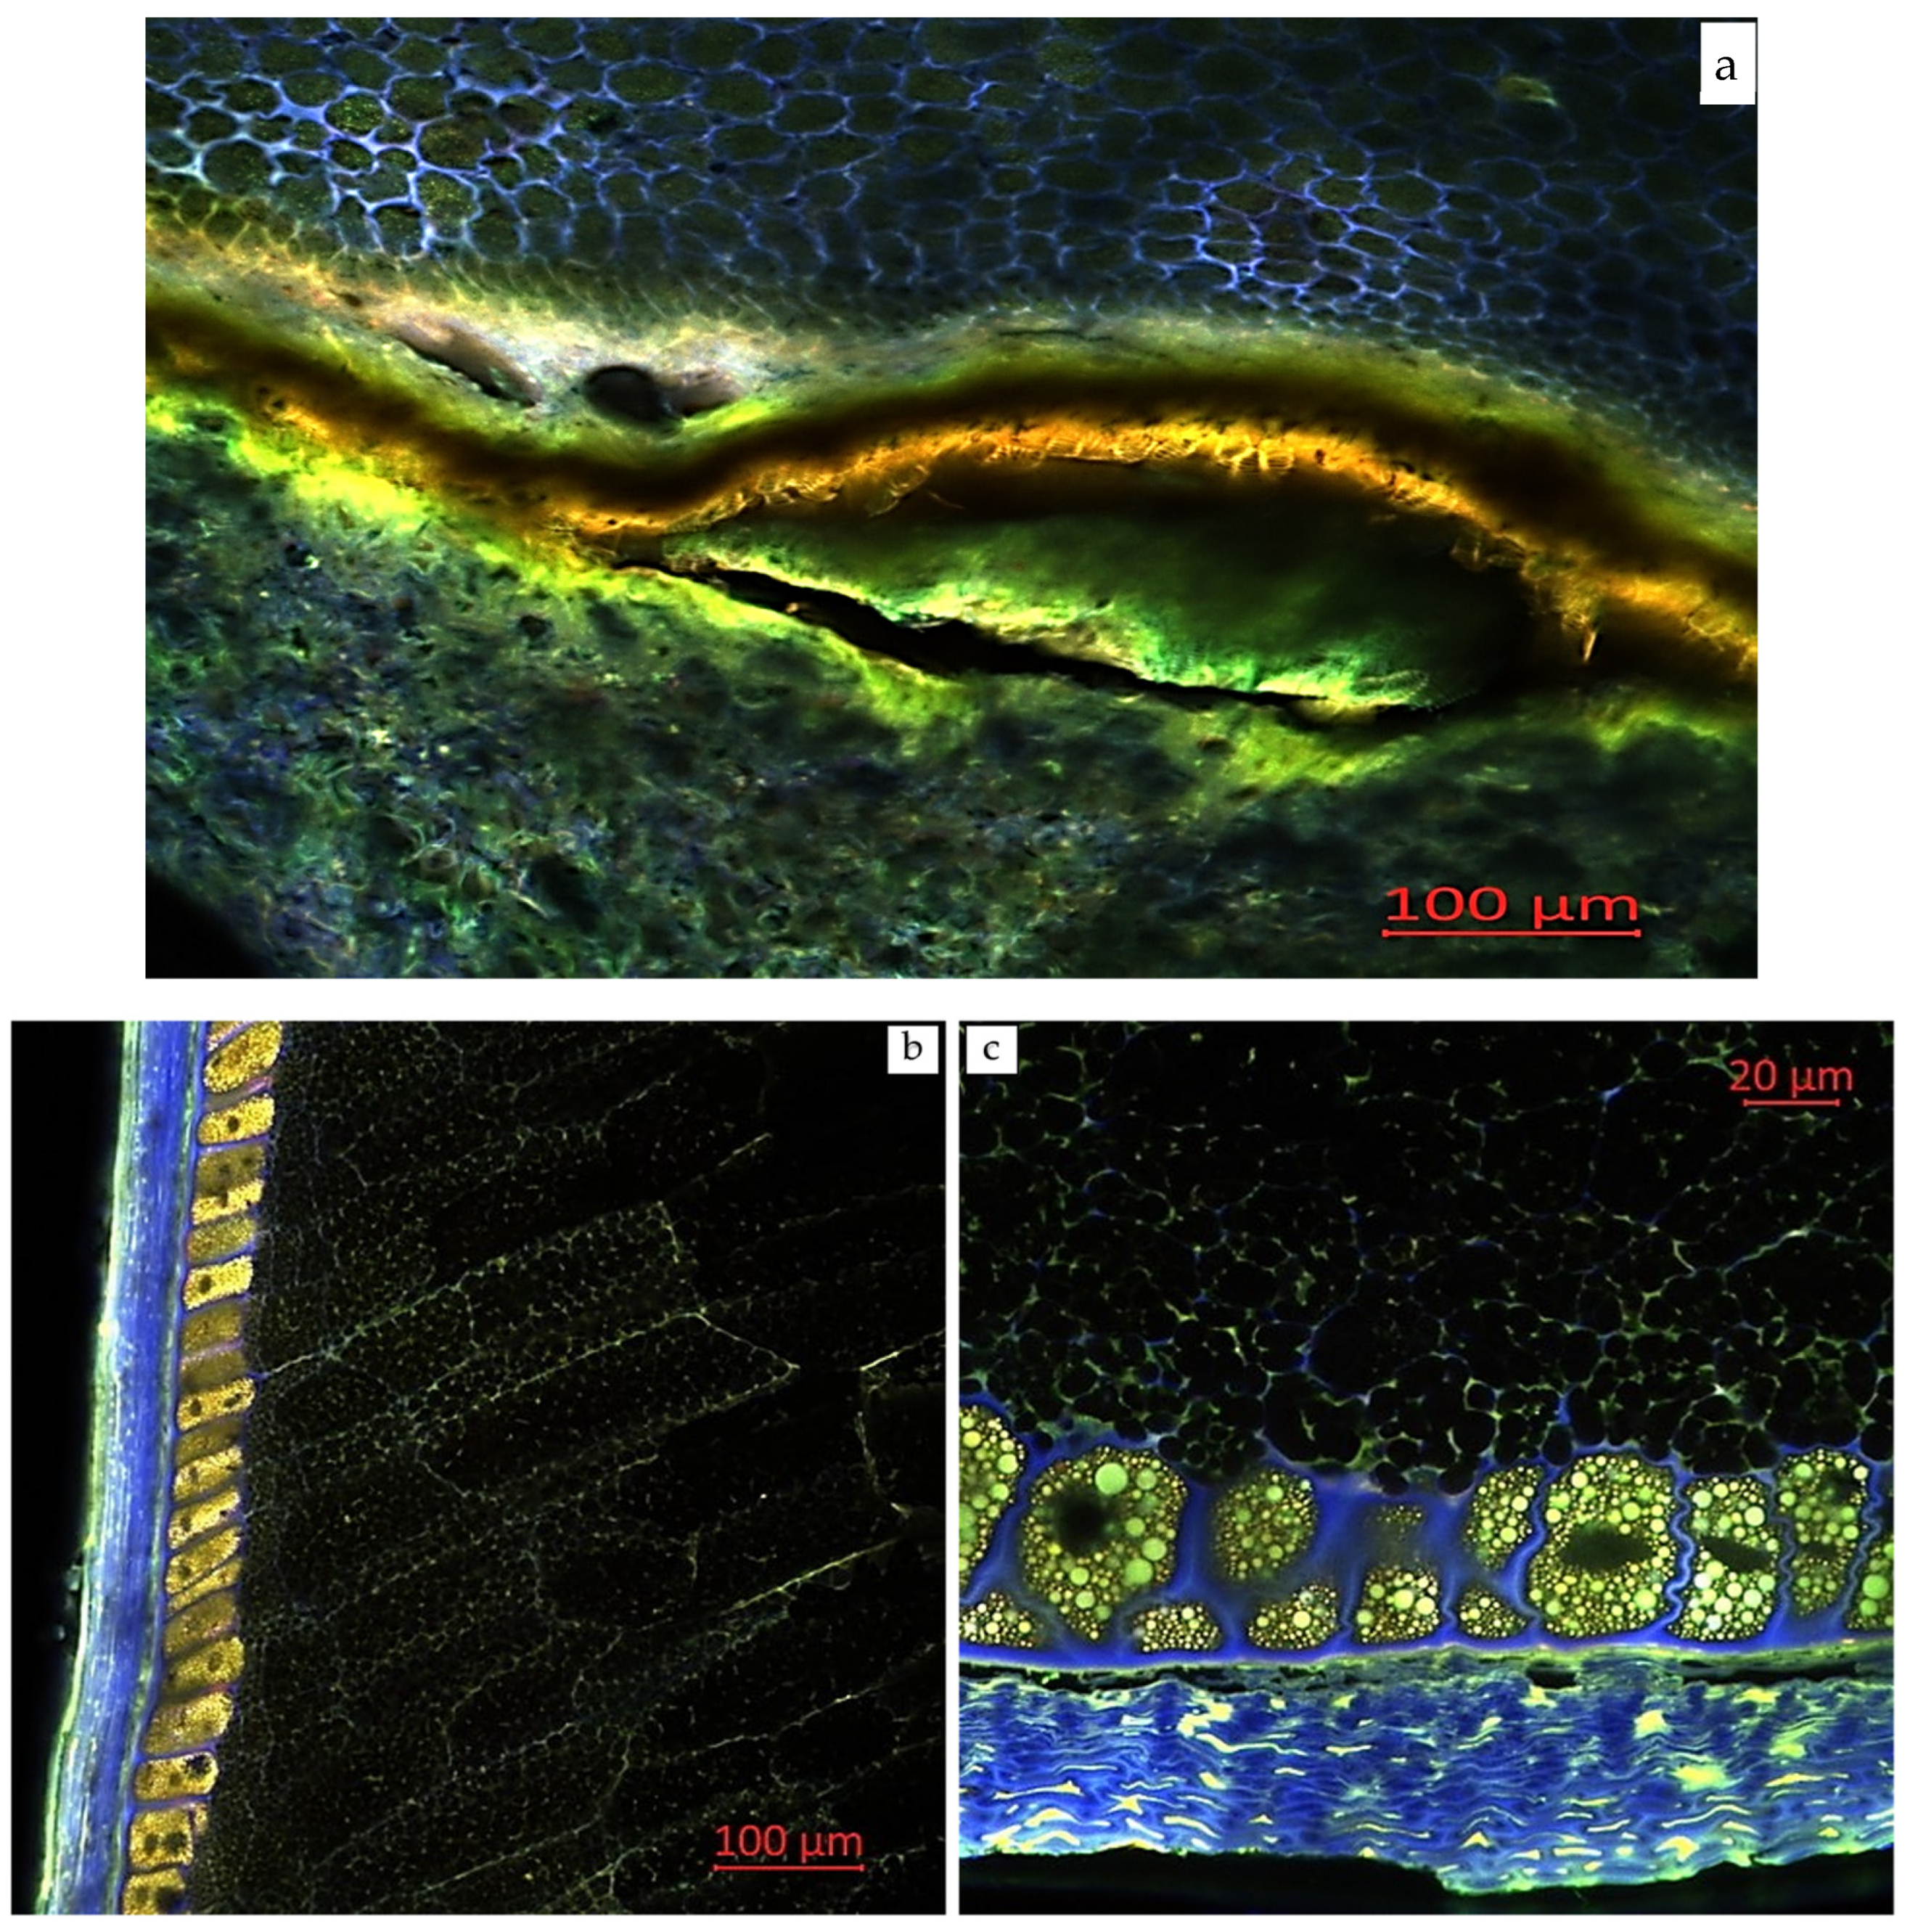
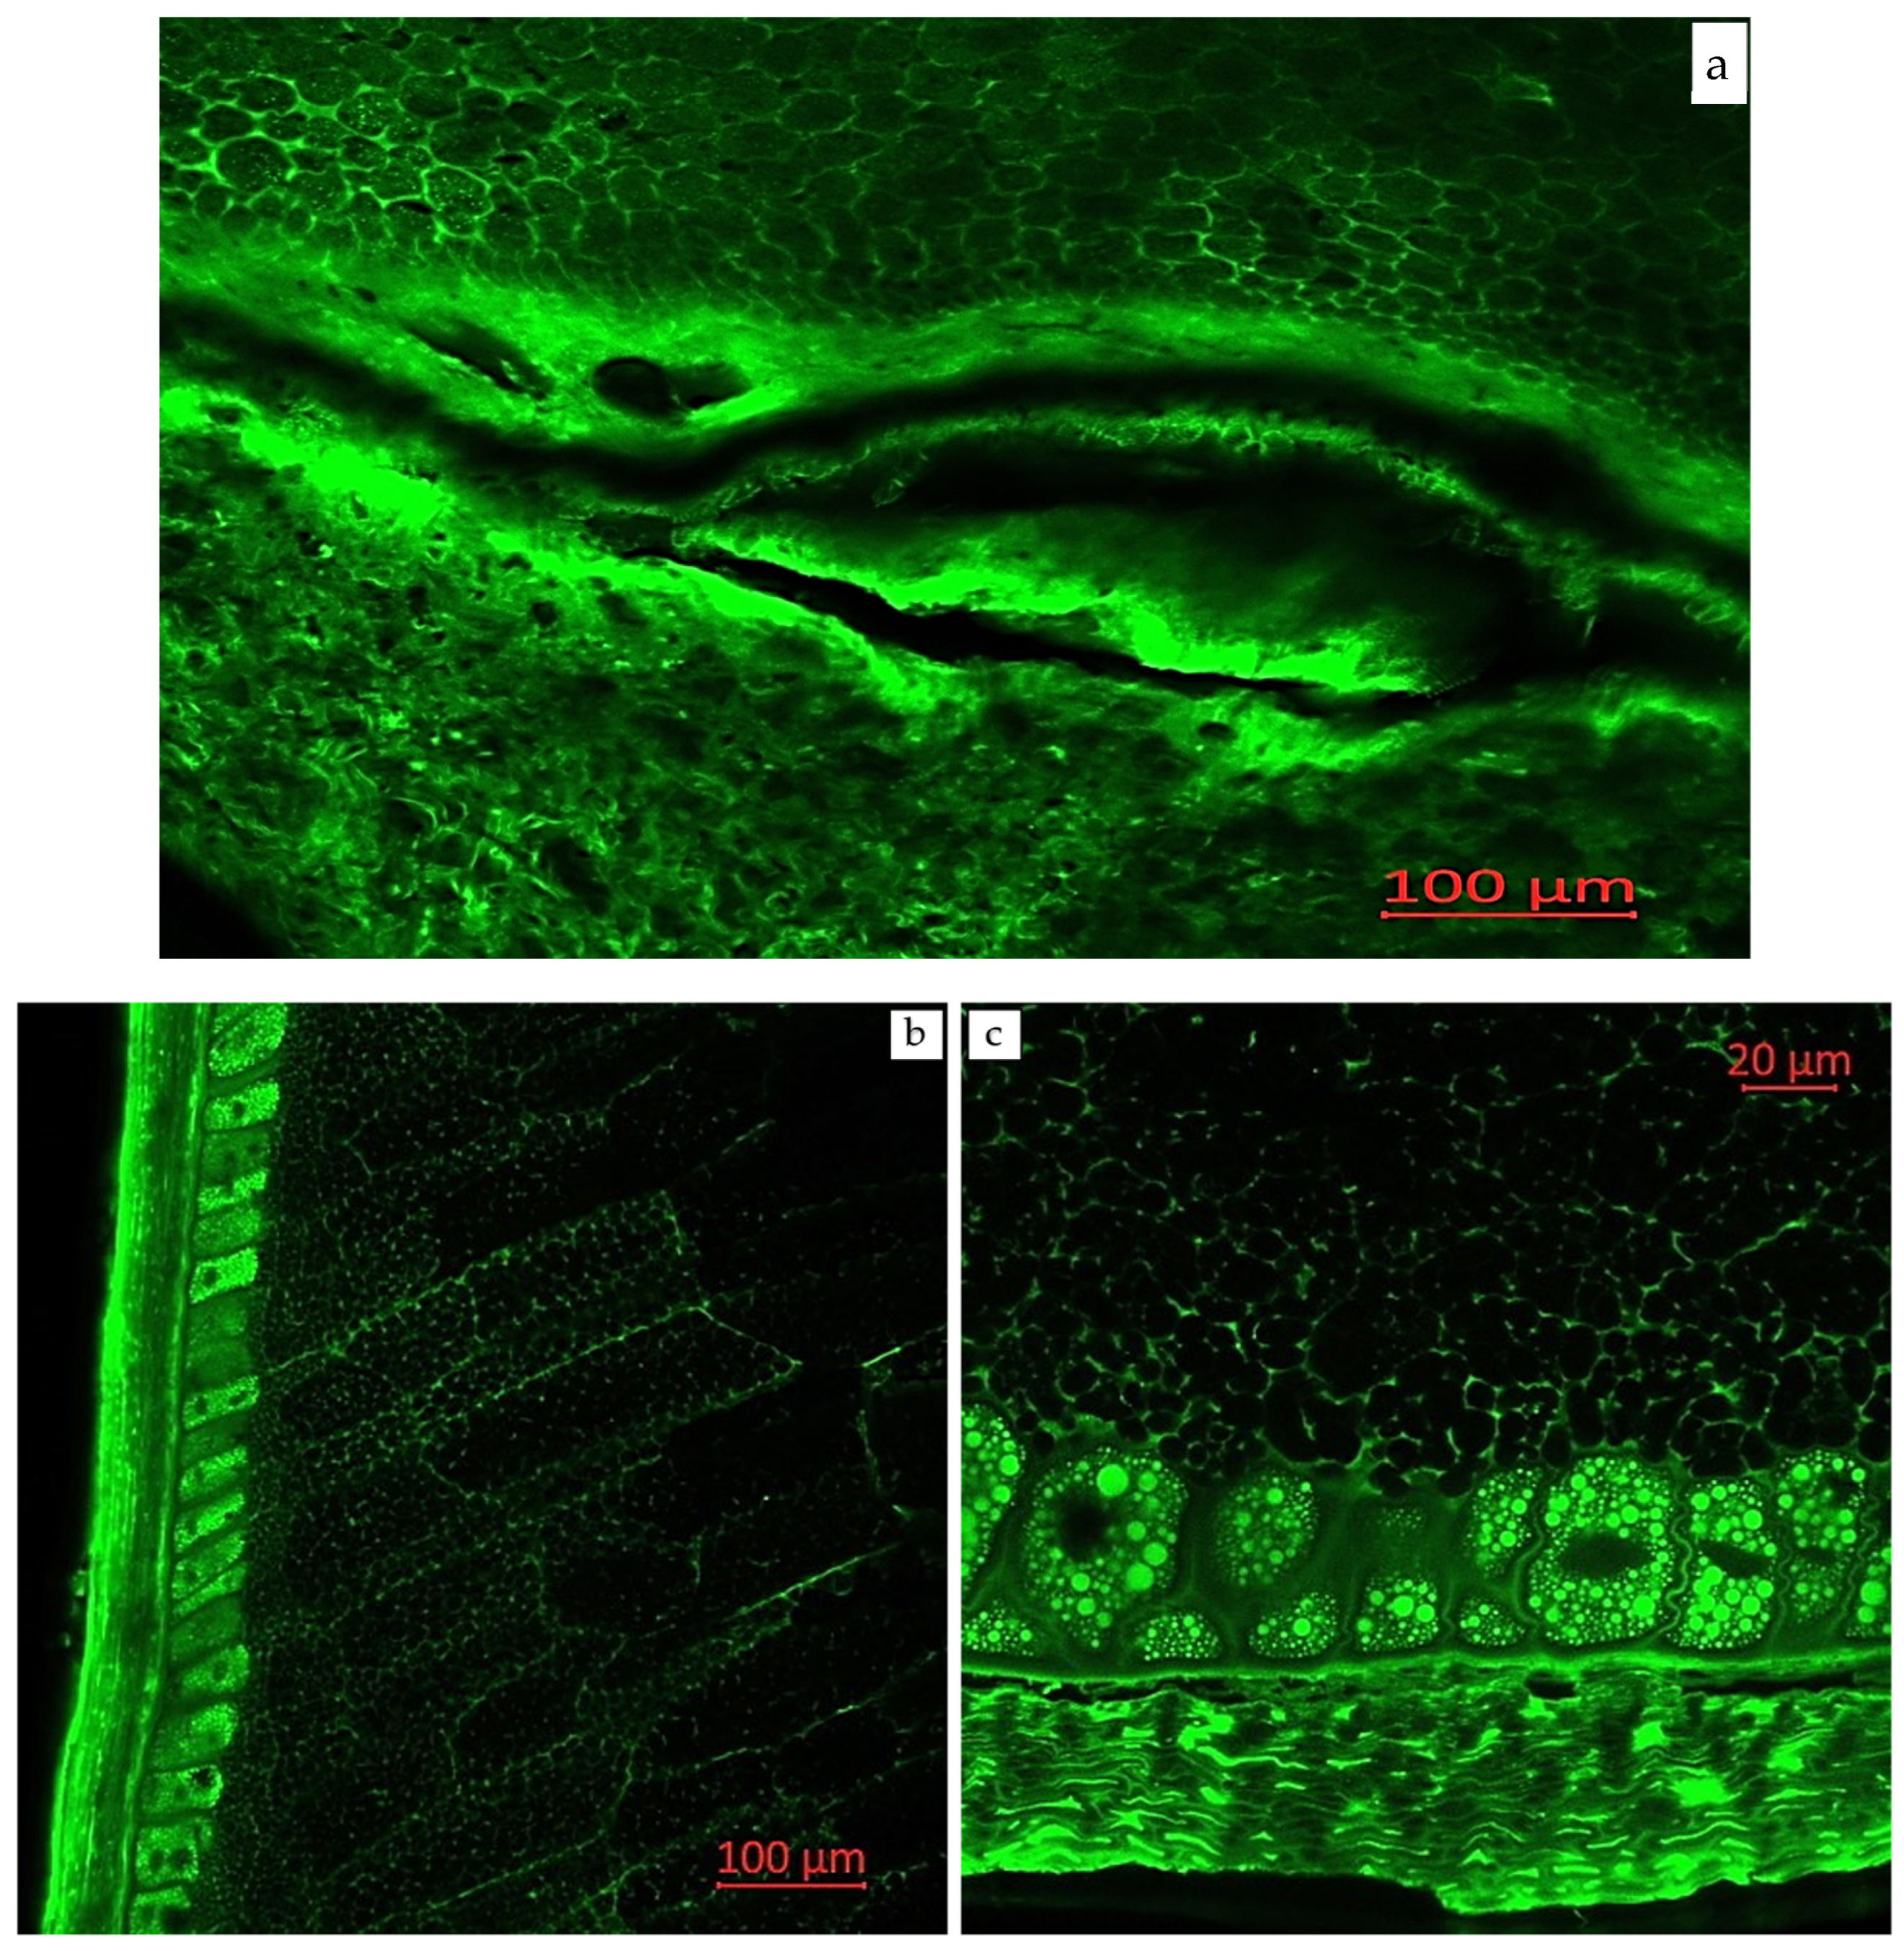
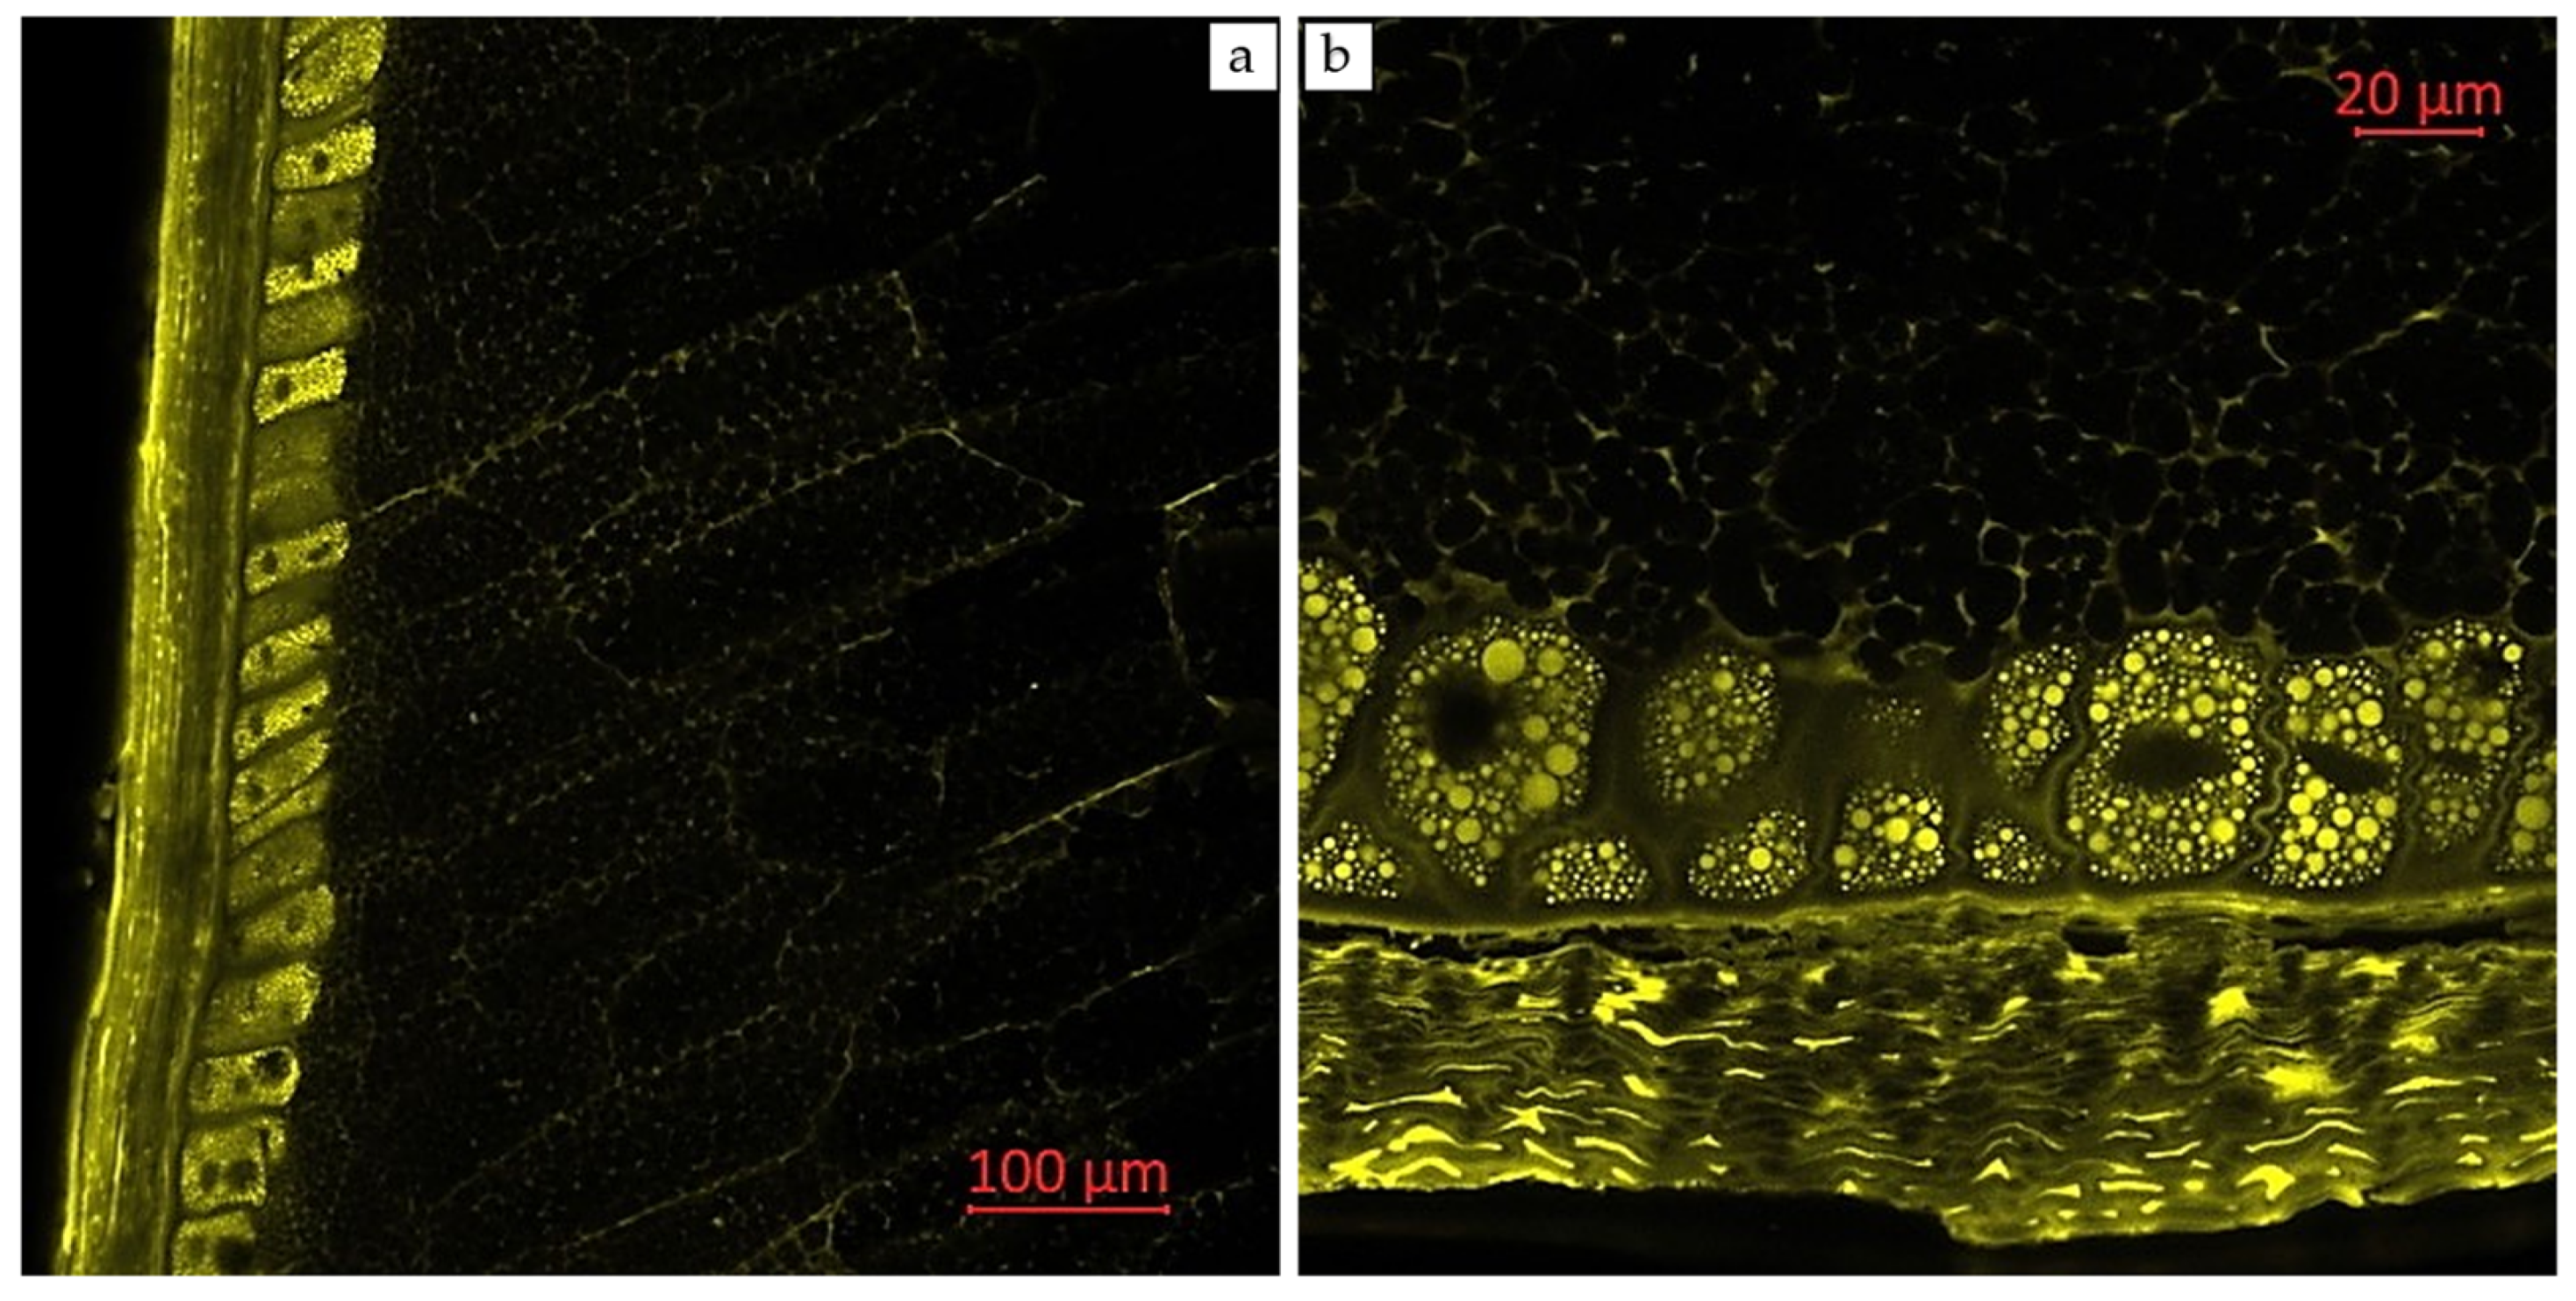
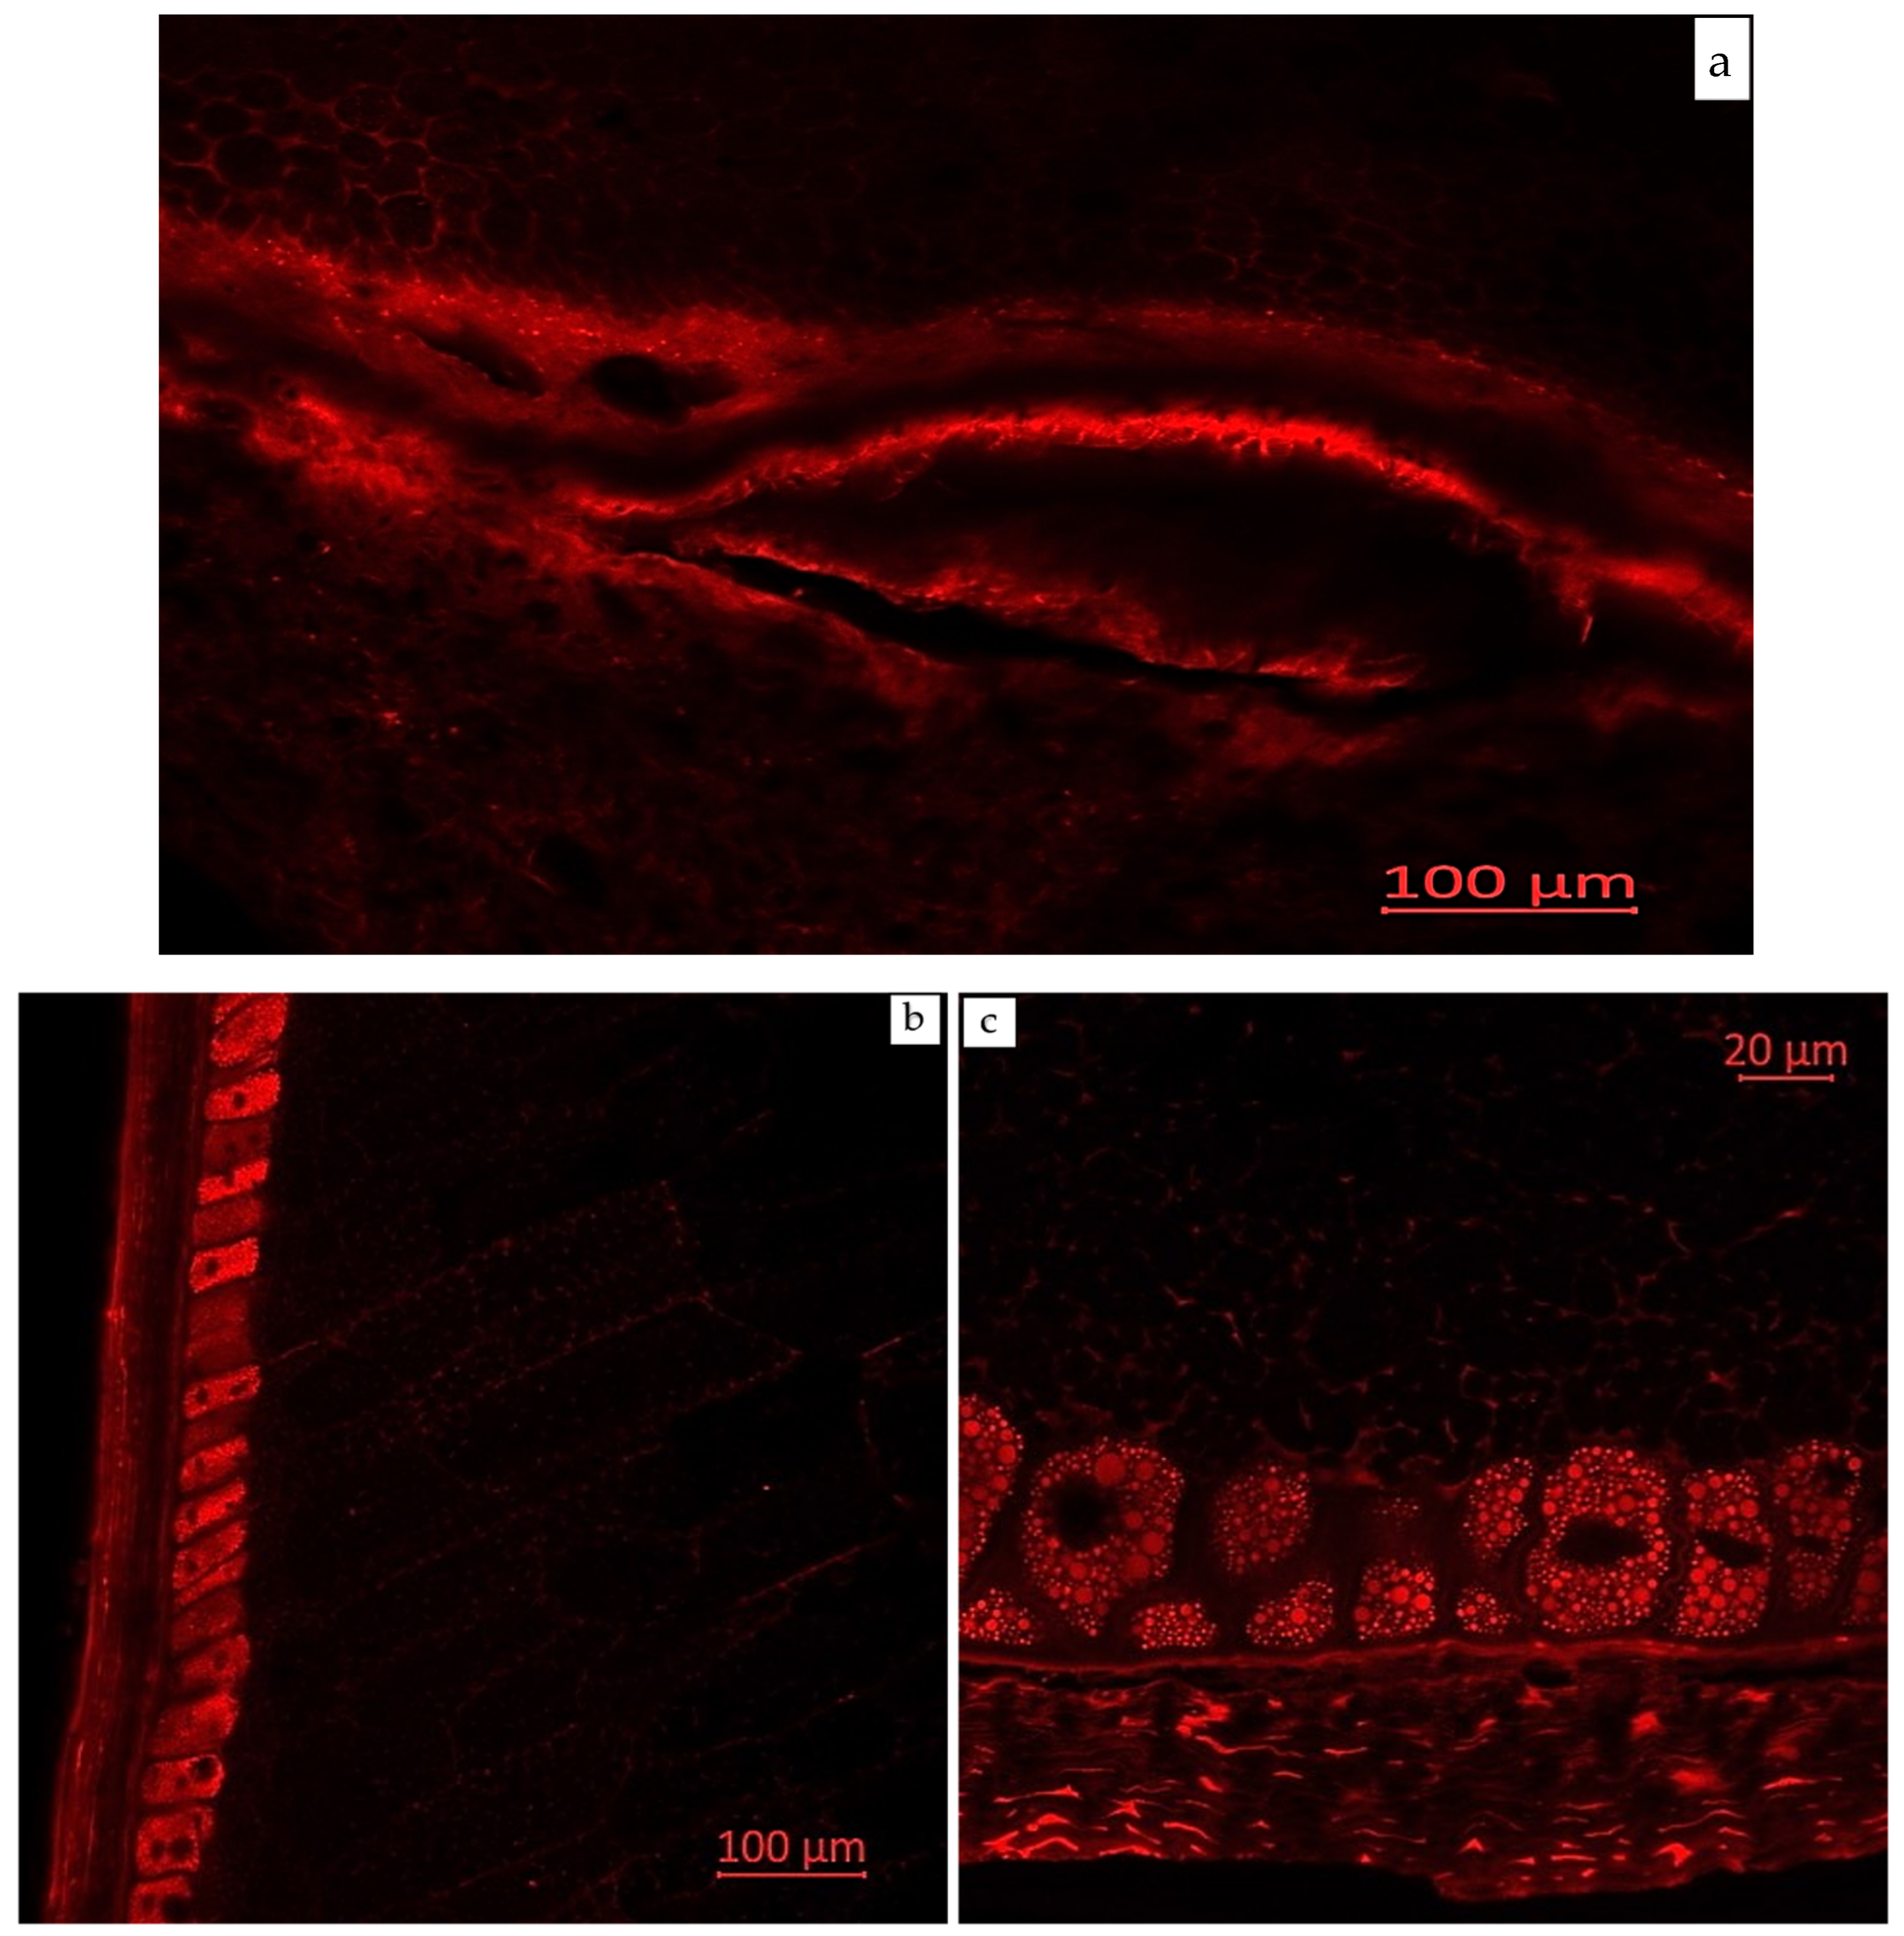
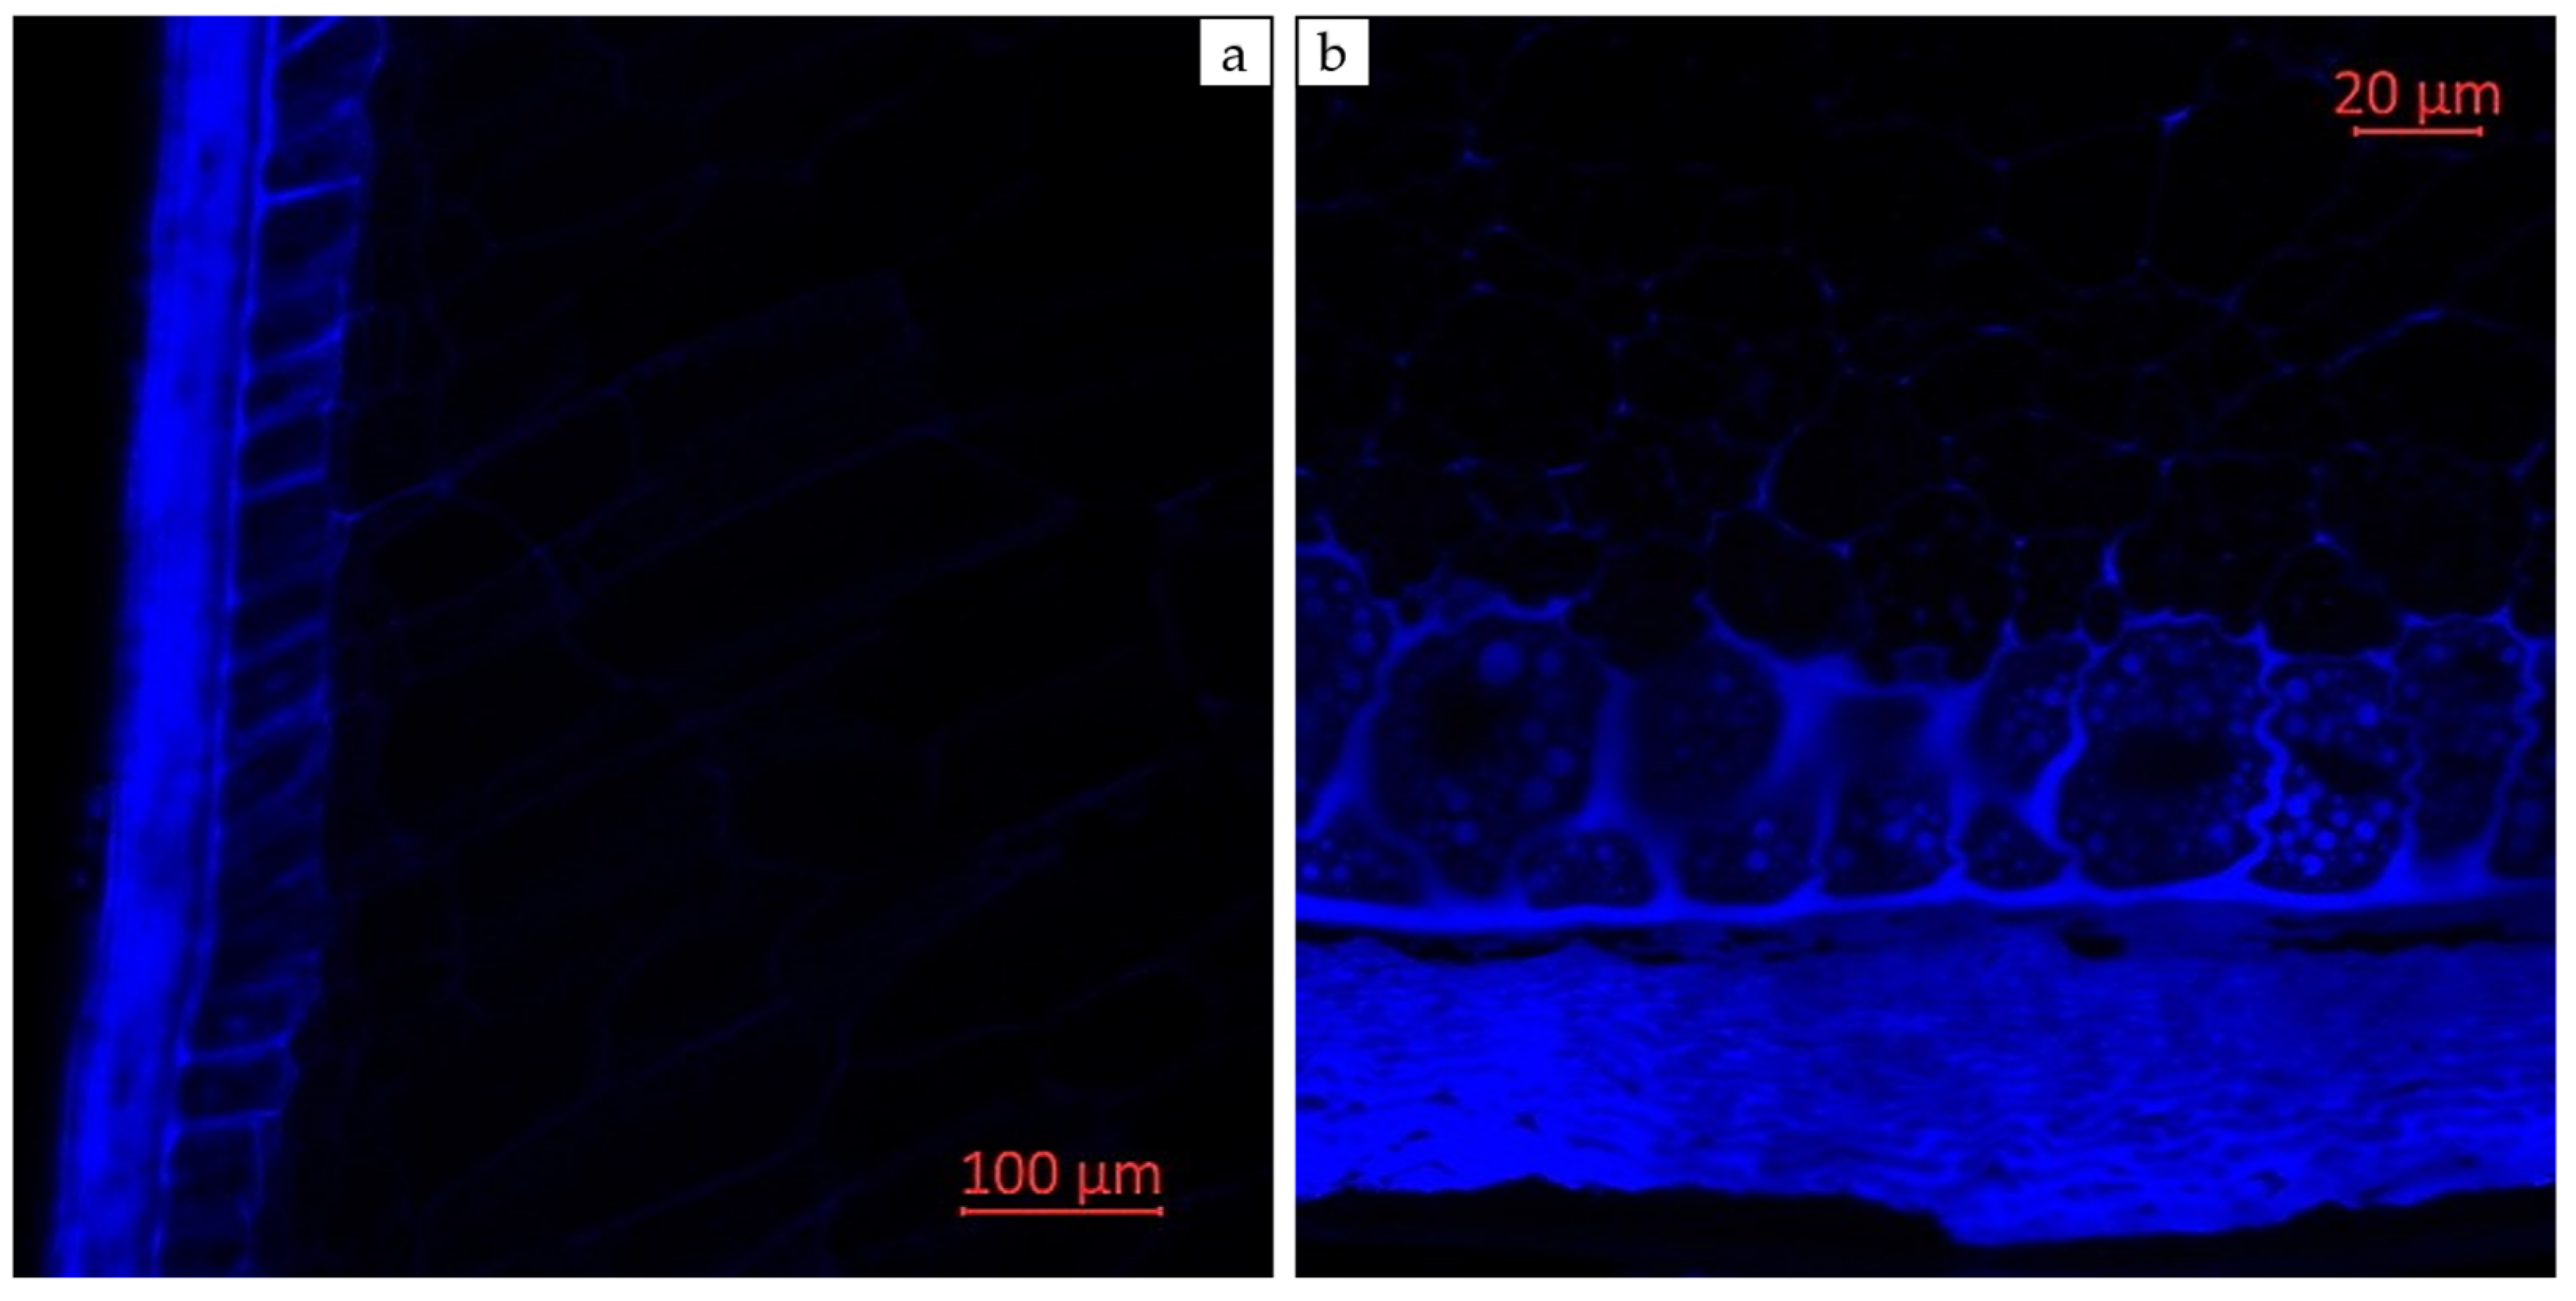
2.3. Visual Localization of Bioactive Compounds

Confocal laser scanning microscopy enables the visualization of various compounds in plant tissues due to their autofluorescent properties. Areas with enhanced autofluorescence indicate regions of high compound concentration. Longitudinal and transverse sections of corn grains (Zea mays L., hybrid Pri-15-7-16), analyzed using confocal laser scanning microscopy with excitation using a UV laser (405 nm) with emission in the range of 400–475 nm (blue autofluorescence), as well as excitation using a blue laser (488 nm) with emissions in the ranges of 410–545 nm (green autofluorescence), 575–617 nm (yellow autofluorescence), and 620–700 nm (red autofluorescence), are presented in Figure 2, Figure 3, Figure 4, Figure 5 and Figure 6.

3. Discussion

A high yield of bioactive compounds from corn grains (Zea mays L., hybrid Pri-15-7-16) was observed under the following conditions: (1) a pressure of 200 bar and a temperature of 55 °C, yielding 2.2 mg/g with a co-solvent mass fraction of 2%; (2) a pressure of 250 bar and a temperature of 55 °C, yielding 2 mg/g with a co-solvent mass fraction of 2%; and (3) a pressure of 200 bar and a temperature of 50 °C, yielding 2 mg/g with a co-solvent mass fraction of 2%. The supercritical extraction time was 1 h. The optimal extraction conditions were identified as 200 bar and 55 °C, yielding 2.2 mg/g. The data in Table 1 are critical for optimizing the supercritical CO2 extraction process for bioactive compound recovery, illustrating how yield varies with pressure and temperature. Higher pressure and temperature parameters may result in lower yields of bioactive compounds during CO2 extraction due to several factors, including solvent density, thermal degradation, pressure-dependent solubility, competing temperature effects, extraction time, and compound-specific behavior [31,32,33,34].
The study by Kuś et al. (2018) [27] demonstrated the effectiveness of the central composite rotatable design method for optimizing supercritical CO2 extraction conditions from Populus nigra L. buds. Pressure and temperature significantly affected extract yield, phenolic compound content, and antioxidant activity. The optimal conditions (30 MPa, 60 °C) maximized the yield and concentration of bioactive flavonoids, making these parameters applicable for obtaining extracts with enhanced levels of target compounds for pharmaceutical use [27]. Another study by Kuś et al. (2018) [25] confirmed the effectiveness of supercritical CO2 extraction under optimized conditions (30 MPa, 60 °C) for obtaining bioactive phytochemicals from black poplar (Populus nigra L.) buds. The extracts, rich in both volatile and non-volatile bioactive compounds, may provide synergistic effects and enhanced biological activity due to complementary mechanisms of action [25,27].
The study by Villacís-Chiriboga et al. (2021) [34] evaluated the supercritical CO2 extraction of bioactive compounds from mango by-products. The research optimized extraction conditions for carotenoids and assessed the co-extraction of phenolics. The optimal conditions were 55 °C, 35 MPa, and 20% ethanol, with β-carotene as the main carotenoid. Phenolic profiles varied between varieties, and the peel contained up to 4.1 times more bioactives than the pulp. Supercritical CO2 extraction proved promising for isolating valuable compounds from mango waste, highlighting its potential in sustainable food processing [34].
The study by Molino et al. (2019) [33] investigated the supercritical CO2 extraction of β-carotene and fatty acids from Dunaliella salina microalgae. The research evaluated the effects of mechanical pre-treatment, biomass loading, pressure, temperature, CO2 flow rate, and extraction time. Optimal conditions for β-carotene extraction were 400 bar, 65 °C, and a CO2 flow rate of 14.48 g/min, yielding a 25.48% recovery. For fatty acids, the maximum recovery (8.47 mg/g) occurred at 550 bar, 75 °C, and a CO2 flow rate of 14.48 g/min. Lower biomass loading (2.45 g) and shorter extraction time (30 min) favored maximum extraction of both compounds [33].
Pimentel-Moral et al. (2019) [32] investigated supercritical CO2 extraction of bioactive compounds from Hibiscus sabdariffa. Using Response Surface Methodology, they evaluated the effects of temperature, pressure, and co-solvent percentage on extraction efficiency. Optimal conditions for maximum phytochemical content were 50 °C, 250 bar, and 16.7% ethanol. Supercritical CO2 is a suitable and selective technique for maximizing the extraction of phytochemical compounds, demonstrating its potential as a green extraction method.
Several studies have investigated supercritical CO2 extraction of bioactive compounds from corn grains and by-products, exploring various experimental conditions to optimize extraction yields. Monroy et al. (2016) [38] studied supercritical CO2 extraction of phenolic compounds from purple corn ears (Zea mays L.), using ethanol and water as co-solvents. They found that pressure, temperature, and co-solvent concentration significantly influenced extraction yields. By evaluating various co-solvent combinations, the study optimized the process, revealing that purple corn ear extract is rich in anthocyanins, phenolic compounds, and flavonoids, exhibiting high antioxidant activity [38].
Marinho et al. (2019) [37] focused on the supercritical CO2 extraction of corn germ oil, investigating the effects of temperature (45–85 °C) and pressure (15–25 MPa) on extraction yields. Their results indicated that yields increased with rising pressure at each temperature but decreased with increasing temperature, highlighting the importance of careful parameter control. Additionally, the antioxidant activity of extracts obtained via supercritical CO2 extraction was higher than that of extracts obtained through conventional Soxhlet extraction [37].
Overall, studies have shown that supercritical CO2 extraction is an effective method for isolating bioactive compounds from various plant materials. This technique offers advantages such as reduced solvent consumption, preservation of sensitive compounds, and the ability to extract both polar and non-polar substances by adjusting parameters such as temperature, pressure, and co-solvent use [26,28,29,30,35,36,39]. However, optimizing the extraction process requires balancing temperature, pressure, and extraction time based on the specific target compounds and plant materials.
In the CO2 extracts of corn grains (Zea mays L.), 44 compounds were identified—30 from the polyphenol group, including flavones, flavonols, flavan-3-ols, anthocyanidins, and polyphenolic acids, and 14 from other chemical groups, including fatty acids and amino acids. All identified compounds, along with their chemical formulas, molar masses, calculated and observed m/z values, and other spectrometric data, are presented in Table A1, Appendix A. The chemical compounds were identified by comparing their retention indices, mass spectra, and mass spectrometry fragmentation patterns with a home-library database created by the Institute of Biotechnology, Bioengineering, and Food Systems at the Advanced Engineering School, Far Eastern Federal University (Russia). This database was built using data from various spectroscopic techniques, including nuclear magnetic resonance, ultraviolet spectroscopy, and mass spectrometry, as well as data from the updated scientific literature.
Fluorescence imaging techniques offer two main advantages over other methods: greater sensitivity and selectivity, owing to the unique properties of autofluorescent molecules that are excited by specific wavelengths and emit light at distinct wavelengths. By utilizing the autofluorescent properties of many plant compounds, fluorescent images can be captured with minimal tissue preparation and, importantly, without the need for labeling [40,41]. The method used in this study is effective for analyzing the distribution of polyphenolic compounds with autofluorescent properties in grains and legume seeds [10,42,43]. This approach allows for the study of plant morphology and the characterization of biologically active phytochemicals using a cost-effective and fast technique.
Figure 2 shows longitudinal and transverse sections of corn grains (Zea mays L., hybrid Pri-15-7-16) under different fluorescence modes: excitation with a UV laser (405 nm) with emission in the range of 400–475 nm (blue autofluorescence), and excitation with a blue laser (488 nm) with emission in the ranges of 410–545 nm (green autofluorescence) and 575–617 nm (yellow autofluorescence). Image analysis revealed that the pericarp and aleurone layer cell walls are enriched with autofluorescent compounds, consistent with the data from Razgonova et al. (2022) [10].
In plant cell walls, only certain components fluoresce under specific excitation wavelengths. Polysaccharides do not exhibit fluorescence, whereas phenolic compounds, particularly hydroxycinnamic acids and lignin, are the primary natural fluorophores. Hydroxycinnamic acids emit blue fluorescence under UV excitation, while lignin, excited by both UV and visible light, emits blue, green, and red fluorescence. The nature of phenolic compounds, their varying relative proportions, and environmental factors (such as pH and the presence of quenching molecules) lead to different tissue fluorescence responses, which can be interpreted as a tissue’s fluorescent signature [40,44,45,46,47].
Figure 3 presents longitudinal and transverse sections of corn grains (Zea mays L., hybrid Pri-15-7-16) in a monospectrum, with excitation using a blue laser (488 nm) and emission in the range of 410–545 nm. The green autofluorescence observed in this spectrum may indicate the presence of a significant amount of flavonoid compounds [42,48,49,50], such as flavins and flavonols (myricetin, quercetin, kaempferol, and their derivatives), as confirmed by our mass spectrometric studies. Blue and green autofluorescence were most pronounced in the outer layer of the cotyledons in the seeds of three different soybean species (G. soja, G. gracilis, and G. max). This distribution of phenolic compounds in the outer seed layers may serve a protective function during seed development and against environmental factors [42].
Figure 4 presents longitudinal and transverse sections of corn grains (Zea mays L., hybrid Pri-15-7-16) in a monospectrum, with excitation using a blue laser (488 nm) and emission in the range of 575–617 nm (yellow autofluorescence). Berger et al. (2021) [40] studied the fluorescence signature of cell walls in maize forage stem sections using multispectral autofluorescence visualization to detect phenolic compounds after UV and visible excitations. UV-induced fluorescence intensity in the rind and nearby parenchyma was associated with the amount of p-coumaric acid, while ferulic acid levels were mainly correlated with the parenchyma near the rind. The study also found that higher lignin content led to increased lignin fluorescence across all tissues, linking yellow and blue fluorescence to lignin and phenolic compounds [40].
Figure 5 shows the longitudinal and transverse sections of corn grains (Zea mays L., hybrid Pri-15-7-16) in a monospectrum, excitation with a blue laser (488 nm) and emission in the range of 620–700 nm (red autofluorescence). Emission in the red spectrum is mainly due to the presence of various polyphenolic compounds, including anthocyanins and anthocyanidins [51,52,53]. According to mass spectrometric studies, anthocyanidins were identified in the corn grain extracts. The study by Razgonova et al. (2022) [42] examined the spatial distribution of phenolic compounds in the seeds of three different soybean species (G. soja, G. gracilis, and G. max). Red autofluorescence (excitation with a blue laser at 488 nm, emission in the range of 620–700 nm) was strongly correlated with soybean seed color. Black-seeded soybean varieties exhibited the brightest red fluorescence, yellow-seeded varieties showed the weakest, and brown-seeded varieties displayed scattered red fluorescence. As the authors suggested, this fluorescence was linked to anthocyanin content, which was responsible for the black color of the seed coat in legumes [42].
Figure 6 shows the longitudinal and transverse sections of corn grains (Zea mays L., hybrid Pri-15-7-16) in a monospectrum, with excitation using a UV laser (405 nm) and emission in the range of 400–475 nm (blue autofluorescence). Blue autofluorescence in plants is primarily attributed to the presence of phenolic compounds, particularly lignin and hydroxycinnamic acids [40,41,54,55,56]. The main fluorescent component is ferulic acid, though other hydroxycinnamic acids, such as p-coumaric and caffeic acids, may also contribute to blue fluorescence under UV excitation [55]. Lignin is a well-known source of blue fluorescence in plants [56,57]. However, due to the presence of multiple types of fluorophores within its molecule, lignin exhibits a broad emission range and can be observed under both UV and visible light excitation [40,45,58].
As seen in the monospectral images, the endosperm cell walls exhibit very low blue fluorescence due to their minimal content of fluorescent phenolic compounds, which is consistent with previous studies [10,59]. In addition, the pericarp of Zea mays grains has been reported to contain a total phenolic content 30–34 times higher than that of the endosperm [60]. According to Razgonova et al. (2022) [10], who studied the distribution of polyphenolic compounds in Zea mays L. var. Pioneer grains using laser microscopy, the aleurone layer of the grain was enriched with polyphenolic substances emitting blue autofluorescence. However, as previously reported, since the aleurone layer does not contain lignin [57], the authors concluded that the observed blue fluorescence may be due to the presence of significant amounts of hydroxycinnamic acids, such as ferulic and coumaric acids [61,62].
Fluorescence microscopy data revealed the most probable localizations of polyphenolic compounds. However, it is important to note that this method has certain limitations: while effective for determining the spatial arrangement of chemical substance groups, it does not allow for the identification of individual compounds. These methodological limitations should be considered when interpreting the results.
For a more accurate interpretation of autofluorescence results in plant cell walls, further research on the quantitative analysis of bioactive compounds would be beneficial. Additionally, other methods, such as Wiesner’s or Maule’s stains or other selective dyes for lignin, could be applied. It may also be advantageous to consider additional microspectroscopic techniques, such as Raman or infrared imaging, to further localize phenolic compounds alongside cell wall polysaccharides [40].

4. Materials and Methods

The object of this study was corn grains (Zea mays L., hybrid Pri-15-7-16) obtained from the collection of the Federal Scientific Center of Agricultural Biotechnology of the Far East named after A.K. Chaika, Ussuriysk, Russia. These grains were grown and harvested during August–September 2022 in fields located near Ussuriysk, 120 km from Vladivostok, Russia, on the Ussuri-Khankai plain. This region is characterized by a warm and humid climate with harsh winters. The hydrothermal coefficient varies from 1.6 to 2.0 (excessively humid). The hybrid corn (Zea mays L.) was assigned its name by the Federal Scientific Center of Agricultural Biotechnology of the Far East named after A.K. Chaika according to their classification. These varieties are included in the State Register of Breeding Achievements of the Russian Federation and are approved for use. The corn grains were pre-ground in a universal mill to a particle size of 2–3 mm.

4.1. Fractional Maceration

To obtain highly concentrated extracts, the fractional maceration technique was applied. The total amount of extractant (methyl alcohol of reagent grade ≥ 99.5%) was divided into three parts and successively infused with portions of the plant material: first, with the first portion; then, with the second; and finally, with the third. The infusion time for each part was seven days at room temperature.

4.2. Supercritical CO2 Extraction

Supercritical CO2 extraction was performed using the SFC-500 supercritical fluid chromatography system (Thar Instruments, Inc., Pittsburgh, PA, USA). The system included a supercritical extraction compressor for compressing CO2 to the required pressure, a CO2 flow meter (Siemens, München, Germany) to measure the CO2 input, a co-solvent pump for supplying the co-solvent, and a 1 L extraction vessel. The extraction vessel was heated with a hot jacket controlled by a thermostat (±1 °C) while pressure was regulated by a dosing valve. Ground plant matrices (100 g) were loaded into the extractor with a CO2 flow rate of 250 g/min. Supercritical extracts were obtained under various CO2 pressures (50–400 bar) and temperatures (31–70 °C), using minimal amounts of ethanol as a co-solvent. Extracts were collected in a separator connected to the dosing valve and maintained in a circulation bath at 0 °C. The extraction time began after achieving working pressure and equilibrium flow with CO2 pressure and temperature optimized to maximize product yield. This supercritical CO2 extraction method was tested on various plant matrices.

4.3. Liquid Chromatography

High-performance liquid chromatography (HPLC) was performed using a Shimadzu LC-20 Prominence HPLC system (Shimadzu, Kyoto, Japan) equipped with a UV sensor and a C18 silica reverse-phase column (4.6 × 150 mm, particle size: 2.7 µm) for the separation of multi-component mixtures. The gradient elution program with two mobile phases (A: deionized water; B: acetonitrile with 0.1% v/v formic acid) was as follows: 0–2 min, 0% B; 2–50 min, 0–100% B; and control washing 50–60 min, 100% B. The entire HPLC analysis was performed using a UV–vis detector SPD-20A (Shimadzu, Kyoto, Japan) at wavelengths of 230 and 330 nm. The column temperature was maintained at 50 °C, with a total flow rate of 0.25 mL min−1. The injection volume was 10 µL. Additionally, liquid chromatograph was combined with a mass spectrometric ion trap AmaZon SL (Bruker Daltoniks, Bremen, Germany) for compound identification.

4.4. Mass Spectrometry

Mass spectrometry (MS) analysis was performed using an ion trap AmaZon SL (Bruker Daltoniks, Bremen, Germany) equipped with an electrospray ionization (ESI) source operating in both negative and positive ion modes. The optimized parameters were as follows: ionization source temperature: 70 °C, gas flow: 4 L/min, nebulizer gas (atomizer) pressure: 7.3 psi, capillary voltage: 4500 V, endplate bend voltage: 1500 V, fragmentor voltage: 280 V, and collision energy: 60 eV. The ion trap was used within the scanning range of m/z 100–1700 for MS and MS/MS. The acquisition rate was one spectrum per second for MS and two spectra per second for MS/MS. A four-stage ion separation mode (MS/MS mode) was implemented. Data collection was controlled by Hystar Data Analysis 4.1 software (Bruker Daltoniks, Bremen, Germany) and synchronized with the Shimadzu LC-20 Prominence HPLC system. All experiments were repeated three times.
The chemical compounds were identified by comparing their retention index, mass spectra, and mass spectrometry fragmentation patterns with data from a home-library database created by the Institute of Biotechnology, Bioengineering, and Food Systems at the Advanced Engineering School, Far Eastern Federal University (Russia), as well as other databases (MS2T, MassBank, HMDB).

4.5. Confocal Laser Scanning Microscopy

Confocal laser scanning microscopy was performed according to the method described by Razgonova et al. (2022) [10]. Before microscopic examination, longitudinal and transverse sections of dry, untreated corn grains were prepared using an MS-2 sliding microtome (Tochmedpribor, Harkiv, Ukraine). The obtained slices of corn grains were placed on a microscope slide with immersion oil to reduce light refraction caused by air gaps. The autofluorescence parameters of the corn grain slices were determined using an inverted confocal laser scanning microscope (LSM 800, Carl Zeiss Microscopy GmbH, Jena, Germany). The autofluorescence spectrum was selected using the λ-scanning mode of the confocal microscope, which allows for determining the emission maximum in a specific sample and obtaining spectra. A λ-experiment was conducted with excitation using lasers of 405 and 488 nm in succession, recording the emission in the range from 400 to 700 nm with a step of 5 nm. The following fluorescence maxima were identified: excitation with a UV laser (405 nm, solid-state, diode, 5 mW) with emission in the range of 400–475 nm (blue); excitation with a blue laser (488 nm, solid-state, diode, 10 mW) with emissions in the ranges of 410–545 nm (green), 575–617 nm (yellow), and 620–700 nm (red). Images were obtained using Plan-Apochromat 20×/0.8 M27 and Plan-Apochromat 63×/1.40 Oil DIC M27 objectives. ZEN 2.1 software (Carl Zeiss Microscopy GmbH, Germany) was used for image acquisition.

5. Conclusions

The research demonstrated the effectiveness of supercritical CO2 extraction in isolating bioactive compounds from corn grains (Zea mays L., hybrid Pri-15-7-16). The optimal extraction conditions were determined to be a pressure of 200 bar and a temperature of 55 °C, yielding 2.20 mg/g of bioactive compounds. These results highlight the potential of supercritical CO2 extraction as an efficient method for obtaining valuable bioactive compounds. However, optimizing the extraction process requires balancing temperature, pressure, and extraction time based on the specific target compounds and plant materials.
Metabolomic analysis identified a diverse array of 44 compounds, including 30 polyphenols from various subgroups—flavones, flavan-3-ols, flavonols, polyphenolic acids, and anthocyanidins—as well as compounds from other chemical groups, such as amino acids and fatty acids. This diversity underscores the potential of corn grains as a rich source of bioactive compounds.
Additionally, the distribution of bioactive compounds in corn grain tissues was visualized using confocal laser scanning microscopy, providing insights into their localization. Image analysis showed that the pericarp and aleurone layer cell walls were rich in autofluorescent compounds, while the endosperm cell walls exhibited low autofluorescence. The ability of phenolic compounds to emit autofluorescence enables their detection and analysis in plant cell walls without additional labeling. Understanding the distribution of polyphenolic compounds in plant tissues will aid in developing methods for their direct extraction and further applications in the food, feed, pharmaceutical, and cosmetic industries.

Author Contributions

Conceptualization, M.P.R. and A.B.P.; methodology, M.P.R.; investigation, M.P.R.; resources, M.P.R., P.A.S. and A.A.M.; data curation, M.P.R.; writing—original draft preparation, A.A.M.; writing—review and editing, M.P.R. and A.B.P.; supervision, M.P.R. and L.A.T.; project administration, L.A.T.; funding acquisition, L.A.T. All authors have read and agreed to the published version of the manuscript.

Funding

This research was funded by The Ministry of Science and Higher Education of the Russian Federation, grant number FZNS-2022-0017 “Development of a Package of Technologies for Producing a Bioavailable Protected Form of Feed Vitamin D3 and Biocomplexes Based on It Using Plant and Oceanic Resources to Enhance Productivity and Immune Protection of Farm Animals”.

Data Availability Statement

The data presented in the current study are available in the article.

Acknowledgments

We would like to express our gratitude to the referees for their thoughtful comments and recommendations.

Conflicts of Interest

The authors declare no conflicts of interest.

Appendix A

Table A1. Bioactive compounds identified in supercritical CO2 extracts of corn grains (Zea mays L.) by tandem mass spectrometry (MS/MS) in positive and negative ionization modes.
Classes of CompoundsIdentified Chemical CompoundsChemical FormulaMolar MassIon Adduct [M−H]Ion Adduct [M+H]+First-Order Fragmentation MS/MSSecond-Order Fragmentation MS/MSThird-Order Fragmentation MS/MSSources
Polyphenolic Compounds
1Polyphenolic acidCaffeic acid derivativeC16H18O9Na377.2985377 341; 215179; 113 [63]
2Polyphenolic acidCaffeoylmalic acidC13H12O8296.2296295 277; 171233; 113 [64,65]
3Polyphenolic acid3,4-Diacetoxybenzoic acidC10H11O6238.1935237 119 [64,66]
4Polyphenolic acidHydroxy methoxy dimethylbenzoic acidC10H12O4196.1999 197177; 153125 [67]
5Polyphenolic acidHydroxyferulic acidC10H10O5210.1834 211193; 125 [68]
6Polyphenolic acidCaffeic acid [(2E)-3-(3,4-Dihydroxyphenyl) acrylic acid]C9H8O4180.1574 181135119 [69,70,71]
7StilbeneResveratrol [trans-Resveratrol; 3,4’,5-Trihydroxystilbene; Stilbentriol]C14H12O3228.2433 229209163146[67,72]
8Flavan-3-olEpiafzelechin [(epi)Afzelechin]C15H14O5274.2687 275245; 176175 [67,73,74]
9FlavonolKaempferol [3,5,7-Trihydroxy-2-(4-hydro- xyphenyl)-4H-chromen-4-one]C15H10O6286.2363285 185; 117; 257117 [64,68,75,76,77]
10Flavan-3-olCatechin [D-Catechol]C15H14O6290.2681 291261; 189173; 242191; 143[67,72,78,79,80]
11Flavan-3-ol(epi)catechinC15H14O6290.2681 291261; 173243; 173 [67,72,80]
12FlavonolQuercetinC15H10O7302.2357 303275; 245; 203; 175175 [63,64,75,78]
13Flavan-3-olGallocatechin [+ (-) Gallocatechin]C15H14O7306.2675 307277; 207207; 159 [67,78,79]
14FlavonolMyricetinC15H10O8318.2351 319291; 219; 174259; 191243; 161[71,72,77,81,82]
15FlavoneCirsiliolC17H14O7330.2889329 229; 171; 293211; 155183[83]
16Flavone5,7-Dimetoxy-3,3’,4’-trihydroxyflavoneC17H14O7330.2889 331315; 270313285; 257[84]
17FlavoneLuteolin 7,3’-disulphateC15H10O12S2446.3627 447287152 [85]
18FlavoneApigenin 7-sulfateC15H10O8S350.3001 351337; 308308; 291 [67,86]
19LignanMatairesinol [(-)-Matairesinol; Artigenin Congener]C20H22O6358.3851 359324; 289; 127144127[87]
20Flavan-3-ol derivativeEpiafzelechin 3-O-gallateC22H18O9426.3729 427301; 171; 382171 [80]
21FlavoneApigenin-C-hexosideC21H20O10432.3775 433418; 314; 265; 219; 155257; 169 [88]
22AnthocyanidinPelargonidin-3-O-glucoside (callistephin)C21H21O10433.3854 433271; 185253; 121235[89,90]
23AnthocyanidinCyanidin-3-O-glucoside [Cyanidin 3-O-beta-D-Glucoside; Kuromarin]C21H21O11+449.3848447 285199 [90,91,92]
24FlavoneLuteolin-7-O-beta-glucuronideC21H18O12462.3604 463447; 395; 359; 285; 199; 149287; 199 [93,94]
25FlavonolKaempferol-3-O-glucuronideC21H18O12462.3604 463287; 198269; 198 [65,67,75]
26AnthocyanidinDelphinidin malonyl hexosideC24H23O15551.4304 551465; 287; 185287; 115 [67]
27FlavoneChrysoeriol C-hexoside-C-pentosideC27H30O15594.5181 595578; 536; 509; 425294 [66]
28FlavonolQuercetin 3,4’-di-O-beta-glucopyranoside [Quercetin diglucoside]C27H30O17626.5169 627465447; 405; 303 [64,77,92]
29FlavoneTricin trimethyl ether 7-O-hexosyl-hexosideC30H36O17668.5966 669345; 387; 283 [95]
30Flavan-3-ol(Epi)fisetinidol-(epi)catechin-A-(epi)fisetinidolC45H36O16832.7577831 721; 693; 609; 575; 537; 506 [96]
Compounds of Other Chemical Groups
31Amino acidL-LysineC6H14N2O2146.1876 147119 [76]
32Amino acidL-threanineC7H14N2O3174.1977 175159 [80]
33Amino acidL-Tryptophan [Tryptophan; (S)-Tryptophan]C11H12N2O2204.2252 205161; 159143 [80,97]
34Omega-5 fatty acidMyristoleic acid [Cis-9-Tetradecanoic acid]C14H26O2226.3550 227209; 168127 [67]
35Medium-chain fatty acidHydroxy dodecanoic acidC12H22O5246.3001 247238203174[67]
36Omega-3 fatty acidStearidonic acid [6,9,12,15-Octadecatetraenoic acid; Moroctic acid]C18H28O2276.4137 277259; 177177 [67,75,98]
37Omega-3 fatty acidLinolenic acid (Alpha-Linolenic acid; Linolenate)C18H30O2278.4296 279243; 173173131[98,99]
38DiterpenoidIsocryptotanshinone IIC19H20O3296.3603 297279; 197173 [98]
39Alpha-omega Dicarboxylic acidOctadecanedioic acid [1,16-Hexadecanedicarboxylic acid]C18H34O4314.4602313 295; 183293; 179275; 177[67]
40Unsaturated fatty acidOxo-eicosatetraenoic acidC20H30O3318.4504 319301186 [67]
41Oxylipin13-Trihydroxy-Octadecenoic acid [THODE]C18H34O5330.4596329 171; 211; 293153 [100,101]
42Oxylipin9,12,13-Trihydroxy-trans-10-octadecenoic acidC18H34O5330.4596329 171; 229127 [64]
43Carotenoid(all-E)-lutein 3’-O-myristateC40H54O550.8562 551533; 505; 469;429; 373; 345453; 410 [102]
44Unsaturated fatty acidEicosatetraenedioic acidC20H30O4334.4498 335321; 124291 [67]

References

  1. Mora-Gutierrez, A.; Núñez de González, M.T.; Woldesenbet, S.; Attaie, R.; Jung, Y. Influence of Deliverable Form of Dietary Vitamin D3 on the Immune Response in Late-Lactating Dairy Goats. Dairy 2024, 5, 308–315. [Google Scholar] [CrossRef]
  2. Zafalon, R.V.A.; Ruberti, B.; Rentas, M.F.; Amaral, A.R.; Vendramini, T.H.A.; Chacar, F.C.; Kogika, M.M.; Brunetto, M.A. The Role of Vitamin D in Small Animal Bone Metabolism. Metabolites 2020, 10, 496. [Google Scholar] [CrossRef]
  3. Szymczak, I.; Pawliczak, R. The Active Metabolite of Vitamin D3 as a Potential Immunomodulator. Scand. J. Immunol. 2016, 83, 83–91. [Google Scholar] [CrossRef] [PubMed]
  4. Šimoliūnas, E.; Rinkūnaitė, I.; Bukelskienė, Ž.; Bukelskienė, V. Bioavailability of Different Vitamin D Oral Supplements in Laboratory Animal Model. Medicina 2019, 55, 265. [Google Scholar] [CrossRef]
  5. Jäpelt, R.B.; Jakobsen, J. Vitamin D in Plants: A Review of Occurrence, Analysis, and Biosynthesis. Front. Plant Sci. 2013, 4, 136. [Google Scholar] [CrossRef]
  6. Azevedo, M.A.; Cerqueira, M.A.; Gonçalves, C.; Amado, I.R.; Teixeira, J.A.; Pastrana, L. Encapsulation of Vitamin D3 Using Rhamnolipids-Based Nanostructured Lipid Carriers. Food Chem. 2023, 427, 136654. [Google Scholar] [CrossRef] [PubMed]
  7. Peñuñuri-Pacheco, N.; Moreno-García, Y.A.; González-Ríos, H.; Astiazarán-García, H.; López-Franco, Y.L.; Tortoledo-Ortiz, O.; Pérez-Báez, A.J.; Dávila-Ramírez, J.L.; Lizardi-Mendoza, J.; Valenzuela-Melendres, M. Optimization of the Encapsulation of Vitamin D3 in Oil in Water Nanoemulsions: Preliminary Application in a Functional Meat Model System. Foods 2024, 13, 2842. [Google Scholar] [CrossRef]
  8. Dahiya, D.; Terpou, A.; Dasenaki, M.; Nigam, P.S. Current Status and Future Prospects of Bioactive Molecules Delivered through Sustainable Encapsulation Techniques for Food Fortification. Sustain. Food Technol. 2023, 1, 500–510. [Google Scholar] [CrossRef]
  9. Aggeletopoulou, I.; Kalafateli, M.; Geramoutsos, G.; Triantos, C. Recent Advances in the Use of Vitamin D Organic Nanocarriers for Drug Delivery. Biomolecules 2024, 14, 1090. [Google Scholar] [CrossRef]
  10. Razgonova, M.; Zinchenko, Y.; Pikula, K.; Tekutyeva, L.; Son, O.; Zakharenko, A.; Kalenik, T.; Golokhvast, K. Spatial Distribution of Polyphenolic Compounds in Corn Grains (Zea mays L. var. Pioneer) Studied by Laser Confocal Microscopy and High-Resolution Mass Spectrometry. Plants 2022, 11, 630. [Google Scholar] [CrossRef]
  11. Razgonova, M.P.; Navaz, M.A.; Sabitov, A.S.; Zinchenko, Y.N.; Rusakova, E.A.; Petrusha, E.N.; Golokhvast, K.S.; Tikhonova, N.G. The Global Metabolome Profiles of Four Varieties of Lonicera caerulea, Established via Tandem Mass Spectrometry. Horticulturae 2023, 9, 1188. [Google Scholar] [CrossRef]
  12. Waqas, M.; Salman, M.; Sharif, M.S. Application of Polyphenolic Compounds in Animal Nutrition and Their Promising Effects. J. Anim. Feed Sci. 2023, 32, 233–256. [Google Scholar] [CrossRef]
  13. Godlewska, K.; Pacyga, P.; Szumny, A.; Szymczycha-Madeja, A.; Wełna, M.; Michalak, I. Methods for Rapid Screening of Biologically Active Compounds Present in Plant-Based Extracts. Molecules 2022, 27, 7094. [Google Scholar] [CrossRef] [PubMed]
  14. Tyśkiewicz, K.; Konkol, M.; Rój, E. The Application of Supercritical Fluid Extraction in Phenolic Compounds Isolation from Natural Plant Materials. Molecules 2018, 23, 2625. [Google Scholar] [CrossRef]
  15. Serra, V.; Salvatori, G.; Pastorelli, G. Dietary Polyphenol Supplementation in Food Producing Animals: Effects on the Quality of Derived Products. Animals 2021, 11, 401. [Google Scholar] [CrossRef]
  16. Salinas-Moreno, Y.; García-Salinas, C.; Ramírez-Díaz, J.L.; Alemán-de la Torre, I. Phenolic Compounds in Maize Grains and Its Nixtamalized Products. In Phenolic Compounds-Natural Sources, Importance and Applications; InTech: Hong Kong, China, 2017. [Google Scholar]
  17. Siyuan, S.; Tong, L.; Liu, R. Corn Phytochemicals and Their Health Benefits. Food Sci. Hum. Wellness 2018, 7, 185–195. [Google Scholar] [CrossRef]
  18. Kim, J.-T.; Chung, I.-M.; Kim, M.-J.; Lee, J.-S.; Son, B.-Y.; Bae, H.-H.; Go, Y.S.; Kim, S.-L.; Baek, S.-B.; Kim, S.-H.; et al. Comparison of Antioxidant Activity Assays in Fresh Purple Waxy Corn (Zea mays L.) during Grain Filling. Appl. Biol. Chem. 2022, 65, 1. [Google Scholar] [CrossRef]
  19. Chen, L.; Guo, Y.; Li, X.; Gong, K.; Liu, K. Phenolics and Related in Vitro Functional Activities of Different Varieties of Fresh Waxy Corn: A Whole Grain. BMC Chem. 2021, 15, 14. [Google Scholar] [CrossRef]
  20. Hu, Q.; Xu, J. Profiles of Carotenoids, Anthocyanins, Phenolics, and Antioxidant Activity of Selected Color Waxy Corn Grains during Maturation. J. Agric. Food Chem. 2011, 59, 2026–2033. [Google Scholar] [CrossRef]
  21. Piazza, S.; Bani, C.; Colombo, F.; Mercogliano, F.; Pozzoli, C.; Martinelli, G.; Petroni, K.; Roberto Pilu, S.; Sonzogni, E.; Fumagalli, M.; et al. Pigmented Corn as a Gluten-Free Source of Polyphenols with Anti-Inflammatory and Antioxidant Properties in CaCo-2 Cells. Food Res. Int. 2024, 191, 114640. [Google Scholar] [CrossRef]
  22. Feregrino-Pérez, A.A.; Mercado-Luna, A.; Murillo-Cárdenas, C.A.; González-Santos, R.; Chávez-Servín, J.L.; Vargas-Madriz, A.F.; Luna-Sánchez, E. Polyphenolic Compounds and Antioxidant Capacity in Native Maize of the Sierra Gorda of Querétaro. Agronomy 2024, 14, 142. [Google Scholar] [CrossRef]
  23. Chen, Z.; Świsłocka, R.; Choińska, R.; Marszałek, K.; Dąbrowska, A.; Lewandowski, W.; Lewandowska, H. Exploring the Correlation Between the Molecular Structure and Biological Activities of Metal–Phenolic Compound Complexes: Research and Description of the Role of Metal Ions in Improving the Antioxidant Activities of Phenolic Compounds. Int. J. Mol. Sci. 2024, 25, 11775. [Google Scholar] [CrossRef] [PubMed]
  24. Chen, J.; Yang, J.; Ma, L.; Li, J.; Shahzad, N.; Kim, C.K. Structure-Antioxidant Activity Relationship of Methoxy, Phenolic Hydroxyl, and Carboxylic Acid Groups of Phenolic Acids. Sci. Rep. 2020, 10, 2611. [Google Scholar] [CrossRef]
  25. Kuś, P.M.; Okińczyc, P.; Jakovljević, M.; Jokić, S.; Jerković, I. Development of Supercritical CO2 Extraction of Bioactive Phytochemicals from Black Poplar (Populus nigra L.) Buds Followed by GC–MS and UHPLC-DAD-QqTOF-MS. J. Pharm. Biomed. Anal. 2018, 158, 15–27. [Google Scholar] [CrossRef] [PubMed]
  26. Razgonova, M.P.; Nawaz, M.A.; Ivanova, E.P.; Cherevach, E.I.; Golokhvast, K.S. Supercritical CO2-Based Extraction and Detection of Phenolic Compounds and Saponins from the Leaves of Three Medicago varia Mart. Varieties by Tandem Mass Spectrometry. Processes 2024, 12, 1041. [Google Scholar] [CrossRef]
  27. Kuś, P.; Jerković, I.; Jakovljević, M.; Jokić, S. Extraction of Bioactive Phenolics from Black Poplar (Populus nigra L.) Buds by Supercritical CO2 and Its Optimization by Response Surface Methodology. J. Pharm. Biomed. Anal. 2018, 152, 128–136. [Google Scholar] [CrossRef]
  28. Razgonova, M.; Zakharenko, A.; Shin, T.-S.; Chung, G.; Golokhvast, K. Supercritical CO2 Extraction and Identification of Ginsenosides in Russian and North Korean Ginseng by HPLC with Tandem Mass Spectrometry. Molecules 2020, 25, 1407. [Google Scholar] [CrossRef]
  29. Razgonova, M.P.; Cherevach, E.I.; Tekutyeva, L.A.; Fedoreyev, S.A.; Mishchenko, N.P.; Tarbeeva, D.V.; Demidova, E.N.; Kirilenko, N.S.; Golokhvast, K. Maackia Amurensis Rupr. et Maxim.: Supercritical CO2 Extraction and Mass Spectrometric Characterization of Chemical Constituents. Molecules 2023, 28, 2026. [Google Scholar] [CrossRef]
  30. Zakharenko, A.M.; Razgonova, M.P.; Pikula, K.S.; Golokhvast, K.S. Simultaneous Determination of 78 Compounds of Rhodiola rosea Extract by Supercritical CO2-Extraction and HPLC-ESI-MS/MS Spectrometry. Biochem. Res. Int. 2021, 2021, 9957490. [Google Scholar] [CrossRef]
  31. Essien, S.O.; Young, B.; Baroutian, S. Recent Advances in Subcritical Water and Supercritical Carbon Dioxide Extraction of Bioactive Compounds from Plant Materials. Trends Food Sci. Technol. 2020, 97, 156–169. [Google Scholar] [CrossRef]
  32. Pimentel-Moral, S.; Borrás-Linares, I.; Lozano-Sánchez, J.; Arráez-Román, D.; Martínez-Férez, A.; Segura-Carretero, A. Supercritical CO2 Extraction of Bioactive Compounds from Hibiscus Sabdariffa. J. Supercrit. Fluids 2019, 147, 213–221. [Google Scholar] [CrossRef]
  33. Molino, A.; Larocca, V.; Di Sanzo, G.; Martino, M.; Casella, P.; Marino, T.; Karatza, D.; Musmarra, D. Extraction of Bioactive Compounds Using Supercritical Carbon Dioxide. Molecules 2019, 24, 782. [Google Scholar] [CrossRef]
  34. Villacís-Chiriboga, J.; Voorspoels, S.; Uyttebroek, M.; Ruales, J.; Van Camp, J.; Vera, E.; Elst, K. Supercritical CO2 Extraction of Bioactive Compounds from Mango (Mangifera indica L.) Peel and Pulp. Foods 2021, 10, 2201. [Google Scholar] [CrossRef]
  35. Razgonova, M.; Zakharenko, A.; Ercisli, S.; Grudev, V.; Golokhvast, K. Comparative Analysis of Far East Sikhotinsky Rhododendron (Rh. sichotense) and East Siberian Rhododendron (Rh. adamsii) Using Supercritical CO2-Extraction and HPLC-ESI-MS/MS Spectrometry. Molecules 2020, 25, 3774. [Google Scholar] [CrossRef] [PubMed]
  36. Razgonova, M.P.; Tekutyeva, L.A.; Podvolotskaya, A.B.; Stepochkina, V.D.; Zakharenko, A.M.; Golokhvast, K. Zostera marina L.: Supercritical CO2-Extraction and Mass Spectrometric Characterization of Chemical Constituents Recovered from Seagrass. Separations 2022, 9, 182. [Google Scholar] [CrossRef]
  37. Marinho, C.M.; Lemos, C.O.T.; Arvelos, S.; de Souza Barrozo, M.A.; Hori, C.E.; Watanabe, É.O. Extraction of Corn Germ Oil with Supercritical CO2 and Cosolvents. J. Food Sci. Technol. 2019, 56, 4448–4456. [Google Scholar] [CrossRef]
  38. Monroy, Y.M.; Rodrigues, R.A.F.; Sartoratto, A.; Cabral, F.A. Optimization of the Extraction of Phenolic Compounds from Purple Corn Cob (Zea mays L.) by Sequential Extraction Using Supercritical Carbon Dioxide, Ethanol and Water as Solvents. J. Supercrit. Fluids 2016, 116, 10–19. [Google Scholar] [CrossRef]
  39. Razgonova, M.P.; Zakharenko, A.M.; Golokhvast, K.S. Investigation of the Supercritical CO2 Extracts of Wild Ledum palustre L. (Rhododendron tomentosum Harmaja) and Identification of Its Metabolites by Tandem Mass Spectrometry. Russ. J. Bioorganic Chem. 2023, 49, 1645–1657. [Google Scholar] [CrossRef]
  40. Berger, M.; Devaux, M.-F.; Legland, D.; Barron, C.; Delord, B.; Guillon, F. Darkfield and Fluorescence Macrovision of a Series of Large Images to Assess Anatomical and Chemical Tissue Variability in Whole Cross-Sections of Maize Stems. Front. Plant Sci. 2021, 12, 792981. [Google Scholar] [CrossRef]
  41. Corcel, M.; Devaux, M.-F.; Guillon, F.; Barron, C. Comparison of UV and Visible Autofluorescence of Wheat Grain Tissues in Macroscopic Images of Cross-Sections and Particles. Comput. Electron. Agric. 2016, 127, 281–288. [Google Scholar] [CrossRef]
  42. Razgonova, M.P.; Zinchenko, Y.N.; Kozak, D.K.; Kuznetsova, V.A.; Zakharenko, A.M.; Ercisli, S.; Golokhvast, K.S. Autofluorescence-Based Investigation of Spatial Distribution of Phenolic Compounds in Soybeans Using Confocal Laser Microscopy and a High-Resolution Mass Spectrometric Approach. Molecules 2022, 27, 8228. [Google Scholar] [CrossRef] [PubMed]
  43. Razgonova, M.P.; Burlyaeva, M.O.; Zinchenko, Y.N.; Krylova, E.A.; Chunikhina, O.A.; Ivanova, N.M.; Zakharenko, A.M.; Golokhvast, K.S. Identification and Spatial Distribution of Bioactive Compounds in Seeds Vigna unguiculata (L.) Walp. by Laser Microscopy and Tandem Mass Spectrometry. Plants 2022, 11, 2147. [Google Scholar] [CrossRef] [PubMed]
  44. Donaldson, L.; Radotić, K.; Kalauzi, A.; Djikanović, D.; Jeremić, M. Quantification of Compression Wood Severity in Tracheids of Pinus Radiata D. Don Using Confocal Fluorescence Imaging and Spectral Deconvolution. J. Struct. Biol. 2010, 169, 106–115. [Google Scholar] [CrossRef] [PubMed]
  45. Donaldson, L. Softwood and Hardwood Lignin Fluorescence Spectra of Wood Cell Walls in Different Mounting Media. IAWA J. 2013, 34, 3–19. [Google Scholar] [CrossRef]
  46. Donaldson, L. Autofluorescence in Plants. Molecules 2020, 25, 2393. [Google Scholar] [CrossRef]
  47. Donaldson, L.; Williams, N. Imaging and Spectroscopy of Natural Fluorophores in Pine Needles. Plants 2018, 7, 10. [Google Scholar] [CrossRef]
  48. Roshchina, V.V.; Kuchin, A.V.; Yashin, V.A. Application of Autofluorescence for Analysis of Medicinal Plants. Int. J. Spectrosc. 2017, 2017, 7159609. [Google Scholar] [CrossRef]
  49. Sudo, E.; Teranishi, M.; Hidema, J.; Taniuchi, T. Visualization of Flavonol Distribution in the Abaxial Epidermis of Onion Scales via Detection of Its Autofluorescence in the Absence of Chemical Processes. Biosci. Biotechnol. Biochem. 2009, 73, 2107–2109. [Google Scholar] [CrossRef]
  50. Monago-Maraña, O.; Durán-Merás, I.; Galeano-Díaz, T.; Muñoz de la Peña, A. Fluorescence Properties of Flavonoid Compounds. Quantification in Paprika Samples Using Spectrofluorimetry Coupled to Second Order Chemometric Tools. Food Chem. 2016, 196, 1058–1065. [Google Scholar] [CrossRef]
  51. Talamond, P.; Verdeil, J.-L.; Conéjéro, G. Secondary Metabolite Localization by Autofluorescence in Living Plant Cells. Molecules 2015, 20, 5024–5037. [Google Scholar] [CrossRef]
  52. Mackon, E.; Ma, Y.; Jeazet Dongho Epse Mackon, G.C.; Li, Q.; Zhou, Q.; Liu, P. Subcellular Localization and Vesicular Structures of Anthocyanin Pigmentation by Fluorescence Imaging of Black Rice (Oryza sativa L.) Stigma Protoplast. Plants 2021, 10, 685. [Google Scholar] [CrossRef] [PubMed]
  53. Collings, D.A. Anthocyanin in the Vacuole of Red Onion Epidermal Cells Quenches Other Fluorescent Molecules. Plants 2019, 8, 596. [Google Scholar] [CrossRef] [PubMed]
  54. Corcel, M.; Devaux, M.-F.; Guillon, F.; Barron, C. Identification of Tissular Origin of Particles Based on Autofluorescence Multispectral Image Analysis at the Macroscopic Scale. EPJ Web Conf. 2017, 140, 05012. [Google Scholar] [CrossRef]
  55. Lichtenthaler, H.K.; Schweiger, J. Cell Wall Bound Ferulic Acid, the Major Substance of the Blue-Green Fluorescence Emission of Plants. J. Plant Physiol. 1998, 152, 272–282. [Google Scholar] [CrossRef]
  56. Rudall, P. Investigation of the Presence of Phenolic Compounds in Monocotyledonous Cell Walls, Using UV Fluorescence Microscopy. Ann. Bot. 1994, 74, 483–491. [Google Scholar] [CrossRef]
  57. Antoine, C.; Peyron, S.; Mabille, F.; Lapierre, C.; Bouchet, B.; Abecassis, J.; Rouau, X. Individual Contribution of Grain Outer Layers and Their Cell Wall Structure to the Mechanical Properties of Wheat Bran. J. Agric. Food Chem. 2003, 51, 2026–2033. [Google Scholar] [CrossRef]
  58. Vanholme, R.; De Meester, B.; Ralph, J.; Boerjan, W. Lignin Biosynthesis and Its Integration into Metabolism. Curr. Opin. Biotechnol. 2019, 56, 230–239. [Google Scholar] [CrossRef] [PubMed]
  59. Philippe, S.; Tranquet, O.; Utille, J.-P.; Saulnier, L.; Guillon, F. Investigation of Ferulate Deposition in Endosperm Cell Walls of Mature and Developing Wheat Grains by Using a Polyclonal Antibody. Planta 2007, 225, 1287–1299. [Google Scholar] [CrossRef]
  60. Das, A.K.; Singh, V. Antioxidative Free and Bound Phenolic Constituents in Pericarp, Germ and Endosperm of Indian Dent (Zea mays var. indentata) and Flint (Zea mays var. indurata) Maize. J. Funct. Foods 2015, 13, 363–374. [Google Scholar] [CrossRef]
  61. Hernanz, D.; Nuñez, V.; Sancho, A.I.; Faulds, C.B.; Williamson, G.; Bartolomé, B.; Gómez-Cordovés, C. Hydroxycinnamic Acids and Ferulic Acid Dehydrodimers in Barley and Processed Barley. J. Agric. Food Chem. 2001, 49, 4884–4888. [Google Scholar] [CrossRef]
  62. Rhodes, D.I.; Sadek, M.; Stone, B.A. Hydroxycinnamic Acids in Walls of Wheat Aleurone Cells. J. Cereal Sci. 2002, 36, 67–81. [Google Scholar] [CrossRef]
  63. El-sayed, M.; Abbas, F.; Refaat, S.; El-Shafae, A.; Fikry, E. UPLC-ESI-MS/MS Profile of The Ethyl Acetate Fraction of Aerial Parts of Bougainvillea “Scarlett O’Hara” Cultivated in Egypt. Egypt. J. Chem. 2020, 64, 793–806. [Google Scholar] [CrossRef]
  64. Rodríguez-Pérez, C.; Gómez-Caravaca, A.M.; Guerra-Hernández, E.; Cerretani, L.; García-Villanova, B.; Verardo, V. Comprehensive Metabolite Profiling of Solanum tuberosum L. (Potato) Leaves by HPLC-ESI-QTOF-MS. Food Res. Int. 2018, 112, 390–399. [Google Scholar] [CrossRef]
  65. Spínola, V.; Pinto, J.; Castilho, P.C. Identification and Quantification of Phenolic Compounds of Selected Fruits from Madeira Island by HPLC-DAD–ESI-MSn and Screening for Their Antioxidant Activity. Food Chem. 2015, 173, 14–30. [Google Scholar] [CrossRef]
  66. Stallmann, J.; Schweiger, R.; Pons, C.A.A.; Müller, C. Wheat Growth, Applied Water Use Efficiency and Flag Leaf Metabolome under Continuous and Pulsed Deficit Irrigation. Sci. Rep. 2020, 10, 10112. [Google Scholar] [CrossRef] [PubMed]
  67. Hamed, A.R.; El-Hawary, S.S.; Ibrahim, R.M.; Abdelmohsen, U.R.; El-Halawany, A.M. Identification of Chemopreventive Components from Halophytes Belonging to Aizoaceae and Cactaceae Through LC/MS—Bioassay Guided Approach. J. Chromatogr. Sci. 2021, 59, 618–626. [Google Scholar] [CrossRef]
  68. Aita, S.; Capriotti, A.; Cavaliere, C.; Cerrato, A.; Giannelli Moneta, B.; Montone, C.; Piovesana, S.; Laganà, A. Andean Blueberry of the Genus Disterigma: A High-Resolution Mass Spectrometric Approach for the Comprehensive Characterization of Phenolic Compounds. Separations 2021, 8, 58. [Google Scholar] [CrossRef]
  69. Santos, S.A.O.; Freire, C.S.R.; Domingues, M.R.M.; Silvestre, A.J.D.; Neto, C.P. Characterization of Phenolic Components in Polar Extracts of Eucalyptus Globulus Labill. Bark by High-Performance Liquid Chromatography–Mass Spectrometry. J. Agric. Food Chem. 2011, 59, 9386–9393. [Google Scholar] [CrossRef]
  70. Domingues, R.M.A.; Sousa, G.D.A.; Silva, C.M.; Freire, C.S.R.; Silvestre, A.J.D.; Neto, C.P. High Value Triterpenic Compounds from the Outer Barks of Several Eucalyptus Species Cultivated in Brazil and in Portugal. Ind. Crops Prod. 2011, 33, 158–164. [Google Scholar] [CrossRef]
  71. Jiang, R.-W.; Lau, K.-M.; Hon, P.-M.; Mak, T.; Woo, K.-S.; Fung, K.-P. Chemistry and Biological Activities of Caffeic Acid Derivatives from Salvia Miltiorrhiza. Curr. Med. Chem. 2005, 12, 237–246. [Google Scholar] [CrossRef]
  72. Zhu, Z.; Li, J.; Gao, X.; Amponsem, E.; Kang, L.; Hu, L.; Zhang, B.; Chang, Y. Simultaneous Determination of Stilbenes, Phenolic Acids, Flavonoids and Anthraquinones in Radix Polygoni Multiflori by LC–MS/MS. J. Pharm. Biomed. Anal. 2012, 62, 162–166. [Google Scholar] [CrossRef] [PubMed]
  73. Marcía-Fuentes, J.; Santos-Aleman, R.; Borrás-Linares, I.; Sánchez, J.L. The Carao (Cassia grandis L.): Its Potential Usage in Pharmacological, Nutritional, and Medicinal Applications. In Innovations in Biotechnology for a Sustainable Future; Springer International Publishing: Cham, Switzerland, 2021; pp. 403–427. [Google Scholar]
  74. Sobeh, M.; Mahmoud, M.F.; Abdelfattah, M.A.O.; Cheng, H.; El-Shazly, A.M.; Wink, M. A Proanthocyanidin-Rich Extract from Cassia abbreviata Exhibits Antioxidant and Hepatoprotective Activities In Vivo. J. Ethnopharmacol. 2018, 213, 38–47. [Google Scholar] [CrossRef]
  75. Abu-Reidah, I.M.; Ali-Shtayeh, M.S.; Jamous, R.M.; Arráez-Román, D.; Segura-Carretero, A. HPLC–DAD–ESI-MS/MS Screening of Bioactive Components from Rhus coriaria L. (Sumac) Fruits. Food Chem. 2015, 166, 179–191. [Google Scholar] [CrossRef] [PubMed]
  76. Cai, Z.; Wang, C.; Zou, L.; Liu, X.; Chen, J.; Tan, M.; Mei, Y.; Wei, L. Comparison of Multiple Bioactive Constituents in the Flower and the Caulis of Lonicera Japonica Based on UFLC-QTRAP-MS/MS Combined with Multivariate Statistical Analysis. Molecules 2019, 24, 1936. [Google Scholar] [CrossRef] [PubMed]
  77. Oertel, A.; Matros, A.; Hartmann, A.; Arapitsas, P.; Dehmer, K.J.; Martens, S.; Mock, H.-P. Metabolite Profiling of Red and Blue Potatoes Revealed Cultivar and Tissue Specific Patterns for Anthocyanins and Other Polyphenols. Planta 2017, 246, 281–297. [Google Scholar] [CrossRef]
  78. Chandrasekara, A.; Shahidi, F. Bioactivities and Antiradical Properties of Millet Grains and Hulls. J. Agric. Food Chem. 2011, 59, 9563–9571. [Google Scholar] [CrossRef]
  79. Sobeh, M.; Mahmoud, M.; Hasan, R.; Cheng, H.; El-Shazly, A.; Wink, M. Senna Singueana: Antioxidant, Hepatoprotective, Antiapoptotic Properties and Phytochemical Profiling of a Methanol Bark Extract. Molecules 2017, 22, 1502. [Google Scholar] [CrossRef]
  80. Qin, D.; Wang, Q.; Li, H.; Jiang, X.; Fang, K.; Wang, Q.; Li, B.; Pan, C.; Wu, H. Identification of Key Metabolites Based on Non-Targeted Metabolomics and Chemometrics Analyses Provides Insights into Bitterness in Kucha [Camellia kucha (Chang et Wang) Chang]. Food Res. Int. 2020, 138, 109789. [Google Scholar] [CrossRef]
  81. Zhou, X.-J.; Yan, L.-L.; Yin, P.-P.; Shi, L.-L.; Zhang, J.-H.; Liu, Y.-J.; Ma, C. Structural Characterisation and Antioxidant Activity Evaluation of Phenolic Compounds from Cold-Pressed Perilla frutescens var. arguta Seed Flour. Food Chem. 2014, 164, 150–157. [Google Scholar] [CrossRef]
  82. Paudel, L.; Wyzgoski, F.J.; Scheerens, J.C.; Chanon, A.M.; Reese, R.N.; Smiljanic, D.; Wesdemiotis, C.; Blakeslee, J.J.; Riedl, K.M.; Rinaldi, P.L. Nonanthocyanin Secondary Metabolites of Black Raspberry (Rubus occidentalis L.) Fruits: Identification by HPLC-DAD, NMR, HPLC-ESI-MS, and ESI-MS/MS Analyses. J. Agric. Food Chem. 2013, 61, 12032–12043. [Google Scholar] [CrossRef]
  83. Pandey, V.; Ansari, M.W.; Tula, S.; Sahoo, R.K.; Bains, G.; Kumar, J.; Tuteja, N.; Shukla, A. Ocimum Sanctum Leaf Extract Induces Drought Stress Tolerance in Rice. Plant Signal Behav. 2016, 11, e1150400. [Google Scholar] [CrossRef]
  84. Prasad Pandey, B.; Prakash Pradhan, S.; Adhikari, K. LC-ESI-QTOF-MS for the Profiling of the Metabolites and In Vitro Enzymes Inhibition Activity of Bryophyllum pinnatum and Oxalis corniculata Collected from Ramechhap District of Nepal. Chem. Biodivers. 2020, 17, e2000155. [Google Scholar] [CrossRef] [PubMed]
  85. Enerstvedt, K.H.; Jordheim, M.; Andersen, Ø.M. Isolation and Identification of Flavonoids Found in Zostera marina Collected in Norwegian Coastal Waters. Am. J. Plant Sci. 2016, 7, 1163–1172. [Google Scholar] [CrossRef]
  86. Teles, Y.; Souza, M.; Souza, M. Sulphated Flavonoids: Biosynthesis, Structures, and Biological Activities. Molecules 2018, 23, 480. [Google Scholar] [CrossRef] [PubMed]
  87. Smeds, A.I.; Eklund, P.C.; Sjöholm, R.E.; Willför, S.M.; Nishibe, S.; Deyama, T.; Holmbom, B.R. Quantification of a Broad Spectrum of Lignans in Cereals, Oilseeds, and Nuts. J. Agric. Food Chem. 2007, 55, 1337–1346. [Google Scholar] [CrossRef]
  88. Quifer-Rada, P.; Vallverdú-Queralt, A.; Martínez-Huélamo, M.; Chiva-Blanch, G.; Jáuregui, O.; Estruch, R.; Lamuela-Raventós, R. A Comprehensive Characterisation of Beer Polyphenols by High Resolution Mass Spectrometry (LC–ESI-LTQ-Orbitrap-MS). Food Chem. 2015, 169, 336–343. [Google Scholar] [CrossRef]
  89. Dinelli, G.; Segura-Carretero, A.; Di Silvestro, R.; Marotti, I.; Arráez-Román, D.; Benedettelli, S.; Ghiselli, L.; Fernadez-Gutierrez, A. Profiles of Phenolic Compounds in Modern and Old Common Wheat Varieties Determined by Liquid Chromatography Coupled with Time-of-Flight Mass Spectrometry. J. Chromatogr. A 2011, 1218, 7670–7681. [Google Scholar] [CrossRef] [PubMed]
  90. Garg, M.; Chawla, M.; Chunduri, V.; Kumar, R.; Sharma, S.; Sharma, N.K.; Kaur, N.; Kumar, A.; Mundey, J.K.; Saini, M.K.; et al. Transfer of Grain Colors to Elite Wheat Cultivars and Their Characterization. J. Cereal Sci. 2016, 71, 138–144. [Google Scholar] [CrossRef]
  91. Vera de Rosso, V.; Hillebrand, S.; Cuevas Montilla, E.; Bobbio, F.O.; Winterhalter, P.; Mercadante, A.Z. Determination of Anthocyanins from Acerola (Malpighia emarginata DC.) and Açai (Euterpe oleracea Mart.) by HPLC–PDA–MS/MS. J. Food Compos. Anal. 2008, 21, 291–299. [Google Scholar] [CrossRef]
  92. Yin, N.-W.; Wang, S.-X.; Jia, L.-D.; Zhu, M.-C.; Yang, J.; Zhou, B.-J.; Yin, J.-M.; Lu, K.; Wang, R.; Li, J.-N.; et al. Identification and Characterization of Major Constituents in Different-Colored Rapeseed Petals by UPLC–HESI-MS/MS. J. Agric. Food Chem. 2019, 67, 11053–11065. [Google Scholar] [CrossRef]
  93. Xu, L.-L.; Xu, J.-J.; Zhong, K.-R.; Shang, Z.-P.; Wang, F.; Wang, R.-F.; Zhang, L.; Zhang, J.-Y.; Liu, B. Analysis of Non-Volatile Chemical Constituents of Menthae Haplocalycis Herba by Ultra-High Performance Liquid Chromatography-High Resolution Mass Spectrometry. Molecules 2017, 22, 1756. [Google Scholar] [CrossRef]
  94. Thomford, N.; Dzobo, K.; Chopera, D.; Wonkam, A.; Maroyi, A.; Blackhurst, D.; Dandara, C. In Vitro Reversible and Time-Dependent CYP450 Inhibition Profiles of Medicinal Herbal Plant Extracts Newbouldia laevis and Cassia abbreviata: Implications for Herb-Drug Interactions. Molecules 2016, 21, 891. [Google Scholar] [CrossRef] [PubMed]
  95. Wojakowska, A.; Perkowski, J.; Góral, T.; Stobiecki, M. Structural Characterization of Flavonoid Glycosides from Leaves of Wheat (Triticum aestivum L.) Using LC/MS/MS Profiling of the Target Compounds. J. Mass Spectrom. 2013, 48, 329–339. [Google Scholar] [CrossRef] [PubMed]
  96. Mateos-Martín, M.L.; Fuguet, E.; Jiménez-Ardón, A.; Herrero-Uribe, L.; Tamayo-Castillo, G.; Torres, J.L. Identification of Polyphenols from Antiviral Chamaecrista nictitans Extract Using High-Resolution LC–ESI–MS/MS. Anal. Bioanal. Chem. 2014, 406, 5501–5506. [Google Scholar] [CrossRef]
  97. Perchuk, I.; Shelenga, T.; Gurkina, M.; Miroshnichenko, E.; Burlyaeva, M. Composition of Primary and Secondary Metabolite Compounds in Seeds and Pods of Asparagus Bean (Vigna unguiculata (L.) Walp.) from China. Molecules 2020, 25, 3778. [Google Scholar] [CrossRef]
  98. Zhang, G.; Tian, Y.; Zhang, J.; Shu, L.; Yang, S.; Wang, W.; Sheng, J.; Dong, Y.; Chen, W. Hybrid de Novo Genome Assembly of the Chinese Herbal Plant Danshen (Salvia miltiorrhiza Bunge). Gigascience 2015, 4, 62. [Google Scholar] [CrossRef] [PubMed]
  99. Ekeberg, D.; Flæte, P.-O.; Eikenes, M.; Fongen, M.; Naess-Andresen, C.F. Qualitative and Quantitative Determination of Extractives in Heartwood of Scots Pine (Pinus sylvestris L.) by Gas Chromatography. J. Chromatogr. A 2006, 1109, 267–272. [Google Scholar] [CrossRef]
  100. Llorent-Martínez, E.J.; Spínola, V.; Gouveia, S.; Castilho, P.C. HPLC-ESI-MSn Characterization of Phenolic Compounds, Terpenoid Saponins, and Other Minor Compounds in Bituminaria bituminosa. Ind. Crops Prod. 2015, 69, 80–90. [Google Scholar] [CrossRef]
  101. Park, S.K.; Ha, J.S.; Kim, J.M.; Kang, J.Y.; Lee, D.S.; Guo, T.J.; Lee, U.; Kim, D.-O.; Heo, H.J. Antiamnesic Effect of Broccoli (Brassica oleracea var. italica) Leaves on Amyloid Beta (Aβ)1–42-Induced Learning and Memory Impairment. J. Agric. Food Chem. 2016, 64, 3353–3361. [Google Scholar] [CrossRef]
  102. Rodrigues, D.B.; Mariutti, L.R.B.; Mercadante, A.Z. An in Vitro Digestion Method Adapted for Carotenoids and Carotenoid Esters: Moving Forward towards Standardization. Food Funct. 2016, 7, 4992–5001. [Google Scholar] [CrossRef]
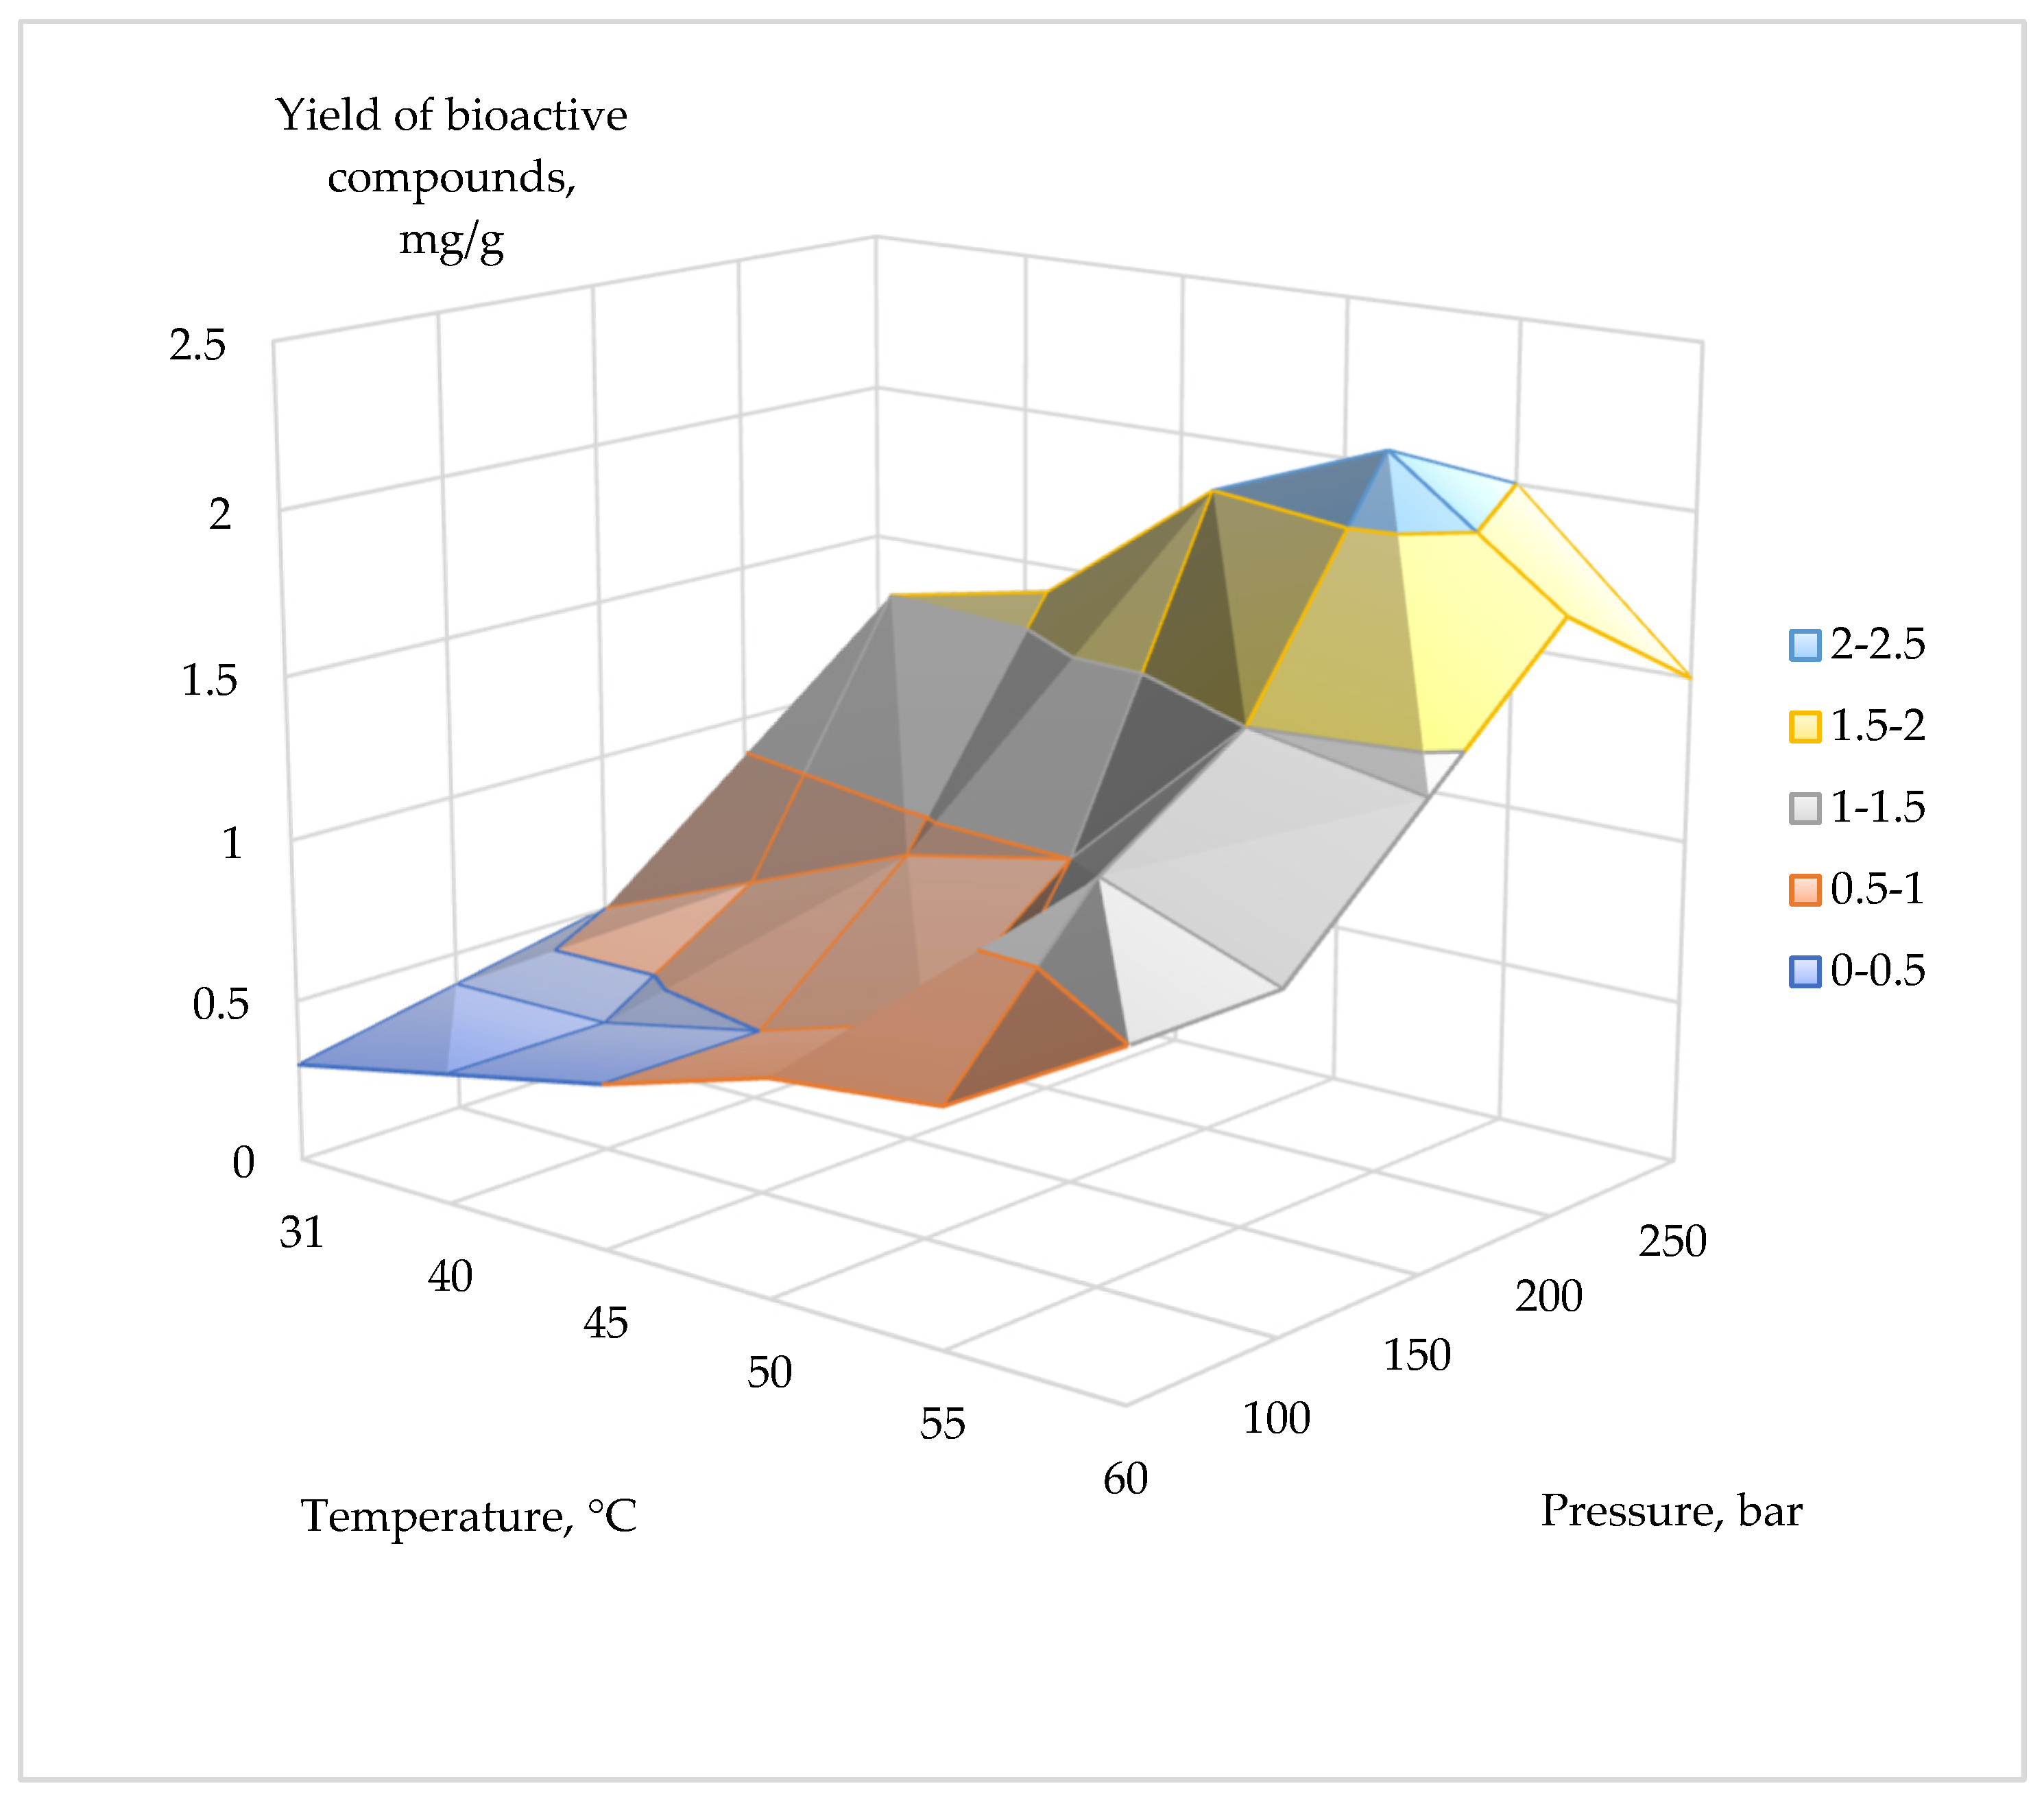
Figure 1. Three-dimensional graph of total yield of bioactive compounds during supercritical CO2 extraction of corn grains (Zea mays L., hybrid Pri-15-7-16) depending on pressure and temperature.
Plants 14 00913 g001
Figure 2. Multispectral image of corn grains (Zea mays L., hybrid Pri-15-7-16): (a) longitudinal section of the seed base (near the attachment point to the cob), 20× magnification; (b) longitudinal section, 20× magnification; and (c) transverse section of the distal edge of the grain, 63× magnification. Excitation with a UV laser (405 nm) with emission in the range of 400–475 nm (blue); and excitation with a blue laser (488 nm) with emission in the ranges of 410–545 nm (green) and 575–617 nm (yellow).
Plants 14 00913 g002
Figure 3. Monospectral images of corn grains (Zea mays L., hybrid Pri-15-7-16): (a) longitudinal section of the seed base (near the attachment point to the cob), 20× magnification; (b) longitudinal section, 20× magnification; and (c) transverse section of the distal edge of the grain, 63× magnification. Excitation with a blue laser (488 nm) with emission in the range of 410–545 nm (green autofluorescence).
Plants 14 00913 g003
Figure 4. Monospectral images of corn grains (Zea mays L., hybrid Pri-15-7-16): (a) longitudinal section, 20× magnification; and (b) transverse section of the distal edge of the grain, 63× magnification. Excitation with a blue laser (488 nm) with emission in the range of 575–617 nm (yellow autofluorescence).
Plants 14 00913 g004
Figure 5. Monospectral images of corn grains (Zea mays L., hybrid Pri-15-7-16): (a) longitudinal section of the seed base (near the attachment point to the cob), 20× magnification; (b) longitudinal section, 20× magnification; and (c) transverse section of the distal edge of the grain, 63× magnification. Excitation with a blue laser (488 nm) with emission in the range of 620–700 nm (red autofluorescence).
Plants 14 00913 g005
Figure 6. Monospectral images of corn grains (Zea mays L., hybrid Pri-15-7-16): (a) longitudinal section, 20× magnification; and (b) transverse section of the distal edge of the grain, 63× magnification. Excitation with a UV (405 nm) with emission in the range of 400–475 nm (blue autofluorescence).
Plants 14 00913 g006
Table 1. Yield of bioactive compounds (mg/g) from corn grains (Zea mays L., hybrid Pri-15-7-16) under various pressure and temperature conditions during supercritical CO2 extraction.
Temperature, °C50 bar100 bar150 bar200 bar250 bar
310.300.400.500.561.00
400.400.400.701.501.30
450.500.500.901.601.50
500.650.651.002.001.80
550.701.201.502.202.00
601.001.001.401.801.50
Disclaimer/Publisher’s Note: The statements, opinions and data contained in all publications are solely those of the individual author(s) and contributor(s) and not of MDPI and/or the editor(s). MDPI and/or the editor(s) disclaim responsibility for any injury to people or property resulting from any ideas, methods, instructions or products referred to in the content.

