Article

Mapping Genomic Regions for Grain Protein Content and Quality Traits in Milled Rice (Oryza sativa L.)

1
Agricultural College, Acharya NG Ranga Agricultural University, Bapatla 522101, India
2
Regional Agricultural Research Station (RARS), Maruteru 534122, India
3
ICAR—Indian Institute of Rice Research, Rajendranagar, Hyderabad 500030, India
*
Author to whom correspondence should be addressed.
Plants 2025, 14(6), 905; https://doi.org/10.3390/plants14060905
Submission received: 24 January 2025 / Revised: 18 February 2025 / Accepted: 24 February 2025 / Published: 14 March 2025
(This article belongs to the Collection Crop Genomics and Breeding)

Abstract

Grain protein content (GPC) is gaining attention due to increasing consumer demand for nutritious foods. The present study carried out at ICAR-IIRR, Hyderabad, focused on the identification of quantitative trait loci (QTLs) linked with GPC and other quality traits. We utilized a population of 188 F2 individuals developed from BPT 5204 (low GPC) X JAK 686 (high GPC) for QTL analysis. QTL analysis yielded four significant QTLs for GPC, three for amylose content, and multiple QTLs for other quality traits. qPC1.2, a major QTL in milled rice, was located in the marker interval RM562-RM11307 on chromosome 1 with an LOD value of 4.4. qPC1.2 explained 15.71% of the phenotypic variance (PVE). Additionally, the Interval Mapping for Epistatic QTLs (IM-EPI) method detected 332 pairs of di-genic epistatic QTLs. Fifteen QTLs exhibited a positive additive effect, indicating that the contributing allele(s) was from JAK 686. Five F2 plants, viz., F2-140, F2-12, F2-7, F2-147, and F2-41, exhibited a high GPC of 14.67%, 14.36%, 14.32%, 13.60%, and 13.36%, respectively. Additionally, these plants also exhibited high per-plant grain yield (~17.0–29.0 g) with desirable agronomic traits. The QTLs identified are valuable resources for developing high-grain-protein varieties with high grain yield and desirable quality traits.

Graphical Abstract

1. Introduction

Globally, rice is a major staple food crop and is a significant energy source for about half of the world’s population [1]. Rice is a widely consumed cereal, accounting for approximately 21% of human caloric requirements globally [2]. It is mostly produced and consumed in South and Southeast Asia and accounts for up to ~76% of caloric intake in this region. People mostly consume rice in the milled (polished) form, which only consists of endosperm. The processing of hulled/brown rice removes the embryo and bran. The nutritional value of milled rice is largely dependent on the endosperm, which comprises starch (70–80%), proteins (7–10%), and lipids (<1.0%) [3]. The rice endosperm is relatively deficient in many micronutrients or phytonutrients. The total seed protein in rice comprises 60–80% glutelin and 20–30% prolamin [4,5].
Multiple genetic factors with a complex genetic basis control GPC in rice. Environment also has a significant impact on GPC. GPC exhibits wide variation among the different varieties. Among the different japonica rice varieties collected from different regions, the GPC ranged from 6.45 to 11.1% (Lou et al. 2023) [6]. Analysis of approximately 4000 rice varieties collected from 57 countries for GPC exhibited a range from 5.3% to 13.6% (Lou et al. 2023). However, the GPC in present-day cultivated varieties ranges from 6.0% to 8.0% only. GPC influences the cooking and eating quality of rice, and affects the physicochemical properties [2]. High GPC causes cooked rice to be hard and loose, resulting in poor eating quality [7]. Consumers usually prefer soft and fluffy cooked rice.
Since GPC is a complex trait influenced by multiple factors, it may not be possible to meet the demands of the growing population using only conventional methods of crop improvement. Breeding approaches like marker-assisted breeding (MAB) are very promising. The application of MAB in crop improvement requires information about the genomic regions governing the trait. The mapping of complex quantitative traits like GPC is relatively difficult compared to simple Mendelian traits. Mapping methods such as QTL mapping have been very effective in identifying the genomic regions governing a particular trait. The effectiveness of QTL mapping depends on precise phenotyping and efficient marker-based genotyping. Rice breeders extensively use thousands of ‘Simple Sequence Repeats (SSRs)’ to perform genotyping across the entire genome [8]. Vast genetic resources are available in rice, including more than 20,000 SSR primers [9]. SSRs are very useful for the construction of linkage maps, mapping of genes, and marker-assisted selection [9].
To date, more than 40 QTLs with small effects on GPC have been identified [10,11,12,13], but very few QTLs have been cloned and functionally validated [14]. OsASN1, OsNAC74, OsAUX5, and SEMIDWARF1 (SD1) are some of the important candidate genes that play a role in rice GPC [15,16,17,18]. Despite the success, two major drawbacks of the QTLs identified so far are as follows: first, the QTLs identified are mostly in brown rice; and second, the parents used in breeding lacked the required variation/difference in GPC. Hence, the identification of stable-GPC QTLs specifically in milled rice, without any undesirable effects on agronomic traits and grain quality, is crucial. This is very essential for the genetic enhancement of the GPC in milled rice and the eating quality of cooked rice.
The objective of the present study is to identify QTLs specifically for GPC in milled rice, and for grain quality traits and yield, in an F2 population developed from BPT 5204 X JAK-686. The GPC of BPT 5204 and JAK-686 is ~8.0% and ~12.0%, respectively. BPT 5204 is a very popular variety, with a medium-slender grain type, low GPC, and excellent cooking quality, while JAK-686 is a high-GPC germplasm line, which shows early maturity (110 days). The results of this study will be useful in developing high-yielding, protein-rich varieties with a desirable eating and cooking quality.

2. Results

The GPC and cooking quality of rice cultivars are two important traits valued by consumers. Identifying genomic regions governing these traits and their introgression into popular varieties like BPT 5204 through marker-assisted breeding is an effective strategy to develop high-yielding and nutritionally rich cultivars. Therefore, identification and validation of QTLs/genes in different genetic backgrounds and environments is a prerequisite for their large-scale application in a variety of crop improvement programs.

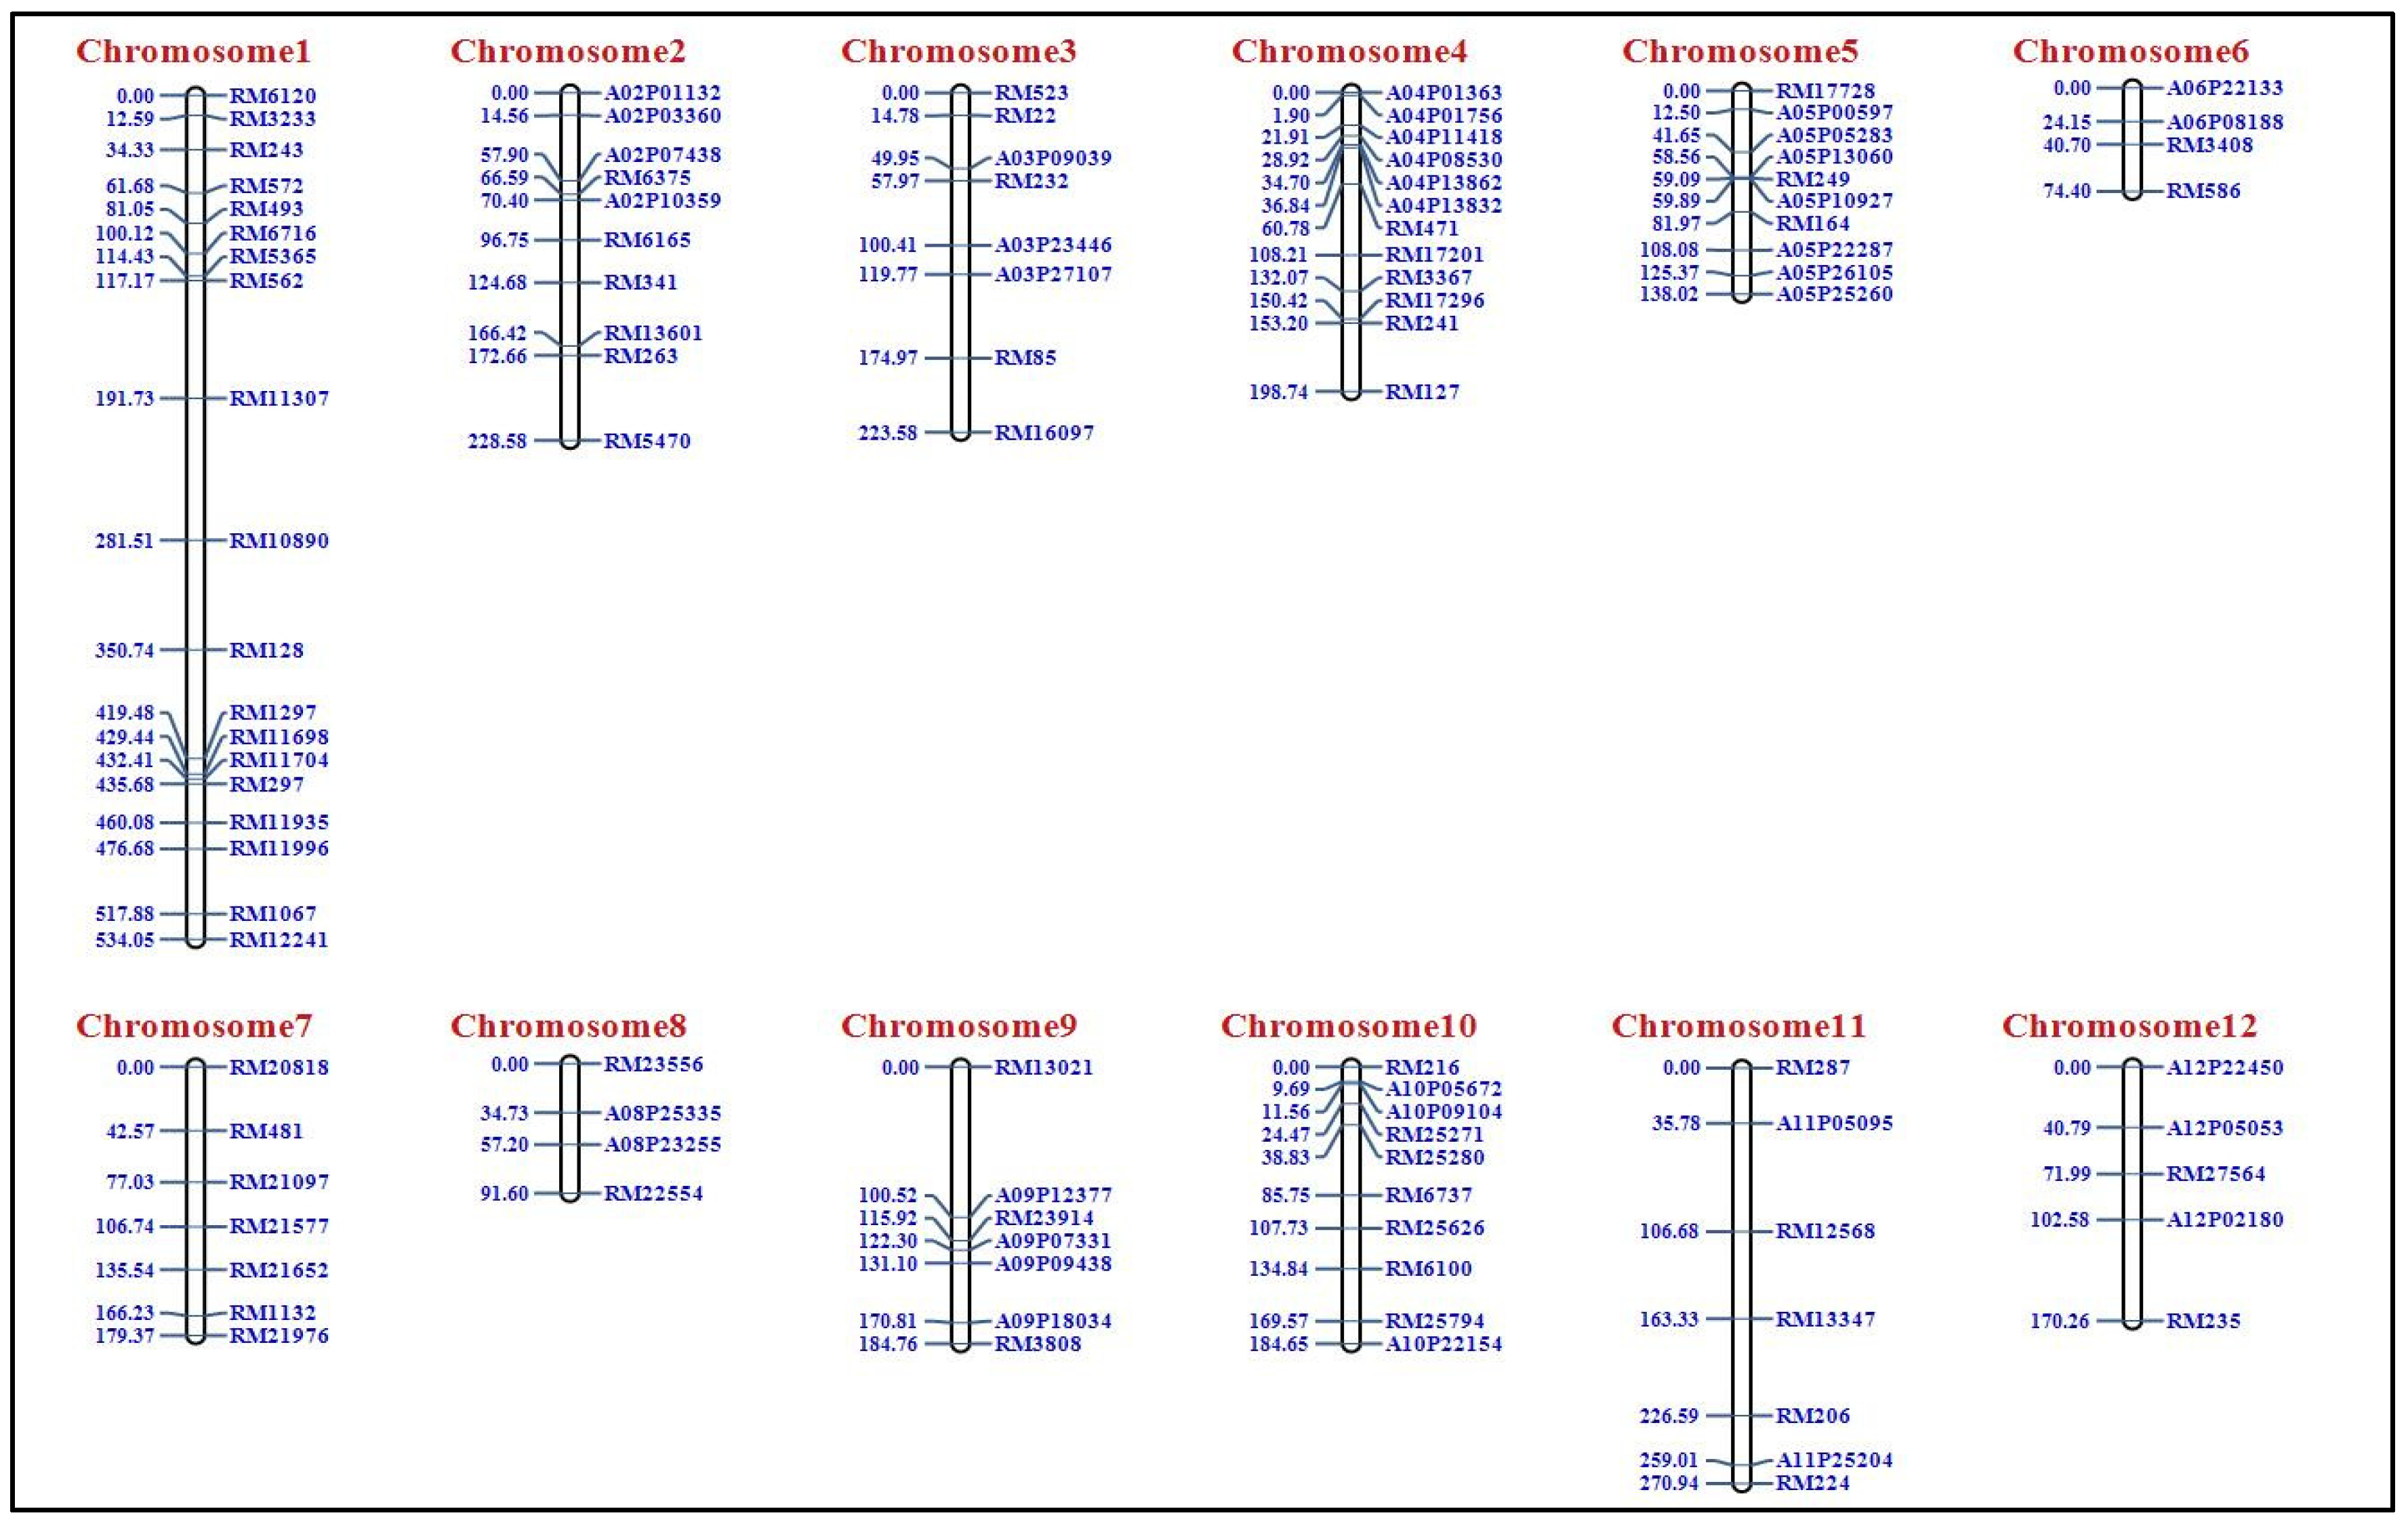
2.1. Construction of Genetic Map Using F2 Population

We developed a population of 188 F2 individuals from a cross between “BPT 5204” and “JAK-686” made during the dry season of 2021–2022 (Figure 1). We tested 1220 SSR and 60 InDel markers for polymorphism between parents (BPT 5204 and JAK 686). Supplementary Table S1 lists the differences between the two parents. Among them, 103 markers were polymorphic between BPT 5204 and JAK-686. All 188 F2 plants were genotyped using 103 polymorphic markers. The details of the polymorphic markers across the twelve rice chromosomes are listed in Supplementary Table S2. The polymorphic markers were uniformly distributed over all 12 chromosomes, and the highest number of markers was present on chromosome 1 (Table 1). We used the data generated from 103 polymorphic markers on 188 F2 plants to construct a genetic linkage map. We used the Chi-square test (X2) to study the marker segregation distortion. These markers showed a good fit to the expected marker segregation ratio (1:2:1) in a Mendelian fashion. We constructed a genetic map spanning 2478.95 cM with 103 polymorphic marker loci on the 12 linkage groups (Table 1; Figure 2). The highest number of marker loci, nineteen (19), mapped on chromosome 1, at a distance of 534.05 cM. The least featured only four marker loci mapped on chromosomes 6 and 8. The remaining chromosomes had 5–12 marker loci (Table 1).

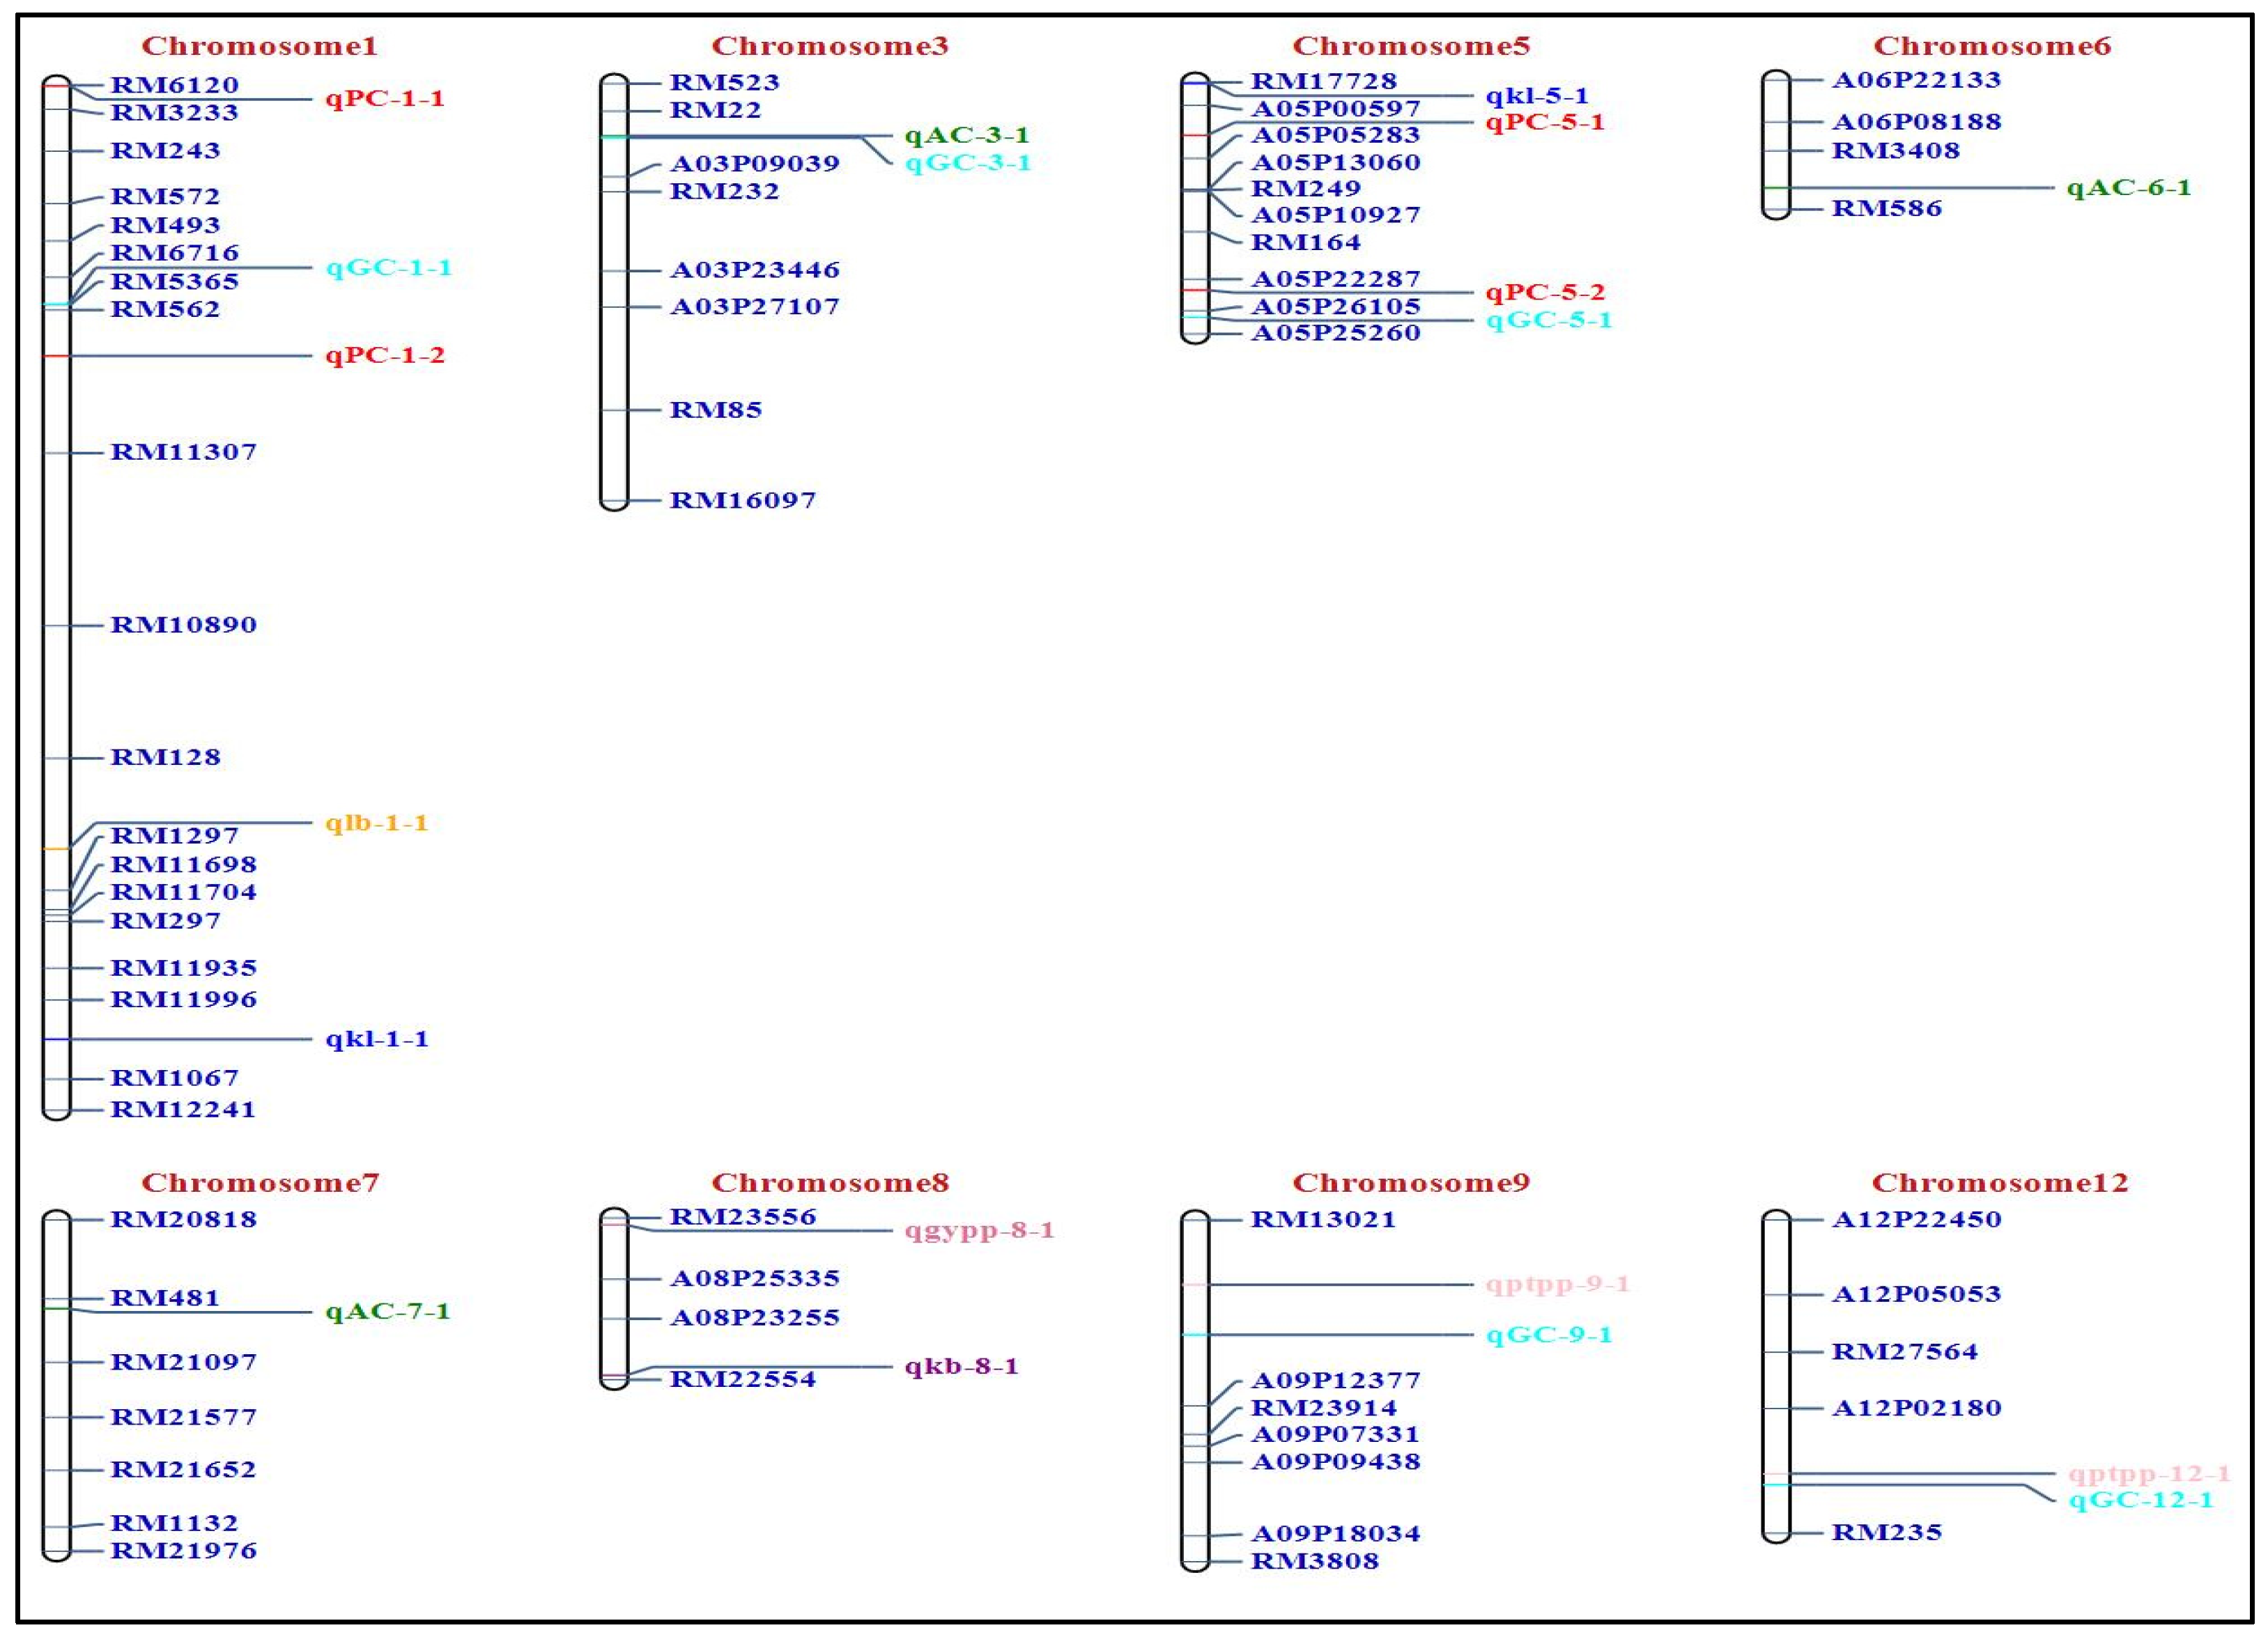
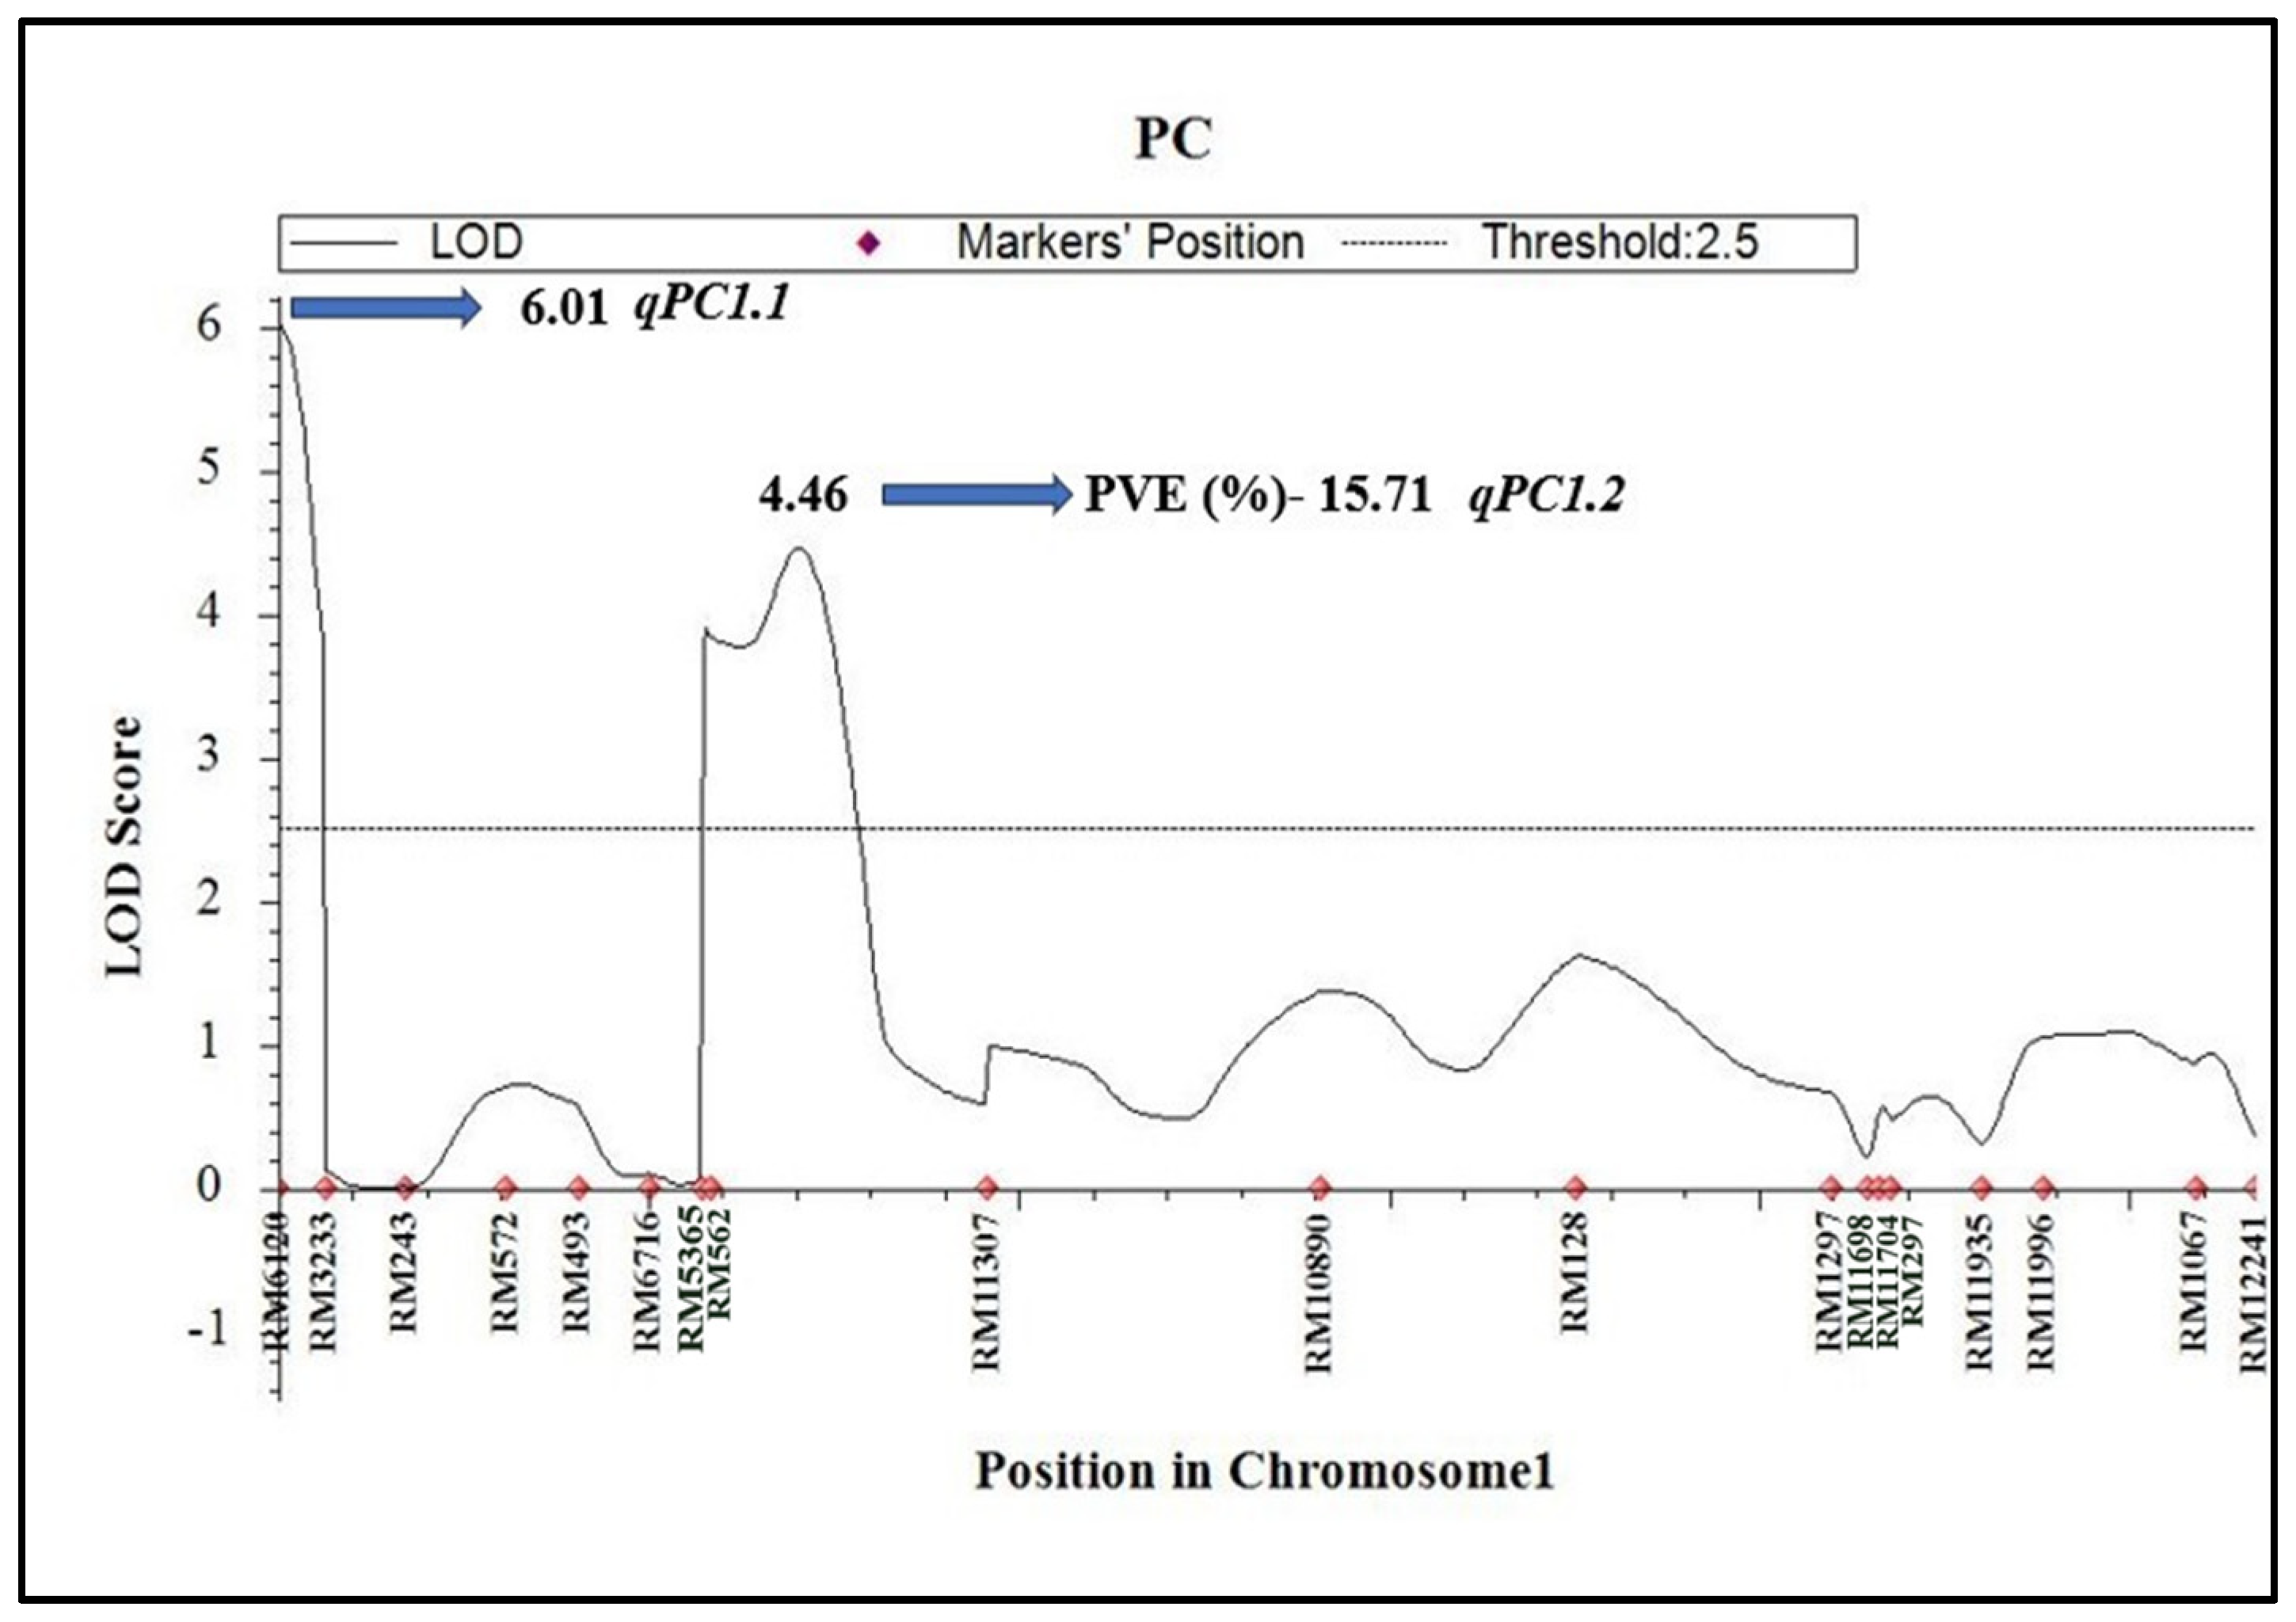
2.2. Identification of QTLs for GPC, Quality Traits, and Yield

The focus of the present study was to identify QTLs for GPC, grain quality, and yield using an F2 population of BPT 5204 X JAK-686. QTL analysis was performed using the inclusive composite interval mapping additive (ICIM-ADD) method implemented in the ICIM software ICIM [19]. In total, 19 QTLs were identified for GPC, grain quality, yield, and their contributing traits using ICIM-ADD on 12 rice chromosomes (Table 2; Figure 3).
Four QTLs, qPC1.1 (RM6120-RM3233), qPC1.2 (RM562-RM11307), qPC5.1 (A05P00597-A05P05283), and qPC5.2 (A05P22287-A05P26105), were identified for GP on chromosome 1 and 5, explaining 5.38%, 15.71%, 4.59%, and 3.09% of phenotypic variance (PVE), with LOD scores of 6.01, 4.46, 2.84, and 2.88, respectively (Table 2). Details of previously identified QTLs including their physical location are presented in Table 3. Among the four QTLs for GPC, qPC1.2, a major QTL, explained about 15.71% of the PVE (Figure 4). All the four GPC QTLs identified had a positive additive effect, indicating that the trait-enhancing alleles are from JAK-686 (Table 2).
AC and GC, two important quality traits, have a significant impact on the cooking and eating quality of rice. We identified three QTLs for AC (qAC3.1, qAC6.1, and qAC7.1) on chromosome 3, 6, and 7, respectively. qAC3.1 had the highest LOD score of 6.37, and explained approximately 7.15% of the PVE (Table 2). All the three QTLs identified had positive additive effects, indicating that the contributing allele came from JAK-686. We identified five QTLs (qGC1.1, qGC3.1, qGC5.1, qGC9.1, and qGC12.1) governing GC. Among the five QTLs, qGC9.1 and qGC12.1, present on chromosomes 9 and 12, respectively, explained about 6.0% of the PVE (Table 2). qGC9.1 and qGC12.1 had LOD scores of 3.68 and 3.00, respectively (Table 2).
Additionally, we identified two QTLs for KL: qkl1.1 and qkl5.1 on chromosomes 1 and 5, respectively. qkl1.1 and qkl5.1, with LOD scores of 2.86 and 4.77, respectively, explaining 9.63% and 4.24% of the PVE. A single QTL was identified each for KB (qkb8.1) and L:B (qlb1.1) on chromosomes 8 and 1, respectively. qkb8.1 and qlb1.1, with LOD scores of 3.30 and 2.51, respectively, explained 7.79% and 6.19% of the PVE. We have also identified two QTLs, qptpp9.1, and qptpp12.1, for PTPP on chromosome 9 and 12, respectively; qptpp9.1 and qptpp12.1, with LOD scores of 4.34 and 3.55, respectively, explained 5.65% and 5.78% of the PVE. Further, qgypp8.1, a QTL for GYPP with an LOD value of 2.57, explained 6.07% of the PVE.

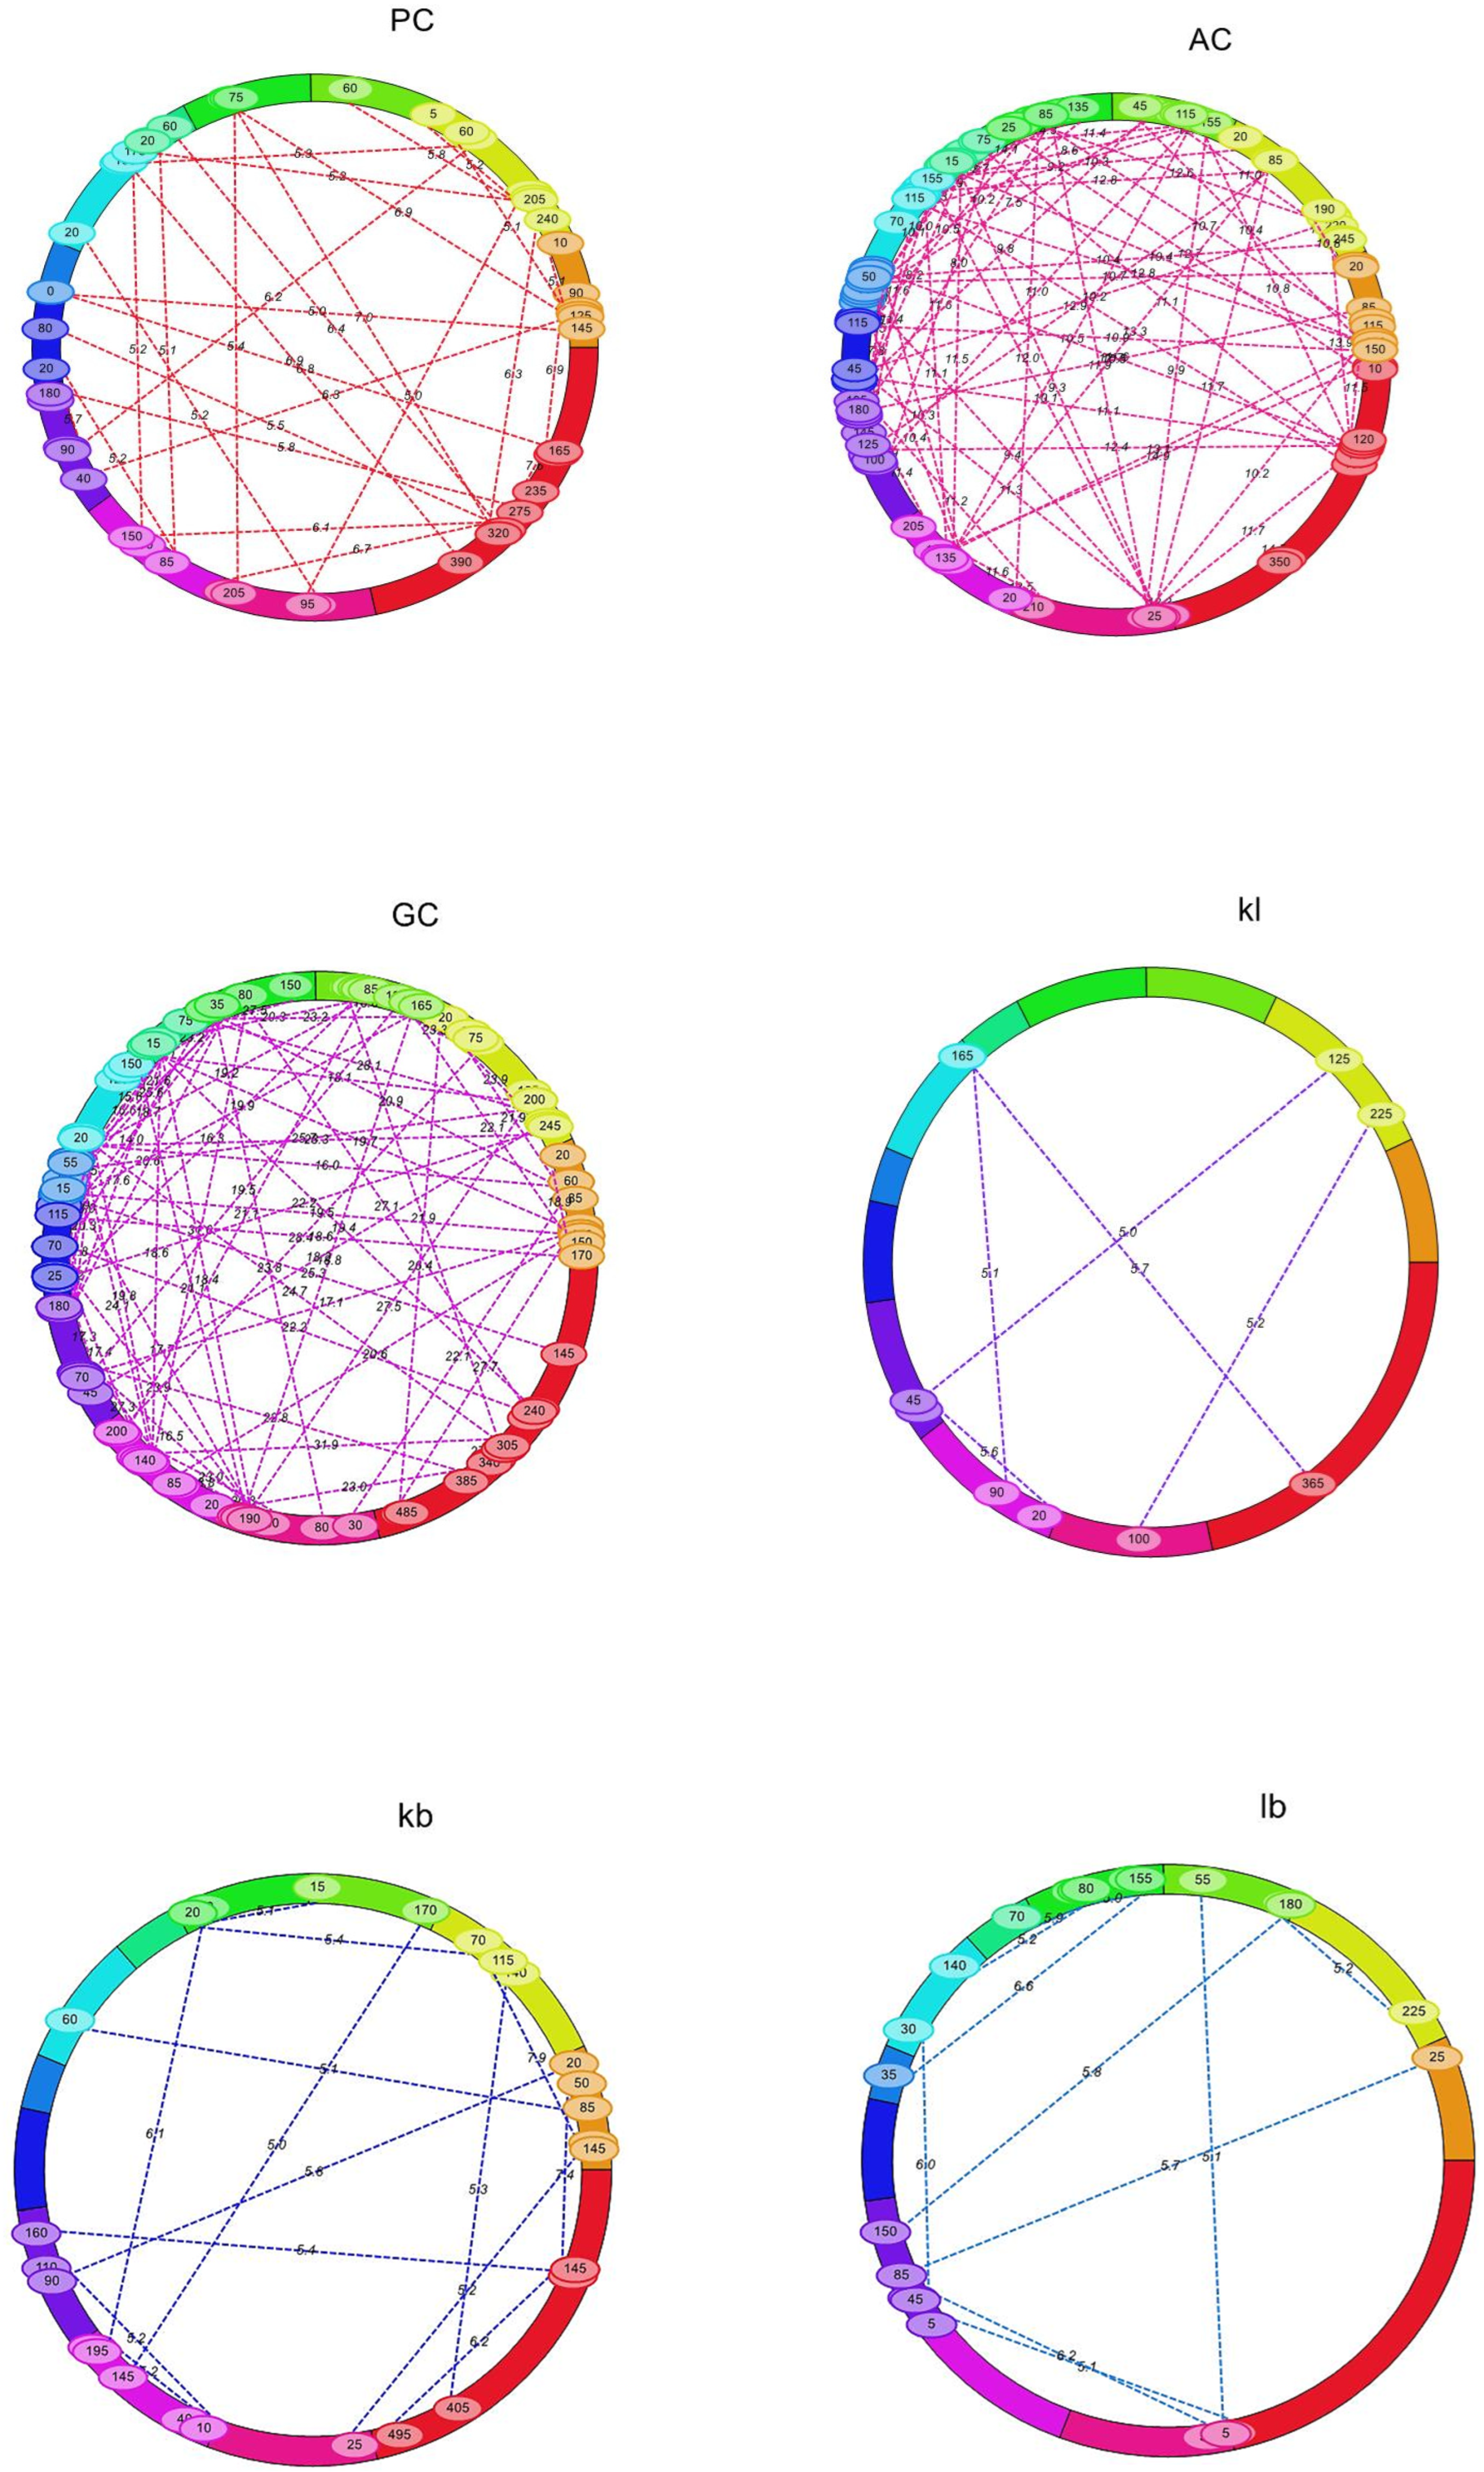
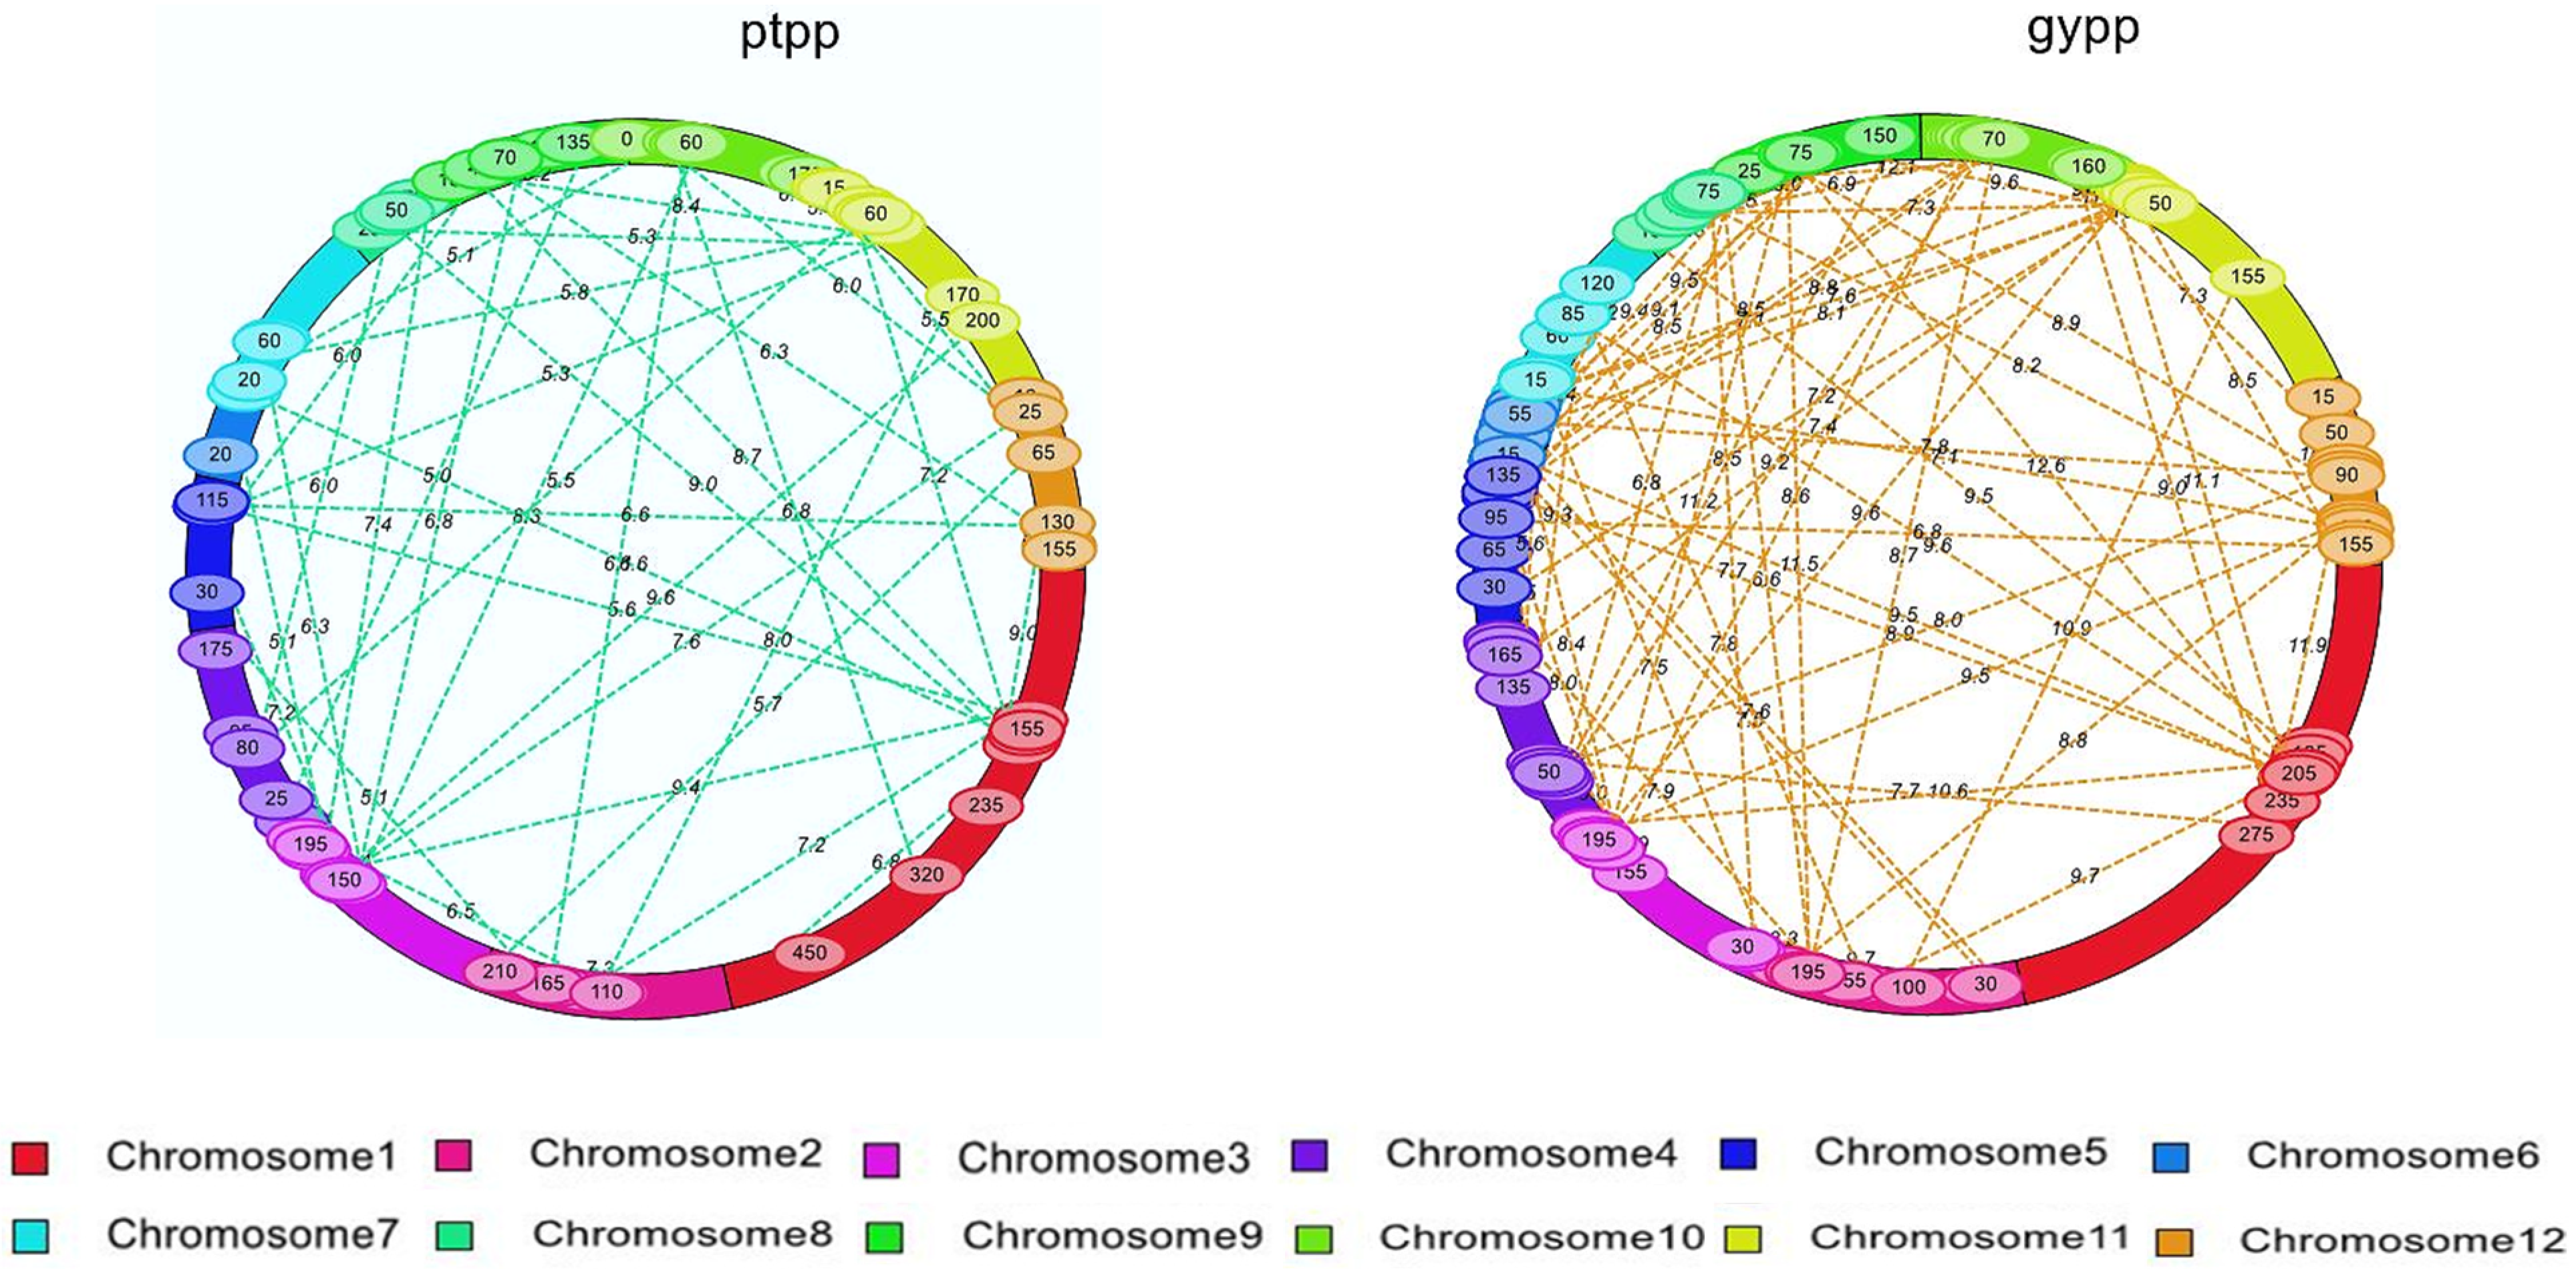
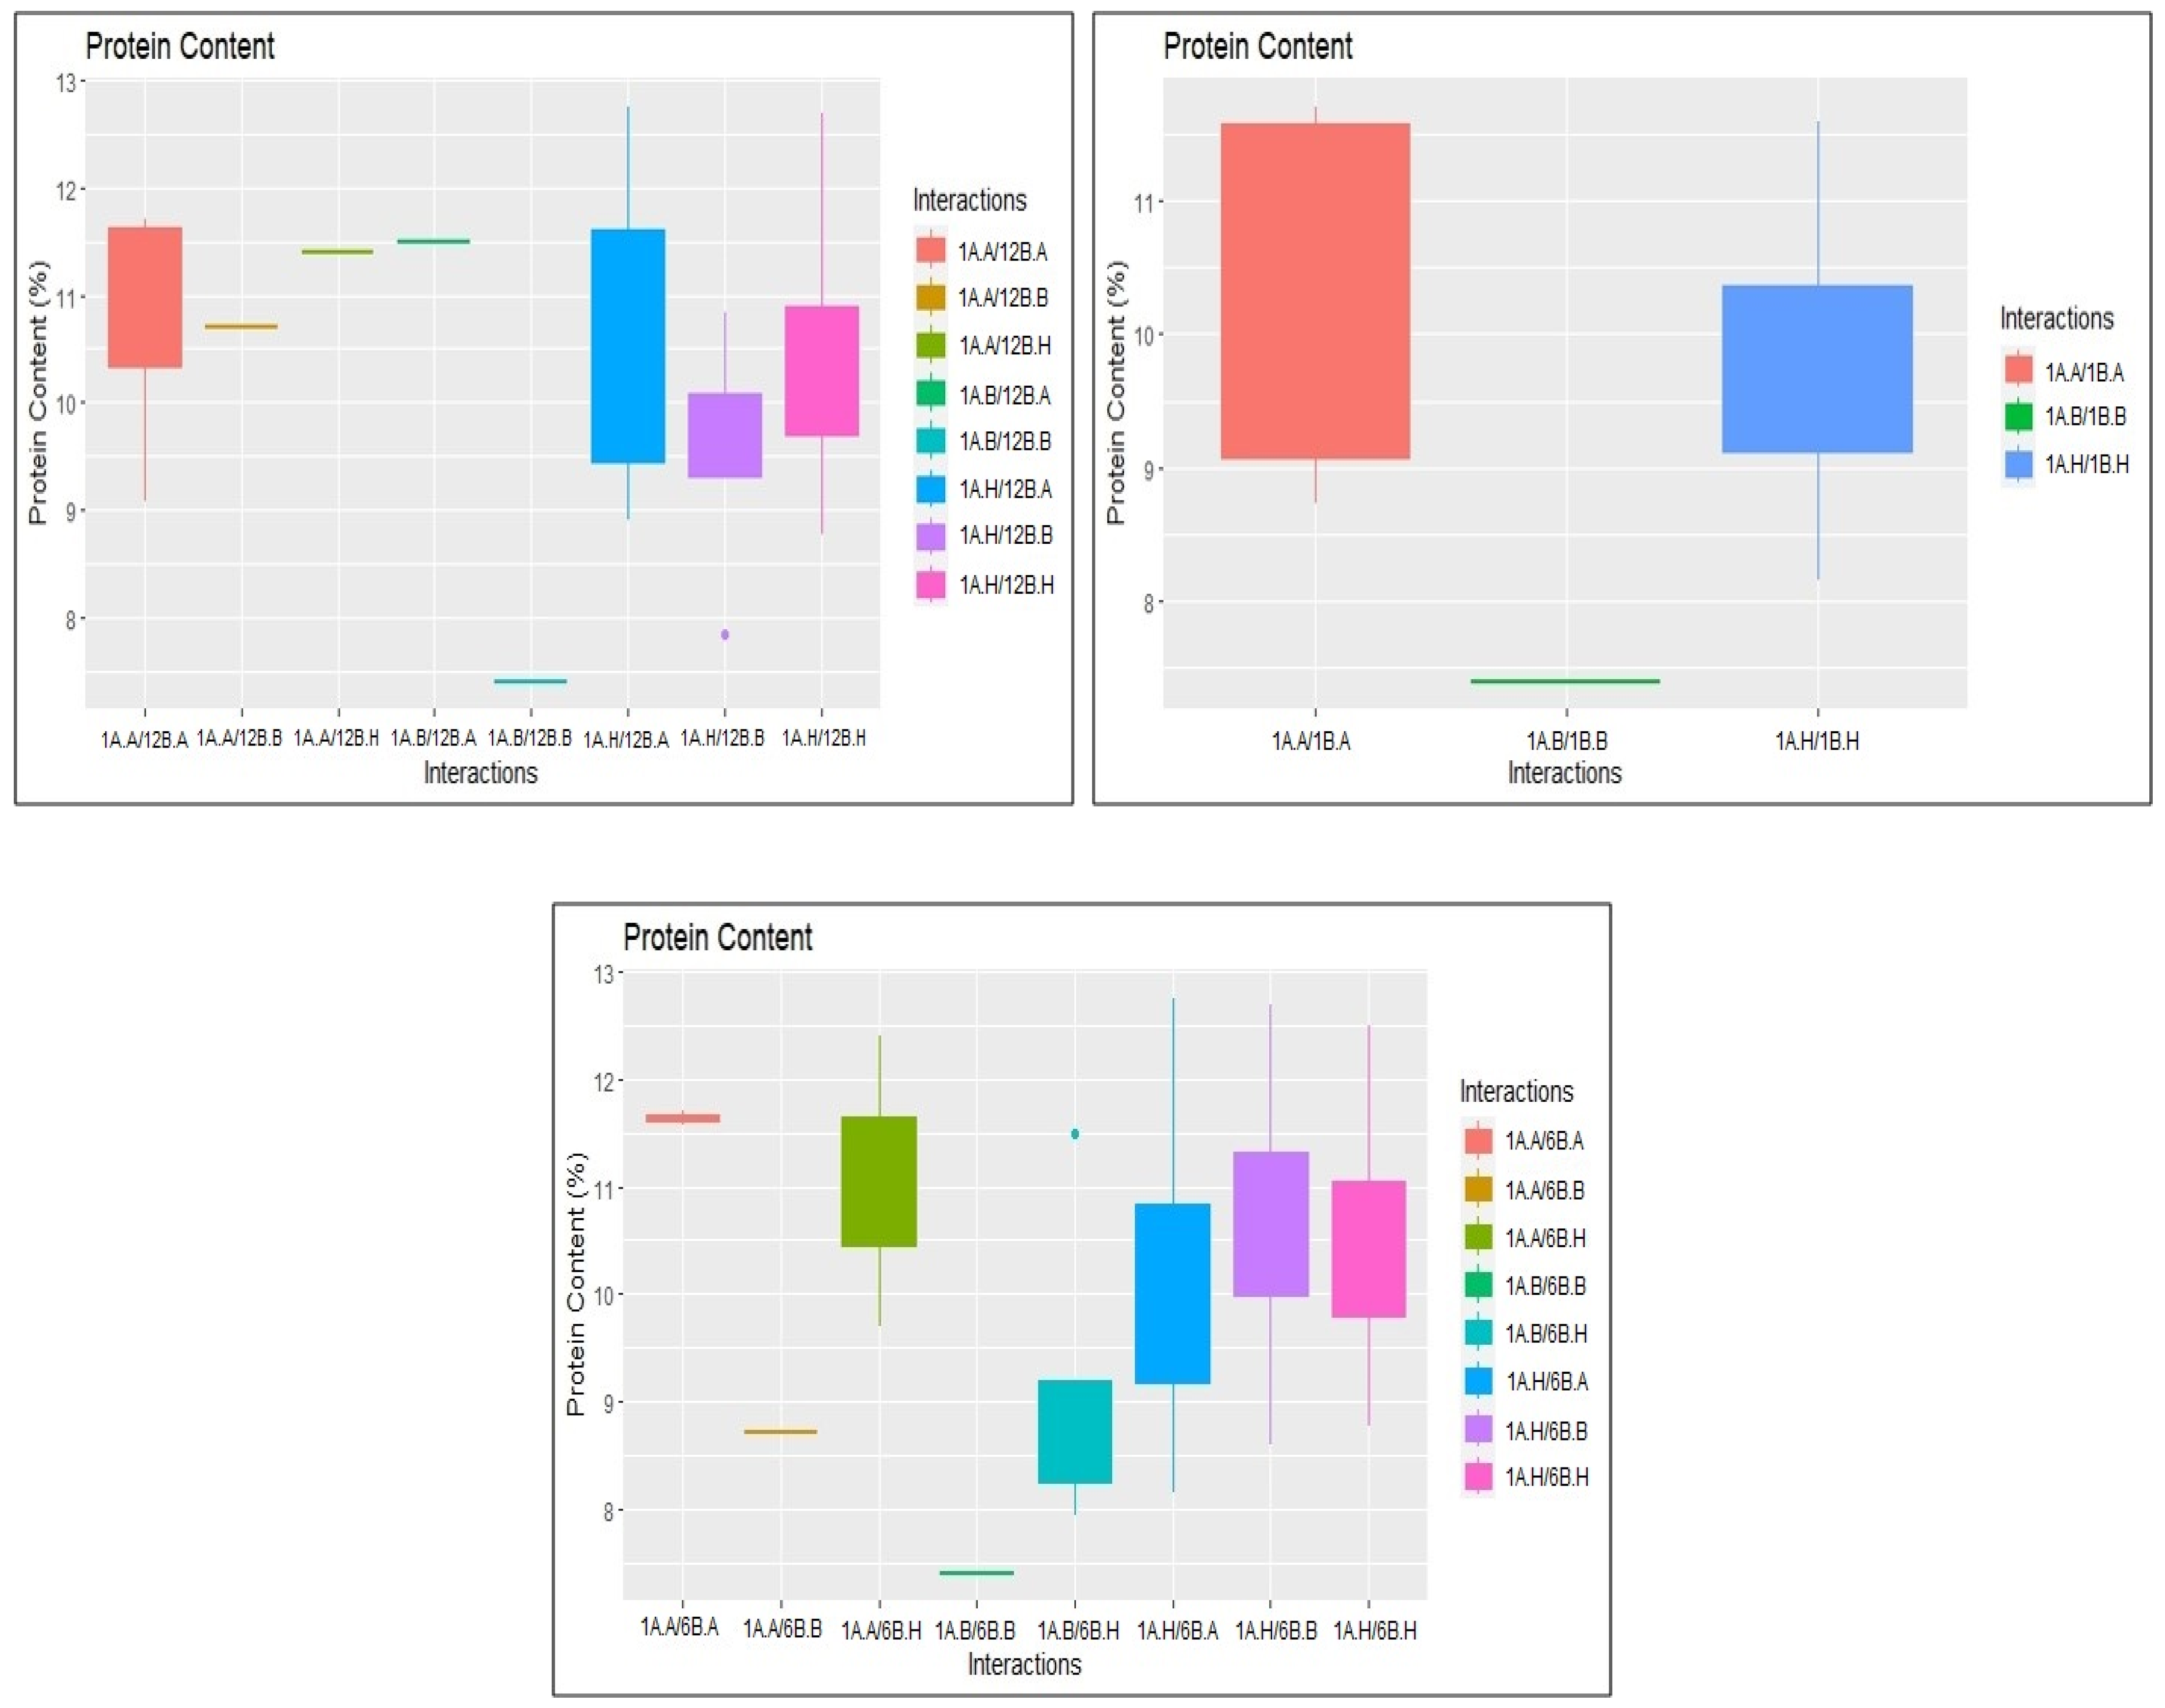
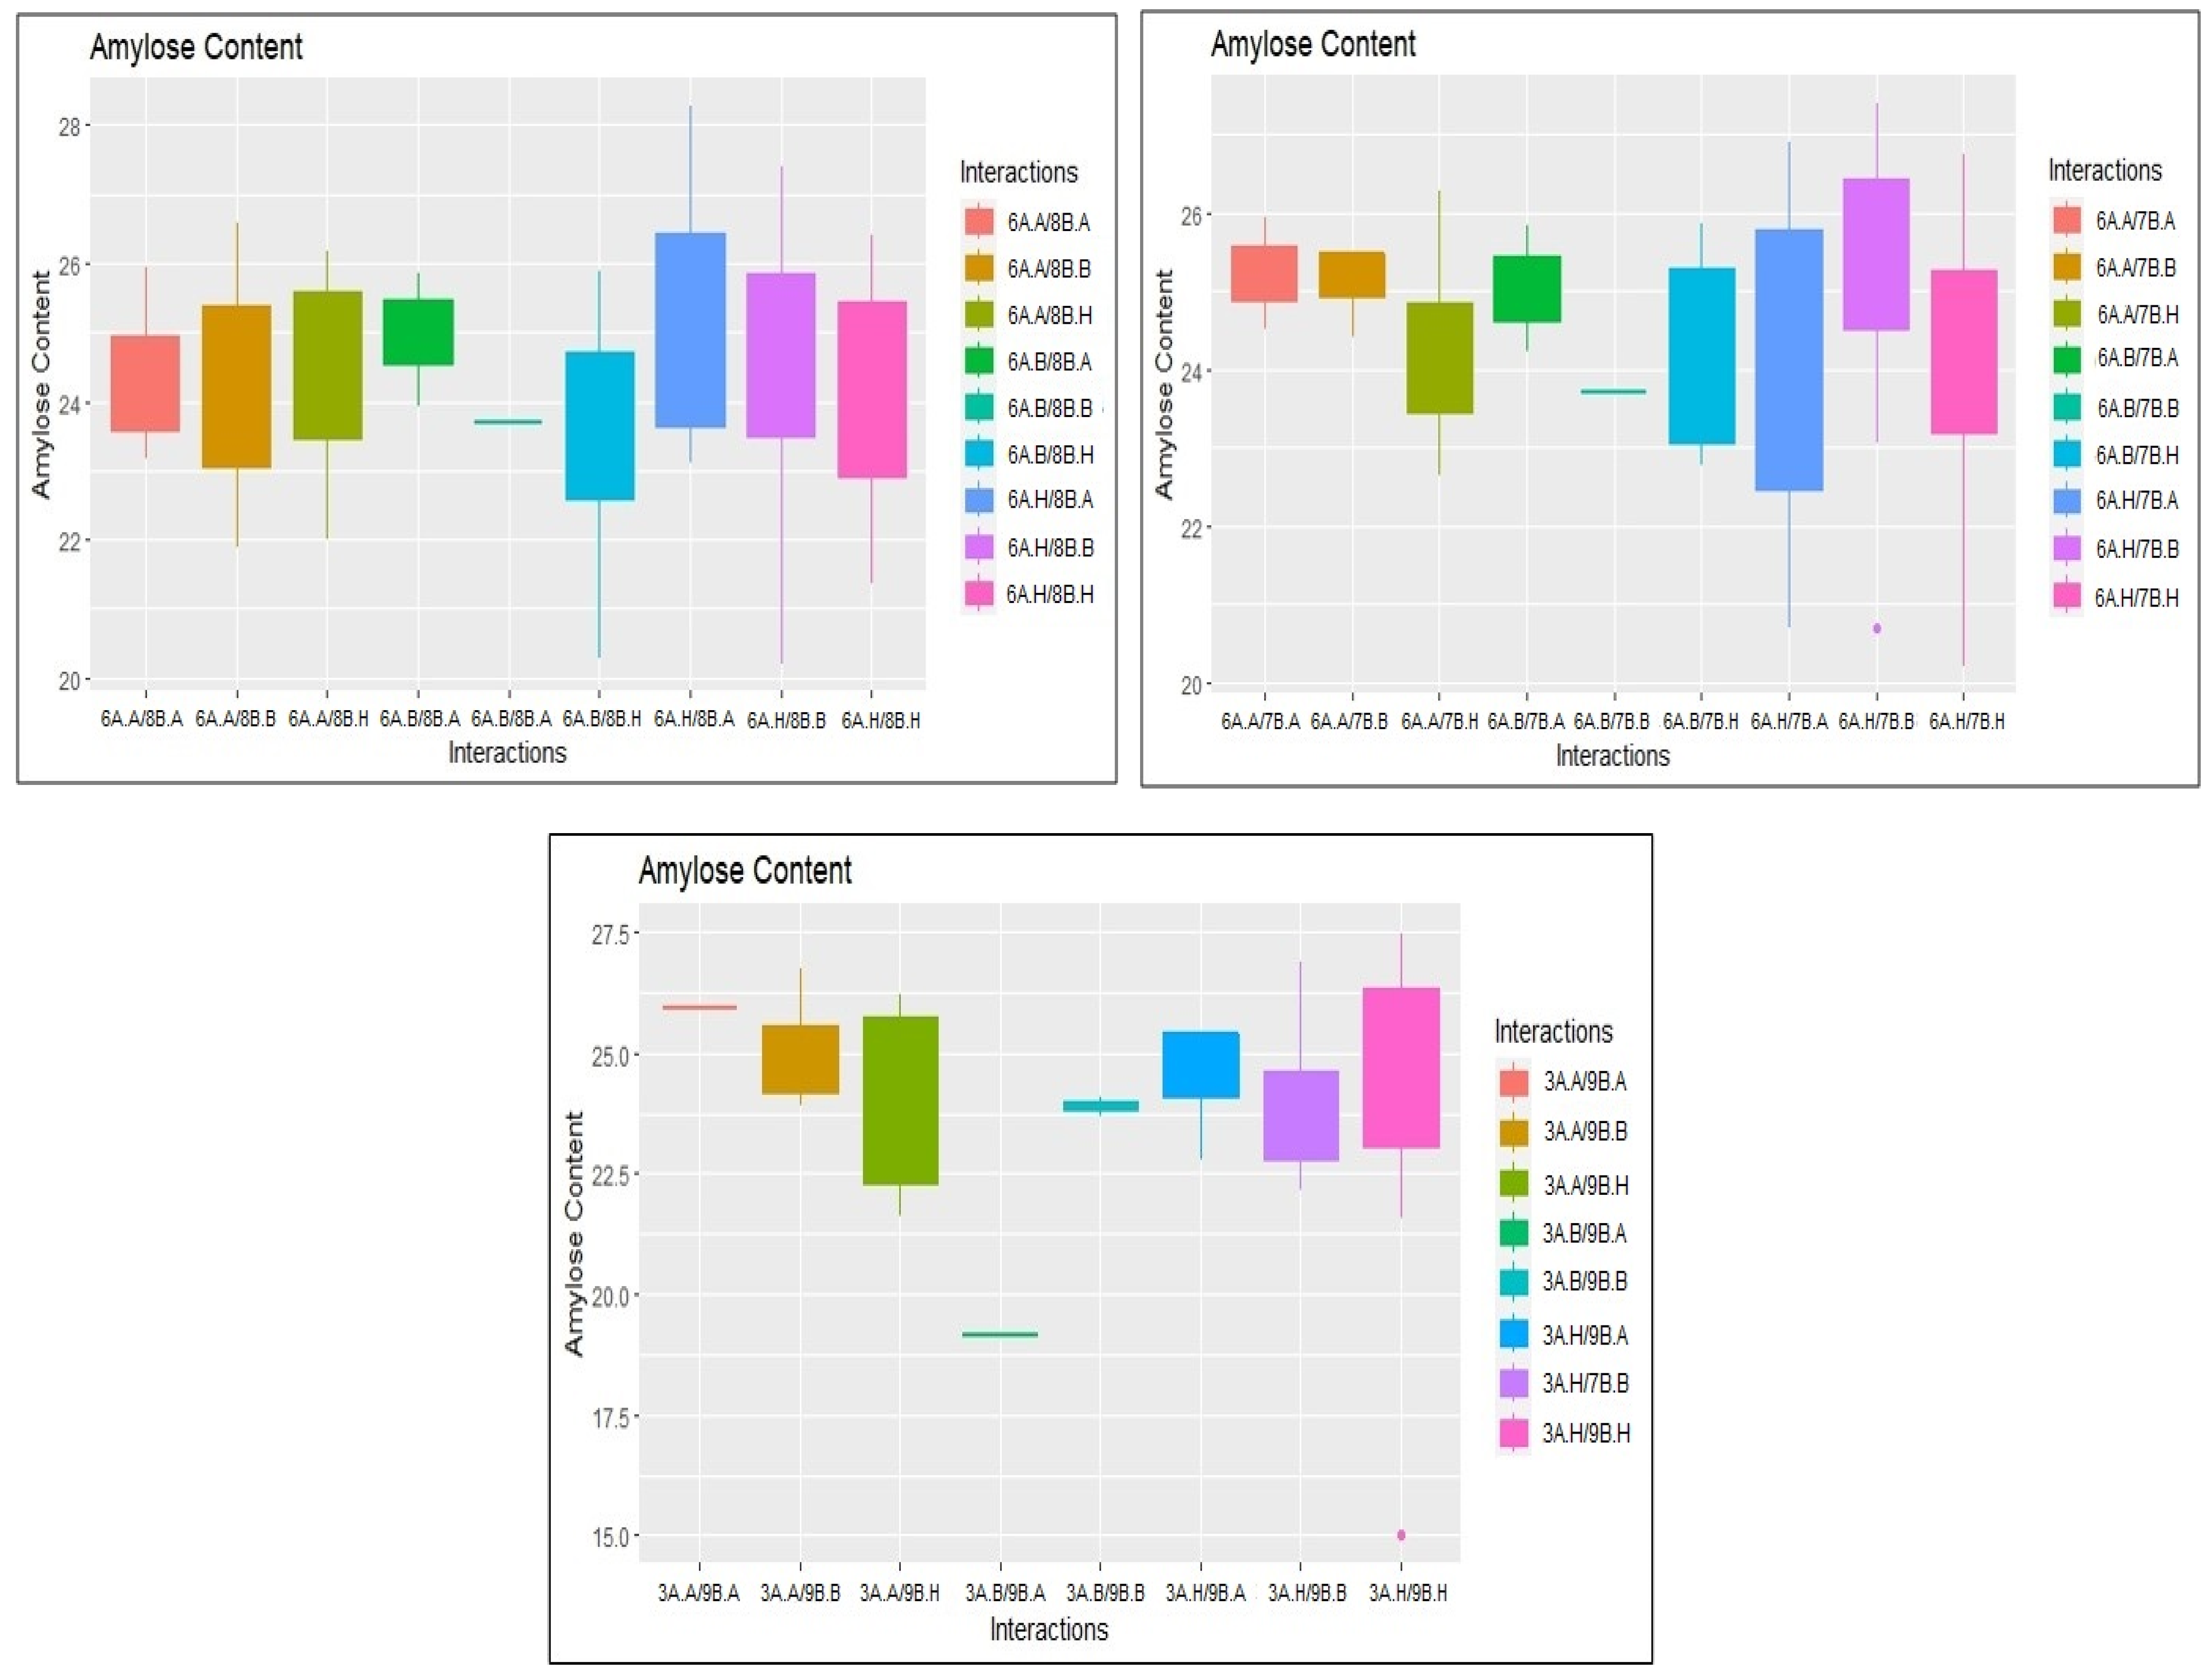
2.3. Identification of Epistatic QTLs

A total of 331 significant epistatic QTLs were detected for GPC, AC, GC, KL, KB, L:B, PTPP, and GYPP at a threshold LOD score > 5, with PVE ranging from 0.56 to 10.18% (Table S3). At LOD > 5, we found minor interactions between multiple loci across chromosomes (Figure 5). We detected 28 digenic interactions for GPC. Interestingly, three of these interactions occurred between a significant main-effect QTL (RM562-RM11307) in chromosome 1 for GPC and non-significant loci in other chromosomes. These interactions are represented in the boxplots (Figure 6). Both additive effects were from JAK-686 (Table S3). Similarly, we detected 79 epistatic interactions for AC. Three of these interactions occurred between two significant main-effect QTLs (RM22-A03P09039 and RM562-RM11307) on chromosome 3 and 6, respectively, and non-significant loci in other chromosomes (Figure 7). The influence of additive-by-additive effects of epistatic QTLs was relatively lower compared to the individual additive effects of the corresponding QTLs. This could be due to the presence of few individuals with rare loci in the populations. Further, interference from other loci and the limited epistatic variance arising from interactions may also contribute to this effect.

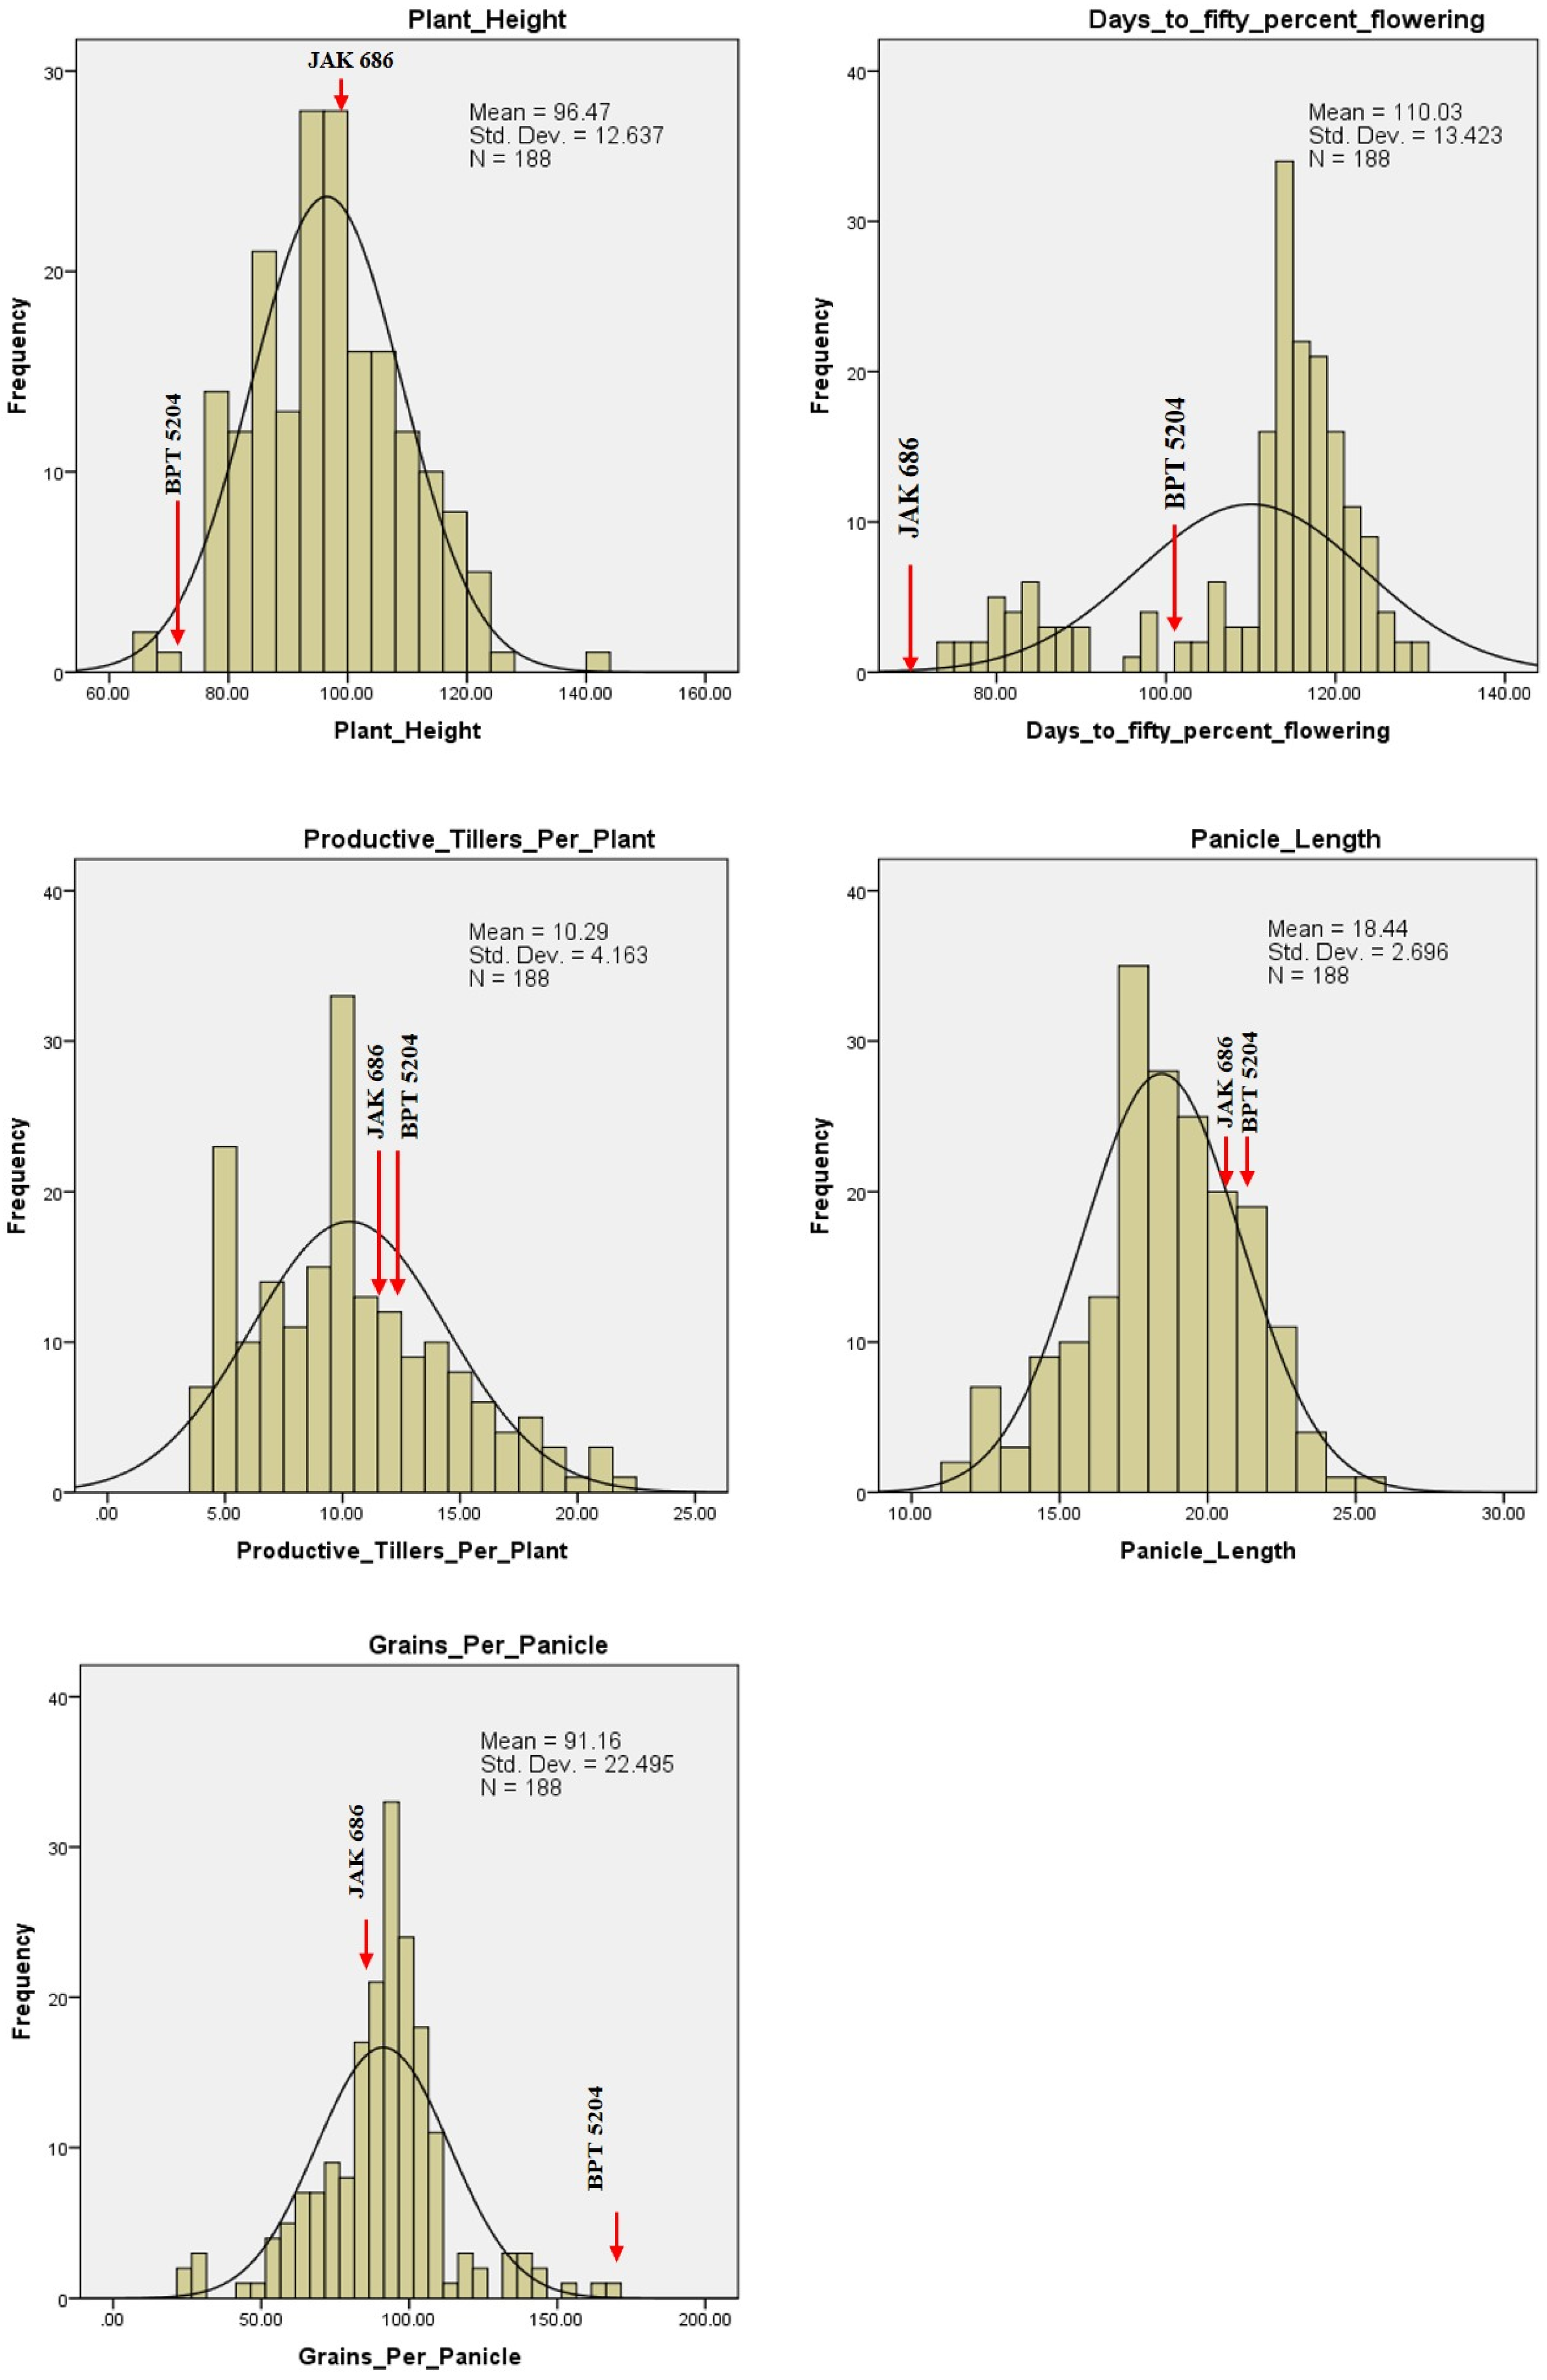
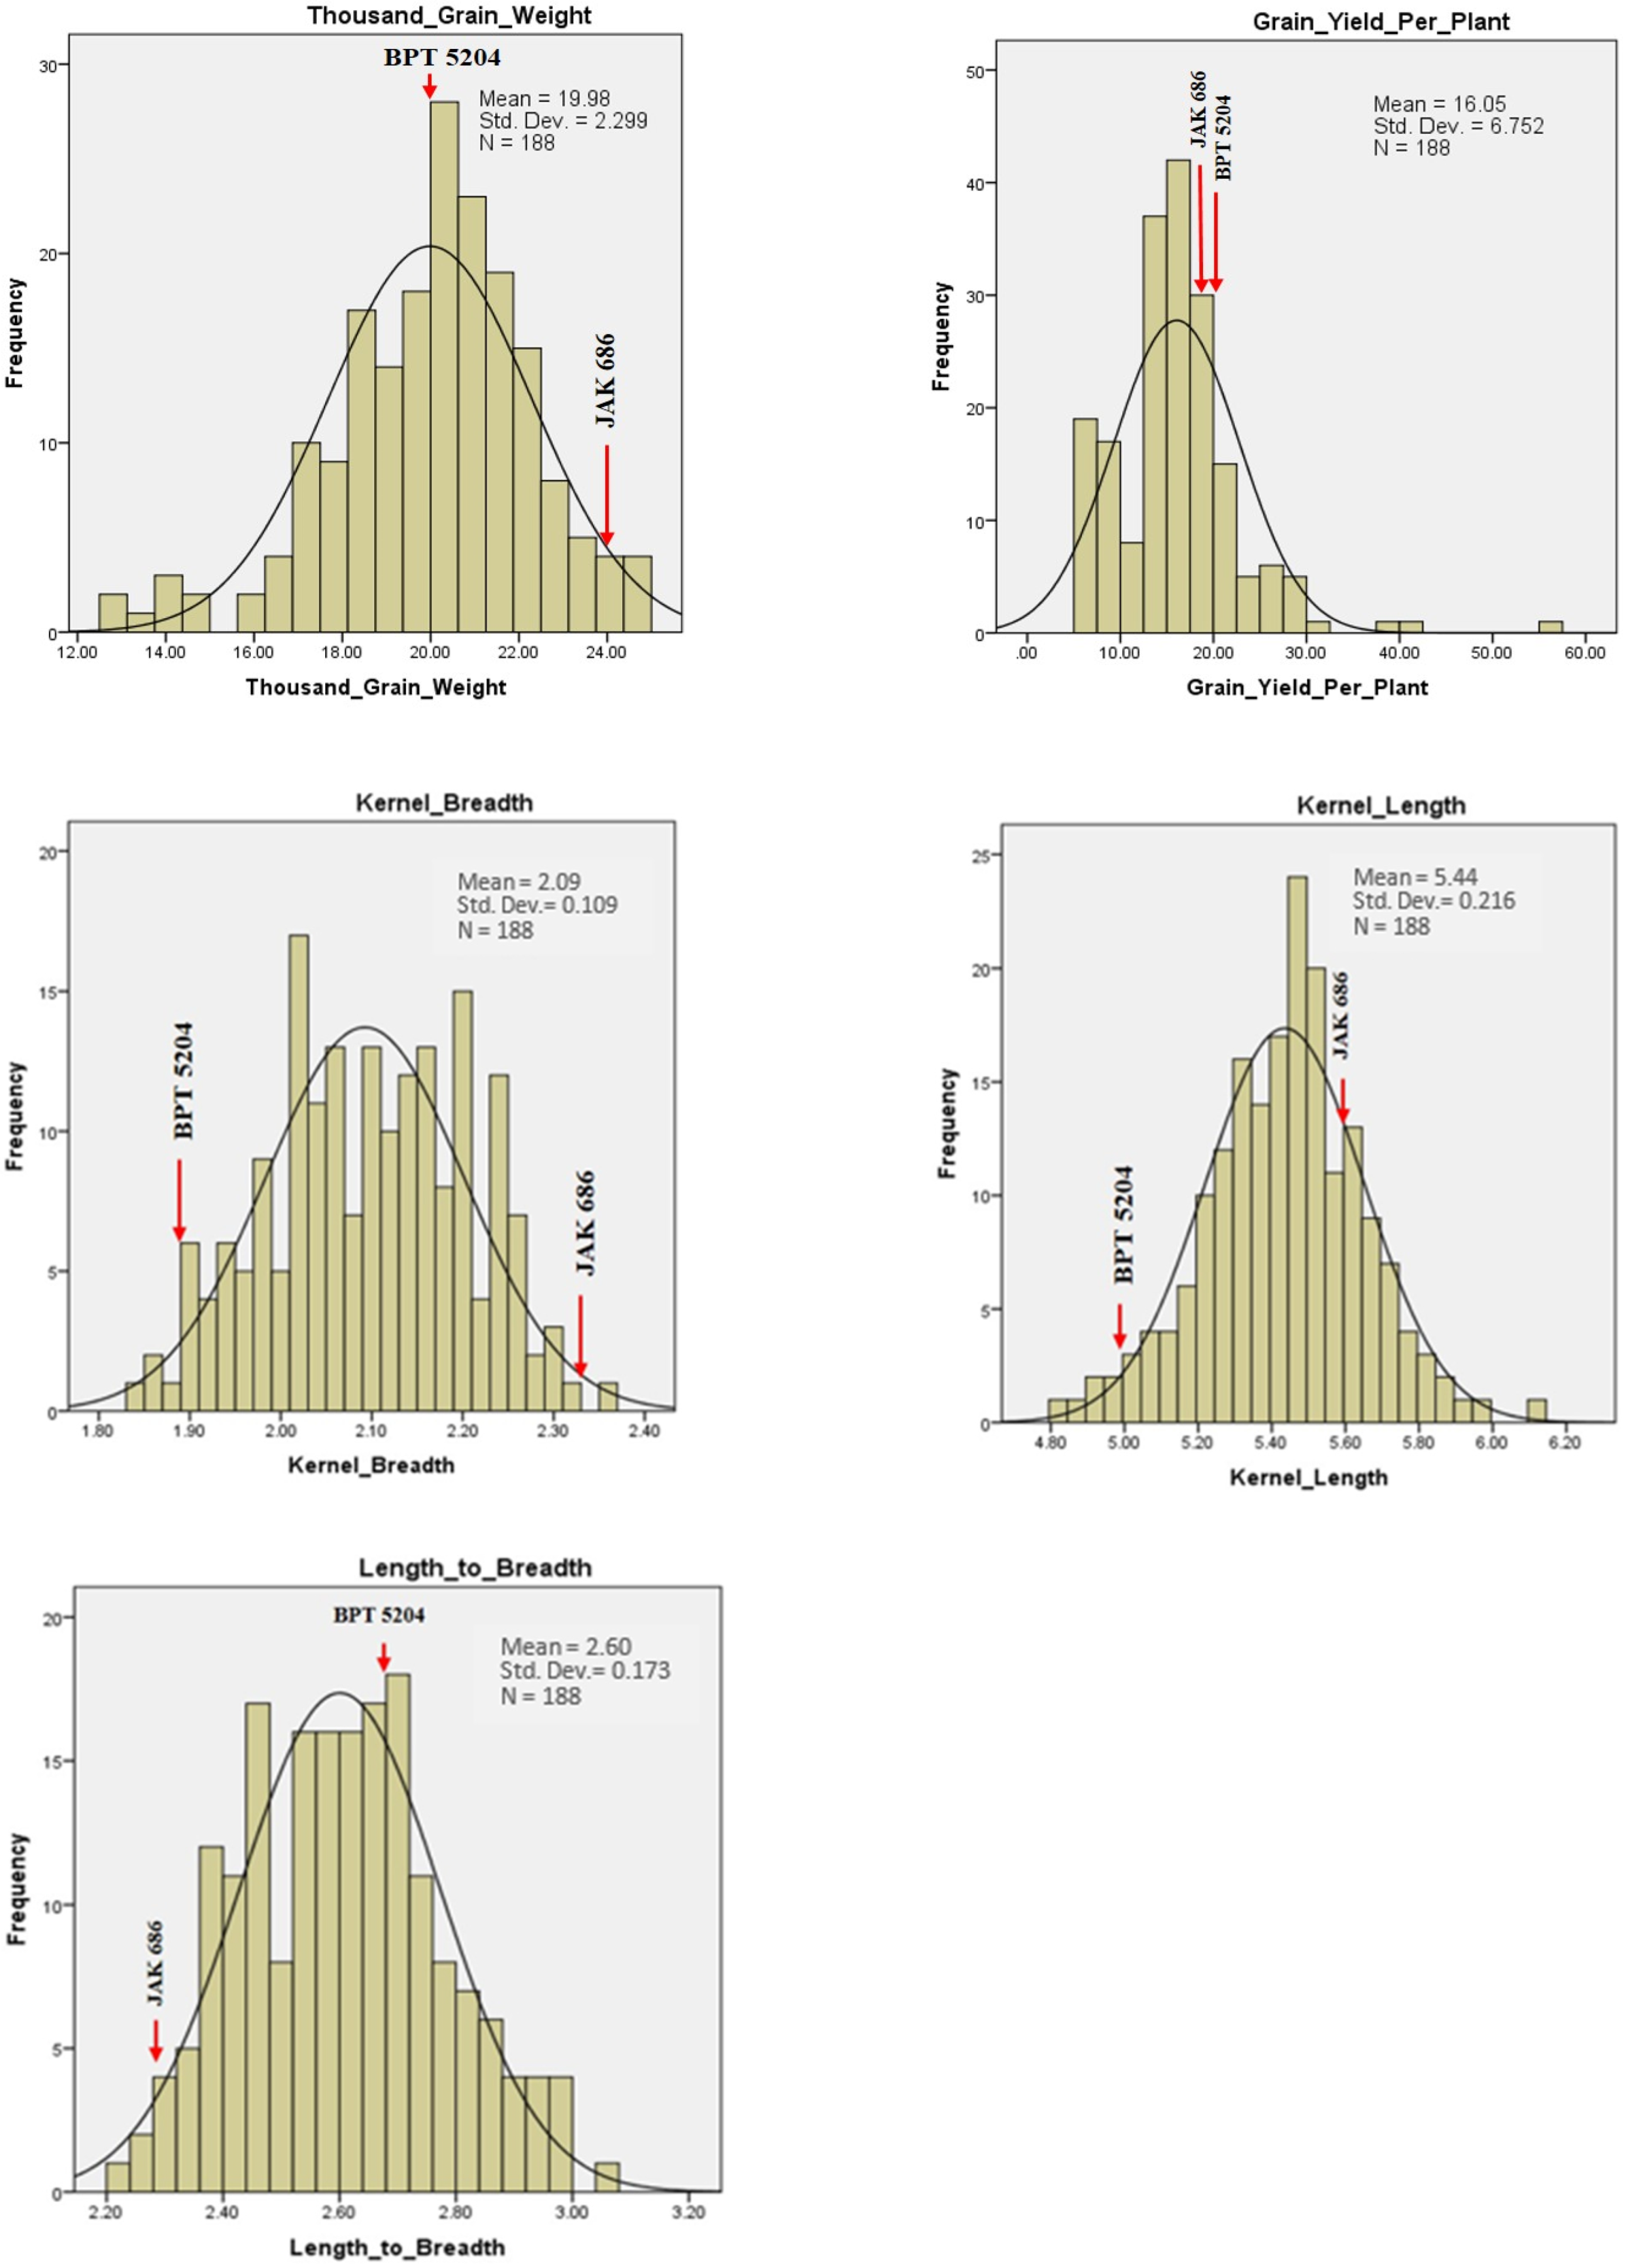
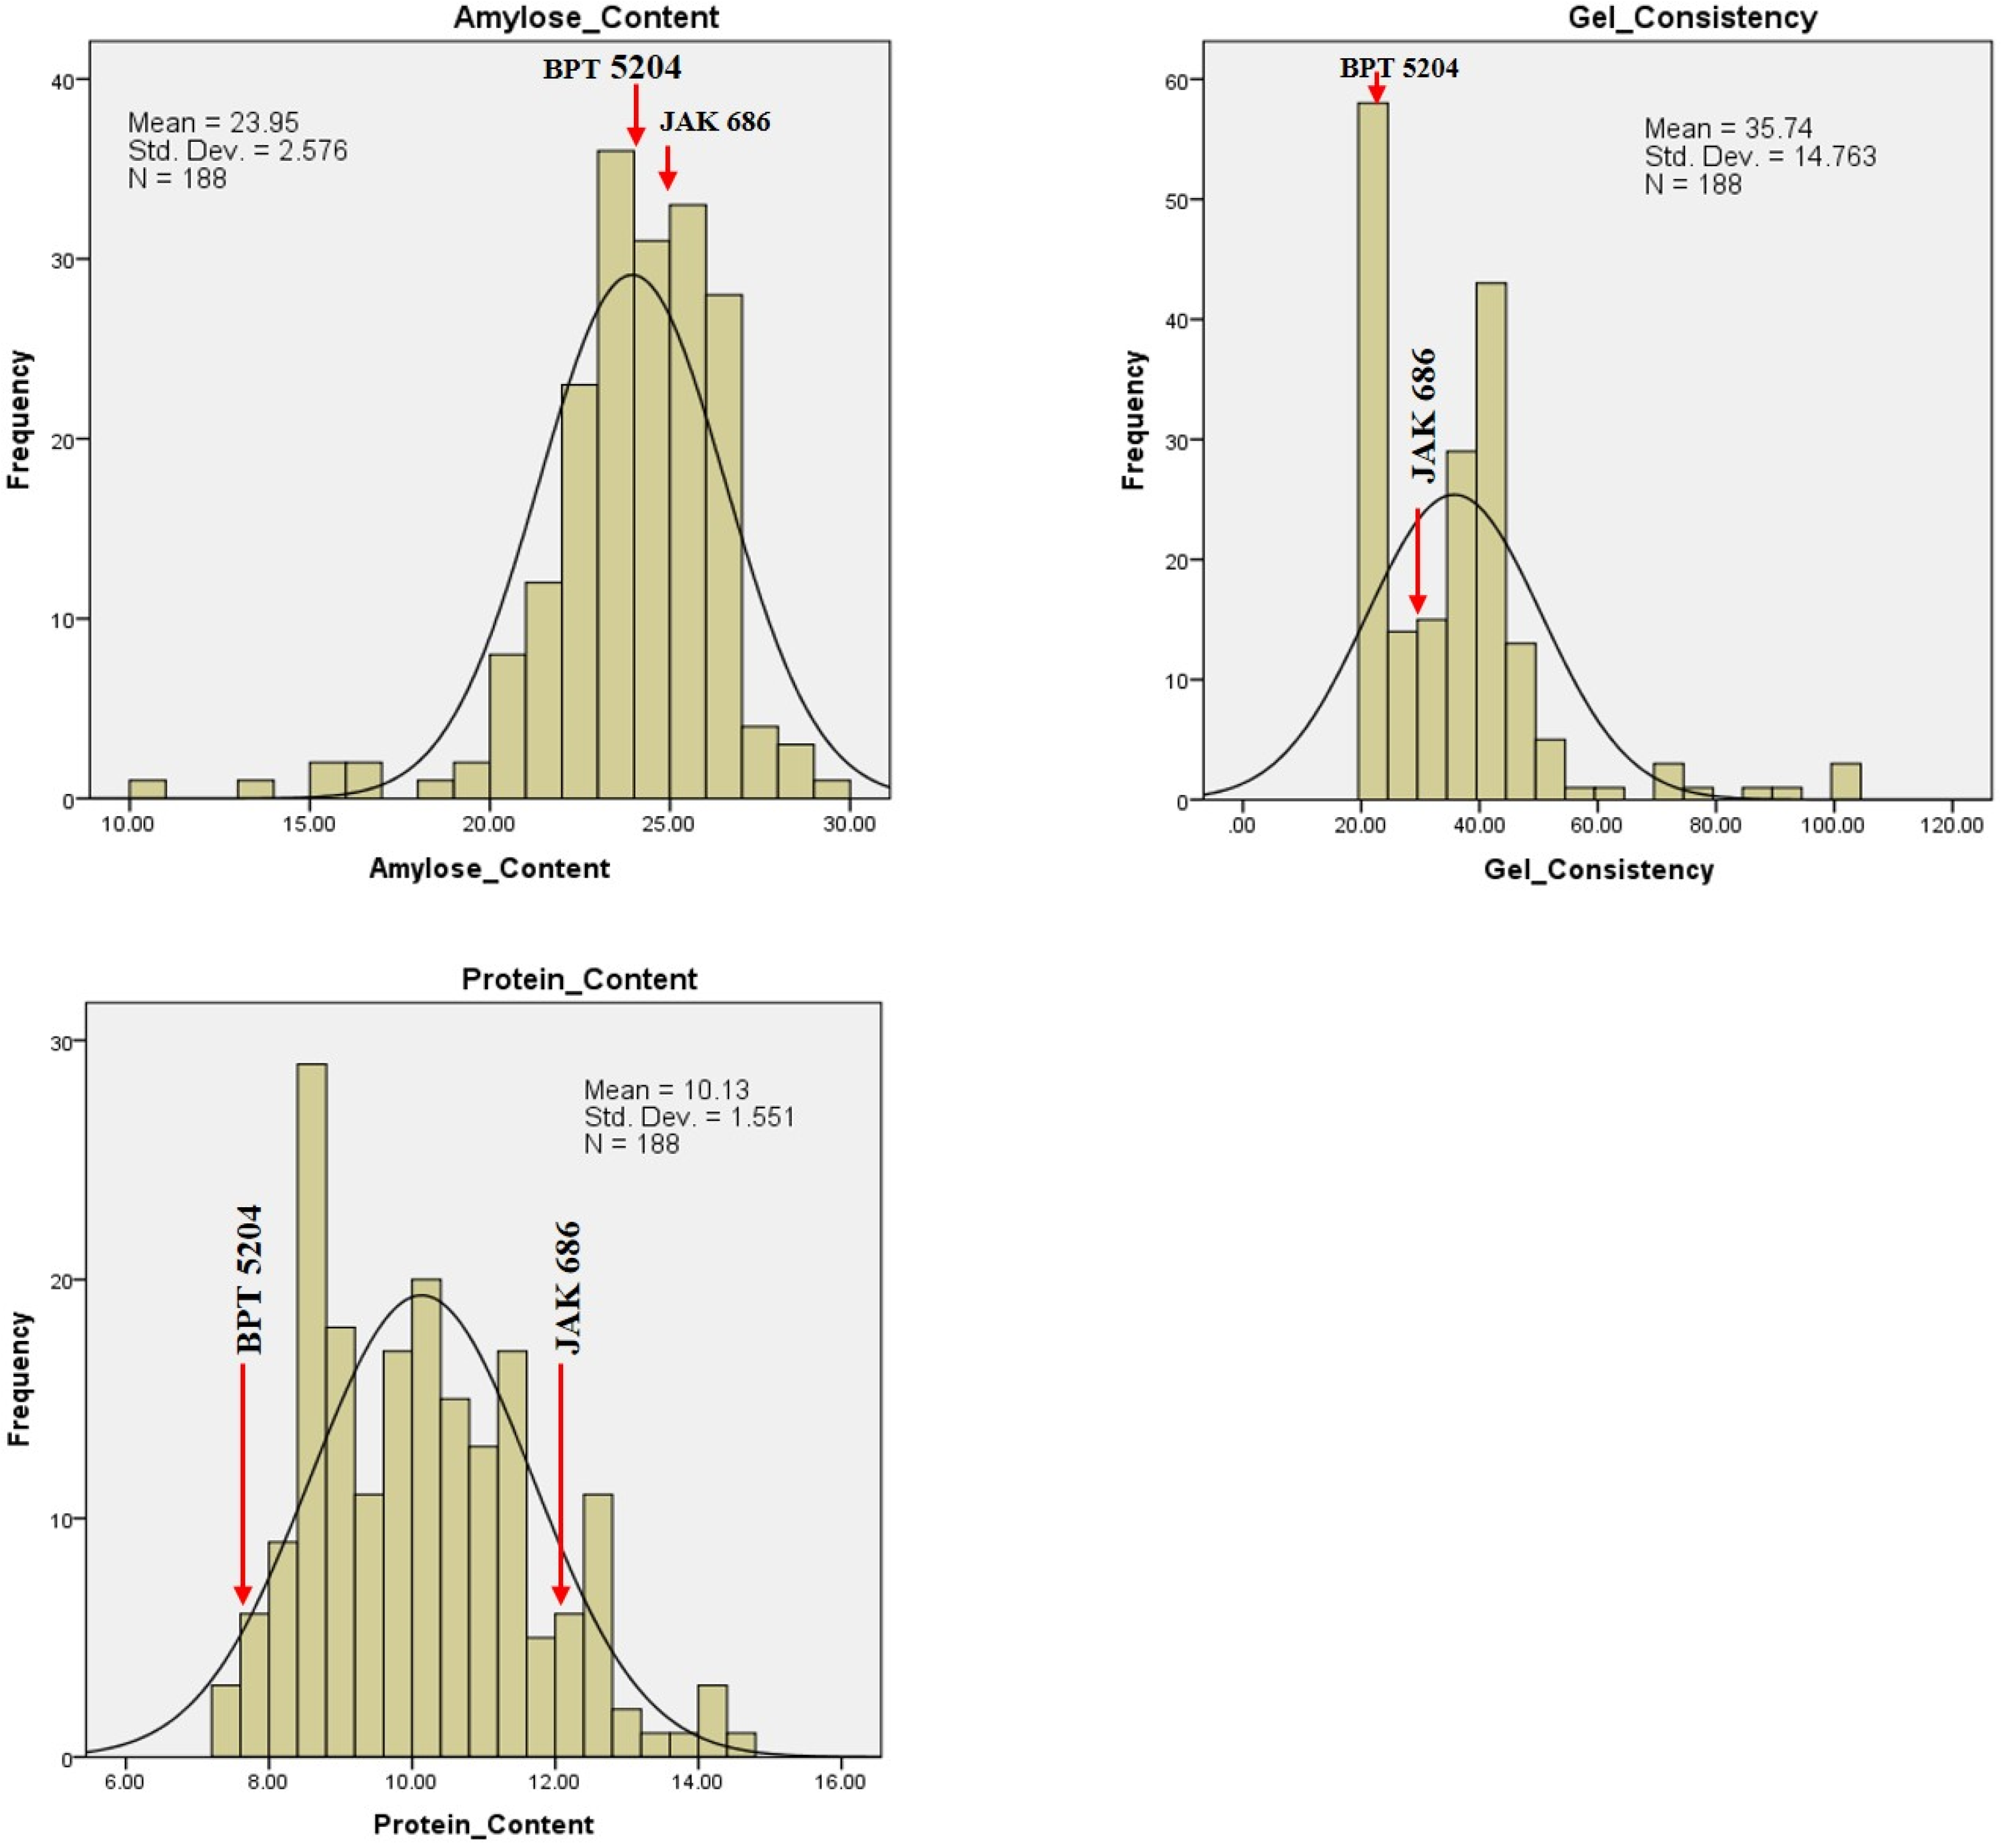
2.4. Variability for GPC, Grain Quality Traits, and Yield

Frequency distribution plots for GPC, grain quality, yield, and yield attributing traits showed transgressive segregants for all the traits in one or both directions (Figure 8, Figure 9 and Figure 10). This could be due to the combination of favorable and unfavorable alleles from the parents, ‘BPT 5204’ and ‘JAK-686’. Using phenotypic data from the F2 population, a normal distribution and significant variability was observed, suggesting polygenic inheritance of the traits. The GPC ranged between 7.2% (F2-186) and 14.7% (F2-140), with an average GPC of 10.1% among the F2 population. Five F2 plants, F2-140, F2-12, F2-7, F2-147, and F2-41, had high GPC values of 14.67%, 14.36%, 14.32%, 13.60%, and 13.36%, respectively. Additionally, their respective GYPP values were 29.03 g, 19.12 g, 16.54 g, 25.90 g, and 15.87 g (Table 4).
Among the quality traits, GC exhibited the highest variation within the F2 population, ranging from 22 mm to 100 mm, with an average GC of 35.7 mm. AC showed a range from 10.14% (in F2-127) to 29.01% (in F2-66), with an average AC of 24.05%. Among the yield attributing traits, GPP, followed by PH and GYPP, showed the highest variation in the F2 population. The values ranged from 24 to 169 for GPP, 65 cm to 143 cm for PH, and 5.12 g to 55.04 g for GYPP.
Correlation studies revealed a negative association of PC with both AC and GC. AC and GC were also negatively correlated (Table 5). AC showed a significant negative correlation with KL and L:B, but a positive correlation with KB. KL had a significant positive correlation with multiple yield-related traits, including GYPP. However, KB showed a significant positive association only with TGW. GPP and TGW exhibited a significant positive correlation with KL, PTPP, and GYPP. GYPP showed a positive and significant association with TGW, GPP, PL, and PTPP.
Among the thirteen traits, the present work revealed high heritability with moderate GAM for TGW (61.4, 14.1), DFF (68.5, 17.3), and AC (75.4, 16.6). We observed high heritability and high GAM for PH (93, 25.3), PTPP (89.2, 71.7), PL (96.4, 28.6), GPP (72.0, 34.3), GYPP (97, 80.8), and GC (90.3, 76.9). The study detected moderate heritability and GAM for GPC (52.4, 16.2). Further, we observed low heritability and GAM for KL (35.1, 2.8), KB (44.9, 4.8), and L:B (33.8, 4.6; Table 6).

3. Discussion

The majority of modern-day mega/popular rice cultivars are low in GPC and other essential micronutrients [29,30]. The GPC of milled rice is about 7.0%, whereas brown rice contains 8.0–10.0%. Recent reports have indicated a wide variation for GPC in rice germplasm [30,31]. This existing variability can be exploited for the identification of QTLs, and these QTLs could be utilized through marker-assisted back cross (MABC) breeding to improve high-yielding mega varieties like BPT 5204 (or any other), which have high market acceptability. Both GPC and grain quality can be improved through MABC. The global burden of PEM in 2019 was approximately 148.0 million, ~100.0 million in Asia and 29.0 million in Africa [32]. Interestingly, rice is the major staple diet in these two regions. Hence, any efforts to address the issue of PEM specifically in these regions should include the improvement of GPC along with other nutrients in milled rice. Conventional breeding efforts have had limited success in improving GPC due to its complex nature coupled with the influence of environment. Therefore, exploiting the genetic basis of GPC, coupled with MABC, can aid in developing high-GPC varieties with desirable qualities. Several studies have identified genomic regions affecting GPC, but most of these are for brown rice. Therefore, the present study focused on identifying QTLs for GPC in milled rice, grain quality, and other traits.
BPT 5204 is one of the most popular mega varieties of India. The consumers prefer it due to its excellent eating and cooking quality along with high yield, desirable grain quality, and stable performance across different ecosystems. However, BPT 5204 has a low GPC (7.0–8.0%). In the present study, JAK-686, a high-GPC line (12.5% in milled rice), is the donor parent for GPC. We used the F2 population developed from BPT5204 X JAK-686 for identifying genomic regions associated with GPC. Correlation analysis revealed interesting results among the quality traits. AC exhibited a significant negative correlation with GC, indicating that the simultaneous improvement of AC and GC is not possible [33]. However, Roy et al. (2021) [29] reported a positive correlation between AC and GC. Interestingly, PC did not exhibit any significant association with any of the grain quality traits [28]. Suresh et al. (2016) [30] and Roy et al. (2021) [34] reported a positive correlation of KL with yield, and a significant positive correlation with TSW, demonstrating that these traits can be selected and improved simultaneously. GYPP showed a significant positive correlation with yield-related traits like TGW, GPP, PL, and PTPP [34,35,36].
TGW, DFF, and AC exhibited high heritability coupled with moderate GAM. Heritability greater than the genetic advance indicates the influence of environment [37]. We can improve such traits by intermating superior genotypes in the segregating population developed by combination breeding [38]. PH, PTPP, PL, GPP, GYPP, and GC exhibited high heritability and high GAM. Chaudhari et al. (2007) [39] also observed similar results. Since additive gene action largely influences these traits, the potential for their improvement is through direct selection. Accordingly, selection based on these traits is more reliable. GPC exhibited moderate heritability and GAM. This study is consistent with the results of Bruno et al. (2017) [40], suggesting a moderate heritability of protein with higher variation in the population compared to that in the parents due to environmental interaction. Low heritability and GAM were observed for KL, KB, and L:B. These results agree with those reported in other studies [41,42,43]. High heritability coupled with high GAM indicates that most of the heritability is due to additive gene action, making selection potentially effective. Hence, among the thirteen traits studied, selection is effective for PH, PTPP, PL, GPP, GYPP, and GC. Selection for these traits would improve the genotypic value of the selected plants beyond that of their parents [40].
We identified four QTLs (qPC1.1, qPC1.2, qPC5.1, and qPC5.2) affecting GPC in milled rice, two each on chromosome 1 and chromosome 5. qPC1.2, in the marker interval RM562-RM11307, explained 15.7% of the phenotypic variance. Zhong et al. (2011) [21] reported two QTLs (qPr1 and qPr7) for GPC in milled rice in the marker interval RM493-RM562 and RM445-RM418. The qPr1 allele from Zhenshan 97B reduced the GPC, while qPr7 increased the GPC of milled rice. Earlier research has identified numerous QTLs associated with GPC, mostly in brown rice [14,20,44,45]. Several QTLs for GPC in brown rice were identified using different types of populations, including ‘Recombinant Inbred Lines (RILs)’ [27,46] and a ‘Doubled Haploid (DH)’ population [10]. Though these are interesting results, in most of the studies, parents exhibited a narrow range for GPC. In contrast, the parents utilized in the present study showed significant variation for GPC in milled rice, aiding in a more accurate QTL mapping of genomic regions governing GPC. Identifying QTLs in brown rice is useful, but milled rice is more important, as consumers eat brown rice less frequently than milled rice. Further, although researchers have detected numerous QTLs for GPC using different mapping populations, they have characterized only a few. Peng et al. (2014) [25] cloned and validated the qPC1 locus identified by Wang et al. (2008) [47].
qPC1 in rice controls GPC by regulating the synthesis and accumulation of different protein fractions [25]. qPC1 encodes a ‘putative amino acid transporter (OsAAP6)’. OsAAP6 has a positive effect on GPC in rice, indicating that a higher level of expression of OsAAP6 correlates with higher GPC. OsAAP6 significantly enhances the root absorption of amino acids and effects their distribution. The palatability of Nangeng 46, a japonica cultivar, improves after the introduction of qPC1 [48]. In addition, qGPC-10 was cloned and its function was validated [3]. OsGluA2, a glutelin type-A2 precursor, is the candidate gene underlying qGPC-10. OsGluA2 functions as a positive regulator of GPC and exerts a pleiotropic effect on the quality of rice grains. OsGluA2 had a significant effect on GPC and the majority of the protein fractions, with the largest effect on glutelin. The increased or reduced genetic expression of OsAAP6 and OsGluA2 would be the primary targets for high/low GPC breeding [14]. Consumers generally consider high GPC as an indicator of superior nutritional value. However, researchers have found a negative correlation between high GPC and eating quality [14]. High GPC in rice results in a compact endosperm, which negatively affects its palatability.
Amylose content (AC) and gel consistency (GC) are two important traits that affect both the cooking and eating quality of rice. Based on AC, rice is classified into glutinous (sticky) and non-glutinous (non-sticky) types. Consumer demands differ widely based on the stickiness of the rice. Numerous studies have underscored the importance of AC and GC. Several QTLs influencing grain quality traits were identified in both indica and japonica rice. We have identified three QTLs (qAC 3.1, qAC 6.1, and qAC 7.1) for AC. Cheng et al. (2014) [49] detected three QTLs on chromosomes 3, 5, and 6. Earlier studies reported multiple QTLs in chromosome 1 for AC [50,51,52,53]. The Wx locus is the major determinant of AC. The Wx locus encodes the ‘Waxy’ gene, the major candidate gene responsible for the amylose content in rice [54]. Allelic variations in the Wx gene play a crucial role in determining amylose content in rice grains and act as key regulatory factors influencing eating and cooking quality. The Wxa and Wxlv alleles are associated with AC levels exceeding 25%, whereas Wxin exhibits AC levels ranging from 18% to 22%. The Wxb allele corresponds to AC levels between 15% and 18%. Additionally, alleles such as Wxmw, Wxla, Wxmq, Wxmp, Wxop, and Wxhp demonstrate AC levels between 10% and 15%. Among all variants, the wx allele exhibits the lowest AC level, approximately 2% [55].
We have identified five QTLs (qGC1.1, qGC3.1, qGC5.1, qGC9.1, and qGC12.1) for GC. Among the five QTLs, qGC1.1 and qGC3.1 have a negative additive effect, indicating that the contributing allele(s) came from BPT 5204. For the other QTLs, the contributing allele came from JAK 686, the high-GPC parent. Multiple QTLs for GC have been reported across the rice genome using different mapping populations [56,57,58]. Researchers have identified the Wx locus on chromosome 6 as the primary determinant of GC, explaining 38.9% of the variation. Further, QTL studies for AC and GC have revealed that the Wx and Alk loci, located on short arm of chromosome 6, control these traits along with gelatinization temperature [47]. Two QTLs for KL, qkl1.1 and qkl5.1, were identified on chromosomes 1 and 5. Similarly, Singh et al. (2012) [59] identified a KL QTL on chromosome 1 linked to the marker RM 431.
Rabiei et al. (2004) [60] identified five QTLs on chromosomes 2, 3, 5, 7, and 8, with each explaining more than 10% of the PVE. For KB, one QTL, qkb8.1, was identified on chromosome 8. Rabiei et al. (2004) [60] detected a QTL, qGW8, controlling KB on chromosome 8. Fine mapping of this QTL identified OsSPL16, squamosa promoter-binding protein-like 16, and a member of the SBP domain-containing transcription factors [61]. OsSPL16 encodes a protein that acts as a positive regulator of cell proliferation. A higher level of expression of OsSPL16 promotes cell division and has a positive impact on grain width. On the contrary, a loss-of-function mutation of OsSPL16 in basmati improves grain quality by producing more slender grains. Song et al. (2007) [62] successfully cloned the QTL GW2 (Grain Width on Chromosome 2), which encodes a RING-type E3 ubiquitin ligase that regulates rice grain width. GW2 functions as a negative regulator of cell division by directing its substrate for proteasomal degradation. The loss of function in gw2 leads to an increase in cell numbers within the spikelet hull, thereby contributing to greater grain width, weight, and yield. The major QTL, qSW5/GW5 (Seed Width/Grain Width on Chromosome 5), plays a crucial role in determining grain width and has been mapped to a 21–22 kb genomic region [63,64]. GW5 functions within the brassinosteroid signaling pathway, modulating grain development by inhibiting the kinase activity of GSK2 on OsBZR1 and DLT, thereby regulating grain width [65].
qlb1.1, a QTL for kernel length-to-breadth (L:B), was identified on chromosome 1. qlb 1.1 exhibited positive additive effects, indicating that the contributing allele came from JAK-686. Rabiei et al. (2004) [60] identified QTLs controlling grain shape (based on L:B) on chromosomes 2, 3, 5, 7, and 8, while Chen et al. (2021) [66] identified qGS7. qGS7 contained the gene GL7/GW7, characterized by Wang et al. (2015) [67]. The upregulation of GW7 expression increased the production of slender grains, thereby enhancing the grain’s appearance and quality. Zhao et al. (2018) [68] identified a QTL, GS9 (Grain Shape Gene on Chromosome 9), that negatively influences the length-to-width ratio of rice grains. GS9 regulates grain morphology by modulating horizontal cell division and vertical cell elongation, thereby affecting overall grain shape. qlb1.1, identified in this study, appears to be a novel QTL, as no loci for L:B have been reported earlier on chromosome 1. Zhao et al. (2022) [2] have identified a significant QTL for PTPP on Chromosome 5, while the present work identified QTLs for PTPP on chromosome 9 and 12. Interestingly, a significant QTL for grain yield was identified on chromosome 8 [61], supporting the present findings. Another study identified cytochrome b561 as the gene underlying qGY8.1, a QTL for yield [69]. Cytochrome b561 belongs to a protein family that plays an important role in plant growth and development, particularly under drought conditions.
We identified QTLs for GPC, quality traits, and yield, which can be used for fine mapping and the identification of specific candidate genes for these traits. This information can used to develop functional markers for trait improvement through marker-assisted backcross breeding (MABC). Additionally, the present findings suggest that further analysis is needed to fully understand the genetic basis of the significant variation observed among the studied traits.

4. Materials and Methods
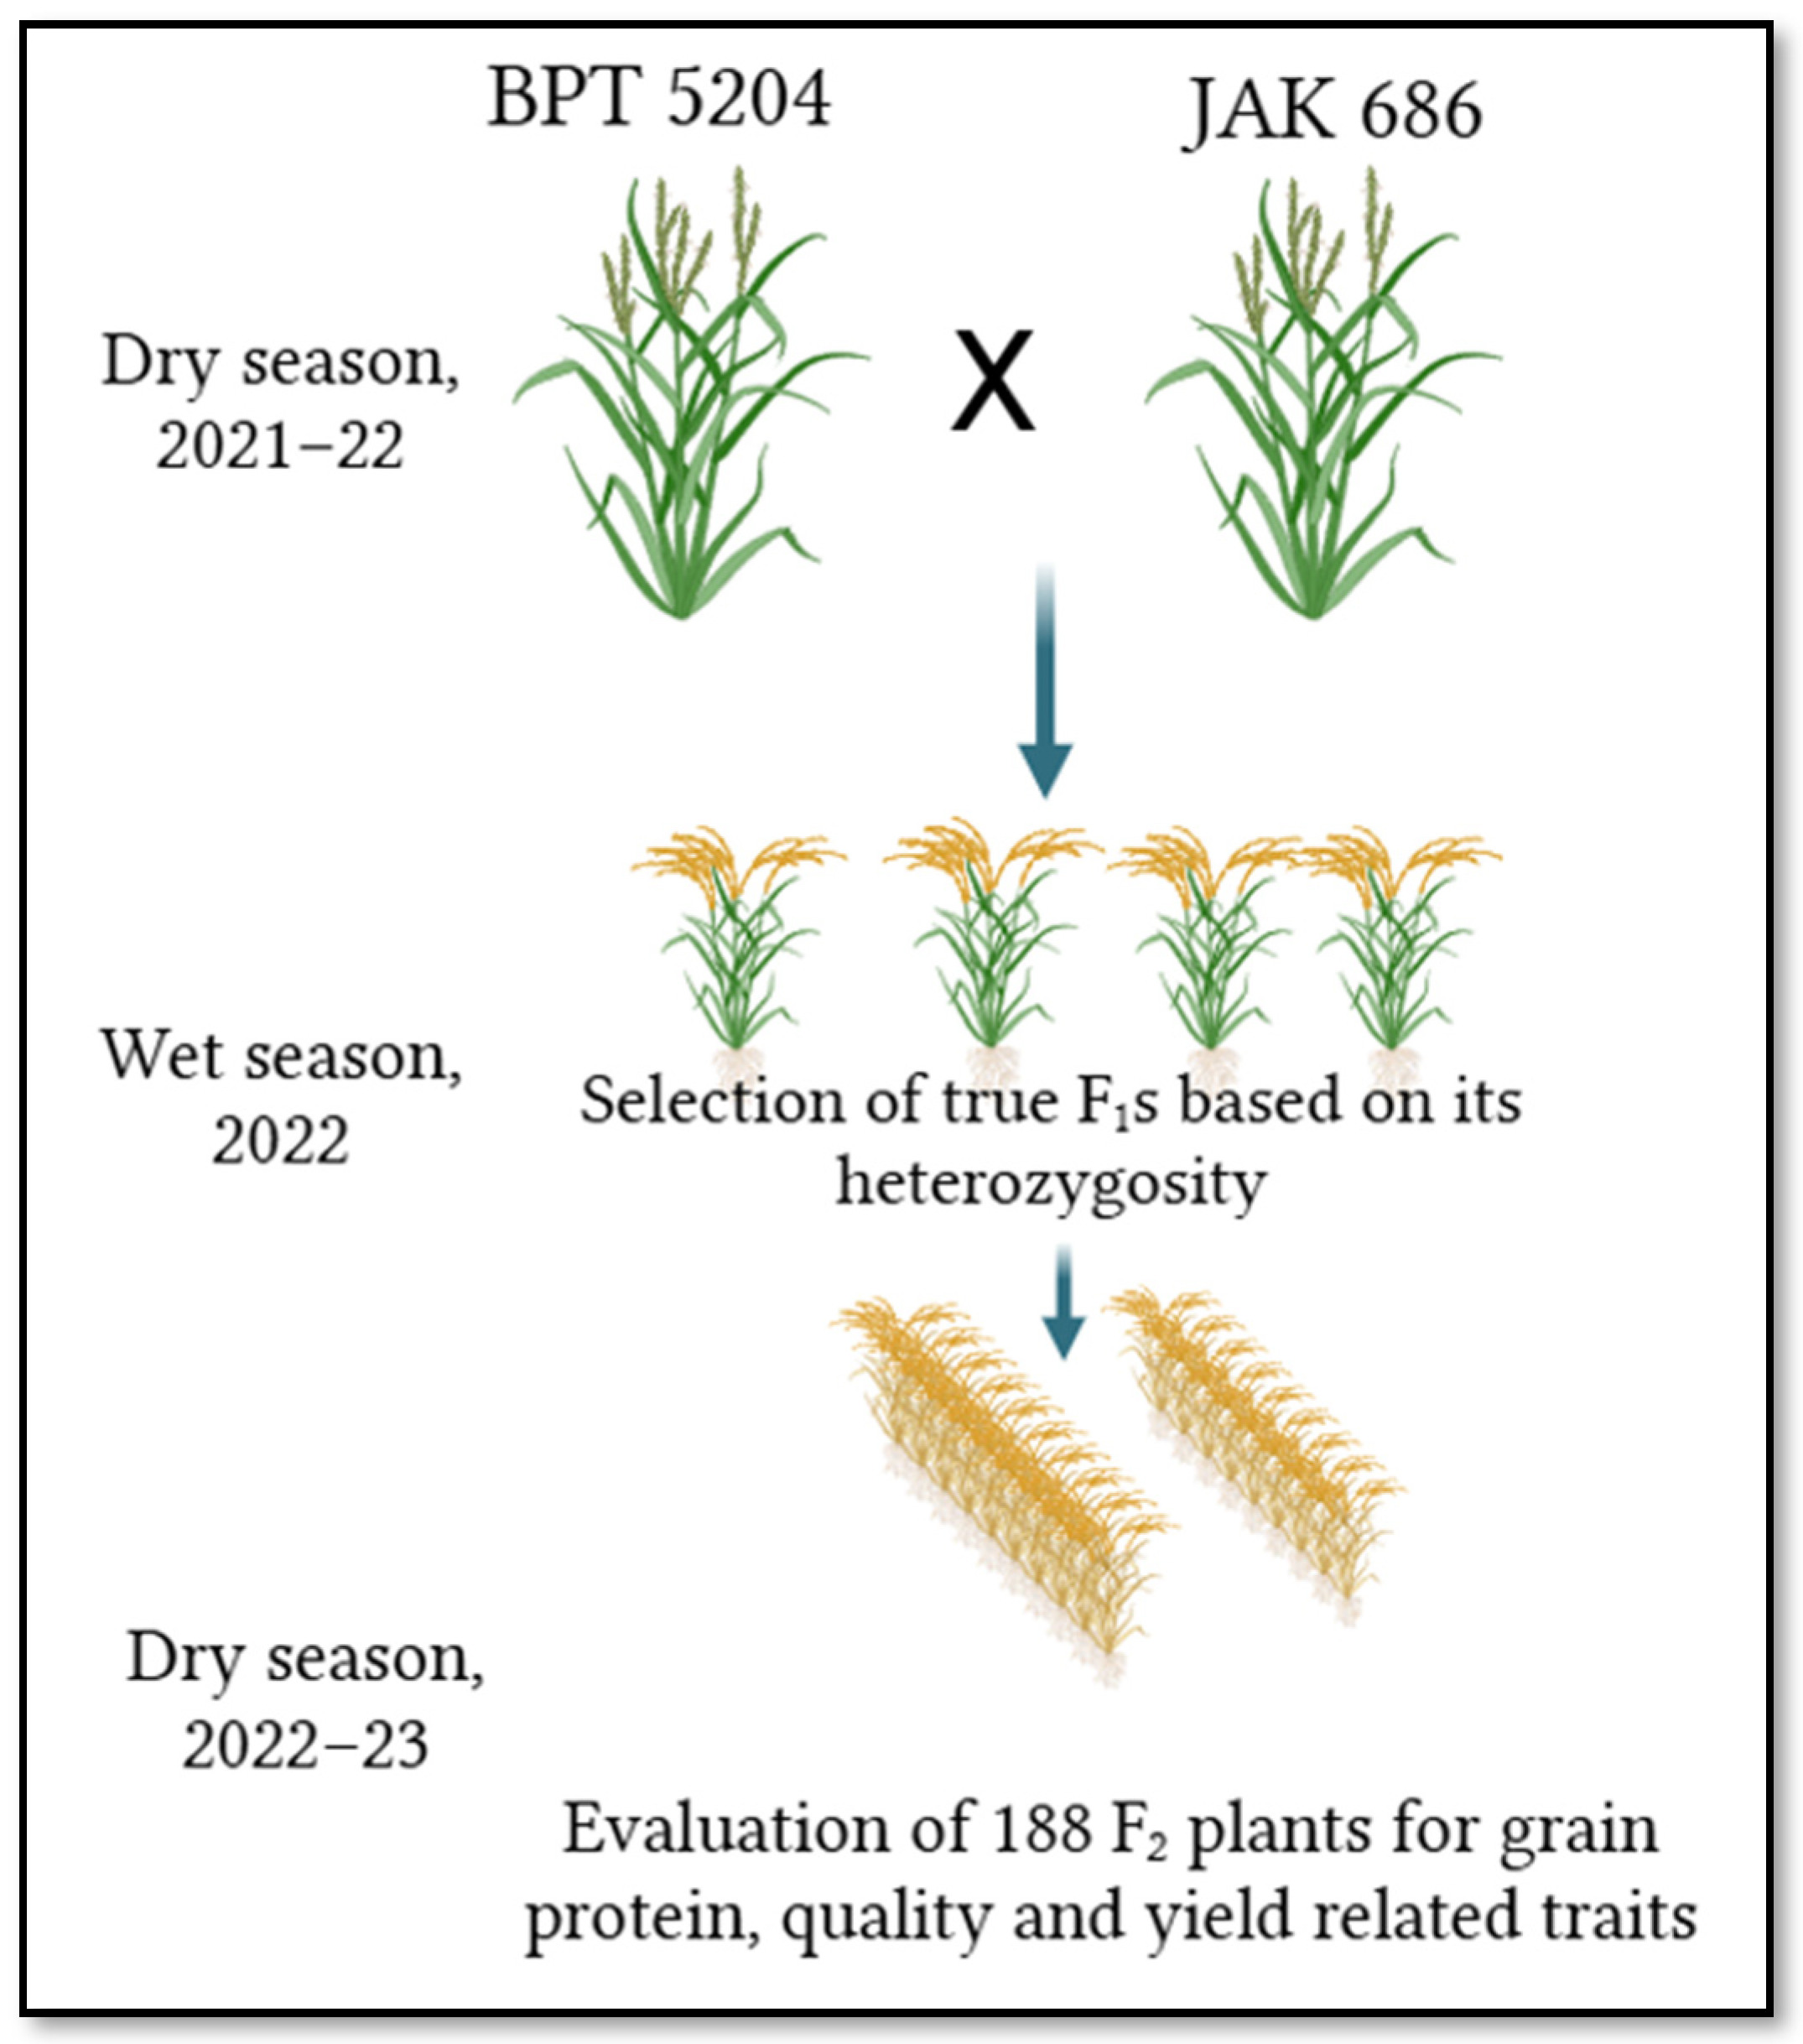
4.1. Plant Material

BPT 5204 (female) and JAK-686 (male) are the two diverse parents (for grain protein content) used in the development of the F2 population. BPT 5204 is a high-yielding popular variety with medium-slender grain, an excellent cooking and eating quality, but with low grain protein content (7.0–8.0% in milled rice). JAK-686 is an early maturing and high-grain-protein-content (~12.5%) germplasm line. We developed a population of 188 F2 individuals from a cross between “BPT 5204” and “JAK-686” made during the dry season of 2021–2022. True F1s were selfed in the wet season of 2022 to generate 188 F2 individual plants. During the dry season of 2022–2023, the phenotyping and genotyping of 188 F2 plants for protein content, quality trait yield, and their component traits was completed. The field experiments were conducted at the research farm of ICAR—Indian Institute of Rice Research, Hyderabad.

4.2. Grain Protein Content, Grain Quality, Yield, and Yield Attributing Traits

The transplanting of F2 plants occurred at 25 days after sowing with an interrow spacing of 20 cm and an interplant spacing of 15cm. Following the recommended agronomic practices and pest control measures ensured a healthy crop. The F2 population was evaluated for seven yield and yield attributing traits, viz., plant height (PH; cm), productive tillers per plant (PTPP), panicle length (PL; cm), grains per panicle (GPP), days to 50% flowering (DFF), 1000-grain weight (TW; g), and grain yield per plant (GYPP; g). Screening of F2 mapping population was also carried out for GPC (%) and quality traits, viz., kernel length (KL; mm), kernel breadth (KB; mm), length:breadth ratio (L:B), gel consistency (GC; mm), and amylose content (AC; %). We estimated the nitrogen content of milled rice through the micro-Kjeldahl distillation method [70]. The nitrogen value thus obtained was converted to protein content by multiplying it by a correction factor of 6.25 [71]. Genetic variability parameters like the Genotypic Coefficient of Variation (GCV) and Phenotypic Coefficient of Variation (PCV) were calculated as per Burton and Dewane (1953) [72], along with heritability and genetic advance as a percentage (GAM) [73,74]. The correlations were determined using R software version 1.4.1717 while the frequency distribution plots were derived using IBM SPSS Statistics 20.

4.3. QTL Analysis

We extracted DNA from leaf samples using the CTAB method and assessed its quality and quantity using a UV spectrophotometer at both 260 nm/280 nm and 260 nm/230 nm. Genomic DNA was isolated from 188 fresh leaf samples using the CTAB method, and the F2 population was genotyped. We used a working DNA concentration of 40 ng/µL for genotyping. A set of 1280 markers, comprising 1220 SSRs and 60 InDels, evenly distributed across the rice genome were used to study parental polymorphism. The SSR and InDel markers which have been previously reported in the universal core genetic map for rice [75], the genome-wide InDel marker set for allele discrimination between rice (Oryza sativa), and the other seven AA-genome Oryza species [76], respectively, were used for the polymorphism study between parents. Some SSR markers for the rice genome were retrieved from the Gramene Marker Database (https://gramene.org/archive (accessed on 27 December 2022)). Markers were selected from all 12 chromosomes of rice (Oryza sativa L.) to ensure comprehensive genome-wide coverage.
Among the 1280 markers, 103 were polymorphic. We screened the F2 population using these 103 polymorphic markers. PCR was carried out in a Bio-Rad T100TM Thermal Cycler (Bio-Rad, Hercules, CA, USA) with a reaction volume of 10 µL, containing 15 ng of genomic DNA, primers at concentrations ranging from 5 to 10 pM, and Emerald Amp GT PCR Master Mix (Takara Bio India, New Delhi, India). The details of PCR cycles are as follows: initial denaturation at 94 °C for 5 min, followed by 35 cycles of denaturation at 94 °C for 30 s, annealing at 55 °C for 30 s, extension at 72 °C for 1 min, and a final extension step at 72 °C for 10 min. Amplified products were separated using 3% agarose gel electrophoresis in 1 × TAE buffer at 120 V for 2 h. Ethidium bromide staining was used to visualize bands and a gel documentation system was employed to document the results.
SSRs and InDels were scored as co-dominant markers, with “A” representing the presence of the JAK-686 allele, “B” representing the presence of the BPT 5204 allele, and “AB” indicating heterozygous bands. A Chi-square test was conducted to assess the segregation ratio in the F2 mapping population. We then constructed a linkage map using genotypic data from 188 F2 plants and 103 polymorphic markers spanning all the rice chromosomes. We developed the genetic linkage map using ICIM and utilized Kosambi’s mapping function to convert recombination frequencies into centiMorgan (cM). QTL mapping was carried out through inclusive composite interval mapping of additive QTLs (ICIM-ADD) and inclusive composite interval mapping of epistatic QTLs (ICIM-EPI), implemented in QTL IciMapping v4.1. We considered a QTL significant if it exceeded the logarithm of odds (LOD) threshold of 2.5, determined through a 1000-permutation test. Stepwise regression analysis was utilized to estimate the percentage of phenotypic variance explained (PVE or R2) by individual QTLs and to determine their additive effects at the LOD peak positions.

5. Conclusions

Improving the grain protein content in rice is essential for addressing protein energy malnutrition, particularly in developing nations. In the present study, we have successfully identified four QTLs for GPC and three for amylose content in milled rice. qPC1.2, the major QTL, was located on chromosome 1, explaining about 15.7% of the phenotypic variation. Further characterization of the identified GPC QTLs will aid in identification of the candidate gene(s). Subsequently, this information on genomic regions will be useful in the introduction of high-GPC traits into elite high-yielding backgrounds. Additionally, the F2–3 progeny with 13–14% protein content identified in the present study can be stabilized through generation advancement (F5 or F6). The stable material will have a high GPC, coupled with a high grain yield and desirable grain and cooking quality. This cultivar can fetch additional income for farmers as it is of premium grain and nutritional quality. Overall, the present study successfully identified valuable genomic resources for GPC and other quality traits in milled rice that will be useful for researchers, farmers, and consumers.

Supplementary Materials

The following supporting information can be downloaded at: https://www.mdpi.com/article/10.3390/plants14060905/s1, Table S1: Details of both parents used for developing F2 population; Table S2: Details of 103 polymorphic markers; Table S3: Details of Di-Genic epistatic QTLs detected for GPC, grain quality and yield traits in F2 population.

Author Contributions

Software, formal analysis, investigation, visualization, V.B.; methodology, validation, S.Y.; methodology, validation, resources, S.T.; formal analysis, data curation, B.B.; writing—review and editing, D.K.; methodology, validation, visualization, N.N.C.; methodology, writing—review and editing, J.B.; conceptualization, writing—original draft preparation, R.M.S.; conceptualization, writing—original draft preparation, supervision, project administration, funding acquisition, A.K.J. All authors have read and agreed to the published version of the manuscript.

Funding

We would like to thank the Science & Engineering Research Board (SERB), Department of Science and Technology, Government of India, grant number CRG/2023/002079, for funding this work.

Data Availability Statement

Data are available from the authors upon reasonable request.

Acknowledgments

We would also like thank and acknowledge the help provided by Divya Balakrishnan, K Suman, and Late Malathi from the ICAR—Indian Institute of Rice Research, Hyderabad.

Conflicts of Interest

The authors declare no conflicts of interest.

References

  1. Liu, L.; Cong, W.-F.; Suter, B.; Zhang, F.; van der Werf, W.; Stomph, T.J. How much can Zn or Fe fertilization contribute to Zn and Fe mass concentration in rice grain? A global meta-analysis. Field Crops Res. 2023, 301, 109033. [Google Scholar] [CrossRef]
  2. Zhao, L.; Zhao, C.F.; Zhou, L.H.; Yao, S.; Zhao, Q.Y.; Chen, T.; Wang, C.L. Mapping QTLs for rice (Oryza sativa L.) grain protein content via chromosome segment substitution lines. Cereal Res. Commun. 2022, 50, 699–708. [Google Scholar] [CrossRef]
  3. Yang, Y.; Guo, M.; Sun, S.; Zou, Y.; Yin, S.; Liu, Y.; Tang, S.; Gu, M.; Yang, Z.; Yan, C. Natural variation of OsGluA2 is involved in grain protein content regulation in rice. Nat. Commun. 2019, 10, 1949. [Google Scholar] [CrossRef] [PubMed]
  4. Kawakatsu, T.; Yamamoto, M.P.; Hirose, S.; Yano, M.; Takaiwa, F. Characterization of a new rice glutelin gene GluD-1 expressed in the starchy endosperm. J. Exp. Bot. 2008, 59, 4233–4245. [Google Scholar] [CrossRef]
  5. Xu, J.H.; Messing, J. Amplification of prolamin storage protein genes in different subfamilies of the Poaceae. Theor. Appl. Genet. 2009, 119, 1397–1412. [Google Scholar] [CrossRef] [PubMed]
  6. Lou, G.; Bhat, M.A.; Tan, X.; Wang, Y.; He, Y. Research progress on the relationship between rice protein content and cooking and eating quality and its influencing factors. Seed Biol. 2023, 2, 16. [Google Scholar] [CrossRef]
  7. Hamaker, B.R.; Griffin, V.K. Effect of disulfide bond containing protein on rice starch gelatinization and pasting. Cereal Chem. 1993, 70, 377–380. [Google Scholar]
  8. Park, Y.J.; Lee, J.K.; Kim, N.S. Simple Sequence Repeat Polymorphisms (SSRPs) for evaluation of molecular diversity and germplasm classification of minor crops. Molecules 2009, 14, 4546–4569. [Google Scholar] [CrossRef]
  9. Bhat, R.; Singh, A.K.; Salgotra, R.K.; Sharma, M.; Mushtaq, M.; Bagati, S.; Hangloo, S.; Singh, A. Detection of QTL for panicle architecture in F2 population of rice. J. Genet. 2019, 98, 50. [Google Scholar] [CrossRef]
  10. Aluko, G.; Martinez, C.; Tohme, J.; Castano, C.; Bergman, C.; Oard, J.H. QTL mapping of grain quality traits from the interspecific cross Oryza sativa× O. glaberrima. Theor. Appl. Genet. 2004, 109, 630–639. [Google Scholar] [CrossRef]
  11. Hu, Z.L.; Li, P.; Zhou, M.Q.; Zhang, Z.H.; Wang, L.X.; Zhu, L.H.; Zhu, Y.G. Mapping of quantitative trait loci (QTLs) for rice protein and fat content using doubled haploid lines. Euphytica 2004, 135, 47–54. [Google Scholar] [CrossRef]
  12. Huang, T.; Yu, B.; Tondi-yacouba, N.; Gao, G.J.; Zhang, Q.L.; He, Y.Q. QTLs mapping of protein content and crude fat content in rice. Hu Bei Agric. Sci. 2012, 51, 4709–4713, (In Chinese with English Abstract). [Google Scholar]
  13. Hu, B. Mapping of QTLs for the Major Rice Grain Qualities by Using Chromosome Segment Substitution Lines. Master’s Thesis, Yangzhou University, Yangzhou, China, 2013. (In Chinese with English Abstract). [Google Scholar]
  14. Alam, M.; Tan, X.; Zhang, H.; Lou, G.; Yang, H.; Zhou, Y.; He, Y. QTL Mining and validation of grain nutritional quality characters in rice (Oryza sativa L.) using two introgression line populations. Agriculture 2023, 13, 1725. [Google Scholar] [CrossRef]
  15. Lee, S.; Park, J.; Lee, J.; Shin, D.; Marmagne, A.; Lim, P.O.; Masclaux-Daubresse, C.; An, G.; Nam, H. OsASN1 Overexpression in Rice Increases Grain Protein Content and Yield under Nitrogen-Limiting Conditions. Plant Cell Physiol. 2020, 61, 1309–1320. [Google Scholar] [CrossRef] [PubMed]
  16. Peng, B.; Sun, X.; Tian, X.; Kong, D.; He, L.; Peng, J.; Liu, Y.; Guo, G.; Sun, Y.; Pang, R.; et al. OsNAC74 affects grain protein content and various biological traits by regulating OsAAP6 expression in rice. Mol. Breed. 2023, 43, 87. [Google Scholar] [CrossRef] [PubMed]
  17. Shi, Y.; Zhang, Y.; Sun, Y.; Xie, Z.; Luo, Y.; Long, Q.; Feng, J.; Liu, X.; Wang, B.; He, D.; et al. Natural variations of OsAUX5, a target gene of OsWRKY78, control the neutral essential amino acid content in rice grains. Mol. Plant. 2023, 16, 322–336. [Google Scholar] [CrossRef]
  18. Terao, T.; Hirose, T. Control of grain protein contents through SEMIDWARF1 mutant alleles: sd1 increases the grain protein content in Dee-geo-woo-genbut not in Reimei. Mol Genet. Genom. 2015, 290, 939–954. [Google Scholar] [CrossRef]
  19. Meng, L.; Li, H.; Zhang, L.; Wang, J. QTL IciMapping: Integrated software for genetic linkage map construction and quantitative trait locus mapping in biparental populations. Crop J. 2015, 3, 269–283. [Google Scholar] [CrossRef]
  20. Jang, S.; Han, J.H.; Lee, Y.K.; Shin, N.H.; Kang, Y.J.; Kim, C.K.; Chin, J.H. Mapping and validation of QTLs for the amino acid and total protein content in brown rice. Front. Genet. 2020, 11, 240. [Google Scholar] [CrossRef]
  21. Zhong, M.; Wang, L.Q.; Yuan, D.J.; Luo, L.J.; Xu, C.G.; He, Y.Q. Identification of QTL affecting protein and amino acid contents in rice. Rice Sci. 2011, 18, 187–195. [Google Scholar] [CrossRef]
  22. Chattopadhyay, K.; Behera, L.; Bagchi, T.B.; Sardar, S.S.; Moharana, N.; Patra, N.R.; Sharma, S. Detection of stable QTLs for grain protein content in rice (Oryza sativa L.) employing high throughput phenotyping and genotyping platforms. Sci. Rep. 2019, 9, 3196. [Google Scholar] [CrossRef] [PubMed]
  23. Qin, Y.; Kim, S.; Sohn, J. QTL analysis of protein content in double-haploid lines of rice. Korean J. Crop Sci. 2009, 54, 165–171. [Google Scholar]
  24. Zheng, L.; Zhang, W.; Chen, X.; Ma, J.; Chen, W.; Zhao, Z.; Wan, J. Dynamic QTL analysis of rice protein content and protein index using recombinant inbred lines. J. Plant Biol. 2011, 54, 321–328. [Google Scholar] [CrossRef]
  25. Peng, B.; Kong, H.; Li, Y.; Wang, L.; Zhong, M.; Sun, L.; He, Y. OsAAP6 functions as an important regulator of grain protein content and nutritional quality in rice. Nat. Commun. 2014, 5, 4847. [Google Scholar] [CrossRef]
  26. Fiaz, S.; Sheng, Z.; Zeb, A.; Barman, H.N.; Shar, T.; Ali, U.; Tang, S. Analysis of genomic regions for crude protein and fractions of protein using a recombinant inbred population in Rice (Oryza sativa L.). J. Taibah Univ. Sci. 2021, 15, 579–588. [Google Scholar] [CrossRef]
  27. Yu, Y.H.; Li, G.; Fan, Y.Y.; Zhang, K.Q.; Min, J.; Zhu, Z.W.; Zhuang, J.Y. Genetic relationship between grain yield and the contents of protein and fat in a recombinant inbred population of rice. J. Cereal Sci. 2009, 50, 121–125. [Google Scholar] [CrossRef]
  28. Pradhan, S.K.; Pandit, E.; Pawar, S.; Bharati, B.; Chatopadhyay, K.; Singh, S.; Reddy, J.N. Association mapping reveals multiple QTLs for grain protein content in rice useful for biofortification. Mol. Genet. Genom. 2019, 294, 963–983. [Google Scholar] [CrossRef] [PubMed]
  29. Zimmerman, M.; Hurrel, R. Improving iron, zinc and vitamin A nutrition through plant biotechnology. Curr. Opin. Biotechnol. 2002, 13, 142–145. [Google Scholar] [CrossRef]
  30. Mahender, A.; Anandan, A.; Pradhan, S.K.; Pandit, E. Rice grain nutritional traits and their enhancement using relevant genes and QTLs through advanced approaches. SpringerPlus 2016, 5, 2086. [Google Scholar] [CrossRef]
  31. Mohanty, A.; Marndi, B.C.; Sharma, S.; Das, A. Biochemical characterization of two high protein rice cultivars from Assam rice collections. Oryza 2011, 48, 171–174. [Google Scholar]
  32. Zhang, X.; Zhang, L.; Pu, Y.; Sun, M.; Zhao, Y.; Zhang, D.; He, S. Global, regional, and national burden of protein–energy malnutrition: A systematic analysis for the global burden of disease study. Nutrients 2022, 14, 2592. [Google Scholar] [CrossRef] [PubMed]
  33. Khatun, M.M.; Ali, M.H.; Dela Cruz, Q.D. Correlation studies on grain physicochemical characteristics of aromatic rice. Pak. J. Biol. Sci. 2003, 6, 511–513. [Google Scholar]
  34. Roy, D.; Kohli, B.; Deo, I. Deciphering correlation studies for yield and quality traits in basmati rice (Oryza sativa L.) mated through line × tester mating design. J. Pharmacogn. Phytochem. 2021, 10, 906–910. [Google Scholar] [CrossRef]
  35. Suresh, N.K.; Reddy, V.R.; Chandramohan, Y. Correlation and path coefficient studies of yield and quality traits in rice (Oryza sativa L.). Res. J. Agric. Sci. 2016, 7, 606–609. [Google Scholar]
  36. Soharu, A.; Pandey, D.P. Correlation and path analysis for yield and its component traits in rice (Oryza sativa L.). J. Rice Res. 2018, 11, 1–5. [Google Scholar]
  37. Thongbam, P.D.; Raychaudhury, M.; Durai, A.; Das, S.P.; Ramesh, T.; Ramya, K.T.; Ngachan, S.V. Studies on grain and food quality traits of some indigenous rice cultivars of North-eastern hill region of India. J. Agric. Sci. 2012, 4, 259. [Google Scholar] [CrossRef]
  38. Samadia, D.K. Genetic variability studies in Lasora (Cordia myxa Roxb.). Indian J. Plant Genet. Resour. 2005, 18, 236–240. [Google Scholar]
  39. Chaudhari, M.; Motirmani, N.K.; Pravin, J. Variability and genetic divergence of aromatic rice (Oryza sativa L.). Ann. Agric. Res. New Ser. 2007, 28, 268–272. [Google Scholar]
  40. Bruno, E.; Choi, Y.S.; Chung, I.K.; Kim, K.M. QTLs and analysis of the candidate gene for amylose, protein and moisture content in rice (Oryza sativa L.). 3 Biotech 2017, 7, 40. [Google Scholar] [CrossRef]
  41. Fathima, M.A.; Geetha, S.; Amudha, K.; Uma, D. Genetic variability, frequency distribution and association analysis in ADT (R) 48 x Kavuni derived F2 population of rice (Oryza sativa L.). Electron. J. Plant Breed. 2021, 12, 659–666. [Google Scholar]
  42. Nandeshwar, B.C.; Pal, S.; Senapati, B.K.; De, D.K. Genetic variability and character association among biometrical traits in F2 generation of some Rice crosses. Electron. J. Plant Breed. 2010, 1, 758–763. [Google Scholar]
  43. Seneega, T.A.; Gnanamalar, R.P.; Parameswari, C.; Vellaikumar, S.; Priyanka, A.R. Genetic variability and association studies in F2 generation of rice (Oryza sativa L.). Electron. J. Plant Breed. 2019, 10, 512–517. [Google Scholar] [CrossRef]
  44. Wu, Y.B.; Li, G.; Zhu, Y.J.; Cheng, Y.C.; Yang, J.Y.; Chen, H.Z.; Ying, J.Z. Genome-wide identification of QTLs for grain protein content based on genotyping-by-resequencing and verification of qGPC1-1 in rice. Int. J. Mol. Sci. 2020, 21, 408. [Google Scholar] [CrossRef]
  45. Islam, M.Z.; Arifuzzaman, M.; Banik, S.; Hossain, M.A.; Ferdous, J.; Khalequzzaman, M.; Ali, M.P. Mapping QTLs underpin nutrition components in aromatic rice germplasm. PLoS ONE 2020, 15, e0234395. [Google Scholar] [CrossRef]
  46. Tan, Y.F.; Sun, M.; Xing, Y.Z.; Hua, J.P.; Sun, X.L.; Zhang, Q.F.; Corke, H. Mapping quantitative trait loci for milling quality, protein content and color characteristics of rice using a recombinant inbred line population derived from an elite rice hybrid. Theor. Appl. Genet. 2001, 103, 1037–1045. [Google Scholar] [CrossRef]
  47. Wang, L.; Zhong, M.; Li, X.; Yuan, D.; Xu, Y.; Liu, H.; Zhang, Q. The QTL controlling amino acid content in grains of rice (Oryza sativa) are co-localized with the regions involved in the amino acid metabolism pathway. Mol. Breed. 2008, 21, 127–137. [Google Scholar] [CrossRef]
  48. Cheng, A.; Ismail, I.; Osman, M.; Hashim, H. Mapping of quantitative trait loci for aroma, amylose content and cooked grain elongation traits in rice. Plant Omics 2014, 7, 152–157. [Google Scholar]
  49. Li, Z.F.; Wan, J.M.; Xia, J.F.; Zhai, H.Q.; Ikehashi, H. Identification of quantitative trait loci underlying milling quality of rice (Oryza sativa) grains. Plant Breed. 2004, 123, 229–234. [Google Scholar] [CrossRef]
  50. Nayak, D.K.; Sahoo, S.; Barik, S.R.; Sanghamitra, P.; Sangeeta, S.; Pandit, E.; Pradhan, S.K. Association mapping for protein, total soluble sugars, starch, amylose and chlorophyll content in rice. BMC Plant Biol. 2022, 22, 620. [Google Scholar] [CrossRef]
  51. Swamy, B.M.; Kaladhar, K.; Shobha, R.N.; Prasad, G.S.V.; Viraktamath, B.C.; Reddy, G.A.; Sarla, N. QTL analysis for grain quality traits in 2 BC2F2 populations derived from crosses between Oryza sativa cv Swarna and 2 accessions of O. nivara. J. Hered. 2012, 103, 442–452. [Google Scholar] [CrossRef]
  52. Zheng, X.; Wu, J.G.; Lou, X.Y.; Xu, H.M.; Shi, C.H. The QTL analysis on maternal and endosperm genome and their environmental interactions for characters of cooking quality in rice (Oryza sativa L.). Theor. Appl. Genet. 2008, 116, 335–342. [Google Scholar] [CrossRef] [PubMed]
  53. Mikami, I.; Uwatoko, N.; Ikeda, Y.; Yamaguchi, J.; Hirano, H.Y.; Suzuki, Y.; Sano, Y. Allelic diversification at the wx locus in landraces of Asian rice. Theor. Appl. Genet. 2008, 116, 979–989. [Google Scholar] [CrossRef] [PubMed]
  54. Lanceras, J.C.; Huang, Z.L.; Naivikul, O.; Vanavichit, A.; Ruanjaichon, V.; Tragoonrung, S. Mapping of genes for cooking and eating qualities in Thai jasmine rice (KDML105). DNA Res. 2000, 7, 93–101. [Google Scholar] [CrossRef]
  55. He, Y.; Han, Y.; Jiang, L.; Xu, C.; Lu, J.; Xu, M. Functional analysis of starch-synthesis genes in determining rice eating and cooking qualities. Mol. Breed. 2006, 18, 277–290. [Google Scholar] [CrossRef]
  56. Tan, Y.F.; Li, J.X.; Yu, S.B.; Xing, Y.Z.; Xu, C.G.; Zhang, Q. The three important traits for cooking and eating quality of rice grains are controlled by a single locus in an elite rice hybrid, Shanyou 63. Theor. Appl. Genet. 1999, 99, 642–648. [Google Scholar] [CrossRef]
  57. Singh, R.; Singh, A.K.; Sharma, T.R.; Singh, A.; Singh, N.K. Fine mapping of grain length QTLs on chromosomes 1 and 7 in Basmati rice (Oryza sativa L.). J. Plant Biochem. Biotechnol. 2012, 21, 157–166. [Google Scholar] [CrossRef]
  58. Rabiei, B.; Valizadeh, M.; Ghareyazie, B.; Moghaddam, M.; Ali, A.J. Identification of QTLs for rice grain size and shape of Iranian cultivars using SSR markers. Euphytica 2004, 137, 325–332. [Google Scholar] [CrossRef]
  59. Wang, S.; Wu, K.; Yuan, Q.; Liu, X.; Liu, Z.; Lin, X.; Fu, X. Control of grain size, shape and quality by OsSPL16 in rice. Nat. Genet. 2012, 44, 950–954. [Google Scholar] [CrossRef]
  60. Chen, J.; Liu, K.; Zha, W.; Zhou, L.; Li, M.; Xu, H.; You, A. Identification and verification of grain shape QTLs by SNP array in rice. PLoS ONE 2021, 16, e0260133. [Google Scholar] [CrossRef]
  61. Wang, S.; Li, S.; Liu, Q.; Wu, K.; Zhang, J.; Wang, S.; Fu, X. The OsSPL16-GW7 regulatory module determines grain shape and simultaneously improves rice yield and grain quality. Nat. Genet. 2015, 47, 949–954. [Google Scholar] [CrossRef]
  62. Balakrishnan, D.; Surapaneni, M.; Yadavalli, V.R.; Addanki, K.R.; Mesapogu, S.; Beerelli, K.; Neelamraju, S. Detecting CSSLs and yield QTLs with additive, epistatic and QTL× environment interaction effects from Oryza sativa × O. nivara IRGC81832 cross. Sci. Rep. 2020, 10, 7766. [Google Scholar] [CrossRef] [PubMed]
  63. Piper, C.S. Soil and Plant Analysis; Hans Publishers: Bombay, India, 1966. [Google Scholar]
  64. Sadasivam, S.; Manickam, A. Biochemical Methods for Agricultural Sciences; New Age International (P) Ltd.: New Delhi, India, 1996; pp. 1–97. [Google Scholar]
  65. Burton, G.W.; Devane, E.W. Estimating heritability in tall fescue (Festuca arundiraceae) from replicated clonal material. Agron. J. 1953, 45, 478–481. [Google Scholar] [CrossRef]
  66. Allard, R.W. Principles of Plant Breeding; John Wiley and Sons. Inc.: New York, NY, USA, 1960; 485p. [Google Scholar]
  67. Johnson, H.W.; Robinson, H.F.; Comstock, R.E. Estimation of genetic and environmental variability in soybean. Agron. J. 1955, 47, 314–318. [Google Scholar] [CrossRef]
  68. Song, X.J.; Huang, W.; Shi, M.; Zhu, M.Z.; Lin, H.X. A QTL for rice grain width and weight encodes a previously unknown RING-type E3 ubiquitin ligase. Nat. Genet. 2007, 39, 623–630. [Google Scholar] [CrossRef]
  69. Shomura, A.; Izawa, T.; Ebana, K.; Ebitani, T.; Kanegae, H.; Konishi, S.; Yano, M. Deletion in a gene associated with grain size increased yields during rice domestication. Nat. Genet. 2008, 40, 1023–1028. [Google Scholar] [CrossRef] [PubMed]
  70. Weng, J.; Gu, S.; Wan, X.; Gao, H.; Guo, T.; Su, N.; Lei, C.; Zhang, X.; Cheng, Z.; Guo, X.; et al. Isolation and initial characterization of GW5, a major QTL associated with rice grain width and weight. Cell Res. 2008, 18, 1199–1209. [Google Scholar] [CrossRef] [PubMed]
  71. Liu, J.; Chen, J.; Zheng, X.; Wu, F.; Lin, Q.; Heng, Y.; Tian, P.; Cheng, Z.; Yu, X.; Zhou, K.; et al. GW5 acts in the brassinosteroid signalling pathway to regulate grain width and weight in rice. Nat. Plants 2017, 3, 17043. [Google Scholar] [CrossRef] [PubMed]
  72. Zhao, D.S.; Li, Q.F.; Zhang, C.Q.; Zhang, C.; Yang, Q.Q.; Pan, L.X.; Ren, X.Y.; Lu, J.; Gu, M.H.; Liu, Q.Q. GS9 acts as a transcriptional activator to regulate rice grain shape and appearance quality. Nat. Commun. 2018, 9, 1240. [Google Scholar] [CrossRef]
  73. Yang, Y.; Shen, Z.; Xu, C.; Guo, M.; Li, Y.; Zhang, Y.; Zhong, C.; Sun, S.; Yan, C. Genetic improvement of panicle-erectness japonica rice toward both yield and eating and cooking quality. Mol. Breed. 2020, 40, 51. [Google Scholar] [CrossRef]
  74. Gong, D.; Zhang, X.; He, F.; Chen, Y.; Li, R.; Yao, J.; Zhang, M.; Zheng, W.; Yu, G. Genetic Improvements in Rice Grain Quality: A Review of Elite Genes and Their Applications in Molecular Breeding. Agronomy 2023, 13, 1375. [Google Scholar] [CrossRef]
  75. Hechanova, S.L.; Bhattarai, K.; Simon, E.V.; Clave, G.; Karunarathne, P.; Ahn, E.-K.; Li, C.-P.; Lee, J.-S.; Kohli, A.; Hamilton, N.R.S.; et al. Development of a genome-wide InDel marker set for allele discrimination between rice (Oryza sativa) and the other seven AA-genome Oryza species. Sci. Rep. 2021, 11, 8962. [Google Scholar] [CrossRef] [PubMed]
  76. Orjuela, J.; Garavito, A.; Bouniol, M.; Arbelaez, J.D.; Moreno, L.; Kimball, J.; Wilson, G.; Rami, J.F.; Tohme, J.; McCouch, S.R.; et al. A universal core genetic map for rice. Theor. Appl. Genet. 2010, 120, 563–572. [Google Scholar] [CrossRef] [PubMed]
Figure 1. Breeding scheme for development of F2 population from BPT 5204 X JAK-686 cross.
Plants 14 00905 g001
Figure 2. Linkage map generated using IciMapping software V. 4.1 with 103 polymorphic marker.
Plants 14 00905 g002
Figure 3. Genetic linkage map indicating position of QTLs for grain protein content, grain quality, yield, and yield traits in F2 population.
Plants 14 00905 g003
Figure 4. Mapping of major QTL for grain protein content on chromosome 1 using ICIM.
Plants 14 00905 g004
Figure 5. Epistatic QTLs for protein, yield, and quality traits in F2 population by IM-EPI (PC—grain protein content; AC—amylose content; GC—gel consistency; kl—kernel length; kb—kernel breadth; lb—L:B; ptpp—productive tillers per plant; gypp—grain yield per plant).
Plants 14 00905 g005aPlants 14 00905 g005b
Figure 6. Box plots illustrating the epistatic interactions for protein content on chromosomes 1A (RM562-RM11307) and 12B (RM27564-A12P02180); 1A (RM562-RM11307) and 1B (RM11307-RM10890); 1A (RM562-RM11307) and 6B (A06P22133-A06P08188) A, JAK-686 allele; B, BPT 5204 allele; H, heterozygous.
Plants 14 00905 g006
Figure 7. Box plots illustrating the epistatic interactions for amylose content on chromosomes 6A (RM3408-RM586) and 8B (RM23556-A08P25335); 6A (RM3408-RM586) and 7B (RM21652-RM1132); 3A (RM22-A03P09039) and 9B (RM13021-A09P12377).
Plants 14 00905 g007
Figure 8. Frequency distribution of F2 population for morphological and yield-related traits.
Plants 14 00905 g008
Figure 9. Frequency distribution of F2 population for yield and physical quality traits.
Plants 14 00905 g009
Figure 10. Frequency distribution of F2 population for biochemical traits and grain protein content.
Plants 14 00905 g010
Table 1. Details of markers used and development of linkage map.
S. No.ChromosomeTotal MarkersPolymorphic MarkersPolymorphism
(%)
Length
(cM)
111851910.27534.05
22941010.63228.58
3316884.76223.58
441191210.08198.74
55921010.86138.02
6611243.5774.40
779677.29179.37
888944.4991.60
999577.36184.76
1010611016.39184.65
111168710.29270.94
121210154.95170.26
Total12801038.042478.95
Table 2. Additive QTLs detected for protein content, grain quality, and yield in F2 population.
S. No.TraitCHRQTLPositionMarker IntervalLODPVE(%)AddParental Allele
1PC1qPC1.10RM6120-RM32336.015.380.67J
2PC1qPC1.2141RM562-RM113074.4615.711.28J
3PC5qPC5.129A05P00597-A05P052832.844.590.20J
4PC5qPC5.2114A05P22287-A05P261052.883.090.57J
5AC3qAC3.128RM22-A03P090396.377.154.10J
6AC6qAC6.162RM3408-RM5863.252.711.36J
7AC7qAC7.148RM481-RM210972.911.520.66J
8GC1qGC1.1114RM6716-RM53653.571.22−6.00B
9GC3qGC3.129RM22-A03P090395.566.23−21.56B
10GC5qGC5.1129A05P26105-A05P252603.351.271.57J
11GC9qGC9.162RM13021-A09P123773.685.9012.64J
12GC12qGC12.1144A12P02180-RM2353.005.8912.37J
13KL1qkl1.1497RM11996-RM10672.869.63−0.0005B
14KL5qkl5.10RM17728-A05P005974.774.240.07J
15KB8qkb8.189A08P23255-RM225543.307.790.04J
16L:B1qlb1.1398RM128-RM12972.516.190.002J
17PTPP9qptpp9.135RM13021-A09P123774.345.653.55J
18PTPP12qptpp12.1138A12P02180-RM2353.555.783.63J
19GYPP8qgypp8.14RM23556-A08P253352.576.07−2.30B
PC = protein content, AC = amylose content, GC = gel consistency, KL = kernel length, KB = kernel breadth, PTPP = productive panicles per plant, GYPP = grain yield per plant.
Table 3. QTLs identified for grain protein content.
TraitChromosomeIdentified QTLsPreviously Known QTLsReferences
NamePhysical Position (Mbp)NamePhysical Position
(Mbp)
Protein
content
1qPC1.14.31–5.05qPC1.14.63–4.70[20]
1qPC1.214.61–23.92qPr112.20–14.63[21]
1 qGPC1.10.6–1.1[22]
1 qPC1.18.07[23]
1 qRPC-111.07[11]
1 qPC-125.02–26.19[24]
1 Pro-132.09–34.02[10]
1 qPC137.88–40.16[25]
1 qPC1.239.16–39.23[20]
1 qPC140.13–41.16[26]
5qPC5.10.59–5.28qPC51.94[26]
5qPC5.222.28–26.10qPC-523.48–24.26[27]
5 qPC5.10.53[28]
5 qGPC57.8[2]
Table 4. Characterization of five (5) promising F2 lines for GPC, grain quality, yield, and yield attributing traits.
GenotypesGPC
(%)
PH
(cm)
PTPPPL
(cm)
GPPTGW
(g)
GYPP
(g)
DFFAC
(%)
GC
(mm)
KL
(mm)
KB
(mm)
L:B
F2-14014.6793182112624.529.0311425.87225.652.182.59
F2-1214.36911016.839021.319.1211923.46495.741.982.89
F2-714.32852120.278218.416.5411923.17245.52.022.72
F2-14713.601041019.415523.625.9011523.61485.472.282.39
F2-4113.36951219.4310323.615.8711621.88526.12.112.89
GPC = grain protein content; AC = amylose content; GC = gel consistency; KL = kernel length; KB = kernel breadth; L:B = length-to-breadth ratio; PH = plant height; PTPP = productive tillers per plant; PL = panicle length; GPP = grains per panicle; TGW = 1000-grain weight; GYPP = grain yield per plant; DFF = days to 50% flowering.
Table 5. Correlation studies in F2 population of BPT 5204 X JAK-686 cross.
TraitsPCACGCKLKBL:BPHPTPPPLGPPTGWGYPPDFF
PC1−0.060−0.0540.104−0.0190.082−0.0490.0190.0870.0780.0520.0250.064
AC−0.0601−0.245 **−0.135 *0.143 *−0.187 **0.021−0.1020.029−0.0230.075−0.044−0.043
GC−0.054−0.245 **10.0240.090−0.057−0.0340.0000.0890.074−0.0360.135 *0.088
KL0.104−0.135 *0.02410.0140.585 **−0.0680.305 **0.208 **0.187 **0.258 **0.263 **0.049
KB−0.0190.143 *0.0900.0141−0.801 **0.133 *−0.056−0.012−0.0430.389 **0.005−0.047
L:B0.082−0.187 **−0.0570.585 **−0.801 **1−0.145 *0.238 **0.146 *0.154 *−0.163 *0.160 *0.062
PH−0.0490.021−0.034−0.0680.133 *−0.145 *1−0.158 *−0.047−0.149 *0.003−0.130 *−0.507 **
PTPP0.019−0.1020.0000.305 **−0.0560.238 **−0.158 *10.503 **0.456 **0.166 **0.651 **0.100
PL0.0870.0290.0890.208 **−0.0120.146 *−0.0470.503 **10.390 **0.0380.487 **0.078
GPP0.078−0.0230.0740.187 **−0.0430.154 *−0.149 *0.456 **0.390 **10.137 *0.836 **0.159 *
TGW0.0520.075−0.0360.258 **0.389 **−0.163 *0.0030.166 **0.0380.137 *10.125 *0.044
GYPP0.025−0.0440.135 *0.263 **0.0050.160 *−0.130 *0.651 **0.487 **0.836 **0.125 *10.109
DFF0.064−0.0430.0880.049−0.0470.062−0.507 **0.1000.0780.159 *0.0440.1091
PC = protein content; AC = amylose content; GC = gel consistency; KL = kernel length; KB = kernel breadth; L:B = length-to-breadth ratio; PH = plant height; PTPP = productive tillers per plant; PL = panicle length; GPP = grains per panicle; TGW = 1000-grain weight; GYPP = grain yield per plant; DFF = days to 50% flowering.* Significant at 5% level; ** significant at 1% level.
Table 6. Genetic variability in F2 population of BPT 5204 X JAK-686 cross.
CharactersVgVpVePCVGCVh2 BSGAGAM
Plant height (cm)149.2160.411.213.212.793.024.225.3
Productive tillers per plant (No.)15.116.91.839.036.889.27.571.7
Panicle length (cm)7.07.20.214.414.196.45.328.6
Grains per panicle (No.)357.4496.2138.723.119.672.033.034.3
1000-grain weight (g)3.15.01.911.18.761.42.814.1
Grain yield per plant (g)42.744.01.240.439.897.013.280.8
Kernel length (mm)0.0160.0450.0293.92.335.10.152.8
Kernel breadth (mm)0.0050.0120.0175.24.844.90.104.8
Length-to-breadth ratio0.010.0290.0196.63.833.80.124.6
Days to 50% flowering125.1182.657.412.310.268.519.117.3
Gel consistency (mm)191.2211.620.441.339.290.327.076.9
Protein content (%)1.22.31.115.110.952.41.616.2
Amylose content (%)4.96.61.610.69.275.44.016.6
Vg = genotypic variance, Vp = phenotypic variance, Ve = environmental variance, PCV = phenotypic coefficient of variation, GCV = genotypic coefficient of variation, h2 BS = broad-sense heritability, GA = genetic advance, GAM = genetic advance as percent of mean.
Disclaimer/Publisher’s Note: The statements, opinions and data contained in all publications are solely those of the individual author(s) and contributor(s) and not of MDPI and/or the editor(s). MDPI and/or the editor(s) disclaim responsibility for any injury to people or property resulting from any ideas, methods, instructions or products referred to in the content.

