
Why Is the Diversity of Tree Species in China’s Lowland Rainforests Higher than in Its Montane Rainforests?

 , ,
, ,
Abstract
1. Introduction
2. Materials and Methods
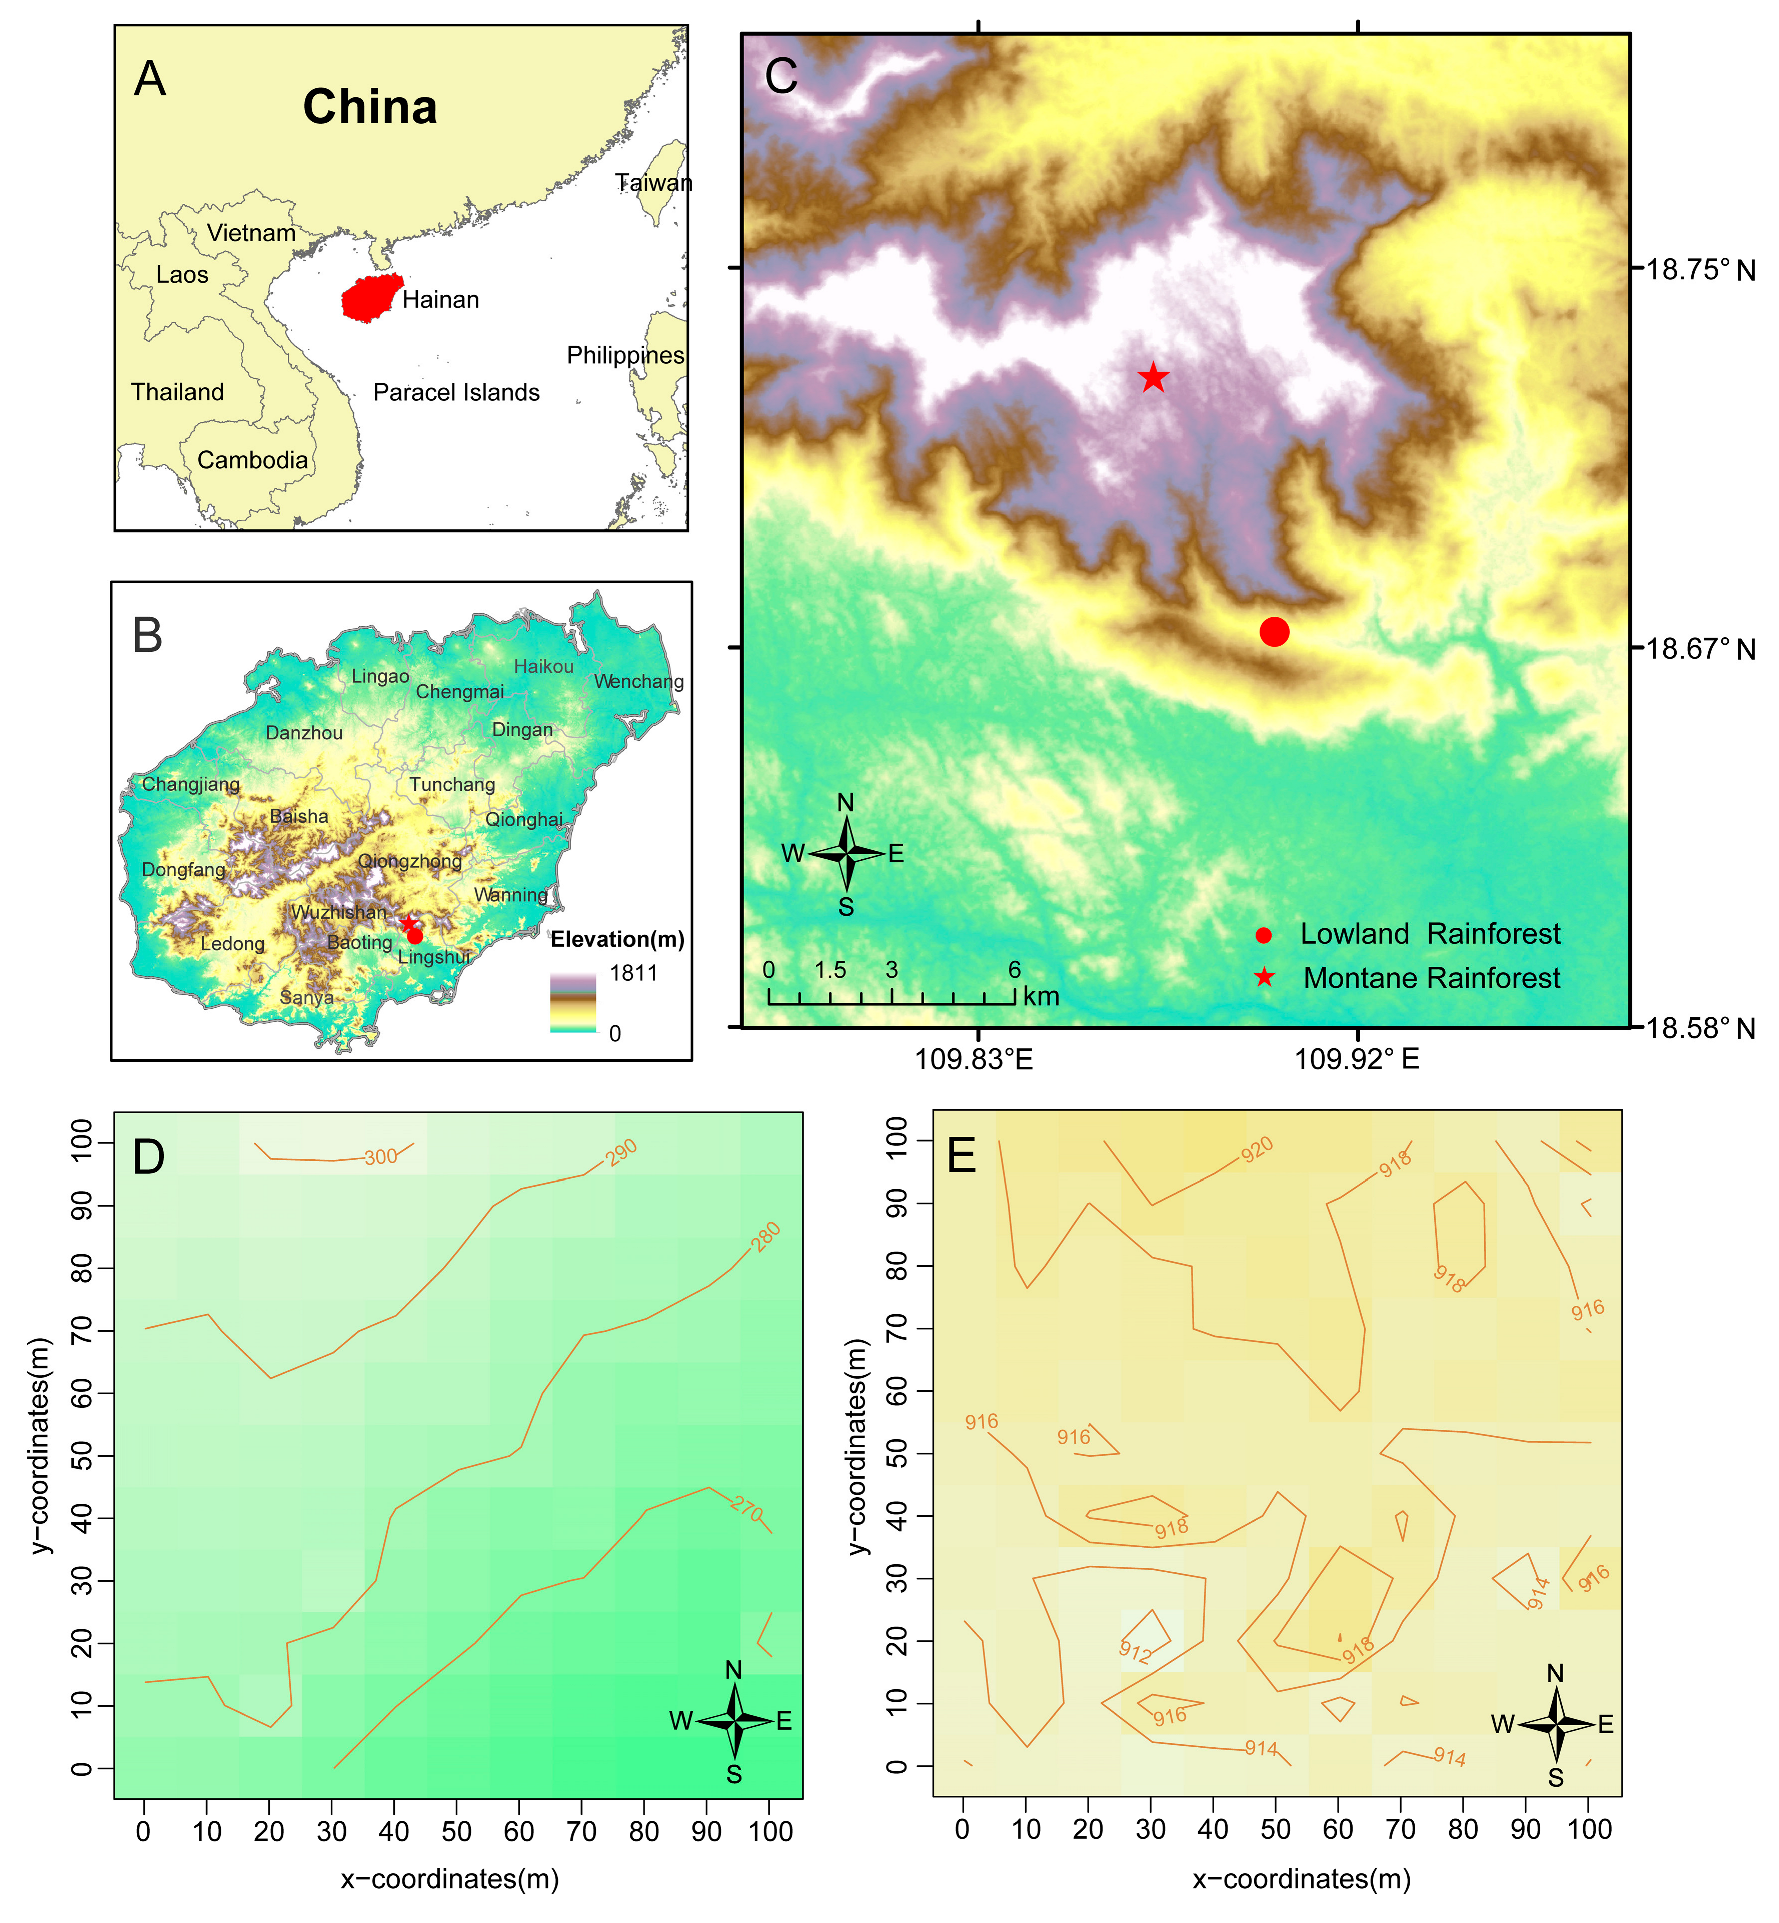
2.1. Study Site
2.2. Data Collection
2.3. Data Analysis
2.3.1. Data Statistics
2.3.2. Spatial Distribution Pattern
2.3.3. Interspecific Association Analysis
2.3.4. Intraspecific Association Analysis
2.3.5. Niche Differentiation and Environmental Variables Analysis
3. Result Analysis
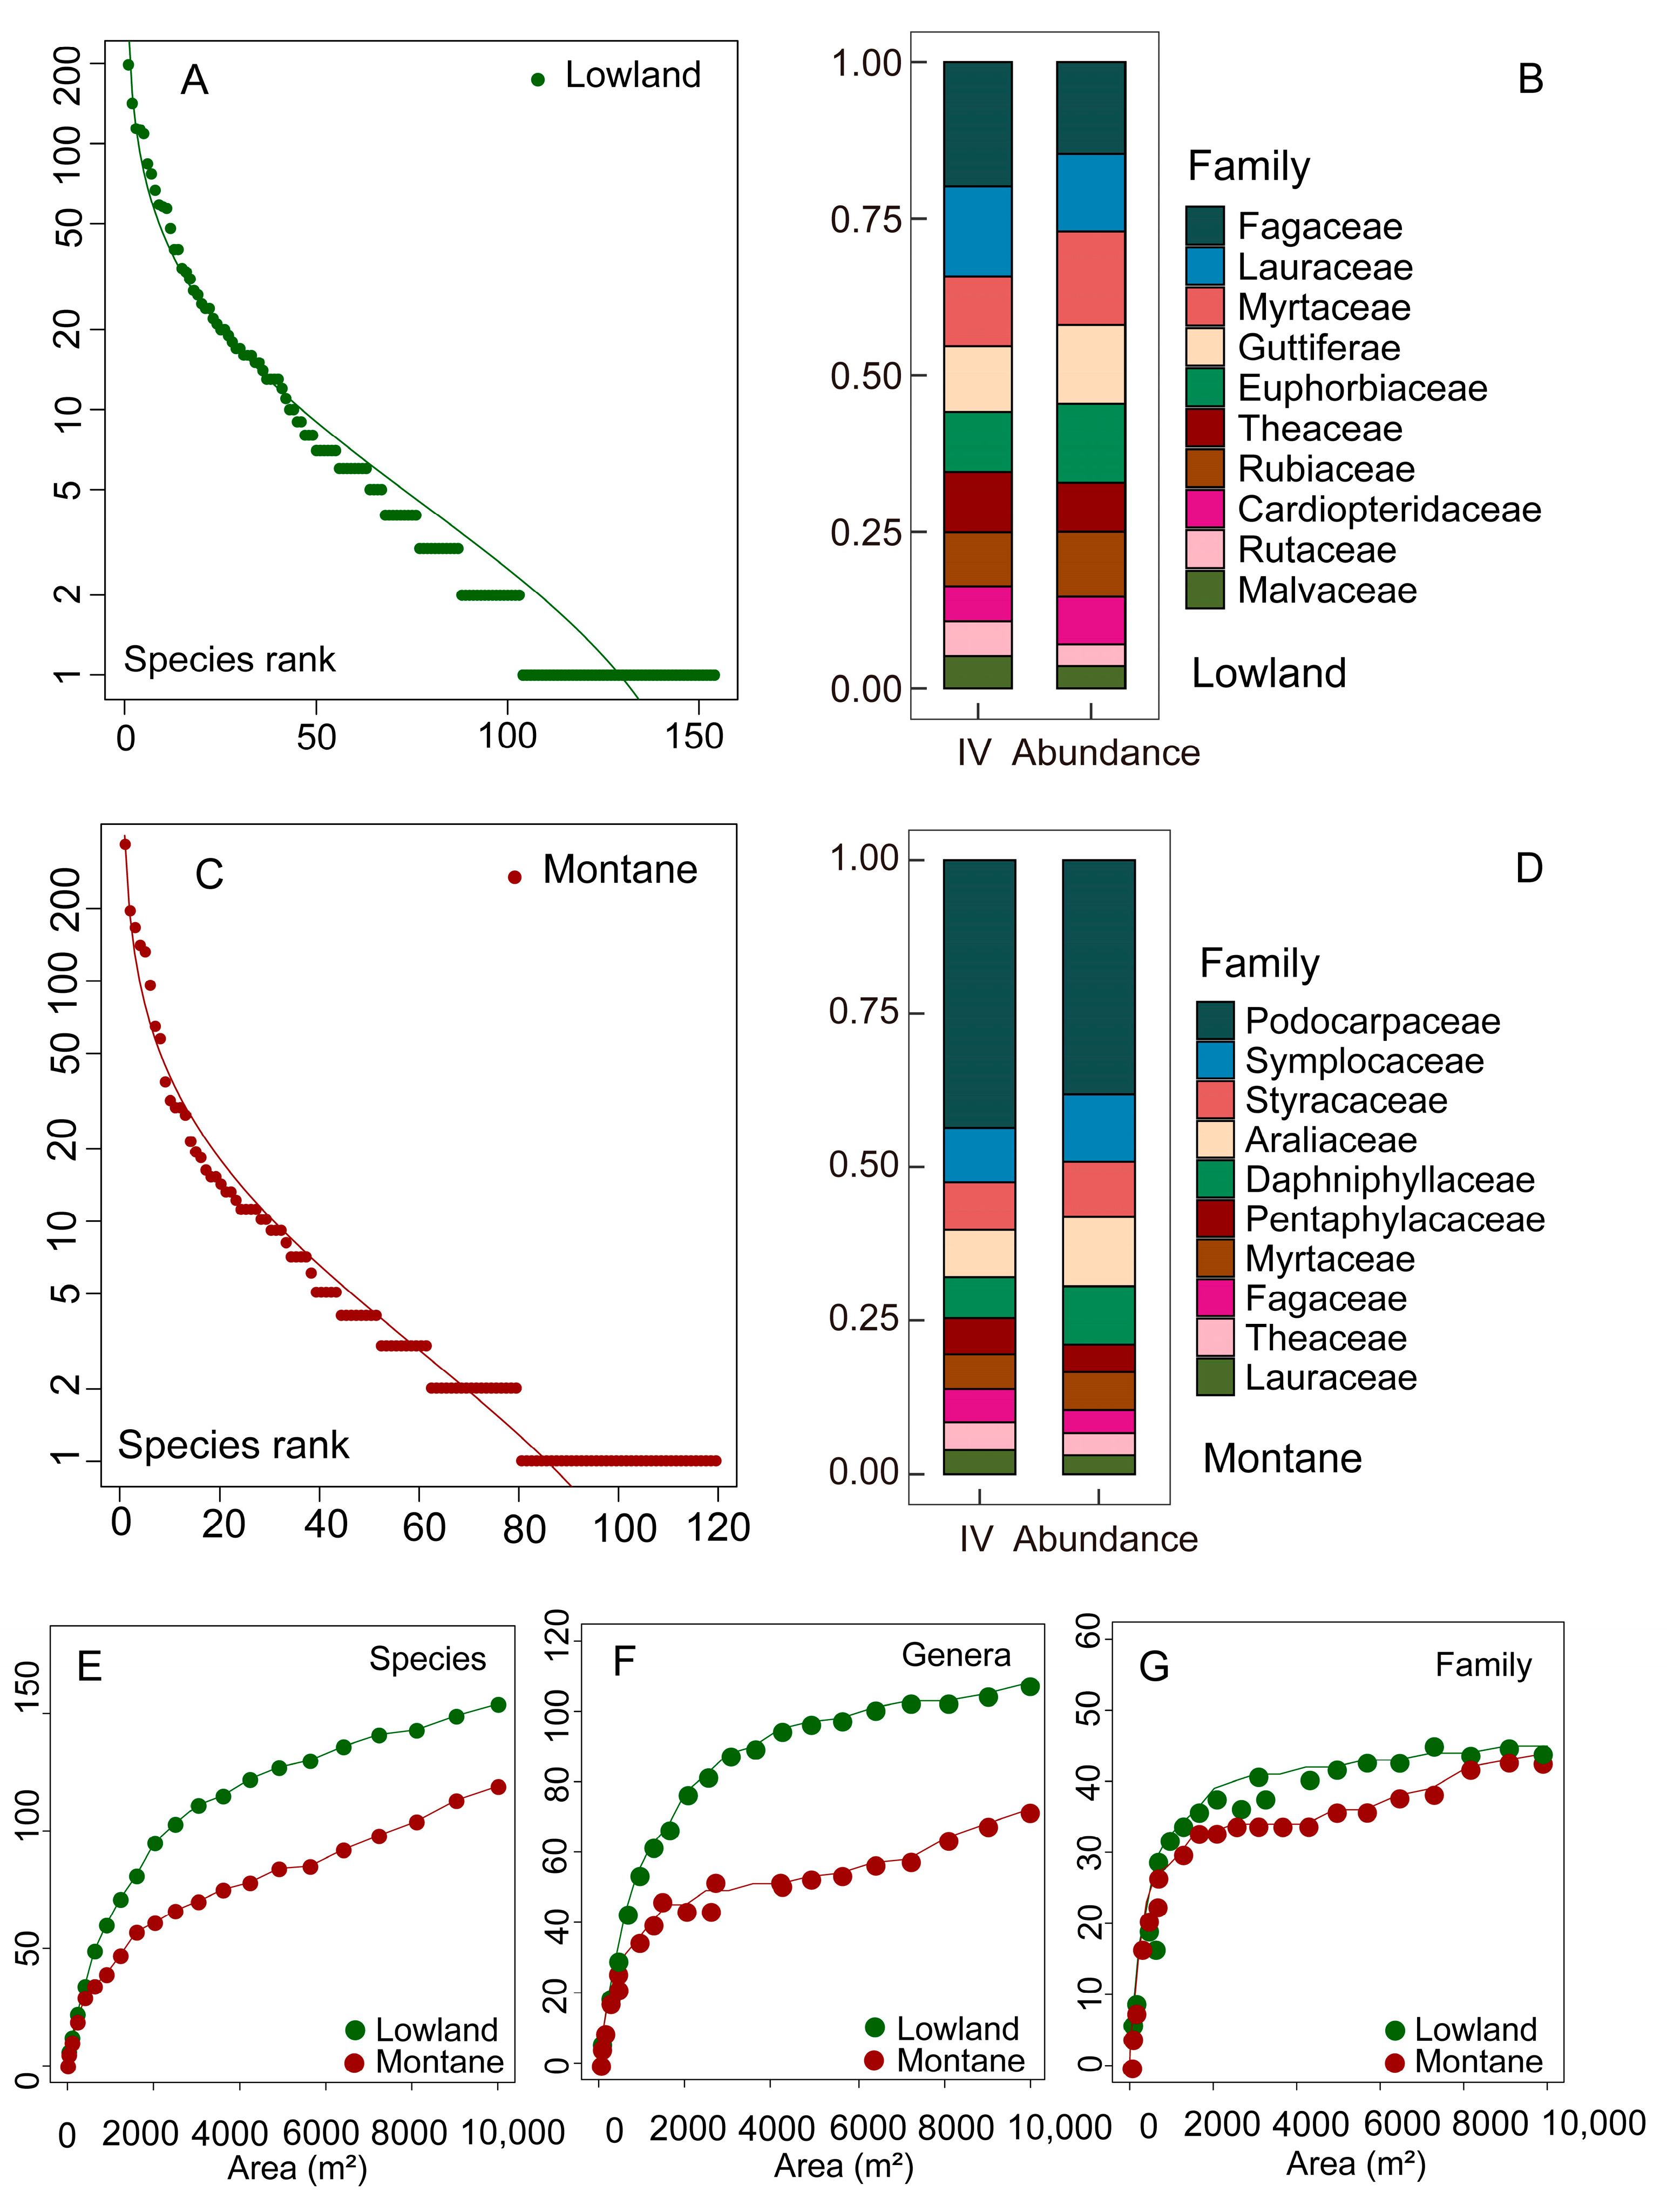
3.1. Species Composition and Diversity
3.2. DBH Distribution
3.3. Spatial Distribution Pattern and Intraspecific Association
3.4. Interspecific Association
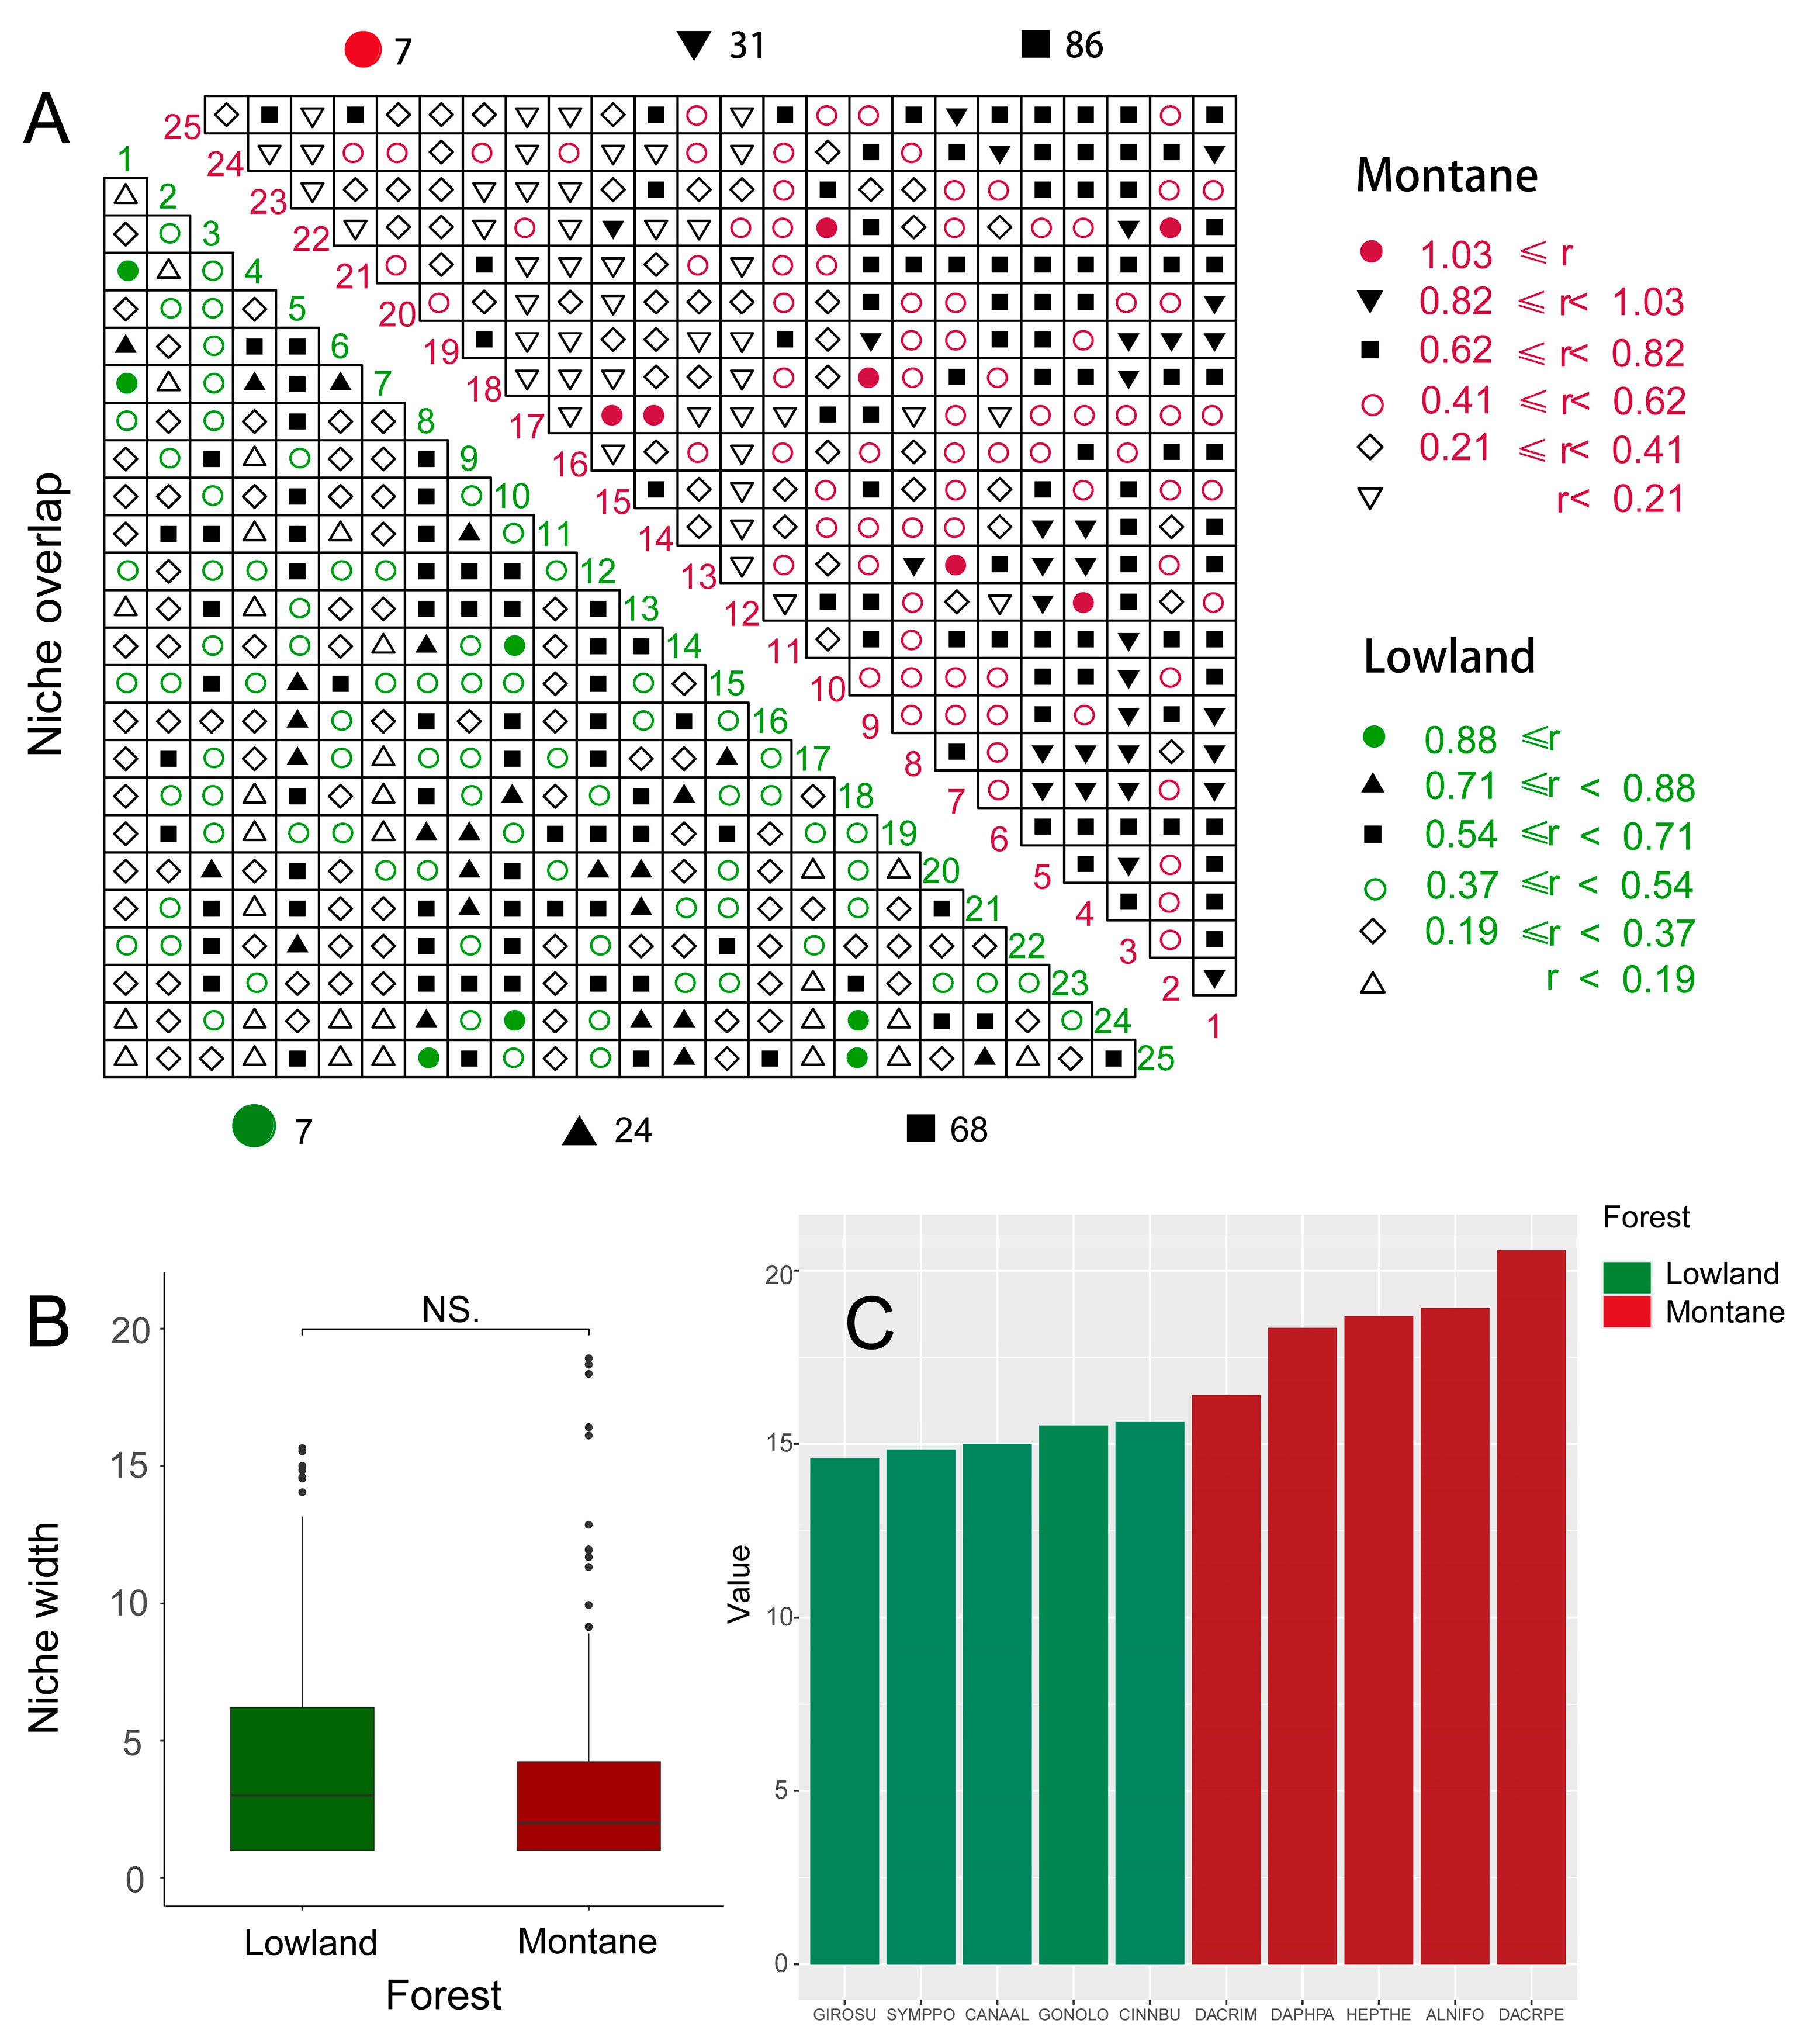
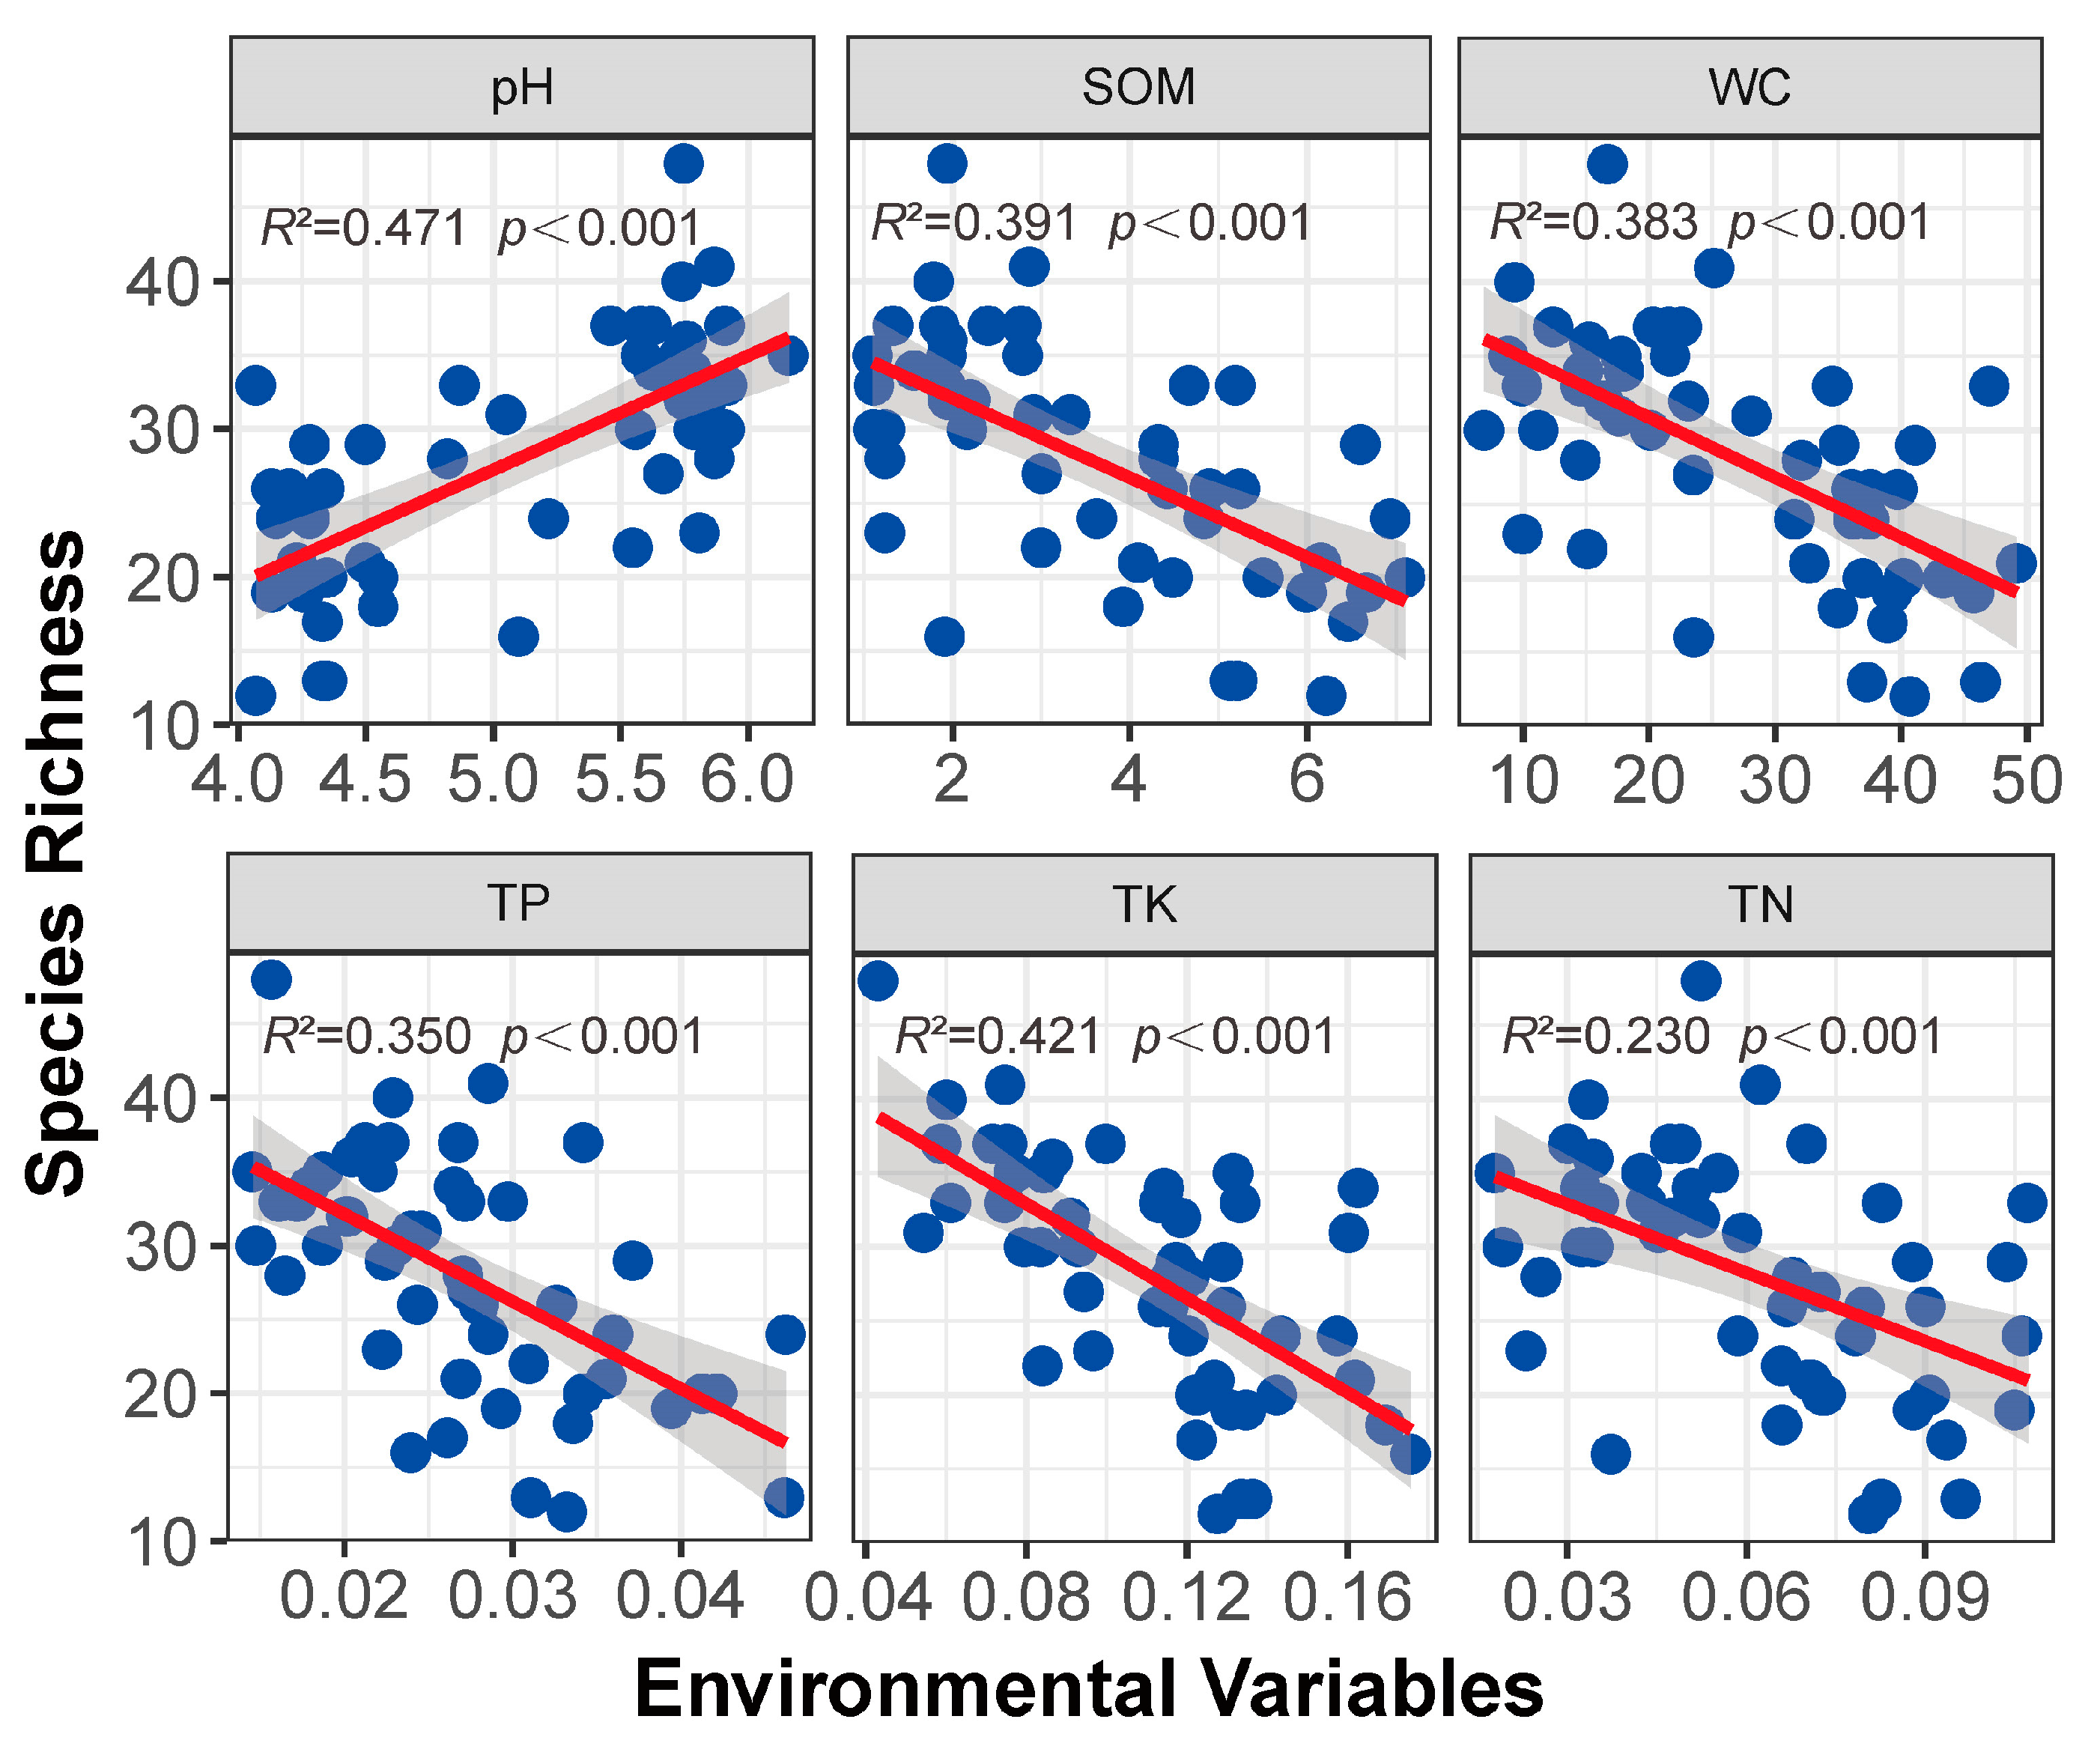
3.5. Niche Differentiation and Environmental Variables
4. Discussion
4.1. Tree Species Diversity
4.2. Negative Density Dependence Effect
4.3. Niche Differentiation and Environment Variables
5. Conclusions
Supplementary Materials
Author Contributions
Funding
Data Availability Statement
Acknowledgments
Conflicts of Interest
References
- Richard, H.W.; Steven, W.R. Forest Ecosystems: Analysis at Multiple Scales; Academic Press, Inc.: Orlando, FL, USA, 1985. [Google Scholar]
- Richards, P.W. The Tropical Rain Forest; Cambridge University Press: London, UK, 1952; 450p. [Google Scholar]
- Wright, J.S. Plant diversity in tropical forests: A review of mechanisms of species coexistence. Oecologia 2002, 130, 1–14. [Google Scholar] [CrossRef]
- Hu, Y.; Li, Y. Tropical rainforest of Hainan Island; Guangdong Higher Education Press (GHEP): Guangzhou, China, 1992; ISBN 7-5361-0886-9. (In Chinese) [Google Scholar]
- Chesson, P. Mechanisms of maintenance of species diversity. Annu. Rev. Ecol. Syst. 2000, 31, 343–366. [Google Scholar] [CrossRef]
- Johnson, D.J.; Beaulieu, W.T.; Bever, J.D.; Clay, K. Conspecific negative density dependence and forest diversity. Science 2012, 336, 904. [Google Scholar] [CrossRef] [PubMed]
- Loke, L.H.L.; Chisholm, R.A. Unveiling the transition from niche to dispersal assembly in ecology. Nature 2023, 618, 537–542. [Google Scholar] [CrossRef] [PubMed]
- Comita, L.S.; Queenborough, S.A.; Murphy, S.J.; Eck, J.L.; Xu, K.; Krishnadas, M.; Beckman, N.; Zhu, Y. Testing predictions of the Janzen-Connell hypothesis: A meta-analysis of experimental evidence for distance- and density-dependent seed and seedling survival. J. Ecol. 2014, 102, 845–856. [Google Scholar] [CrossRef]
- Xu, M.; Wang, Y.; Yu, S. Conspecific negative density dependence decreases with increasing species abundance. Ecosphere 2015, 6, 1–11. [Google Scholar] [CrossRef]
- Stump, S.M.; Comita, L.S. Interspecific variation in conspecific negative density dependence can make species less likely to coexist. Ecol. Lett. 2018, 21, 541–551. [Google Scholar] [CrossRef] [PubMed]
- Hülsmann, L.; Chisholm, R.A.; Hartig, F. Is variation in conspecific negative density dependence driving tree diversity patterns at large scales? Trends Ecol. Evol. 2021, 36, 151–163. [Google Scholar] [CrossRef] [PubMed]
- Song, X.; Lim, J.Y.; Yang, J.; Luskin, M.S. When do Janzen-Connell effects matter? A phylogenetic meta-analysis of conspecific negative distance and density dependence experiments. Ecol. Lett. 2021, 24, 608–620. [Google Scholar] [CrossRef]
- Comita, L.S.; Muller-Landau, H.C.; Aguilar, S.; Hubbell, S.P. Asymmetric density dependence shapes species abundances in a tropical tree community. Science 2010, 329, 330–332. [Google Scholar] [CrossRef] [PubMed]
- Chisholm, R.; Fung, T. Janzen-Connell effects are a weak impediment to competitive exclusion. Am. Nat. 2020, 196, 649–661. [Google Scholar] [CrossRef] [PubMed]
- Zhu, Y.; Mi, X.C.; Ma, K.P. A mechanism of plant species coexistence: The negative density-dependent hypothesis. Biodiver. Sci. 2009, 17, 594–604. [Google Scholar]
- Lan, G.Y.; Zhu, H.; Cao, M.; Hu, Y.H.; Wang, H.; Deng, X.B.; Zhou, S.S.; Cui, J.Y.; Huang, J.G.; He, Y.C.; et al. Spatial dispersion patterns of trees in a tropical rainforest in Xishuangbanna, southwest China. Ecol. Res. 2009, 24, 1117–1124. [Google Scholar] [CrossRef]
- Lan, G.Y.; Hu, Y.H.; Cao, M.; Zhu, H. Topography related spatial distribution of dominant tree species in a tropical seasonal rain forest in China. Forest. Ecol. Manag. 2011, 262, 1507–1513. [Google Scholar] [CrossRef]
- Lan, G.Y.; Getzin, S.; Wiegand, T.; Hu, Y.; Xie, G.; Zhu, H.; Cao, M. Spatial Distribution and Interspecific Associations of Tree Species in a Tropical Seasonal Rain Forest of China. PLoS ONE 2012, 7, e46074. [Google Scholar] [CrossRef]
- Lan, G.Y.; Zhu, H.; Cao, M. Tree species diversity of a 20-ha plot in a tropical seasonal rainforest in Xishuangbanna, southwest China. J. Forest. Res. 2012, 17, 432–439. [Google Scholar] [CrossRef]
- Lan, G.Y.; Zhang, Y.; He, F.; Hu, Y.; Zhu, H.; Cao, M. Species associations of congeneric species in a tropical seasonal rain forest of China. J. Trop. Ecol. 2016, 32, 201–212. [Google Scholar] [CrossRef]
- Hülsmann, L.; Chisholm, R.A.; Comita, L.; Visser, M.D.; de Souza Leite, M.; Aguilar, S.; Anderson-Teixeira, K.J.; Bourg, N.A.; Brockelman, W.Y.; Bunyavejchewin, S.; et al. Latitudinal patterns in stabilizing density dependence of forest communities. Nature 2024, 627, 564–571. [Google Scholar] [CrossRef] [PubMed]
- Tilman, D. Constraints and tradeoffs: Toward a predictive theory of competition and succession. Oikos 1990, 58, 3–15. [Google Scholar] [CrossRef]
- Chazdon, R.L. Second Growth: The Promise of Tropical Forest Regeneration in an Age of Deforestation; University of Chicago Press: Chicago, IL, USA, 2019; Volume 182, p. 288. [Google Scholar]
- Hutchinson, G.E. Concluding Remarks. Cold Spring Harb. Symp. Quant. Biol. 1957, 22, 415–427. [Google Scholar] [CrossRef]
- Hutchinson, G.E. An Introduction to Population Ecology; G. Yale University Press: New Haven, CT, USA, 1978. [Google Scholar]
- Liu, H.D.; Chen, Q.; Xu, Z.Y.; Liu, Y.; Jiang, Y.; Chen, Y.F. Effects of topographical factors on species diversity across Dacrydium pectinatum natural community in Hainan Island. Chin. J. Ecol. 2020, 39, 394. [Google Scholar]
- Zhu, H.; Tan, Y.H. Community characteristics, research states and problems of tropical rain forests in China. J. Plant. Ecol. 2023, 47, 447–468. [Google Scholar] [CrossRef]
- Tang, Z.Y.; Fang, J.Y. A review on the elevational patterns of plant species diversity. Biodiver. Sci. 2004, 12, 20–28. [Google Scholar]
- LaManna, J.A.; Jones, F.A.; Bell, D.M.; Pabst, R.J.; Shaw, D.C. Tree species diversity increases with conspecific negative density dependence across an elevation gradient. Ecol. Lett. 2022, 25, 1237–1249. [Google Scholar] [CrossRef] [PubMed]
- Harms, K.E.; Wright, S.J.; Calderón, O.; Hernández, A.; Herre, E.A. Pervasive density-dependent recruitment enhances seedling diversity in a tropical forest. Nature 2000, 404, 493–495. [Google Scholar] [CrossRef] [PubMed]
- Adler, P.B.; Smull, D.; Beard, K.H.; Choi, R.T.; Furniss, T.; Kulmatiski, A.; Meiners, J.M.; Tredennick, A.T.; Veblen, K.E. Competition and coexistence in plant communities: Intraspecific competition is stronger than interspecific competition. Ecol. Lett. 2018, 21, 1319–1329. [Google Scholar] [CrossRef] [PubMed]
- Das Gupta, S.; Pinno, B.D. Spatial patterns and competition in trees in early successional reclaimed and natural boreal forests. Acta. Oecol. 2018, 92, 138–147. [Google Scholar] [CrossRef]
- Qu, M. Study on Neighbor Competition Effect of Vatica mangachapoi Population in Hainan Tropical Lowland Rainforest; South China Agricultural University: Guangdong, China, 2007. [Google Scholar]
- Zhang, S.Z. Study on the Maintenance Mechanisms of Species Diversity in the Natural Old Growth Tropical Forests on Hainan Island, China; Chinese Academy of Forestry: Beijing, China, 2017. [Google Scholar]
- Lan, G.Y.; Wu, Z.X.; Yang, C.; Sun, R.; Chen, B.Q.; Zhang, X.C. Network complexity of rubber plantations is lower than tropical forests for soil bacteria but not fungi. Soil 2021, 8, 149–161. [Google Scholar] [CrossRef]
- Jiang, H.S. Biodiversity and Conservation of Diaoluo Mountain in Hainan; Guangdong Science and Technology Press: Guangzhou, China, 2006; pp. 1–71. [Google Scholar]
- Condit, R. Research in large, long-term tropical forest plots. Trends. Ecol. Evol. 1995, 10, 18–22. [Google Scholar] [CrossRef] [PubMed]
- Condit, R. Tropical Forest Census Plots; Environmental Intelligence Unit; Springer: Berlin/Heidelberg, Germany, 1998. [Google Scholar]
- Lan, G.Y. Research progress on large, long-term plot of tropical forest ecosystem in the world. Acta Bot. Boreali-Occident. Sin. 2007, 27, 2140–2143. [Google Scholar]
- Lan, G.Y.; Hu, Y.H.; Cao, M.; Zhu, H.; Wang, H.; Zhou, S.S.; Deng, X.B.; Cui, J.Y.; Hung, J.G.; Liu, L.Y.; et al. Establishment of Xishuangbanna tropical forest dynamics plot: Species compositions and spatial distribution patterns. Chin. J. Plant Ecol. 2008, 32, 287–298. [Google Scholar]
- Condit, R.; Ashton, P.S.; Baker, P.; Bunyavejchewin, S.; Gunatilleke, S.; Gunatilleke, N.; Hubbell, S.P.; Foster, R.B.; Itoh, A.; LaFrankie, J.V.; et al. Spatial patterns in the distribution of tropical tree species. Science 2000, 288, 1414–1418. [Google Scholar] [CrossRef]
- Oksanen, J.; Simpson, G.; Blanchet, F.; Kindt, R.; Legendre, P.; Minchin, P.; O’Hara, R.; Solymos, P.; Stevens, M.; Szoecs, E.; et al. vegan: Community Ecology, Package. R Package Version 2.6-6.1. 2024. Available online: https://cran.r-project.org/web/packages/vegan/index.html (accessed on 20 January 2025).
- Greig-Smith, P. Quantitative Plant Ecology; Blackwell Scientific Publications: London, UK, 1983. [Google Scholar]
- He, F.L.; Legendre, P. On species-area relations. Am. Nat. 1996, 148, 719–737. [Google Scholar] [CrossRef]
- Venables, W.N.; Ripley, B.D. Modern Applied Statistics with S, 4th ed.; Springer: New York, NY, USA, 2002. [Google Scholar]
- Baddeley, A.; Rubak, E.; Turner, R. Spatial Point Patterns: Methodology and Applications with R; Chapman and Hall/CRC Press: London, UK, 2015. [Google Scholar]
- Rowlingson, B.; Diggle, P. splancs: Spatial and Space-Time Point Pattern Analysis. R Package Version 2.01-45. 2024. Available online: https://cran.r-project.org/web/packages/splancs/index.html (accessed on 20 January 2025).
- Zhang, J. spaa: SPecies Association Analysis. R Package Version 0.2.2. 2016. Available online: https://cran.r-project.org/web/packages/spaa/index.html (accessed on 20 January 2025).
- Wickham, H. ggplot2: Elegant Graphics for Data Analysis; Springer: New York, NY, USA, 2016. [Google Scholar]
- Wickham, H. Reshaping Data with the reshape Package. J. Stat. Softw. 2007, 21, 1–20. [Google Scholar] [CrossRef]
- Lan, G.Y.; Wei, Y.Q.; Li, Y.W.; Wu, Z.X. Diversity and assembly of root-associated microbiomes of rubber trees. Front. Plant Sci. 2023, 14, 1136418. [Google Scholar] [CrossRef]
- Sanjeewani, N.; Samarasinghe, D.; Jayasinghe, H.; Ukuwela, K.; Wijetunga, A.; Wahala, S.; De Costa, J. Variation of floristic diversity, community composition, endemism, and conservation status of tree species in tropical rainforests of Sri Lanka across a wide altitudinal gradient. Sci. Rep. 2024, 14, 2090. [Google Scholar] [CrossRef]
- Kang, S.; Niu, J.M.; Zhang, Q.; Zhang, X.F.; Han, G.D.; Zhao, M.L. Niche differentiation is the underlying mechanism maintaining the relationship between community diversity and stability under grazing pressure. Glob. Ecol. Conserv. 2020, 24, e01246. [Google Scholar] [CrossRef]
- Bunyavejchewin, S.; LaFrankie, J.V.; Baker, P.J.; Kanzaki, M.; Ashton, P.S.; Yamakura, T. Spatial distribution patterns of the dominant canopy dipterocarp species in a seasonal dry evergreen forest in western Thailand. Forest. Ecol. Manag. 2003, 175, 87–101. [Google Scholar] [CrossRef]
- Plotkin, J.B.; Chave, J.; Ashton, P.S. Cluster analysis of spatial patterns in Malaysian tree species. Am. Nat. 2002, 160, 629–644. [Google Scholar] [CrossRef] [PubMed]
- Plotkin, J.B.; Potts, M.D.; Leslie, N.; Manokaran, N.; Lafrankie, J.; Ashton, P.S. Species-area curves, spatial aggregation, and habitat specialization in tropical forests. J. Theor. Biol. 2000, 207, 81–99. [Google Scholar] [CrossRef]
- Olivier, J.H.; Bonaventure, S. Spatial pattern analysis of tree species distribution in a tropical rain forest of Cameroon: Assessing the role of limited dispersal and niche differentiation. Forest. Ecol. Manag. 2004, 197, 191–202. [Google Scholar]
- LaManna, J.A.; Mangan, S.A.; Alonso, A.; Bourg, N.A.; Brockelman, W.Y.; Bunyavejchewin, S.; Chang, L.-W.; Chiang, J.-M.; Chuyong, G.B.; Clay, K.; et al. Plant diversity increases with the strength of negative density dependence at the global scale. Science 2017, 356, 1389–1392. [Google Scholar] [CrossRef]
- Zhao, G.D.; Xiong, K.; Xu, G.X.; Ma, F.Q.; Yang, H.G.; Liu, S.; Shi, Z.M.; Chen, J.; Zhang, Y. Spatial patterns and associations of main dominant species Abies fargesii var. faxoniana and Betula utilis in Miyaluo subalpine dark coniferous forest of western Sichuan, China. Acta Ecol. Sin. 2022, 42, 3377–3388. [Google Scholar]
- Wang, M.H.; Chen, Z.Q.; Li, S.F.; Huang, X.B.; Lang, X.D.; Hu, Z.H.; Shang, R.G.; Liu, W.D. Spatial pattern of dominant species with different seed dispersal modes in a monsoon evergreen broad-leaved forest in Pu’er, Yunnan Province. Biodiver. Sci. 2023, 31, 86–95. [Google Scholar] [CrossRef]
- Zhang, H.N.; Xue, J.H. Spatial patterns and competition among trees of different height classes in Guizhou, Chishui evergreen broadleaved forest. Acta Ecol. Sin. 2018, 38, 7381–7390. [Google Scholar]
- Du, H.; Hu, F.; Zeng, F.; Wang, K.; Peng, W.; Zhang, H.; Zeng, Z.; Zhang, F.; Song, T. Spatial distribution of tree species in evergreen-deciduous broadleaf karst forests in southwest China. Sci. Rep. 2017, 7, 15664. [Google Scholar] [CrossRef]
- Wiegand, T.; Gunatilleke, S.; Gunatilleke, N. Species associations in a heterogeneous Sri Lankan dipterocarp forest. Am. Nat. 2007, 170, E77–E95. [Google Scholar] [CrossRef] [PubMed]
- Wiegand, T.; Gunatilleke, S.; Gunatilleke, N.; Okuda, T. Analyzing the spatial structure of a Sri Lankan tree species with multiple scales of clustering. Ecology 2007, 88, 3088–3102. [Google Scholar] [CrossRef]
- Janzen, D. Herbivores and the number of tree species in tropical forests. Am. Nat. 1970, 104, 501–528. [Google Scholar] [CrossRef]
- Connell, J.H. On the role of natural enemies in preventing competitive exclusion in some marine animals and in forest trees. In Proceedings of the Dynamics of Populations, Oosterbeek, The Netherlands, 7–18 September 1970. [Google Scholar]
- Coelho, M.T.P.; Barreto, E.; Rangel, T.F.; Diniz-Filho, J.A.F.; Wüest, R.O.; Bach, W.; Skeels, A.; McFadden, I.R.; Roberts, D.W.; Pellissier, L.; et al. The geography of climate and the global patterns of species diversity. Nature 2023, 622, 537–544. [Google Scholar] [CrossRef]
- Alexander, J.M.; Kueffer, C.; Daehler, C.C.; Edwards, P.J.; Pauchard, A.; Seipel, T.; Consortium, M. Assembly of nonnative floras along elevational gradients explained by directional ecological filtering. Proc. Natl. Acad. Sci. USA 2011, 108, 656–661. [Google Scholar] [CrossRef]
- Pandey, R.; Rawat, M.; Singh, V.; Yousefpour, R.; Reshi, Z.A. Large scale field-based evaluation of niche breadth, niche overlap and interspecific association of Western Himalayan temperate forest tree species. Ecol. Indic. 2023, 146, 109876. [Google Scholar] [CrossRef]
- Dong, S.K.; Li, S.; Xu, Y.D.; Shen, H.; Song, H.J.; Wu, Z.F.; Wu, S.N.; Zhou, B.R.; Li, F. Different responses of alpine plants to natural climate change reduced coexistence through phenological niche overlap. Sci. Total. Environ. 2023, 892, 164522. [Google Scholar] [CrossRef]
- Yuan, Y.; Tang, X.; Liu, M.; Liu, X.; Tao, J. Species distribution models of the Spartina alterniflora loisel in its origin and invasive country reveal an ecological niche shift. Front. Plant Sci. 2021, 12, 738769. [Google Scholar] [CrossRef]
- Maedeh, S.; Mansoureh, M.; Mostafa, T.E. Interspecific niche overlap and climatic associations of native Quercus species in the Zagros forests of Iran. Glob. Ecol. Conserv. 2024, 51, e02878. [Google Scholar]
- Lan, G.Y.; Wu, Z.X.; Yang, C.; Sun, R.; Chen, B.Q.; Zhang, X. Tropical rainforest conversion into rubber plantations results in changes in soil fungal composition, but underling mechanisms of community assembly remain unchanged. Geoderma 2020, 375, 114505. [Google Scholar] [CrossRef]
- Daisy, H.D.; Sergio, E.V. Uniting niche differentiation and dispersal limitation predicts tropical forest succession. Trends. Ecol. Evol. 2021, 36, 700–708. [Google Scholar]


| Family | No. of Family | No. of Stems | ||
| Lowland | Montane | Lowland | Montane | |
| Dominant families (≥5) | 11 (24.44%) | 7 (19.91%) | 1148 (55.81%) | 450 (25.18%) |
| Common departments (≥2) | 20 (44.44%) | 16 (36.36%) | 574 (27.9%) | 784 (43.87%) |
| Single family (=1) | 14 (31.11%) | 21 (47.73%) | 335 (16.29%) | 553 (30.95%) |
| Species | No. of Species | No. of Stems | ||
| Lowland | Montane | Lowland | Montane | |
| Dominant species (≥50) | 11 (7.14%) | 8 (6.73%) | 1078 (51.90%) | 1182 (66.14%) |
| Common species (≥2) | 92 (59.7%) | 71 (59.66%) | 948 (45.64%) | 565 (31.62%) |
| Rare species (=1) | 51 (33.11%) | 40 (33.61%) | 51 (2.46%) | 40 (2.24%) |
| DBH (cm) | No. of Family | No. of Genus | No. of Species | No. of Individuals | ||||
|---|---|---|---|---|---|---|---|---|
| Lowland | Montane | Lowland | Montane | Lowland | Montane | Lowland | Montane | |
| DBH ≥ 5 | 45 | 44 | 108 | 68 | 154 | 119 | 2077 | 1787 |
| DBH ≥ 10 | 39 | 33 | 82 | 46 | 103 | 74 | 771 | 958 |
| DBH ≥ 20 | 30 | 18 | 42 | 25 | 46 | 27 | 191 | 359 |
| DBH ≥ 30 | 18 | 8 | 23 | 11 | 24 | 11 | 54 | 107 |
| DBH ≥ 40 | 9 | 3 | 12 | 4 | 12 | 4 | 19 | 14 |
| DBH ≥ 50 | 3 | 1 | 3 | 1 | 3 | 1 | 5 | 1 |
Disclaimer/Publisher’s Note: The statements, opinions and data contained in all publications are solely those of the individual author(s) and contributor(s) and not of MDPI and/or the editor(s). MDPI and/or the editor(s) disclaim responsibility for any injury to people or property resulting from any ideas, methods, instructions or products referred to in the content. |
© 2025 by the authors. Licensee MDPI, Basel, Switzerland. This article is an open access article distributed under the terms and conditions of the Creative Commons Attribution (CC BY) license (https://creativecommons.org/licenses/by/4.0/).
Share and Cite
Pang, T.; Yuan, L.; Wei, Y.; Wang, X.; Zhang, N.; Ji, K.; Li, Y.; Lan, G. Why Is the Diversity of Tree Species in China’s Lowland Rainforests Higher than in Its Montane Rainforests? Plants 2025, 14, 505. https://doi.org/10.3390/plants14040505
Pang T, Yuan L, Wei Y, Wang X, Zhang N, Ji K, Li Y, Lan G. Why Is the Diversity of Tree Species in China’s Lowland Rainforests Higher than in Its Montane Rainforests? Plants. 2025; 14(4):505. https://doi.org/10.3390/plants14040505
Chicago/Turabian StylePang, Tong, Langxing Yuan, Yaqing Wei, Xin Wang, Ning Zhang, Kepeng Ji, Yuwu Li, and Guoyu Lan. 2025. "Why Is the Diversity of Tree Species in China’s Lowland Rainforests Higher than in Its Montane Rainforests?" Plants 14, no. 4: 505. https://doi.org/10.3390/plants14040505
APA StylePang, T., Yuan, L., Wei, Y., Wang, X., Zhang, N., Ji, K., Li, Y., & Lan, G. (2025). Why Is the Diversity of Tree Species in China’s Lowland Rainforests Higher than in Its Montane Rainforests? Plants, 14(4), 505. https://doi.org/10.3390/plants14040505