Article

The Development of Secretory Cavities in Zanthoxylum nitidum Leaves and the Pattern of Essential Oil Accumulation

1
School of Pharmaceutical Sciences, Hunan University of Medicine, Huaihua 418000, China
2
Guangdong Laboratory for Lingnan Modern Agriculture, College of Life Sciences, South China Agricultural University, Guangzhou 510642, China
3
Biomedical Research Institute, Hunan University of Medicine, Huaihua 418000, China
*
Authors to whom correspondence should be addressed.
These authors contributed equally to this work.
Plants 2025, 14(22), 3449; https://doi.org/10.3390/plants14223449
Submission received: 24 September 2025 / Revised: 5 November 2025 / Accepted: 6 November 2025 / Published: 11 November 2025
(This article belongs to the Section Phytochemistry)

Abstract

The root of Zanthoxylum nitidum is used in traditional Chinese medicine, whereas its leaves remain an under-exploited resource rich in essential oil (EO). By integrating cytological, analytical–chemical, and chemometric approaches, we have dissected the ontogeny of secretory cavities and the temporal accumulation of EO in Z. nitidum leaves for the first time. Cytological analyses revealed marginal-tooth-slit secretory cavities consisting solely of a spherical domain formed via a schizogenous mechanism. The EO yield followed a unimodal trajectory, peaking at growth stages ZN-2 and ZN-3. Gas chromatography–mass spectrometry (GC-MS) profiling identified 60 constituents; sesquiterpenoids reached maximal abundance at ZN-3, whereas monoterpenoids predominated at ZN-2. Second-derivative Fourier transform infrared spectroscopy (FTIR) spectra exhibited pronounced stage-specific differences, and hierarchical cluster analysis coupled with principal component analysis reliably discriminated developmental stages based on their chemical fingerprints. These findings provide a robust cytological and analytical framework for quality control and rational utilization of Z. nitidum leaves, laying the groundwork for their full medicinal exploitation.

1. Introduction

Zanthoxylum nitidum (Roxb.) DC. is a perennial woody vine in the Rutaceae family, widely used as a traditional Chinese folk medicine for anti-inflammatory and analgesic purposes. In traditional Chinese medicine (TCM), Z. nitidum is valued for its effects of promoting blood circulation to remove blood stasis, regulating qi to alleviate pain, dispelling wind to unblock the collaterals, and detoxifying to reduce swelling [1,2]. Its principal bioactive constituents are alkaloids such as nitidine chloride and chelerythrine [2,3,4]. Contemporary clinical and pharmacological studies have demonstrated its anti-inflammatory, analgesic, antimicrobial, antitumor, and cardiovascular activities [2,3,5,6]. Z. nitidum is the key raw material for more than 60 Chinese patent medicines, as well as for everyday products such as toothpaste [7,8]. It is therefore one of China’s most economically important natural plant resources.
The Pharmacopeia of the People’s Republic of China (PPRC) stipulates that the medicinal part of Z. nitidum is its root [1]. However, classical and modern references such as the Shennong’s Classic of Materia Medica, Mingyi Bielu, Chinese Materia Medica Dictionary, and Modern Compendium of Materia Medica record that its root, stem, leaf, and fruit are all used medicinally [9,10]. As a perennial species, harvesting Z. nitidum for its roots alone leads to massive wasteage of the aerial biomass of this medicinal resource, especially the leaves. Studies have shown that the alkaloid levels in the aerial parts are markedly lower than in the roots [11,12], whereas the essential oil (EO) content in the leaves is significantly higher than in both the roots and stems [10]. Vilaysack et al. [13] found that the principal constituents of Z. nitidum leaves’ EO remained qualitatively similar across different months. Moreover, numerous studies have confirmed that the EOs of Z. schinifolium Siebold and Zucc., Z. myriacanthum var. pubescens (C. C. Huang) C. C. Huang, and Z. coreanum Nakai all exhibit significant anti-inflammatory effects in animal experiments [14,15,16,17]. Our previous work demonstrated that Z. nitidum leaf EO possesses markedly higher in vitro antioxidant activity than the root, stem, or pericarp EOs [10]. In addition, the leaf EO inhibits Bacillus subtilis (Ehrenberg) Cohn and Escherichia coli T. Escherich and exhibits cytotoxic activity against hepatoma, cervical, and human breast carcinoma cells [18]. These findings indicate that Z. nitidum leaves are a valuable medicinal resource; their utilization not only prevents wastage of TCM biomass but also enhances the economic returns of cultivation enterprises.
The biosynthesis and accumulation of EOs in plants are intimately linked to the structural characteristics of their specialized secretory organs [19]. For example, in the oil cells of Cinnamomum cassia (L.) D. Don [20,21] and Persea americana Mill. [22], the secretory cavities in Citrus grandisTomentosa’ [23] and Citrus medicaFingered’ [24], as well as the secretory ducts in Bupleurum chinense Franch. [25], all exhibit close developmental relationships with EO secretion.
Secretory cavities are a structural hallmark common to Rutaceae, occurring widely in the stems, leaves, flowers, and fruits. Three modes of cavity ontogeny have been proposed for rutaceous secretory structures: lysigenous, schizogenous, and schizolysigenous [19,26]. Studies have shown that secretory cavities in Poncirus and Citrus species arise lysigenously [27,28]. In Tetradium ruticarpum (A. Juss.) T. G. Hartley, leaf secretory cavities originate from the spongy mesophyll beneath the lower epidermis without the involvement of epidermal cells, and their lumina form schizogenously [29]. In contrast, secretory cavities in C. sinensis (L.) Osbeck leaves develop through a schizolysigenous process [30]. Liu and Hu [26] observed that secretory cavities in Z. nitidum occur exclusively in the recesses between marginal leaf-teeth and are characterized by large diameters and numerous epithelial cells. Liu et al. [23] demonstrated that in C. grandisTomentosa’ fruit, the secretory cavity lumen forms schizolysigenously; these cavities serve as principal sites for the distribution and accumulation of bioactive constituents, with EO content rising progressively as the cavities develop. The mode of initiation and the structural characteristics of secretory cavity formation in Z. nitidum leaves, together with the dynamics of EO content and composition, have yet to be reported.
In this study, leaves of Z. nitidum at different developmental stages were investigated to elucidate the developmental characteristics and formation mechanism of leaflet secretory cavities using semi-thin sectioning. The EO yield was quantified, and the chemical composition was analyzed using gas chromatography–mass spectrometry (GC-MS) and Fourier transform infrared spectroscopy (FTIR) across developmental stages to clarify the dynamics of secretory cavity morphogenesis and EO accumulation. The findings provide fundamental cytological and analytical data for the quality control and rational utilization of Z. nitidum leaves as medicinal materials, offering a scientific basis for their comprehensive development and utilization with the ultimate goal of improving yield per unit area, promoting industrial development, and supporting rural revitalization.

2. Materials and Methods

2.1. Experimental Materials

Seedlings of Z. nitidum (Rutaceae) were collected in November 2021 from a standardized medicinal cultivation base in Yunfu City, Guangdong Province, China (112°3′ E, 22°54′ N), and identified by Professor Hong Wu of South China Agricultural University. After two years of acclimatization and transplantation, sampling experiments were conducted on leaves at different developmental stages from multiple individual plants.

2.2. Semi-Thin Sectioning

Our methods followed Yang et al. [31]. Leaves of Z. nitidum at different developmental stages were collected and cut into small pieces (0.5 cm × 0.5 cm), then fixed in 2% glutaraldehyde + 3% paraformaldehyde (prepared in 0.1 M PBS, pH 7.2) under vacuum at 4 °C for 12 h. The samples were rinsed three times with PBS (pH 7.2) and post-fixed in 2% osmium tetroxide for 2 h, followed by three additional PBS washes. Dehydration was performed through a graded ethanol series (30%, 50%, 70%, 85%, 90%, 95%, and 100%, for ~10 min each). Tissues were then infiltrated with 100% ethanol/propylene oxide (1:1) for 15 min, followed by two changes of pure propylene oxide (15 min each). The samples were embedded by sequential infiltration with propylene oxide/Epon812 resin (1:1) for 24 h and pure Epon812 resin twice for 12 h each, then polymerized at 60 °C for 24 h. Semi-thin sections (1~2 µm) were cut using a Leica RM2155 microtome (Leica; Nussloch, Germany), stained with 0.5% toluidine blue, and observed and photographed with a Leica DMLB microscope (Leica; Nussloch, Germany).

2.3. Extraction and Quantification of EO

Leaves at four developmental stages were air-dried, ground, and passed through a 60-mesh sieve. For each stage, 30 g of leaf powder was placed in a 1000 mL round-bottom flask, mixed with 300 mL of distilled water, shaken, and soaked for 12 h. Essential oils were extracted using aqueous distillation according to the method described in the PPRC [1]. The extracted oils were weighed, and each group of samples was measured in triplicate to determine the average yield. The essential oils were stored at −20 °C until analysis was performed.

2.4. GC-MS Analysis

The GC-MS operating conditions were as follows: column—DB-5 MS (30 m × 0.25 µm × 0.25 mm); injector temperature—300 °C; temperature program—initial oven temperature 60 °C held for 4 min, ramped at 8 °C min−1 to 100 °C and held for 8 min, ramped at 8 °C min−1 to 150 °C and held for 5 min, ramped at 5 °C min−1 to 200 °C and held for 2 min, then ramped at 10 °C min−1 to 300 °C; carrier gas—high-purity helium at a constant flow rate of 1.0 mL min−1.
EO was dissolved in dichloromethane, filtered through a 0.22 µm organic membrane, and 2 µL was injected at a 20:1 split. The solvent delay was 4 min, and the settings were EI = 70 eV, ion source = 200 °C, and m/z = 35~650 amu. Compounds were identified using NIST library matching of their MS spectra and quantified by relative peak area using Xcalibur (Thermo Fisher; Waltham, MA, USA). GC profile: 4.00~50.00 min.

2.5. FTIR Analysis

FTIR spectra were acquired on a Nicolet 5700 spectrometer (Thermo Nicolet Corp.; Madison, WI, USA) equipped with a DTGS detector (Thermo Nicolet Corp.; Madison, WI, USA). Spectra were collected over 4000–400 cm−1 at 4 cm−1 resolution in a room maintained at 25 °C and 30% relative humidity. Dried samples were ground to 200-mesh powder. Exactly 1.00 mg of sample was thoroughly mixed with 100.00 mg dried KBr and pressed into 5 mm × 1 mm pellets. Each sample was scanned 64 times, repeated in triplicate, and the averaged spectrum was used after subtracting ambient air, H2O, and CO2 contributions [32]. Baseline correction and smoothing were performed with OMNIC 8.2.

2.6. Hierarchical Cluster Analysis (HCA)

Hierarchical clustering is a method that constructs a nested grouping of observations. Any accepted similarity (or distance) metric can be employed; consequently, samples within the same cluster are highly similar, whereas those in different clusters are markedly dissimilar [33]. In this study, hierarchical cluster analysis was performed using Pearson correlation. The relative percentages of the common GC-MS peaks served as the variables, and the distance matrix among samples was derived accordingly. Clustering and dendrogram generation were executed in SPSS 20.0 (IBM, New York, NY, USA).

2.7. Principal Component Analysis (PCA)

PCA is a spectral-feature extraction technique that, by maximizing variance, linearly recombines the numerous original variables into a reduced set of new, low-dimensional variables [20]. In this study, PCA was performed via singular value decomposition of the second-derivative FTIR data matrix. The first three principal component scores were used to generate projection plots that visually reveal fingerprint similarity. All PCA computations were carried out in SPSS 20.0.

2.8. Data Analysis

All data are presented as the mean ± SEM. Statistical analysis was performed using one-way ANOVA followed by Duncan’s multiple-comparison test (SPSS 20.0). p < 0.05 was considered statistically significant.

3. Results and Discussion

3.1. Distribution of Secretory Cavities

SEM revealed Z. nitidum leaflet secretory cavities to be of the marginal-tooth-slit type: one globular cavity per tooth sinus, large enough to be macroscopically discernible (Figure 1A,B). Sudan red staining showed abundant essential oil droplets within each cavity (Figure 1C). These cavities, universally present in Rutaceae, are the principal sites of volatile oil biosynthesis [26,34,35]. Among the three recognized types, Z. nitidum, Z. planispinum DC., and T. glabrifolium (Champ. ex Benth.) T. G. Hartley all exhibit the marginal-tooth-slit form [26].

3.2. Ontogenetic Mode of Secretory Cavities

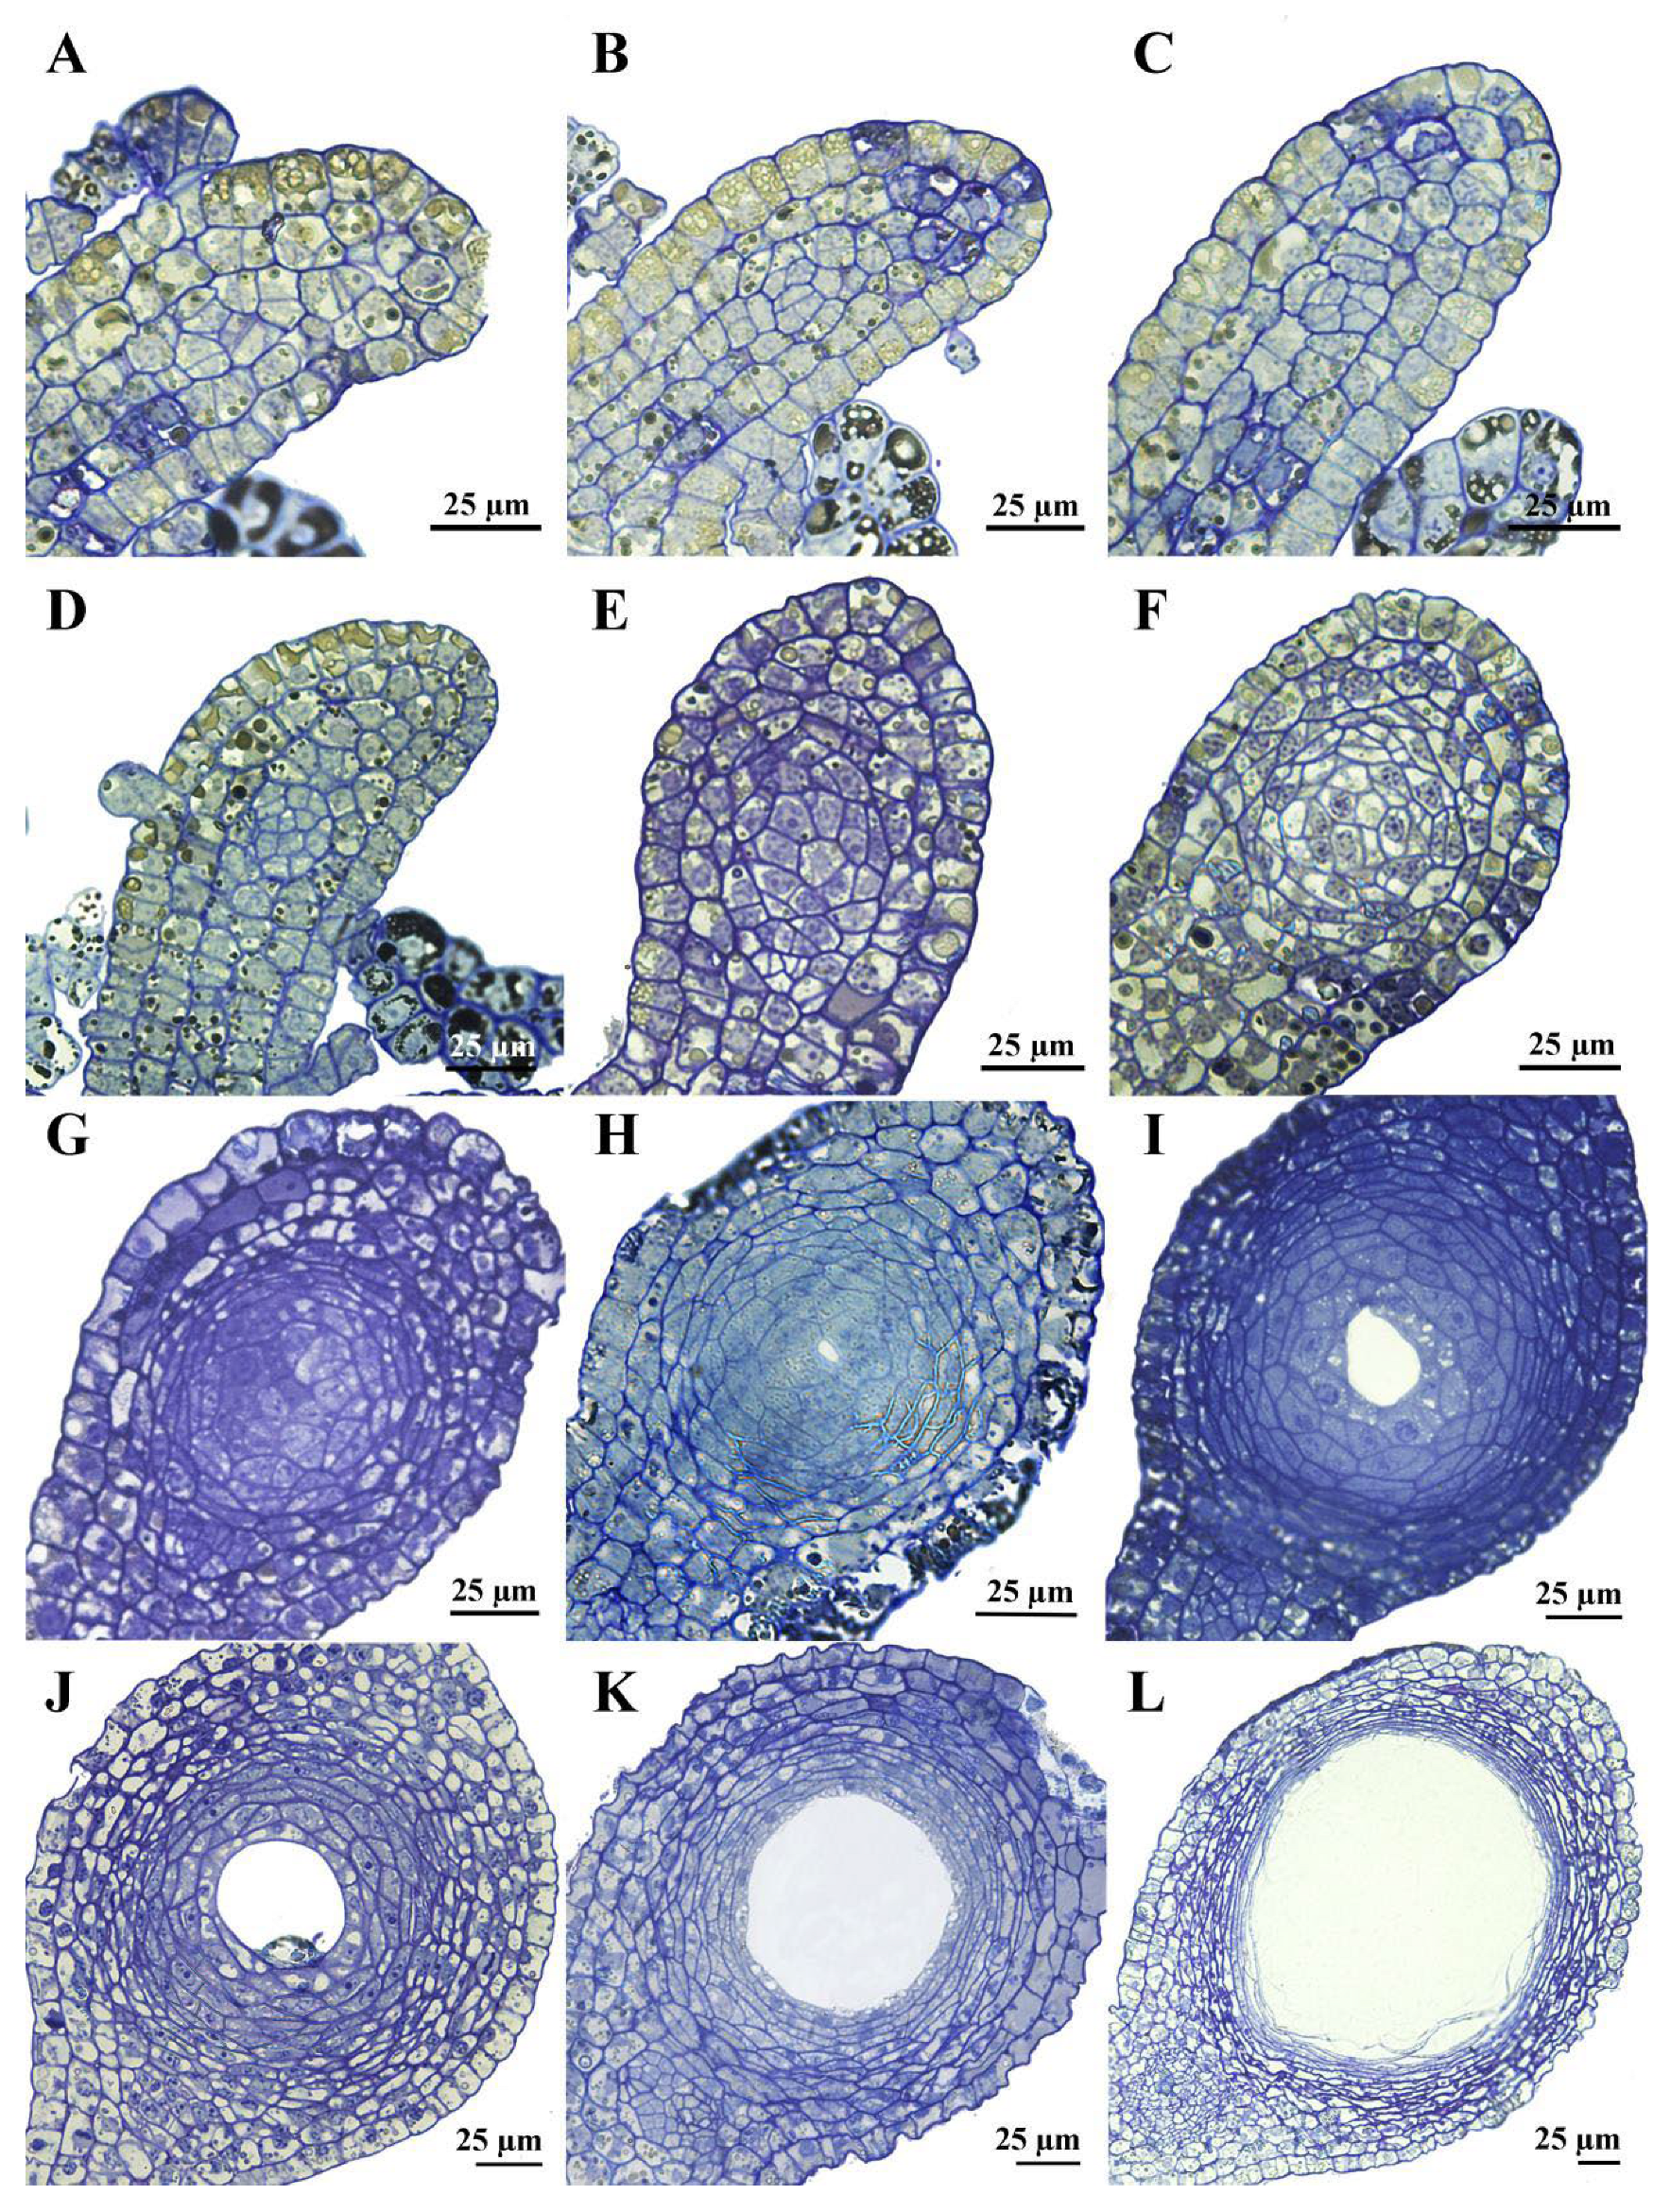
Secretory cavity development is divided into four phases: initial cell, schizogenous intercellular space formation, cavity expansion, and maturation [23,24,26]. During the initial cell phase, one densely cytoplasmic central cell first undergoes a periclinal division to produce two cells (Figure 2A), then an anticlinal division to yield four (Figure 2B). Subsequent longitudinal or transverse divisions (Figure 2C) generate a 10-to-12-cell circular or elliptical primordium (Figure 2D,E).
During the schizogenous phase, the primordium proliferates and enlarges the cell cluster (Figure 2F). Local wall swelling between 2~3 central cells generates fissures at cell junctions (Figure 2G); these clefts propagate, yielding a micro-cavity encircled by 5~6 cells (Figure 2H). Only the spherical domain was observed in Z. nitidum. Central cells remain meristematic with dense cytoplasm, small vacuoles, and large central nuclei [23,24]; two to three isodiametric and cytoplasm-rich inner cell layers become epithelial cells; and a three-to-four-layer outer mantle of smaller, flattened cells differentiates into the sheath [23,24].
Initial cavity expansion is driven by peripheral cells inserting between the inner layers to augment the epithelial cell number. Subsequently, epithelial cells vacuolate and elongate tangentially, rapidly enlarging the lumen (Figure 2I). Continued swelling thins their walls, distorts their shape, and produces a large central vacuole (Figure 2J). Progressive dissolution then proceeds centripetally, leaving only 1~2 epithelial layers intact.
At maturity, the secretory cavity enlarges to a diameter of about 90 µm. A one-to-two-layered sheath of tangentially flattened epithelial cells borders the lumen; these cells exhibit dense cytoplasm and only minute vacuoles. Beyond them, four to six additional layers of even flatter sheath cells display markedly higher vacuolation (Figure 2K,L).
Semi-thin sections revealed that the secretory cavities in Z. nitidum leaves consist solely of a globular zone and arise schizogenously. Earlier studies reported that the secretory cavities of Ruta are schizogenous, whereas those in Poncirus and Citrus are lysigenous [27,28,36]. Liu and Hu [37] demonstrated that the secretory cavities in Z. bungeanum Maxim. fruit are likewise schizogenous. With improved techniques, a survey of 42 Rutaceous species confirmed that schizogeny is the predominant mode of cavity initiation [26], a finding consistent with our observations in Z. nitidum. These cavities serve as the primary storage sites for EOs and are thought to protect leaves against herbivorous insects [38,39].

3.3. Comparison of EO Contents

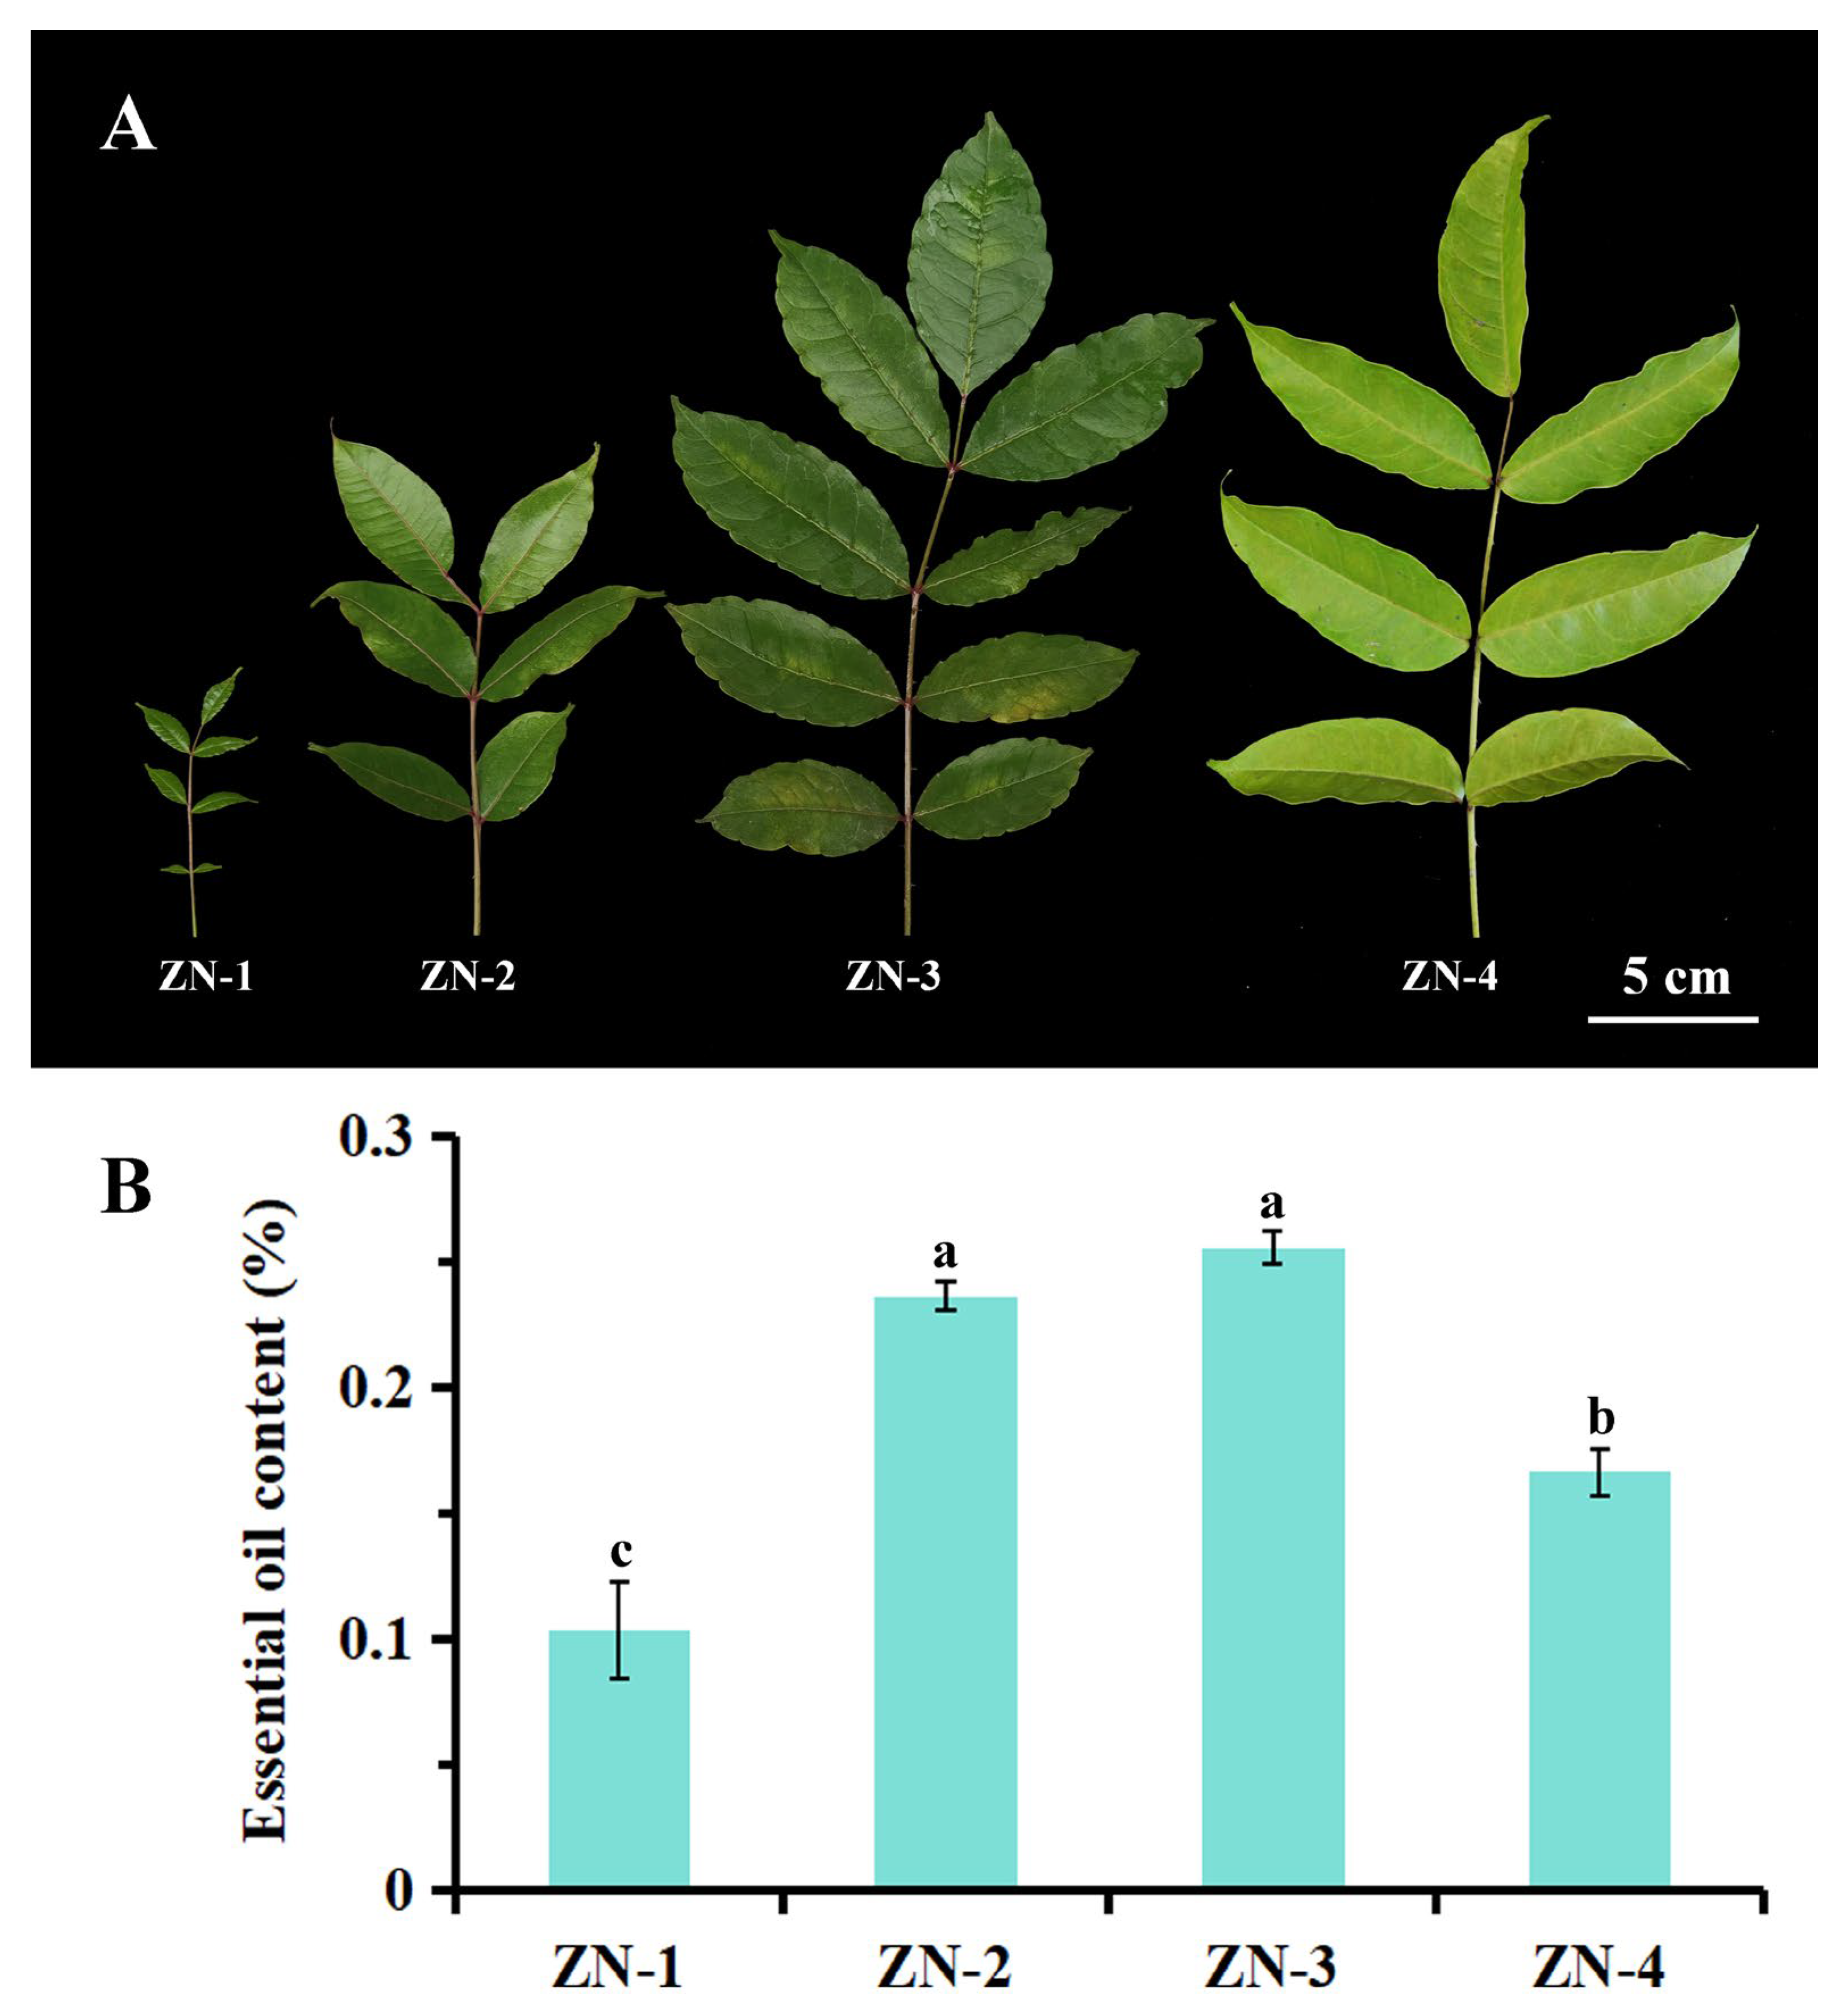
EO yields from leaves at different growth stages (Figure 3A) are shown in Figure 3B. The yield initially increased and then declined. Stages ZN-3 and ZN-2 produced the highest yields (0.26% and 0.24%, respectively), with no significant difference between them (p > 0.05). The yield at ZN-4 (0.17%) was significantly higher than that at ZN-1 (0.10%). Under the same hydro-distillation method, fresh leaves from Vietnam and Australia yielded only 0.01% and 0.10%, respectively [18,40], whereas those from upper Assam, northeastern India, reached 0.76% [41]. In our previous study, Z. nitidum leaves yielded 0.21% [10]. In the present study, yields across stages ranged from 0.10% to 0.26%, peaking at intermediate maturity. During early leaf development, rapid cell division and expansion initiated secondary metabolite accumulation; at full maturity, biosynthesis plateaued. Upon senescence, essential oils and other nutrients were remobilized or degraded, reducing yield [42,43]. Similar trends were reported for C. cassia leaf EO, the alkaloids of Z. nitidum, and the chlorogenic acid and luteoloside of Lonicera japonica Thunb. [2,21,44]. Thus, stages ZN-2 and ZN-3 were identified as the optimal harvest window for essential oil production.

3.4. Chemical Composition of the EO

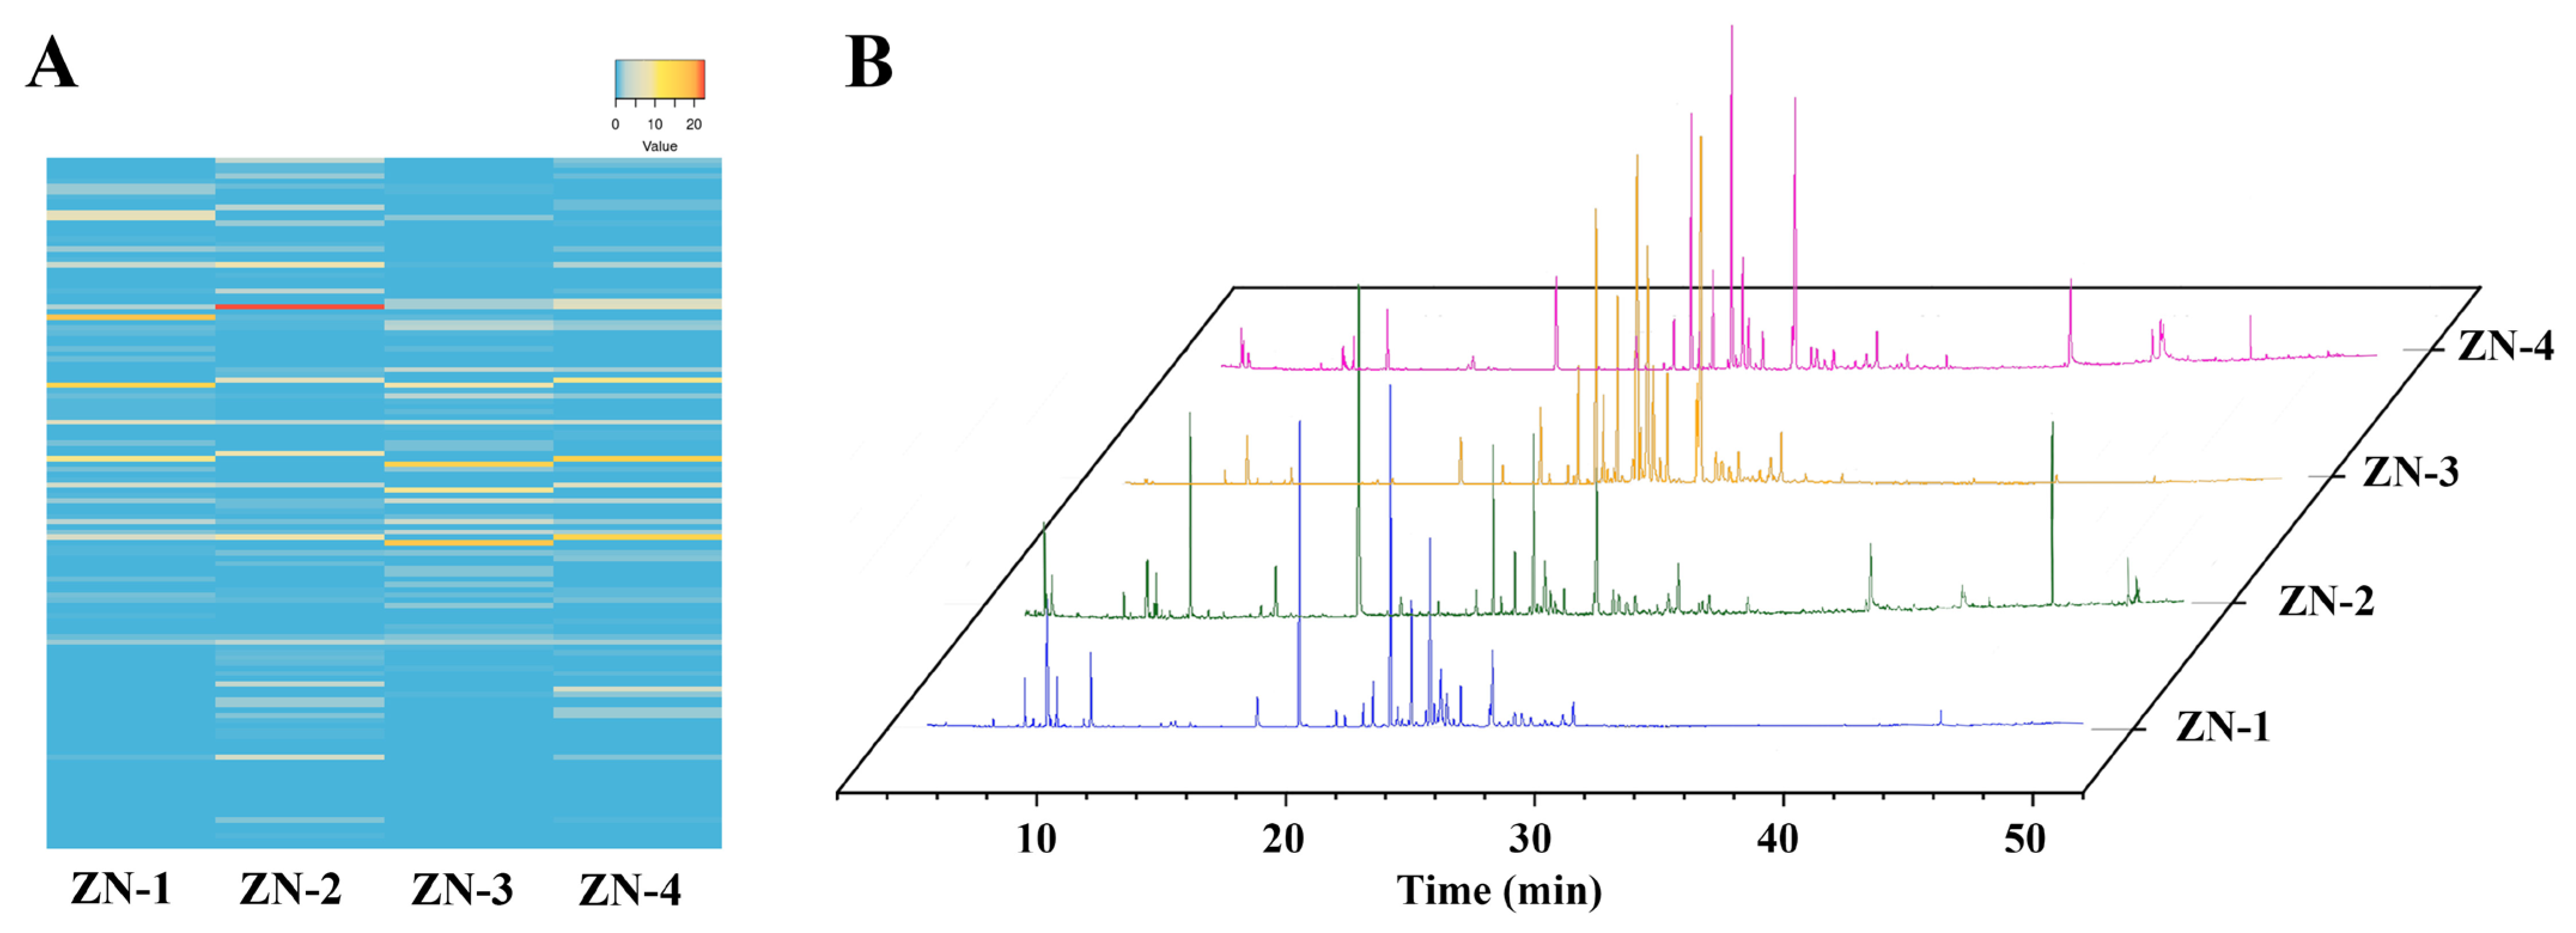
GC-MS analysis of EOs from Z. nitidum leaves at four developmental stages (Figure 4A,B) identified a total of 60 constituents (Figure 4B, Table 1) accounting for 88.96~90.36% of the total EO. The number of compounds detected at each stage was 34, 35, 32, and 33 for ZN-1, ZN-2, ZN-3, and ZN-4, respectively. In ZN-1, 2-undecanone (18.00%), β-caryophyllene (15.37%), β-copaene (9.93%), α-humulene (6.01%), and trans-nerolidol (4.84%) dominated, giving 54.10% sesquiterpenoids, 18.43% ketones, and 16.18% monoterpenoids. ZN-2 was richest in piperitone (22.47%), followed by trans-nerolidol (8.55%), germacrene D (8.35%), linalool (8.17%), and β-caryophyllene (6.51%), with 39.75% monoterpenoids and 37.47% sesquiterpenoids. ZN-3 was characterized by trans-nerolidol (17.39%), β-copaene (15.92%), bicyclogermacrene (9.61%), β-caryophyllene (8.78%), and α-humulene (5.61%), resulting in 84.89% sesquiterpenoids and only 2.44% monoterpenoids. In ZN-4, β-copaene (15.87%), trans-nerolidol (15.55%), β-caryophyllene (9.80%), bicyclogermacrene (5.87%), and n-hexadecanoic acid (4.81%) were foremost, yielding 66.37% sesquiterpenoids and 9.92% monoterpenoids.
All four stages shared the dominant constituents trans-nerolidol, α-humulene, β-caryophyllene, α-cadinol, δ-amorphene, α-farnesene, bicyclogermacrene, linalool, piperitone, and germacrene B, and were dominated by sesquiterpenoids, consistent with our previous report of 68.50% sesquiterpenoids in Z. nitidum leaf oil [10]. In contrast, Z. nitidum leaf EO in Australia is predominantly composed of sesquiterpenes (35.80%), whereas the leaves from Vietnam and India mainly contain monoterpenoids, at 62.10% and 60.00%, respectively [18,40,41]. The type and abundance of secondary metabolites in a medicinal plant vary with growth environment, developmental stage, and tissue [10,42,43,45]. Wide geographic separation and pronounced environmental divergence induce physiological and biochemical shifts that modulate metabolite accumulation [43,46]. For example, Z. nitidum from Guangdong showed a markedly higher alkaloid content than that from Guangxi [8], while leaves from Qujing, Yunnan, contained significantly more hesperidin and total flavonoids than material from Guangdong or Guangxi [6]. Harvest timing further alters composition [2,43,45]. Monoterpenoids in the leaf EO increased to a maximum at ZN-2 (39.75%) and subsequently declined, a pattern paralleled by the accumulation of chlorogenic acid and luteoloside in L. japonica [44] and by total alkaloids in Z. nitidum [2]. Consequently, ZN-3 represents the optimal stage for maximal sesquiterpenoid content, whereas ZN-2 provides the highest monoterpenoid level.

3.5. FTIR Fingerprints, HCA, and PCA of Z. nitidum

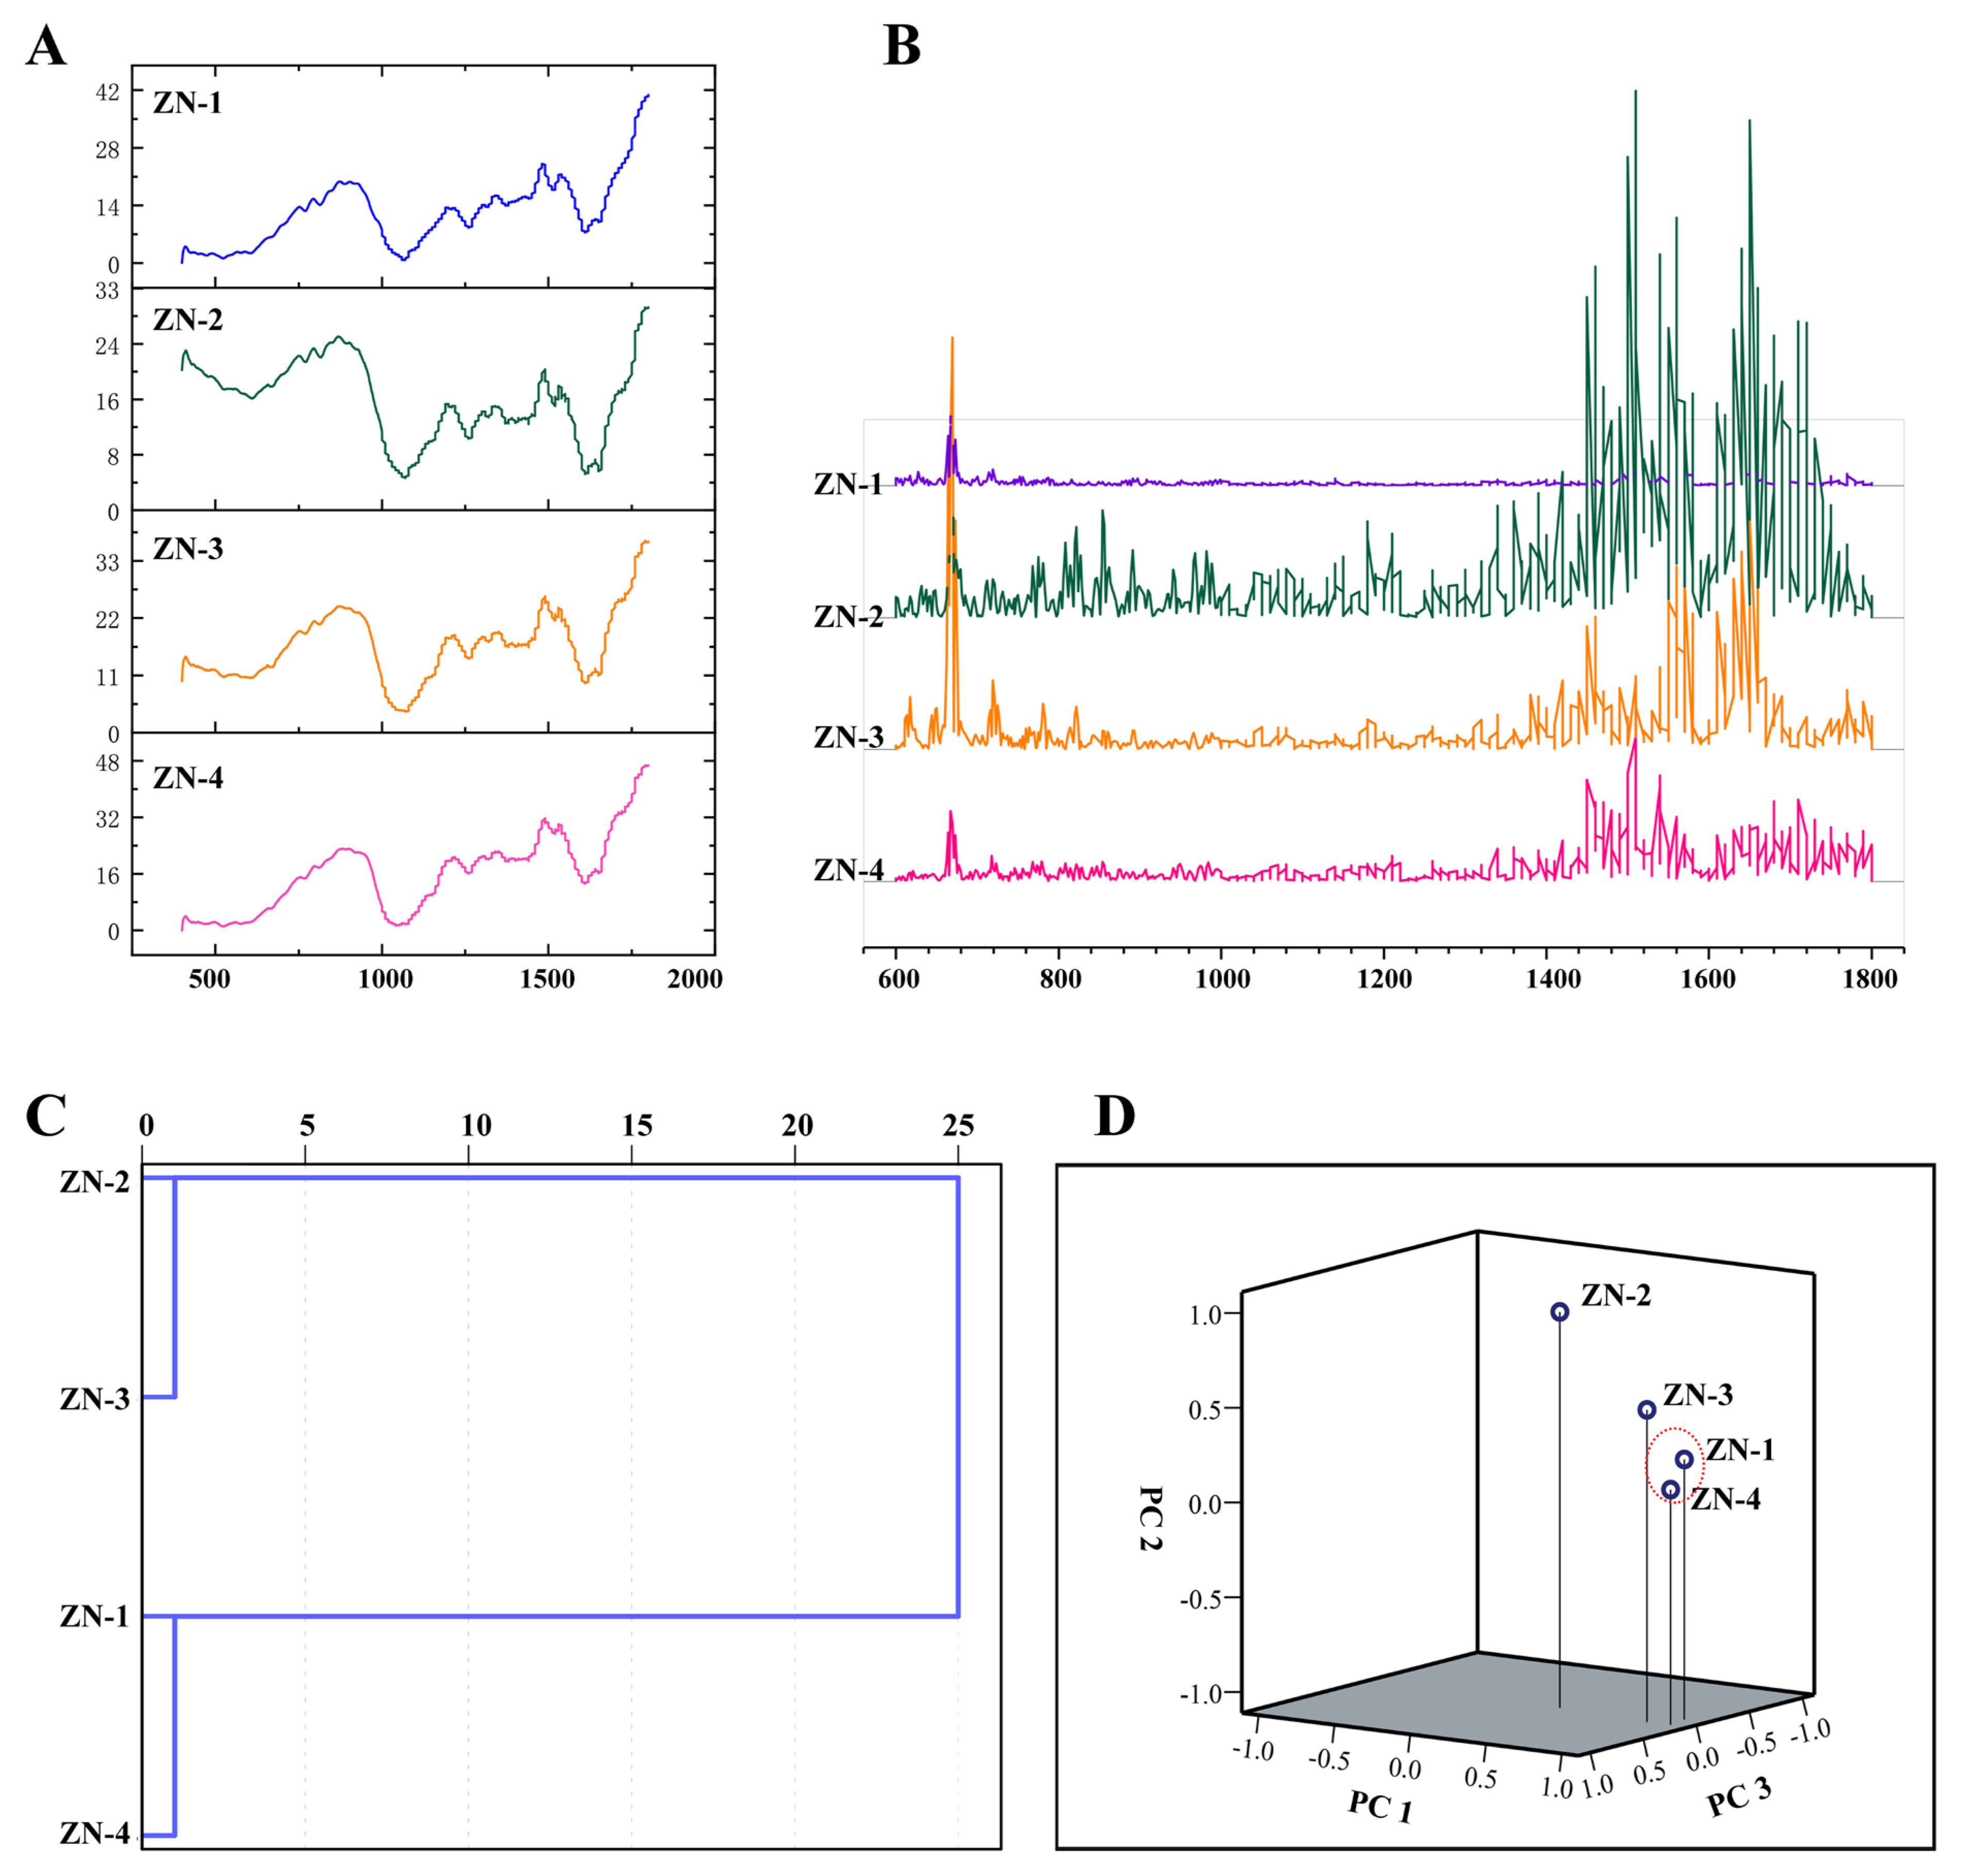
FTIR spectra represent the superposition of functional groups present in the sample [8,32]. Analysis of the FTIR fingerprints of Z. nitidum leaf powders from four developmental stages revealed the 1800~600 cm−1 region to be the most characteristic (Figure 5A). Within this window, the spectra of all four groups highly overlapped, reflecting both chemical complexity and similarity that precluded visual differentiation. Second-derivative spectra (Figure 5B), which enhance resolution, amplify weak bands, and suppress baseline drift [6,8], showed a common peak near 660 cm−1 attributable to out-of-plane bending of aromatic C-H [47]. Marked divergence was observed at 1420~1800 cm−1, corresponding to C=O stretching, C=C stretching, aliphatic C-H bending, and aromatic C=C skeletal vibrations [47]; of these, ZN-2 exhibited the largest amplitude, followed by ZN-3 and ZN-4.
To further characterize the spectroscopic signatures of Z. nitidum leaf powders across developmental stages, chemometric tools including HCA and PCA were applied to the absorbance data. The dendrogram (Figure 5C) resolved the four samples into two primary clusters: the first was formed by ZN-2 and ZN-3, linked by a small distance coefficient (<5); the second comprised ZN-1 and ZN-4, also with a comparably low distance coefficient.
Although hierarchical cluster analysis accurately classified the objects at various distance levels, it failed to reveal relationships between non-adjacent samples [48,49]. To clarify these interrelationships, the second-derivative FTIR spectra spanning 4000~400 cm−1 were selected as the analytical window and subjected to PCA. Figure 5D presents the three-dimensional scatter plot derived from PC1, PC2, and PC3. PC1 explained 61.58% of the total variance and was therefore the dominant component, whereas PC2 and PC3 accounted for 20.78% and 12.75%, respectively. The cumulative contribution of the first three components reached 95.11%, indicating that only 4.89% of the spectral information was lost; consequently, these components captured the vast majority of the original data. Each sample occupied a distinct position in the principal component space, enabling effective discrimination among the four developmental stages. Consistent with the cluster analysis, ZN-1 and ZN-4 clustered together within the red dashed circle in the 3D plot, whereas ZN-2 and ZN-3 were located farther away, with ZN-3 slightly closer to the red circle, mirroring the differences observed in the second-derivative spectra (Figure 5B). Thus, the 3D scatter plot not only provided accurate classification but also offered an intuitive visualization of the relationships among samples. Both cluster analysis and PCA have been widely employed to investigate and differentiate medicinal materials such as Z. nitidum, C. cassia, and Stellaria dichotoma var. lanceolata Bunge [2,4,8,10,50,51].

4. Conclusions

This study is the first to integrate cytological, analytical–chemical, and chemometric approaches to systematically elucidate the ontogeny of secretory cavities and the temporal accumulation of essential oils in Z. nitidum leaves at four developmental stages. (1) Secretory cavities in the leaflets were unequivocally identified as the marginal-tooth-slit type. (2) Each cavity exclusively comprised a spherical domain and originated strictly through a schizogenous mechanism. (3) The EO yield displayed a unimodal trajectory, peaking at stages ZN-2 and ZN-3. GC-MS profiling resolved 65 principal constituents, among which sesquiterpenoids reached their maximum content at ZN-3, and monoterpenoids were most abundant at ZN-2. (4) The second-derivative FTIR spectra of leaf powders exhibited pronounced inter-stage differences; HCA and PCA enabled reliable classification and identification of the developmental stages based on their bioactive signatures, underscoring the robustness and practical utility of the methodology. Collectively, these findings establish a comprehensive cytological and analytical–chemical framework for quality control and rational utilization of Z. nitidum leaves, thereby providing a scientific basis for the full exploitation of this medicinal resource.

Author Contributions

Y.Y.: Conceptualization, methodology, investigation, visualization, writing—review and editing, funding acquisition. J.H.: Methodology, investigation, writing—original draft. J.Z.: Methodology, visualization, writing—original draft. Y.F.: Investigation, software. T.T.: Investigation. X.W.: Investigation. R.K.: Resources. S.Z.: Formal analysis. W.L.: Resources. T.C.: Resources. R.Z.: Data curation. Y.C.: Data curation. Y.L.: Visualization, writing—review and editing. M.B.: Conceptualization, project administration. H.W.: Conceptualization, writing—review and editing, project administration. All authors have read and agreed to the published version of the manuscript.

Funding

This work was supported by the Hunan Provincial Natural Science Foundation (grant number 2024JJ7330), the Excellent Youth Project of Hunan Provincial Department of Education (grant number 24B1083), and the Doctoral Scientific Research Foundation of Hunan University of Medicine (Document number 202543).

Data Availability Statement

All data from this study have been published in the manuscript. There is no additional data available.

Conflicts of Interest

The authors declare no competing interests.

References

  1. China Pharmacopeia Commission. Pharmacopoeia of the People’s Republic of China; China Medical Science and Technology Press: Beijing, China, 2025; pp. 181–182. [Google Scholar]
  2. Yang, Y.; Liu, Y.; Yang, Y.; Jia, H.; Tan, P.; Zeng, J.; Zeng, L.; Xie, T.; Geng, X.; He, H.; et al. A comparative analysis of the composition of the primary bioactive molecules, antioxidant activities, and anti-inflammation abilities of the roots of Zanthoxylum nitidum harvested at different years of cultivation. Ind. Crop Prod. 2024, 221, 119426. [Google Scholar] [CrossRef]
  3. Lu, Q.; Ma, R.; Yang, Y.; Mo, Z.; Pu, X.; Li, C. Zanthoxylum nitidum (Roxb.) DC: Traditional uses, phytochemistry, pharmacological activities and toxicology. J. Ethnopharmacol. 2020, 260, 112946. [Google Scholar] [CrossRef] [PubMed]
  4. Yang, Y.; He, J.; Liu, Y.; Zeng, J.; Zeng, L.; He, R.; Guiang, M.M.; Li, Y.; Wu, H. Assessment of Chinese suitable habitats of Zanthoxylum nitidum in different climatic conditions by Maxent model, HPLC, and chemometric methods. Ind. Crop Prod. 2023, 196, 116515. [Google Scholar] [CrossRef]
  5. Qin, F.; Wang, F.F.; Wang, C.G.; Chen, Y.; Li, M.S.; Zhu, Y.K.; Huang, X.C.; Fan, C.W.; Wang, H.S. The neurotrophic and antineuroinflammatory effects of phenylpropanoids from Zanthoxylum nitidum var. tomentosum (Rutaceae). Fitoterapia 2021, 153, 104990. [Google Scholar] [CrossRef] [PubMed]
  6. He, J.; Zeng, J.; Zeng, L.; Yang, L.; Ma, Q.; Wu, H.; Yang, Y. Comparison of the bioactive components and antioxidant activities of wild-type Zanthoxylum nitidum roots from various regions of Southern China. Nat. Prod. Res. 2024, 38, 4399–4410. [Google Scholar] [CrossRef]
  7. Peng, Z.H.; Wu, M.H.; Xie, Z.J.; Yang, X.B.; Lai, M.X. Investigation of wild resource of Zanthoxylum nitidum. Pharm. Today 2018, 28, 500–504. [Google Scholar]
  8. Yang, Y.; Li, Y.; Amoroso, V.; Acma, F.; Guiang, M.M.; Wu, H. Comparison of production of bioactive components in Zanthoxylum nitidum taproots from different regions in southern China. Biomed. Chromatogr. 2023, 37, e5602. [Google Scholar] [CrossRef]
  9. Tan, Y. Scientific and Reaconable Exploitation and Utilization of Zanthoxylum nitidum, the Essential Raw Materials of Sanjiu Weitai Granules. Ph.D. Thesis, Guangzhou University of Chinese Medicine, Guangzhou, China, 2011. [Google Scholar]
  10. Yang, Y.; Li, Y.; He, H.; Yang, L.; Zeng, J.; Bai, M.; Wu, H. Comparison of essential oil components and in vitro antioxidant activity of Zanthoxylum nitidum from different parts. Plants 2025, 14, 1194. [Google Scholar] [CrossRef]
  11. Yang, Y.; Li, Y.; He, H.; Yang, L.; Zeng, J.; Bai, M.; Wu, H. UPLC specific chromatogram study and pharmacodynamic composition analysis of roots and stems of Zanthoxylum nitidum. J. Chin. Med. Mater. 2020, 43, 2959–2965. [Google Scholar]
  12. He, L.L.; Lin, Z.H.; Hu, Y.Z.; Qin, Q.Y.; Huang, G.W.; Hu, D.N. Dynamic accumulation research of active ingredient in different part and growth phase of caltivative Zanthoxylum nitidum by UPLC-DAD. Chin. J. Exp. Tradit. Med. Formulae 2013, 19, 165–168. [Google Scholar]
  13. Vilaysack, M. Studies on the Anti-Inflammatory and Analgesic Active of Different Portions and Low-Polarity Portion Chemical Constituents in the Leaves of Zanthoxylum nitidum DC. Master’s Thesis, Guangxi Medical University, Nanning, China, 2013. [Google Scholar]
  14. Lee, J.H.; Chang, K.M.; Kim, G.H. Composition and antin-flammatory activities of Zanthoxylum schinifolium essential oil: Suppression of inducible nitric oxidesynthase, cyclooxy-genase-2, cytokines and cellular adhesion. J. Sci. Food Agric. 2009, 89, 1762–1769. [Google Scholar] [CrossRef]
  15. Li, R.; Yang, J.J.; Shi, Y.X.; Zhao, M.; Ji, K.L.; Zhang, P.; Xu, Y.K.; Hu, H.B. Chemical composition, antimicrobial and anti-inflammatory activities of the essential oil from Maqian (Zanthoxylum myriacanthum var. pubescens) in Xishuangbanna, southwest China. J. Ethnopharmacol. 2014, 158, 43–48. [Google Scholar] [CrossRef]
  16. Ji, K.L.; Gan, X.Q.; Xu, Y.K.; Li, X.F.; Guo, J.; Dahab, M.M.; Zhang, P. Protective effect of the essential oil of Zanthoxylum myriacanthum var. pubescens against dextran sulfate sodium-induced intestinal inflammation in mice. Pytomedicine 2016, 23, 883–890. [Google Scholar] [CrossRef]
  17. Guo, R.H.; Park, J.U.; Jo, S.J.; Ahn, J.H.; Park, J.H.; Yang, J.Y.; Lee, S.S.; Park, M.J.; Kim, Y.R. Anti-allergic inflammatory effects of the essential oil from fruits of Zanthoxylum coreanum Nakai. Front. Pharmacol. 2018, 9, 1441. [Google Scholar] [CrossRef]
  18. Tuyen, T.T.; Quan, P.M.; Thu Le, V.T.; Toan, T.Q.; Nghi, D.H.; Bach, P.C.; Inh, C.T.; Hanh, N.P.; Vien, T.A.; Hong Minh, P.T.; et al. Chemical composition, antimicrobial, and cytotoxic activities of leaf, fruit, and branch essential oils obtained from Zanthoxylum nitidum grown in Vietnam. Nat. Prod. Commun. 2021, 16, 1934578X20985649. [Google Scholar] [CrossRef]
  19. Hu, Z.; Tian, W.; Lv, H. Anatomy of Plant Secretory Structures, 1st ed.; Shanghai Science and Technology Press: Shanghai, China, 2012; pp. 12–18. [Google Scholar]
  20. Li, Y.; Kong, D.; Hong, W. Analysis and evaluation of essential oil components of Cinnamon barks using GC-MS and FTIR spectroscopy. Ind. Crop Prod. 2013, 41, 269–278. [Google Scholar] [CrossRef]
  21. Li, Y.Q.; Kong, D.X.; Huang, R.S.; Liang, H.L.; Xu, C.G.; Wu, H. Variations in essential oil yields and compositions of Cinnamomum cassia leaves at different developmental stages. Ind. Crop Prods 2013, 47, 92–101. [Google Scholar] [CrossRef]
  22. Platt-Aloia, K.A.; Oross, J.W.; Thomson, W.W. Ultrastructural study of the development of oil cells in the mesocarp of avocado fruit. Bot. Gaz. 1983, 144, 49–55. [Google Scholar] [CrossRef]
  23. Liu, P.; Liang, S.; Yao, N.; Wu, H. Programmed cell death of secretory cavity cells in fruits of Citrus grandis cv. tomentosa is associated with activation of caspase 3-like protease. Trees 2012, 26, 1821–1835. [Google Scholar] [CrossRef]
  24. Liang, S.J.; Wu, H.; Lun, X.; Lu, D.W. Secretory cavity development and its relationship with the accumulation of essential oil in fruits of Citrus medica L. var. sarcodactylis (Noot.) swingle. J. Integr. Plant Biol. 2006, 48, 573–583. [Google Scholar] [CrossRef]
  25. Cai, X.; Hu, Z.; He, Y. The relationship between ultrastructure changesand produce of the oil during the oil celldevelopment in Liriodendron chinense. Acta Bot. Boreali-Occident. Sin. 2002, 22, 327–332. [Google Scholar]
  26. Liu, W.; Hu, Z. Comparative anatomy of secretory cavities in leaves of the Rutaceae in China. J. Syst. Evol. 1998, 36, 119–127. [Google Scholar]
  27. Heinrich, G. Licht -und elektronenmikroskopische untersuchungen zur genese der exkrete in den lysigenen exkreträumen von Citrus medica. Flora Allg Bot. Zeitung. Abt. A Physiol. Biochem. 1966, 156, 451–456. [Google Scholar] [CrossRef]
  28. Heinrich, G. Elektronenmikroskopische beobachtungen zur entstehungsweise der exkretbehälter von Ruta graveolens, Citrus limon und Poncirus trifoliata. Osterr. Bot. Z.—Plant Syst. Evol. 1969, 117, 397–403. [Google Scholar] [CrossRef]
  29. Li, Y.; Liu, W. Anatomical studies on the secretory cavity development in the stem and leaf of Evodia rutaecarpa. J. Northwest Sci-Tech Univ. Agric. For. 2000, 28, 27–31. [Google Scholar]
  30. Thomson, W.W.; Platt-Aloia, K.A.; Endress, A.G. Ultrastructure of oil gland development in leaf of Citrus sinensis L. Bot. Gaz. 1976, 137, 330–340. [Google Scholar] [CrossRef]
  31. Yang, Y.; Medecilo-Guiang, M.M.P.; Yang, L.; Huang, B.; He, J.; Chen, P. Structure and characteristics of foliar variegation in four species of medicinal Zingiberaceae. Braz. J. Bot. 2023, 46, 423–432. [Google Scholar] [CrossRef]
  32. Bai, M.; Jin, X.; Cen, Z.; Yu, K.; Yu, H.; Xiao, R.; Deng, J.; Lai, Z.; Wu, H.; Li, Y. GC–MS and FTIR spectroscopy for the identification and assessment of essential oil components of five Cinnamon leaves. Braz. J. Bot. 2021, 44, 525–535. [Google Scholar] [CrossRef]
  33. Buchgraber, M.; Ulberth, F.; Anklam, E. Cluster analysis for the systematic grouping of genuine cocoa butter and cocoa butter equivalent samples based on triglyceride patterns. J. Agric. Food Chem. 2004, 52, 3855–3860. [Google Scholar] [CrossRef]
  34. de Andrade, C.R.B.; Martins, F.M.; Brandão, H.N.; Alves, C.Q.; de Freitas-Silva, L. Leaf anatomy and histochemistry of secretory structures of Zanthoxylum caribaeum Lam. (Rutaceae). Braz. J. Bot. 2020, 43, 961–968. [Google Scholar] [CrossRef]
  35. Shunmugam, S.; Roslia, N.S.; Manickamb, S.; Yusoffa, N.F.M.; Alitheena, N.B.; Namasivayama, P. Morphology and anatomy of leaf, stem and petiole of Luvunga crassifolia Tanaka (Rutaceae). Malays. J. Fund. Appl. Sci. 2021, 17, 818–828. [Google Scholar] [CrossRef]
  36. Heinrich, G. Elektronenmikroskopische beobachtungen an den Drüsenzellen von Poncirus trifoliata; zugleich ein bBeitrag zur wirkung ätherischer Öle auf pflanzenzellen und eine methode zur unterscheidung flüchtiger von nichtflüchtigen lipophilen komponenten. Protoplasma 1970, 69, 15–36. [Google Scholar] [CrossRef]
  37. Liu, W.; Hu, Z. Ultrastructure of the secretory cavity development in the fruit of Zanthoxylum bungeanum. J. Integr. Plant Biol. 1997, 39, 200–204. [Google Scholar]
  38. Turner, G.W. Comparative development of secretory cavities in the tribes amorpheae and psoraleeae (Leguminosae: Papilionoideae). Am. J. Bot. 1986, 73, 1178–1192. [Google Scholar] [CrossRef]
  39. Crang, R.; Lyons-Sobaski, S.; Wise, R. Secretory structures. In Plant Anatomy: A Concept-Based Approach to the Structure of Seed Plants; Springer International Publishing: Cham, Switzerland, 2018; pp. 443–476. [Google Scholar]
  40. Brophy, J.J.; Goldsack, R.J.; Forster, P.I.; Hutton, I. Composition of the leaf oils of the Australian and lord howe Island species of Zanthoxylum (Rutaceae). J. Essent. Oil Res. 2000, 12, 285–291. [Google Scholar] [CrossRef]
  41. Bhattacharya, S.; Zaman, M.K. Essential oil composition of fruits and leaves of Zanthoxylum nitidum grown in upper Assam region of India. Pharmacogn. Res. 2009, 1, 148–151. [Google Scholar]
  42. Figueiredo, A.C.; Barroso, J.G.; Pedro, L.G.; Scheffer, J.J. Factors affecting secondary metabolite production in plants: Volatile components and essential oils. Flavour. Frag. J. 2008, 23, 213–226. [Google Scholar] [CrossRef]
  43. Li, Y.; Kong, D.; Fu, Y.; Sussman, M.R.; Wu, H. The effect of developmental and environmental factors on secondary metabolites in medicinal plants. Plant Physiol. Biochem. 2020, 148, 80–89. [Google Scholar] [CrossRef]
  44. Kong, D.X.; Li, Y.Q.; Bai, M.; He, H.J.; Liang, G.X.; Wu, H. Correlation between the dynamic accumulation of the main effective components and their associated regulatory enzyme activities at different growth stages in Lonicera japonica Thunb. Ind. Crop Prod. 2017, 96, 16–22. [Google Scholar] [CrossRef]
  45. Bhatla, S.C.; Lal, M.A. Secondary metabolites. In Plant Physiology, Development and Metabolism; Springer: Singapore, 2023; pp. 765–808. [Google Scholar]
  46. Verma, N.; Shukla, S. Impact of various factors responsible for fluctuation in plant secondary metabolites. J. Appl. Res. Med. Aromat. Plants 2015, 2, 105–113. [Google Scholar] [CrossRef]
  47. Weng, S.F. Fourier Transform Infrared Spectrometer; Beijing Industry Press: Beijing, China, 2005; pp. 320–326. [Google Scholar]
  48. Zhang, Y.; Wang, Z. Comparative analysis of essential oil components of three Phlomis species in Qinling Mountains of China. J. Pharmaceut Biomed. 2008, 47, 213–217. [Google Scholar] [CrossRef] [PubMed]
  49. Liu, J.; Chen, X.; Yang, W.; Liu, W.; Jiang, T. Study on establishment of RP-HPLC and GC-MS fifingerprints for wild germplasm resource of Ophiopogon japonicus in Sichuan and hierarchical clustering analysis. China J. Chin. Mater. Med. 2010, 35, 2726–2730. [Google Scholar]
  50. Li, Y.; Yang, Y.; Gu, D.; Cheng, Y.; Lv, X.; Huang, Y.; Ye, P.; Zhang, X.; Zhang, J.; Jian, W.; et al. Investigation of the impact of diverse climate conditions on the cultivation suitability of Cinnamomum cassia using the MaxEnt model, HPLC and chemometric methods in China. Sci. Rep. 2024, 14, 25686. [Google Scholar] [CrossRef] [PubMed]
  51. Li, Z.; Yang, Y.; Feng, L.; Li, H.; Dai, Z.; Cheng, T.; Liu, S.; Ma, L.; Luo, X.; Wang, Y.; et al. The combined effects of climate, soil, and rhizospheric microorganisms determine the quality and suitable production zones of Stellaria dichotoma L. var. lanceolata Bge. in China. Chem. Biol. Technol. Agric. 2024, 11, 185. [Google Scholar] [CrossRef]
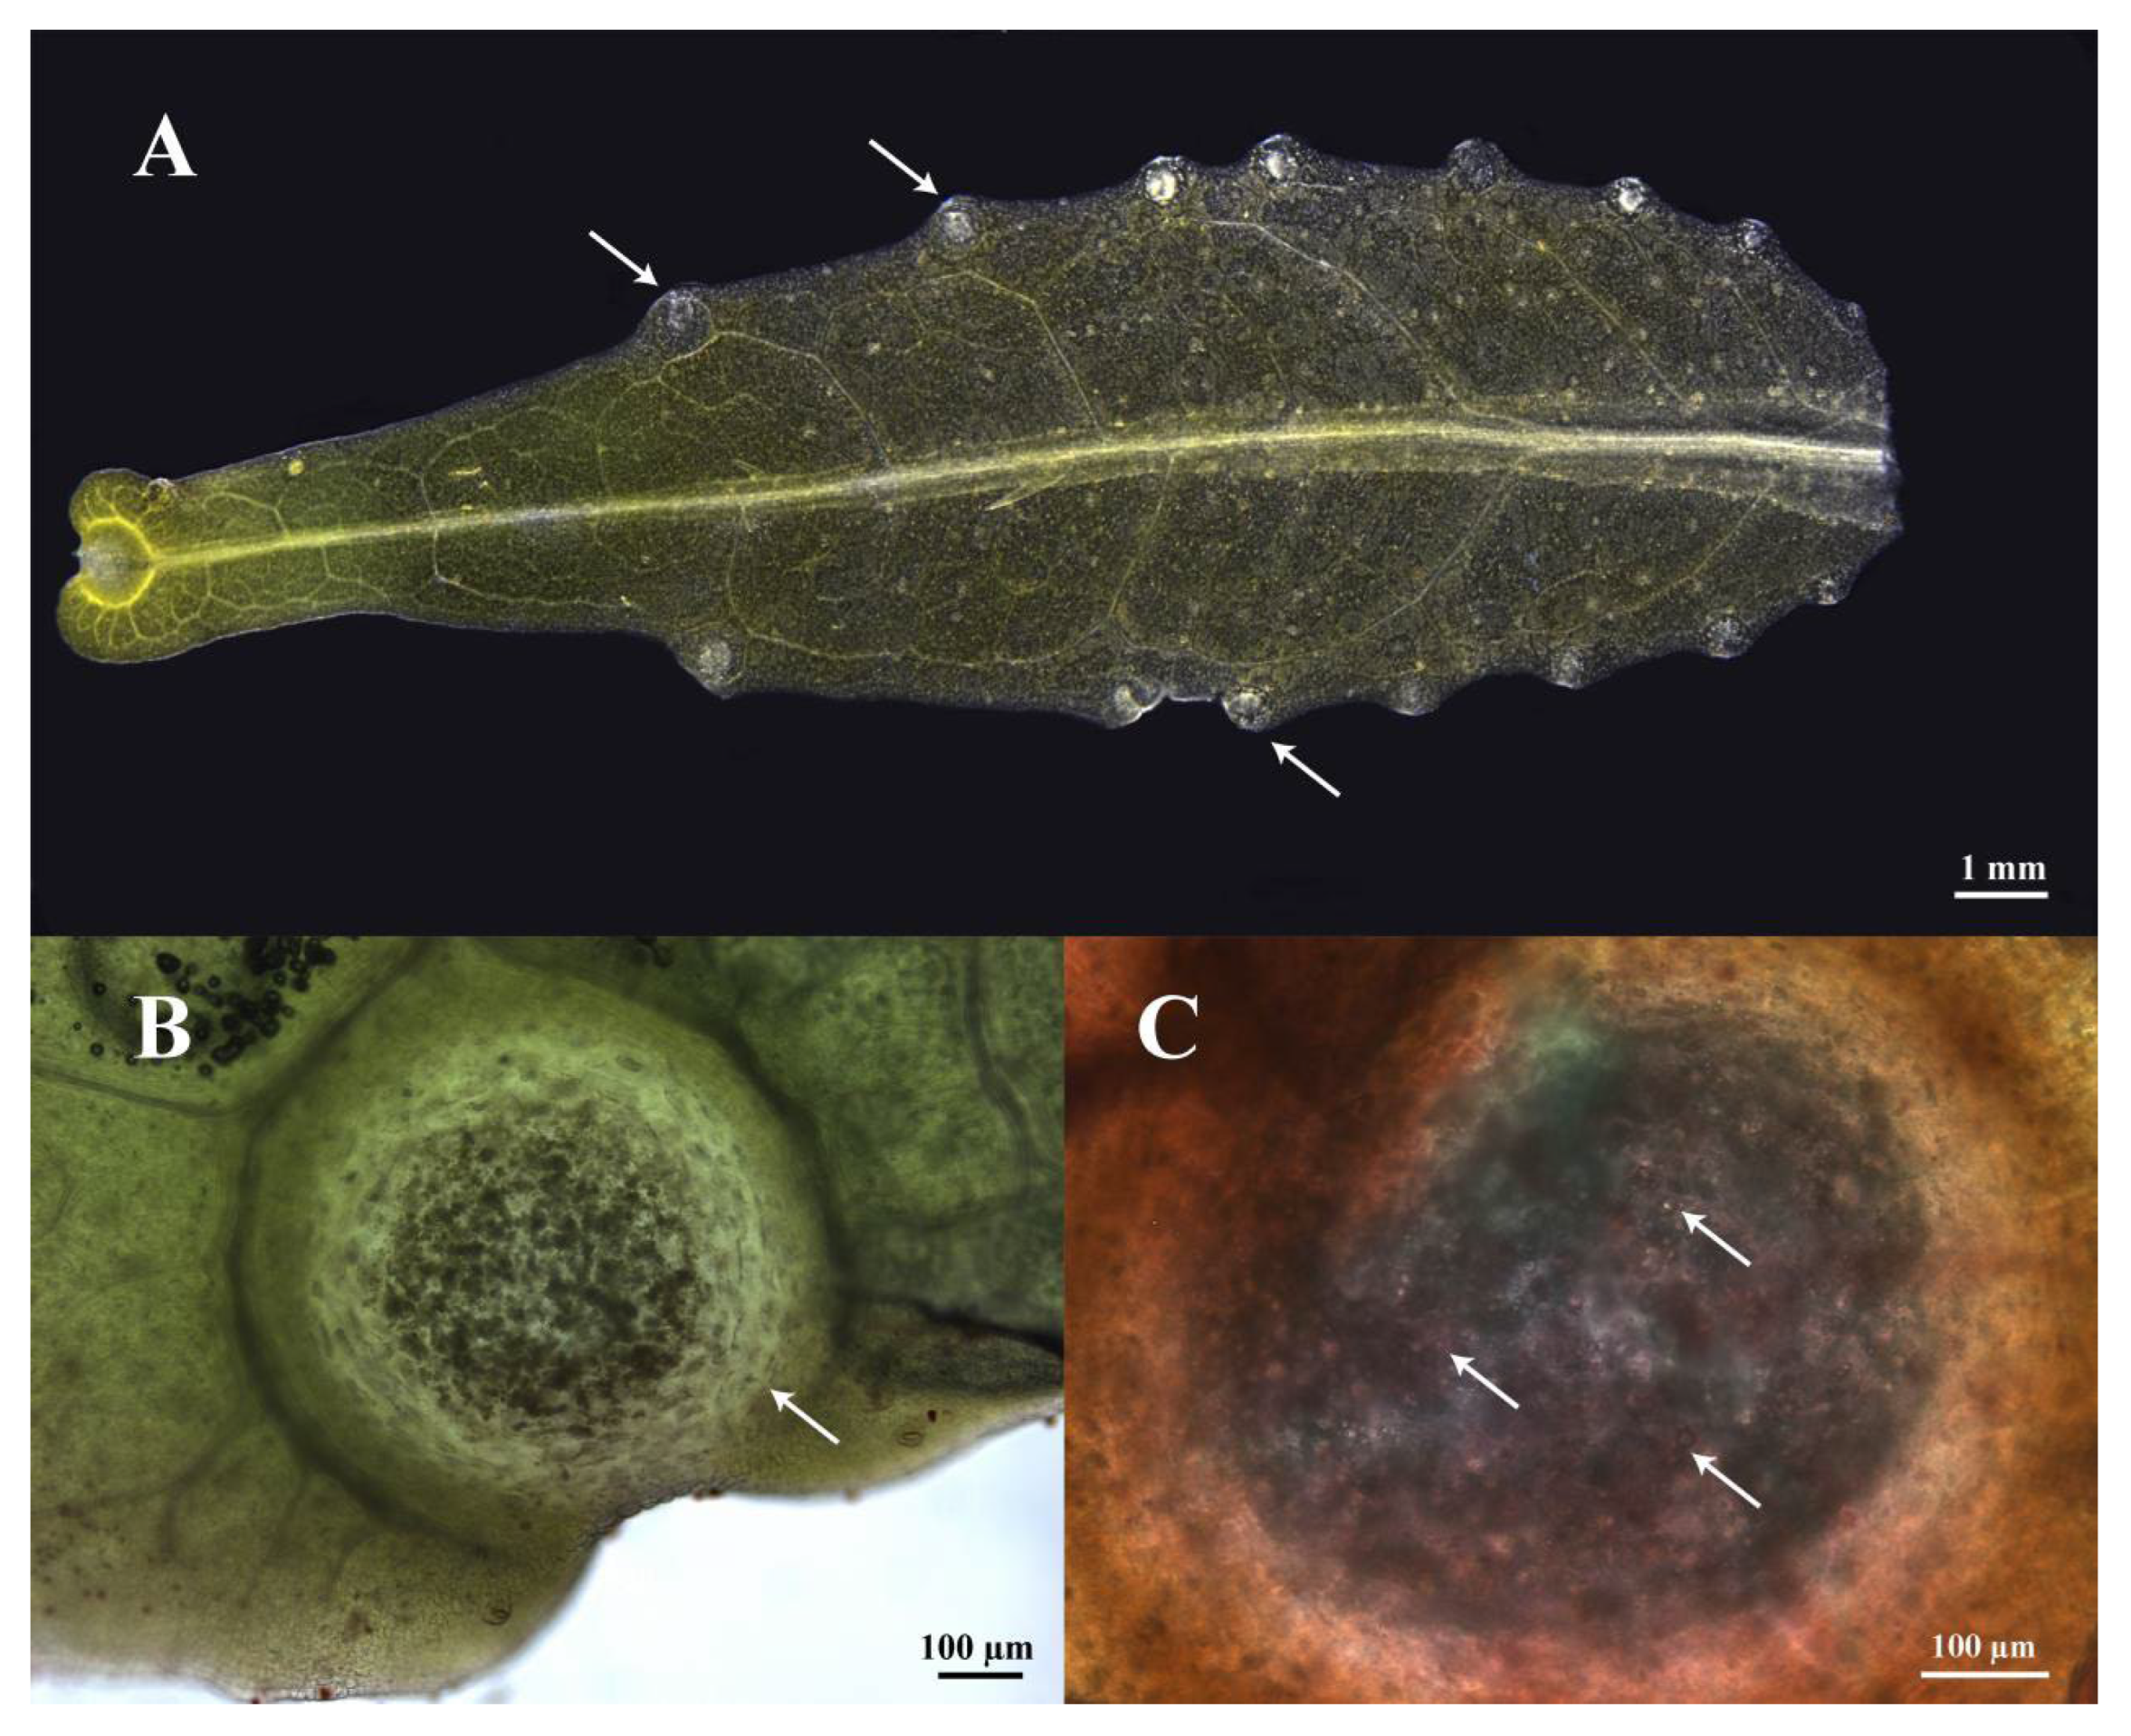
Figure 1. (A) Distribution of secretory cavities (white arrows) in Zanthoxylum nitidum leaf, bar = 1 mm. (B) Secretory cavity, bar = 100 µm. (C) Essential oil droplets (white arrows) stained with Sudan red in the secretory cavity, bar = 100 µm.
Plants 14 03449 g001
Figure 2. Semi-thin sections of secretory cavity development in Zanthoxylum nitidum leaf. (AF), initial cell stage; (G,H), schizogenous stage; (I,J), cavity expansion stage; (K,L), maturation stage. Bar = 25 µm.
Plants 14 03449 g002
Figure 3. (A) Zanthoxylum nitidum leaves at different developmental stages, bar = 5 cm. (B) Histogram of essential oil yields from leaves at different stages; different lowercase letters “a”, “b”, and “c” indicate significant differences among samples (p < 0.05).
Plants 14 03449 g003
Figure 4. (A) Heat map and (B) GC-MS chromatograms of essential oils from Zanthoxylum nitidum leaves at different developmental stages.
Plants 14 03449 g004
Figure 5. Zanthoxylum nitidum leaves at different developmental stages: (A) IR spectra, (B) second-derivative IR spectra, (C) cluster dendrogram, and (D) PCA score scatter plot.
Plants 14 03449 g005
Table 1. Chemical composition of Zanthoxylum nitidum leaves at different developmental stages.
No.Compound NameRIRelative Content (%)Identification
ZN-1ZN-2ZN-3ZN-4
12-Hexenal8502.95 ± 0.0591.25 ± 0.072GC-MS, RI
23-Hexen-1-ol8590.49 ± 0.0470.91 ± 0.054GC-MS, RI
3trans-2-Hexenol8611.56 ± 0.0640.72 ± 0.030GC-MS, RI
4β-Thujene9360.26 ± 0.010GC-MS, RI
5α-Pinene9482.18 ± 2.18GC-MS, RI
6(+)-Sabinene9834.70 ± 2.351.37 ± 0.040GC-MS, RI
7α-Myrcene9911.14 ± 0.570.70 ± 0.019GC-MS, RI
8Isocarvestrene10182.27 ± 0.023GC-MS, RI
9Eucalyptol10311.76 ± 0.0170.34 ± 0.019GC-MS, RI
10α-Tolualdehyde10440.36 ± 0.027GC-MS, RI
11(E)-β-Ocimene10481.78 ± 0.0491.31 ± 0.00900.96 ± 0.037GC-MS, RI
12Terpinolen10820.31 ± 0.0030GC-MS, RI
13Linalool11013.38 ± 0.0788.17 ± 0.0430.39 ± 0.0102.24 ± 0.089GC-MS, RI
14Terpinen-4-ol11620.33 ± 0.055GC-MS, RI
15(-)-α-Terpineol11970.32 ± 0.002.74 ± 0.0350.62 ± 0.017GC-MS, RI
16Decanal12080.21 ± 0.00GC-MS, RI
172-Isopropyl-5-methyl-3-cyclohexen-1-one12513.76 ± 1.88GC-MS, RI
18Piperitone12622.11 ± 0.02022.47 ± 0.0570.68 ± 0.682.00 ± 2.00GC-MS, RI
192-Undecanone129418.00 ± 0.0920.56 ± 0.0120.57 ± 0.0090GC-MS, RI
20δ-EIemene13470.21 ± 0.110.70 ± 0.700.91 ± 0.46GC-MS, RI
21(-)-α-Cubebene13610.45 ± 0.000.25 ± 0.00300.23 ± 0.0030GC-MS, RI
22α-Copaene13750.31 ± 0.31GC-MS, RI
23α-Ylangene13770.61 ± 0.310.47 ± 0.0030GC-MS, RI
24Elemene14020.20 ± 0.203.03 ± 0.077GC-MS, RI
25β-Caryophyllene143015.37 ± 0.0136.51 ± 0.0468.78 ± 0.119.80 ± 0.12GC-MS, RI
26β-Copaene14379.93 ± 0.09515.92 ± 0.05715.87 ± 0.035GC-MS, RI
27γ-Elemene14440.90 ± 0.0400.45 ± 0.0282.27 ± 0.0691.41 ± 0.12GC-MS, RI
28Isogermacrene D14480.45 ± 0.00GC-MS, RI
29(+)-Aromadendrene14560.38 ± 0.00GC-MS, RI
30α-Humulene14716.01 ± 0.0232.52 ± 0.00905.61 ± 0.0124.00 ± 0.030GC-MS, RI
31γ-Muurolene14890.99 ± 0.0150.96 ± 0.0030GC-MS, RI
32Germacrene D14978.35 ± 0.093GC-MS, RI
332-Tridecanone14560.43 ± 0.015GC-MS, RI
34Bicyclogermacrene14954.52 ± 0.0222.65 ± 0.0569.61 ± 0.0425.87 ± 0.055GC-MS, RI
35α-Farnesene15051.83 ± 0.0590.51 ± 0.254.01 ± 0.142.29 ± 0.069GC-MS, RI
36α-Amorphene15120.33 ± 0.0070GC-MS, RI
37γ-Amorphene15180.37 ± 0.00700.89 ± 0.0120.20 ± 0.017GC-MS, RI
38δ-Amorphene15212.43 ± 0.0241.07 ± 0.0323.87 ± 0.0381.78 ± 0.013GC-MS, RI
39Germacrene B15611.17 ± 0.0640.72 ± 0.0472.80 ± 0.121.99 ± 0.10GC-MS, RI
40trans-Nerolidol15644.84 ± 0.0848.55 ± 0.08217.39 ± 0.03515.55 ± 0.039GC-MS, RI
41(-)-Spathulenol15720.25 ± 0.0061.06 ± 0.0351.31 ± 0.0151.13 ± 0.022GC-MS, RI
42Caryophyllene oxide15780.40 ± 0.401.26 ± 0.029GC-MS, RI
43(-)-Globulol15800.94 ± 0.0230.88 ± 0.0500.78 ± 0.39GC-MS, RI
44(-)-Epicedrol15850.70 ± 0.0240.65 ± 0.0191.14 ± 0.012GC-MS, RI
45Cedrol15891.40 ± 0.021GC-MS, RI
46Humulene epoxide II16060.22 ± 0.0070GC-MS, RI
47Junenol16180.35 ± 0.0120.24 ± 0.00GC-MS, RI
48Isospathulenol16300.29 ± 0.00600.31 ± 0.0090GC-MS, RI
49T-Muurolol16400.89 ± 0.0120.75 ± 0.0191.24 ± 0.0200.92 ± 0.028GC-MS, RI
50α-Cadinol16531.59 ± 0.0372.39 ± 0.0782.05 ± 0.0472.02 ± 0.027GC-MS, RI
51β-Sinensal16930.64 ± 0.035GC-MS, RI
52Mintsulfide17420.32 ± 0.010GC-MS, RI
53α-Sinensal17650.46 ± 0.0230.49 ± 0.015GC-MS, RI
54m-Camphorene19440.23 ± 0.023GC-MS, RI
55n-Hexadecanoic acid19593.06 ± 0.0414.81 ± 0.26GC-MS, RI
56Conjugated linoleic acid20600.56 ± 0.56GC-MS, RI
57Linoelaidic acid20651.04 ± 0.52GC-MS, RI
58Phytol21110.31 ± 0.0201.37 ± 0.050GC-MS, RI
59Linolenic acid21591.18 ± 0.0521.73 ± 0.024GC-MS, RI
6011,14-Eicosadienoic acid22501.84 ± 0.065GC-MS, RI
Total 89.6089.6788.9690.36
Data is expressed as mean ± SEM. RI, retention indices; GC-MS, gas chromatography–mass spectrometry; —, not detected.
Disclaimer/Publisher’s Note: The statements, opinions and data contained in all publications are solely those of the individual author(s) and contributor(s) and not of MDPI and/or the editor(s). MDPI and/or the editor(s) disclaim responsibility for any injury to people or property resulting from any ideas, methods, instructions or products referred to in the content.