Article

Fine-Mapping of a Red-Skinned Taproot Gene in Radish (Raphanus sativus L.)

1
College of Horticulture, Shanxi Agricultural University, Taiyuan 030031, China
2
College of Agronomy, Shanxi Agricultural University, Taiyuan 030031, China
*
Authors to whom correspondence should be addressed.
Plants 2025, 14(19), 3065; https://doi.org/10.3390/plants14193065
Submission received: 1 September 2025 / Revised: 1 October 2025 / Accepted: 2 October 2025 / Published: 3 October 2025
(This article belongs to the Special Issue Genetic Mapping of Agronomic Traits in Crops)

Abstract

The skin color of radish taproots is an important commodity character that directly affects the choice behavior of consumers. Here, we identified a skin color gene carried by a red-skinned inbred line, SXAU-R2. Genetic population was constructed by the crossing of SXAU-R2 and a white-skinned inbred line, SXAU-W2, and the taproots of F1 plants exhibited intermediate color. In the F2 population, the separation ratio of taproot skin color indicated that the phenotype was controlled by one major locus, named RST1 (Red-Skinned Taproot 1). Combined with bulked segregant analysis and RNA sequencing (BSA-seq), 2640 single nucleotide polymorphisms (SNPs) were detected between the annotated genes of the red skin bulk and white skin bulk. Molecular markers were developed in the SNP-enriched 27~32 Mbp region of chromosome 7, and then RST1 was mapped in the genetic interval between flanking markers SSR-14 and SSR-22. Using F2:3 lines derived from a key F2 heterozygote, RST1 was narrowed down into a 530 Kbp interval. There were 46 expressed annotated genes in the fine-mapping region, and a gene encoding MYB was selected as the candidate of RST1. Finally, based on Kyoto Encyclopedia of Genes and Genomes (KEGG) enrichment analysis and RT-qPCR, we identified the potential interacting genes RsbHLH and RsWD, as well as the latent target genes RsDFR and RsANS of RST1 in the anthocyanin synthesis pathway. These results provide an understanding of the genetic mechanisms regulating anthocyanin synthesis and offer an efficient molecular marker for the radish breeding of skin color.

1. Introduction

Radish (Raphanus sativus L., 2n = 2x = 18) is a typical annual or biennial cross-pollinated plant belonging to the Brassicaceae family. It is an important vegetable crop and widely planted in the world, especially in East Asia. Radish commonly accounts for 2% of the total global production of vegetables, and in 2021, the fresh-radish market was worth 1264 million USD [1]. The main edible part of the radish is the fleshy taproot, which is rich in nutrition, high yield, and conducive to storage. In addition to taproot, the leaf, silique, and seed oil of some radish germplasms are also used for food in some areas [2,3].
The taproot of radish displayed abundant diversity in color, shape, size, and flavor, of which the color of taproot skin is an important commodity character of radish that directly affects the choice behavior of consumers. After natural domestication and artificial selection, radish taproots showed different skin colors, including purple, red, pink, white, green, and even black as well as yellow. Among them, red/purple-, green-, and white-skinned radishes are the most common [4]. In a China-specific cultivar (cv.) Xinlimei, the skin color of its taproot is red during the early developmental period and gradually changes to green during maturation. By analyzing the transcriptome data of this process, it was found that the genes involved in anthocyanin biosynthesis were highly up-regulated in the red phase of taproot skin; at the stage when the skin fades red and turns green, anthocyanin-related genes were down-regulated while chlorophyll biosynthesis-related genes were significantly up-regulated [5]. Multiple similar studies confirmed that the skin color of red/purple radish and green radish is formed by the accumulation of anthocyanins and chlorophyll in epidermal cells, respectively [6,7,8].
Several loci for taproot skin color were further identified. Using bulked-segregant analysis (BSA) on an F2 population derived from the cross of two inbred lines, green-skinned G-2 and white-skinned W-1, GREEN-SKINNED TAPROOT 1 (GST1) was mapped in the 2.93~8.99 Mbp physical position on the terminal of the short arm of chromosome 1, and annotated genes related to chlorophyll synthesis within this region, such as RsDnaJ and RsPPR, were highly expressed in the green-skin bulk [9]. Moreover, the red/purple skin of the taproot is mainly regulated by MYB family genes. Lim et al. first isolated RsMYB1 (GenBank No. KR706195) from red-skinned radish, which is homologous with PRODUCTION OF ANTHOCYANIN PIGMENT 1 (AtPAP1) in Arabidopsis. RsMYB1 was characterized as a positive regulator to transcriptionally activate the anthocyanin biosynthetic machinery by itself in Arabidopsis and tobacco plants [10]. Based on the F2 population crossed by inbred lines CX16Q-25-2 (purple skin) and CX16Q-1-6-2 (white skin), a quantitative trait locus (QTL) for skin color was mapped in the position of 31.58~31.82 Mbp on chromosome 2, and RsMYB1.1 (gene ID: Rs094840) within this region was identified as the candidate gene [11]. Genome-wide association studies on two sets of radish germplasms also detected the QTLs for skin color on chromosome 2, and RsPAP2 [12] and RsMYB1.1 (gene ID: R2.009390) [13] were selected as the candidate genes, respectively. In addition, on chromosome 7, a skin color QTL was identified in the position of 8.47~12.37 Mbp by using progeny from self-pollination of a Chinese commercial hybrid cv. Lian Yan No. 1 (red skin), and then RsMYB1 (gene ID: Rs388430) in the region was used as the candidate gene [14]. Furthermore, in the F2 populations of NAU-YH (red skin) × NAU-LB (white skin), YAAS-RR1 (red skin) × YAAS-WR1 (white skin), and JH6B (red skin) × Minowsh (white skin), skin color QTLs on chromosome 7 were detected, harboring the candidate genes RsMYB90, RsMYB1.3, and RsMYB2, respectively [15,16,17].
SXAU-R2 is a typical red-skinned radish germplasm collected and purified by the Radish Germplasm Resources Innovation and Genetic Breeding Research Group of the College of Horticulture, Shanxi Agricultural University. It is a stable inbred line originated from the Chinese landrace Dahongpao after five generations of self-fertilization. To identify the genetic loci controlling red skin, in this study, a genetic population was constructed using SXAU-R2 and a white-skinned radish, SXAU-W2. Combined with BSA and RNA sequencing (BSA-seq), the gene controlling red skin, RED-SKINNED TAPROOT 1 (RST1), was fine-mapped. These results are beneficial for a deeper understanding of the color mechanism of taproot red skin and provide new molecular markers for quality breeding in radish.

2. Results

2.1. Genetic Dissection of Radish Skin Color

The taproots of radish inbred line SXAU-R2 are spherical and red-skinned (Figure 1a), while those of inbred line SXAU-W2 are cylindrical and white-skinned (Figure 1b). The hybrid F1 plants of parents SXAU-R2 and SXAU-W2 displayed an intermediate phenotype of root skin color, with red near the leaves and white at the bottom (Figure 1c). In the SXAU-R2 × SXAU-W2 F2 population, three types of root skin color were separated, including red, intermediate color, and white (Figure 1d). The statistical results showed that there were 67 red-skinned individuals, 136 intermediate-skinned individuals, and 70 white-skinned individuals (Figure 2a), with a ratio roughly in line with 1:2:1 (χ2 = 0.97, p > 0.05), indicating that the root skin color was controlled by one major locus, which is temporarily named RST1 (Red-Skinned Taproot 1).

2.2. Distribution of Bulk-Polymorphic SNPs

Using 20 red-skinned and 20 white-skinned individuals of the SXAU-R2 × SXAU-W2 F2 population, the red-skin bulk and white-skin bulk were constructed for BSA-seq, respectively. Each bulk obtained clean data above 20 Mb with Q30-based percentages greater than 93.93% and GC percentages ranging from 47.74 to 48.01% (Table S1), indicating that the sequencing data was of high quality for further analysis. The clean reads were then mapped on the radish reference genome (R. sativus var. radicula) and covered all the nine chromosomes of radish (Figure 3). Subsequently, the uni-transcripts were annotated as genes.
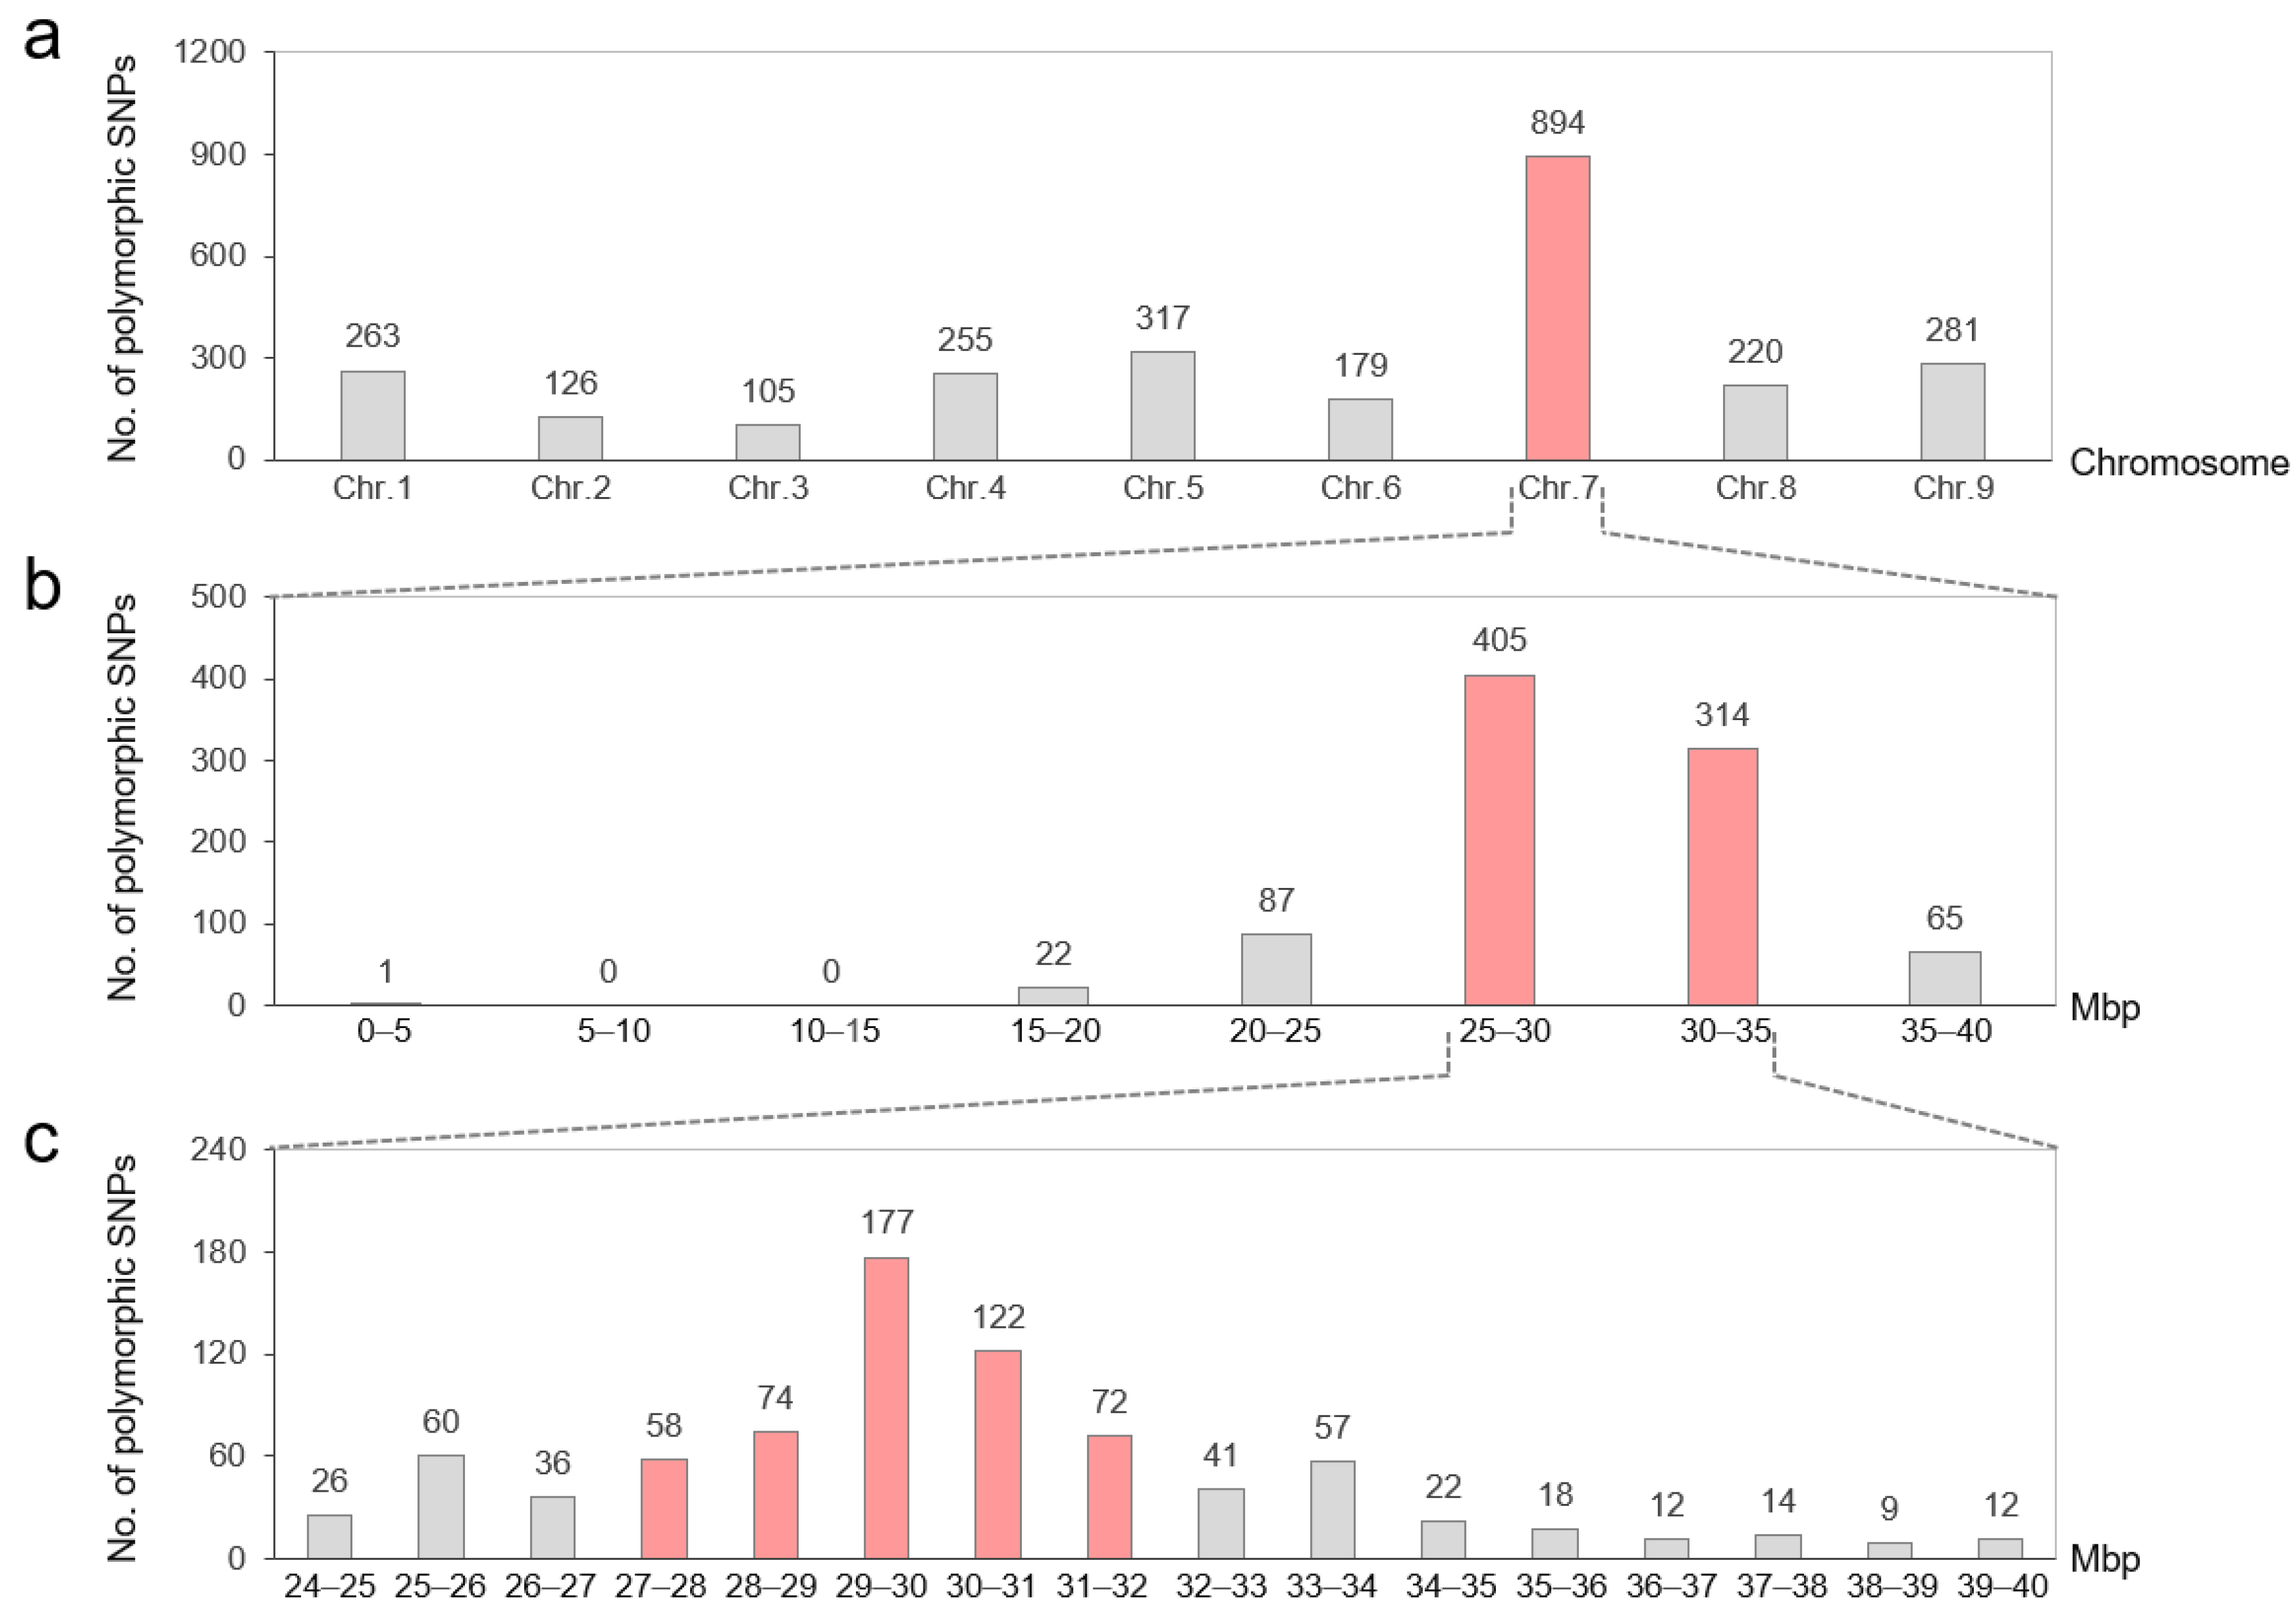
Based on sequence alignment, 2640 SNPs were detected between annotated genes in the red skin bulk and white skin bulk, with the distribution numbers on chromosomes 1 to 9 being 263, 126, 105, 255, 317, 179, 894, 220, and 281, respectively (Figure 4a, Table S2). Among them, the most SNPs were found on chromosome 7 (33.86%), mainly concentrated in the physical position of 27~32 Mbp (Figure 4b,c), indicating that GST1 is probably located on chromosome 7. It is worth noting that the SNPs were also widely distributed on other chromosomes, ranging in number from 105 to 317, which may be due to high background noise caused by the small bulk size.

2.3. Initial Mapping of RST1

Based on simple sequence repeat (SSR) loci in the SNP-enriched 27~32 Mbp region of chromosome 7, in total 30 molecular markers (SSR1~SSR30) were randomly developed and used to amplify parents SXAU-R2 and SXAU-W2. Then, six parental polymorphic markers, including SSR-4, SSR-9, SSR-11, SSR-14, SSR-22, and SSR-24, were selected to amplify the F2 population. Combined with phenotypes of root skin color, RST1 was mapped between SSR14 and SSR22, with genetic distances of 3.2 cM and 2.1 cM, respectively, corresponding to the physical position of 29.70~31.64 Mbp on chromosome 7 (Figure 5a).

2.4. Fine-Mapping of RST1

One key heterozygous F2 individual, #21, was selected for fine-mapping (Figure 1d). The F2-21 plant harvested a total of 923 seeds, and 400 seeds were randomly selected for planting and generating F2:3 plants. Results of phenotype identification showed that the number of F2:3 plants with red-skinned, intermediate-skinned, and white-skinned roots were 91, 221, and 88, respectively, roughly in a 1:2:1 ratio (χ2 = 0.11, p > 0.05) (Figure 2b), once again confirming that the root skin color is controlled by the major gene RST1. Twenty SSR markers, SSR31~SSR50, were further developed in the initial mapping region of RST1 (29.70–31.64 Mbp), of which three markers showed parental polymorphism and were then used to amplify the F2:3 plants deriving from F2-21. Luckily, new genetic exchange events were detected in two plants, F2:3-18 and F2:3-233, narrowing down RST1 into the physical position of 30.54~31.07 Mbp between markers SSR39 and SSR50 (Figure 5b).

2.5. Determination of Candidate Gene

There were 67 annotated genes within the fine-mapped region of RST1, only 46 of which were expressed in the root epidermis, according to the BSA-seq results. Based on expression patterns, these 46 expressed genes were divided into two categories: 11 genes up-regulated in the white skin bulk and 35 genes up-regulated in the red skin bulk (Figure 5c). Among them, three genes were significantly upregulated in the red skin bulk (|log2FoldChange| ≥ 1 and FDR ≤ 0.01), including Rs0R7c036674, Rs0R7c036685, and Rs0R7c036711, which encoded E3 ubiquitin protein ligase, alcohol dehydrogenase class-P, and MYB transcription factor, respectively (Table S3).
As several R2R3-type MYBs characterized by N-terminal R2 and R3 DNA-binding domains have been reported to regulate pigment synthesis in plants [18], Rs0R7c036711 was selected as the candidate gene of RST1. We developed a diagnostic marker for Rs0R7c036711, which had amplification product in the red-skinned parent but no amplification product in the white-skinned parent (Figure 5d). The genotyping results in the F2 population showed that the individuals with the SXAU-R2 allele all exhibited red-skinned or intermediate-skinned roots, while the individuals with the SXAU-W2 allele basically displayed white-skinned roots (97.22%) (Figure 5e), indicating that this marker is co-segregated with the skin color phenotype and confirming that Rs0R7c036711 is the causing gene.

2.6. Expression Patterns of Genes Involving Anthocyanin Synthesis

To speculate on the possible regulatory mechanism of RST1 on skin color, we conducted Kyoto Encyclopedia of Genes and Genomes (KEGG) enrichment analysis on differentially expressed genes (DEGs) between the red skin bulk and white skin bulk. The results showed that three of the top 10 KEGG terms were related to anthocyanin synthesis, namely flavone and flavonol biosynthesis (ko00944), flavonoid biosynthesis (ko00941), and isoflavonoid biosynthesis (ko00943) (Figure 6a, Table S4). Therefore, we inferred that RST1 was involved in regulating the process of flavonoid synthesis.
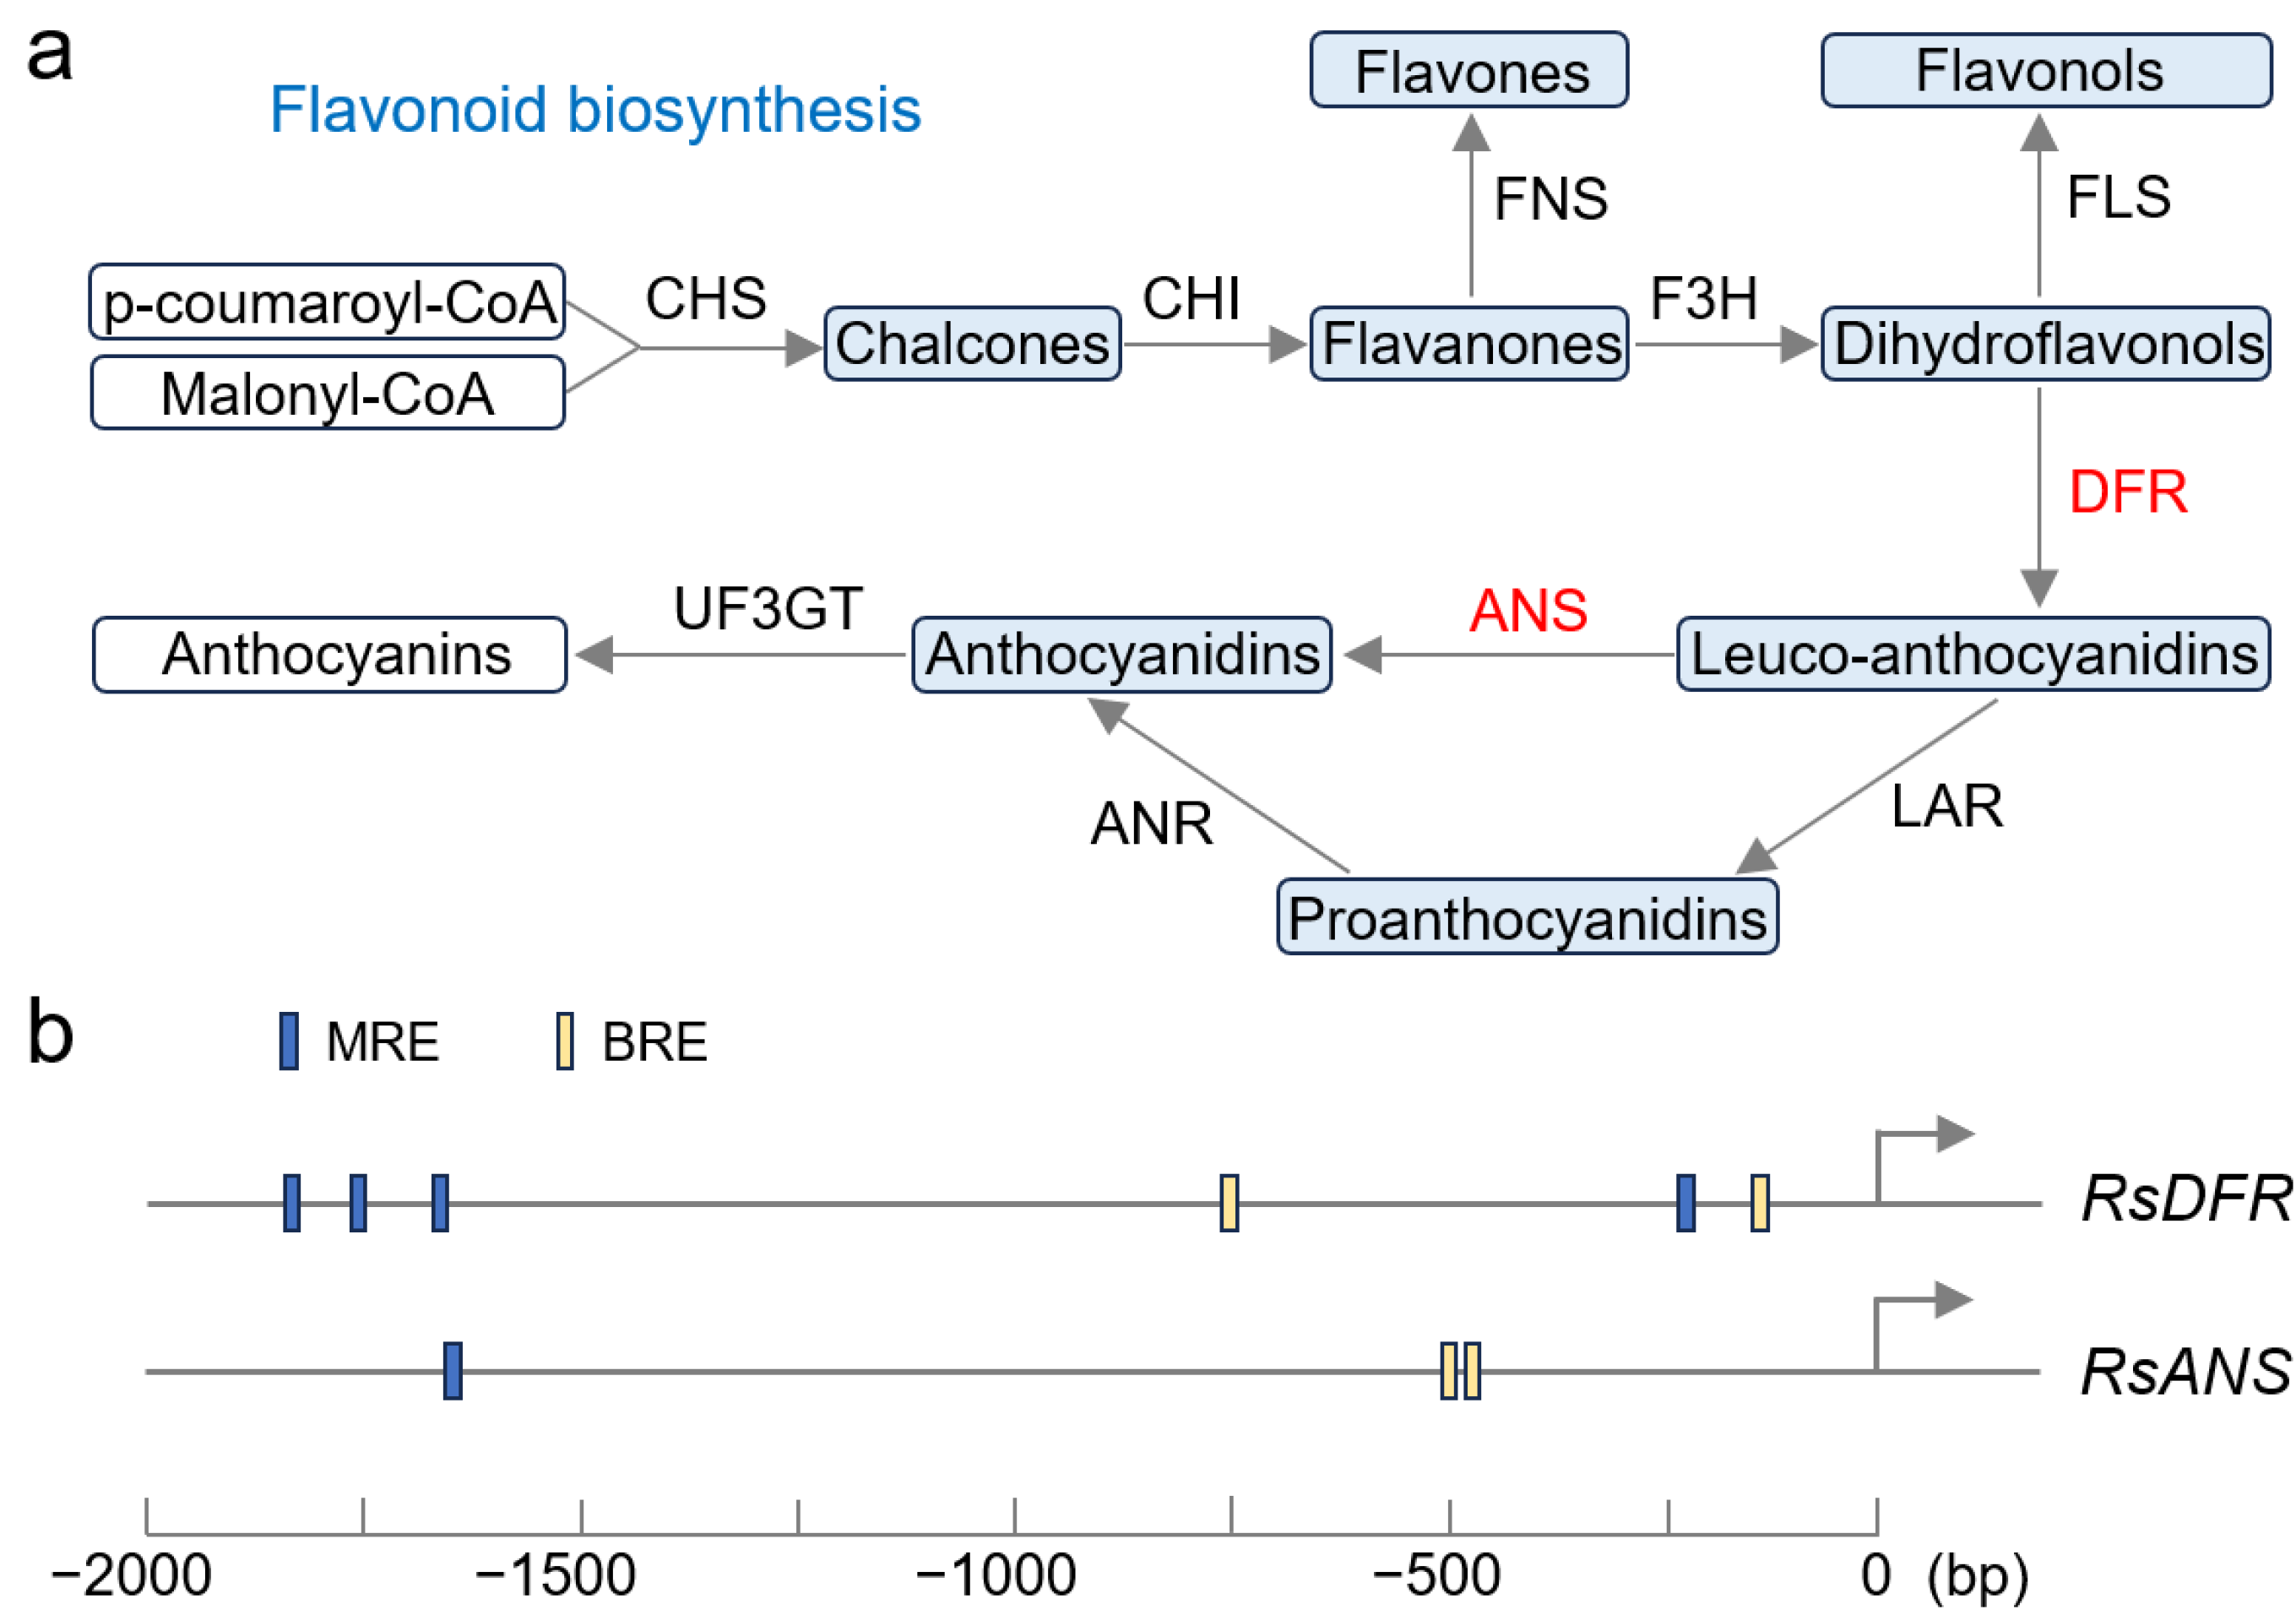
From the BSA-seq data, we isolated the BASIC HELIX-LOOP-HELIX gene RsbHLH (Rs0R9c043795) and the WD40 REPEAT gene RsWDR (Rs0R6c033946), as well as genes encoding for key enzymes in the anthocyanin synthesis pathway, including CHALCONE SYNTHASE (RsCHS), CHALCONE ISOMERASE (RsCHI), FLAVANONE 3-HYDROXYLASE (RsF3H), DIHYDROflAVONOL-4-REDUCTASE (RsDFR), and ANTHOCYANIDIN SYNTHASE (RsANS). RT-qPCR results showed that the expression levels of RST1, RsbHLH, and RsWDR were significantly higher in the red skin bulk than in the white skin bulk (Figure 6b). Moreover, RsDFR and RsANS were also highly expressed in the red skin bulk, suggesting that RST1 may co-regulate the transcription of RsDFR and RsANS with RsbHLH and RsWDR (Figure 6b).

3. Discussion

3.1. RST1 Can Be Used for the Radish Breeding of Skin Color

Radish is an important root vegetable grown and consumed throughout the world. With the improvement of people’s consumption level, red/purple radishes have become increasingly popular due to their enriched glucosinolates and anthocyanins [19]. As a meaningful flavonoid compound, anthocyanins possess potent antioxidant capacity that is beneficial for health, including protecting against diabetes and cardiovascular diseases [20]. Moreover, anthocyanins play key roles in plants for attracting pollinators and seed dispersers, as well as protecting high light stress and pathogen attack [21]. Therefore, breeding radish cultivars with red/purple skin has become an objective with market value. Marker-assisted selection (MAS) can greatly accelerate the breeding process. In the past decade, several radish genetic maps have been developed based on traditional molecular markers [22,23,24]. However, these maps with low-density markers are still not effective for fine mapping of genes or QTLs. The insufficiency of effective markers that are closely linked with target genes limited the application of MAS in radish breeding. Recently, some costly biological techniques, such as whole-genome sequencing (WG-seq), or specific-locus amplified fragment sequencing (SLAF-seq) have been used to construct the high-density genetic maps of radish [15,16]. In our study, using the low-cost but high-accuracy BSA-seq, RST1 was successfully fine-mapped in a 530 Kbp interval. Due to the presence of a highly probable candidate gene, MYB, within this region, further high-resolution mapping was not performed. Finally, a functional marker of RST1 was developed and co-separated with the phenotype, providing an efficient molecular marker for the radish breeding of skin color. The enrichment of anthocyanins in taproot epidermis can enhance the tolerance of radish to pathogens or abiotic stresses and contribute to sustainable agricultural production.

3.2. RST1 Participates in Regulating Anthocyanin Synthesis

We identified an MYB gene as the candidate for RST1. In Arabidopsis, MYB can bind with bHLH transcription factor and WDR protein to form a MYB-bHLH-WDR (MBW) complex that regulates anthocyanin synthesis [25]. Among them, MYB was the core of the complex and was responsible for recognizing and binding to the specific site of the target gene promoter; bHLH showed a weak ability to bind to DNA, but it strongly combined with MYB and helped the complex to recruit other regulatory factors, while WDR acted as a scaffold to stabilize the whole ternary complex [25,26,27]. In this study, the expression levels of RST1, RsbHLH, and RsWDR, as well as RsDFR and RsANS in the red skin bulk, were significantly higher than those in the white skin bulk, suggesting that the RST1-RsbHLH-RsWDR complex may regulate the reaction steps from dihydroflavonols to anthocyanidins in the anthocyanin synthesis pathway (Figure 7a) [28]. MYB and bHLH of the complex could recognize and bind specific elements in the promoter region of DFR and ANS [12,29]. These reported binding sites were also identified in the promoter of RsDFR (Rs0R9c041942) and RsANS (Rs0R4c020786) in our study (Figure 7b), and we will verify them through electrophoretic mobility shift assays or luciferase assays in the future.

3.3. Relationship Between RST1 and Anthocyanin-Related MYBs

At present, several MYB genes controlling red or purple radish root skin have been identified based on numerous versions of the radish genome [30,31,32]. Compared with the above research, we further revealed that MYB may control red color by regulating the transcription levels of anthocyanin pathway genes RsDFR and RsANS. However, due to the lack of a well-established genetic transformation system in radishes, we were still unable to perform functional validation experiments on RST1. In addition, the relationship between these MYBs is not clear due to the differences in reference genome and naming methods. Some genes are different but share one name, such as RsMYB1 (Rsa10034073) [14] and RsMYB1 (Rsa10033919) [17], while some genes are the same sequence but with different names, such as RsMYB90 (Rs388430) [15] and RsMYB1a (Rs388430) [33]. Therefore, we constructed a phylogenetic tree for the published MYB genes controlling root skin color in radish and several MYB genes involved in anthocyanin synthesis in other species (Figure 8). The results showed that RST1 was the same gene as RsMYB1 carried by red-skinned cv. Lian Yan No.1 [14] and RsMYB90 carried by red-skinned inbred line NAU-YH [15]. Moreover, three genes named RaMYB1 that were detected in different red-fleshed radish germplasm, including RsMYB1 (KR706195) [34], RsMYB1 (AKM95888) [10], and RsMYB1 (Rsa10033919) [17], shared the same gene sequence. In addition, MYBs from Brassicaceae, such as radish MYBs, Arabidopsis MYBs, and a Chinese cabbage MYB [35], were clustered into one group; MYBs from Rosaceae, including MdMYB10 from apple and PyMYB10 from pear, were clustered into the second group; while MYBs in gramineous crops (wheat, maize, and rice) from Poaceae were clustered into another group. Overall, MYBs from dicots and MYBs from monocots did not cluster into one group, suggesting that the MYB family differentiated at least after the divergence of monocots and dicots (~130 MYA) [36].

4. Material and Methods

4.1. Plant Materials

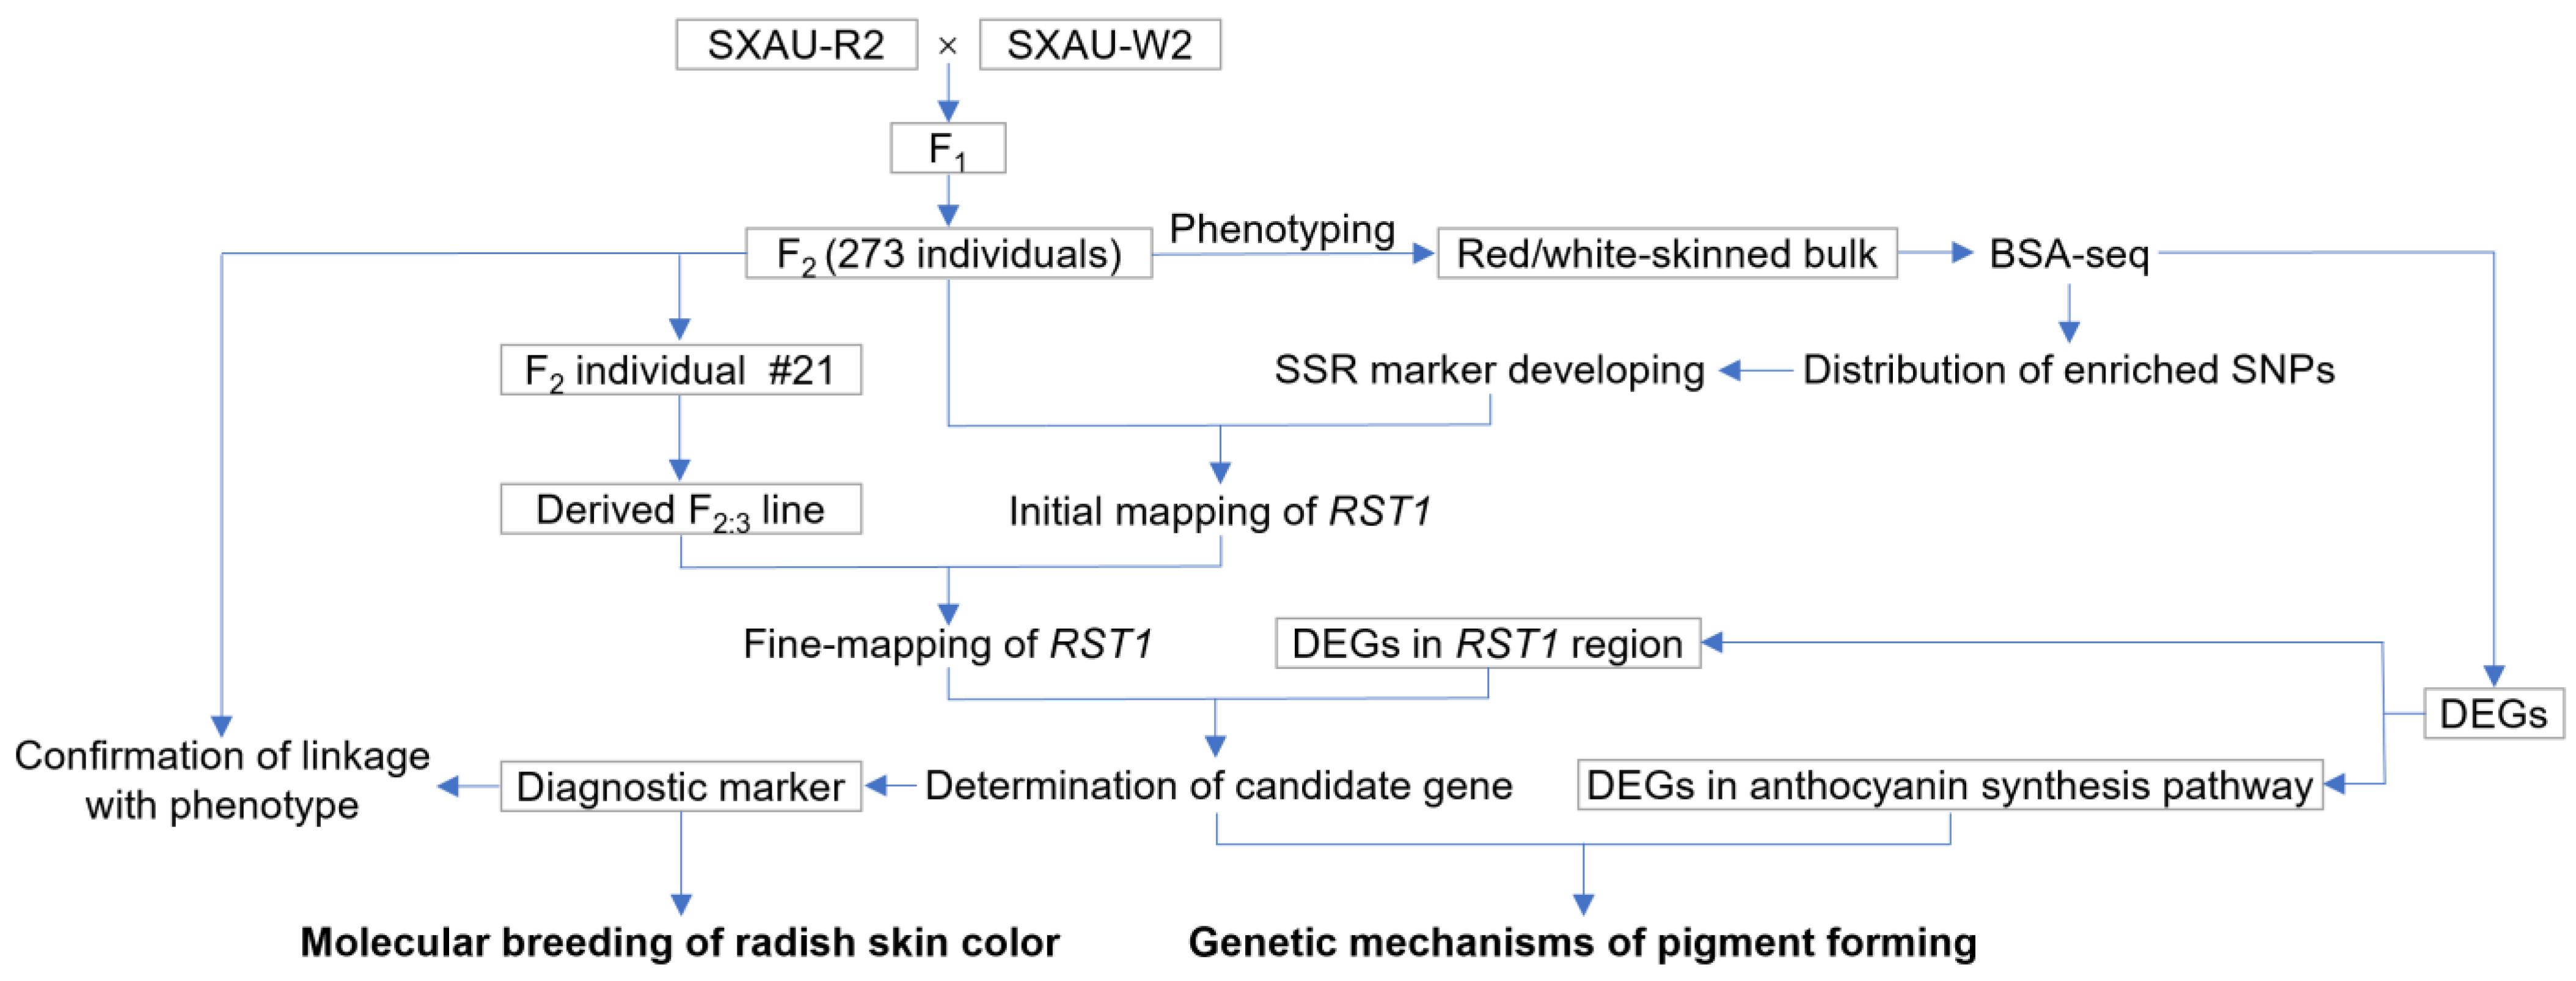
The red-skinned radish SXAU-R2 is an inbred line that originated from the landrace Dahongpao after five generations of self-fertilization, and SXAU-W2 is a white-skinned inbred line selected from the hybrid progeny of landraces Zhentoubai and Shibai, with the characteristics of heat tolerance, disease resistance, and great adaptability. The biparental populations of SXAU-R2 and SXAU-W2, including the F1 heterozygote, F2 plants with 273 individuals, and F2:3 families derived from certain F2 plants, were used to identify the red-skinned taproot gene carried by SXAU-R2. The above materials were collected and preserved by the Radish Germplasm Resources Innovation and Genetic Breeding Research Group of the College of Horticulture, Shanxi Agricultural University. The experiments conducted on these materials in this study are shown in Figure 9.

4.2. Experimental Conditions and Phenotyping

Seeds were sown in 72-cell plug trays and germinated in a growth chamber set at 22 °C under a 16 h light/8 h dark cycle and 60% humidity. After 1 week of germination, seedlings were transferred to the ridges of hilled rows (0.2 m width and 0.3 m height; 0.3 m separation of rows and columns) of a 2 m × 20 m plot in the experimental field of Shanxi Agricultural University (37°33′ N, 112°40′ E, Jinzhong, Shanxi, China). During the late stage of taproot enlargement (about 75 days after planting), the skin color was investigated visually and recorded as A for red, B for white, and M for intermediate color, based on the parental phenotypes. After phenotyping, genomic DNA was extracted from the tender leaf of each plant using the CTAB method [37].

4.3. BSA-Seq

According to the identification results for skin color of the SXAU-R2 × SXAU-W2 F2 population, 20 red-skinned individuals were selected, and the taproot epidermis of each individual was sampled and then mixed with equal mass to form a red skin bulk. Using the same method, 20 white-skinned individuals were selected to construct the white skin bulk. These two sample bulks were used to extract total RNA by TRIzol reagent (Invitrogen, Carlsbad, CA, USA) and then construct cDNA libraries using the TruSeq RNA Sample Preparation Kit v2 (Illumina, San Diego, CA, USA) for sequencing on the Illumina NovaSeq6000 platform (Biomarker Tech., Beijing, China). Clean reads were obtained by removing low-quality reads containing adapters and poly-N (>10%) or with a quality score < 30 from the raw data and then mapping them to the radish reference genome (R. sativus var. radicula) that downloaded from the China National Genomics Data Center (NGDC) database with accession number GWHANWP00000000 (https://ngdc.cncb.ac.cn/, accessed on 20 May 2024).

4.4. Development of PCR-Based Markers

Through comparing the assembled gene sequences from the red- and white-skin bulks on the BioMarker Cloud Server (https://international.biocloud.net/, accessed on 1 June 2024), SNPs with information on chromosomal position between bulks were obtained. Next, sequences of genomic segments with high SNP distribution frequency were extracted from the radish reference genome mentioned above and then used for primer design. Briefly, the genome sequence was input into the SSRHunter software (version 1.3) to search for SSR sites, setting the parameters as follows: the nucleotides per repeat unit were two to five, and the repeat times were ≥5. Then, the eligible SSR loci within the target sequence were obtained. In the upstream and downstream 150 bp sequences of each locus, forward and reverse primers were designed, respectively, with the following criteria: primer length = 20 ± 2 bp, theoretical product size < 200 bp, and the annealing temperature difference between the forward and reverse primers was less than 2 °C (Table S5). Polymorphic SSR markers were subsequently screened by genomic DNA of parents SXAU-R2 and SXAU-W2. The amplification condition was as follows: 94 °C for 30 s, 36 cycles of 94 °C for 30 s, 58 °C for 30 s, and then 72 °C for 30 s, with a final extension of 72 °C for 5 min. Polyacrylamide gel electrophoresis was used for differentiating the PCR products. In addition, a diagnostic marker was developed for distinguishing the allelic variations in the causing gene of RST1 using agarose gel electrophoresis.

4.5. Mapping and Fine Mapping

Briefly, the parental polymorphic SSR markers were used to amplify the genomic DNA of the SXAU-R2 × SXAU-W2 F2 population. The genotypes, together with the phenotypic data of skin color, were imported into Joinmap software (version 4.0) to calculate the genetic distances between markers and the target gene by using the Kosambi function so as to complete the preliminary mapping of RST. For the next fine mapping, the heterozygous F2 individuals were selected by flanking markers of RST, and their seeds were planted to obtain the corresponding F2:3 plants. Markers in the initial RST section were continuously developed for amplifying the F2:3 plants to obtain new genetic exchange events. Combined with the skin color of F2:3 plants, the RST section was narrowed down.

4.6. Transcription Levels of Annotated Genes

Referring to the previous method [38], the transcript level of each gene from the BSA-seq data was measured with fragments per kilobase of exon model per million mapped fragments (FPKM) values calculated from the following formula: FPKM = cDNA Fragments/Mapped Fragments (Millions) × Transcript Length (kb), where “cDNA Fragments” represents the number of fragments mapped to a certain transcript, “Mapped Fragments (Millions)” represents the total number of fragments mapped to the transcript, measured in units of 106, and “Transcript Length (kb)” represents the length of the certain transcript, measured in units of 103 bases. Differentially expressed genes (DEGs) analysis between red skin bulk and white skin bulk was performed using the DESeq package (version 2.0), with a threshold of |log2FoldChange| ≥ 1 and FDR ≤ 0.01. The DEGs were then used for the enrichment analysis of Kyoto Encyclopedia of Genes and Genomes (KEGG). Moreover, the expression levels of annotated genes within the RST section in the two bulks were visualized in a heatmap based on their FPKM data using MeV software (version 4.9).

4.7. RT-qPCR

The genes encoding key enzymes in the anthocyanin biosynthesis pathway were selected from the BSA-seq data and used to identify the expression levels. As described previously [39], the backup total RNA for BSA-seq was reverse-transcribed into cDNA using a reverse transcription kit (Takara Bio, Shiga, Japan). RT-qPCR was performed on the QuantStudio 3 Real-time PCR System (Applied Biosystems, Carlsbad, CA, USA) utilizing Premix Ex Taq II enzyme (Takara Bio, Shiga, Japan) and specific primer pairs for the anthocyanin biosynthesis-related genes (Table S5), and the radish GADPH gene was used as the internal reference gene. Each reaction was repeated three times, and the results were analyzed using the 2−∆CT method, wherein the ∆CT was calculated using the following formula: ∆CT = CT (target gene) − CT (reference gene).

4.8. Statistical Analysis

The Origin (version 3.1) software was used to perform the statistical analysis by one-way analysis of variance (ANOVA), and p < 0.05 was considered a significant difference, while p < 0.01 was considered an extremely significant difference.

5. Conclusions

The red-skinned radish inbred line SXAU-R2 carried a major skin color gene, RST1, which was fine-mapped in the physical position of 30.54~31.07 Mbp on chromosome 7. Within the target region, a MYB transcription factor-encoding gene was selected as the candidate gene of RST1, and its functional marker was developed. Finally, the potential interacting genes and the latent target genes of RST1 were identified. Our results provide a better understanding of the color mechanism of taproot red skin and offer an efficient molecular marker for quality breeding in radish.

Supplementary Materials

The following supporting information can be downloaded at: https://www.mdpi.com/article/10.3390/plants14193065/s1, Table S1: Summary of BSA-seq results; Table S2: 2640 SNPs between annotated genes in the red skin bulk and white skin bulk; Table S3: 67 annotated genes within the fine-mapped region of RST1; Table S4: Results of KEGG enrichment analysis on DEGs between the red skin bulk and white skin bulk; Table S5: Primers used in this study.

Author Contributions

Conceptualization, G.L.; formal analysis, Z.L. (Zhao Liu); methodology, Z.L. (Zhenzhen Li); software, L.Q.; validation, Z.L. (Zhao Liu); investigation, Z.L. (Zhao Liu); resources, Z.L. (Zhao Liu); data curation, L.Q.; writing—original draft preparation, L.Q. and Z.L. (Zhao Liu); writing—review and editing, G.L.; project administration, G.L. All authors have read and agreed to the published version of the manuscript.

Funding

This work was supported by the Taiyuan Comprehensive Experimental Station of the National Bulk Vegetable Industry Technology System (Grant No. CARS-23-G09), the Biological Breeding Project of Shanxi Agricultural University (YZGC119), the Key Research and Development Projects in Shanxi Province (No. 202202140601005), and the Shanxi Agricultural University science and technology innovation project (CXGC2025086).

Data Availability Statement

Data are contained within the article and Supplementary Materials.

Conflicts of Interest

The authors declare no conflicts of interest.

References

  1. Singh, B.K. Radish (Raphanus sativus L.): Breeding for Higher Yield, Better Quality and Wider Adaptability. In Advances in Plant Breeding Strategies: Vegetable Crops; Al-Khayri, J.M., Jain, S.M., Johnson, D.V., Eds.; Springer: Cham, Switzerland, 2021; pp. 275–304. [Google Scholar]
  2. Yamagishi, H.; Terachi, T. Multiple origins of cultivated radishes as evidenced by a comparison of the structural variations in mitochondrial DNA of Raphanus. Genome 2003, 46, 89–94. [Google Scholar] [CrossRef] [PubMed]
  3. Kobayashi, H.; Shirasawa, K.; Fukino, N.; Hirakawa, H.; Akanuma, T.; Kitashiba, H. Identification of genome-wide SNPs among geographically diverse radish accessions. DNA Res. 2020, 27, dsaa001. [Google Scholar] [CrossRef]
  4. Zhang, J.; Qiu, X.; Tan, Q.; Xiao, Q.; Mei, S. A Comparative Metabolomics Study of Flavonoids in Radish with Different Skin and Flesh Colors (Raphanus sativus L.). J. Agric. Food Chem. 2020, 68, 14463–14470. [Google Scholar] [CrossRef] [PubMed]
  5. Liu, T.; Zhang, Y.; Zhang, X.; Sun, Y.; Wang, H.; Song, J.; Li, X. Transcriptome analyses reveal key genes involved in skin color changes of ‘Xinlimei’ radish taproot. Plant Physiol. Biochem. 2019, 139, 528–539. [Google Scholar] [CrossRef]
  6. Chen, F.B.; Xing, C.Y.; Huo, S.P.; Cao, C.L.; Yao, Q.L.; Fang, P. Red Pigment Content and Expression of Genes Related to Anthocyanin Biosynthesis in Radishes (Raphanus sativus L.) with Different Colored Flesh. J. Agric. Sci. 2016, 8, 126–135. [Google Scholar] [CrossRef]
  7. Yu, R.; Du, X.; Li, J.; Liu, L.; Hu, C.; Yan, X.; Xia, Y.; Xu, H. Identification and differential expression analysis of anthocyanin biosynthetic genes in root-skin color variants of radish (Raphanus sativus L.). Genes Genom. 2020, 42, 413–424. [Google Scholar] [CrossRef]
  8. Zhang, J.; Zhao, J.; Tan, Q.; Qiu, X.; Mei, S. Comparative transcriptome analysis reveals key genes associated with pigmentation in radish (Raphanus sativus L.) skin and flesh. Sci. Rep. 2021, 11, 11434. [Google Scholar] [CrossRef]
  9. Liu, Z.; Qiao, N.; Lei, Y.; Zhang, X.; Li, Z.; Wang, S.; Qiao, L. Genetic Mapping of a Novel Gene GST1 for Green-Skinned Taproot in Radish (Raphanus sativus L.). J. Nucl. Agric. Sci. 2024, 38, 2066–2073. [Google Scholar]
  10. Lim, S.H.; Song, J.H.; Kim, D.H.; Kim, J.K.; Lee, J.Y.; Kim, Y.M.; Ha, S.H. Activation of Anthocyanin Biosynthesis by Expression of the Radish R2R3-MYB Transcription Factor Gene RsMYB1. Plant Cell Rep. 2016, 35, 641–653. [Google Scholar] [CrossRef] [PubMed]
  11. Liu, T.; Wang, J.; Wu, C.; Zhang, Y.; Zhang, X.; Li, X.; Wang, H.; Song, J.; Li, X. Combined QTL-Seq and Traditional Linkage Analysis to Identify Candidate Genes for Purple Skin of Radish Fleshy Taproots. Front. Genet. 2019, 10, 808. [Google Scholar] [CrossRef]
  12. Fan, L.; Wang, Y.; Xu, L.; Tang, M.; Zhang, X.; Ying, J.; Li, C.; Dong, J.; Liu, L. A Genome-wide Association Study Uncovers a Critical Role of the RsPAP2 Gene in Red-Skinned Raphanus sativus L. Hortic. Res. 2020, 7, 164. [Google Scholar]
  13. Kim, J.; Jang, H.; Huh, S.M.; Cho, A.; Yim, B.; Jeong, S.H.; Kim, H.; Yu, H.J.; Mun, J.H. Effect of Structural Variation in the Promoter Region of RsMYB1.1 on the Skin Color of Radish Taproot. Front. Plant Sci. 2024, 14, 1327009. [Google Scholar] [CrossRef]
  14. Yi, G.; Kim, J.S.; Park, J.E.; Shin, H.; Yu, S.H.; Park, S.; Huh, J.H. MYB1 Transcription Factor Is a Candidate Responsible for Red Root Skin in Radish (Raphanus sativus L.). PLoS ONE 2018, 13, e0204241. [Google Scholar] [CrossRef]
  15. Luo, X.; Xu, L.; Wang, Y.; Dong, J.; Chen, Y.; Tang, M.; Fan, L.; Zhu, Y.; Liu, L. An Ultra-high-density Genetic Map Provides Insights into Genome Synteny, Recombination Landscape and Taproot Skin Colour in Radish (Raphanus sativus L.). Plant Biotechnol. J. 2020, 18, 274–286. [Google Scholar] [CrossRef] [PubMed]
  16. Tao, J.; Li, S.; Wang, Q.; Yuan, Y.; Ma, J.; Xu, M.; Yang, Y.; Zhang, C.; Chen, L.; Sun, Y. Construction of a High-Density Genetic Map Based on Specific-Locus Amplified Fragment Sequencing and Identification of Loci Controlling Anthocyanin Pigmentation in Yunnan Red Radish. Hortic. Res. 2022, 9, uhab031. [Google Scholar] [CrossRef]
  17. Wang, Q.; Wang, Y.; Wu, X.; Shi, W.; Chen, N.; Pang, Y.; Zhang, L. Sequence and Epigenetic Variations of R2R3-MYB Transcription Factors Determine the Diversity of Taproot Skin and Flesh Colors in Different Cultivated Types of Radish (Raphanus sativus L.). Theor. Appl. Genet. 2024, 137, 33. [Google Scholar] [CrossRef] [PubMed]
  18. Karppinen, K.; Lafferty, D.J.; Albert, N.W.; Mikkola, N.; McGhie, T.; Allan, A.C.; Afzal, B.M.; Häggman, H.; Espley, R.V.; Jaakola, L. MYBA and MYBPA Transcription Factors Co-Regulate Anthocyanin Biosynthesis in Blue-Coloured Berries. New Phytol. 2021, 232, 1350–1367. [Google Scholar] [CrossRef] [PubMed]
  19. Park, N.I.; Xu, H.; Li, X.; Jang, I.H.; Park, S.; Ahn, G.H.; Lim, Y.P.; Kim, S.J.; Park, S.U. Anthocyanin Accumulation and Expression of Anthocyanin Biosynthetic Genes in Radish (Raphanus sativus). J. Agric. Food Chem. 2011, 59, 6034–6039. [Google Scholar] [CrossRef]
  20. Gonçalves, A.C.; Nunes, A.R.; Falcão, A.; Alves, G.; Silva, L.R. Dietary Effects of Anthocyanins in Human Health: A Comprehensive Review. Pharmaceuticals 2021, 14, 690. [Google Scholar] [CrossRef]
  21. Cappellini, F.; Marinelli, A.; Toccaceli, M.; Tonelli, C.; Petroni, K. Anthocyanins: From Mechanisms of Regulation in Plants to Health Benefits in Foods. Front. Plant Sci. 2021, 12, 748049. [Google Scholar] [CrossRef]
  22. Budahn, H.; Peterka, H.; Mousa, M.A.A.; Ding, Y.H.; Zhang, S.S.; Li, J.B. Molecular Mapping in Oil Radish (Raphanus sativus L.) and QTL Analysis of Resistance Against Beet Cyst Nematode (Heterodera schachtii). Theor. Appl. Genet. 2009, 118, 775–782. [Google Scholar] [CrossRef] [PubMed]
  23. Xu, L.; Wang, L.J.; Gong, Y.Q.; Dai, W.H.; Wang, Y.; Zhu, X.W.; Wen, T.C.; Liu, L. Genetic Linkage Map Construction and QTL Mapping of Cadmium Accumulation in Radish (Raphanus sativus L.). Theor. Appl. Genet. 2012, 125, 659–670. [Google Scholar] [CrossRef]
  24. Yu, X.N.; Choi, S.R.; Dhandapani, V.; Rameneni, J.J.; Li, X.N.; Pang, W.X.; Lee, J.Y.; Lim, Y.P. Quantitative Trait Loci for Morphological Traits and Their Association with Functional Genes in Raphanus sativus. Front. Plant Sci. 2016, 7, 255. [Google Scholar] [CrossRef]
  25. Xu, W.; Dubos, C.; Lepiniec, L. Transcriptional Control of Flavonoid Biosynthesis by MYB–bHLH–WDR Complexes. Trends Plant Sci. 2015, 20, 176–185. [Google Scholar] [CrossRef]
  26. Pan, J.; Zhou, X.; Ahmad, N.; Zhang, K.; Tang, R.; Zhao, H.; Jiang, J.; Tian, M.; Li, C.; Li, A.; et al. BSA-Seq and Genetic Mapping Identified Candidate Genes for Branching Habit in Peanut. Theor. Appl. Genet. 2022, 135, 4457–4468. [Google Scholar] [CrossRef]
  27. Ahmad, N.; Zhang, K.; Ma, J.; Yuan, M.; Zhao, S.; Wang, M.; Deng, L.; Ren, L.; Gangurde, S.S.; Pan, J.; et al. Transcriptional Networks Orchestrating Red and Pink Testa Color in Peanut. BMC Plant Biol. 2023, 23, 44. [Google Scholar] [CrossRef]
  28. LaFountain, A.M.; Yuan, Y.W. Repressors of Anthocyanin Biosynthesis. New Phytol. 2021, 231, 933–949. [Google Scholar] [CrossRef]
  29. Zhu, Z.; Wang, H.; Wang, Y.; Guan, S.; Wang, F.; Tang, J.; Zhang, R.; Xie, L.; Lu, Y. Characterization of the cis Elements in the proximal promoter regions of the Anthocyanin Pathway Genes Reveals a Common Regulatory Logic That Governs Pathway Regulation. J. Exp. Bot. 2015, 66, 3775–3789. [Google Scholar] [CrossRef]
  30. Zhang, X.H.; Liu, T.J.; Wang, J.L.; Wang, P.; Qiu, Y.; Zhao, W.; Pang, S.; Li, X.M.; Wang, H.P.; Song, J.P.; et al. Pan-genome of Raphanus Highlights Genetic Variation and Introgression Among Domesticated, Wild, and Weedy Radishes. Mol. Plant. 2021, 14, 2032–2055. [Google Scholar] [CrossRef] [PubMed]
  31. Xu, L.; Wang, Y.; Dong, J.; Zhang, W.; Tang, M.; Zhang, W.; Wang, K.; Chen, Y.; Zhang, X.; He, Q.; et al. A Chromosome-Level Genome Assembly of Radish (Raphanus sativus L.) Reveals Insights into Genome Adaptation and Differential Bolting Regulation. Plant Biotechnol. J. 2023, 21, 990–1004. [Google Scholar] [CrossRef] [PubMed]
  32. Yang, F.; Peng, S.; Yuan, S.; Ran, M.; Li, X.; Li, Y.; Liu, B.; Li, M.; Kong, C.; Yang, X.; et al. A Telomere-To-Telomere Genome Assembly of Radish (Raphanus sativus L.) Provides Insights into QTL Mapping of Bolting Traits. J. Genet. Genom. 2025, in press. [Google Scholar] [CrossRef]
  33. Lai, B.; Cheng, Y.; Liu, H.; Wang, Q.; Wang, Q.; Wang, C.; Su, R.; Chen, F.; Wang, H.; Du, L. Differential Anthocyanin Accumulation in Radish Taproot: Importance of RsMYB1 Gene Structure. Plant Cell Rep. 2020, 39, 217–226. [Google Scholar] [CrossRef]
  34. Wang, Q.; Wang, Y.; Sun, H.; Sun, L.; Zhang, L. Transposon-Induced Methylation of the RsMYB1 Promoter Disturbs Anthocyanin Accumulation in Red-Fleshed Radish. J. Exp. Bot. 2020, 71, 2537–2550. [Google Scholar] [CrossRef]
  35. He, Q.; Wu, J.; Xue, Y.; Zhao, W.; Li, R.; Zhang, L. The Novel Gene BrMYB2, Located on Chromosome A07, With a Short Intron 1 Controls the Purple-Head Trait of Chinese Cabbage (Brassica rapa L). Hortic. Res. 2020, 7, 97. [Google Scholar] [CrossRef] [PubMed]
  36. Shoeva, O.Y.; Glagoleva, A.Y.; Khlestkina, E.K. The Factors Affecting the Evolution of the Anthocyanin Biosynthesis Pathway Genes in Monocot and Dicot Plant Species. BMC Plant Biol. 2017, 17, 256. [Google Scholar] [CrossRef]
  37. Doyle, J. Genomic Plant DNA Preparation from Fresh Tissue CTAB Method. Phytochem. Bull. 1987, 19, 11–15. [Google Scholar]
  38. Chen, J.; Zhang, L.; Liu, Y.; Shen, X.; Guo, Y.; Ma, X.; Zhang, X.; Li, X.; Cheng, T.; Wen, H.; et al. RNA-Seq-Based WGCNA and Association Analysis Reveal the Key Regulatory Module and Genes Responding to Salt Stress in Wheat Roots. Plants 2024, 13, 274. [Google Scholar] [CrossRef] [PubMed]
  39. Zhang, L.; Wei, A.; Chen, J.; Wu, L.; Li, T.; Qiao, L. Identification of Ethylene Response Factors in Wheat Reveals That TaERF16-B Contributes to Salt Tolerance. Plants 2025, 14, 621. [Google Scholar] [CrossRef] [PubMed]
Figure 1. Taproot skin color of two inbred lines, SXAU-R2 and SXAU-W2, as well as their hybrid offspring. (a) Red-skinned parent SXAU-R2. (b) White-skinned parent SXAU-W2. (c) F1 generation. (d) Red-skinned, intermediate-color-skinned, and white-skinned individuals of the F2 segregant population.
Plants 14 03065 g001
Figure 2. Segregation of taproot skin color in SXAU-R2 × SXAU-W2 F2 population (a) and F2:3 lines derived from a heterozygous F2 individual #21 (b).
Plants 14 03065 g002
Figure 3. Genome-wide distribution of read coverage of the BSA-seq data. Taking 10 Kbp as the interval unit length, the chromosome was divided into multiple small windows, and the mapped reads falling in each window were counted as the coverage depth. Blue represented forward sequence, while green represented reverse sequence.
Plants 14 03065 g003
Figure 4. Chromosomal distribution of 2640 SNPs between annotated genes in the red skin bulk and white skin bulk. (a) Chromosomes 1~9 of radish. (b) Physical position of chromosomes 7. (c) The position of 28~32 Mbp on chromosome 7. The chromosome or physical position with high SNP distribution was marked in red.
Plants 14 03065 g004
Figure 5. Fine mapping of RST1. (a) Linkage map of RST1 in the SXAU-R2 × SXAU-W2 F2 population. RST1 was marked in red. (b) Diagrams of the locations of crossovers in three recombinant F2 individuals and two F2:3 lines deriving from the F2-21 individual. The red box referred to the SXAU-R2 allele, the white box referred to the SXAU-W2 allele, pink box referred to the heterozygote, and the gray box referred to the targeted region of RST1. ‘X’ indicated a crossover event. (c) Heatmap of the expressed annotated genes within the RST1 region based on the BSA-seq data. Genes significantly up-expressed in the red-skinned bulk were highlighted in bold, and the candidate gene was marked in red. (d) Agarose gel electrophoresis results of the diagnostic marker developed for the causing gene Rs0R7c036711 of RST1. The radish GADPH gene was used as the positive control. The diagnostic marker of RST1 had an amplification product in red-skinned parent SXAU-R2, but not in white-skinned parent SXAU-W2. Marker of positive control GADPH had amplification products in both parents. M: DNA ladder marker. (e) Phenotype of taproot skin color of F2 individuals corresponding to the two alleles of RST1 that were detected by the diagnostic marker.
Plants 14 03065 g005
Figure 6. DEGs between red-skinned bulk and white-skinned bulk. (a) The top 10 terms of KEGG enrichment results for DEGs. Term names related to flavonoid biosynthesis were marked in blue. The dot color and the dot size indicated the significance of enrichment and the count of enriched genes in terms, respectively. (b) Relative expression level of RST1, RsbHLH, RsWDR, and genes involved in anthocyanin synthesis. CHS: chalcone synthase; CHI: chalcone isomerase; F3H: flavanone 3-hydroxylase; DFR: dihydroflavonol-4-reductase; ANS: anthocyanidin synthase. BR: red-skinned bulk; WR: white-skinned bulk. *** indicates p < 0.001, and **** indicates p < 0.0001.
Plants 14 03065 g006
Figure 7. The flavonoid biosynthesis pathway. (a) Biochemical reaction steps of flavonoid synthesis. Chemical products were shown in boxes, and enzymes were shown next to the arrows. The enzymes marked in red indicated that its coding gene was highly expressed in the red-skinned bulk in this study. CHS: chalcone synthase; CHI: chalcone isomerase; FNS: flavone synthase; F3H: flavanone 3-hydroxylase; FLS: flavonol synthase; DFR: dihydroflavonol-4-reductase; ANS: anthocyanidin synthase; LAR: leucoanthocyanidin reductase; ANR: anthocyanidin reductase; UF3GT: flavonoid 3-O-glucosyltransferase. (b) Putative binding sites of the MBW complex in the promoter region of RsDFR (Rs0R9c041942) and RsANS (Rs0R4c020786). The blue and yellow small rectangles represented the MYB-recognizing element (MRE) and bHLH-recognizing element (BRE), respectively.
Plants 14 03065 g007
Figure 8. Phylogenetic analysis of flavonoid-related MYBs based on their amino acid sequences. The accession numbers of the MYBs were listed in brackets. MYBs in radish were marked in blue, and the MYB encoded by RST1 in this study was marked in red. In addition, AtPAP1/MYB75 and AtPAP2/MYB90 were from Arabidopsis thaliana, BrMYB2 from Chinese cabbage (Brassica rapa), MdMYB10 from apple (Malus domestica), PyMYB10 from pear (Pyrus), TaMYB10 from wheat (Triticum aestivum), ZmP1 and ZmC1 from maize (Zea mays), and OsC1 from rice (Oryza sativa). Bar meant 0.1 substitutions per site.
Plants 14 03065 g008
Figure 9. The workflow diagram of this study.
Plants 14 03065 g009
Disclaimer/Publisher’s Note: The statements, opinions and data contained in all publications are solely those of the individual author(s) and contributor(s) and not of MDPI and/or the editor(s). MDPI and/or the editor(s) disclaim responsibility for any injury to people or property resulting from any ideas, methods, instructions or products referred to in the content.