Article

Improving Sugarcane Biomass and Phosphorus Fertilization Through Phosphate-Solubilizing Bacteria: A Photosynthesis-Based Approach

by
Hariane Luiz Santos
1,*,
Gustavo Ferreira da Silva
1,
Melina Rodrigues Alves Carnietto
1,
Gustavo Ferreira da Silva
2,
Caio Nascimento Fernandes
3,
Lusiane de Sousa Ferreira
1 and
Marcelo de Almeida Silva
1,*
1
Laboratory of Ecophysiology Applied to Agriculture (LECA), Department of Crop Production, School of Agricultural Sciences, Sâo Paulo State University (UNESP), Botucatu 18610-034, SP, Brazil
2
Agricultural Sciences Center, Department of Biotechnology and Plant and Animal Production, Federal University of São Carlos (UFSCar), Araras 13600-970, SP, Brazil
3
Department of Rural Engineering and Socioeconomics, School of Agricultural Sciences, Sâo Paulo State University (UNESP), Botucatu 18610-034, SP, Brazil
*
Authors to whom correspondence should be addressed.
Plants 2025, 14(17), 2732; https://doi.org/10.3390/plants14172732
Submission received: 5 August 2025 / Revised: 18 August 2025 / Accepted: 20 August 2025 / Published: 2 September 2025

Abstract

Phosphorus (P) is essential for sugarcane growth but often presents low agricultural use efficiency. This research evaluated the effects of Bacillus velezensis UFV 3918 (Bv), applied alone or with monoammonium phosphate (MAP), on sugarcane’s physiological, biochemical, and biomass variables. Six treatments were tested in a completely randomized design: absolute control (AC), commercial control (CC, full MAP dose), Bv alone, and Bv combined with 1/3, 2/3, or full MAP dose. B. velezensis (Bv) and Bv + 1/3 MAP increased soil P availability by 22%, correlating strongly with physiological, biochemical, and shoot biomass variables. These treatments boosted total chlorophyll content (11.4%), electron transport rate (28.5%), and photochemical quenching (16.9%), resulting in higher photosynthetic efficiency. Compared with CC, net CO2 assimilation, stomatal conductance, and carboxylation efficiency increased by 49.0%, 35.4%, and 72.9%, respectively. Additionally, amino acid content and leaf acid phosphatase activity rose by 12.1% and 13.8%. Key traits associated with biomass production included stomatal density (abaxial face), chlorophyll content, electron transport rate, intercellular CO2 concentration, and leaf acid phosphatase activity. The results highlight the potential of Bv UFV 3918, particularly with reduced MAP doses, to improve sugarcane photosynthesis and biomass accumulation, offering a sustainable and cost-effective fertilization strategy.

1. Introduction

Sugarcane is a vital global crop and the primary source of sugar and ethanol [1]. Brazil is the world’s leading producer, harvesting 713.2 million tons over 8.33 million hectares in the 2023/2024 season [2]. Achieving high yields depends heavily on adequate fertilization, with phosphorus (P) management being particularly critical due to its role as a limiting nutrient in many agricultural systems [3,4]. Phosphorus is essential for plant growth and reproduction, contributing to cell division, photosynthesis, and respiration, which are fundamental for early root establishment, sprouting, and tillering. Insufficient P supply can negatively impact photosynthetic activity, sucrose synthesis, stalk productivity, and sugarcane field longevity [5,6,7,8,9,10]. Although many soils contain substantial P reserves (100–3000 mg P kg–1), only a small fraction (0.1–10 μM) is readily available to plants [11,12]. Approximately 4% of total soil P is accessible in orthophosphate [13], while inorganic P constitutes around 35–70% of total soil phosphorus [3], highlighting the importance of strategies that enhance P bioavailability for sugarcane cultivation.
Phosphorus has the lowest use efficiency among macronutrients in agricultural production due to its strong interactions with soil components [14,15,16]. This limitation is particularly pronounced in tropical regions, where most soluble phosphate fertilizers applied to the soil dissolve but are rapidly retained in the solid phase through adsorption by iron and aluminum minerals, reducing P availability for plant growth [17,18,19]. In sugarcane cultivation, where soils often exhibit high P-fixing capacity, substantial fertilizer inputs are required to meet crop demands [20]. Given the rising global demand for sugar and bioethanol, improving the efficiency of phosphate fertilization and enhancing both the photochemical and biochemical components of photosynthesis are critical to producing sugarcane more economically and sustainably.
Phosphate-solubilizing bacteria (PSB) are a sustainable approach to increasing P availability in agricultural systems [13,21,22,23,24] while also enhancing phosphorus use efficiency in the soil–plant system [25,26]. These microorganisms are key in converting inorganic and organic P forms into bioavailable compounds [27,28]. Bacillus species are particularly abundant in the rhizosphere and stand out for their potential as efficient P solubilizers [29,30].
Beyond P solubilization, Bacillus species can favor plant photosynthetic capacity by increasing chlorophyll content, contributing to higher photochemical efficiency [31,32]. This effect may occur directly by producing phytohormones, siderophores, or other metabolites that stimulate chlorophyll biosynthesis, and indirectly due to improved nutrient uptake supporting chlorophyll formation [33]. Moreover, PSB can enhance the synthesis of osmoregulatory substances [34], influencing stomatal conductance and cellular tolerance to dehydration [35,36,37], promoting greater water use efficiency [36,38] and higher carboxylation efficiency [38]. In this way, inoculation with bacteria can favor the growth and productivity of sugarcane [23,39,40].
This study aimed to assess sugarcane’s physiological, biochemical, and production responses up to 180 days after planting, using Bacillus velezensis strain UFV 3918, applied alone or in combination with mono ammonium phosphate (MAP). We hypothesized that inoculating sugarcane buds with B. velezensis UFV 3918 could reduce the need for MAP application while maintaining or enhancing photosynthetic efficiency and biomass productivity.

2. Results

2.1. Physiological Assessments

Considering adaxial stomatal density (SDAD), at 60 DAP, the highest value was found in Bv + 3/3 MAP, which was 18.4% higher than in CC (Figure 1A). At 120 DAP, CC, Bv, Bv + 1/3 MAP, and Bv + 3/3 MAP resulted in similar SDAD, while Bv + 2/3 MAP increased the SDAD by 25.7% compared with the CC. At 180 DAP, the highest SDAD was observed in Bv, representing 34.3% and 28.2% increases compared with CC and the other inoculated treatments, respectively (Figure 1A). Similar performance was observed in abaxial stomatal density (SDAB) at 60 DAP, where Bv + 3/3 MAP provided increases of 20.9% and 10.9% compared with CC and the other inoculated treatments, respectively (Figure 1B). At 120 and 180 DAP, all treatments with B. velezensis resulted in SDAB equal to or greater than CC. Bv and Bv + 2/3 MAP provided average increases of 10.0% and 11.2% in SDAB compared with CC at 120 and 180 DAP, respectively (Figure 1B).
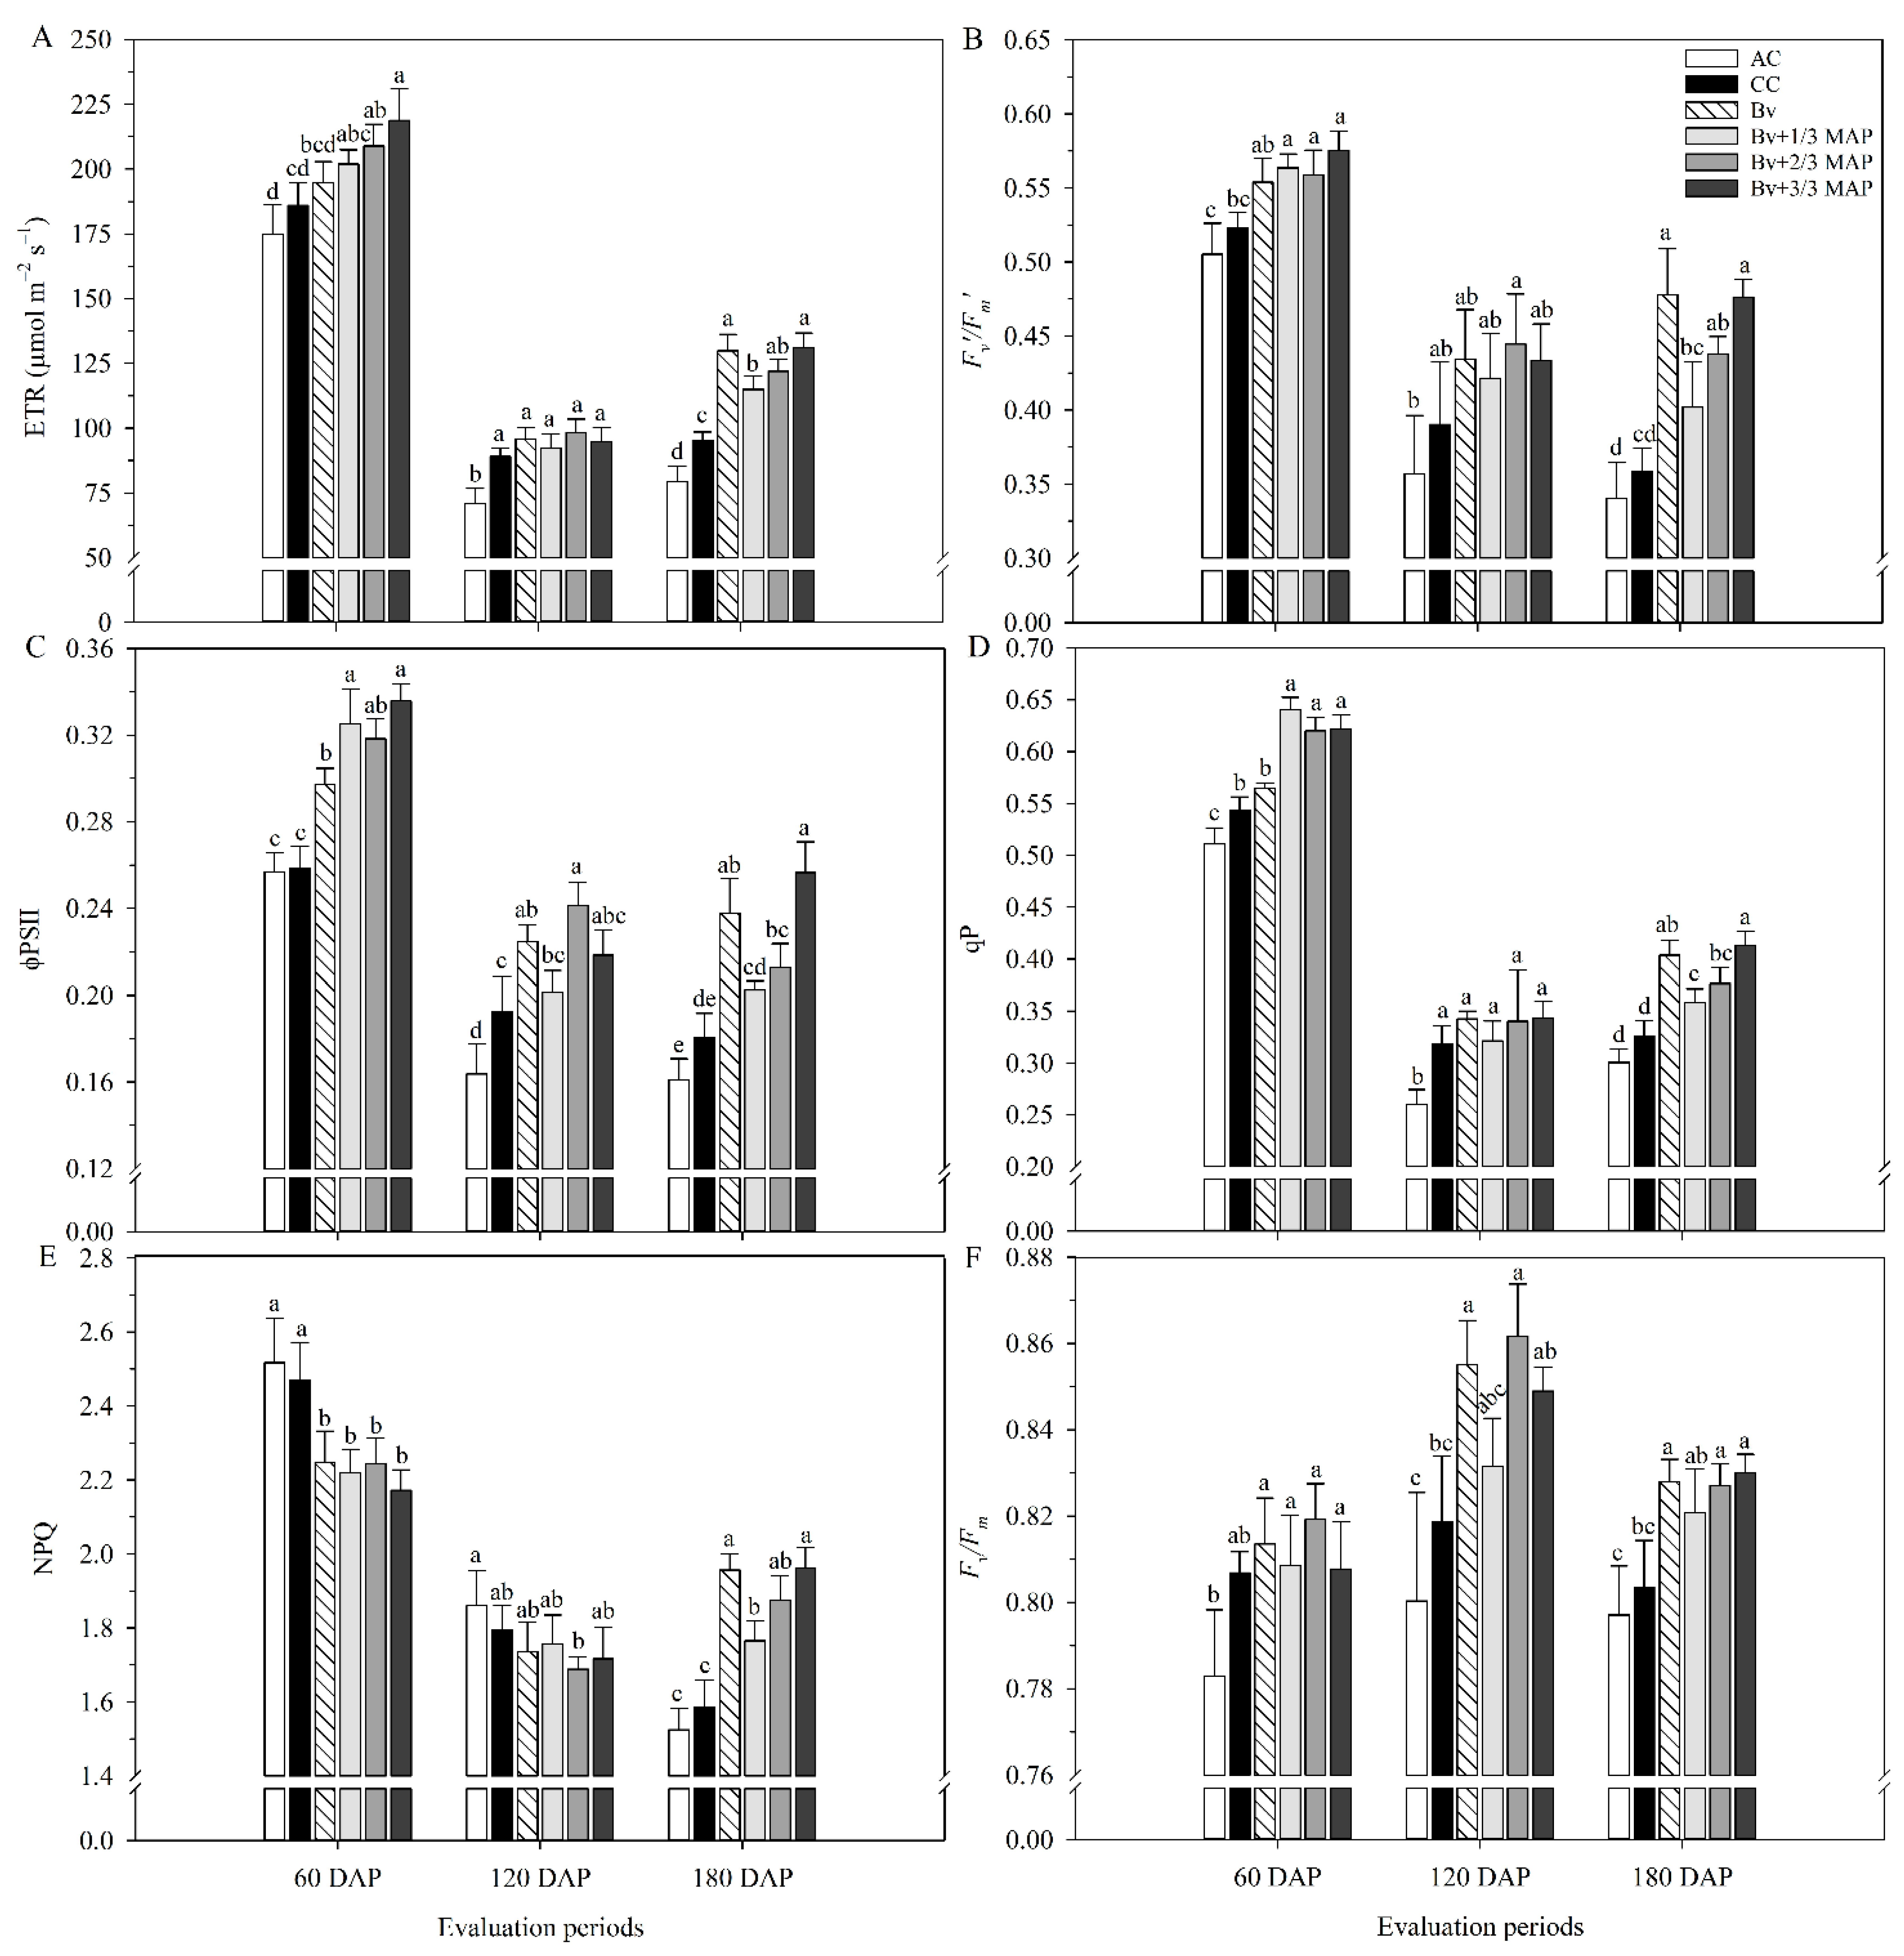
The lowest performance regarding the variables related to chlorophyll a fluorescence was observed in AC (Figure 2). There was a general downward trend in ETR, Fv/Fm, φPSII, qP, and NPQ between 60 and 180 DAP (Figure 2A–E). Furthermore, at 120 DAP, there was no difference between the inoculated treatments and CC for ETR, Fv/Fm, qP, and NPQ (Figure 2A–E).
At 60 DAP, the highest ETR was observed in Bv + 2/3 MAP and Bv + 3/3 MAP, which provided an average increase of 15% compared with CC. At 180 DAP, Bv and Bv + 1/3 MAP increased the ETR by 28.5% compared with CC (Figure 2A). Regarding Fv/Fm, at 60 DAP, the highest values were observed in Bv + 1/3 MAP, 2/3 MAP, and 3/3 MAP, which provided an average increase of 8.2% compared with CC (Figure 2B). At 180 DAP, there was a 33.1% increase in the Fv/Fm of Bv compared with CC.
For φPSII, Bv + 1/3, 2/3, and 3/3 MAP provided an average increase of 25.9% compared with CC at 60 DAP. In contrast, Bv increased φPSII by 17.2% and 31.5% compared with CC at 120 and 180 DAP, respectively, but was similar to Bv + 3/3 MAP in both periods (Figure 2C). At 60 DAP, the highest qP was found in Bv + 1/3, 2/3, and 3/3 MAP, which provided an average increase of 15.6% compared with CC (Figure 2D). At 180 DAP, there was a 23.9% increase in the qP of Bv compared with CC. Still, Bv was similar to Bv + 3/3 MAP, and in general, in the same period, treatments inoculated with B. velezensis provided an average increase of 19.0% in qP compared with CC.
On average, AC and CC provided NPQ 12.2% higher than those observed in plants inoculated with B. velezensis at 60 DAP. In contrast, at 180 DAP, inoculated plants provided an average increase of 21.6% in NPQ compared with non-inoculated plants, emphasizing Bv, Bv + 2/3 MAP, and Bv + 3/3 MAP (Figure 2E). At 120 DAP, Bv and Bv + 2/3 MAP provided an average increase of 4.8% in Fv/Fm compared with CC, and at 180 DAP, Bv, Bv + 2/3 MAP, and Bv + 3/3 MAP provided an average increase of 3.0% in this variable compared with CC (Figure 2F).
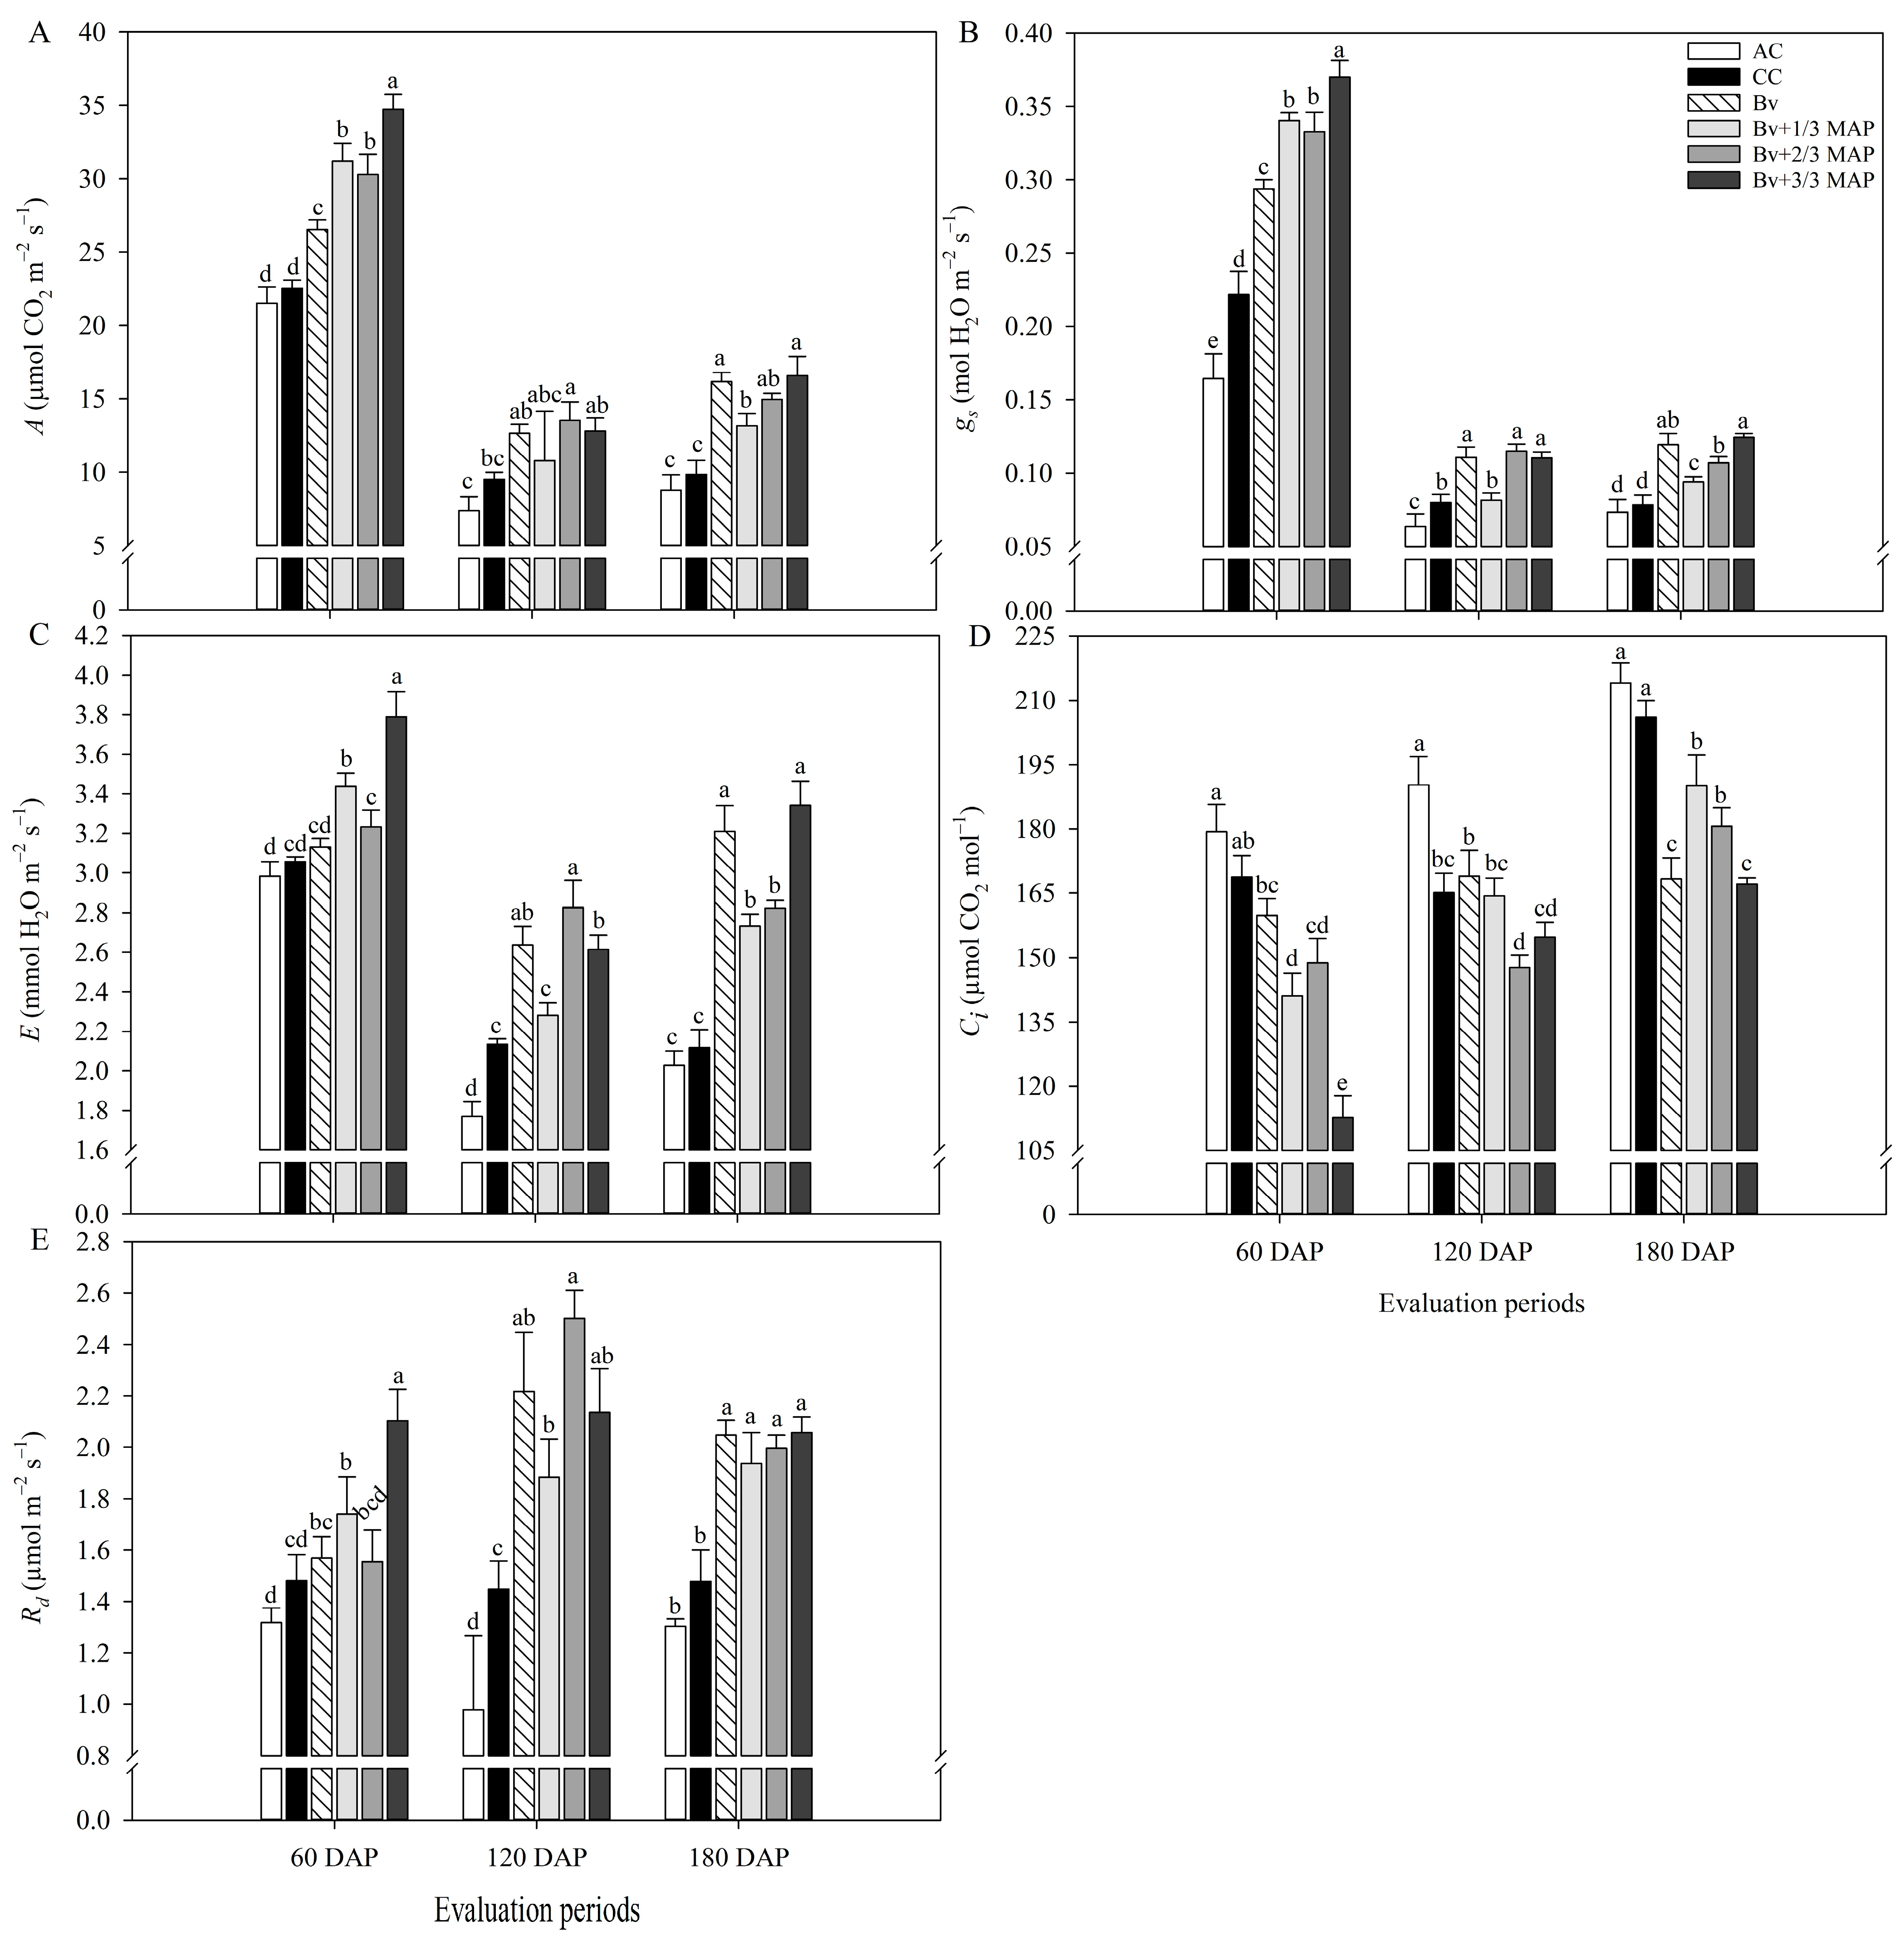
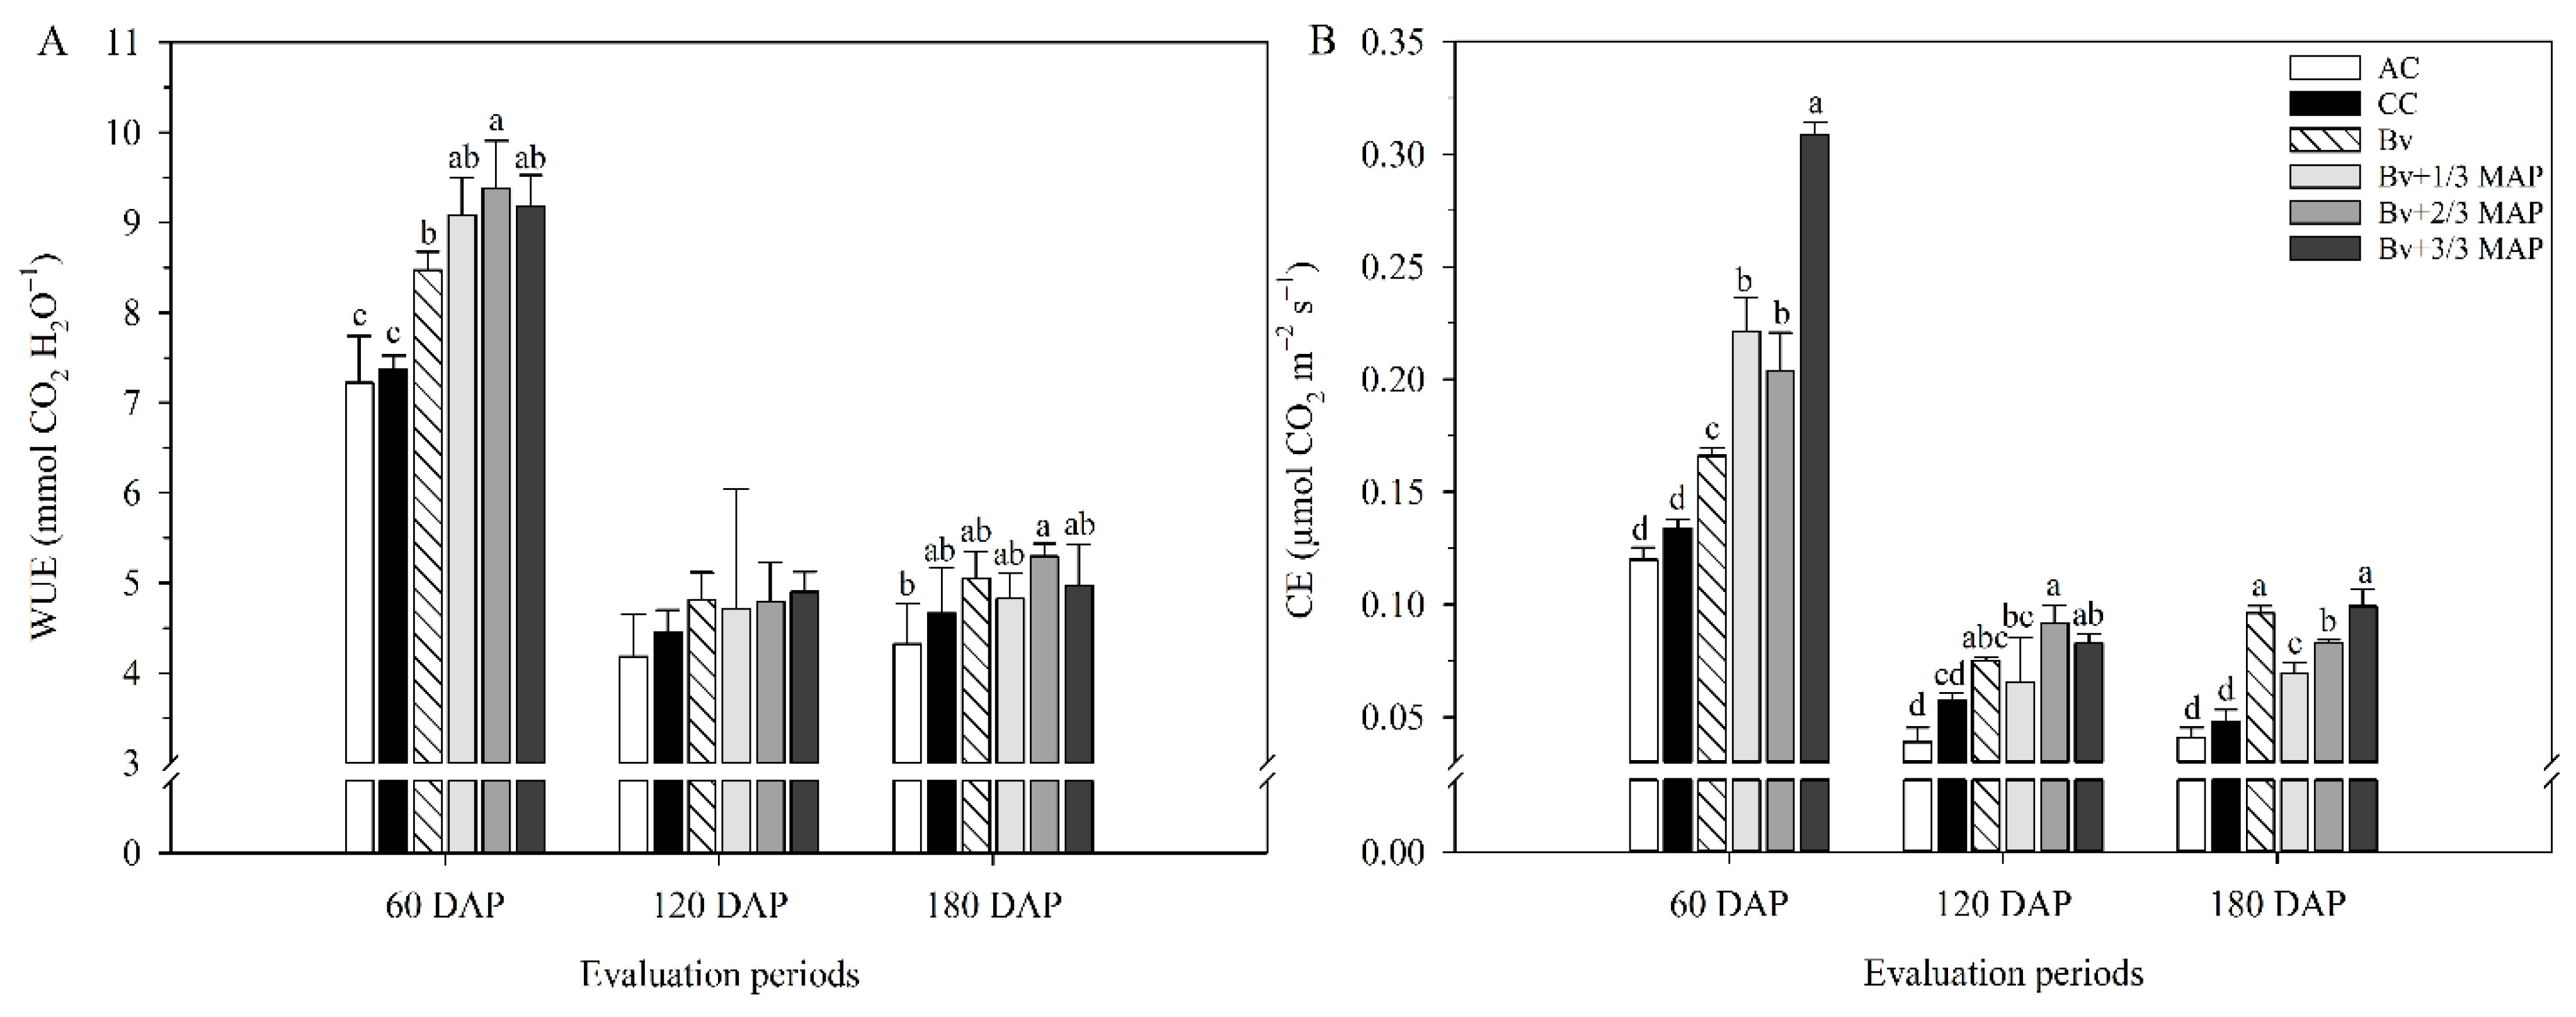
As well as chlorophyll a fluorescence variables, there were decreases in A, gs, and E and an increase in Ci between 60 and 180 DAP (Figure 3), contributing to the reduction in WUE and EC throughout this period (Figure 4). This may have resulted from the plants’ aging and the reduction in the average temperature observed throughout the evaluations (Figure 12).
AC also had the lowest physiological performance in gas exchange throughout the cycle (Figure 3). At 60 DAP, Bv + 3/3 MAP had the best gas exchange performance. However, throughout the evaluations, treatments with B. velezensis and reduced phosphate doses improved photosynthetic performance, even equaling Bv + 3/3 MAP, with Bv standing out (Figure 3).
At 60 DAP, Bv + 1/3 MAP increased A by 38.4% compared with CC, while Bv and Bv + 1/3 MAP provided average increases of 23.3% and 49.0% in A compared with CC, at 120 and 180 DAP, respectively (Figure 3A). Furthermore, Bv was similar to Bv + 2/3 MAP and Bv + 3/3 MAP in both periods. Regarding gs, Bv and Bv + 1/3 MAP promoted average increases of 42.8% and 35.4% compared with CC at 60 and 180 DAP, respectively. There was no difference between Bv, Bv + 2/3 MAP, and Bv + 3/3 MAP for gs at 120 DAP, but these treatments increased gs, on average, by 40% compared with CC (Figure 3B).
Bv had E similar to CC at 60 DAP but increased this variable by 23.6% and 51.6% at 120 and 180 DAP, respectively (Figure 3C), due to the higher gs and A observed during this period. Regarding Ci, there was no difference between Bv and CC at 60 and 120 DAP; however, at 180 DAP, Bv resulted in Ci 18.3% lower than CC and similar to Bv + 3/3 MAP (Figure 3D). Bv + 1/3 MAP provided Ci similar to CC at 120 DAP, but decreases of 16.3% and 7.8% were observed in the Ci of Bv + 1/3 MAP compared with CC at 60 and 180 DAP, respectively (Figure 3D).
At 60 DAP, Bv + 3/3 MAP provided the highest Rd, with 42.1% and 29.8% increases compared with CC and the other treatments inoculated with B. velezensis, respectively (Figure 3E). Plants inoculated with the UFV 3918 strain showed average gains of 50.8% and 35.8% in Rd compared with CC at 120 and 180 DAP, respectively.
At 60 DAP, Bv and Bv + 1/3 MAP had WUE, on average, 14.8% higher than CC but similar to Bv + 3/3 MAP. However, there was no difference between the inoculated treatments and CC at 120 and 180 DAP (Figure 4A). Bv, Bv + 1/3, 2/3, and 3/3 MAP increased CE by 23.9%, 64.9%, 52.2%, and 130.6%, respectively, compared with CC at 60 DAP. At 180 DAP, they provided increases of 100%, 43.8%, 72.9%, and 106.2% in CE, respectively, compared with CC (Figure 4B).

2.2. Biochemical Assessments

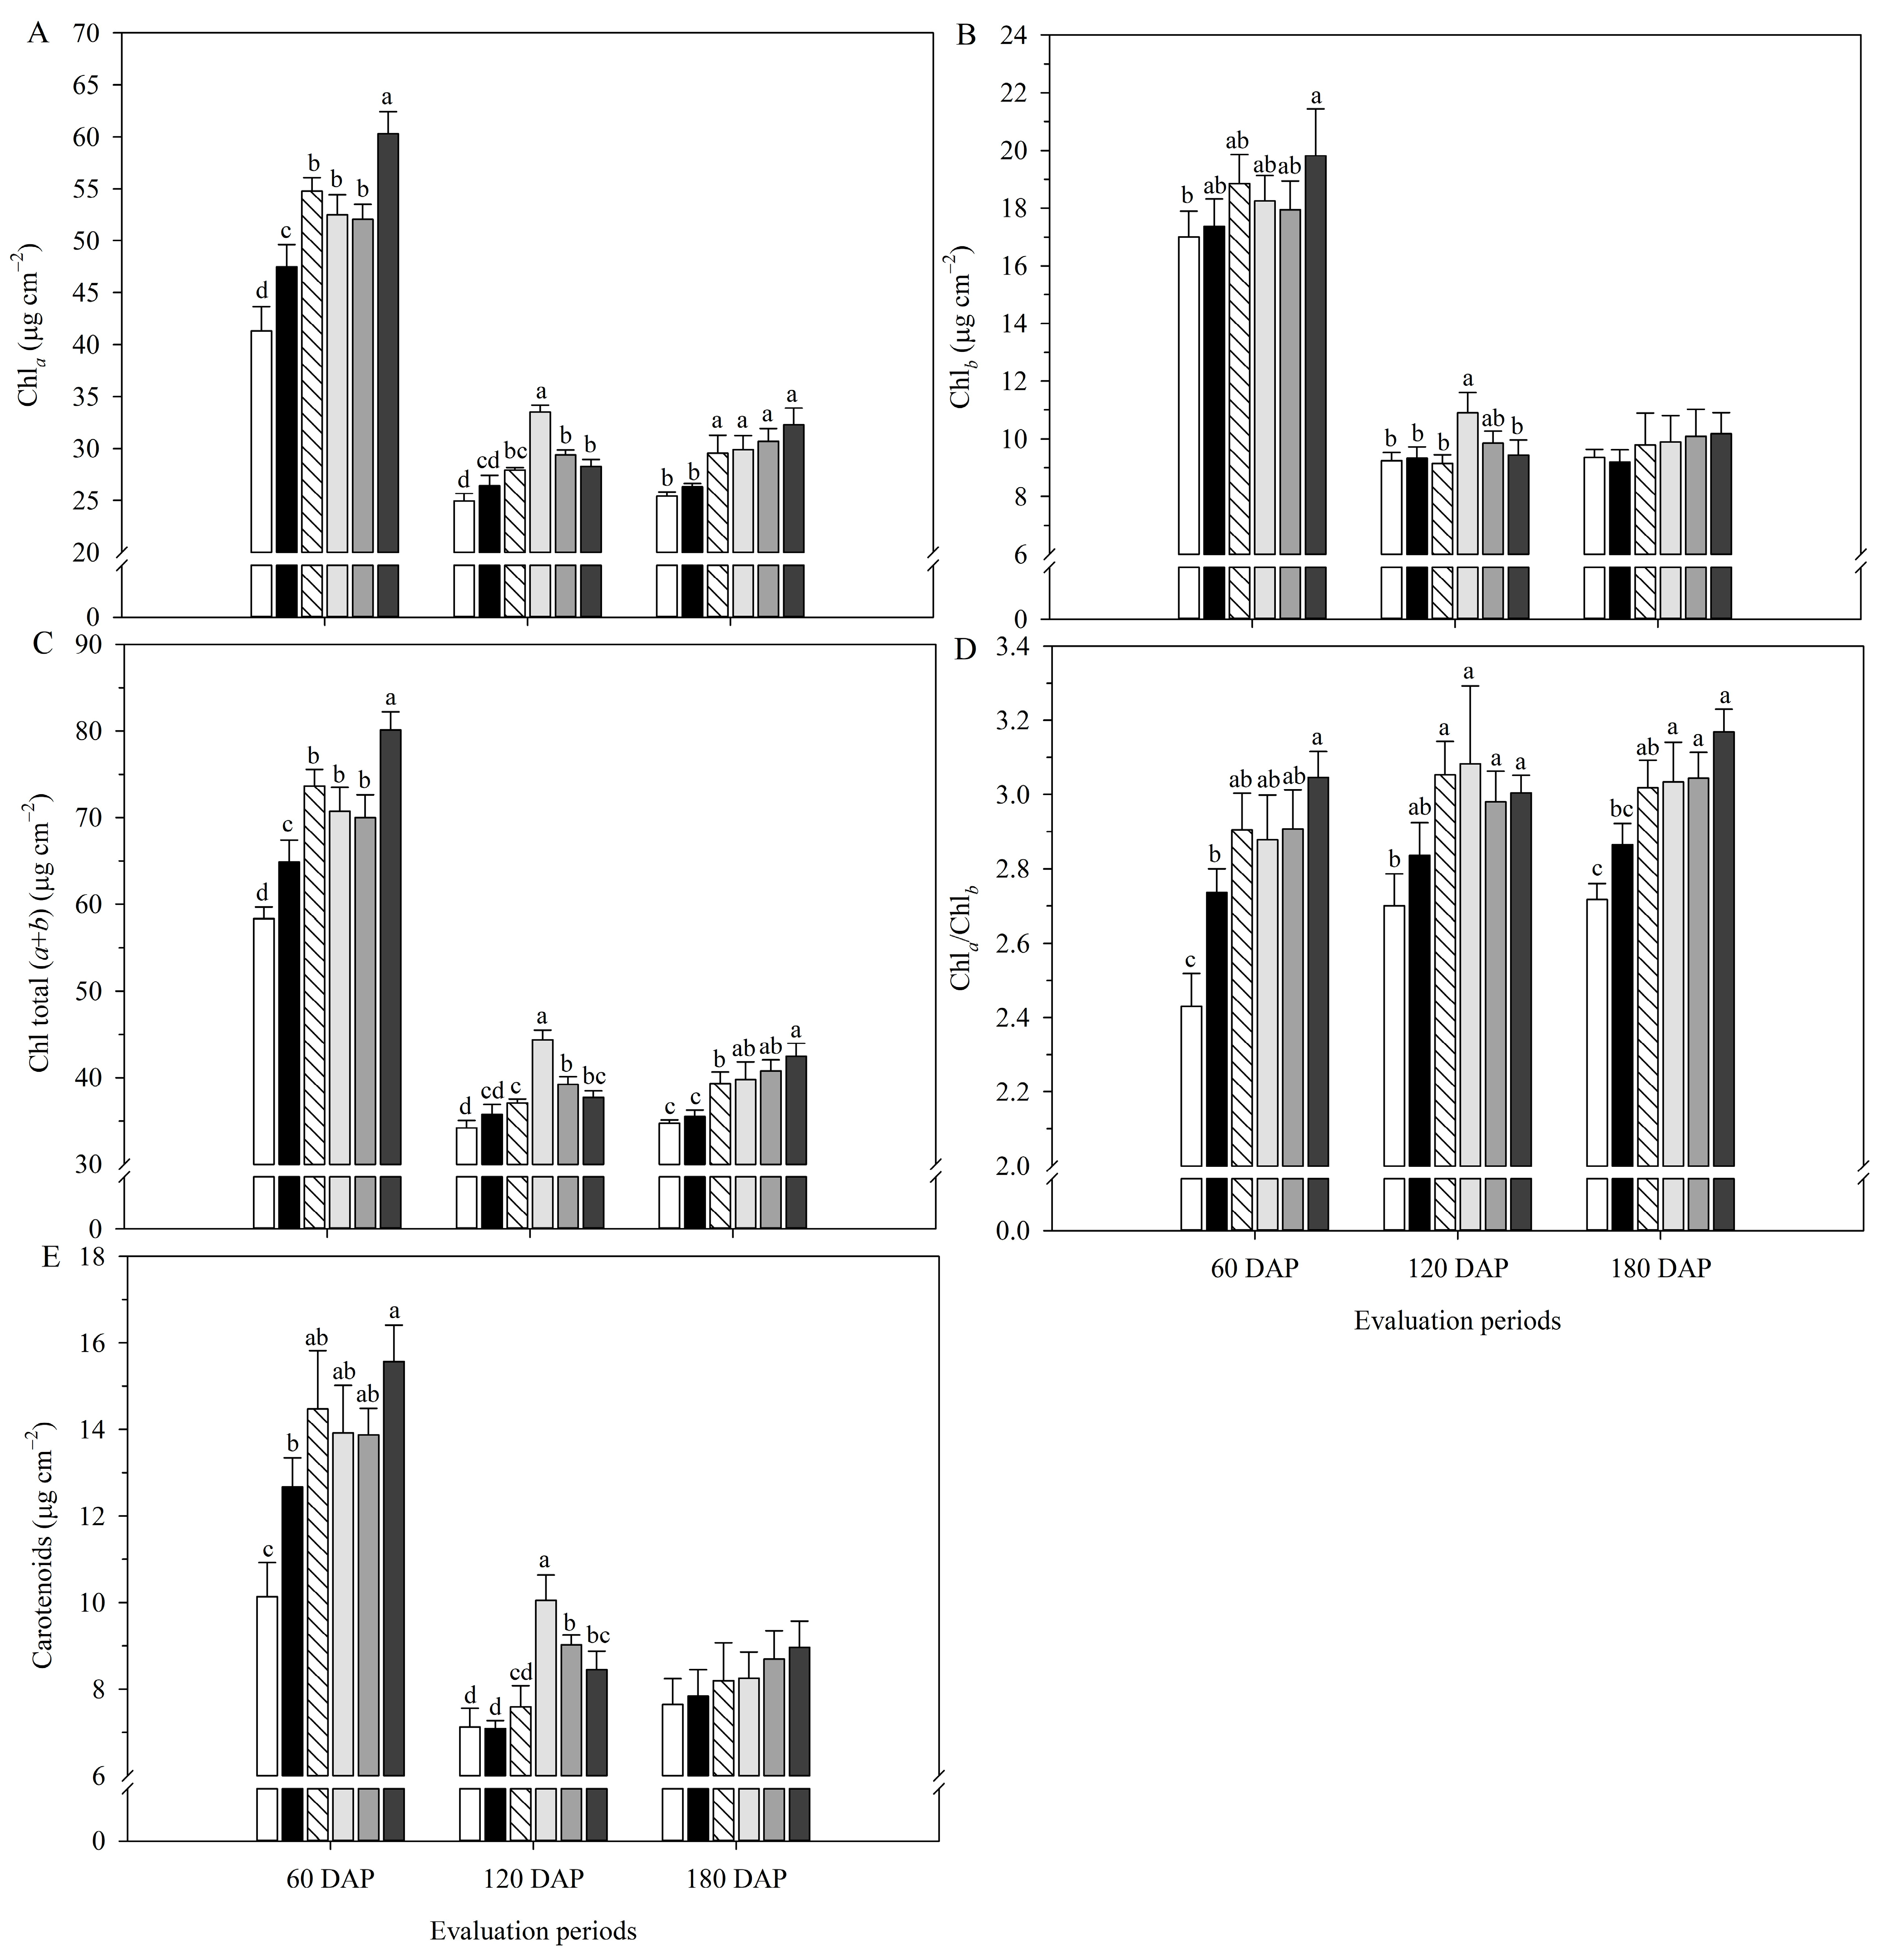
There were decreases in the contents of chlorophyll a (Chla), chlorophyll b (Chlb), total chlorophyll (Chl total), and carotenoids between 60 DAP and 180 DAP because of the plants’ aging, and the lowest contents of photosynthetic pigments throughout the period were verified in the AC (Figure 5). At 60 DAP, Bv + 3/3 MAP performed the best in photosynthetic pigments. Still, throughout the evaluations, the combination of Bv and reduced MAP doses allowed it to equate to Bv + 3/3 MAP, with Bv and Bv + 1/3 MAP standing out.
Bv + 3/3 MAP increased Chla content by 26.9% and 13.5% compared with CC and the other treatments inoculated with B. velezensis, respectively, at 60 DAP. At 120 DAP, Bv + 1/3 MAP increased this variable by 26.7% compared with CC. At 180 DAP, plants inoculated with B. velezensis had Chla content, on average, 16.3% higher than CC (Figure 5A). Regarding Chlb content, there was no difference between CC and Bv + MAP doses at 60 DAP; however, at 120 DAP, Bv + 1/3 MAP increased Chlb content by 16.8% compared with CC (Figure 5B).
Bv, Bv + 1/3 MAP, and Bv + 2/3 MAP provided average increases of 10.1% and 12.5% compared to CC at 60 and 180 DAP, respectively. At 120 DAP, Bv + 1/3 MAP increased this variable by 24.2% compared with CC (Figure 5C). Bv, Bv + 1/3 MAP, and Bv + 2/3 MAP provided Chla/Chlb similar to CC at 60 and 120 DAP, while Bv + 1/3 MAP increased this variable by 5.6% compared with CC at 180 DAP (Figure 5D).
Considering the carotenoid content, there was no difference between treatments inoculated with B. velezensis at 60 DAP, but Bv + 3/3 MAP provided a 22.9% increase in this variable compared with CC (Figure 5E). At 120 DAP, Bv + 1/3 MAP and Bv + 2/3 MAP increased the carotenoid content by 41.7% and 27.2% compared with CC, respectively. In comparison, there was no difference between treatments at 180 DAP.
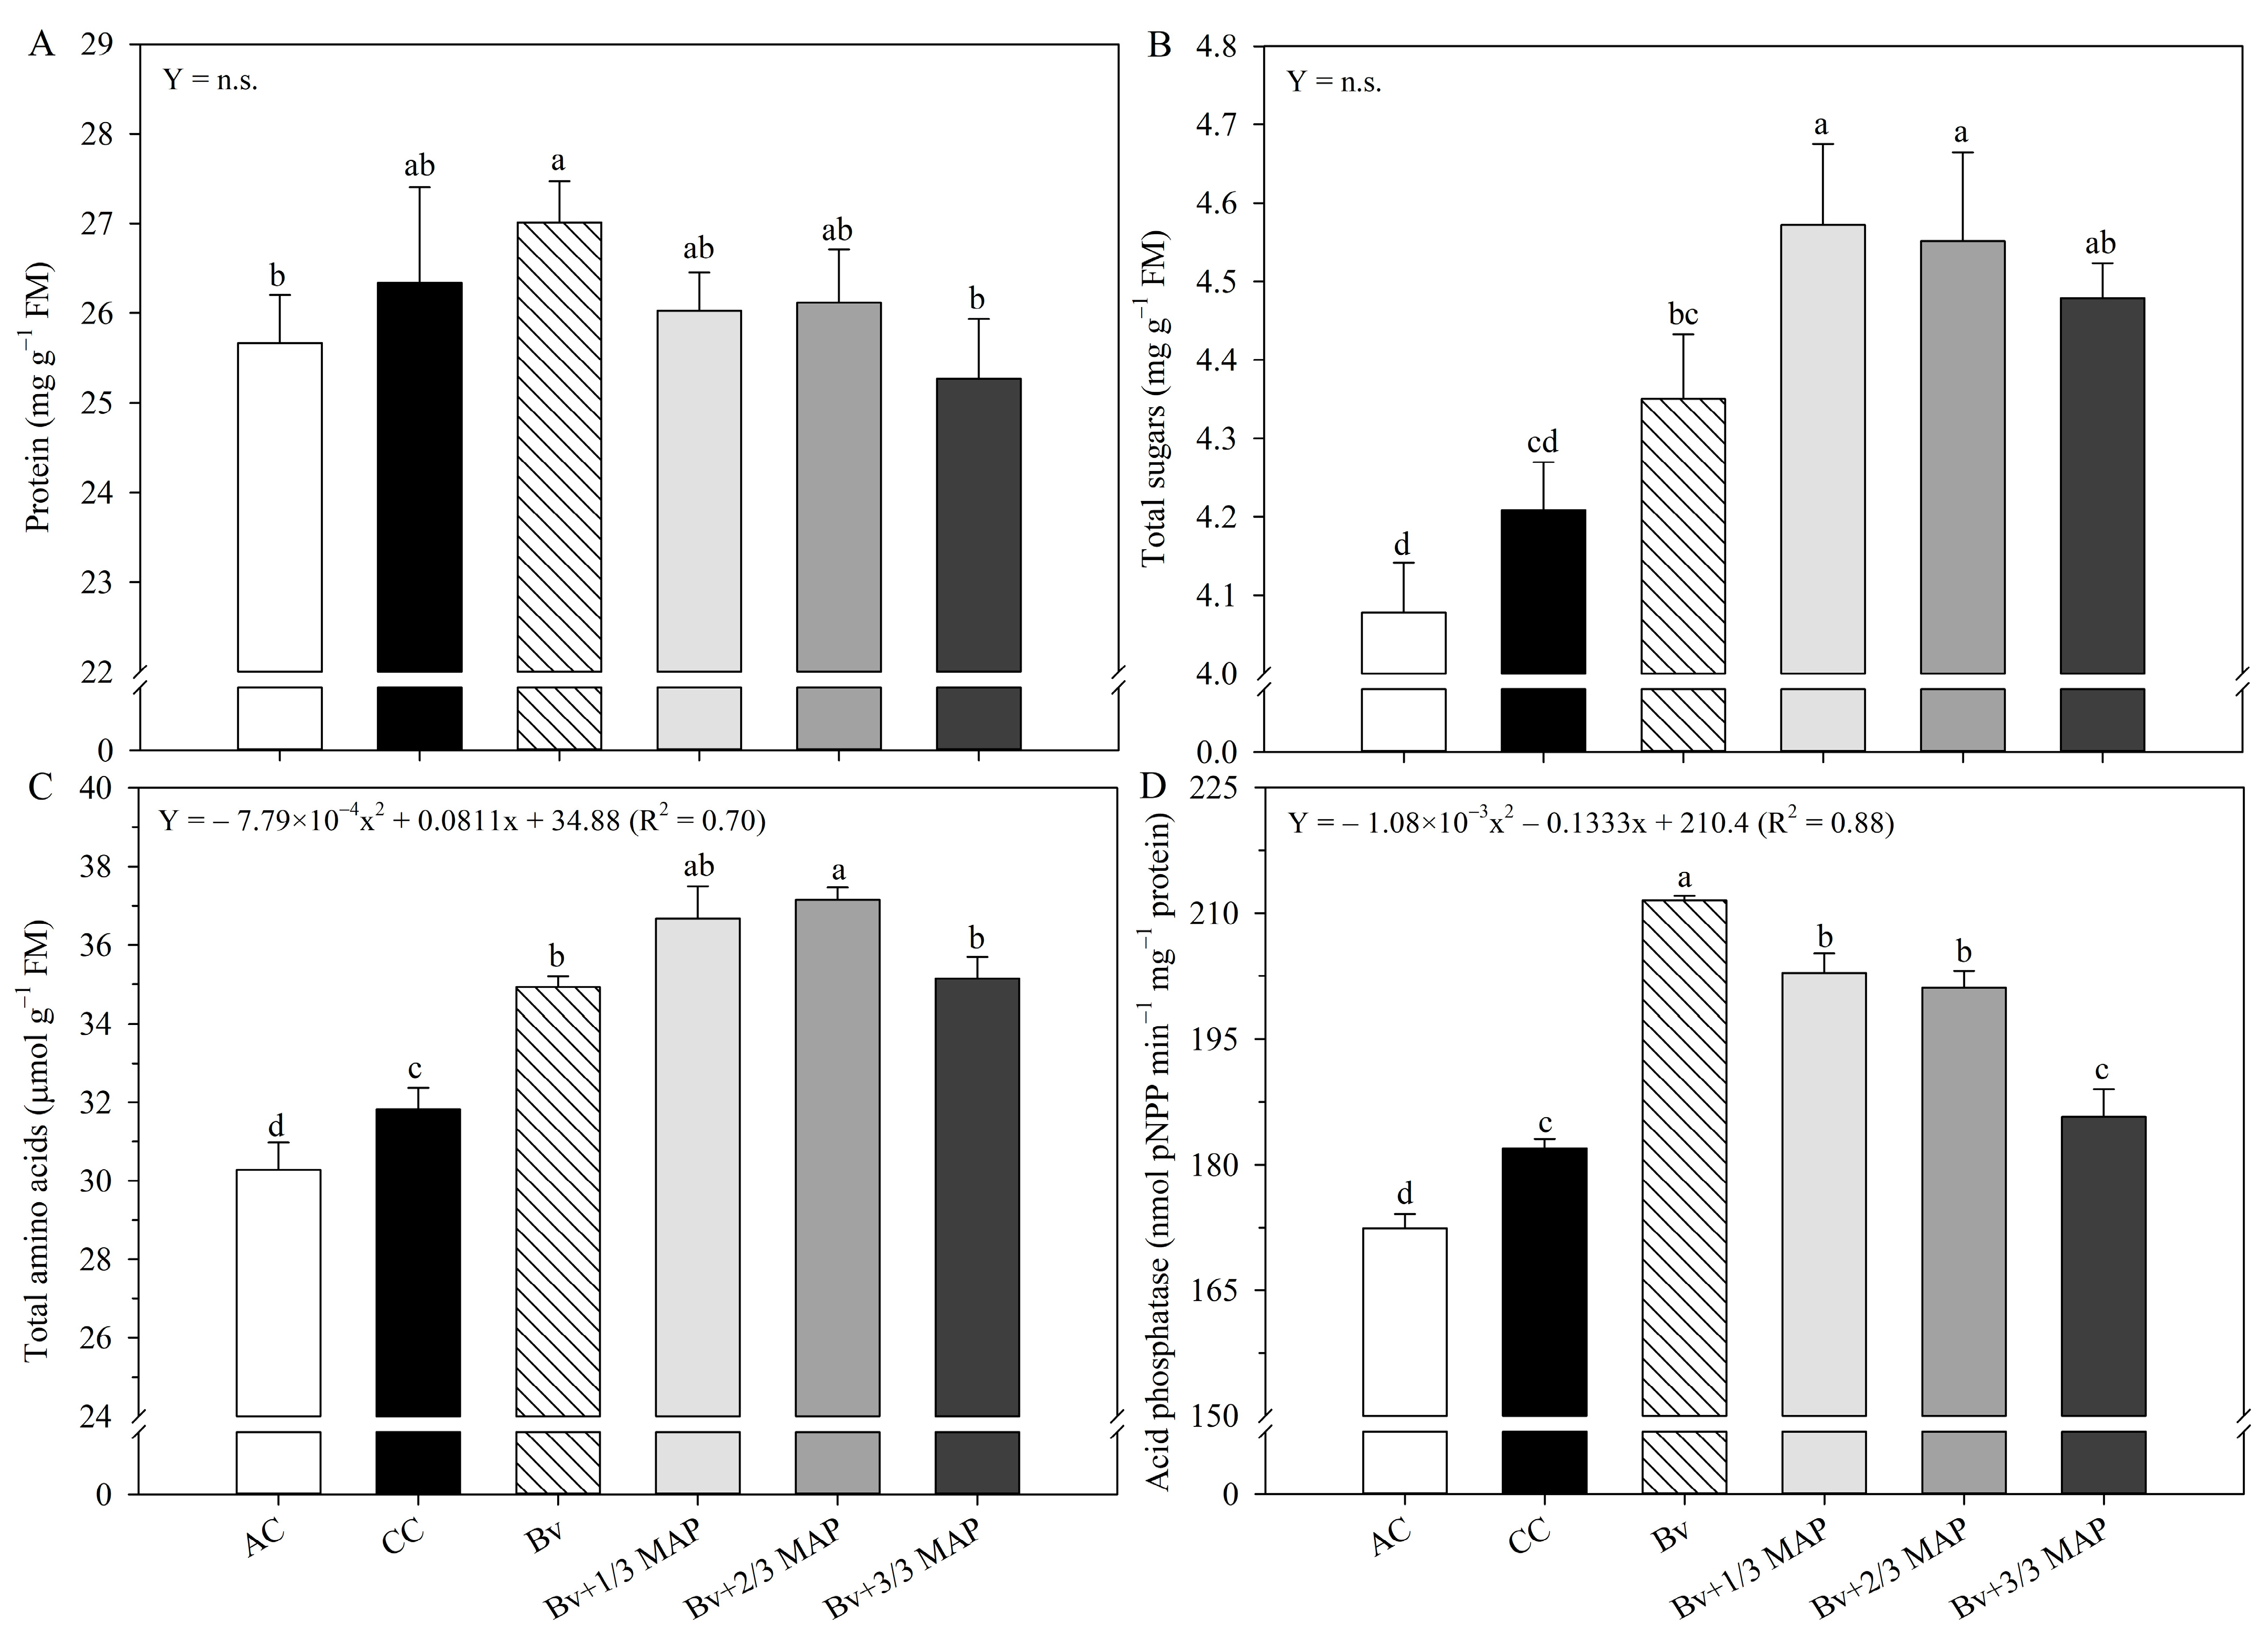
There was no difference in protein content between CC and Bv + MAP doses (Figure 6A), and no regression model was fitted for this variable. The highest total sugar (TS) contents were observed in Bv + 1/3 MAP and Bv + 2/3 MAP, which provided average increases of 4.8%, 9.3%, and 11.5% compared to Bv, CC, and AC, respectively (Figure 6B). There was no regression adjustment of Bv + MAP doses for TS content.
The highest total amino acid (TAC) contents were observed under Bv + MAP doses. Bv, Bv + 1/3 MAP, 2/3 MAP, and 3/3 MAP provided increases of 9.8%, 14.5%, 16.4%, and 10.3% in TAC content, respectively, compared with CC (Figure 6C). Bv + MAP doses raised TAC content up to 66% of the MAP dose, followed by a tendency to decrease with 100% MAP (0.70 *).
Regarding leaf acid phosphatase (LAP) activity, Bv and Bv + reduced MAP doses (Bv + 1/3 MAP and Bv + 2/3 MAP) provided the highest enzymatic activities, with average increases of 16.4% and 10.6%, respectively, compared with CC (Figure 6D). As Bv and increasing doses of MAP were associated, there was a reduction in LAP activity (0.88 *).

2.3. Phosphorus Content in the Soil and Shoot

The inoculated treatments had the highest soil P contents, with Bv, Bv + 1/3 MAP, and Bv + 3/3MAP providing increases of 26.2%, 17.8%, and 23.1%, respectively, compared with CC (Table 1). It is worth highlighting that Bv increased the P content in the soil by 13.6% compared with Bv + 2/3 MAP, similar to Bv + 3/3MAP. Considering Bv+MAP doses, there was a reduction in P content from 0 to 66% of the MAP dose, followed by an increase at the full MAP dose (0.70 *) (Table 1).
Considering the shoot P accumulation (PAc), although there was no statistical difference between Bv + 1/3, 2/3, and 3/3 MAP and CC, Bv provided increases of 29%, 11%, and 11% in PAc compared with AC, CC, and Bv + 1/3 MAP, respectively (Table 1). Regarding the Bv+MAP doses, there was a decrease in PAc from 0 to 33% of the MAP dose, followed by a slight increase at 66% and 100% of the MAP dose (0.70 *).

2.4. Shoot Biomass

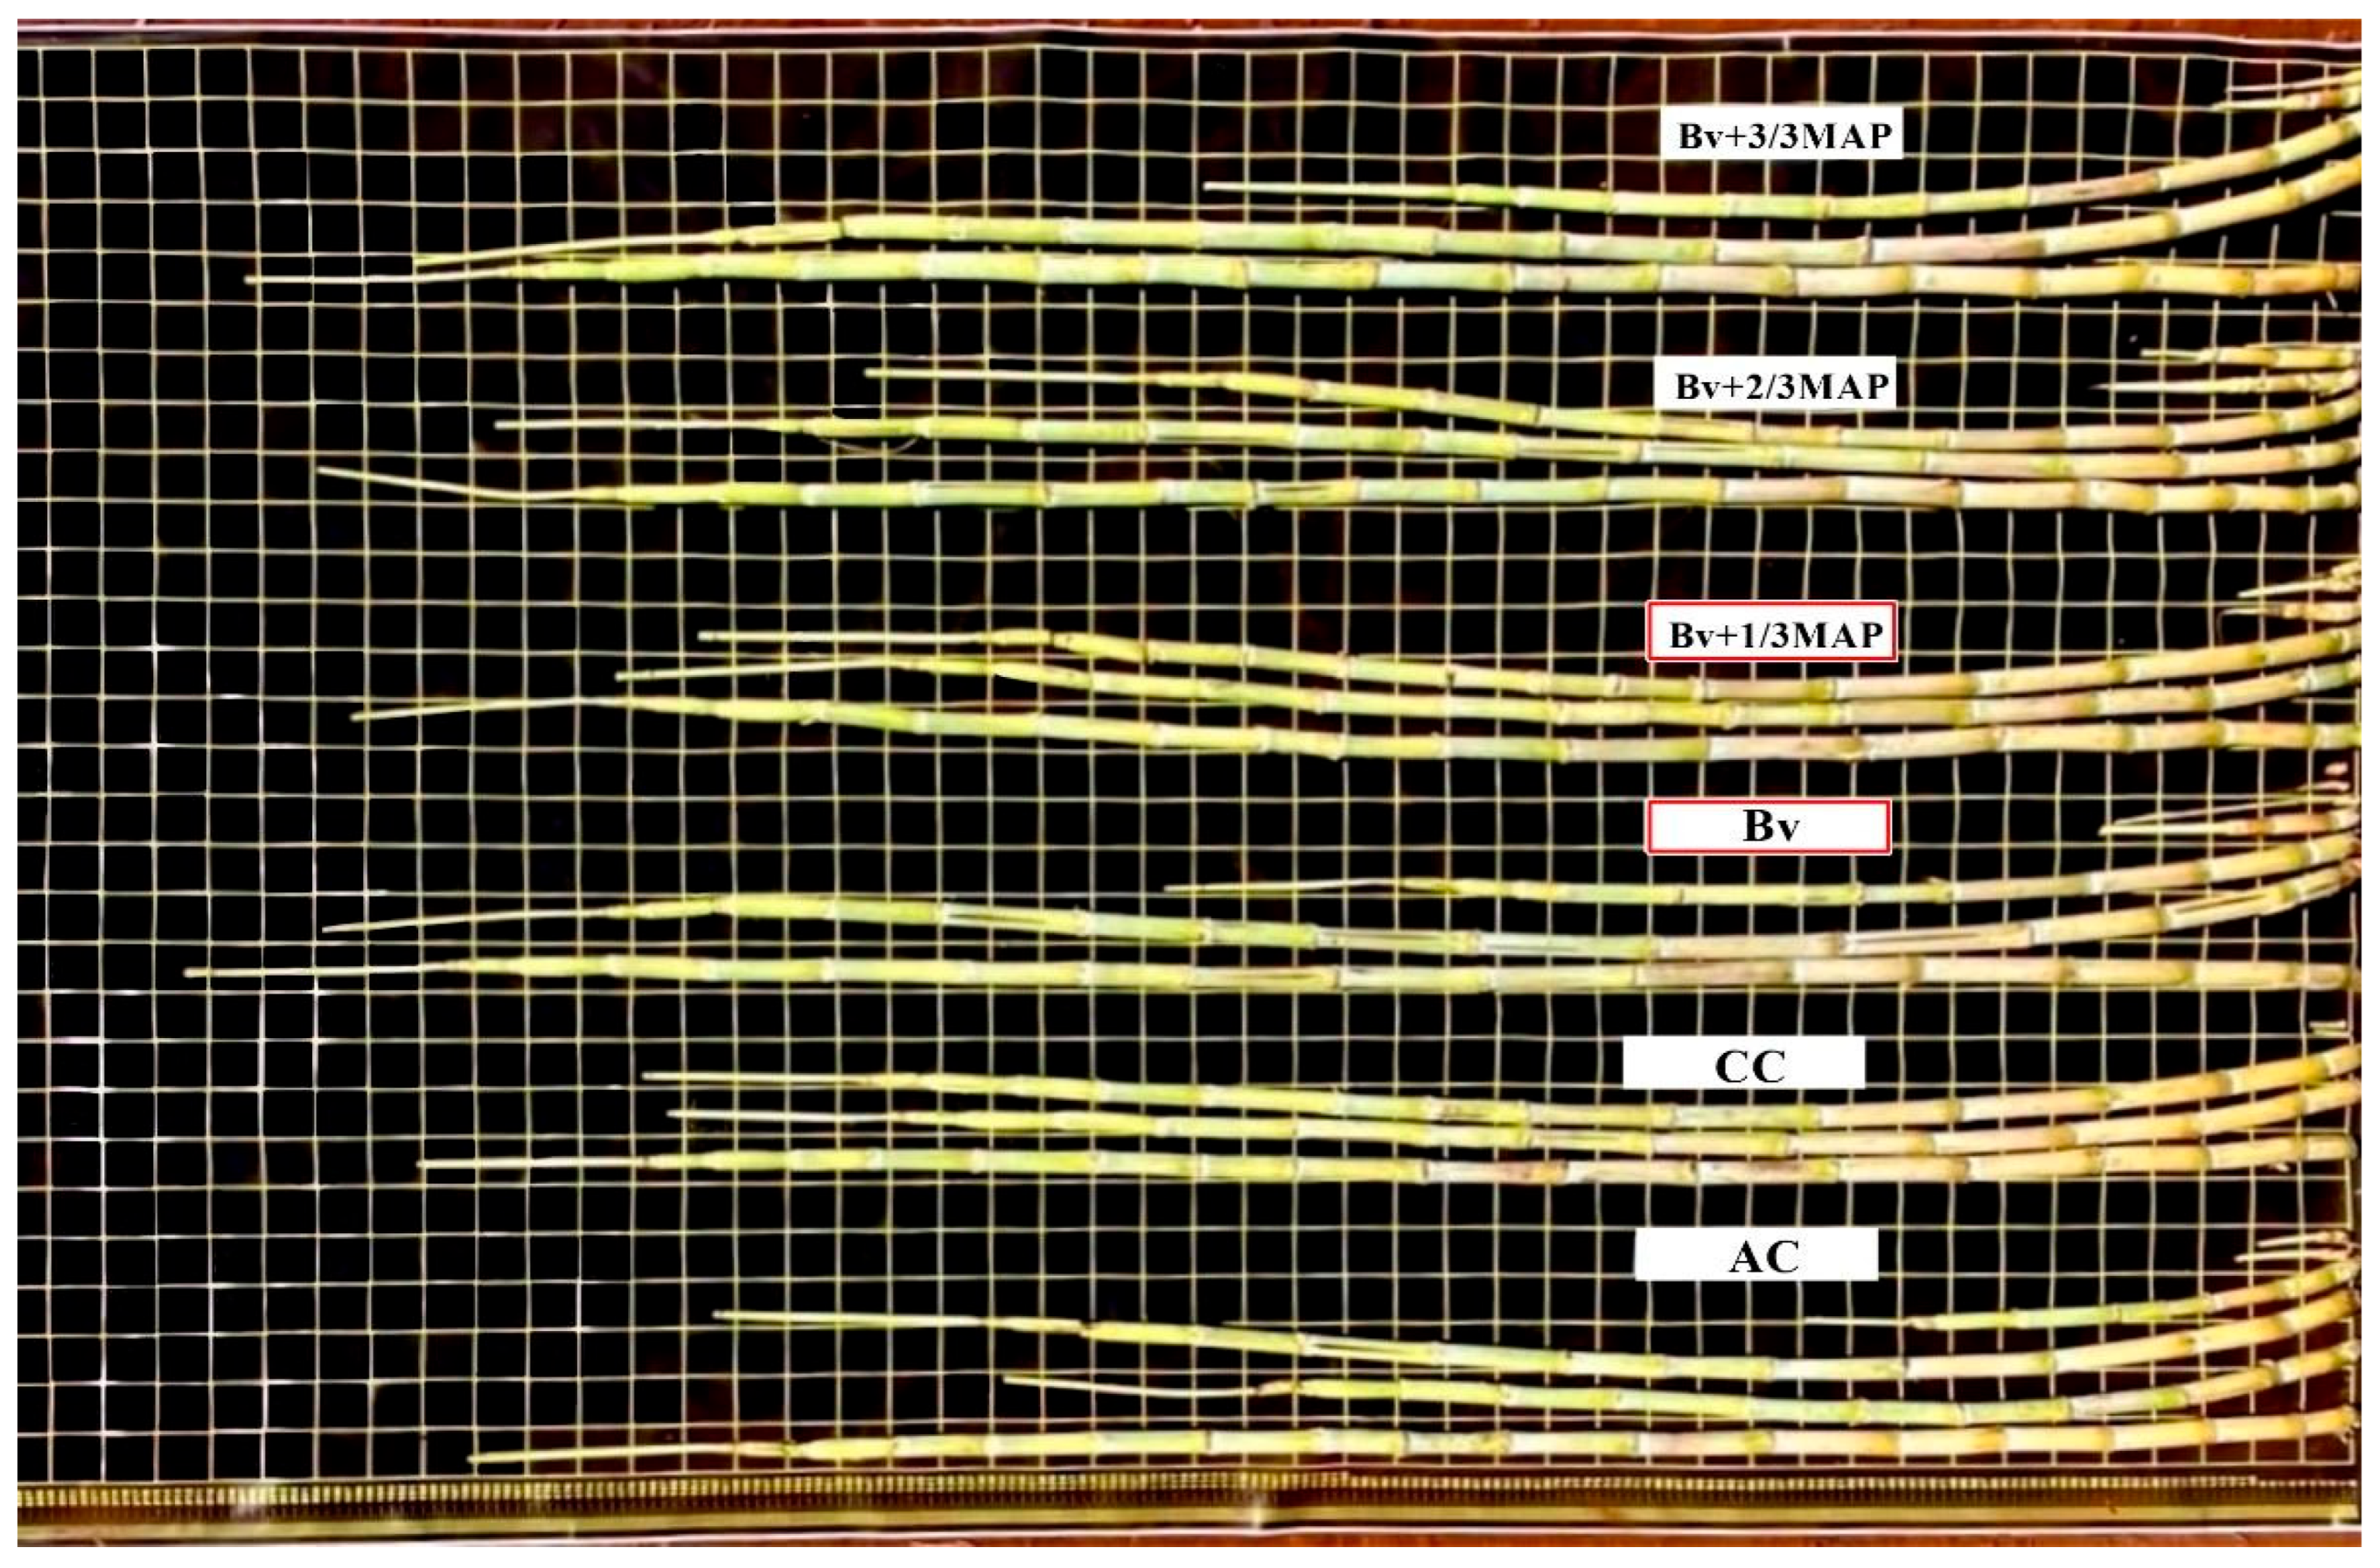
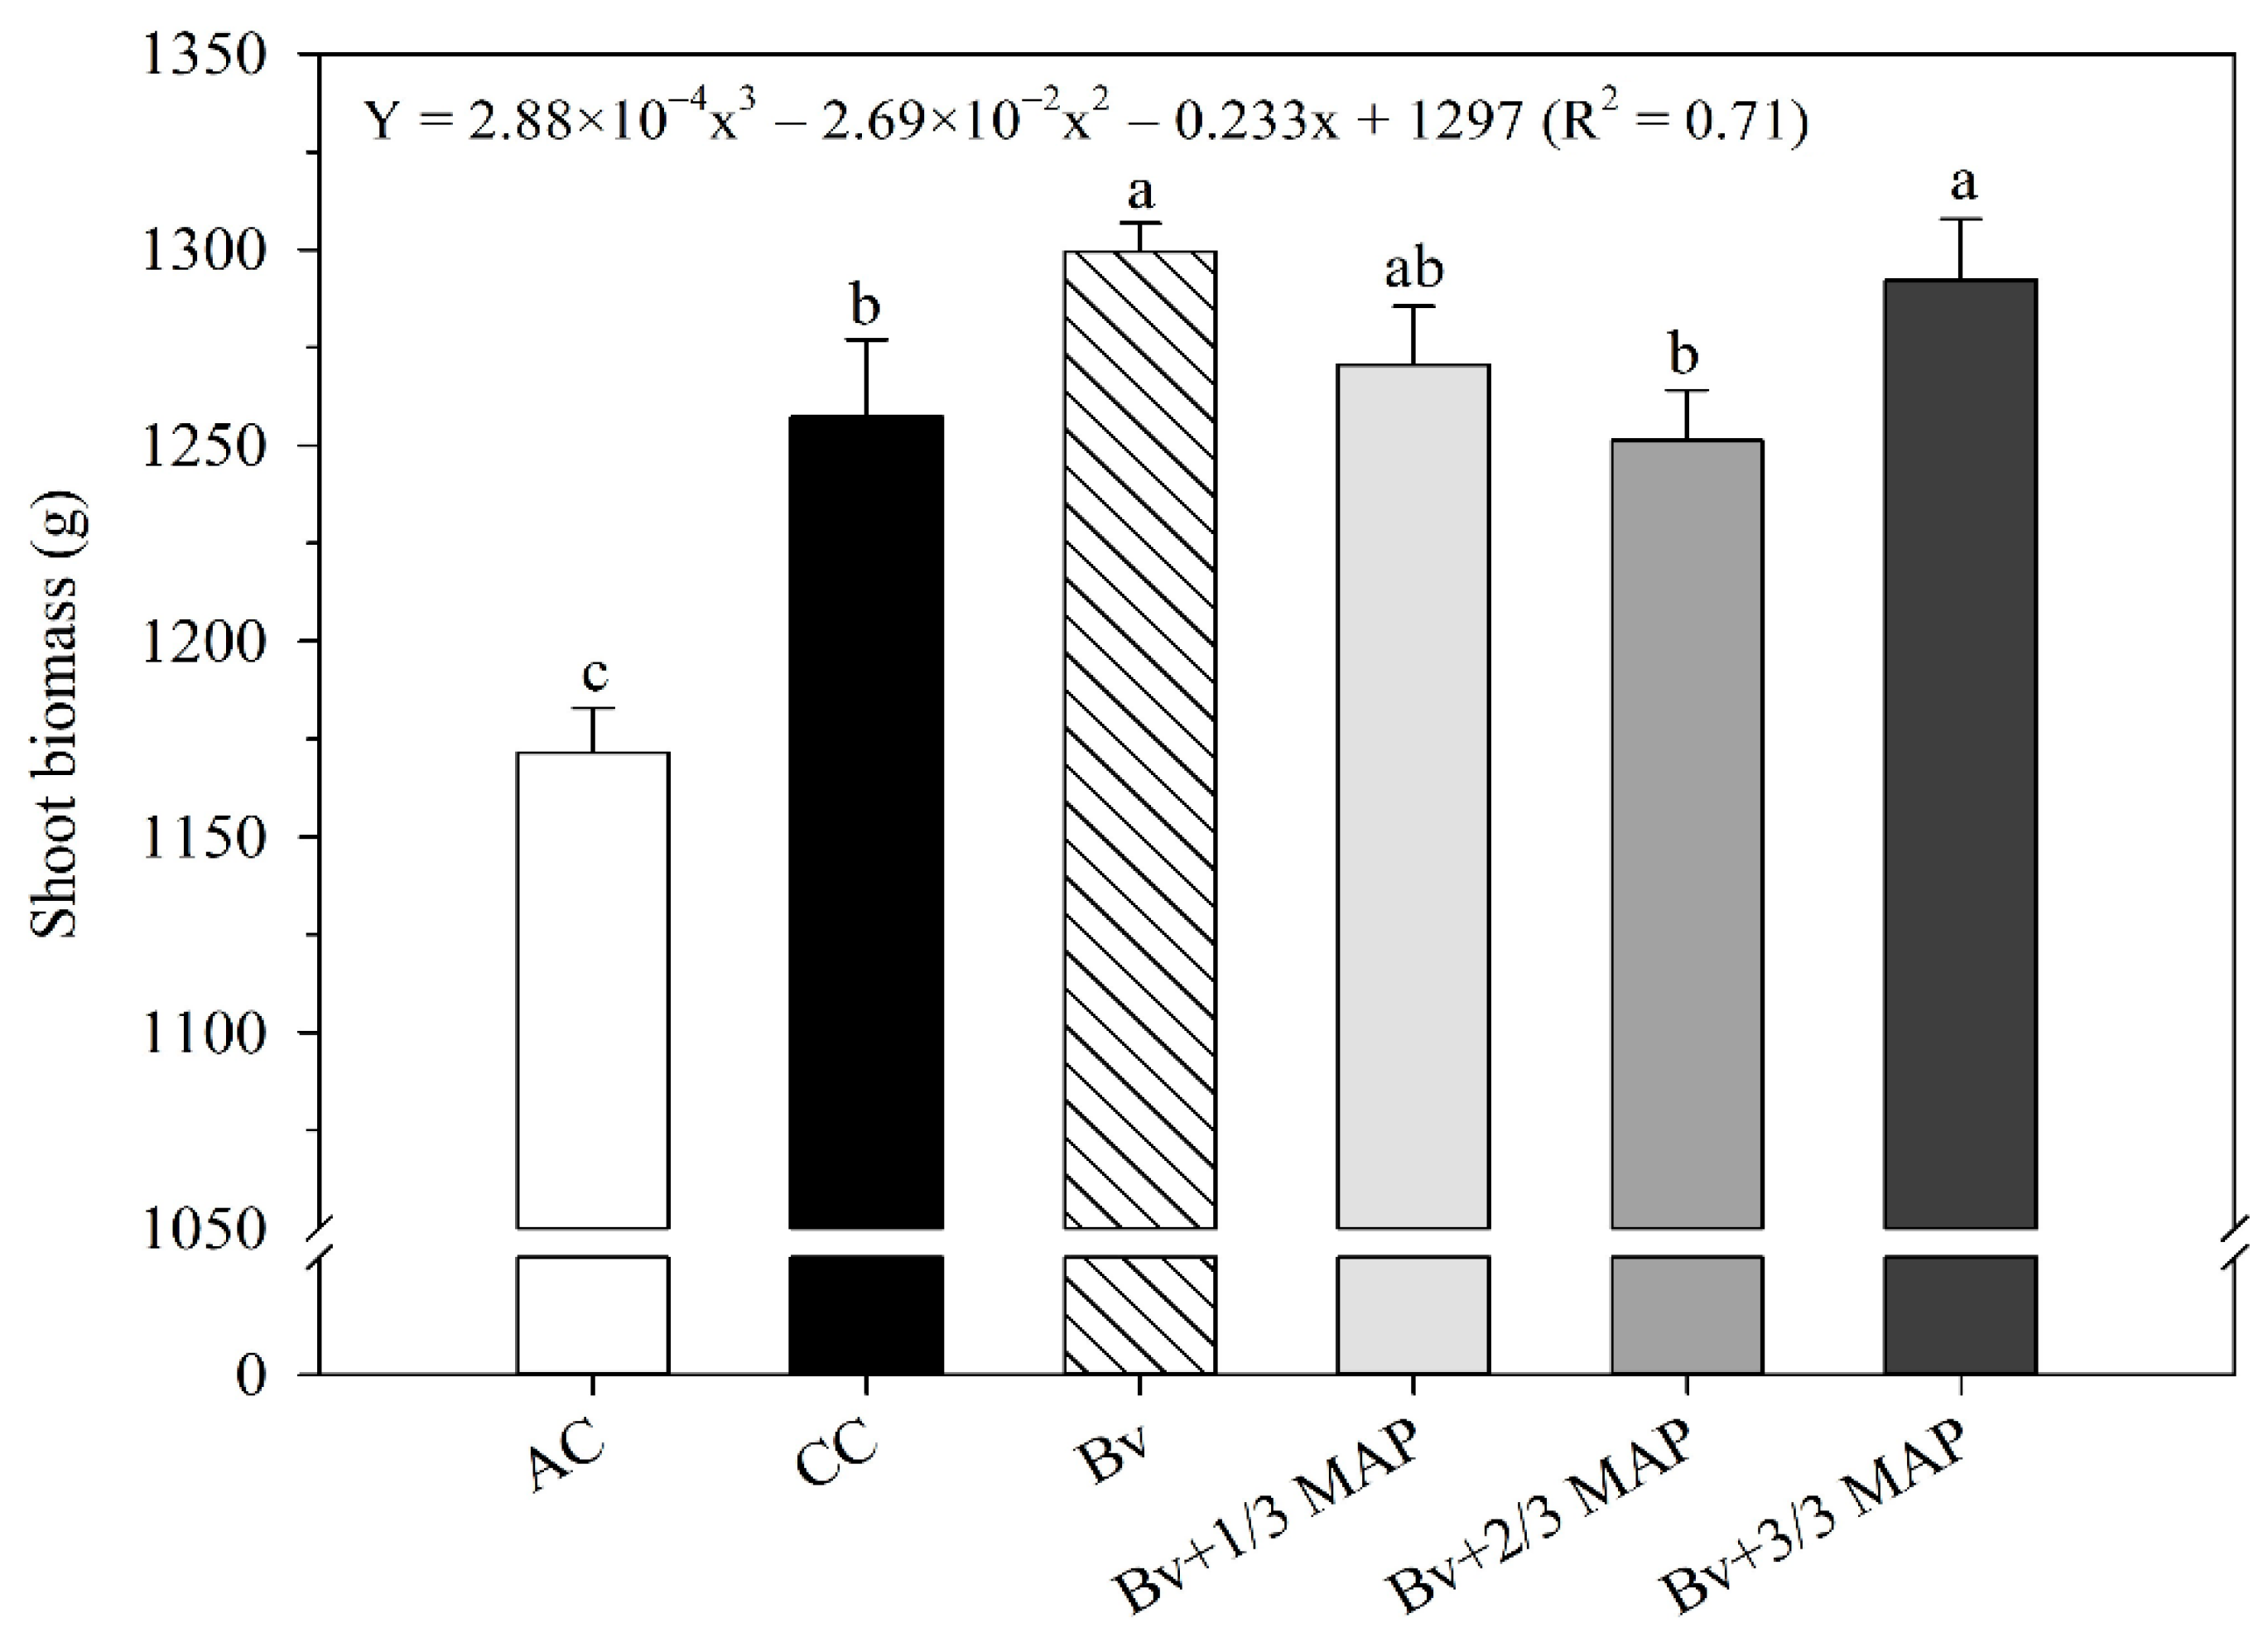
Using B. velezensis increased stalk growth (Figure 7), especially without MAP association, equivalent to the association of Bv + 3/3 MAP. Sugarcane shoot biomass was measured to accurately demonstrate the impact of B. velezensis on production (Figure 8).
Sugarcane plants showed different responses to biomass production between the treatments inoculated and non-inoculated with B. velezensis and different MAP doses (Figure 8). The highest shoot biomass (SB) was observed in Bv and Bv + 3/3 MAP. However, Bv + 1/3 MAP and Bv + 2/3MAP were equivalent to CC, showing that inoculation with the UFV 3918 strain allowed reducing the P dose without harming biomass production (Figure 8). Bv provided 3.2% and 4% higher SB than CC and Bv + 2/3 MAP, respectively. Regarding Bv + MAP doses, as the P dose increased, there was a subtle decrease in SB up to 66% of the recommended MAP dose, followed by a slight increase with 100% of the MAP dose (0.71 *).

2.5. Principal Component Analysis

Eigenvalues and their corresponding eigenvectors were derived from the correlation matrix of variable pairs within each group (stomatal density, photochemistry, gas exchange, photosynthetic pigments, and leaf biochemistry) for principal component analysis.
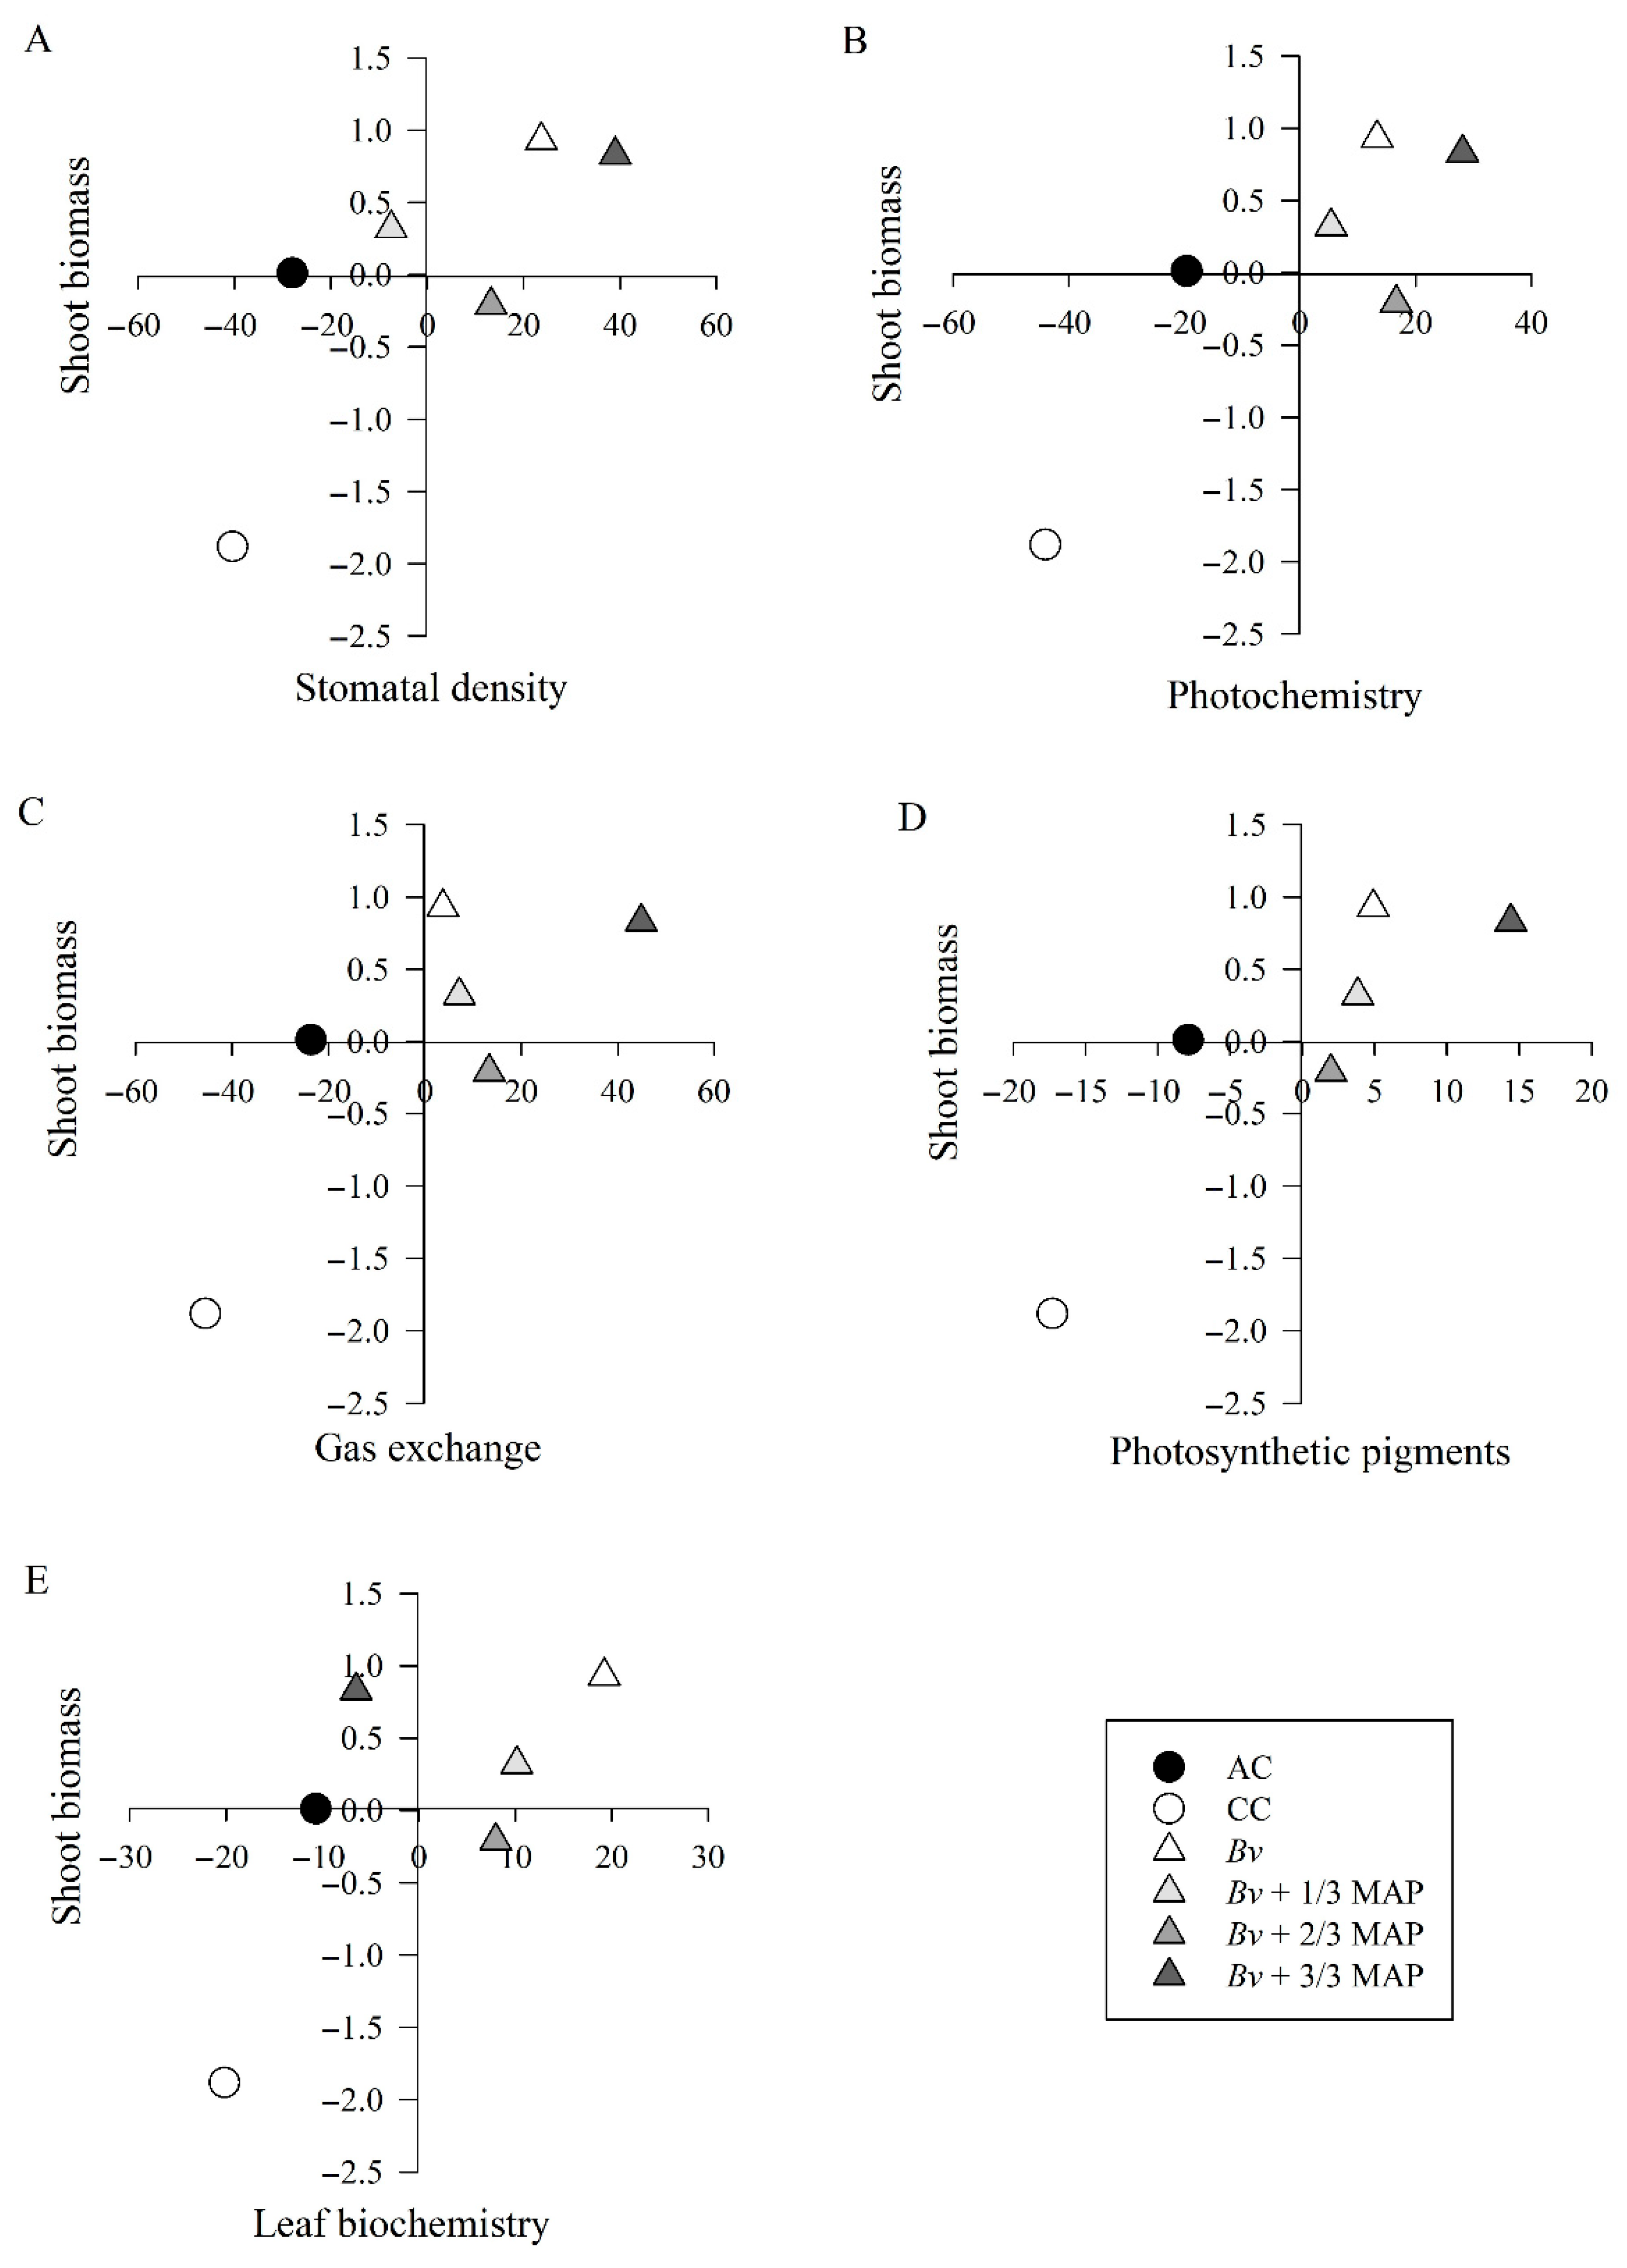
The first principal component accounted for over 70% of the variance across all variable groups (Table 2) and was solely used to interpret the results. Among all the variables analyzed, stomata density on the abaxial surface at 120 DAP (SDAB 120 DAP), electron transport rate at 180 DAP (ETR 180 DAP), intercellular CO2 concentration (Ci) at 60 and 180 DAP, chlorophyll a and total chlorophyll content at 60 DAP (Chla 60 DAP and Chl total 60 DAP), and leaf acid phosphatase activity were the characteristics that explained the most of the respective components (Figure 9), with loadings of 0.56, 0.73, –0.71, –0.55, 0.58, 0.67, and 0.98, respectively.
The two-dimensional dispersion of the treatments showed differences between the inoculated (Bv, Bv + 1/3 MAP, Bv + 2/3 MAP, and Bv + 3/3 MAP) and non-inoculated (AC and CC) treatments for all variable groups. Plants inoculated only with B. velezensis (Bv) showed a higher potential for shoot biomass production than those without inoculation and similar to those inoculated in association with the highest MAP dose (Bv + 3/3 MAP) (Figure 10). Shoot biomass production in Bv (1297.02 g plant−1) was associated with higher SDAB (Figure 9A), higher ETR (Figure 9B), lower Ci and higher A (Figure 9C), higher Chla and total Chl contents (Figure 9D), and higher leaf acid phosphatase activity (Figure 9E).
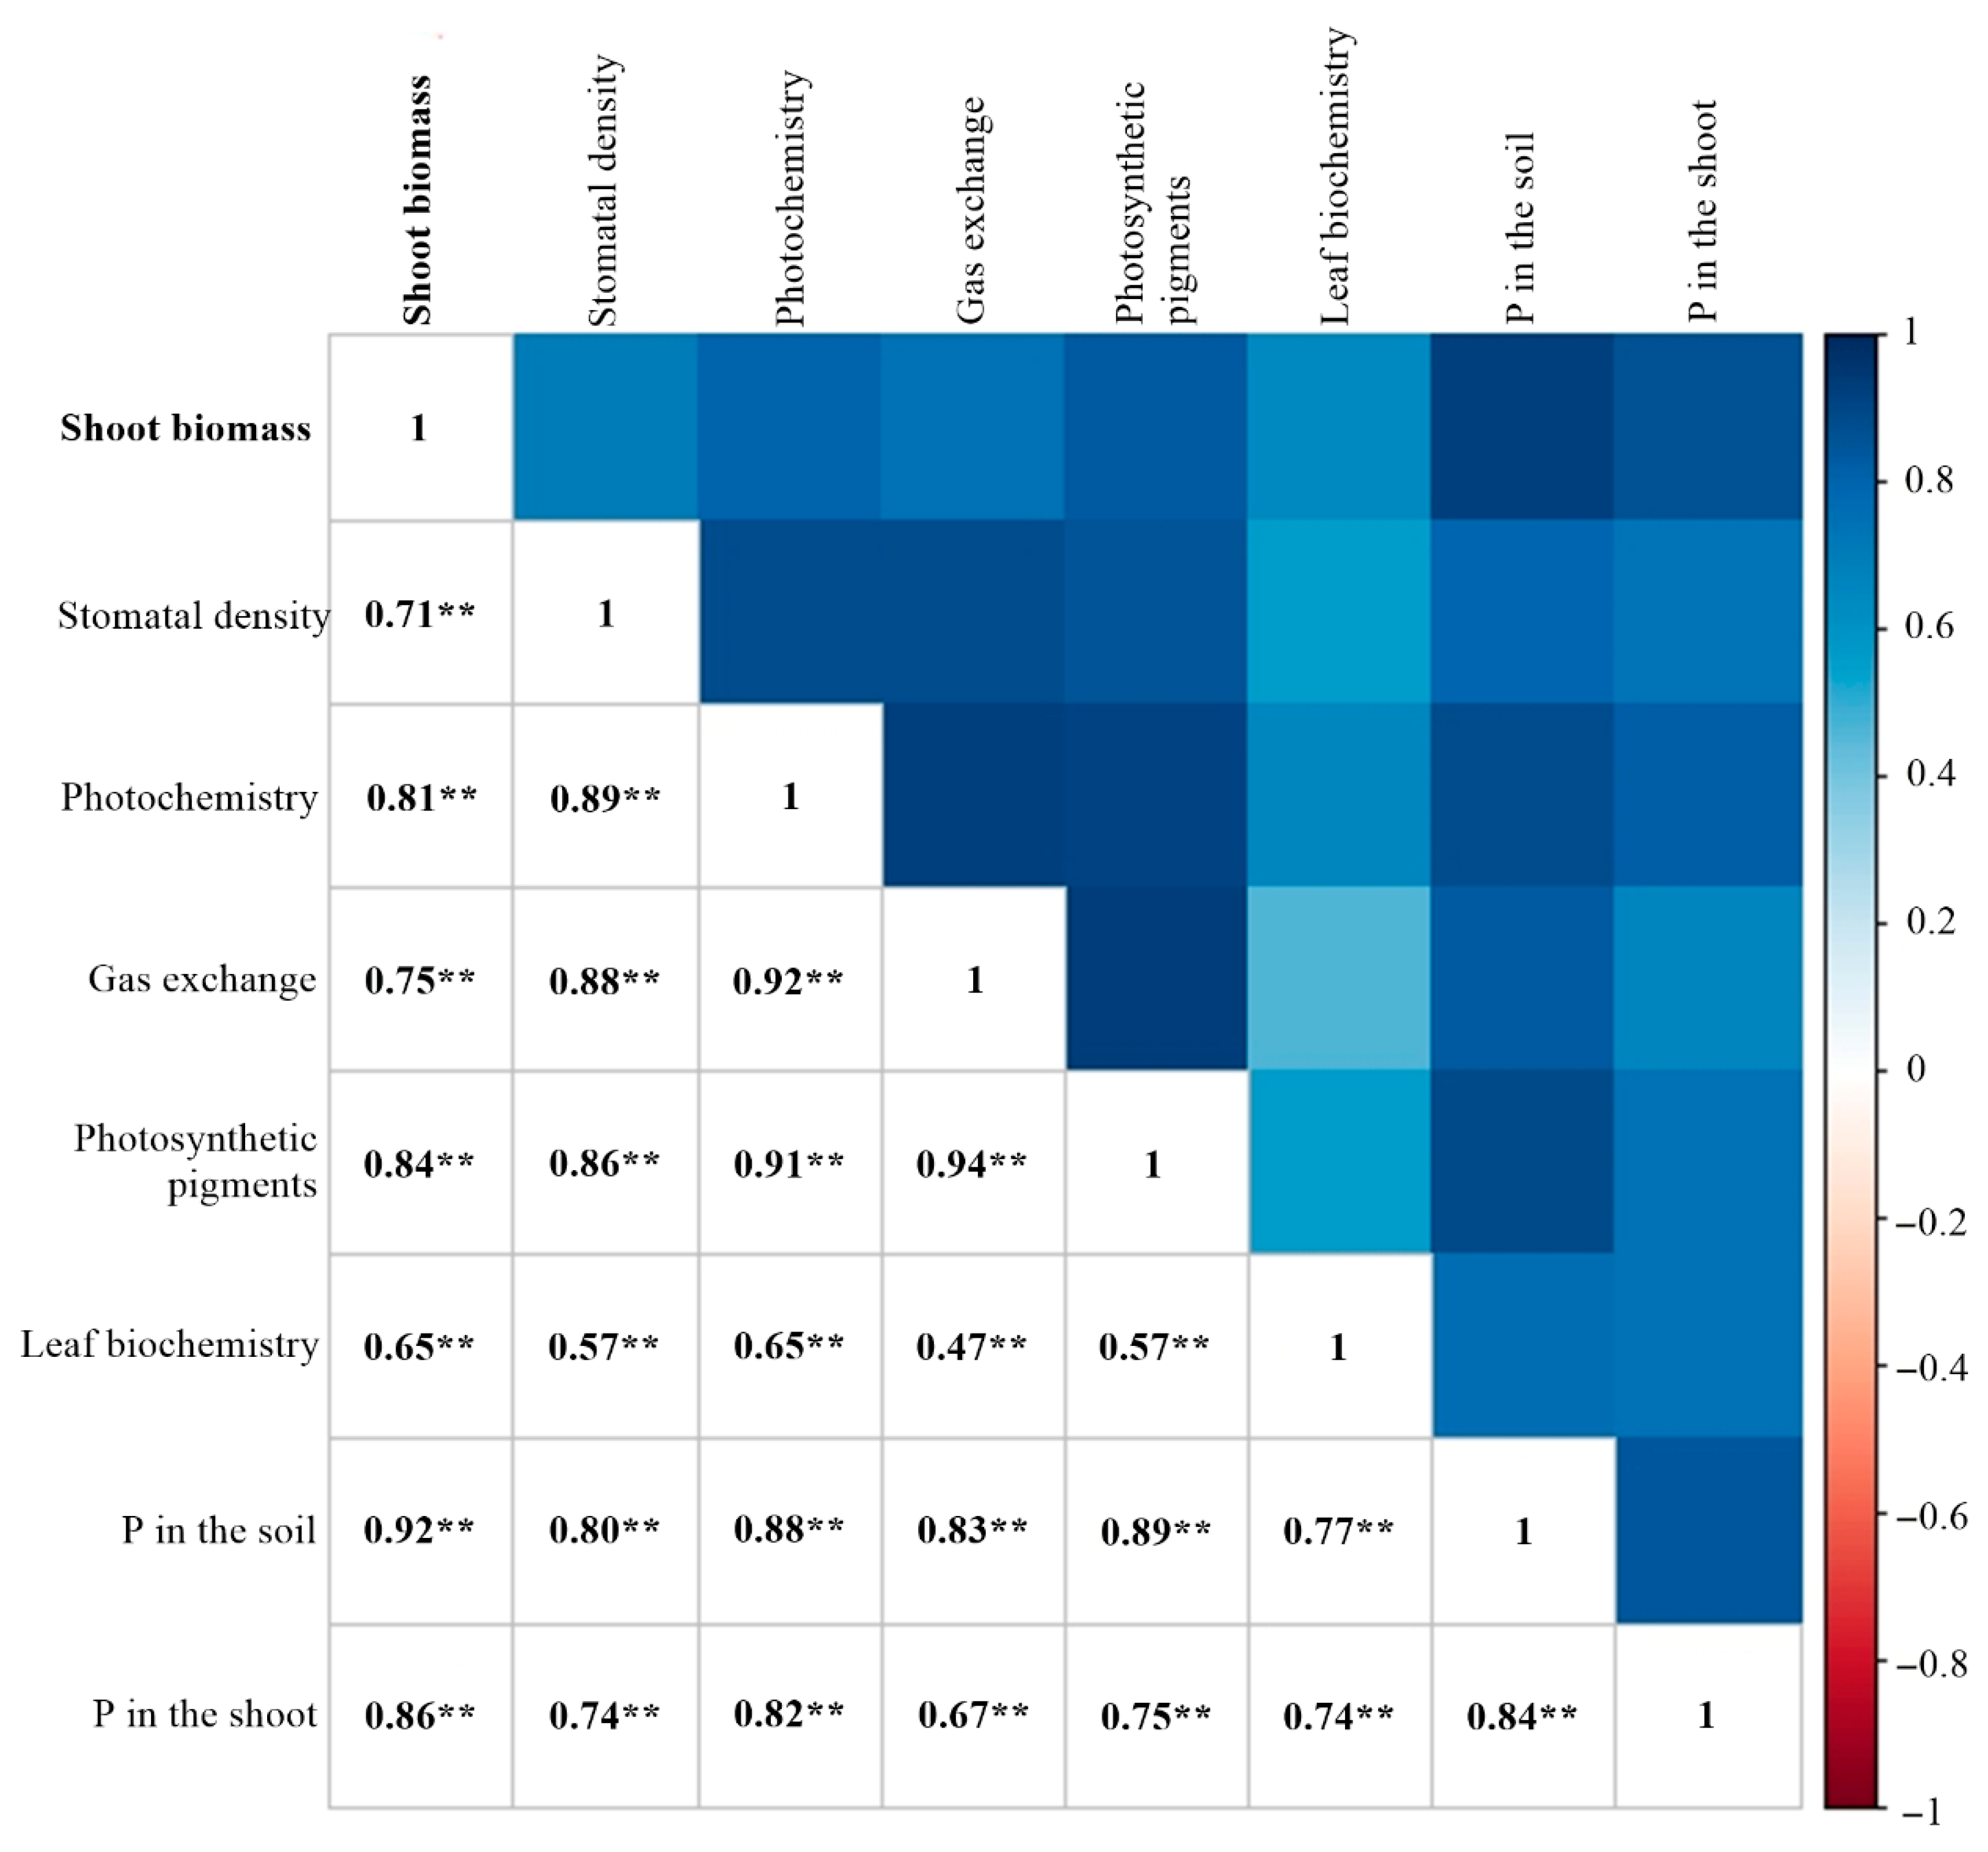
Based on Pearson’s correlation analysis (Figure 11), it was observed that the variable groups stomatal density (0.71), photochemistry (0.81), gas exchange (0.75), photosynthetic pigments (0.84), and leaf biochemistry (0.65) showed a significant correlation (p ≤ 0.01) with shoot biomass production (Figure 11). In addition, all sets of variables had a significant positive correlation.
In general, higher stomatal density was associated with higher electron transport rates, lower intercellular CO2 concentrations and higher net CO2 assimilation rates, higher photosynthetic pigment content, and higher leaf acid phosphatase activity, all of which contributed to higher biomass production (Figure 9 and Figure 11).

3. Discussion

Bacillus spp. strains are widely recognized as efficient phosphate-solubilizing bacteria (PSBs) [41,42,43,44]. Beyond enhancing plant growth, yield, and soil fertility [43,45,46], these microorganisms possess notable advantages, including inherent stability, resilience to adverse environmental conditions, and long shelf life [47,48,49], making them suitable for agricultural applications. Several studies have shown that combining PSBs with P fertilizers can reduce soil P adsorption and enhance P availability [45,50,51,52,53]. However, the dynamics between PSBs and reduced P doses remain an open research area.
Our findings shed light on sugarcane development during the first six months of growth, revealing that B. velezensis UFV 3918, whether applied alone or combined with reduced MAP doses, improved physiological, biochemical, and production traits.
Soil P status significantly influences plant metabolism, root exudation, and soil carbon availability for microorganisms [54,55]. Consequently, P fertilization can substantially alter P renewal efficiency [56] and regulate microbial communities as well as bacterial genes encoding enzymes involved in the P renewal cycle [57]. In unfertilized soils, PSBs typically increase P solubilization activity due to restricted inorganic P availability [58,59]. However, P fertilization may change the abundance of specific bacterial families [60,61]. Thus, the high initial soil P content (61.8 mg dm−3) may have limited the apparent synergistic effect between MAP and PSB. Readily available P often suppresses microbial phosphate-solubilization pathways and reduces the selective advantage of inoculated Bacillus strains [60,61].
This helps explain why B. velezensis without MAP performed better than its combination with 1/3 or 2/3 MAP for most variables. The superior results obtained with the full MAP dose (Bv + 3/3 MAP) probably reflect the high solubility of MAP itself rather than a synergistic effect with the bacterium. Thus, our data suggest that 2/3 MAP may represent a threshold beyond which chemical fertilization masked bacterial benefits. As B. velezensis + MAP doses were combined, there was an increase in the plant photosynthetic activity compared to the commercial control, but these treatments did not outperform Bv. Accordingly, the greater P availability observed under B. velezensis without MAP reflects stimulation of solubilization pathways under high baseline P conditions. This finding reinforces the potential of PSBs to reduce P inputs while maintaining plant performance.
Inoculation also influenced leaf physiology. PSBs are frequently associated with increased leaf area [62,63], which favors light interception and photosynthesis. Photosynthetic pigment content in leaves indicates photosynthetic capacity and physiological plant status [64,65,66,67]. Chlorophylls are the primary pigments that capture light energy and drive electron transport, thereby sustaining photosynthetic reactions [68,69]. Carotenoids complement this process by broadening the light absorption spectrum, protecting against photo-oxidation through the xanthophyll cycle, and stabilizing photosynthesis [68,69,70,71].
Enebe and Babalola [72] note that plant growth-promoting bacteria (PGPB) support the stability of photosynthetic pigments. In this study, inoculated plants exhibited higher contents of Chla, total Chl, and an increased Chla/Chlb ratio, suggesting enhanced chlorophyll biosynthesis. Elevated Chla levels, the primary pigment responsible for converting light energy into chemical energy, relative to Chlb, which primarily absorbs and stores light energy, indicate improved light energy utilization in inoculated plants. Notably, Chla emerged as one of the most influential variables contributing to shoot biomass production. Similar increases in photosynthetic pigment content following inoculation with Bacillus strains have been reported in crops such as sugarcane [38,73], corn [74,75,76], wheat [77], and soybean [78].
In contrast, non-inoculated plants without phosphate fertilization displayed reduced pigment contents, a response previously described as a protective mechanism to limit excess light absorption under P deficiency [79,80,81]. The higher carotenoid contents at 60 and 120 DAP observed in inoculated plants further suggest enhanced protection of the photosynthetic apparatus against photo-oxidative stress [82,83].
Among the treatments, AC showed the lowest ETR, φPSII, and Fv/Fm values, indicating greater susceptibility to photo-oxidative damage and reduced photochemical efficiency, underscoring the negative impact of P deficiency on photosynthetic performance. On the other hand, inoculated plants maintained higher ETR values at 60 and 180 DAP, reflecting the effective functioning of the electron acceptors in the biochemical phase of photosynthesis; the increase in ETR indicates a highly oxidized state of the quinone A (QA) acceptor, facilitating the use of excitation energy for electron transport. This process helps reduce the generation of reactive oxygen species, thereby preventing photo-oxidation [84,85,86].
Since ϕPSII is intrinsically linked to non-cyclic electron transport rates, the higher ϕPSII observed in Bv corresponds to increased ETR and enhanced photosynthetic rates. Along with Fv/Fm, ϕPSII is a reliable indicator of plant performance under various stress conditions [87,88]. This relationship explains why ETR emerged as a critical variable for shoot biomass production. Similar increases in ETR have been reported in crops inoculated with Bacillus spp., including pepper [89,90], sugar beet [91], sugarcane [92], and wheat [93].
The reduced Fv/Fm and qP values in AC suggest the accumulation of reduced QA in the PSII reaction center, impairing photochemical efficiency in leaves with lower P contents [81] and decreasing net CO2 assimilation. This finding corroborates earlier studies demonstrating the adverse effects of P deficiency on photosystems [80,81,94]. In contrast, the higher Fv/Fm and qP values observed in inoculated plants indicate greater directing of light energy to photochemistry, promoting ETR for carbon fixation, allowing most of the reducing power to be allocated to the carbon assimilation process, boosting biomass accumulation [95].
At 180 DAP, inoculated plants also showed 21.5% higher NPQ than non-inoculated plants. While NPQ is often interpreted as a sign of energy dissipation and reduced efficiency [96], our results demonstrate that elevated NPQ occurred in parallel with greater biomass, suggesting a protective role that sustained photochemical integrity under variable conditions. This is consistent with the notion that NPQ and qP jointly reduce O2 production in PSII antenna complexes, mitigating photo-inhibition [97,98,99].
The Fv/Fm ratio is a reliable indicator of photosynthetic performance, representing the maximum efficiency of light absorption by PSII for QA reduction [100,101]. Plants inoculated with B. velezensis had increased Fv/Fm values compared with non-inoculated plants, ranging from 0.80 to 0.86, values typical of healthy and non-stressed plants [95,102]. These results confirm that the UFV 3918 strain did not impair photosynthetic capacity but supported its maintenance. Similar increases in Fv/Fm after inoculation with PGPB have been reported in several crops [89,103,104].
Stomatal regulation balances CO2 uptake for photosynthesis and water loss through transpiration [105]. Stomatal conductance (gs) may be one of the main determinants of net CO2 assimilation (A) [106], and the rates of gs are determined by stomatal anatomical features, including density and size, and stomatal functional aspects [107]. Studies on Arabidopsis have shown that increased stomatal density (SD) can enhance gas exchange. Tanaka et al. [108] reported that higher SD increased gs and A under constant and saturated light conditions. Similarly, Sadoka et al. [109] observed that elevated SD accelerated A induction under fluctuating light, attributed to a higher initial gs value and a more rapid gs response during the early phase of photosynthetic induction.
Bacillus velezensis inoculation promoted an increase in SD, especially SDAB, resulting in greater gs and, consequently, higher A. Our findings align with those of Cappellari et al. [110], who reported increased SD in peppermint plants inoculated with B. subtilis GB03, and Silva et al. [111], who found that higher SDAB enhanced A in some sugarcane varieties under both hydrated and water-deficit conditions.
Intercellular CO2 concentration (Ci) is critical for maximizing photosynthesis but depends on crop species and environmental conditions [112]. In our study, Ci emerged as the most critical physiological variable for shoot biomass production, showing an inverse relationship with A and carboxylation efficiency (CE). The lowest Ci values were observed in plants treated with B. velezensis, indicating that a higher proportion of CO2 was being assimilated. Similarly, Wang et al. [113] reported increased Ci under lower P doses in cotton cultivars, with concurrent increases in A and reductions in Ci under higher P availability.
Typically, higher gs values result in lower water use efficiency (WUE), potentially diminishing the benefits of increased photosynthetic performance for biomass production [108,114]. However, the balance between A and transpiration rate (E) was maintained despite the rise in gs induced by B. velezensis. This balance led to an increase in WUE at 60 DAP in inoculated plants. In contrast, no significant effect of the UFV 3918 strain on WUE was observed at 120 and 180 DAP, demonstrating the strain’s benefit to the photosynthetic apparatus.
The transient increase in WUE may be linked to Bacillus’s exopolysaccharide (EPS) secretion, which improves soil water retention [115,116,117]. Such mechanisms have also been associated with improved WUE in corn [118] and sugarcane propagated via pre-sprouted seedlings [119], correlating directly with higher root dry matter in inoculated plants. In sugarcane, Bacillus spp. have been shown to enhance CE by increasing A and the use of substomatal CO2 [38], highlighting the UFV 3918 strain’s role in improving CO2 flow to carboxylation sites and facilitating substrate metabolism for photoassimilate biosynthesis.
Most PSBs inhabit the rhizosphere, supported by root exudates derived from photosynthesis [120]. The enhanced CO2 assimilation and higher respiration (Rd) in plants inoculated with B. velezensis is likely to have promoted microbial activity and energy supply, contributing to greater biomass accumulation through improved carbon balance [121,122,123,124].
The role of biochemical adjustments was equally evident. Although P is essential for protein synthesis [8], B. velezensis inoculation did not enhance protein content and even reduced it at high P doses. In contrast, its combination with low MAP doses increased total sugars, indicating that PSB helps maintain normal sugar metabolism under reduced P supply by ensuring adequate cytosolic phosphate (Pi) for sucrose synthesis [125]. Inoculated plants accumulated more total amino acids, compounds known to act as osmolytes that stabilize cellular metabolism under stress [126,127,128,129]. This aligns with reports that PSB inoculation enhances proline and related metabolites, supporting stress resilience.
Grasses respond to P deficiency with increased acid phosphatase activity in leaves, stems, and roots [130]. Inoculation with B. velezensis UFV 3918 increased leaf acid phosphatase activity by 16.4%, highlighting its phosphate-solubilizing potential and contribution to shoot biomass production. When combined with higher MAP doses, phosphatase activity decreased due to negative feedback from elevated cellular P levels, resulting from the high initial soil P content and phosphate fertilization [130,131]. It explains why this was the most important biochemical variable influencing shoot biomass production.
Phosphate-solubilizing bacteria release various organic acids capable of converting insoluble P forms into soluble ones. These organic acids chelate cations such as Al, Fe, and Ca, which are bound to P, using their hydroxyl and carboxyl groups to make P more accessible for plant uptake [132,133]. Additionally, these microorganisms facilitate the mineralization of organic P by producing hydrolytic enzymes, such as phosphatases, which catalyze the hydrolysis of phosphoester or phosphoanhydride bonds [44,134].
Enhanced P availability with B. velezensis inoculation was further supported by improved carboxylation efficiency, since net CO2 assimilation strongly depends on adequate P supply [8,135]. Biomass production behavior was strictly related to the soil P availability, which is confirmed by the high correlation of P in the soil with the variables stomatal density (0.80), photochemistry (0.88), gas exchange (0.83), photosynthetic pigments (0.89), leaf biochemistry (0.77) and, consequently, shoot biomass (0.92). Since more than 90% of crop biomass derives from photosynthetic products [136], these results underscore the central role of photosynthesis and respiration in sustaining growth. Consequently, the strong relationship between plant growth, photosynthesis, and respiration helps explain the higher shoot biomass verified in Bv and Bv + 1/3 MAP treatments.
Beyond P solubilization, PSBs promote plant growth through additional mechanisms, including the biosynthesis of phytohormones and secondary metabolites [137,138,139]. Specifically, Bacillus spp. have been reported to produce auxins, gibberellins, and expansins [140], which enhance plant growth and development. These mechanisms probably supported the enhanced shoot biomass observed with UFV 3918, particularly in combination with reduced MAP doses (Bv and Bv + 1/3 MAP). Several studies support the growth-promoting effects of PGPB, including PSBs, on sugarcane productivity; inoculation with PGPB enhanced both growth and yield [24,40,58,119,141].
Finally, it is important to note that this study was conducted in a greenhouse using pots. Such controlled conditions allow a detailed understanding of plant–microbe interaction mechanisms. To confirm the broader applicability and agronomic relevance of UFV 3918, future studies under field conditions, which present greater variability in soil, climate, and microbial populations, are warranted.
In summary, inoculation with B. velezensis UFV 3918, either alone or with reduced MAP doses, enhanced phosphate solubilization efficiency, improved photosynthetic performance, and regulated cellular metabolism, culminating in increased sugarcane biomass. These findings demonstrate the potential of this strain to optimize sugarcane production under lower P inputs, while reinforcing the need for field validation.

4. Materials and Methods

4.1. Cultivation Conditions, Plant Material, Experimental Design, and Treatments

The experiment was carried out between November 2021 and May 2022 in a greenhouse at the Department of Crop Production, School of Agricultural Sciences—FCA/UNESP, located in Botucatu, São Paulo, Brazil (22°51′01” S, 48°25′55” W, 786 m above sea level).
Temperature and humidity data were continuously monitored using a data logger (Instrutherm, HT-500, São Paulo, SP, Brazil). During the experiment, the air temperature inside the greenhouse ranged from 12.5 to 32.0 °C, with an average of 21.2 °C, 23.4 °C, 21.6 °C, 19.2 °C, and 18.0 °C at planting, 1st evaluation (E1), 2nd evaluation (E2), 3rd evaluation (E3), and harvest, respectively (Figure 12). Relative humidity during the cultivation cycle ranged from 60.4 to 88.1%, with an average of 76.5%, 86.4%, 82.9%, 70.9%, and 75.6% at planting, E1, E2, E3, and harvest, respectively (Figure 12).
Plants were irrigated using a drip system (Netafim, PCJ-CNL 4 L/h, Ribeirão Preto, SP, Brazil), maintaining soil moisture at 90% of the pot’s water retention capacity. The water regime was monitored using a portable moisture meter (5TM ProCheck, Decagon Devices, Inc., Pullman, WA, USA).
According to granulometric analysis, the soil used was a dystrophic red latosol [142], characterized by a medium texture with 68.2% sand, 25.7% clay, and 6.1% silt. Solarization was employed to eliminate pathogens [143], minimizing interference from other microorganisms in plant development and phosphate solubilization.
After solarization and before treatment application, the soil had a pH (CaCl2) of 6.0, organic matter content of 40.1 g dm−3, and low exchangeable acidity (Al3+ = 0.7 mmolc dm–3), with potential acidity (H + Al) totaling 20.8 mmolc dm–3. The exchangeable potassium (K), calcium (Ca), and magnesium (Mg) concentrations were 0.6, 75.2, and 26.4 mmolc dm−3, respectively. The sum of bases (SB) was 102.2 mmolc dm−3, and the cation exchange capacity (CEC) reached 123.0 mmolc dm−3, resulting in a base saturation (V%) of 83.0%. Available phosphorus (Presin) was 61.8 mg dm−3, and sulfur (S) was 34.0 mg dm−3. Micronutrient concentrations were: copper (Cu) = 0.3, iron (Fe) = 22.7, manganese (Mn) = 0.7, zinc (Zn) = 1.2, and boron (B) = 0.2 mg dm−3.
Soil fertility was adjusted based on chemical analysis [144], with fertilizers incorporated into the soil at planting. Different fertilization strategies were adopted using varying doses of monoammonium phosphate (MAP, containing 60% soluble P in neutral ammonium citrate and 12% N), combined with fixed rates of KCl and urea. The recommended MAP dose treatment received 125 kg ha−1 of MAP (2.8 g pot−1), 250 kg ha−1 of KCl (5.635 g pot−1), and 36.12 kg ha−1 of urea (0.813 g pot−1). The 2/3 MAP treatment received 83.33 kg ha−1 of MAP (1.878 g pot−1), 46.3 kg ha−1 of urea (1.04 g pot−1), and the same KCl dose. The 1/3 MAP treatment received 41.7 kg ha−1 of MAP (0.939 g pot−1), 56.47 kg ha−1 of urea (1.272 g pot−1), and 250 kg ha−1 of KCl. The treatment without MAP received only urea (66.6 kg ha−1; 1.5 g pot−1) and KCl (250 kg ha−1; 5.635 g pot−1), without phosphorus addition at planting. Additionally, urea was top-dressed at 1.5 g pot−1 (equivalent to 30 kg N ha−1) before stalk formation, as recommended for medium-textured soils [144].
The sugarcane variety RB966928 was chosen for its extensive cultivation in Brazil, accounting for 17.7% of the planted area in São Paulo [145]. This variety is recognized for its rapid growth, robust sprouting, high tillering capacity, superior yields, and overall plant health.
A completely randomized design was used, consisting of six treatments: absolute control (AC, without MAP); commercial control (CC, recommended MAP dose or 3/3 MAP); Bacillus velezensis UFV 3918 (Bv); Bv + 1/3 MAP; Bv + 2/3 MAP; Bv + 3/3 MAP, with four replicates. Healthy buds of uniform size (approximately 5 cm long and 2 cm in diameter) were selected for sprouting standardization. Five buds were planted per 50 L pot containing 45 dm3 of soil. After sprouting, plants were thinned to one per pot to ensure uniformity.
Planting was carried out on 12 November 2021, with fertilizer applied at sowing. Bacterial inoculation consisted of preparing a solution containing 75 mL of water (pH 7.0) and 2 mL of a commercial formulation of B. velezensis strain UFV 3918 (1.0 × 10⁸ CFU mL−1; 7 g L−1). Each bud received 15.4 mL of this solution in bacterial treatments, while non-bacterial treatments included the same volume of water. The commercial formulation, recommended at a field application rate of 2 L ha−1 for sugarcane cultivation, was provided by Vittia (São Joaquim da Barra, São Paulo, Brazil).

4.2. Physiological Assessments

Physiological variables, including stomatal density, gas exchange, and chlorophyll a fluorescence, were assessed at 60, 120, and 180 days after planting (DAP) using the +1 leaf. This leaf, also referred to as the TVD leaf (top visible dewlap), is the first fully expanded leaf with a visible ligule and is considered the most photosynthetically active [146].
Stomatal counts were conducted using epidermal impressions obtained by applying a thin layer of clear nail polish to the abaxial and adaxial surfaces of the +1 leaf, parallel to the midrib. After drying, the nail polish was lifted with transparent adhesive tape, which was mounted on slides for analysis under an optical microscope (Biovideo, BEL Photonics, Monza, Italy) at 40× magnification. Stomatal counts were performed in an area of 0.0744 mm2 following the protocol of Mazumdar et al. [147].
Gas exchange variables—net CO2 assimilation rate (A), stomatal conductance (gs), transpiration rate (E), and intercellular CO2 concentration (Ci)—were measured in the central portion of the +1 leaf using an infrared gas analyzer (IRGA) (LI-COR Biosciences Inc., LI-6400XT, Lincoln, NE, USA). The leaf chamber was equipped with an artificial LED light source (6400-40 LCF, LI-COR; 90% red and 10% blue spectra) providing a photosynthetic photon flux density (PPFD) of 1500 μmol photons m–2 s–1, based on a previously established light-response curve. Measurements were performed between 9:00 am and 11:30 am under ambient CO2 concentration, temperature, and humidity conditions. Instantaneous water use efficiency (WUE) was calculated as the A/E ratio, and instantaneous carboxylation efficiency (CE) was calculated as the A/Ci ratio.
Chlorophyll a fluorescence and respiration (Rd) were measured at night (7:30 pm to 11:00 pm). Respiration was evaluated at sufficiently low irradiance (<1 μmol m−2 s−1) under ambient CO2, temperature, and humidity. Fluorescence variables were assessed using a 6400-40 leaf chamber fluorometer coupled to the IRGA. For light-adapted leaves, maximum fluorescence (Fm) was determined with a saturation pulse of 7000 μmol photons m−2 s−1 for 0.8 s, while actinic light was set at 200 μmol photons m−2 s−1. Dark-adapted maximum fluorescence (Fm) was obtained after a saturation pulse of 4200 μmol photons m−2 s−1 for 0.8 s, while minimum fluorescence (F0) was measured under <1 μmol m−2 s−1 irradiance. Potential quantum yield of PSII (Fv/Fm), maximum variable quantum yield of PSII (Fv/Fm), effective quantum yield of linear electron flow through PSII (φPSII), photochemical quenching (qP), non-photochemical quenching (NPQ), and relative electron transport rate (ETR) were calculated according to Schreiber et al. [148].

4.3. Biochemical Assessments

The contents of photosynthetic pigments (chlorophylls a, b, total, and carotenoids) were measured at 60, 120, and 180 days after planting (DAP). Two leaf discs (0.28 cm2 each) were collected from the +1 leaf using a punch, avoiding the midrib and leaf edges. The discs were immersed in dimethylformamide (DMF) for 48 h and protected from light. Subsequently, 1 mL of the pigment extract was diluted in 1 mL of deionized water, and absorbance readings were taken using a spectrophotometer (Shimadzu, UV-2700, Kyoto, Japan) at wavelengths of 480, 647, and 664 nm. Pigment concentrations were calculated using the method by Wellburn [149], and results were expressed in μg cm−2.
For the analysis of protein content, soluble sugars, amino acids, and acid phosphatase activity, +1 leaves were collected one week before harvest, frozen in liquid nitrogen, and stored at −80 °C (NUAIRE Inc., NU-9668GC, Plymouth, MN, USA). Soluble protein content was determined from 100 mg of leaf tissue macerated in liquid nitrogen and homogenized in 0.1 M potassium phosphate buffer (pH 6.8) containing 0.1 mM ethylenediamine tetraacetic acid, 1 mM phenylmethylsulfonyl fluoride, and 200 mg of polyvinylpyrrolidone. The homogenate was centrifuged at 5000× g for 10 min at 4 °C, and soluble proteins were quantified by mixing 20 μL of the supernatant with 5 mL of Coomassie Brilliant Blue G-250 solution. After 15 min, absorbance was measured at 595 nm (Shimadzu UV-2700, Kyoto, Japan), and protein concentrations were determined using a bovine serum albumin standard curve (1 mg mL−1). Results were expressed as mg g−1 fresh matter (FM) [150].
Soluble sugars were determined using 20 mg of freeze-dried leaf tissue. Samples were extracted in 4 mL of deionized water with stirring for 1 h, followed by centrifugation at 3000× g for 15 min. The supernatant was re-centrifuged at 6000× g for 10 min. A 0.5 mL aliquot of extract was mixed with 0.5 mL of 5% phenol (v/v) and 2.5 mL of sulfuric acid, stirred, and cooled in an ice tray. Absorbance readings were taken at 490 nm (Shimadzu, UV-2700), and concentrations were calculated following Dubois et al. [151]. Results were expressed in mg g−1 FM−1.
Total amino acids were determined using 20 mg of freeze-dried leaf tissue homogenized in 2 mL of 0.01 M Na-K-phosphate buffer (pH 7.6) with 0.1 M NaCl. After stirring for 1 h in trays with ice and centrifugation at 3000× g at 4 °C for 5 min, 1 mL of the supernatant was mixed with 1 mL of 10% (w/v) trichloroacetic acid and left for 1 h. The mixture was centrifuged at 12,000× g at 4 °C for 5 min, and the supernatant was used as a crude extract. A 0.5 mL aliquot was mixed with 0.25 mL of 0.2 M sodium citrate buffer (pH 5.0), 0.1 mL of 5% ninhydrin in 100% methylcellosolve (v/v), and 0.5 mL of 0.0002 M potassium cyanide in methylcellosolve (v/v). Samples were heated in a water bath at 100 °C for 20 min, cooled, and diluted with 3.65 mL of 60% ethanol (v/v). Absorbance was measured at 570 nm (Shimadzu, UV-2700) and compared with a glycine standard curve (0.1–1.0 μmol mL−1) [152]. Results were expressed in μmol g−1 FM−1.
Acid phosphatase activity (AP-EC 3.1.3.2) was measured in 500 mg of leaf tissue macerated in liquid nitrogen and homogenized in 0.1 M sodium acetate buffer (pH 5.6). Homogenates were centrifuged at 15,000× g at 4 °C for 20 min, and crude extracts were used. Enzyme activity was initiated by incubating 500 μL of extract with 200 μL of substrate (2 mM disodium p-nitrophenyl phosphate in 150 mM sodium acetate buffer, pH 5.6) at 37 °C for 10 min. The reaction was stopped with 300 μL of saturated Na2CO3. Absorbance was read at 400 nm (Shimadzu, UV-2700), and activity was expressed in nmol p-nitrophenyl phosphate (pNPP) min−1 mg−1 protein [153].

4.4. Phosphorus Content in the Soil and Shoot

Soil samples were collected at 0–0.15 m depth in May 2022. The sampled soil was then dried in a forced-air oven at 40 °C for 96 h and passed through a 2 mm sieve. Phosphorus (P) concentrations in the soil were analyzed according to van Raij et al. [154] methodology, extracted using ion exchange resin, and determined by spectrophotometry.
Nutrient diagnosis consisted of determining the nutrient content in samples of diagnostic leaves, i.e., +1 leaves [155,156]. In sugarcane, the +1 leaf is characterized as the first leaf with a fully open ligule, also known as the TVD leaf (top visible dewlap) [146].
At 180 DAP, the median portions of the +1 leaves were collected, discarding the central vein, the leaf sheaths of the +1 leaves, and the median portions of the main stalks. The sampled material was placed in a forced-air circulation oven at 60 °C until it reached a constant weight and then ground in a Willey mill. P was extracted by nitroperchloric digestion [157] and determined by spectrophotometry.
Shoot P accumulation was calculated using Formula (1), as follows:
P A c = S B × P C
where PAc is phosphorus accumulation (g plant−1), SB is shoot biomass (g), and PC is phosphorus concentration (g kg−1).

4.5. Shoot Biomass

At 180 days after planting (DAP), the plants were harvested and partitioned into leaves, leaf sheaths, stalks, and roots. Shoot biomass (SB) was calculated as the sum of the biomass of leaves, leaf sheaths, and stalks. Samples were dried in a forced-air circulation oven at 65 °C until reaching constant mass and subsequently weighed using a precision scale with 0.01 g accuracy (Balmak, ELC-6/15/30, Santa Bárbara d’Oeste, SP, Brazil).

4.6. Statistical Analysis

Data were tested for normality using the Shapiro–Wilk test and homoscedasticity using the Levene test. Once these assumptions were satisfied, analysis of variance (ANOVA) was performed using the F test, followed by Tukey’s test (p ≤ 0.05) for mean comparison. Statistical analyses were conducted using AgroEstat software (AgroEstat, version 2015, Jaboticabal, SP, Brazil). Biochemical and yield variables were further analyzed through regression adjustments to assess the effects of MAP doses associated with Bacillus velezensis (Bv, Bv + 1/3 MAP, Bv + 2/3 MAP, and Bv + 3/3 MAP) using Minitab software (Minitab®, version 19, State College, PA, USA).
Variables were organized into five distinct groups: stomatal density (SDAD and SDAB); photochemistry (ETR, Fv/Fm, φPSII, qP, NQP, and Fv/Fm); gas exchange (A, gs, Ci, E, Rd, WUE, and CE); photosynthetic pigments (Chla, Chlb, total Chl, Chla/Chlb, and carotenoids); leaf biochemistry (protein, total sugars, total amino acids, and leaf acid phosphatase); and biomass (SB). Principal component analysis (PCA) was applied to each variable group using the nonlinear iterative partial least squares (NIPALS) algorithm [158]. The minimum number of components explaining at least 70% of the total variability was selected for each group. The PCA scores from the five variable groups were compared with shoot biomass scores and represented in scatter plots, averaging values for each treatment. Pearson’s linear correlation coefficient (p < 0.01) was used to evaluate the relationship between each variable group’s main components, phosphorus in the soil and the shoot, and the sugarcane plants’ shoot biomass.

5. Conclusions

The inoculation of sugarcane buds with B. velezensis UFV 3918, either alone or combined with reduced doses of MAP (Bv, Bv + 1/3 MAP, and Bv + 2/3 MAP), led to an increase in P availability, which strongly correlated with physiological and biochemical variables. These treatments enhanced stomatal density, photosynthetic pigment contents, and relative electron transport rate. These factors improved net CO2 assimilation and carboxylation efficiency, increasing shoot biomass production. Additionally, the treatments boosted sugar and total amino acid contents and leaf acid phosphatase activity, reflecting the regulation of cell metabolism and the potential for P solubilization. In this study, the high initial soil P content allowed inoculation with B. velezensis to reduce phosphate fertilization without compromising the crop’s photosynthetic or productive performance. However, there was a tendency for production to decline when the strain was combined with higher MAP doses, suggesting that Bv + 1/3 MAP is the most suitable combination. This research demonstrates that inoculating sugarcane with B. velezensis UFV 3918 is a viable strategy for optimizing P use in sugarcane, supporting future research to reduce the use of phosphate fertilizers.

Author Contributions

Conceptualization, H.L.S. and M.d.A.S.; methodology, H.L.S.; software, G.F.d.S. (Gustavo Ferreira da Silva 2) and L.d.S.F.; validation, H.L.S.; formal analysis, H.L.S. and G.F.d.S. (Gustavo Ferreira da Silva 2); investigation, H.L.S., G.F.d.S. (Gustavo Ferreira da Silva 1), M.R.A.C., and C.N.F.; resources, M.d.A.S.; data curation, H.L.S.; writing—original draft preparation, H.L.S.; writing—review and editing, H.L.S. and M.d.A.S.; supervision, M.d.A.S.; project administration, M.d.A.S.; funding acquisition, M.d.A.S. All authors have read and agreed to the published version of the manuscript.

Funding

This research was supported by FAPESP (Fundação de Amparo à Pesquisa do Estado de São Paulo) through a master’s fellowship to Hariane Luiz Santos (Grant Number: 2021/02991–0) and by FEPAF (Fundação de Estudos e Pesquisas Agrícolas e Florestais) (Grant Number: 1226).

Data Availability Statement

Once all the data have been published, the data supporting this study’s findings will be available in a repository [UNESP] at http://hdl.handle.net/11449/242558 (accessed on 19 August 2025), reference number S237s. The data are available from the corresponding author upon reasonable request.

Acknowledgments

M.d.A.S., G.F.d.S. (Gustavo Ferreira da Silva 1), and C.N.F. would like to thank CNPq (Conselho Nacional de Desenvolvimento Científico e Tecnológico) for the “Research Productivity” (Proc. 307457/2022–2), “Scientific Initiation” (Proc. 121804/2021–6), and “PhD” (Proc. 147303/2023–0) grants, respectively. In addition, we would like to thank CAPES (Coordenação de Aperfeiçoamento de Pessoal de Nível Superior) for the PhD fellowship for M.R.A.C. and L.d.S.F. (funding code 001).

Conflicts of Interest

The authors declare that the research was carried out in collaboration with Vittia (São Joaquim da Barra, SP, Brazil), which provided the product and technical support and is interested in the product’s performance at a biological level.

References

  1. Bordonal, R.O.; Carvalho, J.L.N.; Lal, R.; Figueiredo, E.B.; Oliveira, B.G.; La Scala, N. Sustainability of sugarcane production in Brazil: A review. Agron. Sustain. Dev. 2018, 38, 13. [Google Scholar] [CrossRef]
  2. Companhia Nacional de Abastecimento. Acompanhamento da Safra Brasileira de Cana-de-Açúcar: Safra 2023/2024—4° Levantamento. Available online: https://www.conab.gov.br/component/k2/item/download/52732_1ba60aad418c90b0a86daf409a3703a5 (accessed on 21 May 2024).
  3. Guignard, M.S.; Leitch, A.R.; Acquisti, C.; Eizaguirre, C.; Elser, J.J.; Hessen, D.O.; Jeyasingh, P.D.; Neiman, M.; Richardson, A.E.; Soltis, P.S.; et al. Impacts of nitrogen and phosphorus: From genomes to natural ecosystems and agriculture. Front. Ecol. Evol. 2017, 5, 70. [Google Scholar] [CrossRef]
  4. Lizcano-Toledo, R.; Reyes-Mantín, M.P.; Celi, L.; Fenández-Ondoño, E. Phosphorus dynamics in the soil–plant–environment relationship in cropping systems: A review. Appl. Sci. 2021, 11, 11133. [Google Scholar] [CrossRef]
  5. Marschner, H. Mineral Nutrition of Higher Plants, 3rd ed.; Elsevier: London, UK, 2012. [Google Scholar]
  6. Teixeira, W.G.; Sousa, R.T.X.; Korndörfer, G.H. Response of sugarcane to doses of phosphorus provided by organomineral fertilizer. Biosci. J. 2014, 30, 1729–1736. [Google Scholar]
  7. Albuquerque, A.W.; Sá, L.A.; Rodrigues, W.A.R.; Moura, A.B.; Oliveira Filho, M.S. Growth and yield of sugarcane as a function of phosphorus doses and forms of application. Rev. Bras. Eng. Agric. Ambient. 2016, 20, 29–35. [Google Scholar] [CrossRef]
  8. Taiz, L.; Zeiger, E.; Moller, I.M.; Murphy, A. Fisiologia e Desenvolvimento Vegetal; Artmed: Porto Alegre, Brazil, 2017. [Google Scholar]
  9. Silva, A.M.S.; Oliveira, E.C.A.; Willadino, L.G.; Freire, F.J.; Rocha, A.T. Corrective phosphate application as a practice for reducing oxidative stress and increasing productivity in sugarcane. Cienc. Agron. 2019, 50, 188–196. [Google Scholar] [CrossRef]
  10. Preston, C.L.; Diaz, D.A.R.; Mengel, D.B. Corn response to long-term phosphorus fertilizer application rate and placement with strip-tillage. Agron. J. 2019, 111, 841–850. [Google Scholar] [CrossRef]
  11. White, P.J.; Brown, P.H. Plant nutrition for sustainable development and global health. Ann. Bot. 2010, 105, 1073–1080. [Google Scholar] [CrossRef]
  12. White, P.J.; Hammond, J.P. Phosphorus nutrition of terrestrial plants. In The Ecophysiology of Plant-Phosphorus Interactions; White, P.J., Hammond, J.P., Eds.; Springer: Dordrecht, The Netherlands, 2008; pp. 51–81. [Google Scholar] [CrossRef]
  13. Alori, E.T.; Glick, B.R.; Babalola, O.O. Microbial phosphorus solubilization and its potential for use in sustainable agriculture. Front. Microbiol. 2017, 8, 971. [Google Scholar] [CrossRef] [PubMed]
  14. Chien, S.H.; Prochnow, L.I.; Cantarella, H. Recent developments of fertilizer production and use to improve nutrient efficiency and minimize environmental impacts. In Advances in Agronomy; Sparks, D.L., Ed.; Elsevier: Amsterdam, The Netherlands, 2009; pp. 267–322. [Google Scholar] [CrossRef]
  15. Caione, G.; Prado, R.M.; Campos, C.N.S.; Moda, L.R.; Vasconcelos, R.L.; Pizauro Júnior, J.M. Response of sugarcane in a red ultisol to phosphorus rates, phosphorus sources, and filter cake. Sci. World J. 2015, 2015, 405970. [Google Scholar] [CrossRef]
  16. Borges, B.M.M.N.; Abdala, D.B.; Souza, M.F.; Viglio, L.M.; Coelho, M.J.A.; Pavinato, P.S.; Franco, H.C.J. Organomineral phosphate fertilizer from sugarcane byproduct and its effects on soil phosphorus availability and sugarcane yield. Geoderma 2019, 339, 20–30. [Google Scholar] [CrossRef]
  17. Novais, R.F.; Smyth, T.J.; Nunes, F.N. Fósforo. In Fertilidade do Solo; Novais, R.F., Alvarez, V.V.H., Barros, N.F., Fontes, R.L.F., Cantarutti, R.B., Neves, J.C.L., Eds.; Sociedade Brasileira de Ciência do Solo: Viçosa, Brazil, 2007; pp. 471–550. [Google Scholar]
  18. Asomaning, S.K. Processes and factors affecting phosphorus sorption in soils. In Sorption in 2020s; Kyzas, G., Lazaridis, N., Eds.; IntechOpen: London, UK, 2020; pp. 1–15. [Google Scholar]
  19. Hanyabui, E.; Apori, S.O.; Frimpong, K.A.; Atiah, K.; Abindaw, T.; Ali, M.; Asiamah, J.Y.; Byalebeka, J. Phosphorus sorption in tropical soils. AIMS Agric. Food 2020, 5, 599–616. [Google Scholar] [CrossRef]
  20. Roy, E.D.; Richards, P.D.; Martinelli, L.A.; Della Coletta, L.; Lins, S.R.M.; Vazquez, F.F.; Willig, E.; Spera, S.A.; VanWey, L.K.; Porder, S. The phosphorus cost of agricultural intensification in the tropics. Nat. Plants 2016, 2, 2–7. [Google Scholar] [CrossRef]
  21. Billah, M.; Matiullah, K.; Bano, A.; Hassan, T.U.; Munir, A.; Gurmani, A.R. Phosphorus and phosphate solubilizing bacteria: Keys for sustainable agriculture. Geomicrobiol. J. 2019, 36, 904–916. [Google Scholar] [CrossRef]
  22. Shukla, A.K. Ecology and Diversity of Plant Growth Promoting Rhizobacteria in Agricultural Landscape. In PGPR Amelioration in Sustainable Agriculture: Food Security and Environmental Management; Singh, A.K., Kumar, A., Singh, P.K., Eds.; Woodhead Publishing: Duxford, UK, 2019; pp. 1–14. [Google Scholar]
  23. Rosa, P.A.L.; Mortinho, E.S.; Jalal, A.; Galindo, F.S.; Buzetti, S.; Fernandes, G.C.; Barco Neto, M.; Pavinato, P.S.; Teixeira Filho, M.C.M. Inoculation with growth-promoting bacteria associated with the reduction of phosphate fertilization in sugarcane. Front. Environ. Sci. 2020, 8, 32. [Google Scholar] [CrossRef]
  24. Rosa, P.A.L.; Galindo, F.S.; Oliveira, C.E.S.; Jalal, A.; Mortinho, E.S.; Fernandes, G.C.; Marega, E.M.R.; Buzetti, S.; Teixeira Filho, M.C.M. Inoculation with plant growth-promoting bacteria to reduce phosphate fertilization requirement and enhance technological quality and yield of sugarcane. Microorganisms 2022, 10, 192. [Google Scholar] [CrossRef]
  25. Meena, R.S.; Meena, V.S.; Meena, S.K.; Verma, J.P. The needs of healthy soils for a healthy world. J. Clean. Prod. 2015, 102, 560–561. [Google Scholar] [CrossRef]
  26. Kumar, A.; Maurya, B.R.; Raghuwanshi, R.; Meena, V.S.; Islam, M.T. Co-inoculation with Enterobacter and Rhizobacteria on yield and nutrient uptake by wheat (Triticum aestivum L.) in the alluvial soil under Indo-Gangetic plain of India. J. Plant Growth Regul. 2017, 36, 608–617. [Google Scholar] [CrossRef]
  27. Shen, H.; He, X.; Liu, Y.; Chen, Y.; Tang, J.; Guo, T. A complex inoculant of N2-fixing, P- and K-solubilizing bacteria from a purple soil improves the growth of kiwifruit (Actinidia chinensis) plantlets. Front. Microbiol. 2016, 7, 841. [Google Scholar] [CrossRef]
  28. Kalayu, G. Phosphate solubilizing microorganisms: Promising approach as biofertilizers. Int. J. Agron. 2019, 2019, 4917256. [Google Scholar] [CrossRef]
  29. Saeid, A.; Prochownik, E.; Dobrowolska-Iwanek, J. Phosphorus solubilization by Bacillus species. Molecules 2018, 23, 2897. [Google Scholar] [CrossRef]
  30. Sarmah, R.; Sarma, A.K. Phosphate Solubilizing Microorganisms: A Review. Commun. Soil Sci. Plant Anal. 2023, 54, 1306–1315. [Google Scholar] [CrossRef]
  31. Elhaissoufi, W.; Khourchi, S.; Ibnyasser, A.; Ghoulam, C.; Rchiad, Z.; Zeroual, Y.; Lyamlouli, K.; Bargaz, A. Phosphate solubilizing rhizobacteria could have a stronger influence on wheat root traits and aboveground physiology than rhizosphere P solubilization. Front. Plant Sci. 2020, 11, 979. [Google Scholar] [CrossRef]
  32. Cheng, Y.; Yuan, J.; Wang, G.; Hu, Z.; Luo, W.; Zhao, X.; Guo, Y.; Ji, X.; Hu, W.; Li, M. Phosphate-solubilizing bacteria improve the antioxidant enzyme activity of Potamogeton crispus L. and enhance the remediation effect on Cd-contaminated sediment. J. Hazard. Mater. 2024, 470, 134305. [Google Scholar] [CrossRef] [PubMed]
  33. Rawat, P.; Das, S.; Shankhdhar, D.; Shankhdhar, S.C. Phosphate-Solubilizing Microorganisms: Mechanism and Their Role in Phosphate Solubilization and Uptake. J. Soil Sci. Plant Nutr. 2021, 21, 49–68. [Google Scholar] [CrossRef]
  34. Shi, Z.; Pan, F.; Kong, X.; Lang, J.; Ye, M.; Wu, Q.; Wang, G.; Han, L.; Zhou, N. Effects of inoculation with phosphate solubilizing bacteria on the physiology, biochemistry, and expression of genes related to the protective enzyme system of Fritillaria taipaiensis P.Y. Li. Phyton-Int. J. Exp. Bot. 2024, 93, 247–260. [Google Scholar] [CrossRef]
  35. Zhang, H.; Xie, X.; Kim, M.-S.; Kornyeyev, D.A.; Holaday, S.; Paré, P.W. Soil bacteria augment Arabidopsis photosynthesis by decreasing glucose sensing and abscisic acid levels in planta. Plant J. 2008, 56, 264–273. [Google Scholar] [CrossRef]
  36. Li, Y.; Xu, S.; Gao, J.; Pan, S.; Wang, G. Bacillus subtilis-regulation of stomatal movement and instantaneous water use efficiency in Vicia faba. Plant Growth Regul. 2016, 78, 43–55. [Google Scholar] [CrossRef]
  37. Majid, M.; Ali, M.; Shahzad, K.; Ahmad, F.; Ikram, R.M.; Ishtiaq, M.; Alaraidh, I.A.; Al-Hashimi, A.; Ali, H.M.; Zarei, T.; et al. Mitigation of osmotic stress in cotton for the improvement in growth and yield through inoculation of rhizobacteria and phosphate solubilizing bacteria coated diammonium phosphate. Sustainability 2020, 12, 10456. [Google Scholar] [CrossRef]
  38. Fonseca, M.C.; Bossolani, J.W.; Oliveira, S.L.; Moretti, L.G.; Portugal, J.R.; Scudeletti, D.; Oliveira, E.F.; Crusciol, C.A.C. Bacillus subtilis inoculation improves nutrient uptake and physiological activity in sugarcane under drought stress. Microorganisms 2022, 10, 809. [Google Scholar] [CrossRef]
  39. Rampazzo, P.E.; Marcos, F.C.C.; Cipriano, M.A.P.; Marchiori, P.E.R.; Freitas, S.S.; Machado, E.C.; Nascimento, L.C.; Brochi, M.; Ribeiro, R.V. Rhizobacteria improve sugarcane growth and photosynthesis under well-watered conditions. Ann. Appl. Biol. 2018, 172, 309–320. [Google Scholar] [CrossRef]
  40. Aye, P.P.; Pinjai, P.; Tawornpruek, S. Effect of phosphorus solubilizing bacteria on soil available phosphorus and growth and yield of sugarcane. Walailak J. Sci. Technol. 2021, 18, 10754. [Google Scholar] [CrossRef]
  41. Santos, H.L.; Silva, G.F.; Carnietto, M.R.A.; Oliveira, L.C.; Nogueira, C.H.C.; Silva, M.A. Bacillus velezensis associated with organomineral fertilizer and reduced phosphate doses improves soil microbial-chemical properties and biomass of sugarcane. Agronomy 2022, 12, 2701. [Google Scholar] [CrossRef]
  42. Abdallah, D.B.; Frikha-Gargouri, O.; Tounsi, S. Rizhospheric competence, plant growth promotion and biocontrol efficacy of Bacillus amyloliquefaciens subsp. plantarum strain 32a. Biol. Control 2018, 124, 61–67. [Google Scholar] [CrossRef]
  43. Bayisa, R.A. Bacillus velezensis AR1 mediated plant nourishing through solubilization of hardly soluble phosphorus nutrient sources. Cogent Food Agric. 2023, 9, 2276561. [Google Scholar] [CrossRef]
  44. Iqbal, Z.; Ahmad, M.; Raza, M.A.; Hilger, T.; Rasche, F. Phosphate Solubilizing Bacillus sp. modulate soil exoenzyme activities and improve wheat growth. Microb. Ecol. 2024, 87, 31. [Google Scholar] [CrossRef]
  45. Suleman, M.; Yasmin, S.; Rasul, M.; Yahya, M.; Atta, B.M.; Mirza, M.S. Phosphate solubilizing bacteria with glucose dehydrogenase gene for phosphorus uptake and beneficial effects on wheat. PLoS ONE 2018, 13, e0204408. [Google Scholar] [CrossRef]
  46. Emami, S.; Alikhani, H.A.; Pourbabaee, A.A.; Etesami, H.; Motasharezadeh, B.; Sarmadian, F. Consortium of endophyte and rhizosphere phosphate solubilizing bacteria improves phosphorous use efficiency in wheat cultivars in phosphorus deficient soils. Rhizosphere 2020, 14, 100196. [Google Scholar] [CrossRef]
  47. Setlow, P. Mechanisms which contribute to the long-term survival of spores of Bacillus species. J. Appl. Bacteriol. 1994, 76, 49S–60S. [Google Scholar] [CrossRef]
  48. Nicholson, W.L.; Munakata, N.; Horneck, G.; Melosh, H.J.; Setlow, P. Resistance of Bacillus endospores to extreme terrestrial and extraterrestrial environments. Microbiol. Mol. Biol. Rev. 2000, 64, 548–572. [Google Scholar] [CrossRef] [PubMed]
  49. Leser, T.D.; Knarreborg, A.; Worm, J. Germination and outgrowth of Bacillus subtilis and Bacillus licheniformis spores in the gastrointestinal tract of pigs. J. Appl. Microbiol. 2008, 104, 1025–1033. [Google Scholar] [CrossRef]
  50. Kalidas-Singh, S.; Thakuria, D. Seedling root-dip in phosphorus and biofertilizer added soil slurry method of nutrient management for transplanted rice in acid soil. J. Soil Sci. Plant Nutr. 2018, 18, 921–938. [Google Scholar] [CrossRef]
  51. Iqbal, A.; Song, M.; Shah, Z.; Alamzeb, M.; Iqbal, M. Integrated use of plant residues, phosphorus and beneficial microbes improve hybrid maize productivity in semiarid climates. Acta Ecol. Sin. 2019, 39, 348–355. [Google Scholar] [CrossRef]
  52. Adnan, M.; Fahad, S.; Zamin, M.; Shah, S.; Mian, I.A.; Danish, S.; Zafar-ul-Hye, M.; Battaglia, M.L.; Naz, R.M.M.; Saeed, B.; et al. Coupling phosphate-solubilizing bacteria with phosphorus supplements improve maize phosphorus acquisition and growth under lime induced salinity stress. Plants 2020, 9, 900. [Google Scholar] [CrossRef]
  53. Biswas, S.S.; Biswas, D.R.; Ghosh, A.; Sarkar, A.; Das, A.; Roy, T. Phosphate solubilizing bacteria inoculated low-grade rock phosphate can supplement P fertilizer to grow wheat in sub-tropical inceptisol. Rhizosphere 2022, 23, 100556. [Google Scholar] [CrossRef]
  54. Singh, B.; Pandey, R. Differences in root exudation among phosphorus-starved genotypes of maize and green gram and its relationship with phosphorus uptake. J. Plant Nutr. 2003, 26, 2391–2401. [Google Scholar] [CrossRef]
  55. Beauregard, M.S.; Hamel, C.; Nayyar, A.; St-Arnaud, M. Long-term phosphorus fertilization impacts soil fungal and bacterial diversity but not AM fungal community in alfalfa. Microb. Ecol. 2010, 59, 379–389. [Google Scholar] [CrossRef]
  56. Grafe, M.; Goers, M.; von Tucher, S.; Baum, C.; Zimmer, D.; Leinweber, P.; Vestergaard, G.; Kublik, S.; Schloter, M.; Schulz, S. Bacterial potentials for uptake, solubilization and mineralization of extracellular phosphorus in agricultural soils are highly stable under different fertilization regimes. Environ. Microbiol. Rep. 2018, 10, 320–327. [Google Scholar] [CrossRef] [PubMed]
  57. Wang, F.; Kertesz, M.A.; Feng, G. Phosphorus forms affect the hyphosphere bacterial community involved in soil organic phosphorus turnover. Mycorrhiza 2019, 29, 351–362. [Google Scholar] [CrossRef]
  58. Widdig, M.; Schleuss, P.M.; Weig, A.R.; Guhr, A.; Biederman, L.A.; Borer, E.T.; Crawley, M.J.; Kirkman, K.P.; Seabloom, E.W.; Wragg, P.D.; et al. Nitrogen and phosphorus additions alter the abundance of phosphorus-solubilizing bacteria and phosphatase activity in grassland soils. Front. Environ. Sci. 2019, 7, 185. [Google Scholar] [CrossRef]
  59. Dai, Z.; Liu, G.; Chen, H.; Chen, C.; Wang, J.; Ai, S.; Wei, D.; Li, D.; Ma, B.; Tang, C.; et al. Long-term nutrient inputs shift soil microbial functional profiles of phosphorus cycling in diverse agroecosystems. ISME J. 2020, 14, 757–770. [Google Scholar] [CrossRef]
  60. Mander, C.; Wakelin, S.; Young, S.; Condron, L.; O’Callaghan, M. Incidence and diversity of phosphate-solubilising bacteria are linked to phosphorus status in grassland soils. Soil Biol. Biochem. 2012, 44, 93–101. [Google Scholar] [CrossRef]
  61. Long, X.E.; Yao, H.; Huang, Y.; Wei, W.; Zhu, Y.G. Phosphate levels influence the utilisation of rice rhizodeposition carbon and the phosphate-solubilising microbial community in a paddy soil. Soil Biol. Biochem. 2018, 118, 103–114. [Google Scholar] [CrossRef]
  62. Zhao, K.; Penttinen, P.; Zhang, X.P.; Ao, X.L.; Liu, M.K.; Yu, X.M.; Chen, Q. Maize rhizosphere in Sichuan, China, hosts plant growth promoting Burkholderia cepacia with phosphate solubilizing and antifungal abilities. Microbiol. Res. 2014, 169, 76–82. [Google Scholar] [CrossRef] [PubMed]
  63. Santos, R.M.; Diaz, P.A.E.; Lobo, L.L.; Rigobelo, E.C. Use of plant growth-promoting rhizobacteria in maize and sugarcane: Characteristics and applications. Front. Sustain. Food Syst. 2020, 4, 136. [Google Scholar] [CrossRef]
  64. Steele, M.R.; Gitelson, A.A.; Rundquist, D.C. A comparison of two techniques for nondestructive measurement of chlorophyll content in grapevine leaves. Agron. J. 2008, 100, 779–782. [Google Scholar] [CrossRef]
  65. Silva, M.A.; Santos, C.M.; Vitorino, H.S.; Rhein, A.F.L. Pigmentos fotossintéticos e índice SPAD como descritores de intensidade do estresse por deficiência hídrica em cana-de-açúcar. Biosci. J. 2014, 30, 173–181. [Google Scholar]
  66. Houborg, R.; Fisher, J.B.; Skidmore, A.K. Advances in remote sensing of vegetation function and traits. Int. J. Appl. Earth Obs. Geoinf. 2015, 43, 1–6. [Google Scholar] [CrossRef]
  67. Chou, S.; Chen, B.; Chen, J.; Wang, M.; Wang, S.; Croft, H.; Shi, Q. Estimation of leaf photosynthetic capacity from the photochemical reflectance index and leaf pigments. Ecol. Indic. 2019, 107, 105867. [Google Scholar] [CrossRef]
  68. Urbonaviciute, A.; Samuoliene, G.; Sakalauskaite, J.; Duchovskis, P.; Brazaityte, A.; Siksnianiene, J.B.; Ulinskaite, R.; Sabajeviene, G.; Baranauskis, K. The effect of elevated CO2 concentrations on leaf carbohydrate, chlorophyll contents and photosynthesis in radish. Pol. J. Environ. Stud. 2006, 15, 921–925. [Google Scholar]
  69. Lokstein, H.; Renger, G.; Götze, J.P. Photosynthetic light-harvesting (antenna) complexes—Structures and functions. Molecules 2021, 26, 3378. [Google Scholar] [CrossRef] [PubMed]
  70. Siefermann, D.; Yamamoto, H.Y. Properties of NADPH and oxygen-dependent zeaxanthin epoxidation in isolated chloroplasts: A transmembrane model for the violaxanthin cycle. Arch. Biochem. Biophys. 1975, 171, 70–77. [Google Scholar] [CrossRef]
  71. Bhutta, M.A.; Bibi, A.; Ahmad, N.H.; Kanwal, S.; Amjad, Z.; Rehman, H.; Farooq, U.; Khalid, M.N.; Nayab, S.F. Molecular mechanisms of photoinhibition in plants: A review. Sarhad J. Agric. 2023, 39, 340–345. [Google Scholar] [CrossRef]
  72. Enebe, M.C.; Babalola, O.O. The influence of plant growth-promoting rhizobacteria in plant tolerance to abiotic stress: A survival strategy. Appl. Microbiol. Biotechnol. 2018, 102, 7821–7835. [Google Scholar] [CrossRef] [PubMed]
  73. Chandra, P.; Triphathi, P.; Chandra, A. Isolation and molecular characterization of plant growth-promoting Bacillus spp. and their impact on sugarcane (Saccharum spp. Hybrids) growth and tolerance towards drought stress. Acta Physiol. Plant. 2018, 40, 199. [Google Scholar] [CrossRef]
  74. Chaudhary, P.; Khati, P.; Chaudhary, A.; Gangola, S.; Sharma, A. Bioinoculation using indigenous Bacillus spp. improves growth and yield of Zea mays under the influence of nanozeolite. 3 Biotech 2021, 11, 11. [Google Scholar] [CrossRef]
  75. Chaudhary, P.; Khati, P.; Gangola, S.; Kumar, A.; Kumar, R.; Sharma, A. Impact of nanochitosan and Bacillus spp. on health, productivity and defence response in Zea mays under field condition. 3 Biotech 2021, 11, 237. [Google Scholar] [CrossRef] [PubMed]
  76. Ali, B.; Hafeez, A.; Saliha, A.; Javed, M.A.; Sumaira; Afridi, M.S.; Dawoud, T.M.; Almaary, K.S.; Muresan, C.C.; Marc, R.A.; et al. Bacillus thuringiensis PM25 ameliorates oxidative damage of salinity stress in maize via regulating growth, leaf pigments, antioxidant defense system, and stress responsive gene expression. Front. Plant Sci. 2022, 13, 921668. [Google Scholar] [CrossRef]
  77. Tahir, M.; Khalid, U.; Ijaz, M.; Shah, G.M.; Naeem, M.A.; Shahid, M.; Mahmood, K.; Ahmad, N.; Kareem, F. Combined application of bio-organic phosphate and phosphorus solubilizing bacteria (Bacillus strain MWT 14) improve the performance of bread wheat with low fertilizer input under an arid climate. Braz. J. Microbiol. 2018, 49, 15–24. [Google Scholar] [CrossRef]
  78. Khan, M.A.; Asaf, S.; Khan, A.L.; Jan, R.; Kang, S.M.; Kim, K.M.; Lee, I.J. Thermotolerance effect of plant growth-promoting Bacillus cereus SA1 on soybean during heat stress. BMC Microbiol. 2020, 20, 175. [Google Scholar] [CrossRef]
  79. Crafts-Brandner, S.J. Phosphorus nutrition influence on leaf senescence in soybean. Plant Physiol. 1992, 98, 1128–1132. [Google Scholar] [CrossRef]
  80. Singh, S.K.; Badgujar, G.; Reddy, V.R.; Fleisher, D.H.; Bunce, J.A. Carbon dioxide diffusion across stomata and mesophyll and photo-biochemical processes as affected by growth CO2 and phosphorus nutrition in cotton. J. Plant Physiol. 2013, 170, 801–813. [Google Scholar] [CrossRef]
  81. Singh, S.K.; Reddy, V.R. Response of carbon assimilation and chlorophyll fluorescence to soybean leaf phosphorus across CO2: Alternative electron sink, nutrient efficiency and critical concentration. J. Photoch. Photobio. B Biol. 2015, 151, 276–284. [Google Scholar] [CrossRef]
  82. Hong-Hai, L.; Merope, T.M.; Ya-Li, Z.; Wang-Feng, Z. Combining gas exchange and chlorophyll a fluorescence measurements to analyze the photosynthetic activity of drip-irrigated cotton under different soil water deficits. J. Integr. Agric. 2016, 15, 1256–1266. [Google Scholar] [CrossRef]
  83. Wang, S.K.; Zhuang, S.; Zhang, M.; Yang, F.; Meng, Q. Overexpression of a tomato carotenoid ε-hydroxylase gene (SILUT1) improved the drought tolerance of transgenic tobacco. J. Plant Physiol. 2018, 170, 235–245. [Google Scholar] [CrossRef]
  84. Melis, A. Photosystem-II damage and repair cycle in chloroplasts: What modulates the rate of photodamage in vivo? Trends Plant Sci. 1999, 4, 1360–1385. [Google Scholar] [CrossRef] [PubMed]
  85. Dias, A.N.; Siqueira-Silva, A.I.; Souza, J.P.; Kuki, K.N.; Pereira, E.G. Acclimation responses of macaw palm seedlings to contrasting light environments. Sci. Rep. 2018, 8, 15300. [Google Scholar] [CrossRef] [PubMed]
  86. Stirbet, A.; Lazár, D.; Kromdijk, J.; Govindjee, G. Chlorophyll a fluorescence induction: Can just a one-second measurement be used to quantify abiotic stress responses? Photosynthetica 2018, 56, 86–104. [Google Scholar] [CrossRef]
  87. Guidi, L.; Calatayud, A. Non-invasive tools to estimate stress-induced changes in photosynthetic performance in plants inhabiting Mediterranean areas. Environ. Exp. Bot. 2014, 103, 42–52. [Google Scholar] [CrossRef]
  88. Schimpl, F.C.; Ribeiro, R.V.; Pereira, L.; Rodrigues, H.S.; Mazzafera, P. Photochemical responses to abrupt and gradual chilling treatments in eucalyptus species. Theor. Exp. Plant Physiol. 2018, 30, 9–17. [Google Scholar] [CrossRef]
  89. Samaniego-Gámez, B.Y.; Garruña, R.; Tun-Suárez, J.M.; Kantun-Can, J.; Reyes-Ramírez, A.; Cervanes-Díaz, L. Bacillus spp. inoculation improves photosystem II efficiency and enhances photosynthesis in pepper plants. Chil. J. Agric. Res. 2016, 76, 409–416. [Google Scholar] [CrossRef]
  90. Samaniego-Gámez, B.Y.; Garruña, R.; Tun-Suárez, J.M.; Moreno-Valenzuela, O.A.; Reyes-Ramírez, A.; Valle-Gough, R.E.; Ail-Catzim, C.E.; Toscano-Palomar, L. Healthy photosynthetic mechanism suggests ISR elicited by Bacillus spp. in Capsicum chinense plants infected with PepGMV. Pathogens 2021, 10, 455. [Google Scholar] [CrossRef] [PubMed]
  91. Shi, Y.; Lou, K.; Li, C. Growth and photosynthetic efficiency promotion of sugar beet (Beta vulgaris L.) by endophytic bacteria. Photosynth. Res. 2010, 105, 5–13. [Google Scholar] [CrossRef]
  92. Marcos, F.C.C.; Iório, R.P.F.; Silveira, A.P.D.; Ribeiro, R.V.; Machado, E.C.; Lagôa, A.M.M.A. Endophytic bacteria affect sugarcane physiology without changing plant growth. Bragantia 2016, 75, 256. [Google Scholar] [CrossRef]
  93. Ozfidan-Konakci, C.; Arikan, B.; Alp-Turgut, F.N.; Balci, M.; Yildiztugay, E. Halotolerant plant growth-promoting bacteria, Bacillus pumilus modulates water status, chlorophyll fluorescence kinetics and antioxidant balance in salt and/or arsenic-exposed wheat. Environ. Res. 2023, 231, 116089. [Google Scholar] [CrossRef]
  94. Singh, S.K.; Reddy, V.R. Combined effects of phosphorus nutrition and elevated carbon dioxide concentration on chlorophyll fluorescence, photosynthesis and nutrient efficiency of cotton. J. Plant Nutr. Soil Sci. 2014, 177, 892–902. [Google Scholar] [CrossRef]
  95. Maxwell, K.; Johnson, G.N. Chlorophyll fluorescence—A practical guide. J. Exp. Bot. 2000, 51, 659–668. [Google Scholar] [CrossRef] [PubMed]
  96. Ruban, A.V. Nonphotochemical Chlorophyll Fluorescence Quenching: Mechanism and Effectiveness in Protecting Plants from Photodamage. Plant Physiol. 2016, 170, 1903–1916. [Google Scholar] [CrossRef]
  97. Müller, P.; Li, X.P.; Niyogi, K.K. Non-photochemical quenching: A response to excess light energy. Plant Physiol. 2001, 125, 1558–1566. [Google Scholar] [CrossRef] [PubMed]
  98. Klughammer, C.; Schreiber, U. Complementary PS II quantum yields calculated from simple fluorescence parameters measured by PAM fluorometry and the saturation pulse method. Heinz Walz GmbH 2008, 1, 27–35. [Google Scholar]
  99. Murchie, E.H.; Ruban, A.V. Dynamic non-photochemical quenching in plants: From molecular mechanism to productivity. Plant J. 2020, 101, 885–896. [Google Scholar] [CrossRef]
  100. Baker, N.R. Chlorophyll fluorescence: A probe of photosynthesis in vivo. Annu. Rev. Plant Biol. 2008, 59, 89–113. [Google Scholar] [CrossRef] [PubMed]
  101. Guidi, L.; Lo Piccolo, E.; Landi, M. Chlorophyll fluorescence, photoinhibition and abiotic stress: Does it make any difference the fact to be a C3 or C4 species? Front. Plant Sci. 2019, 10, 174. [Google Scholar] [CrossRef] [PubMed]
  102. Sánchez-Reinoso, A.D.; Ligarreto-Moreno, G.A.; Restrepo-Díaz, H. Physiological and biochemical expressions of a determinated growth common bean genotype (Phaseolus vulgaris L.) to water deficit stress periods. J. Anim. Plant Sci. 2018, 28, 119–127. [Google Scholar]
  103. Costa-Santos, M.; Mariz-Ponte, N.; Dias, M.C.; Moura, L.; Marques, G.; Santos, C. Effect of Bacillus spp. and Brevibacillus sp. on the photosynthesis and redox status of Solanum lycopersicum. Horticulturae 2021, 7, 24. [Google Scholar] [CrossRef]
  104. Carvalho Neta, S.J.; Araújo, V.L.V.P.; Fracetto, F.L.C.; Silva, C.C.G.; Souza, E.R.; Silva, W.R.; Lumini, E.; Fracetto, G.G.M. Growth-promoting bacteria and arbuscular mycorrhizal fungus enhance maize tolerance to saline stress. Microbiol. Res. 2024, 284, 127708. [Google Scholar] [CrossRef]
  105. McAdam, S.A.M.; Brodribb, T.J. Stomatal innovation and the rise of seed plants. Ecol. Lett. 2012, 15, 1–8. [Google Scholar] [CrossRef]
  106. Wong, S.C.; Cowan, I.R.; Farquhar, G.D. Stomatal conductance correlates with photosynthetic capacity. Nature 1979, 282, 424–426. [Google Scholar] [CrossRef]
  107. Lawson, T.; Blatt, M.R. Stomatal size, speed, and responsiveness impact on photosynthesis and water use efficiency. Plant Physiol. 2014, 164, 1556–1570. [Google Scholar] [CrossRef]
  108. Tanaka, Y.; Sugano, S.S.; Shimada, T.; Hara-Nishimura, I. Enhancement of leaf photosynthetic capacity through increased stomatal density in Arabidopsis. New Phytol. 2013, 198, 757–764. [Google Scholar] [CrossRef]
  109. Sadoka, K.; Yamori, W.; Shimada, T.; Sugano, S.S.; Hara-Nishimura, I.; Tanaka, Y. Higher stomatal density improves photosynthetic induction and biomass production in Arabidopsis under fluctuating light. Front. Plant Sci. 2020, 11, 589603. [Google Scholar] [CrossRef]
  110. Cappellari, L.R.; Santoro, M.V.; Reinoso, H.; Travaglia, C.; Giordano, W.; Banchio, E. Anatomical, morphological, and phytochemical effects of inoculation with plant growth-promoting rhizobacteria on peppermint (Mentha piperita). J. Chem. Ecol. 2015, 41, 149–158. [Google Scholar] [CrossRef] [PubMed]
  111. Silva, M.A.; Geronimo, G.Z.; Santos, H.L. Genetic and morpho-physiological differentiation of sugarcane genotypes under drought stress. Int. J. Agric. Biol. 2020, 24, 311–318. [Google Scholar]
  112. Ku, S.; Edwards, G. Oxygen inhibition of photosynthesis: II. Kinetic characteristics as affected by temperature. Plant Physiol. 1977, 59, 991–999. [Google Scholar] [CrossRef] [PubMed]
  113. Wang, J.; Chen, Y.; Wang, P.; Li, Y.S.; Wang, G.; Liu, P.; Khan, A. Leaf gas exchange, phosphorus uptake, growth and yield responses of cotton cultivars to different phosphorus rates. Photosynthetica 2018, 56, 1414–1421. [Google Scholar] [CrossRef]
  114. Kimura, H.; Hashimoto-Sugimoto, M.; Iba, K.; Terashima, I.; Yamori, W. Improved stomatal opening enhances photosynthetic rate and biomass production in fluctuating light. J. Exp. Bot. 2020, 71, 2339–2350. [Google Scholar] [CrossRef]
  115. Naseem, H.; Bano, A. Role of plant growth-promoting rhizobacteria and their exopolysaccharide in drought tolerance of maize. J. Plant Interact. 2014, 4, 689–701. [Google Scholar] [CrossRef]
  116. Zheng, W.; Zeng, S.; Bais, H.; LaManna, J.M.; Hussey, D.S.; Jacobson, D.L.; Jin, Y. Plant growth-promoting rhizobacteria (PGPR) reduce evaporation and increase soil water retention. Water Resour. Res. 2018, 54, 3673–3687. [Google Scholar] [CrossRef]
  117. Díaz-Cornejo, S.; Otero, M.C.; Banerjee, A.; Gordillo-Fuenzalida, F. Biological properties of exopolysaccharides produced by Bacillus spp. Microbiol. Res. 2023, 268, 127276. [Google Scholar] [CrossRef]
  118. Akhtar, S.S.; Amby, D.B.; Hegelund, J.N.; Fimognari, L.; Groβinsky, D.K.; Westergaard, J.C.; Müller, R.; Moelbak, L.; Liu, F.; Roitsch, T. Bacillus licheniformis FMCH001 increases water use efficiency via growth stimulation in both normal and drought conditions. Front. Plant Sci. 2020, 11, 297. [Google Scholar] [CrossRef]
  119. Almeida, L.C.O.; Santos, H.L.; de Castro Nogueira, C.; Carnietto, M.R.A.; da Silva, G.F.; Boaro, C.S.F.; de Almeida Silva, M. Plant Growth-Promoting Bacteria Enhance Survival, Growth, and Nutritional Content of Sugarcane Propagated through Pre-Sprouted Seedlings under Water Deficit. Agriculture 2024, 14, 189. [Google Scholar] [CrossRef]
  120. Glick, B.R. Introduction to Plant Growth-Promoting Bacteria. In Beneficial Plant-Bacterial Interactions, 2nd ed.; Glick, B.R., Ed.; Springer International Publishing: Cham, Switzerland, 2020; pp. 1–37. [Google Scholar] [CrossRef]
  121. Smith, B.N. Photosynthesis, respiration and growth. In Handbook of Photosynthesis; Pessarakli, M., Ed.; CRC Press: London, UK, 2004; pp. 671–677. [Google Scholar]
  122. Murchie, E.H.; Pinto, M.; Horton, P. Agriculture and the new challenges for photosynthesis research. New Phytol. 2009, 181, 532–552. [Google Scholar] [CrossRef]
  123. Reynolds, M.; Foulkes, M.J.; Slafer, G.A.; Berry, P.; Parry, M.A.; Snape, J.W.; Angus, W.J. Raising yield potential in wheat. J. Exp. Bot. 2009, 60, 1899–1918. [Google Scholar] [CrossRef]
  124. Chytyk, C.; Hucl, P.; Gray, G. Leaf photosynthetic properties and biomass accumulation of selected western Canadian spring wheat cultivars. Can. J. Plant Sci. 2011, 91, 305–314. [Google Scholar] [CrossRef]
  125. Rodrigues, J.D.; Jadoski, C.J.; Fagan, E.B.; Ono, E.O.; Soares, L.H.; Dourado Neto, D. Fisiologia da Produção de Cana-de-Açúcar; ANDREI: São Paulo, Brazil, 2018. [Google Scholar]
  126. Hossain, M.A.; Burritt, D.J.; Fujita, M. Proline and glycine betaine modulate cadmium-induced oxidative stress tolerance in plants. In Plant-Environmental Interaction: Response and Approaches to Mitigate Stress; Azooz, M.M., Ahmad, P., Eds.; John Wiley & Sons: Hoboken, NJ, USA, 2015; pp. 97–123. [Google Scholar] [CrossRef]
  127. Anjum, N.; Thangavel, P.; Rasheed, F.; Masood, A.; Pirasteh-Anosheh, H.; Khan, N. Osmolytes: Efficient oxidative stress-busters in plants. In Plant Stress Physiology; Hasanuzzaman, M., Fujita, M., Oku, H., Nahar, K., Hawrylak-Nowak, B., Eds.; Wiley: Hoboken, NJ, USA, 2023; pp. 1–30. [Google Scholar] [CrossRef]
  128. Less, H.; Galili, G. Principal transcriptional programs regulating plant amino acid metabolism in response to abiotic stresses. Plant Physiol. 2008, 147, 316–330. [Google Scholar] [CrossRef] [PubMed]
  129. Chiappero, J.; Cappellari, L.D.R.; Alderete, L.G.S.; Palermo, T.B.; Banchio, E. Plant growth-promoting rhizobacteria improve the antioxidant status in Mentha piperita grown under drought stress leading to an enhancement of plant growth and total phenolic content. Ind. Crops Prod. 2019, 139, 111553. [Google Scholar] [CrossRef]
  130. Nunes, F.N.; Cantarutti, R.B.; Novais, R.F.; Silva, I.R.; Tótola, M.R.; Ribeiro, B.N. Atividade de fosfatases em gramíneas forrageiras em resposta à disponibilidade de fósforo no solo e à altura de corte das plantas. Rev. Bras. Cienc. Solo 2008, 32, 1899–1909. [Google Scholar] [CrossRef][Green Version]
  131. Bozzo, G.G.; Dunn, E.L.; Plaxton, W.C. Differential synthesis of phosphate-starvation inducible purple acid phosphatase isozymes in tomato (Lycopersicon esculentum) suspension cells and seedlings. Plant Cell Environ. 2006, 29, 303–313. [Google Scholar] [CrossRef]
  132. Xu Cheng, J.; Min Huang, L.; Chen, C.; Wang, J.; Xian Long, X. Effective lead immobilization by phosphate rock solubilization mediated by phosphate rock amendment and phosphate solubilizing bacteria. Chemosphere 2019, 237, 124540. [Google Scholar] [CrossRef] [PubMed]
  133. Rfaki, A.; Zennouhi, O.; Aliyat, F.Z.; Nassiri, L.; Ibijbijen, J. Isolation, selection and characterization of root-associated rock phosphate solubilizing bacteria in Moroccan wheat (Triticum aestivum L.). Geomicrobiol. J. 2020, 37, 230–241. [Google Scholar] [CrossRef]
  134. Bargaz, A.; Elhaissoufi, W.; Khourchi, S.; Benmrid, B.; Borden, K.A.; Rchiad, Z. Benefits of phosphate solubilizing bacteria on belowground crop performance for improved crop acquisition of phosphorus. Microbiol. Res. 2021, 252, 126842. [Google Scholar] [CrossRef]
  135. Malhotra, H.; Sharma, S.; Pandey, R. Phosphorus nutrition: Plant growth in response to deficiency and excess. In Plant Nutrients and Abiotic Stress Tolerance; Hasanuzzaman, M., Fujita, M., Oku, H., Nahar, K., Hawrylak-Nowak, B., Eds.; Springer Nature Singapore Pte Ltd.: Singapore, 2018; pp. 171–190. [Google Scholar] [CrossRef]
  136. Kozai, T.; Niu, G.; Takagaki, M. Plant Factory: An Indoor Vertical Farming System for Efficient Quality Food Production. In Photosynthesis and Respiration, 2nd ed.; Yamori, W., Ed.; Academic Press: London, UK, 2020; pp. 197–206. [Google Scholar]
  137. Tahir, H.A.; Gu, Q.; Wu, H.; Raza, W.; Hanif, A.; Wu, L.; Colman, M.V.; Gao, X. Plant growth promotion by volatile organic compounds produced by Bacillus subtilis SYST2. Front. Microbiol. 2017, 8, 171. [Google Scholar] [CrossRef]
  138. Silva, L.I.; Pereira, M.C.; Carvalho, A.M.X.; Buttrós, V.H.; Pasqual, M.; Dória, J. Phosphorus-Solubilizing Microorganisms: A Key to Sustainable Agriculture. Agriculture 2023, 13, 462. [Google Scholar] [CrossRef]
  139. Zhao, Y.; Liu, S.; He, B.; Sun, M.; Li, J.; Peng, R.; Sun, L.; Wang, X.; Cai, Y.; Wang, H.; et al. Phosphate-solubilising bacteria promote horticultural plant growth through phosphate solubilisation and phytohormone regulation. N. Z. J. Crop Hortic. Sci. 2024, 52, 125–140. [Google Scholar] [CrossRef]
  140. Zubair, M.; Hanif, A.; Farzand, A.; Sheikh, T.M.M.; Khan, A.R.; Suleman, M.; Ayaz, M.; Gao, X. Genetic screening and expression analysis of psychrophilic Bacillus sp. reveal their potential to alleviate cold stress and modulate phytohormones in wheat. Microorganisms 2019, 7, 337. [Google Scholar] [CrossRef]
  141. Safirzadeh, S.; Chorom, M.; Enayatizamir, N. Effect of phosphate solubilising bacteria (Enterobacter cloacae) on phosphorus uptake efficiency in sugarcane (Saccharum officinarum L.). Soil Res. 2019, 57, 333–341. [Google Scholar] [CrossRef]
  142. Santos, H.G.; Jacomine, P.K.T.; Anjos, L.H.C.; Oliveira, V.A.; Lumbreras, J.F.; Coelho, M.R.; Almeida, J.A.; Araújo-Filho, J.C.; Oliveira, J.B.; Cunha, T.J.F. Sistema Brasileiro de Classificação de Solos, 5th ed.; Embrapa Solos: Brasília, Brazil, 2018. [Google Scholar]
  143. Patrício, F.R.A.; Almeida, I.M.G.; Santos, A.S.; Cabral, O.; Tessarioli Neto, J.; Sinigaglia, C.; Beriam, L.O.S.; Rodrigues Neto, J. Avaliação da solarização do solo para o controle de Ralstonia solanacearum. Fitopatol. Bras. 2005, 30, 475–481. [Google Scholar] [CrossRef]
  144. Vitti, G.C.; Luz, P.H.C.; Altran, W.S. Nutrição e Adubação. In Cana-de-Açúcar: Do Plantio à Colheita; Santos, F., Bórem, A., Eds.; UFV: Viçosa, Brazil, 2015; pp. 49–79. [Google Scholar]
  145. Braga Junior, R.L.C.; Landel, M.G.A.; Silva, D.N.; Bidóia, M.A.P.; Silva, T.N.; Silva, V.H.P.; Luz, A.M.; Anjos, I.A. Censo Varietal IAC: Região Centro-Sul—Safra 2019/20; Technical Bulletin 225; Instituto Agronômico de Campinas: Campinas, Brazil, 2021. [Google Scholar]
  146. van Raij, B.; Cantarella, H.; Quaggio, J.A.; Furlani, A.M.C. Recomendações de Adubação e Calagem Para o Estado de São Paulo; Instituto Agronômico de Campinas: Campinas, Brazil, 1997. [Google Scholar]
  147. Mazumdar, R.K.; Chakider, B.P.; Mukherjee, S.K. Selection and classification of mango root stocks in the nursery stage. Acta Hortic. 1969, 24, 101–106. [Google Scholar] [CrossRef]
  148. Schreiber, J.; Bilger, W.; Hormann, H.; Neubauer, C. Chlorophyll fluorescence as a diagnostic tool: Basics and some aspects of practical relevance. In Photosynthesis: A Comprehensive Treatise; Raghavendra, A.S., Ed.; Cambridge University Press: Cambridge, UK, 1998; pp. 320–336. [Google Scholar]
  149. Wellburn, A.R. The spectral determination of chlorophylls a and b, as well as total carotenoids, using various solvents with spectrophotometers of different resolution. J. Plant Physiol. 1994, 144, 307–313. [Google Scholar] [CrossRef]
  150. Bradford, M.M. A rapid and sensitive method for the quantitation of microgram quantities of protein utilizing the principle of protein-dye binding. Anal. Biochem. 1976, 72, 248–254. [Google Scholar] [CrossRef]
  151. Dubois, M.; Gilles, K.A.; Hamilton, J.K.; Rebers, P.A.; Smith, F. Colorimetric method for determination of sugars and related substances. Anal. Biochem. 1956, 28, 350–356. [Google Scholar] [CrossRef]
  152. Yemm, E.W.; Cocking, E.C. The determination of amino acids with ninhydrin. Analyst 1955, 80, 209–213. [Google Scholar] [CrossRef]
  153. Ozawa, K.; Osaki, M.; Matisui, H.; Honma, M.; Tadano, T. Purification and properties of acid phosphatase secreted from lupin roots under phosphorus-deficiency conditions. J. Soil Sci. Plant Nutr. 1995, 41, 461–469. [Google Scholar] [CrossRef]
  154. van Raij, B.; Quaggio, J.A.; Cantarella, H.; Abreu, C.A. Os métodos de análise química do sistema IAC de análise de solo no contexto nacional. In Análise Química Para Avaliação da Fertilidade de Solos Tropicais; van Raij, B., Andrade, J.C., Cantarella, H., Quaggio, J.A., Eds.; Instituto Agronômico de Campinas: Campinas, Brazil, 2001; pp. 5–39. [Google Scholar]
  155. Malavolta, E.; Vitti, G.C.; Oliveira, A.S. Avaliação do Estado Nutricional de Plantas: Princípios e Aplicações, 2nd ed.; Potafós: Piracicaba, Brazil, 1997. [Google Scholar]
  156. McCray, J.M.; Mylavarapu, R. Sugarcane Nutrient Management Using Leaf Analysis; SS-AGR-259; University of Florida—Institute of Food and Agricultural Sciences: Gainesville, FL, USA, 2010; Available online: http://edis.ifas.ufl.edu/sc076 (accessed on 29 June 2025).
  157. AOAC. Official Methods of Analysis of AOAC International; AOAC International: Rockville, MD, USA, 2016. [Google Scholar]
  158. Hair, J.F.; Black, W.C., Jr.; Babin, B.J.; Anderson, R.E.; Tatham, R.L. Análise Multivariada de Dados, 6th ed.; Bookman: Porto Alegre, Brazil, 2009. [Google Scholar]
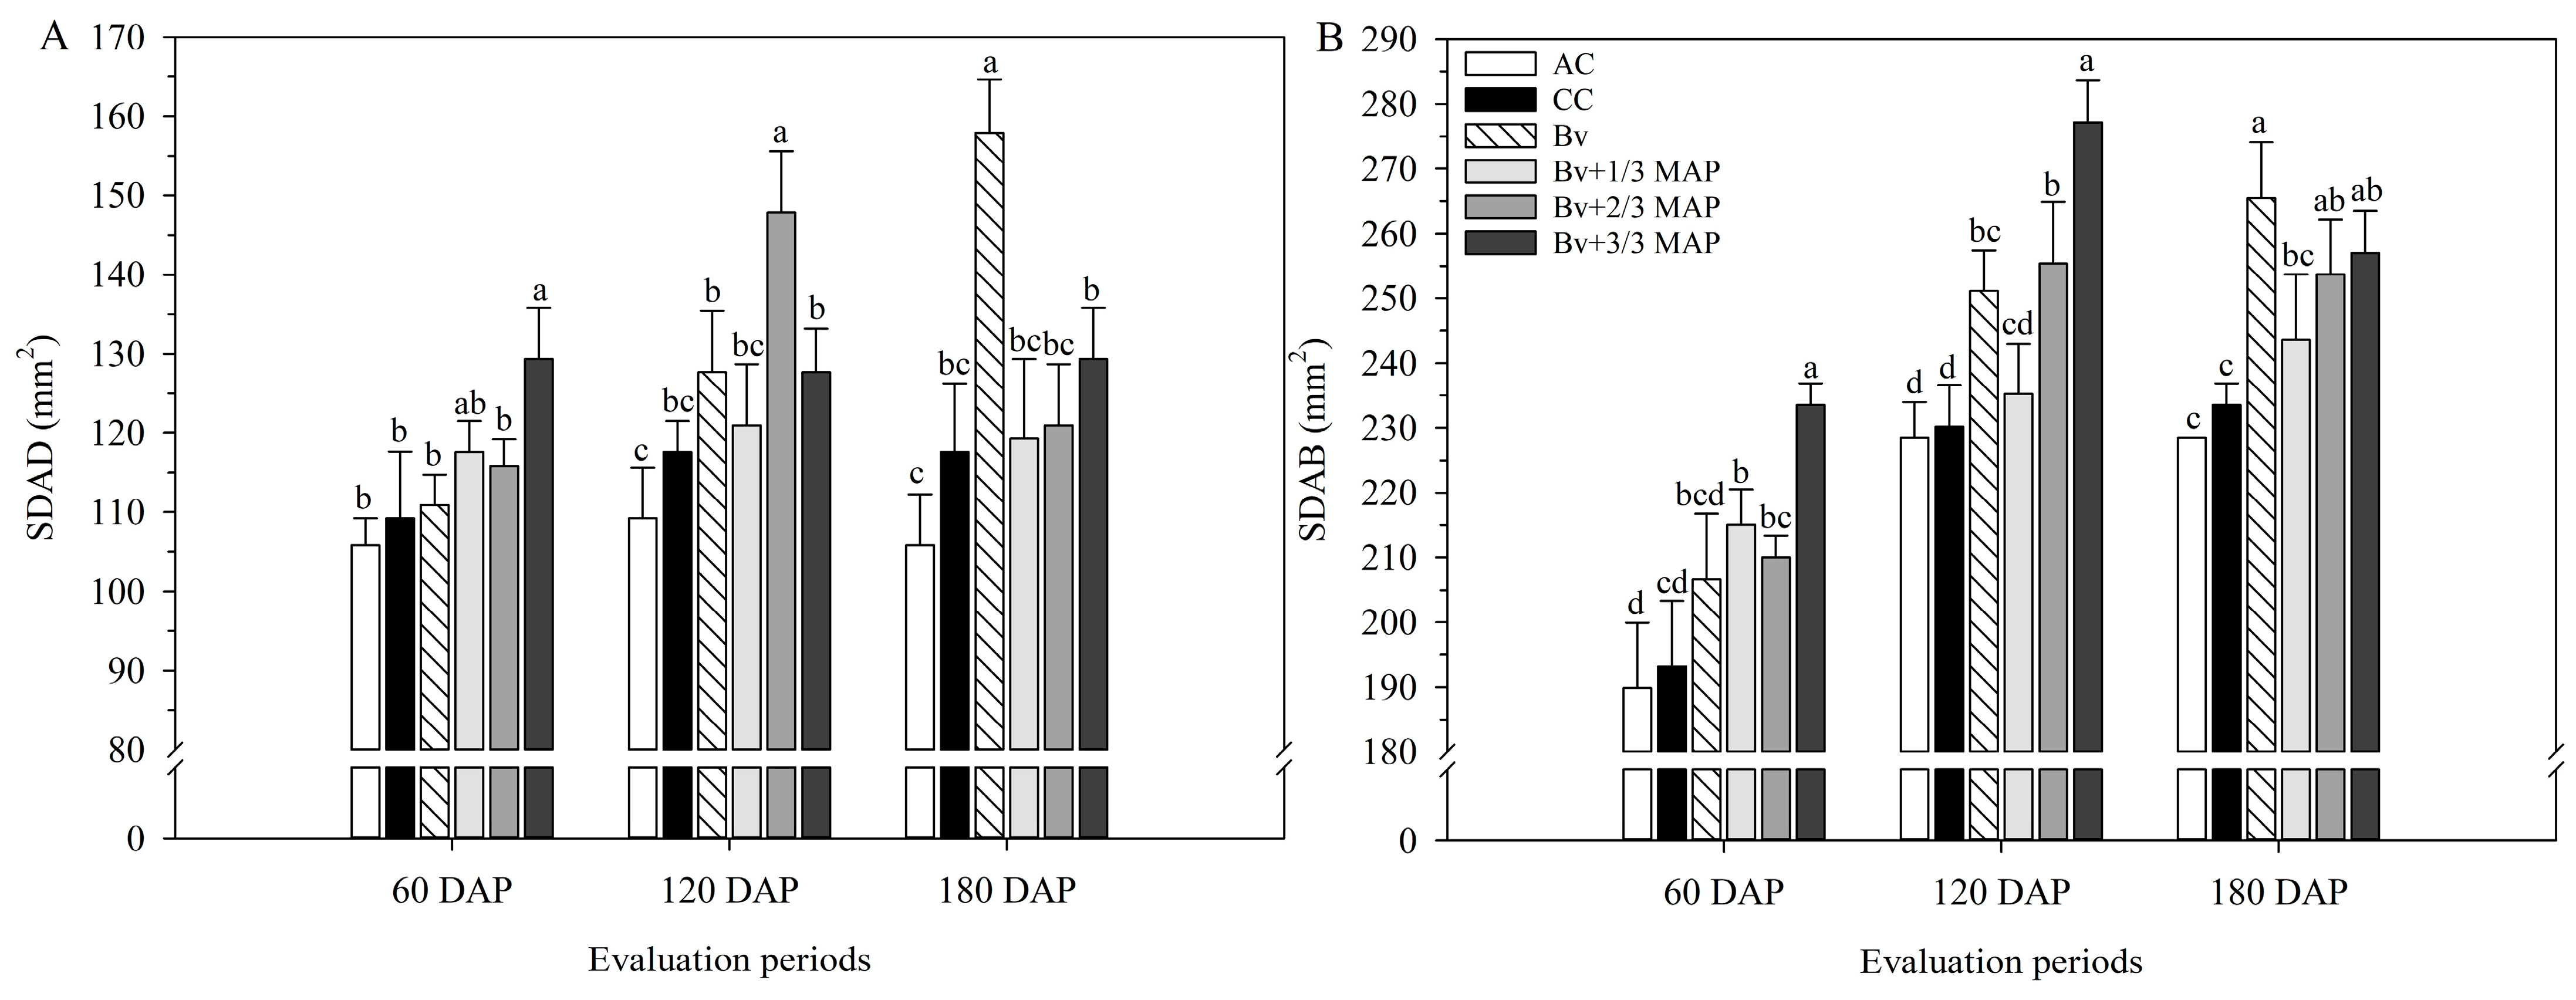
Figure 1. Adaxial stomatal density (SDAD) (A) and abaxial stomatal density (SDAB) (B) of sugarcane leaves under treatments with and without inoculation of Bacillus velezensis UFV 3918 (Bv) and doses of mono ammonium phosphate (MAP), at 60, 120, and 180 DAP. Averages followed by the same letter do not differ according to Tukey’s test at 5% probability. The error bars express the standard deviation of the mean (n = 4). AC: absolute control (without MAP); CC: commercial control (3/3 MAP—100% of recommended MAP dose, without Bv).
Plants 14 02732 g001
Figure 2. Relative electron transport rate (ETR) (A), potential quantum yield of PSII (Fv/Fm) (B), effective quantum yield of linear electron flow through PSII (φPSII) (C), photochemical quenching (qP) (D), non-photochemical quenching (NPQ) (E), maximum variable quantum yield of PSII (Fv/Fm) (F) of sugarcane plants under treatments with and without inoculation of Bacillus velezensis UFV 3918 (Bv) and doses of mono ammonium phosphate (MAP), at 60, 120, and 180 DAP. Averages followed by the same letter do not differ according to Tukey’s test at 5% probability. The error bars express the standard deviation of the mean (n = 4). AC: absolute control (without MAP); CC: commercial control (3/3 MAP—100% of recommended MAP dose, without Bv).
Plants 14 02732 g002
Figure 3. Net CO2 assimilation rate (A) (A), stomatal conductance (gs) (B), transpiration rate (E) (C), intercellular CO2 concentration (Ci) (D), and night respiration (Rd) (E) of sugarcane plants under treatments with and without inoculation of Bacillus velezensis UFV 3918 (Bv) and doses of mono ammonium phosphate (MAP), at 60, 120, and 180 DAP. Averages followed by the same letter do not differ according to Tukey’s test at 5% probability. The error bars express the standard deviation of the mean (n = 4). AC: absolute control (without MAP); CC: commercial control (3/3 MAP—100% of recommended MAP dose, without Bv).
Plants 14 02732 g003
Figure 4. Instantaneous water use efficiency (WUE) (A) and instantaneous carboxylation efficiency (CE) (B) of sugarcane plants under treatments with and without inoculation of Bacillus velezensis UFV 3918 (Bv) and doses of mono ammonium phosphate (MAP), at 60, 120, and 180 DAP. Averages followed by the same letter do not differ according to Tukey’s test at 5% probability. The error bars express the standard deviation of the mean (n = 4). AC: absolute control (without MAP); CC: commercial control (3/3 MAP—100% of recommended MAP dose, without Bv).
Plants 14 02732 g004
Figure 5. Contents of chlorophyll a (Chla) (A), chlorophyll b (Chlb) (B), and total chlorophyll (Chl total) (C), Chla/Chlb ratio (D), and carotenoid content (E) of sugarcane leaves under treatments with and without inoculation of Bacillus velezensis UFV 3918 (Bv) and doses of mono ammonium phosphate (MAP), at 60, 120, and 180 DAP. Averages followed by the same letter do not differ according to Tukey’s test at 5% probability. The error bars express the standard deviation of the mean (n = 4). AC: absolute control; CC: commercial control. AC: absolute control (without MAP); CC: commercial control (3/3 MAP—100% of recommended MAP dose, without Bv).
Plants 14 02732 g005
Figure 6. Protein content (A), total soluble sugars (B), total amino acids (C), and acid phosphatase activity (D) in sugarcane leaves under treatments with and without inoculation of Bacillus velezensis UFV 3918 (Bv) and doses of mono ammonium phosphate (MAP). Averages followed by the same letter do not differ according to Tukey’s test at 5% probability. The error bars express the standard deviation of the mean (n = 4). The regression equations and R2 refer to the association between Bv and MAP doses at a 5% significance level. AC: absolute control (without MAP); CC: commercial control (3/3 MAP—100% of recommended MAP dose, without Bv).
Plants 14 02732 g006
Figure 7. Visual appearance of sugarcane plant stalks under treatments with and without inoculation with Bacillus velezensis UFV 3918 (Bv) and mono ammonium phosphate (MAP) doses. AC: absolute control (without MAP); CC: commercial control (3/3 MAP—100% of recommended MAP dose, without Bv).
Plants 14 02732 g007
Figure 8. Shoot biomass (SB) of sugarcane plants at 180 DAP, under treatments with and without inoculation of Bacillus velezensis UFV 3918 (Bv) and doses of mono ammonium phosphate (MAP). Averages followed by the same letter do not differ according to Tukey’s test at 5% probability. The error bars express the standard deviation of the mean (n = 4). The regression equations and R2 refer to the association between Bv and MAP doses at a 5% significance level. AC: absolute control (without MAP); CC: commercial control (3/3 MAP—100% of recommended MAP dose, without Bv).
Plants 14 02732 g008
Figure 9. Variable loads of the components: stomatal density (A), photochemistry (B), gas exchange (C), photosynthetic pigments (D), and leaf biochemistry (E). Light gray indicates a positively charged variable; dark gray indicates a negatively charged variable. SDAD: adaxial stomatal density; SDAB: abaxial stomatal density; ETR: relative electron transport rate; Fv/Fm: potential quantum yield of PSII; φPSII: effective quantum yield of linear electron flow through PSII; qP: photochemical quenching, NPQ: non-photochemical quenching; Fv/Fm: maximum variable quantum yield of PSII; A: net CO2 assimilation rate; gs: stomatal conductance; E: transpiration rate; Ci: intercellular CO2 concentration; Rd: night respiration; WUE: instantaneous water use efficiency; CE: instantaneous carboxylation efficiency; chlorophyll a content: Chla; chlorophyll b content: Chlb; carotenoid content: CAR.
Plants 14 02732 g009
Figure 10. Dispersion of observations in the first component of stomatal density (A), photochemistry (B), gas exchange (C), photosynthetic pigments (D), and leaf biochemistry (E). AC: absolute control (without mono ammonium phosphate—MAP); CC: commercial control (3/3 MAP—100% of recommended MAP dose, without Bv); Bacillus velezensis UFV 3918 (Bv); Bv + 1/3 MAP; Bv + 2/3 MAP; Bv + 3/3 MAP.
Plants 14 02732 g010
Figure 11. Pearson’s correlation between the first principal components of each variable group. ** indicates a significant correlation at p ≤ 0.01.
Plants 14 02732 g011
Figure 12. Average, maximum, and minimum air temperature and relative humidity inside the protected environment during the experimental period. Adapted from Santos et al. [58]. E1: 1st evaluation (60 DAP); E2: 2nd evaluation (120 DAP); E3: 3rd evaluation (180 DAP).
Plants 14 02732 g012
Table 1. Phosphorus (P) content in the soil and shoot P accumulation in sugarcane, under treatments with and without inoculation of Bacillus velezensis UFV 3918 (Bv) and doses of mono ammonium phosphate (MAP), after 180 days of cultivation.
TreatmentsP in the Soil (mg dm–3)P Accumulated in Sugarcane (g plant−1)
AC24.95 d0.62 c
CC33.30 c0.72 b
Bv42.02 a0.80 a
Bv + 1/3 MAP39.22 ab0.72 b
Bv + 2/3 MAP37.00 bc0.75 ab
Bv + 3/3 MAP41.01 a0.75 ab
C.V. (%)6.615.10
RegressionY = 2.5 × 10–5×3 − 2.21 × 10–3×2 − 0.0389x + 42.02 (R2 = 0.70)Y = −1 × 10–6x3 + 1.18 × 10–4x2 − 5.52 × 10⁻³x + 0.798 (R2 = 0.70)
Averages followed by the same letter do not differ according to Tukey’s test at 5% probability. The regression equations and R2 refer to the association between Bv and MAP doses at a 5% significance level. AC: absolute control (without MAP); CC: commercial control (3/3 MAP—100% of recommended MAP dose, without Bv); C.V.: coefficient of variation.
Table 2. Explanation of the percentage of the first component of variables: stomatal density, photochemistry, gas exchange, photosynthetic pigments, and leaf biochemistry.
Groups of VariablesExplanation Percentage (%)
Stomatal density72.98
Photochemistry84.64
Gas exchange79.07
Photosynthetic pigments82.32
Leaf biochemistry98.29
Disclaimer/Publisher’s Note: The statements, opinions and data contained in all publications are solely those of the individual author(s) and contributor(s) and not of MDPI and/or the editor(s). MDPI and/or the editor(s) disclaim responsibility for any injury to people or property resulting from any ideas, methods, instructions or products referred to in the content.