Article

Genome-Wide Identification of Natural Resistance-Associated Macrophage Protein (NRAMP) and Expression Analysis Under Heavy Metal Stress in Sorghum bicolor L.

1
School of Life Sciences, Guizhou Normal University, Guiyang 550025, China
2
National Key Laboratory for Germplasm Innovation & Utilization of Horticultural Crops, College of Horticulture & Forestry Sciences, Huazhong Agricultural University, Wuhan 430070, China
*
Authors to whom correspondence should be addressed.
These authors contributed equally to this work.
Plants 2025, 14(17), 2660; https://doi.org/10.3390/plants14172660
Submission received: 3 June 2025 / Revised: 19 August 2025 / Accepted: 20 August 2025 / Published: 26 August 2025
(This article belongs to the Collection Feature Papers in Plant Molecular Biology)

Abstract

The NRAMP (Natural Resistance-Associated Macrophage Protein) family plays a pivotal role as membrane transporters in plants’ responses to heavy metal stress. This study identified 12 NRAMP genes in Sorghum bicolor (sorghum) and performed a comprehensive bioinformatics analysis. The SbNRAMP genes are distributed across seven sorghum chromosomes. In-depth analyses of gene structure, conserved motifs, collinearity, and phylogeny indicated that the SbNRAMP family is divided into three subfamilies, each exhibiting unique structural and motif characteristics. Collinearity analysis suggested that large-fragment duplications, rather than tandem duplications, were responsible for the expansion of the SbNRAMP family, resulting in a greater number of genes compared to Arabidopsis thaliana and rice. Transcriptome analysis of the aboveground and underground parts of sorghum seedlings under saline–alkali stress revealed that SbNRAMP5 is a key hub gene exhibiting tissue-specific expression. Furthermore, qRT-PCR analysis following exposure to Cd, Mn, or Zn treatments revealed differential expression among the SbNRAMP genes. Subcellular localization predictions indicated that all twelve NRAMPs are primarily located in the plasma membrane, with nine to twelve transmembrane domains, consistent with their function in metal ion transport. Experimental evidence confirmed that SbNRAMP6 is localized in the plasma membrane. These findings establish a foundation for a deeper understanding of the structure and function of the sorghum NRAMP gene family.

1. Introduction

Metal ions play a variety of crucial roles in plants, significantly influencing their metabolic processes [1]. For instance, copper (Cu) deficiency can result in stunted growth and diminished plant stature [2]. Meanwhile, magnesium (Mg) deficiency adversely affects chloroplast formation, thereby impairing photosynthesis [3]. Zinc (Zn) is essential for regulating auxin metabolism and plant growth [4]. Manganese (Mn) is vital for numerous physiological activities, including photosynthesis, flavonoid synthesis, and the activation of enzyme hormones [5]. Furthermore, certain transition metals, such as iron (Fe), zinc (Zn), and copper (Cu), act as biocatalysts and structural cofactors, thereby enhancing the diversity of protein structures and functions through their binding to proteins [6]. Conversely, excessive concentrations of metals can be detrimental to plants. High levels of copper can damage the root apical meristem, inhibit root elongation, and reduce lateral root formation. Similarly, excessive zinc can disrupt the structure of chloroplasts and diminish the activity of chlorophyll synthase [7]. Certain heavy metals, such as cadmium (Cd) and manganese (Mn), exhibit toxic effects on plant growth and development [8]. In recent years, industrial development has resulted in significant emissions of heavy metals into the environment. Concurrently, heavy metals introduced during the production and use of chemical nitrogen fertilizers have emerged as a critical source of soil pollution [9]. These pollutants not only diminish crop yields but also pose a serious threat to human health [10].
Sorghum bicolor (Hongyingzi) is a monocotyledonous plant belonging to the genus Sorghum within the family Poaceae. It is characterized as a typical diploid plant with a chromosome number of 2n = 20 [11,12]. As one of the world’s top five cereal crops in terms of yield and area cultivated, sorghum is a unique multi-purpose crop and extensively cultivated in regions subject to severe conditions, including drought and saline–alkali soils, due to its remarkable resistance to abiotic stresses [13]. Based on its domestication pathways and utilization characteristics, it can be categorized into three types, grain sorghum, energy sorghum, and silage sorghum, all of which hold significant breeding and economic value [14]. Due to its remarkable resistance, sorghum effectively alleviates various abiotic stresses, such as salinity and drought. Consequently, it has emerged as a viable phytoremediation strategy to mitigate soil heavy metal pollution [15]. Compared to traditional remediation methods, phytoremediation technology offers significant advantages, including environmental sustainability and the absence of secondary pollution. This technology is considered one of the key adaptive strategies for addressing soil pollution and degradation, thereby enhancing the quality and resilience of cultivated land [16]. Consequently, an in-depth exploration of the absorption, transport, and degradation mechanisms of heavy metals by sorghum, a gramineous plant, not only enhances soil remediation efficiency but also holds significant practical implications for reducing heavy metal residues in agricultural products.
NRAMPs (Natural Resistance-Associated Macrophage Proteins) play a crucial role in the transmembrane transport of metal ions in plants. This protein family can significantly mitigate the adverse effects of heavy metals on plant growth [17]. Further exploration has revealed that the NRAMP gene family plays a crucial role in the uptake and transport of nutritionally essential divalent cations, including Fe2+, Mn2+, and Zn2+. Notably, these transporters also facilitate the absorption and transport of Cd2+ in plants [18]. Studies have demonstrated that the NRAMP gene family is widely distributed across animals, plants, and bacteria, with a notable prevalence in plants. There are substantial variations in the number of NRAMP gene family members among different plant species. For instance, Oryza sativa contains 7 NRAMP gene family members [19], Setaria italica has 12 [20], and Brassica napus possesses 22 [21], while A. thaliana only has 6 NRAMP gene members [22]. Research indicates that the NRAMP gene family is vital for various plant species. For instance, AtNRAMP1 functions as a high-affinity manganese transporter; its loss of function significantly inhibits plant growth under manganese stress [23]. In rice, OsNRAMP1, a divalent metal transporter primarily responsible for the uptake of ions such as Fe and Mn, has also been identified as a critical regulator of Cd accumulation. Gene knockout experiments have demonstrated that the deletion of OsNRAMP1 significantly reduces the uptake and transport of cadmium in rice [24]. In Arachis hypogaeas, Mn or Zn deficiency in roots and stems strongly induced the transcription level of AhNRAMP1 [25]. In Triticum aestivum, TaNRAMP5 encodes a transporter for Mn and Fe. Its overexpression enhances Cd tolerance in both wheat and tobacco, likely due to the competition between Cd and essential metals for transport or the alteration of metal homeostasis [26]. Moreover, studies have shown that salt treatment can affect the homeostasis of metal ions in plants and induce the expression of NRAMP genes, and it is accompanied by the accumulation of iron, zinc, and copper ions in the leaves [27].
In this study, we performed a comprehensive genome-wide identification and systematic characterization of the NRAMP gene family in sorghum using bioinformatics approaches. The identified SbNRAMP members were subjected to multi-dimensional characterization encompassing gene structure characteristics, conserved motif analysis, phylogenetic relationships, subcellular localization prediction, and tissue expression patterns. Furthermore, we systematically studied the expression profile of the SbNRAMP genes in response to metal stresses. Sorghum seedlings were treated with Mn2+, Zn2+, or Cd2+, and the gene expression profiles were subsequently analyzed. This comprehensive analysis provides novel insights into the functional divergence of SbNRAMP genes, establishing a theoretical foundation for the identification of key candidate genes involved in sorghum molecular breeding and phytoremediation potential.

2. Results

2.1. Identification of SbNRAMP Gene Family Members and Analysis of Their Physicochemical Properties

Within the sorghum genome, 12 SbNRAMP genes were identified utilizing TBtools and the Pfam online tool. These genes were designated based on their chromosomal positions, and their physicochemical properties were characterized (Table 1). SbNRAMPs vary in length from 466 to 1236 amino acids, with molecular weights ranging from 50.75 to 134.71 kDa. Theoretical isoelectric points range from 4.89 to 8.52, with only SbNRAMP1, 6, 10, and 12 exceeding a pI of 7, indicating that the majority of family members are acidic. The instability for SbNRAMP3, 8, and 10 exceeds 40, suggesting that these proteins are less stable, while the remaining proteins are generally stable, with instability coefficients below 40. The hydrophilicity index of SbNRAMP8 is negative, whereas the indices for the others are positive, indicating that most SbNRAMPs are hydrophobic.

2.2. SbNRAMP Gene Members Were Mapped on Seven Chromosomes

Chromosomal mapping identified the precise locations of SbNRAMP gene family members in sorghum (Figure 1); the distribution is uneven across the seven chromosomes. Chromosome 1 contains the highest number of SbNRAMP genes (five), while chromosome 2 harbors two genes. Additionally, one SbNRAMP gene is present on chromosomes 3, 4, 5, 8, and 10. Most genes are situated near chromosome ends, away from centromeric regions. Given that centromeres and their flanking regions are hotspots for genomic rearrangement and sequence variation [28,29], the observed peripheral localization suggests that SbNRAMP genes have likely maintained structural and functional stability over their evolutionary history by avoiding these dynamic chromosomal regions.

2.3. The Evolutionary Relationships of the Sorghum NRAMP Family in Comparison to Homologous Genes from Various Plant Species

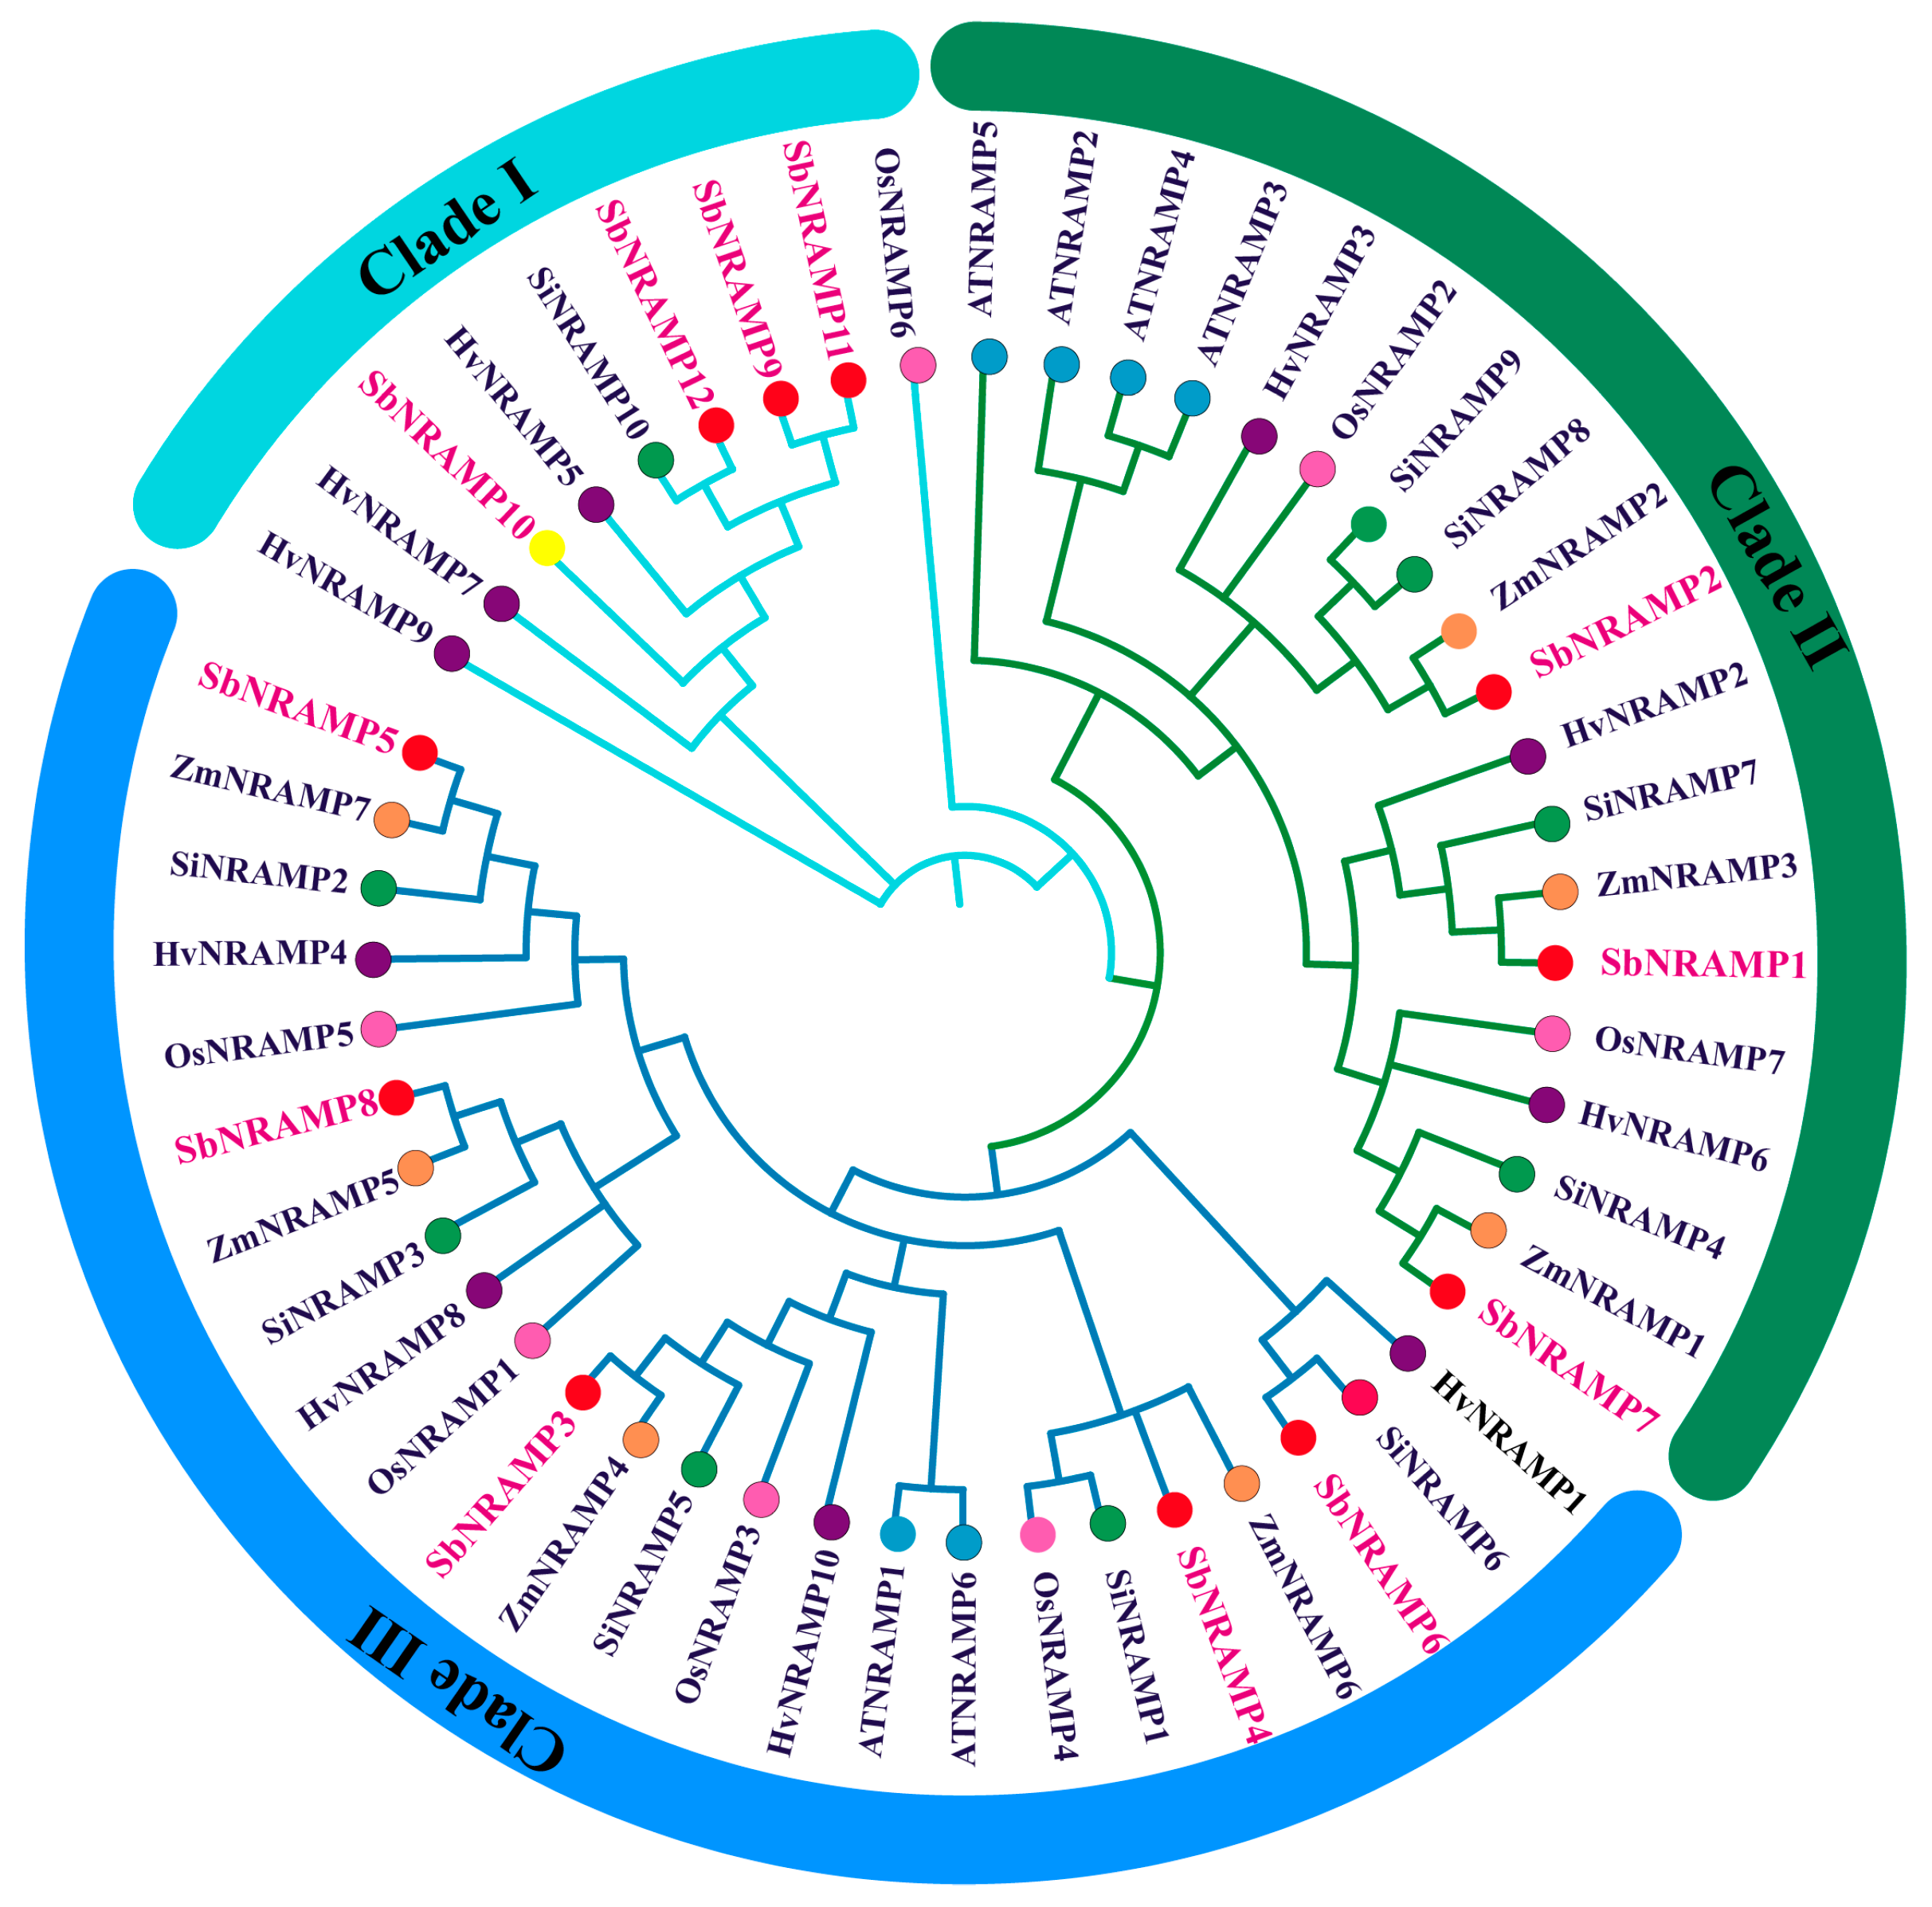
To investigate the evolutionary relationships of the sorghum NRAMP gene family with those from other species, we conducted a phylogenetic analysis utilizing NRAMP sequences derived from Oryza sativa, Arabidopsis thaliana, Setaria italica, Hordeum vulgare, Zea mays, and Sorghum bicolor (Figure 2); the resulting phylogenetic tree comprises three distinct subfamilies, with the 12 SbNRAMPs evenly distributed among them. Further analysis reveals that the SbNRAMPs are most closely related to those found in Z. mays. Several SbNRAMPs exhibit close phylogenetic branches with their maize counterparts, specifically, ZmNRAMP2-SbNRAMP2, ZmNRAMP3-SbNRAMP1, ZmNRAMP7-SbNRAMP5, ZmNRAMP1-SbNRAMP7, ZmNRAMP6-SbNRAMP4, ZmNRAMP5-SbNRAMP8, and ZmNRAMP4-SbNRAMP3. The remaining proteins demonstrate distinct genetic affinities: SbNRAMP6 is closely related to SiNRAMP6 from S. italica; SbNRAMP9, SbNRAMP11, and SbNRAMP12 exhibit close relationships with SiNRAMP10; and SbNRAMP10 shows a strong association with HvNRAMP5 from H. vulgare.

2.4. Comparative Analysis of SbNRAMP Phylogenetic Relationships, Gene Structures, and Conserved Motifs in Sorghum bicolor

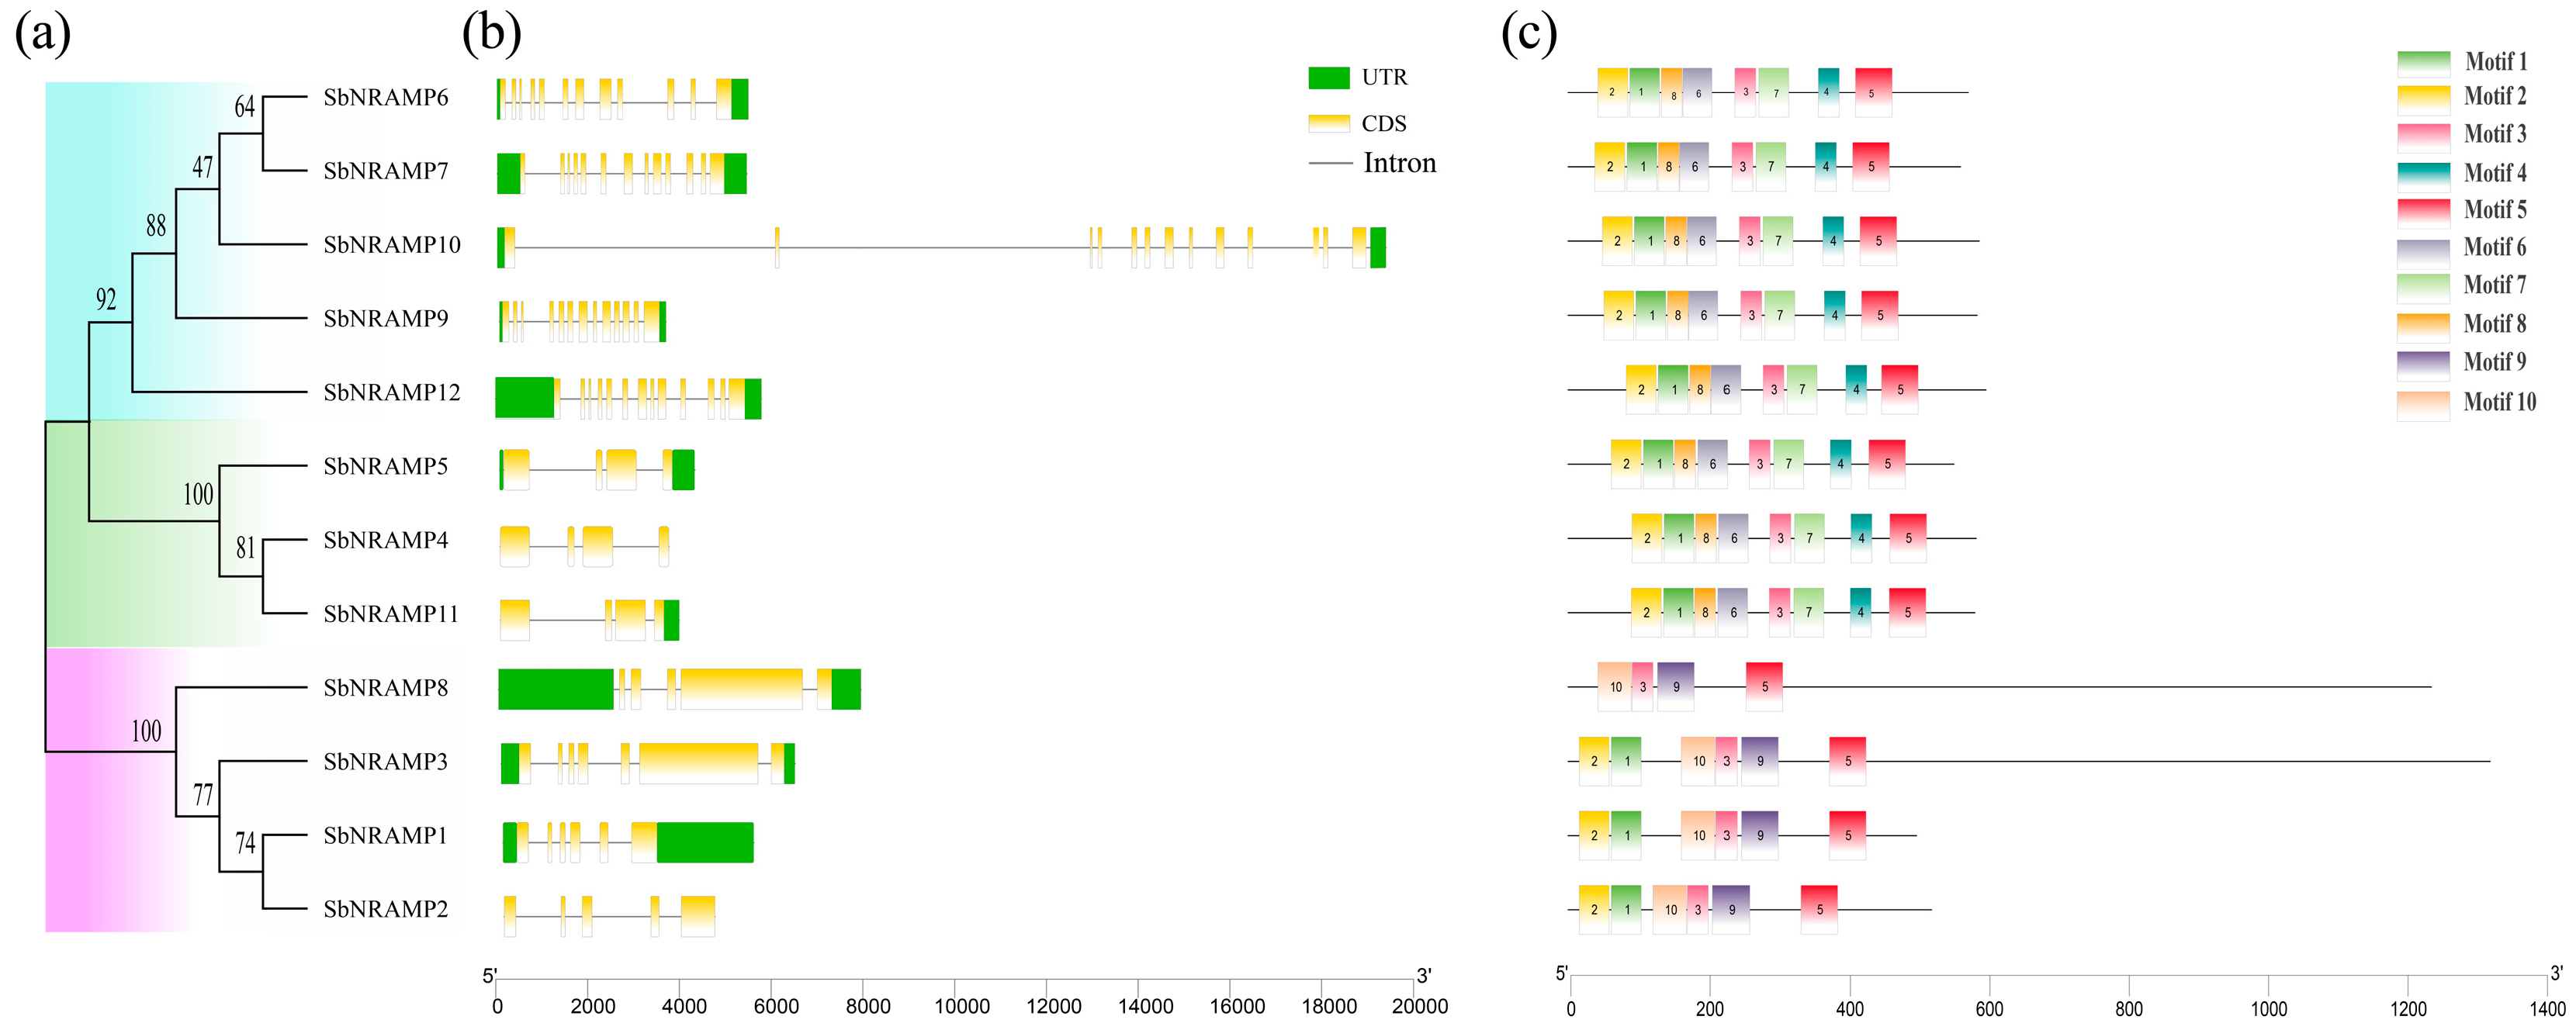
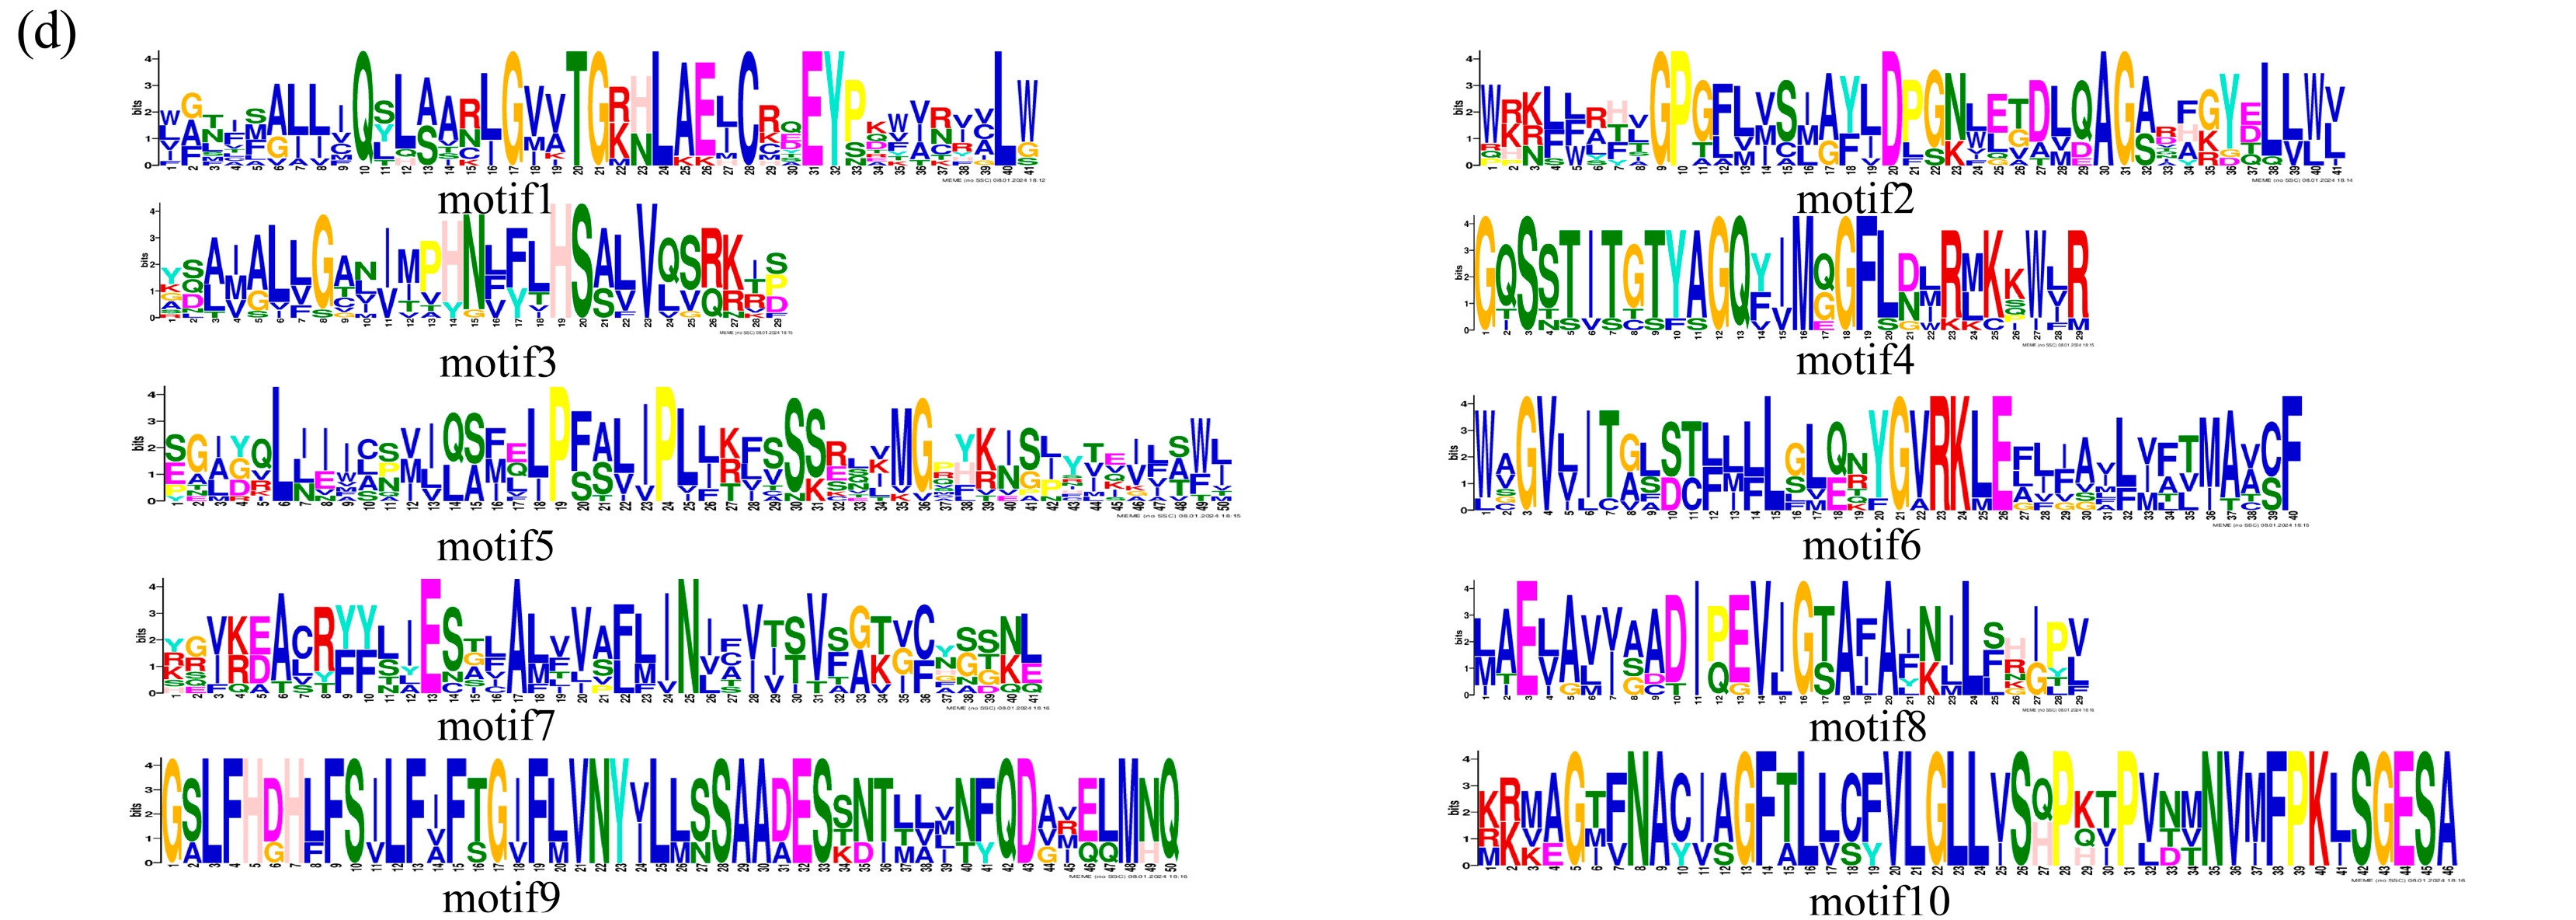
Phylogenetic analysis of the SbNRAMP sequences classified the 12 proteins into three subfamilies (Figure 3a). Subfamily I comprises SbNRAMP6, 7, 9, 10, and 12; subfamily II includes SbNRAMP4, 5, and 11; and subfamily III consists of SbNRAMP1, 2, 3, and 8. Furthermore, we observe that the classification of the three subfamily members diverges from the results obtained through phylogenetic analysis (Figure 2). This discrepancy arises because the 12 genes exhibit varying degrees of protein structural similarity with other species, leading to differing classification outcomes compared to those derived from phylogenetic methods. Structural analysis revealed considerable diversity among these genes (Figure 3b), with intron numbers ranging from 3 to 12 and exon counts varying from 4 to 13. Members of the same subfamily exhibit notable conservation of gene structural features, particularly in terms of highly consistent exon numbers and arrangement patterns. The introns and exons present in each gene are detailed in Table 2. Conserved motif analysis (Figure 3c) identified 10 motifs, with each SbNRAMP containing 4 to 8 motifs. Subfamilies I and II display eight motifs each, indicating structural similarity, while in subfamily III, SbNRAMP8 protein contains only four motifs, and the others each possess six. The amino acid composition and positional frequencies of the motifs are examined in detail by us (Figure 3d).

2.5. Analysis of SbNRAMP Cis-Acting Elements

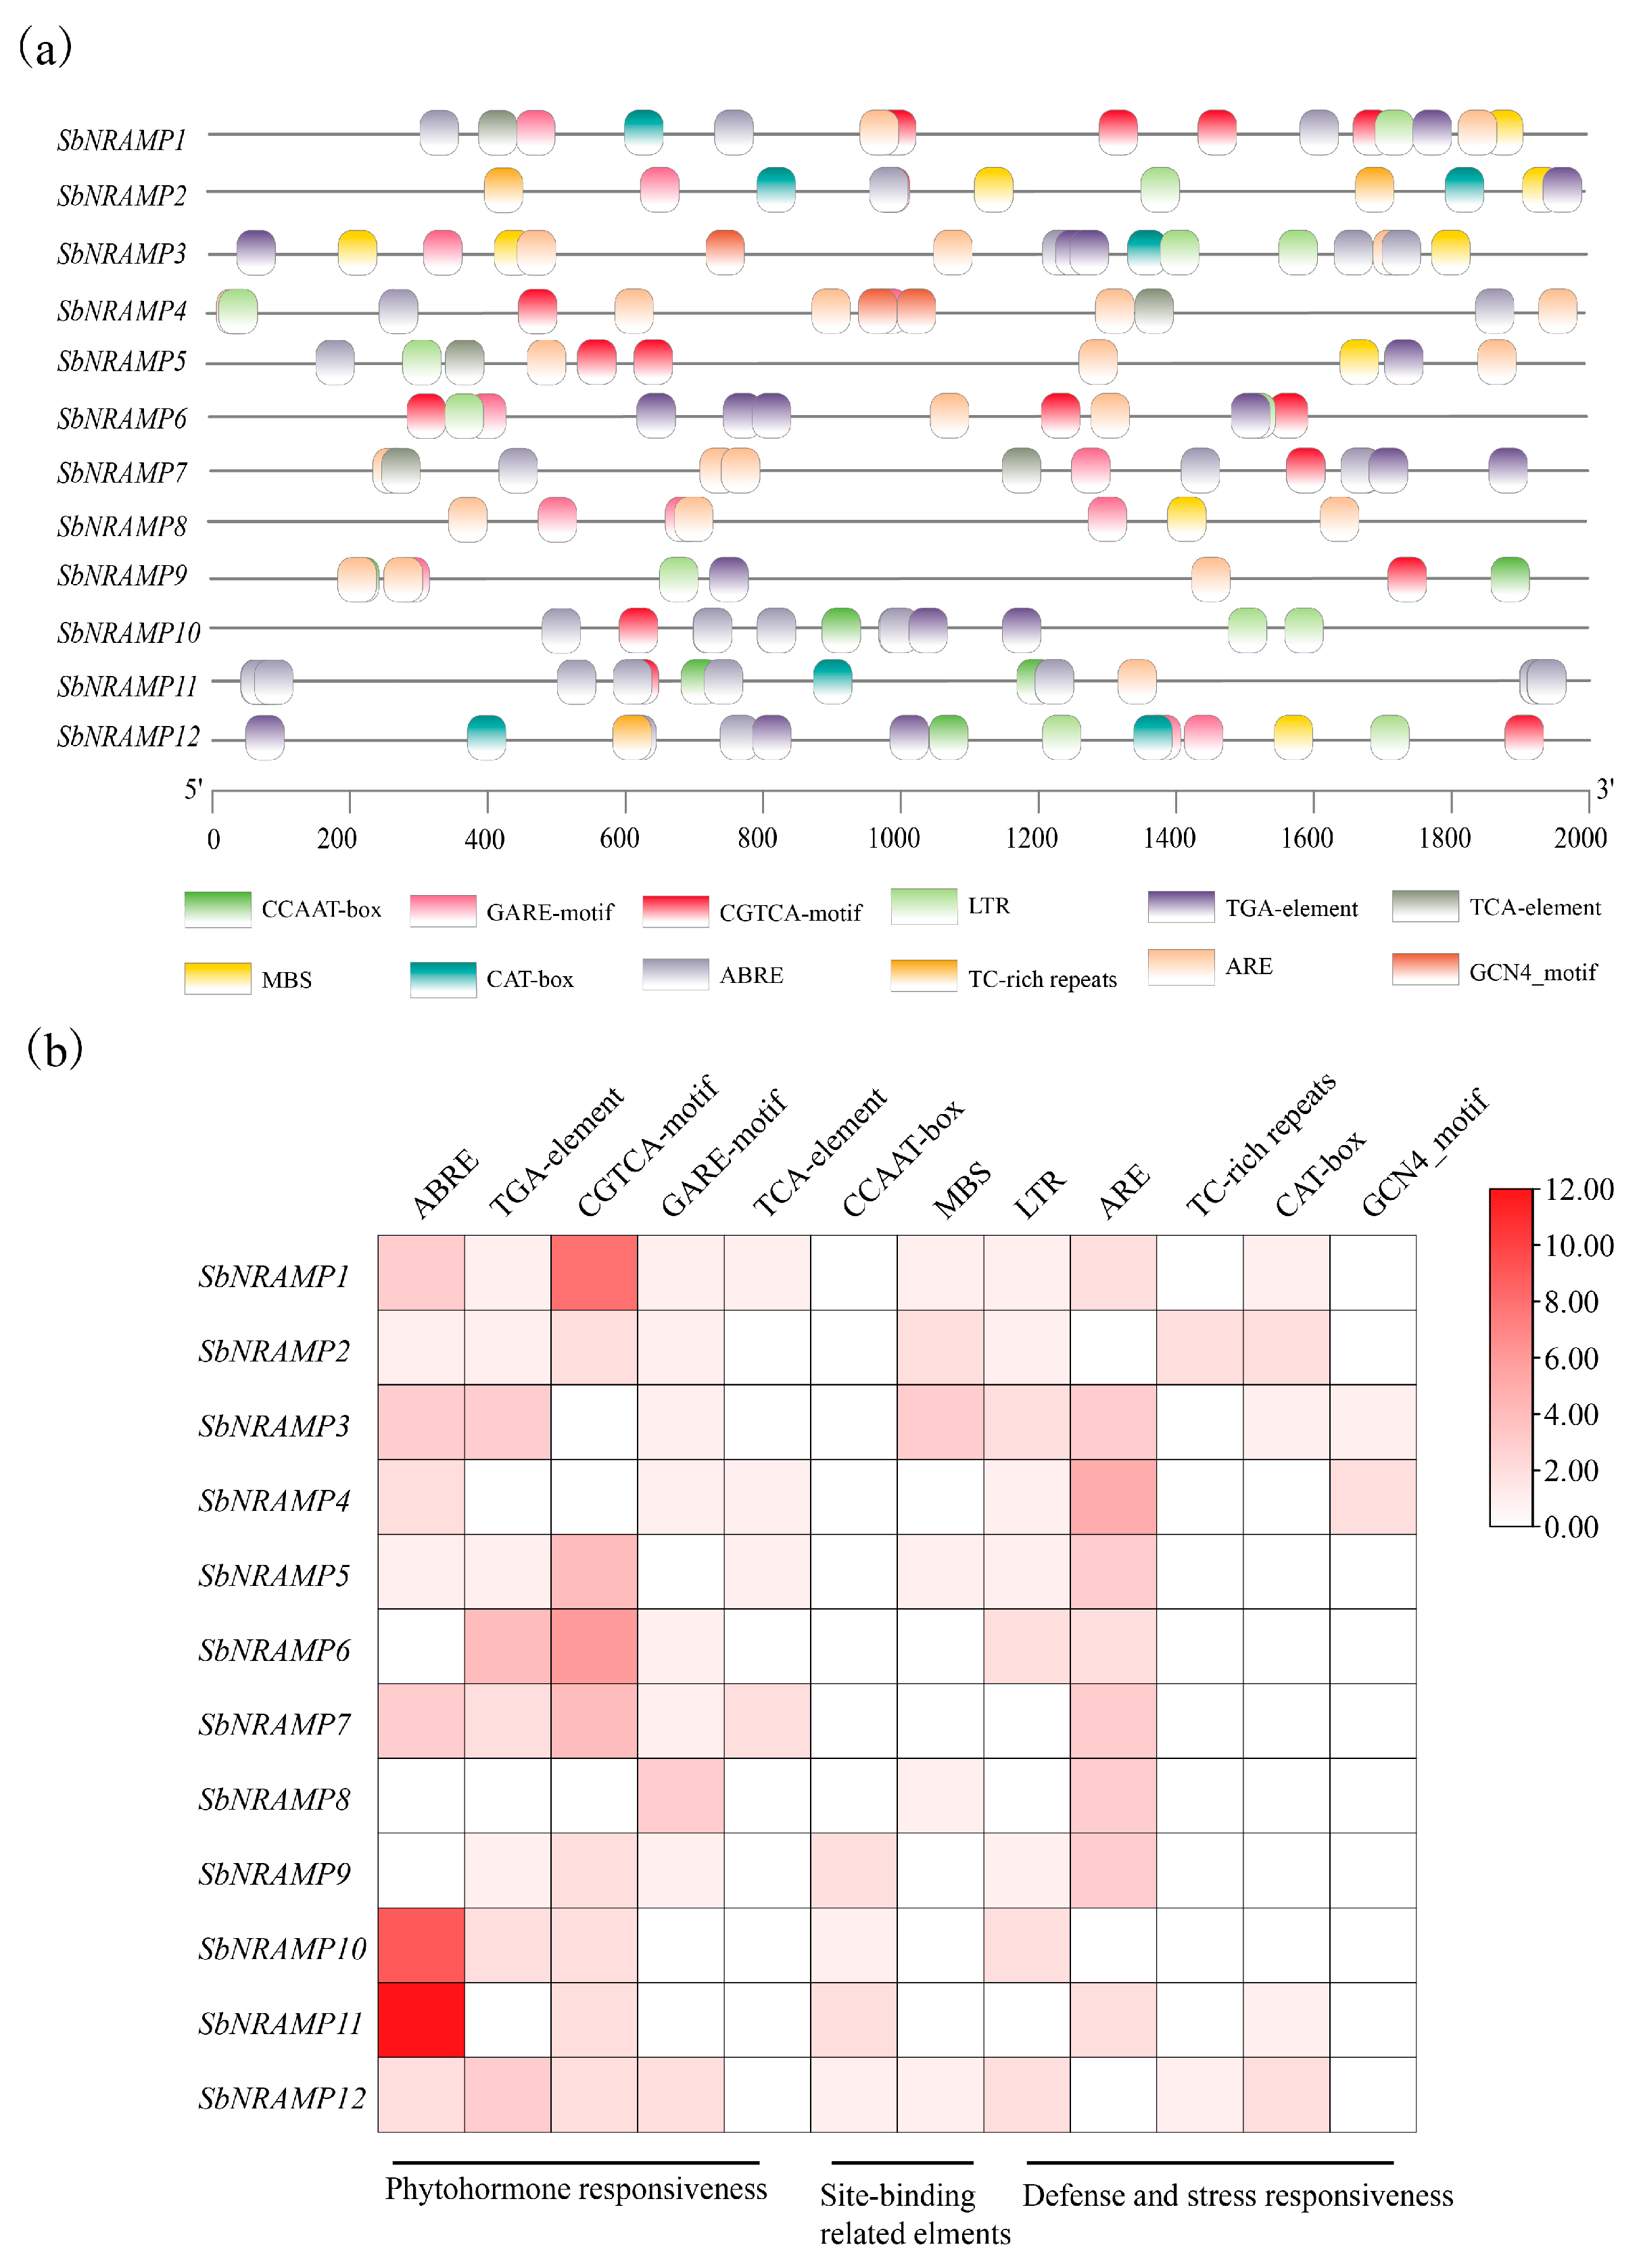
The analysis of the 2000 bp upstream promoter regions of the SbNRAMP genes identified twelve distinct cis-elements (Figure 4a). These promoters are enriched with response elements for abscisic acid, gibberellin, and drought stress, alongside core promoter motifs such as TATA and CAAT boxes. The cis-elements were categorized into five groups: (i) hormone response (ABRE, TGA, CGTCA, GARE, and TCA), (ii) light response (not displayed), (iii) stress response (LTR, ARE, TC-rich repeats, CAT-box, and GCN4-motif), (iv) regulation of plant development (CCAAT-box and MBS), and (v) others (not displayed). This distribution indicates that the SbNRAMP gene family is involved in hormone signaling, drought and stress responses, light-mediated regulation, and various physiological processes essential for sorghum growth, metabolism, and environmental adaptation. The diversity of cis-elements among the promoters suggests potential functional diversification within the SbNRAMP gene family. Heatmap analysis revealed a widespread distribution of hormone-responsive elements, transcription factor binding sites, and defense- and stress-related elements across the promoters (Figure 4b).

2.6. Intraspecific and Interspecific Collinearity Analysis of SbNRAMP

The collinearity analysis of 12 NRAMP family members in sorghum revealed two fragment replication events involving SbNRAMP11 with SbNRAMP5 and SbNRAMP4 (Figure 5a). The SbNRAMP11 gene underwent two substantial replication events in different orientations, leading to these events occurring on distinct chromosomes. This suggests that the SbNRAMP11 gene has experienced significant replication during evolution. In comparison to rice and A. thaliana, the number of SbNRAMP gene family members in sorghum has increased, which may be attributed to the extensive replication events of SbNRAMP gene family members.
Collinearity analysis revealed syntenic relationships between sorghum and two monocot species. In the comparison between sorghum and maize (Figure 5b), 12 collinear gene pairs were identified, distributed across different chromosomes of maize. Additionally, in the case of sorghum and rice, nine collinear gene pairs were found on rice chromosomes 2, 3, 6, 7, and 12 (Figure 5c) in the cruciferous dicotyledonous plant A. thaliana, and for sorghum, a collinear gene pair on chromosome 5 of A. thaliana was identified. This finding indicates that sorghum exhibits a closer evolutionary relationship with NRAMP genes in maize and rice than with those in A. thaliana.

2.7. Subcellular Localization Prediction, Transmembrane Domain Prediction, Protein Structure, and Sequence Analyses of SbNRAMP

Subcellular localization and transmembrane domain analyses were conducted to evaluate the roles of SbNRAMPs in heavy metal transport. According to Table 2, SbNRAMP3 is predicted to localize to the plasma membrane and nucleus, while SbNRAMP8 is expected to be found in the plasma membrane as well as in the chloroplast. The remaining members of the SbNRAMP gene family (SbNRAMP1, 2, 4, 5, 6, 7, 9, 10, 11, 12) are only associated with the plasma membrane. Given that the majority of genes are located in the plasma membrane (10 out of 12), it is likely that most SbNRAMPs are primarily involved in facilitating ion transport related to membrane functions.
Secondary structure analysis revealed that all proteins comprise four types of secondary structures, with α-helix and random coil being predominant. Notably, SbNRAMP3 and SbNRAMP8 exhibit a higher content of random coils relative to α-helices, distinguishing them from other family members and suggesting potential functional divergence (Table 2).
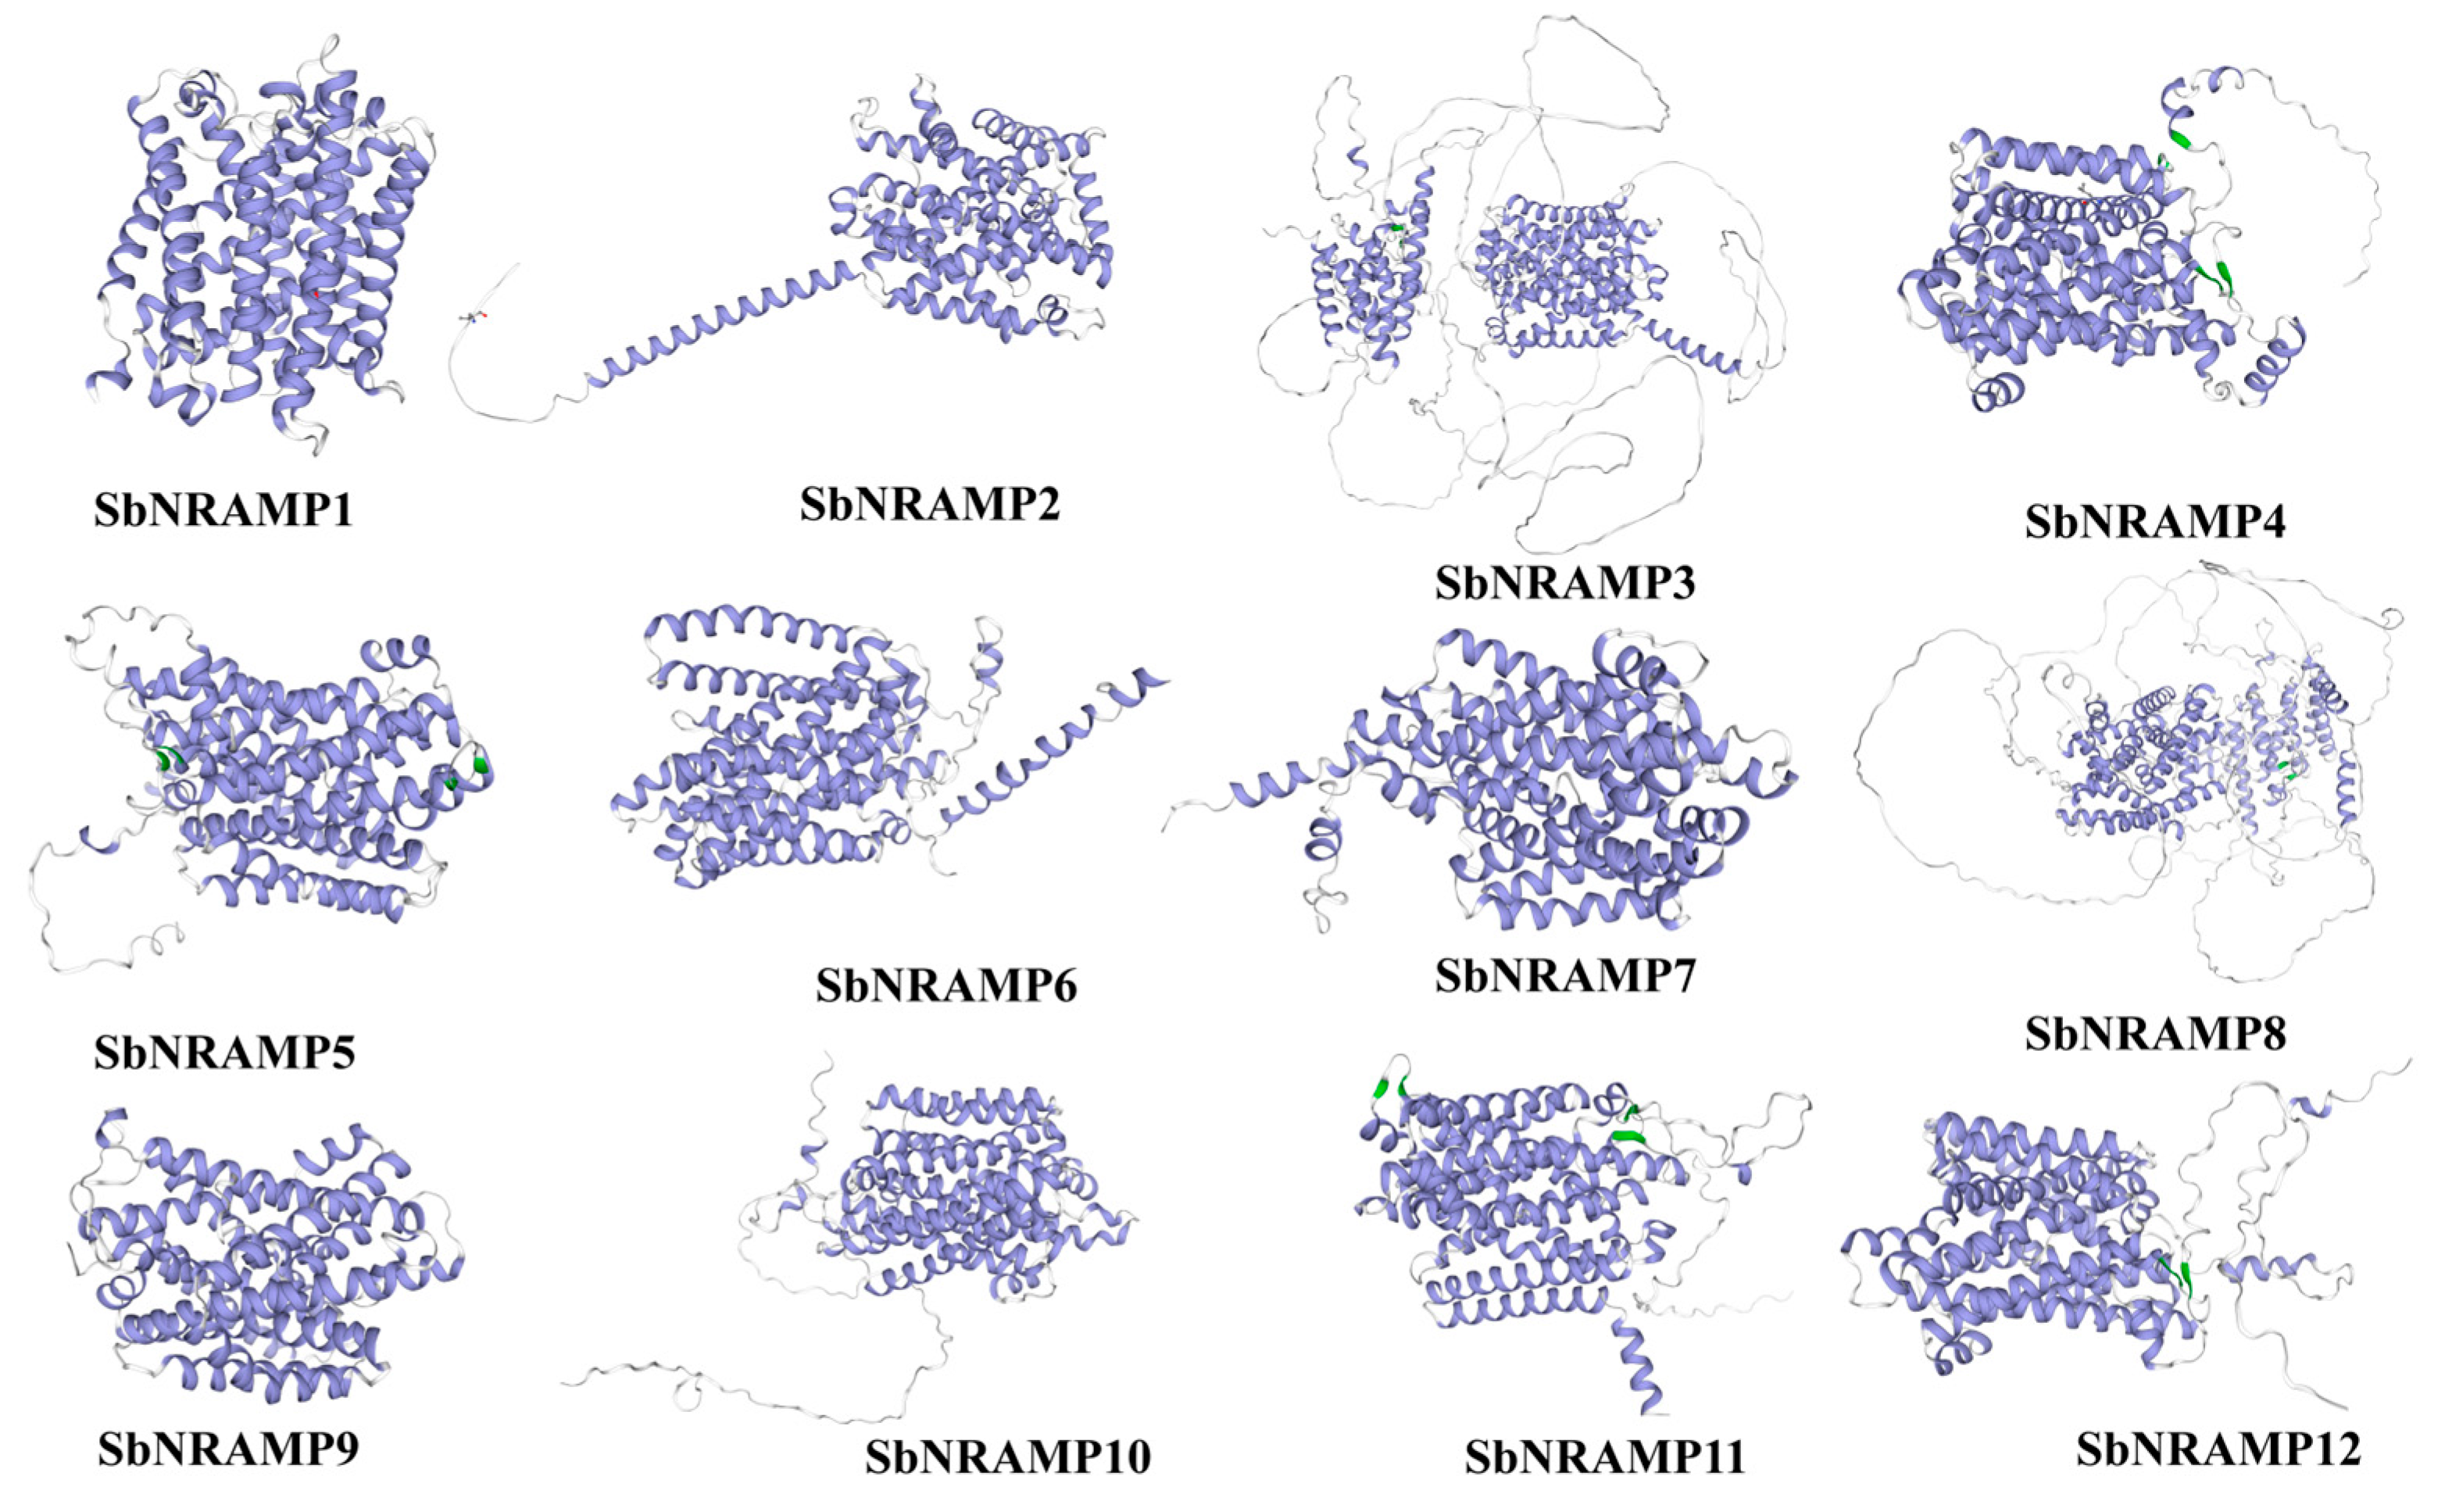
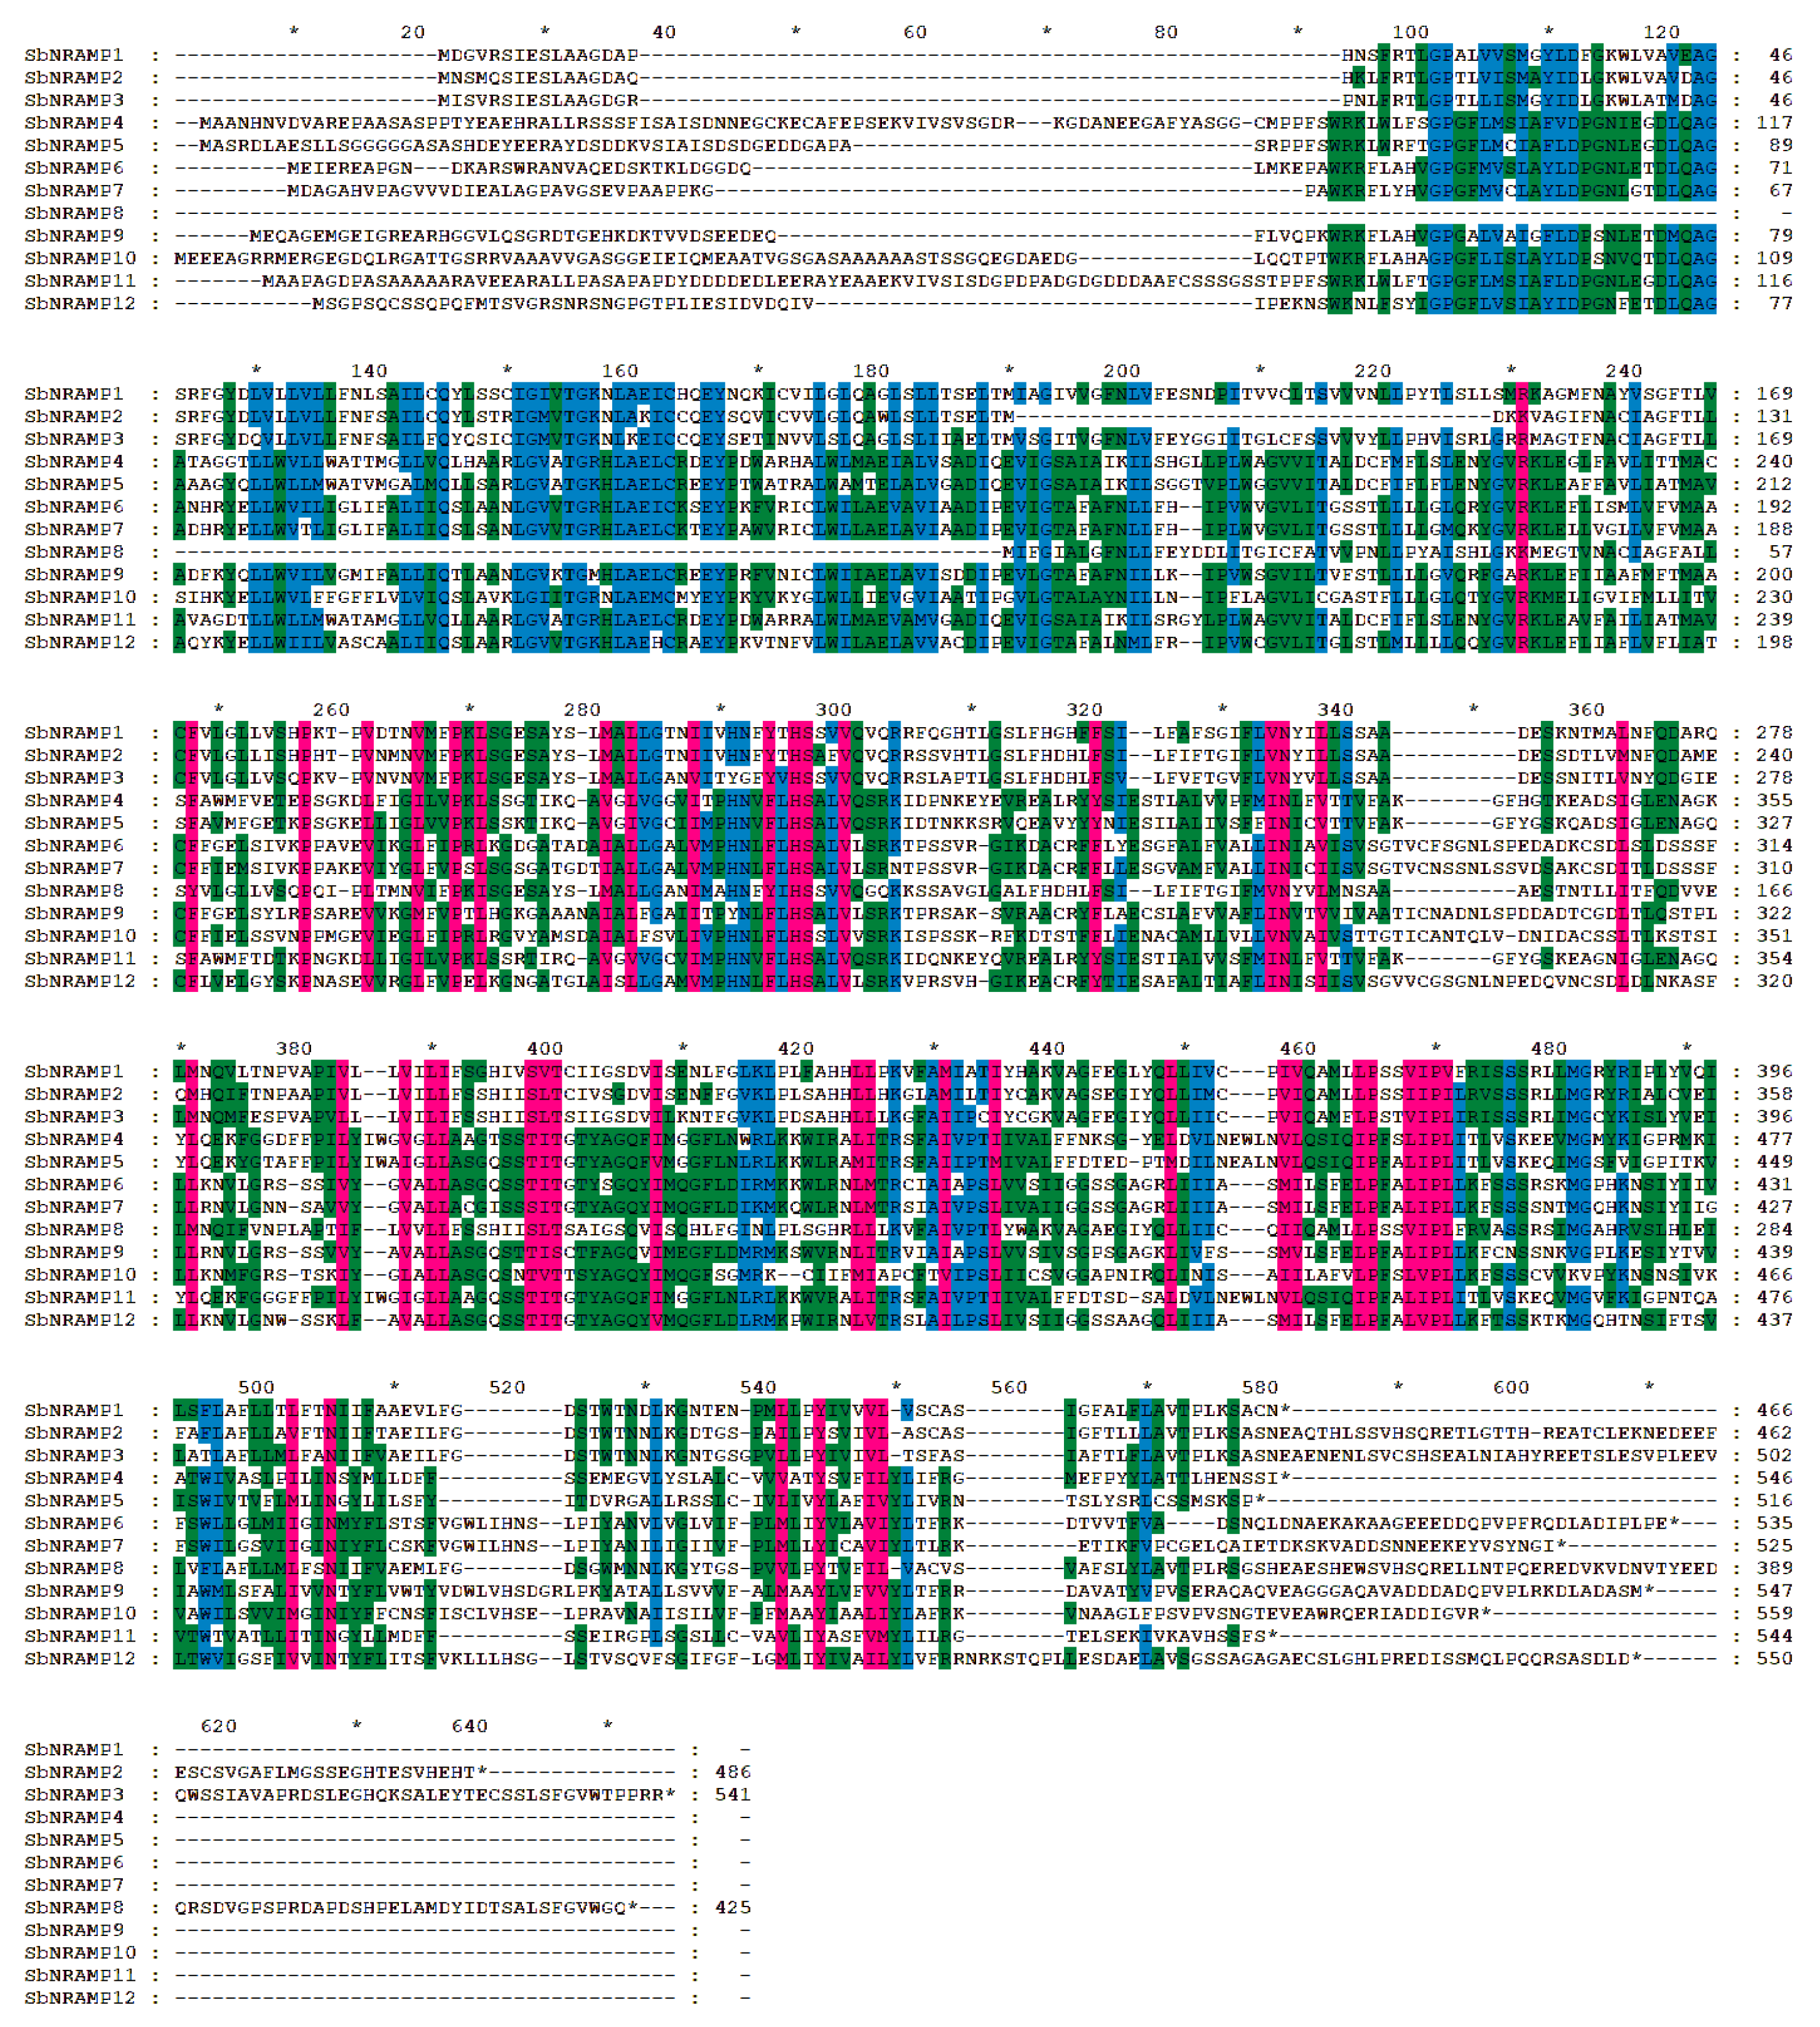
To elucidate the spatial structure of SbNRAMPs, we employed a comparative modeling approach using A. thaliana as a reference to analyze the tertiary structure of 12 SbNRAMP family members (Figure A1). The results of our analysis highlight the distinctions among different subfamilies as well as the similarities among members of the same subfamily. Furthermore, in conjunction with the secondary structure analysis, we can confirm that the results for comparative modeling are reliable. Notably, all members exhibit a prominent helical structure that occupies a central position, accompanied by a limited number of folding fragments. The ends of multiple SbNRAMP members exhibit irregular curls, and the structural similarity among subfamily members is pronounced. In subfamily III (Figure 3a), SbNRAMP3 and SbNRAMP8 are particularly noteworthy, as they possess a substantial number of random coils at both ends of the proteins. Furthermore, the conserved motif maps of these two genes indicate that they contain an extended CDS structure. The protein sequences of 12 members of the NRAMP gene family in sorghum were compared and analyzed (Figure A2), with a subsequent examination of their amino acid frequencies. The results indicated that the SbNRAMPs contain multiple conserved regions.

2.8. Tissue Expression Analysis of SbNRAMP

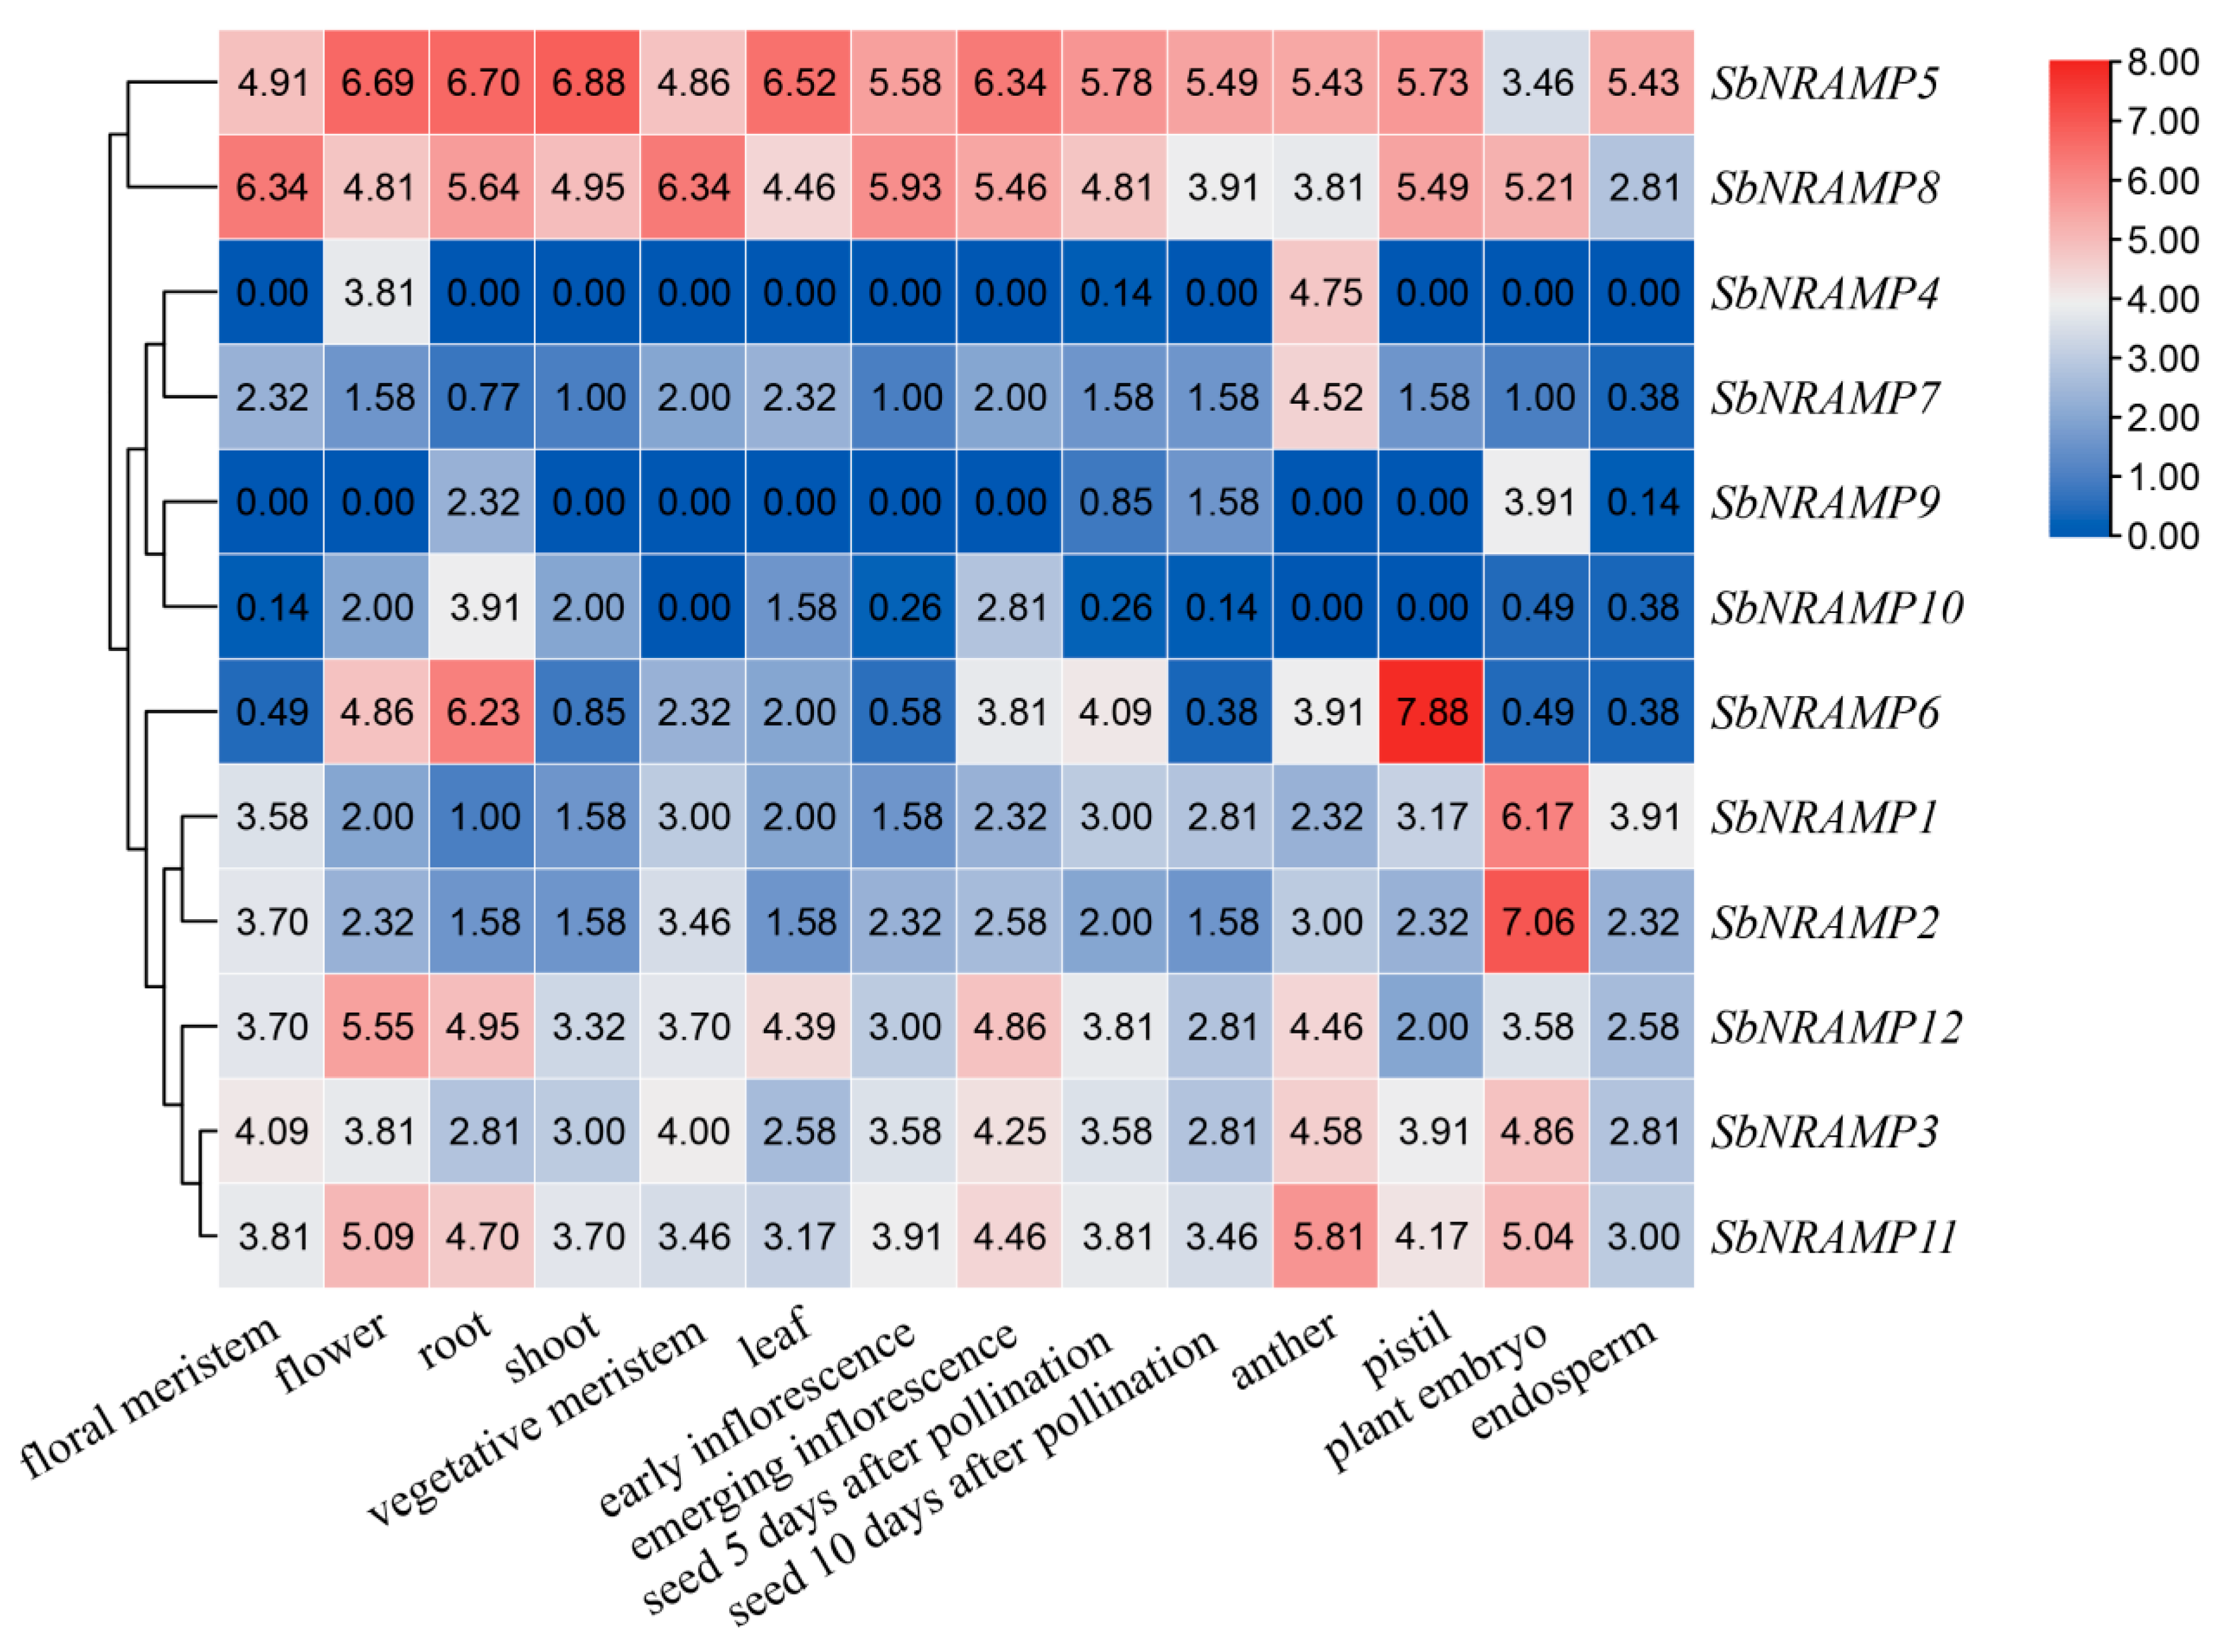
In the sorghum database, we obtained expression data for 12 SbNRAMP genes across 14 tissues under standard growth conditions (28 °C during the day and 25 °C at night, with a 14-h light/10-h dark cycle and 60–65% relative humidity). Utilizing this data, we generated a heatmap to analyze the differential expression patterns (Figure 6). Based on the expression levels of the 12 genes in various tissues, we categorized these genes into two groups: a high expression group (expressed in ≥2 tissues) and a low expression group (expressed in <2 tissues). A log2 FPKM value of ≥4 was established as the threshold for high expression. Our findings revealed that SbNRAMP5 exhibited high expression in 13 out of 14 tissues, while SbNRAMP8 displayed high expression in 11 out of 14 tissues. Notably, SbNRAMP5 was most significantly expressed in roots, shoot, and flowers, whereas SbNRAMP8 peaked in floral and vegetative meristems. Additionally, SbNRAMP3, 6, 11, and 12 also demonstrated high expression across multiple tissues. Specifically, SbNRAMP12 and SbNRAMP11 were highly expressed in five tissues, SbNRAMP3 was expressed in five tissues, and SbNRAMP6 was expressed in four tissues. Conversely, SbNRAMP1, 2, 4, 7, 9, and 10 were classified as low expression genes, with SbNRAMP1, 2, 4, and 7 showing high expression in only one tissue, and SbNRAMP9 and 10 exhibiting low expression across all 14 tissues. This finding suggests that the expression of NRAMP gene family members in sorghum is tissue-specific. Most genes are highly expressed in plant embryos, anthers, roots, flowers, and leaves, whereas expression levels are low in endosperm and seeds 5 and 10 days after pollination stages.

2.9. WGCNA for Identification of Hub Genes

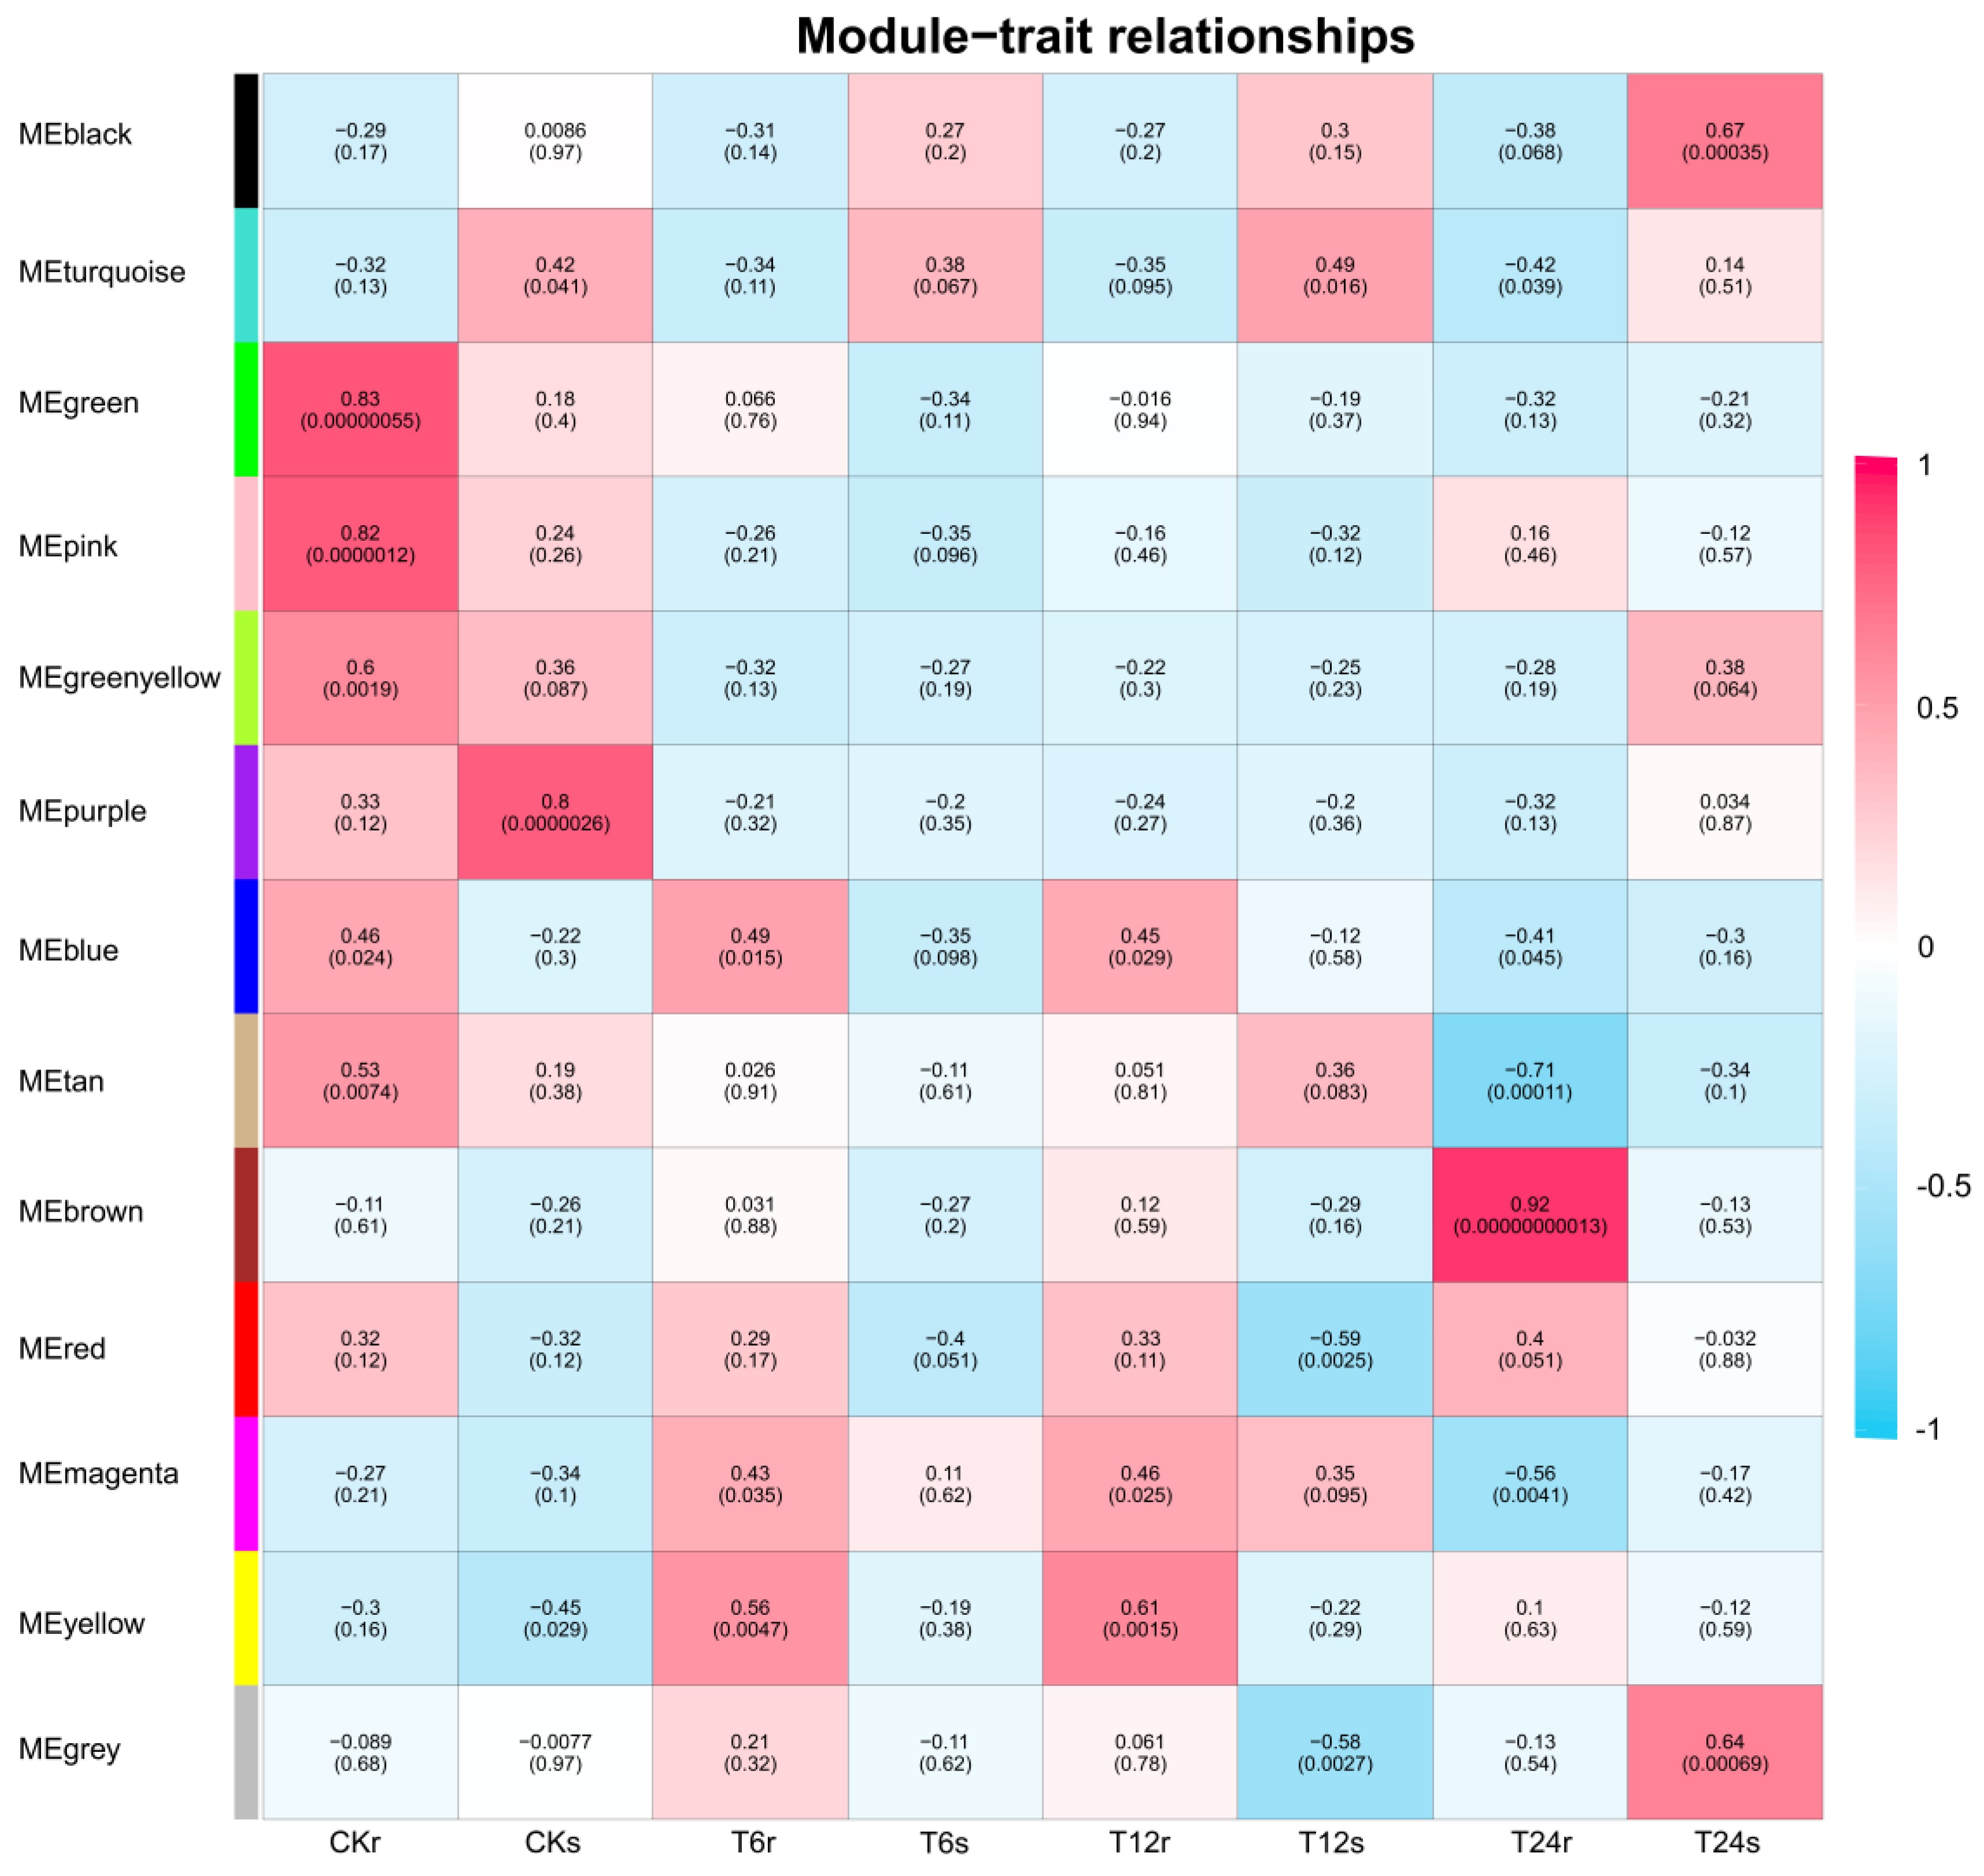
To identify potential gene modules associated with abiotic stress (saline–alkaline), we conducted a weighted gene co-expression network analysis (WGCNA) on the transcriptome data of sorghum seedlings subjected to saline–alkaline stress (150 mM NaHCO3, pH = 8.0, treated for 0, 6, 12, and 24 h) (Figure 7). After excluding low-expression genes (specifically those with FPKM < 1) from the expression matrix, WGCNA was performed on the filtered transcriptome data. A total of 13 distinct gene modules were identified, each represented by a unique color tile in the adjacency matrix. Upon examining the positive correlation coefficients, the key gene SbNRAMP5 (Sobic.001G462500) was identified within the positive correlation module of the co-expression network (T6h/yellow 0.56). Furthermore, protein–protein interaction (PPI) analysis revealed that SbNRAMP5 interacted with other genes within this module, indicating its significant role in abiotic stress response (Figure 8).

2.10. Cd, Mn, or Zn Induced the Expression of SbNRAMP

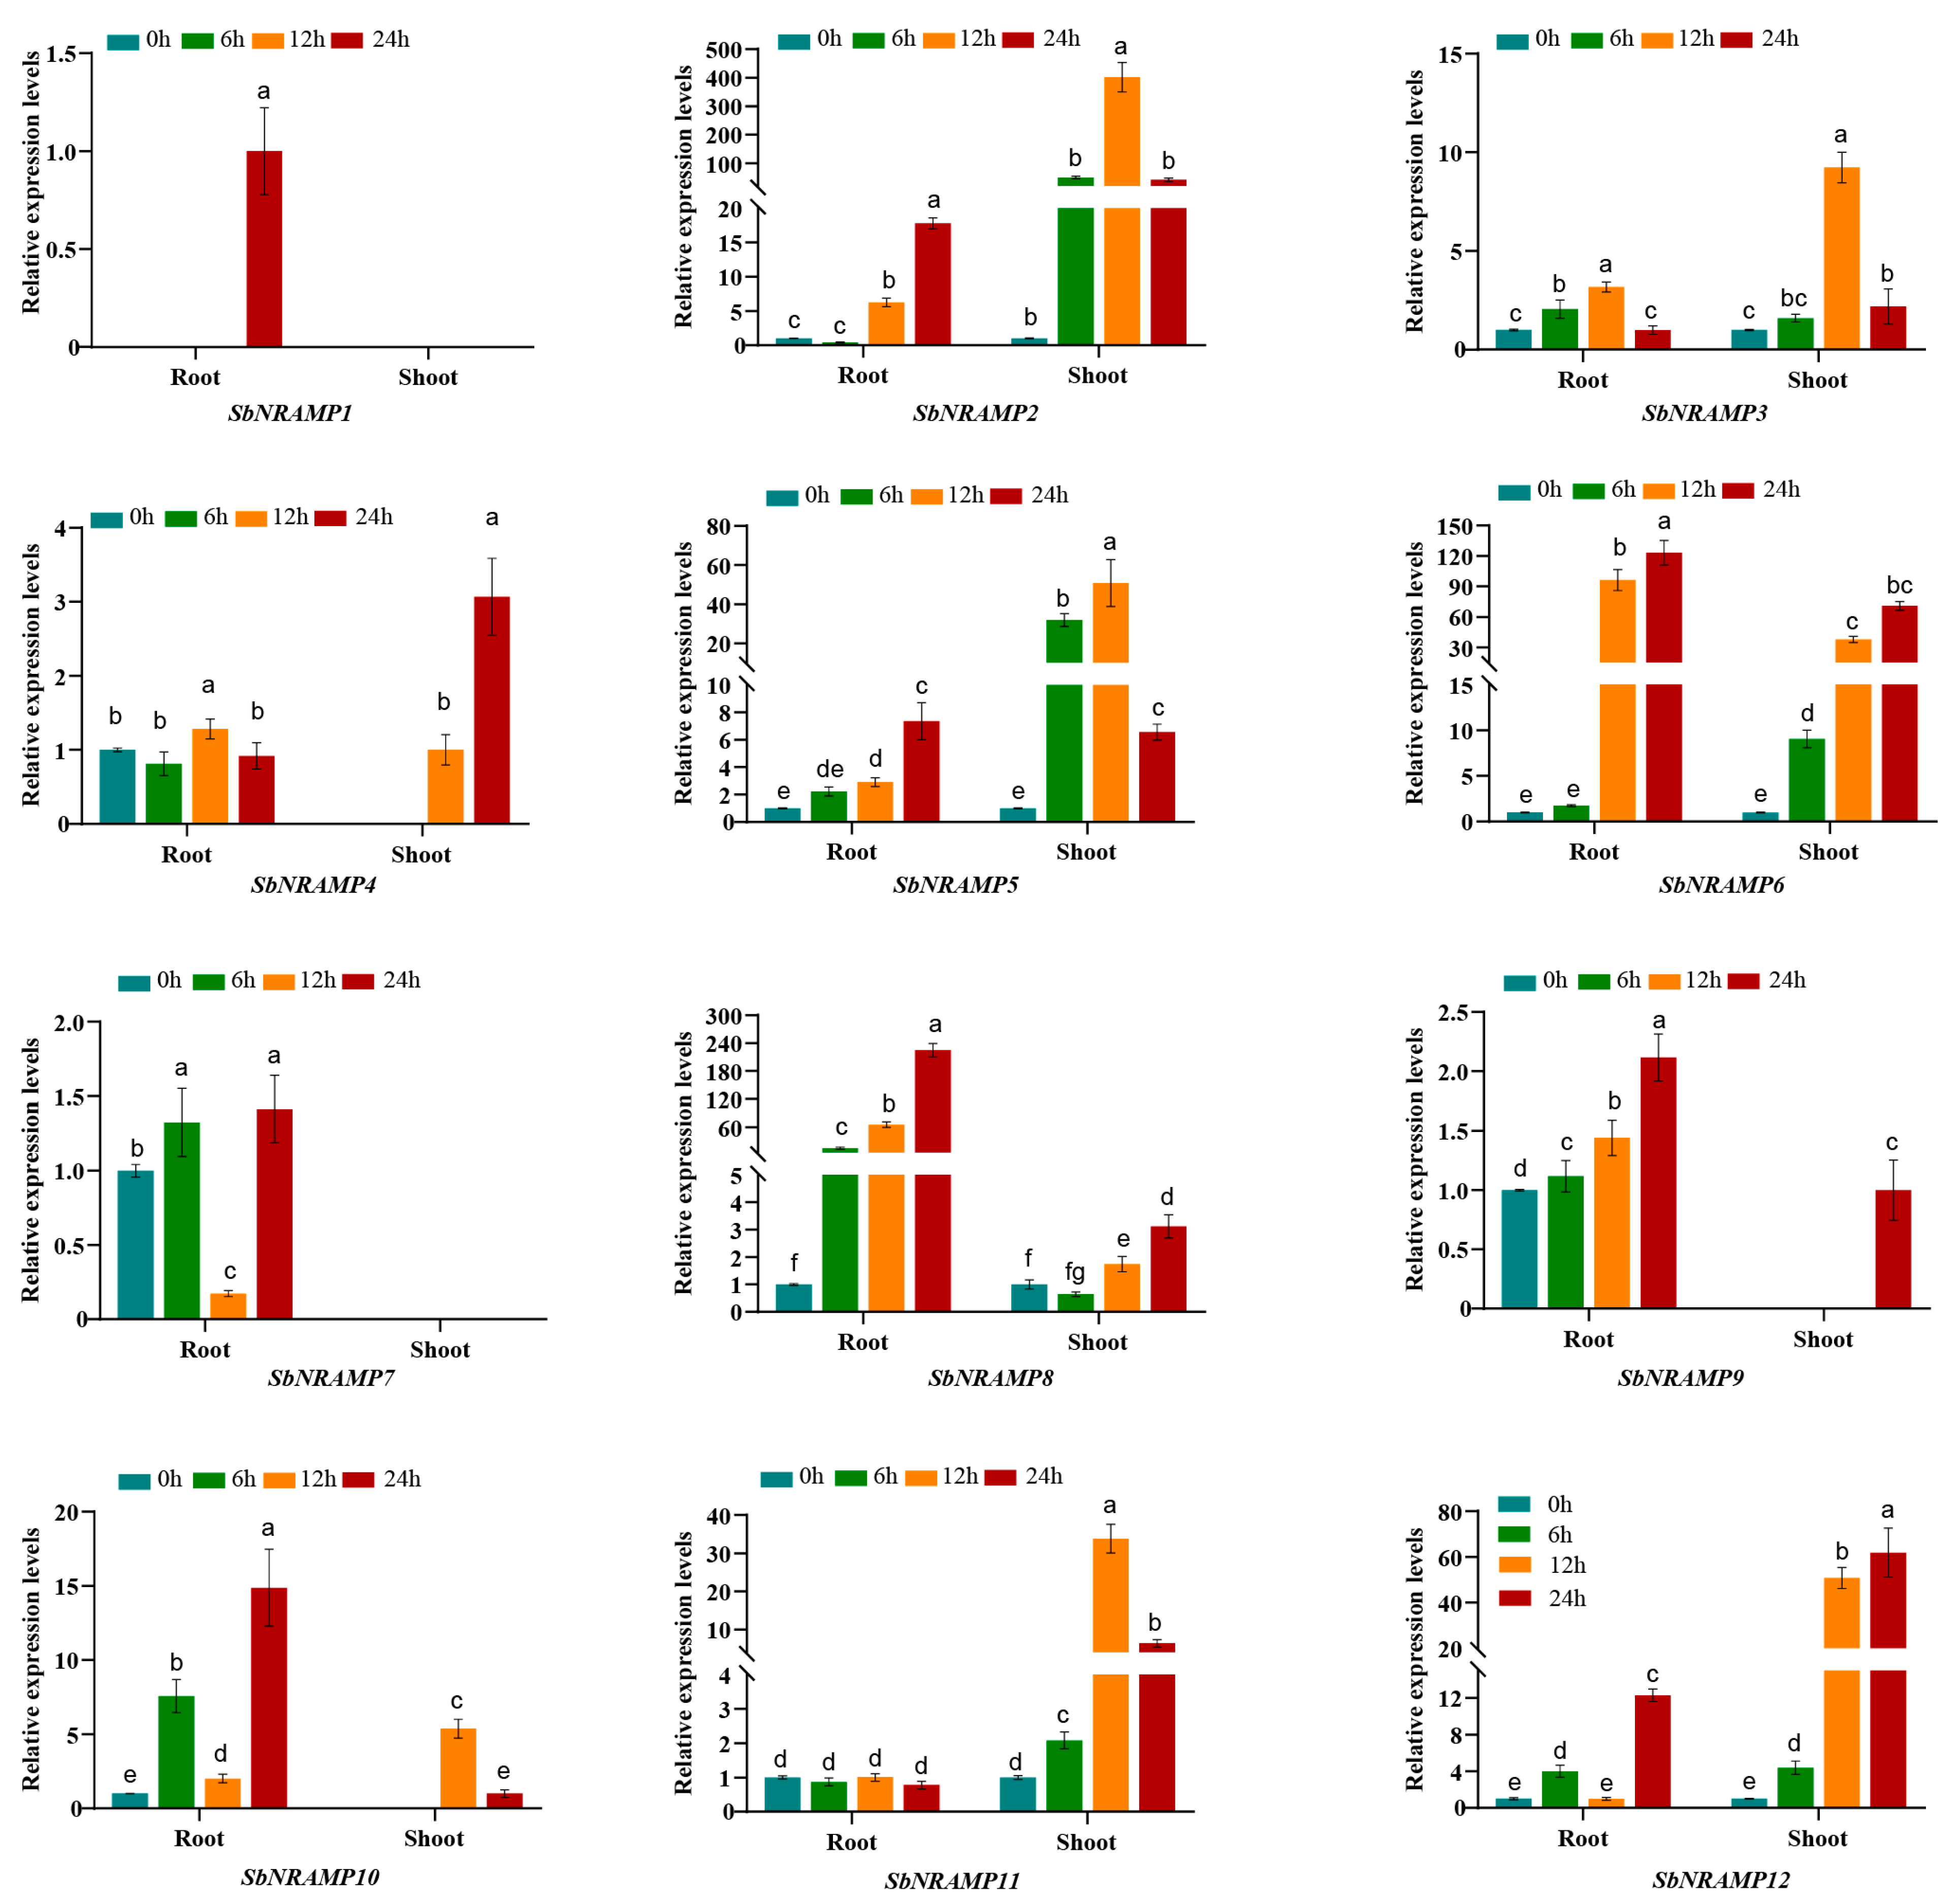
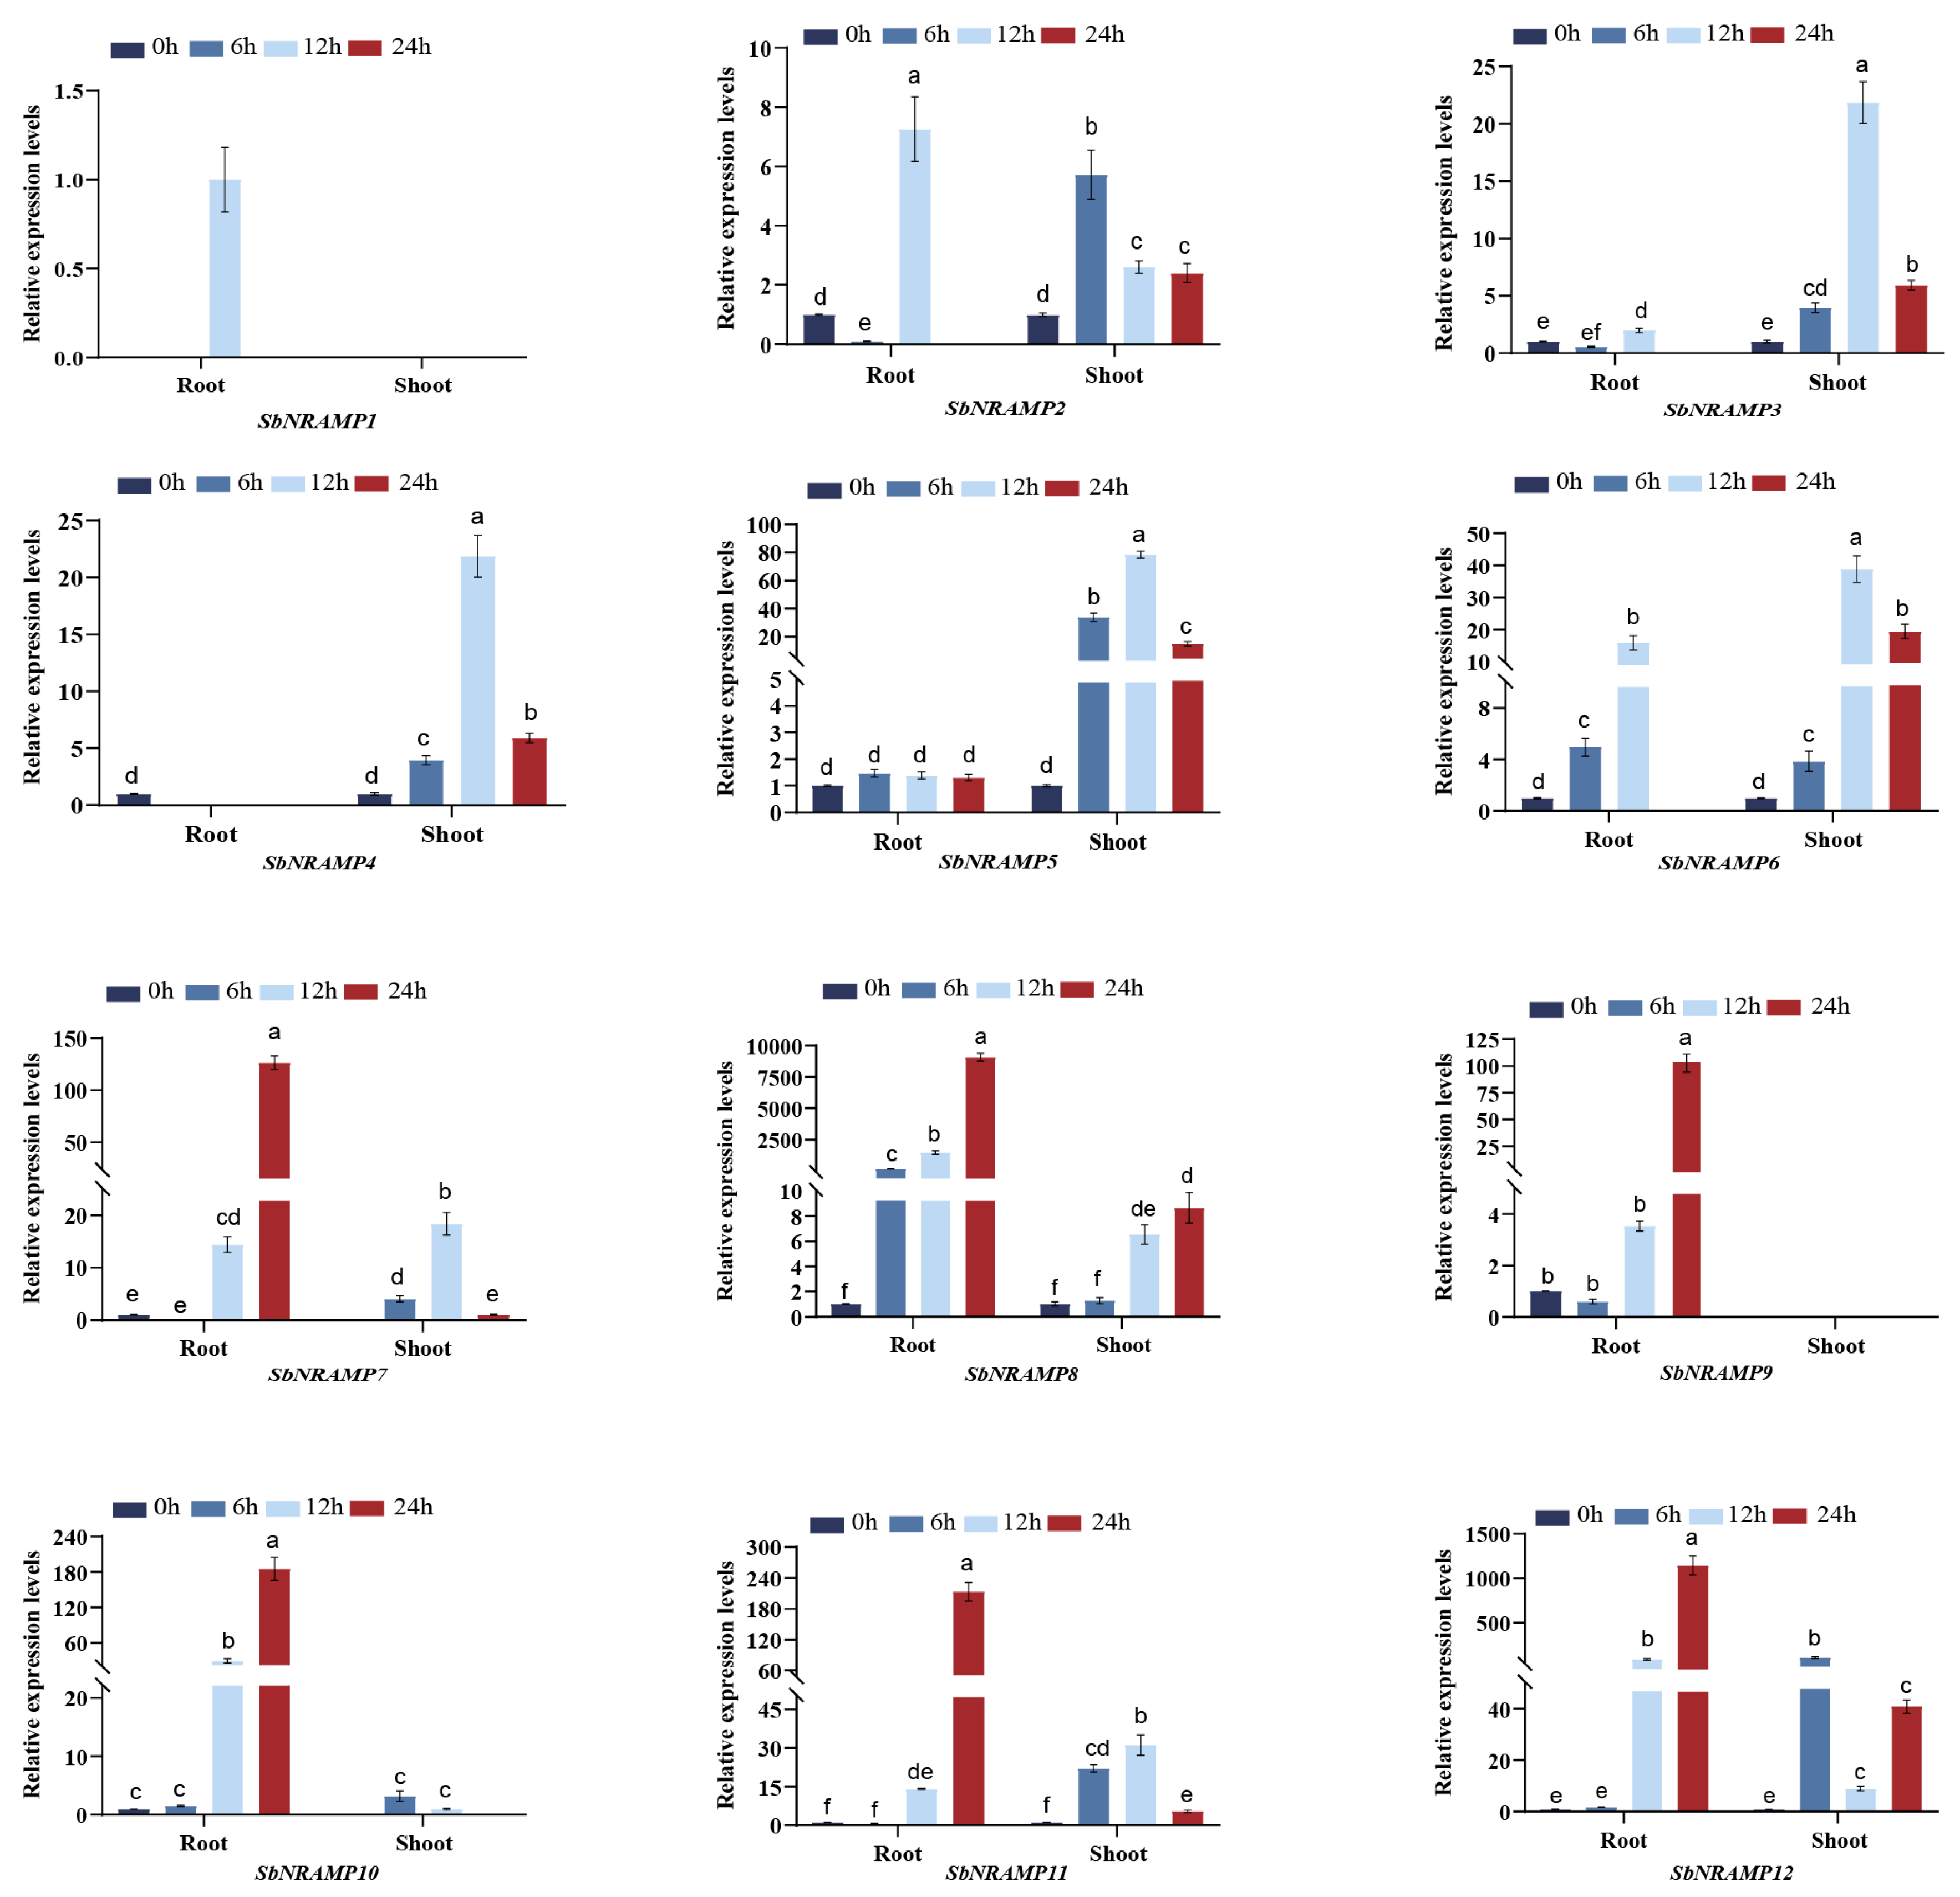
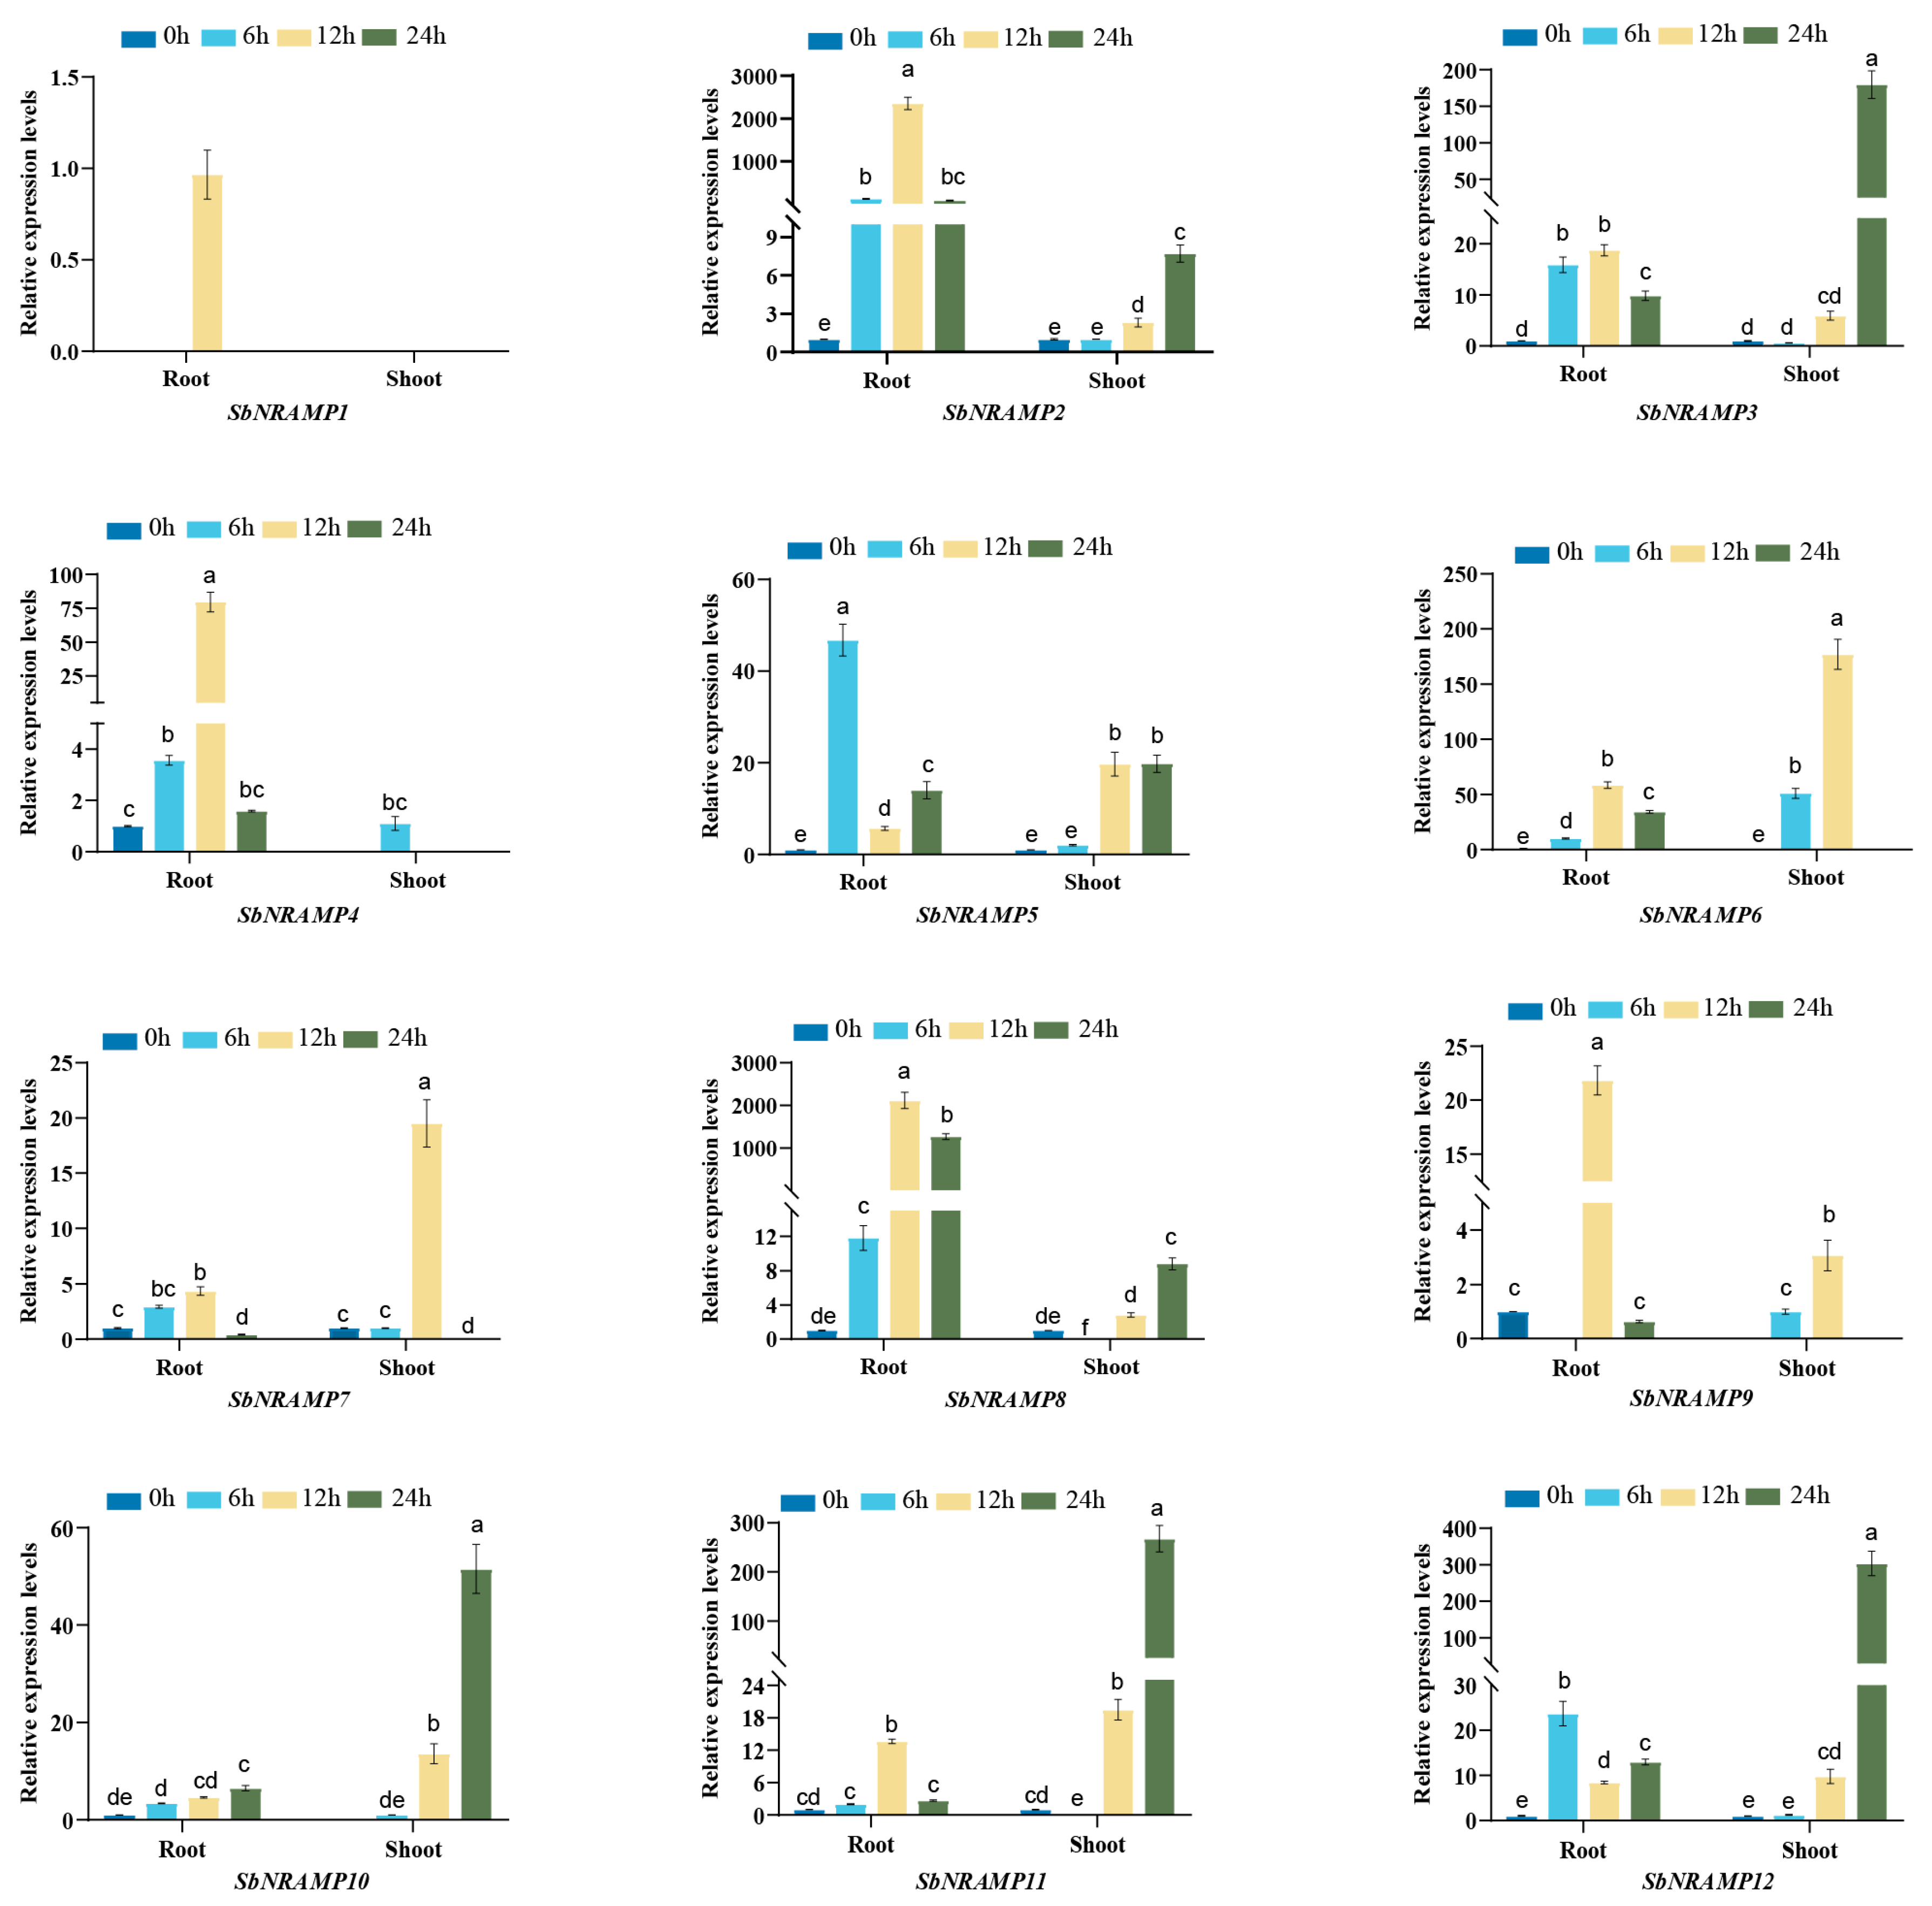
We analyzed the gene expression levels in the roots and shoots of sorghum seedlings under three different treatment conditions using quantitative reverse transcription polymerase chain reaction (qRT-PCR). The expression patterns of the 12 SbNRAMP genes in the roots and shoots exhibited significant differences (p < 0.05) when treated with Cd2+, Mn2+, or Zn2+ (Figure 9, Figure 10 and Figure 11). We normalized the gene expression values to the baseline at 0 h or, alternatively, based on the lowest expression observed at other time points when the genes were not expressed at 0 h. Utilizing the normalized data, we calculated the relative expression at subsequent time points. Notably, SbNRAMP1 was detected at only a single time point in the roots under treatment with the three metals; specifically, it was observed in the roots treated with Cd for 24 h and in the roots treated with Mn and Zn for 12 h. The primary differences observed in the remaining genes are summarized as follows.
Under cadmium (Cd) stress (Figure 9), in the roots, Cd treatment alone markedly upregulated the expression of SbNRAMP8, 9, and 10. Additionally, SbNRAMP2, 5, and 6 were significantly upregulated at both 12 and 24 h, while SbNRAMP3 showed significant upregulation at 6 and 12 h. SbNRAMP4 experienced significant upregulation at 12 h. Notably, SbNRAMP7 was significantly upregulated at both 6 and 24 h but demonstrated a significant downregulation at 12 h. In contrast, SbNRAMP11 expression did not exhibit significant changes, whereas SbNRAMP12 was significantly upregulated at 6 and 24 h. In the shoots of sorghum seedlings, Cd treatment also led to a significant upregulation of SbNRAMP2, 5, 6, 11, and 12 compared to the control group. SbNRAMP3, 4, 8, and 10 showed significant upregulation at 12 and 24 h. SbNRAMP7 expression was not detected, and SbNRAMP9 expression was only detected at 24 h.
Under manganese (Mn) stress (Figure 10), in the roots, Mn treatment alone resulted in a substantial upregulation of SbNRAMP8. The expression of SbNRAMP2 showed a significant downregulation at 6 h, followed by a significant upregulation at 12 h. Additionally, SbNRAMP3 was significantly upregulated at 12 h and SbNRAMP9 was significantly upregulated at 24 h, while SbNRAMP4 was not detected at any time points other than the control. SbNRAMP5 exhibited no significant changes in expression. Conversely, SbNRAMP6 was significantly upregulated at both 6 and 12 h. Furthermore, SbNRAMP7, 10, 11, and 12 were significantly upregulated at 12 and 24 h. In the shoots of sorghum seedlings, Mn treatment alone also led to a significant upregulation of SbNRAMP2, 3, 4, 5, 6, 10, 11, and 12. Specifically, SbNRAMP7 was significantly upregulated at both 6 and 12 h, while SbNRAMP8 showed significant upregulation at 12 and 24 h. Notably, the expression of SbNRAMP9 was not detected.
Under zinc (Zn) stress (Figure 11), in the roots, Zn treatment alone led to a notable upregulation of SbNRAMP2, 3, 4, 5, 6, 8, and 12. Specifically, SbNRAMP7 was significantly upregulated at 12 h but showed a significant downregulation at 24 h. Additionally, SbNRAMP9 and SbNRAMP11 were significantly upregulated at 12 h, while SbNRAMP10 was significantly upregulated at 24 h. In the shoots of sorghum seedlings, Zn treatment alone resulted in significant upregulation of SbNRAMP2, 5, 10, 11, and 12 at both 12 and 24 h compared to the control group. Furthermore, SbNRAMP3 was significantly upregulated at 24 h, whereas SbNRAMP4 expression was only detected at 6 h. SbNRAMP6 and SbNRAMP9 were significantly upregulated at both 6 and 12 h. Notably, SbNRAMP7 was significantly upregulated at 12 h, with SbNRAMP7 also showing significant downregulation at 24 h. SbNRAMP8 demonstrated significant downregulation at 6 h, followed by significant upregulation at 24 h.

2.11. Effects of Metal Ions Stress on Physiological Indexes of Sorghum Seedlings

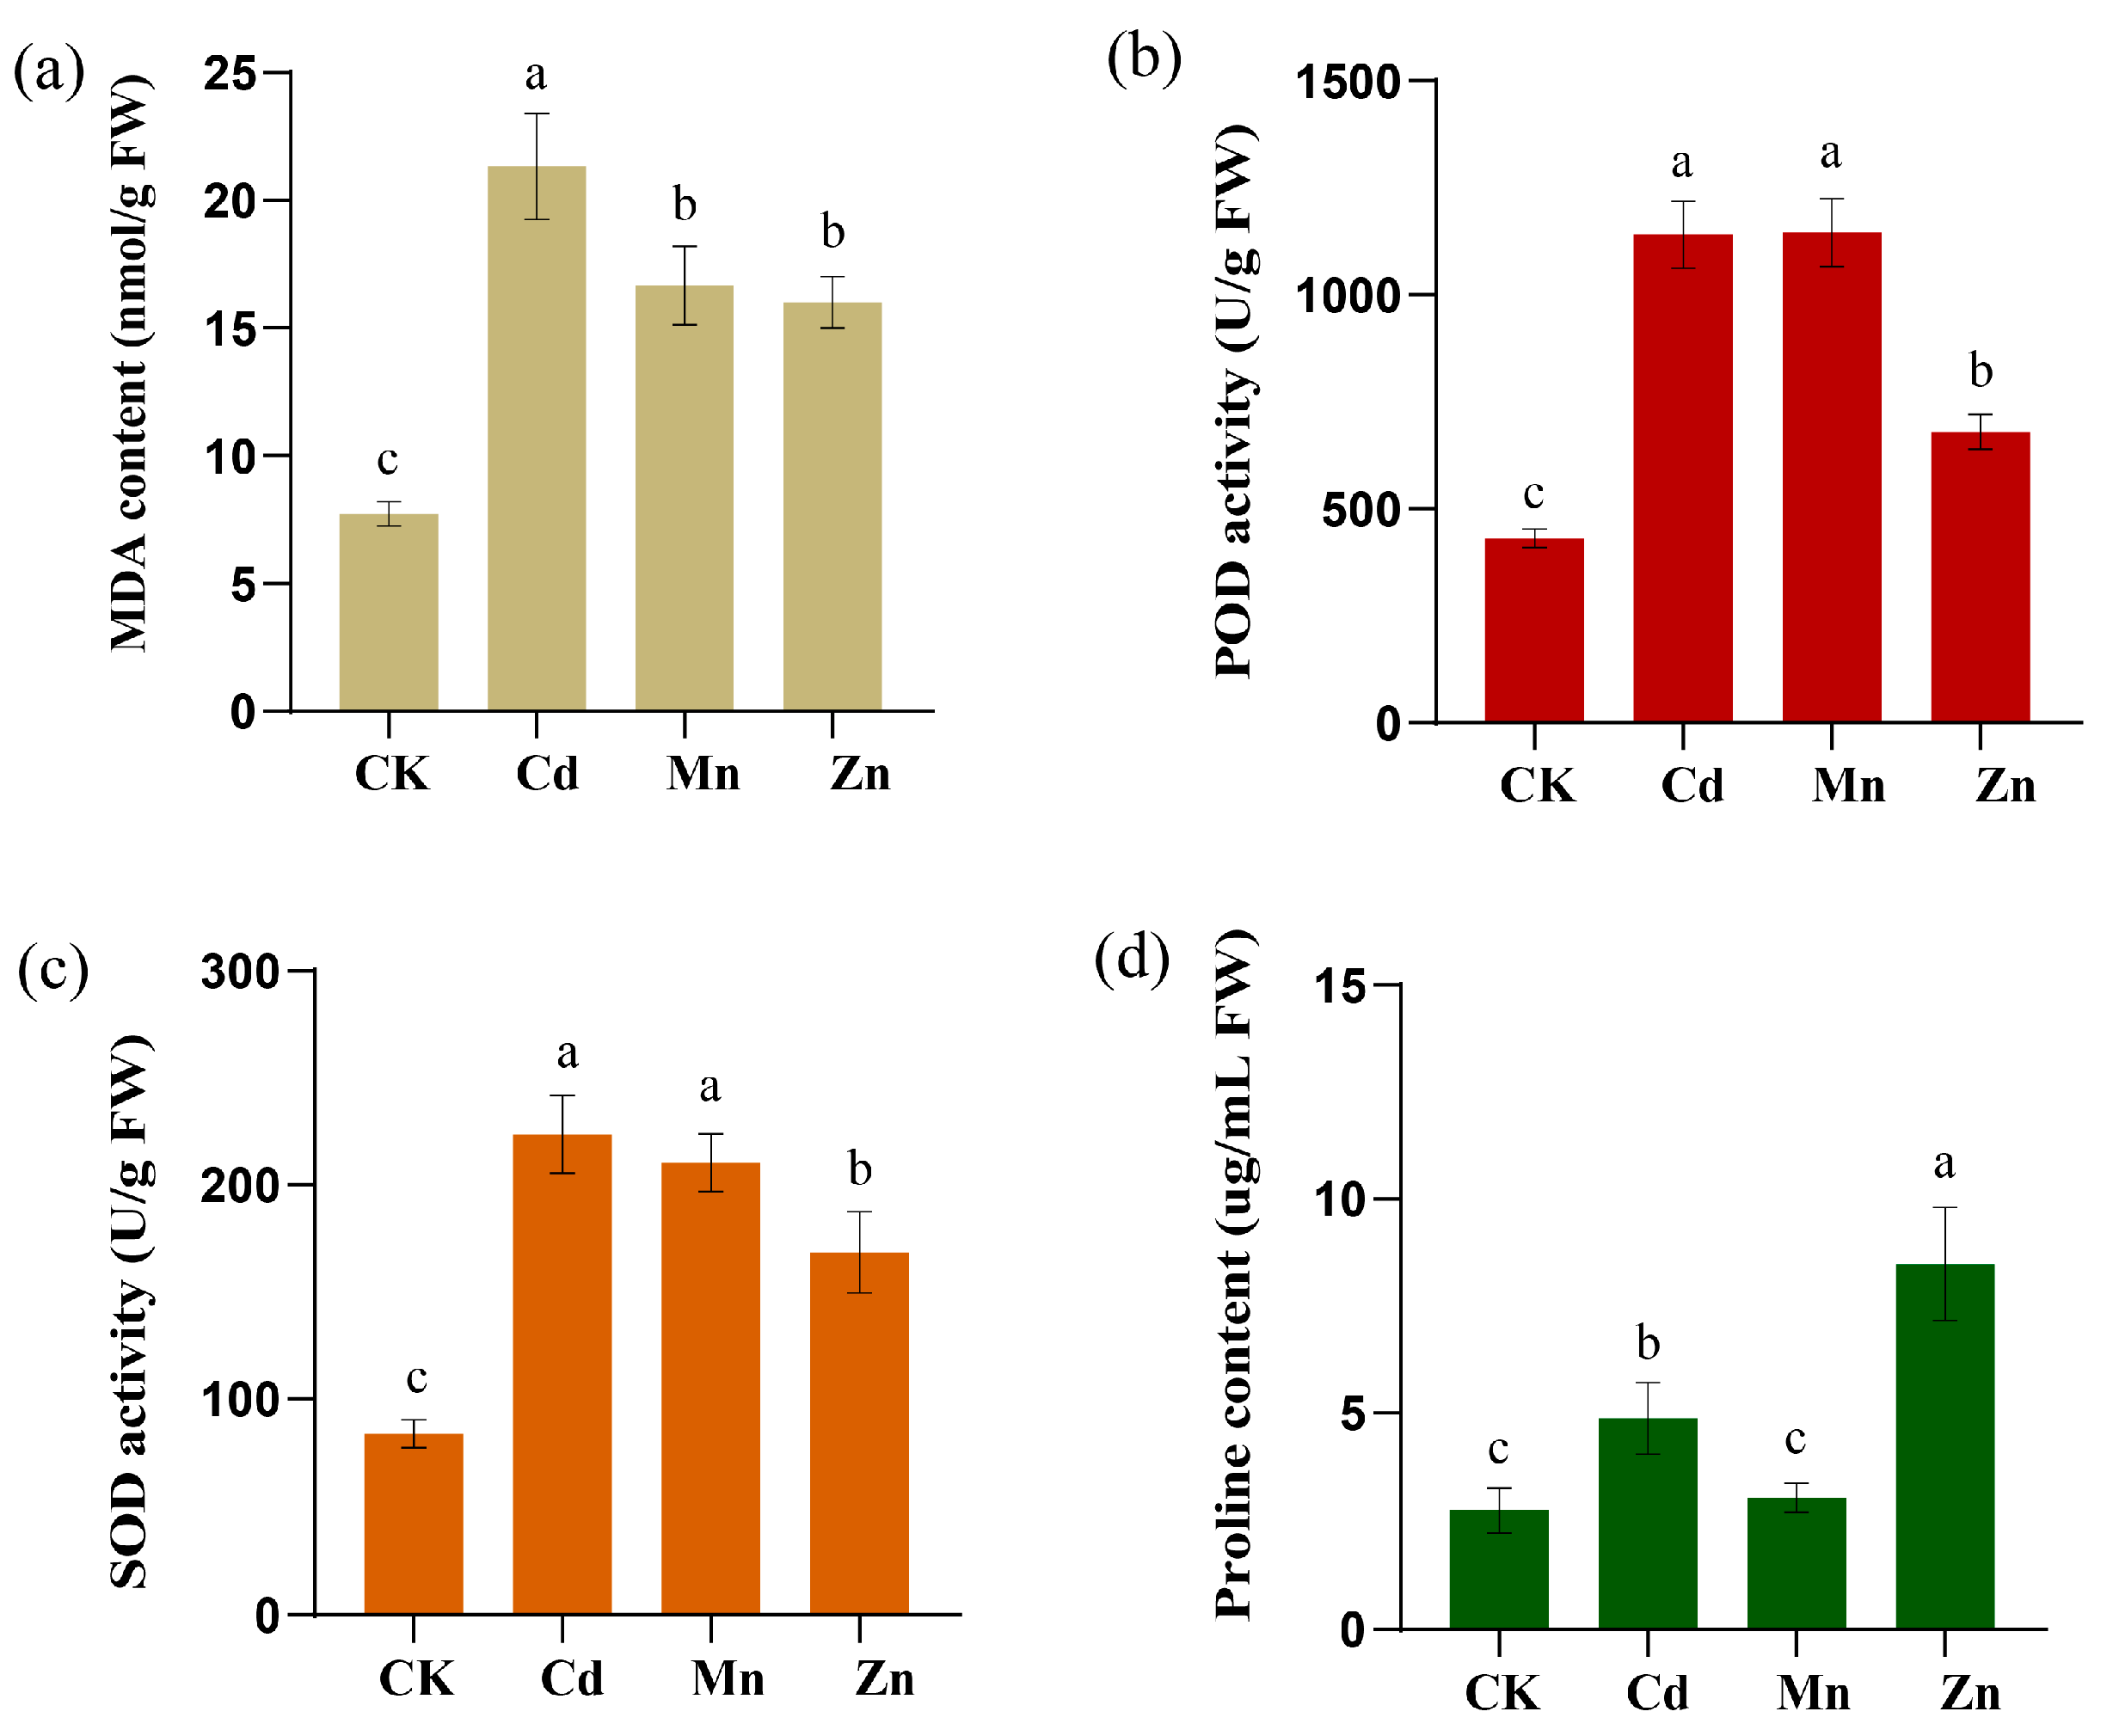
The concentrations of stress-related metabolites and changes in the activities of antioxidant enzymes reflect the stress conditions experienced by plants. This study investigates the effects of exposure to three heavy metals (100 μmol/L MnCl2·4H2O, 100 μmol/L CdCl2, or 100 μmol/L ZnCl2) on sorghum seedlings at the two-leaf and one-heart stage over a period of two days (Figure 12).
The measurement of malondialdehyde (MDA) content in sorghum seedlings indicated that MDA levels significantly increased under all three metal treatments (Figure 12a), with the highest levels observed under Cd2+ treatment.
We observed that the activities of POD (Figure 12b) and SOD (Figure 12c) in the Cd2+, Mn2+, and Zn2+ treatment groups were significantly higher than those in the control group. The activities of POD and SOD were higher following treatment with Cd2+ and Mn2+ than those for Zn2+.
Furthermore, the determination of proline (Pro) content revealed that Pro levels for the Cd2+ and Zn2+ treatments increased (Figure 12d), with the most significant increase noted in the Zn2+ treatment group, while the Pro content in the Mn2+ treatment group did not show a significant increase. This indicates that the three different metal stresses exert varying effects on the growth and development of sorghum seedlings.

2.12. SbNRAMP6 Was Localized in the Cell Membrane

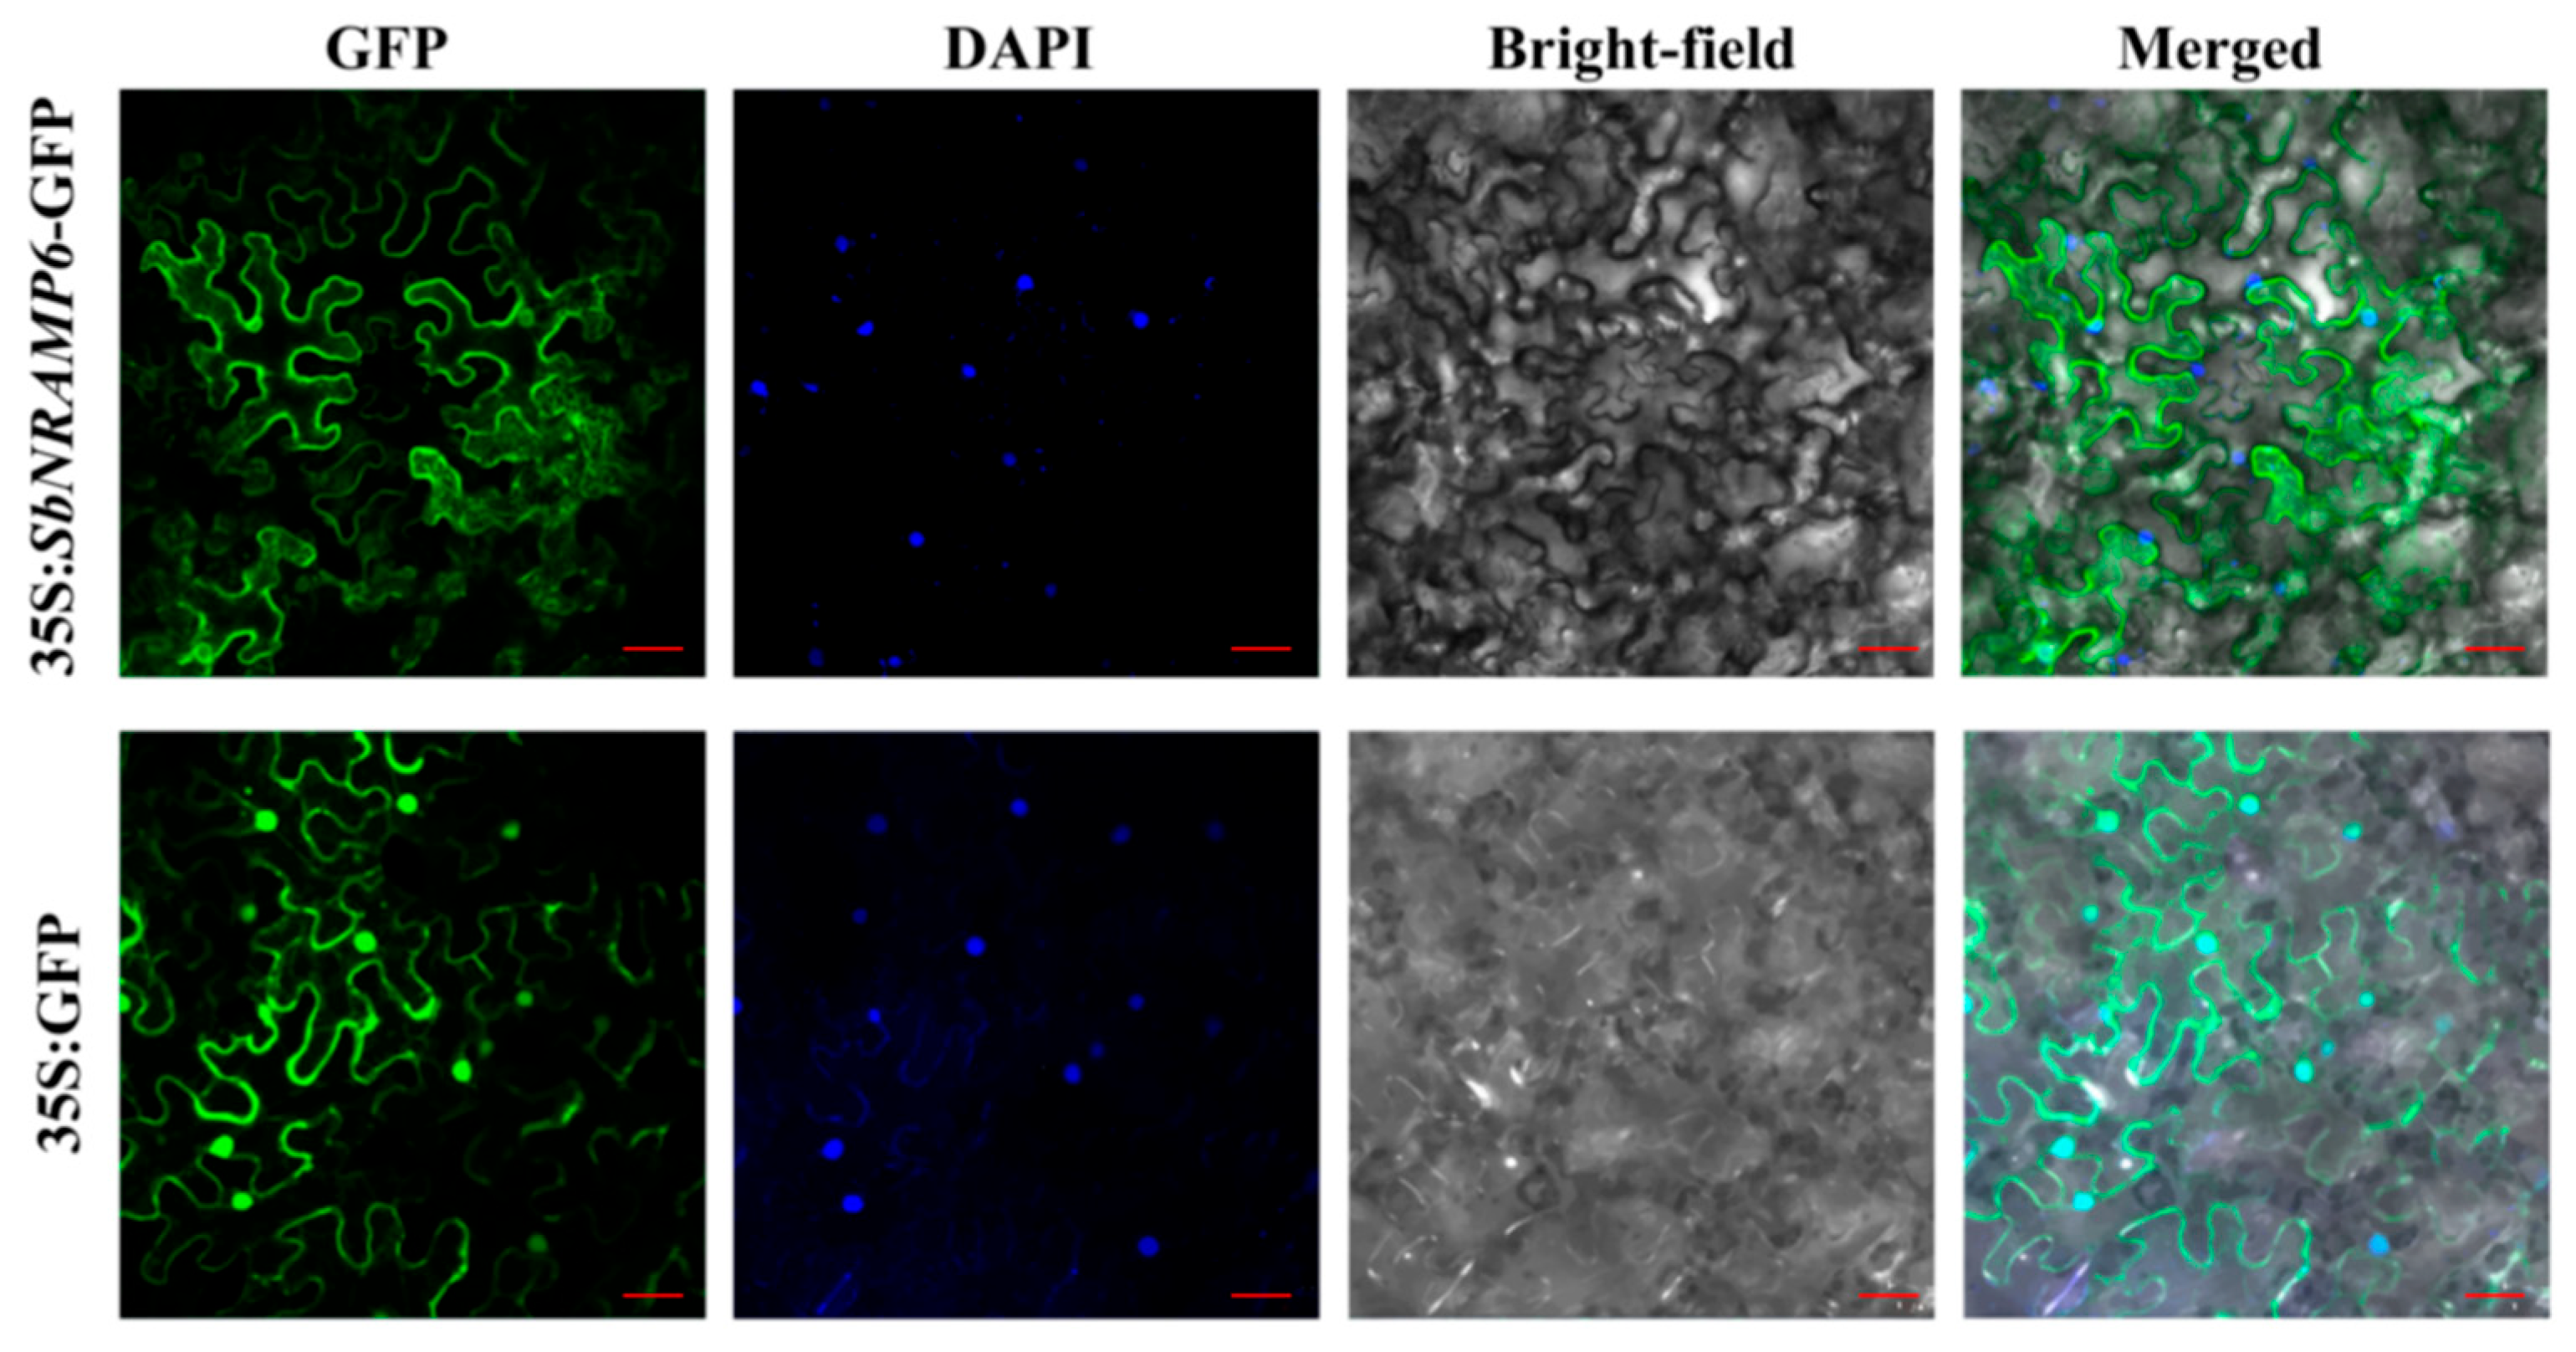
Subcellular localization predictions using Plant-mPLoc indicated that all SbNRAMP genes are localized to the plasma membrane and two of them are also located in other compartments (the chloroplast and nucleus) (Table 2). To experimentally validate these predictions, a subcellular localization analysis was conducted on SbNRAMP6 in Nicotiana benthamiana. The PBI121–SbNRAMP6–GFP expression vector was successfully constructed, and fluorescence microscopy revealed distinct green fluorescence, confirming effective expression in tobacco (Figure 13). Notably, GFP signals were enriched in the plasma membrane, exhibiting only partial overlap with DAPI staining, a nuclear marker. These findings align with bioinformatic predictions, further supporting the localization of SbNRAMP6 to the plasma membrane.

3. Discussion

The Natural Resistance-Associated Macrophage Protein (NRAMP) family is a highly conserved family of metal ion transporters that are widely found in various organisms [30,31]. The NRAMP gene family has been reported in many plant species, primarily responsible for the absorption, transport, and maintenance of intracellular ion balance, such as Fe, Cd, Mn, and Zn [32]. Previous studies have identified members of the NRAMP gene family in the genomes of several species, including Oryza sativa [33], Zea mays [18], Arabidopsis thaliana [21], Areca catechu [34], Camellia sinensis [35], and Hibiscus cannabinus [36]. In this study, we identified 12 NRAMP genes from the sorghum genome (Figure 1). Based on their chromosomal locations, we designated each gene individually. Notably, previous studies classified the seven NRAMP genes in rice into two subfamilies [33]; here, we categorized the twelve members identified into three subfamilies (Figure 3), based on their genetic relationships and structural characteristics within the SbNRAMP gene family. The unique structures of SbNRAMP3 and SbNRAMP8 in the third subfamily suggest that NRAMP genes in sorghum may have evolved novel functions, including specialized metal transport and stress-responsive regulation.
The analysis of physicochemical properties is essential for understanding the potential functional characteristics of proteins [37]. Similarly to other members of the NRAMP gene family in various plant species, the 12 SbNRAMPs comprise both acidic (pI ranging from 4.92 to 5.42) and alkaline (pI ranging from 8.62 to 8.93) proteins [38]. Most SbNRAMPs (9 out of 12) exhibit an instability coefficient of less than 40, indicating that SbNRAMP is considered a stable protein [16]. The amino acid lengths and molecular weights of the majority of SbNRAMPs (10 out of 12) are relatively consistent, ranging from 466 to 559 amino acids with a molecular weight of 50.75 to 60.15 kDa. Notably, the amino acid lengths and molecular weights of SbNRAMP3 and SbNRAMP8 exceed those of other members by more than double (Table 1). This suggests that SbNRAMP3 and SbNRAMP8 may perform unique functions due to their distinct physicochemical properties. Interestingly, the expression levels of SbNRAMP3 and SbNRAMP8 varied significantly under three different metal stresses. SbNRAMP8 exhibited the highest expression in the roots of sorghum seedlings, whereas SbNRAMP3 showed the highest expression in the shoots of these seedlings (Figure 9, Figure 10 and Figure 11). Numerous previous studies have demonstrated that NRAMP gene family members can perform distinct functions across various organelles. For instance, in A. thaliana, AtNRAMP6 is localized to the Golgi/trans-Golgi network and endosomal compartments, where it plays a crucial role in maintaining intracellular iron homeostasis and influences the growth of lateral roots under conditions of iron deficiency [39,40]; AtNRAMP3 and AtNRAMP4 are both located in the vacuolar membrane [41]. Under conditions of iron deficiency, these transporters are transcriptionally upregulated to facilitate the remobilization of vacuolar Mn2+ reserves into the cytosol. This mechanism is essential for maintaining Mn2+ homeostasis, which is critical for the function of photosystem II during seed germination and manganese deficiency stress. Additionally, these transporters regulate the vacuolar efflux of divalent metal ions, including Mn2+ and Fe2+, thereby modulating the availability of cytoplasmic metals, which ultimately influences ion distribution in both leaves and roots [5,42]. For example, AtNRAMP1 is localized to the plasma membrane [43]. The expression of AtNRAMP1 is upregulated in response to iron deficiency in roots. In rice, most OsNRAMPs are also plasma membrane-localized and involved in ion balance [44,45]. OsNRAMP1 is localized to the plasma membrane and facilitates the uptake of cadmium (Cd). Its primary physiological role is to maintain the homeostasis of manganese (Mn2+) and iron (Fe2+) [46]. Similarly localized to the plasma membrane, OsNRAMP5 serves as a primary transporter for manganese (Mn2+) and iron (Fe2+), while also facilitating the uptake of cadmium (Cd) [47,48], facilitating the movement of these ions from the roots to the shoots [49,50]. It is predicted that SbNRAMP3 is localized in the plasma membrane and nucleus, whereas SbNRAMP8 is anticipated to be present in both the plasma membrane and chloroplasts (Table 2). Meanwhile, the tissue expression of SbNRAMP3 and SbNRAMP8 exhibited distinct specificity. SbNRAMP8 was highly expressed across 11 tissues, with the highest levels observed in the floral meristem and vegetative meristem. In contrast, SbNRAMP3 demonstrated high expression in six tissues, predominantly in anther and plant embryos (Figure 6). Consequently, we hypothesize that the observed differences in tissue expression may arise from distinct predictions of subcellular localization. However, the specific roles of SbNRAMP3 and SbNRAMP8 in regulating metal ion homeostasis require further investigation.
Dynamic variations in the lengths of the 5′ untranslated region (UTR) and 3′ UTR act as cis-regulatory mechanisms that finely regulate stress-responsive genes’ expression in plants by modulating transcript stability and translational efficiency [51,52]. Structural analysis revealed that SbNRAMP4 and SbNRAMP2 proteins lack both 5′ and 3′UTRs, while SbNRAMP11 lacks the 5′UTR (Figure 3b). The presence of a 5′UTR is associated with increased RNA and protein accumulation [53]. SbNRAMP8 and SbNRAMP12 exhibit long 5′UTR, SbNRAMP1 has an extended 3′UTR, and SbNRAMP10 is distinguished by a high intron number. The gene structure characteristics of these pre-mRNA structures are worthy of further study and discussion. Given that intron length is inversely correlated with gene expression [54,55], the large intron count in SbNRAMP10 likely results in low expression efficiency without contributing to an increase in protein length.
Subcellular localization analysis predicted that most of the SbNRAMP genes are situated in the plasma membrane (Table 2). Subsequently, based on the integrity of the protein structure, specifically the complete intron–exon arrangement, we categorized tissue expression into high expression levels, defined as expression in at least two tissues. Under the stress of three metals (Cd, Mn, or Zn), significant expression (p < 0.05) was observed in both the roots and shoots. The gene of interest, SbNRAMP6, was successfully cloned, and subcellular localization analysis confirmed that its targeting pattern aligns with bioinformatic predictions; SbNRAMP6 localizes to the plasma membrane (Figure 13). Current studies indicate that most NRAMPs are located on the plasma membrane [18,19]. Given the membrane localization and the conservation of the protein sequence of SbNRAMP6 (Figure A2), we propose that this protein facilitates the transmembrane transport of metal ions, such as Cd, Mn, and Zn, similarly to other members of the NRAMP family, thereby regulating ion homeostasis and stress responses in plants [56,57].
All SbNRAMPs share motifs 3, 5, 9, and 10, highlighting strong conservation and suggesting functional similarity (Figure 3c). Promoter analysis results showed that SbNRAMP5 and SbNRAMP10 contain ABREs, indicating abscisic acid regulation, while SbNRAMP1 is enriched with CGTCA motifs, suggesting responsiveness to methyl jasmonate (Figure 4). The promoters of many SbNRAMP genes possess defense and stress response cis-acting elements, highlighting their roles in plant defense and adaptation. Through WGCNA of transcriptome data, we identified SbNRAMP5 as a key gene associated with saline–alkali stress in the roots of sorghum seedlings. Additionally, SbNRAMP5 was found to be highly expressed in a tissue-specific manner. In the roots, flowers, and shoots of plants, the expression is most significant (Figure 6), exhibiting significant expression across multiple tissues. We hypothesize that SbNRAMP5 may play a crucial role in abiotic stress response; however, the specific functions of this gene require further investigation.
Previous studies have demonstrated that NRAMPs are associated with the uptake and transport of various metal ions in plants [19]. In A. thaliana, the gene AtNRAMP2 exhibits manganese transport activity, facilitating the entry of manganese into the cytoplasm of yeast and effectively rescuing the manganese deficiency phenotype [58]. Additionally, AtNRAMP1 serves a dual role in the absorption and transport of both manganese and iron, playing a crucial role in regulating iron uptake in roots. It is also identified as a key transporter for manganese absorption, particularly under conditions of low manganese availability [43]. In rice, there are seven NRAMP genes. OsNRAMP3 serves as a regulator of manganese distribution in plant tissues [45]. OsNRAMP5 serves as the primary transporter for manganese (Mn2+) uptake from soil by plant roots, while also facilitating the secondary accumulation of cadmium (Cd) [49,59]. OsNRAMP4 is the first transporter recognized as a trivalent aluminum ion transporter within this family; however, its protein structure exhibits less similarity with other family members, indicating that OsNRAMP4 is not involved in the transport of metals such as zinc, manganese, and iron [60]. In this study, we analyzed the expression profiles of the SbNRAMP genes in the aboveground parts and roots of sorghum seedlings subjected to three metal treatments. Our findings indicate that, under the stress of these three metals, SbNRAMP1 exhibits a transient induction that occurs exclusively at specific time points under defined metal stresses (Cd stress at 24 h, Mn and Zn stress at 12 h), while other family members show sustained differential expression across multiple time points. (Figure 9, Figure 10 and Figure 11). This suggests that the SbNRAMP gene family may play a crucial role in the transport of metals in both the shoots and roots of sorghum seedlings, with marked differences in the expression of various genes.
Through the assessment of physiological indices under stress, we observed that, compared to the control group, the activity of key antioxidant enzymes in the treatment group (Figure 12)—including superoxide dismutase (SOD) and peroxidase (POD)—increased significantly. This finding suggests that sorghum mitigated metal ion stress by modulating its antioxidant enzyme system [61]. Malondialdehyde (MDA) is a significant end product of lipid peroxidation in plant membranes, particularly under heavy metal stress [62,63]. The accumulation of MDA in plants can lead to severe damage to cell membranes [64]. Our results indicate that the content of MDA, a biomarker for oxidative damage, increased significantly, suggesting that the membrane system of sorghum seedlings was compromised under the stress of three different metals. These physiological changes indicate that sorghum seedlings can mitigate the damage caused by reactive oxygen species by regulating their own antioxidant enzyme systems when exposed to metal stress.

4. Materials and Methods

4.1. Material Cultivation and Treatment

Sorghum bicolor seeds were surface-sterilized with 0.1% H2O2 for 10 min and subsequently rinsed four times with distilled water until the wash was clear. The seeds were then placed on filter paper in Petri dishes and incubated at 23 °C under a 16-h light/8-h dark cycle in a greenhouse to promote germination. Once the seedlings reached approximately 25 mm in height, they were transferred to hydroponic boxes containing half-strength Hoagland solution. Upon reaching the two-leaf and one-heart stage, uniformly growing seedlings were selected for metal stress experiments. The seedlings were divided into control and treatment groups, with the control group maintained in half-strength Hoagland medium, while the treatment group received half-strength Hoagland medium supplemented with 100 μmol/L MnCl2·4H2O, 100 μmol/L CdCl2, or 100 μmol/L ZnCl2 [65]. Samples from aboveground tissues and roots were collected at 0 h for the control group and at 6, 12, and 24 h for the treatment group, with three replicates per condition. Each replicate included five seedlings, and 0.1 g of each tissue type was harvested per replicate. Collected shoots and roots were immediately frozen in liquid nitrogen and stored at −80 °C for subsequent RNA extraction.

4.2. Total RNA Extraction, cDNA Synthesis, and NRAMP Gene Expression Analyses

At each time point, 0.1 g of root and shoot tissues were collected from sorghum seedlings. Total RNA was isolated from the shoots and roots using the TRIzol reagent kit (Shanghai Huiying Biotechnology Co., Ltd., Shanghai, China), and first-strand cDNA was synthesized with the Thermo Scientific (Waltham, MA, USA) RNA reverse transcription kit. The resulting cDNA served as the template for quantitative real-time PCR (qRT-PCR). Twelve primer pairs were designed for qRT-PCR in accordance with standard primer design criteria. Actin (Gene ID: LOC110436378, NCBI) was utilized as the internal reference gene. Each 20 μL qRT-PCR reaction comprised 10 μL of 2× SYBR Green Master Mix (Tiangen, Beijing, China), 1 μL each of forward and reverse primers, 1 μL of cDNA, and 7 μL of deionized water. The amplification protocol included initial denaturation at 94 °C for 30 s, followed by 40 cycles of denaturation at 94 °C for 30 s and annealing/extension at 60 °C for 30 s. The expression of 12 SbNRAMP genes was quantified using gene-specific primers, and relative expression levels were calculated via the 2−ΔΔCt method [66]. All experiments were conducted in triplicate. All primers used in this study are listed in Table A1.

4.3. Determination of Physiological Indexes

Sorghum seedlings were treated with half-strength Hoagland medium supplemented with 100 μmol/L MnCl2·4H2O, 100 μmol/L CdCl2, or 100 μmol/L ZnCl2 for 2 days. The control group was cultured in half-strength Hoagland medium for the same period. The aboveground portions (sheet) of the sorghum seedlings were harvested and rapidly frozen in liquid nitrogen. Each treatment group consisted of three replicates, each containing four sorghum seedlings. Subsequently, the activities of antioxidant enzymes were measured, with a focus on superoxide dismutase (SOD), peroxidase (POD), malondialdehyde (MDA), and proline (Pro). All substances were quantified using a test kit from Beijing Solebold (Beijing, China), which provides detailed information regarding the experimental procedures.

4.4. Subcellular Localization Analysis

The construction of the pB121–SbNRAMP6 vector was based on the published method [67]. Agrobacterium tumefaciens (GV3101) was used for the transient transformation of the 35S:SbNRAMP6–green fluorescent protein (SbNRAMP6-GFP) vector and the 35S:GFP empty vector, which were injected into the epidermal cells of 4-week-old tobacco plants [68]. Transgenic tobacco was initially cultured in the dark for one day, followed by normal cultivation for two additional days. Subsequently, a 1 μg/mL DAPI solution was injected into the leaves and incubated in the dark for 20 min. The blade was cut into 1 cm2 pieces to make temporary slides. The fluorescence signal was observed using a laser scanning confocal microscope (Leica; Wetzlar, Hessen, Germany).

4.5. Identification and Physicochemical Properties Analysis of SbNRAMP

The sorghum genome, protein, GFF3 annotation, and coding sequence (CDS) data were downloaded from the NCBI database (https://www.ncbi.nlm.nih.gov/). Six NRAMP gene sequences from A. thaliana were obtained from the TAIR database (https://www.arabidopsis.org/). The NRAMP sequences of A. thaliana and sorghum were aligned using Tbtools to preliminarily identify NRAMP candidates based on sequence similarity. The hidden Markov model (HMM) file for NRAMP (PF01566) was retrieved from the Pfam database (http://pfam-legacy.xfam.org/), and HMMER v3.0 was employed for sequence retrieval using the hmmsearch program. Sorghum protein sequences with E-values below 0.05 were retained as additional candidates. Overlapping results from the two identification methods were compared to eliminate duplicates. Candidate sequences were further validated using the Ensembl Plants database (https://plants.ensembl.org/index.html, accessed on 11 October 2024), and the final NRAMP family members were confirmed based on the presence of two conserved motifs. The characteristics of the 12 identified SbNRAMPs, including amino acid number, molecular weight, isoelectric point, atom count, instability index, aliphatic index, and hydrophilicity, were predicted using the ProtParam tool on the ExPASy platform (https://www.expasy.org/).

4.6. Chromosomal Localization, Protein Structure, and Subcellular Localization Prediction

Chromosome density files were generated from the whole-genome annotation of sorghum using TBtools. Target genes were identified and visually pre-mapped within TBtools by integrating the protein sequence file, genome annotation, and chromosome density data. Gene annotation information for the 12 SbNRAMP genes was extracted from the genome annotation, and the visualization function of TBtools was employed to display their chromosomal locations.
The secondary structures of the 12 NRAMPs were predicted using SOPMA, while their tertiary structures were modeled through comparative modeling with SWISS-MODEL (https://swissmodel.expasy.org/). Subcellular localization for all 12 NRAMPs was determined using the Plant-mPLoc (http://www.csbio.sjtu.edu.cn/bioinf/plant-multi/, accessed on 15 April 2025) server.

4.7. Multiple Sequence Alignment and Phylogenetic Analysis

The protein sequence alignment of SbNRAMP was conducted using MEGA 11.0, and the resulting FASTA file was subsequently visualized using GeneDoc 2.7 software. The frequency of conserved protein sequences was plotted using the WebLogo 3 online tool (https://weblogo.berkeley.edu/logo.cgi, accessed on 11 March 2025).
A phylogenetic tree representing the NRAMP gene family across multiple species was constructed. Species data were sourced from NCBI, and the corresponding protein sequences were retrieved using TBtools v2.085 software. Phylogenetic trees for the NRAMP gene family members across sorghum, rice, A. thaliana, foxtail millet, and maize were generated using MEGA 11.0 software. The bootstrap value was set to 1000 repetitions, employing the neighbor-joining (NJ) method, and the online platform ITOL (https://itol.embl.de/, accessed on 14 April 2025) was utilized to enhance the visual presentation of the resulting phylogenetic tree.

4.8. Conserved Domain Analysis of SbNRAMPs

The protein sequences of the SbNRAMP family were submitted to TBtools software for analysis. The number of motifs was set to 10, while the remaining parameters remained unchanged. The results were visualized using TBtools’ built-in software. Each motif sequence was identified and saved using the MEME v5.5.8 online software (https://meme-suite.org/meme/, accessed on 15 April 2025).

4.9. Analysis of Cis-Acting Elements of SbNRAMP Promoter

The promoter sequences of the SbNRAMPs were extracted using TBtools v2.085 software and subsequently submitted to the online tool Plant CARE v1.0 (https://bioinformatics.psb.ugent.be/webtools/plantcare/html/, accessed on 3 May 2025) for analysis. The obtained data were screened and analyzed, and the final results were visualized using TBtools software to create a cis-acting element map.

4.10. Replication Events Between SbNRAMPs

The chromosomal location of the SbNRAMP genes can be determined using the sorghum genome annotation file. Additionally, the collinearity information for the SbNRAMP genes can be extracted using TBtools software, while the collinearity relationships of the SbNRAMP genes were visualized with the Circos program within TBtools.

4.11. SbNRAMP Expression Profile Mapping

The FPKM expression values of the SbNRAMP genes across various tissues were obtained utilizing the Sorghum Functional Genomics Database (http://structuralbiology.cau.edu.cn/sorghum/index.html, accessed on 22 October 2024) for online analysis. This dataset includes expression information for various tissues, such as floral meristem, flower, root, shoot, vegetative meristem, leaf, early inflorescence, inflorescence, 5-day and 10-day post-pollination seed, anther, pistil, plant embryo, and endosperm tissue. Subsequently, a heatmap of the expression data was generated using TBtools software. The expression levels were calculated using log2 FPKM [69].

4.12. Weighted Gene Co-Expression Network Analysis (WGCNA)

The transcriptome data utilized in this study were derived from previously published experimental studies. Sorghum seedlings, characterized by the presence of the third true leaf, were treated with a modified Hoagland solution containing 150 mM NaHCO3. The aboveground parts and roots of both the control group (0 h) and treatment groups (NaHCO3 treatment at 6, 12, and 24 h) were randomly collected for RNA extraction [70]. The phrase ‘randomly collected’ signifies that samples were taken from multiple seedlings in each replicate, without bias towards specific parts (beyond being aboveground). This approach ensures that the samples are pooled to accurately represent the average shoot response. The gene expression matrix was generated based on the expression levels of genes under saline–alkali stress at different time points (0 h, 6 h, 12 h, and 24 h). A Weighted Gene Co-expression Network Analysis (WGCNA) network was constructed using a threshold of 0.5-fold and a minimum of 30 gene counts to integrate closely related genes into distinct modules. Data analysis was performed using the WGCNA-shiny plugin in TBtools (https://github.com/ShawnWx2019/WGCNA-shinyApp, accessed on 12 November 2024). Modules that displayed a correlation coefficient of ≥0.8 and a p-value of ≤0.05 were designated as stress-related modules.

4.13. Statistical Analysis

Experimental data were processed and analyzed using Microsoft Excel 2019 for data organization, IBM SPSS Statistics 20 for statistical analysis, and GraphPad Prism 8 for visualization and graphing. Tukey’s post hoc test was applied for multiple comparisons in ANOVA, with a significance level set at p < 0.05.

5. Conclusions

In this study, we systematically identified 12 NRAMP genes from the whole genome of two-color sorghum. These SbNRAMP genes are randomly distributed across seven chromosomes of sorghum, containing two pairs of fragment repeats, and are further classified into three families (I-III). The three subfamilies exhibit certain differences in conserved motifs and protein structures, with members within a single subfamily showing high similarity. These SbNRAMPs exhibit tissue specificity and functional diversity throughout growth and development. They play a crucial role in regulating plant responses to metal ion stress, particularly in response to cadmium (Cd), manganese (Mn), and zinc (Zn). This study provides a foundational and theoretical basis for investigating the functions and mechanisms of the sorghum gene family in plant growth and development.

Author Contributions

Conceptualization, X.D. and H.W.; methodology, X.H.; software, X.L.; validation, X.H. and X.L.; formal analysis, B.Z.; investigation, L.G.; resources, X.D.; data curation, T.Z.; writing—original draft preparation, X.H.; writing—review and editing, X.D.; visualization, F.Y.; supervision, L.L.; project administration, B.Z.; funding acquisition, H.W. All authors have read and agreed to the published version of the manuscript.

Funding

This research was funded by the Guizhou Science and Technology Talent Innovation Team Project (CXTD [2025]055) and the National Natural Science Foundation of China (grant no. 32260506).

Data Availability Statement

The data presented in this study are available in the European Molecular Biology Laboratory’s (EMBL’s) European Bioinformatics Institute database at [https://www.embl.org/], reference numbers E-MTAB-5956, E-MTAB-4273, E-GEOD-98817, and E-CURD-25. (SUB13694414).

Conflicts of Interest

The authors declare no conflicts of interest.

Appendix A

Table A1. Primers for qRT-PCR analysis in this study.
Gene NamePrimer NamePrimer Sequence (5′–3′)Tm (°C)Length (bp)
SbNRAMP1FAGCACTCGTGGTCTCAATGG60193
RACTCCTGGTGGCAAATCTCG
SbNRAMP2FACCAGCAAGATAACCGAGGC60184
RTCTTTCAGGAACAGCAGCGT
SbNRAMP3FGGCTGTTTCGTCAGAATGGC59157
RCAGTGAAGCCTGCCAAACAC
SbNRAMP4FTCCACCCACCTATGAAGCCGA62181
RCTGAGGCATAGAAGGCACCCT
SbNRAMP5FGCGCTCGATTGCTTCATCTT59175
RTGATGCAGCCCACAATTCCA
SbNRAMP6FTCGCAGAGGTGGCTGTAATC60119
RCTTCCGCACCCCGTATCTTT
SbNRAMP7FGGTGTAGCAATGTTCGTGGC60198
RTTGCCCAGCGTAAGTACCAG
SbNRAMP8FATATCTTCTCGGCGCAGTCG60208
RTTGAACAGCCACCCTGATCC
SbNRAMP9FAATGCAGACAACCTCTCCCC59140
RATGATGACCTGCCCAGCAAA
SbNRAMP10FTGTGGAGCAAGCACTTTCCT60148
RTGGCATAAACCCCTCGCAAT
SbNRAMP11FGCCCTAACACCCAAGCTGTA59175
RCTGCTGTGGACTGCTTTGAC
SbNRAMP12FTGTCCACCGTCTCCCAAGTA60166
RATGTCCTCTCGGGGCAAATG
Figure A1. Protein tertiary structure prediction of SbNRAMP gene family members. Purple represents the α-helix structure, green for β-strands, and grey for loops and coils. Tertiary structures were modeled and visualized using SWISS-MODEL with default parameters.
Plants 14 02660 g0a1
Figure A2. The protein sequence alignment of SbNRAMP; red, blue, and green, respectively, indicate that the amino acid conservation is 100%, greater than or equal to 80%, and greater than or equal to 60%. The asterisks (*) above the alignment denote fully conserved residues across all sequences. Protein sequences aligned with MEGA 11.0 and visualized using GeneDoc.
Plants 14 02660 g0a2

References

  1. Kapilan, R.; Vaziri, M.; Zwiazek, J.J. Regulation of Aquaporins in Plants under Stress. Biol. Res. 2018, 51, 4. [Google Scholar] [CrossRef]
  2. Feil, S.B.; Pii, Y.; Valentinuzzi, F.; Tiziani, R.; Mimmo, T.; Cesco, S. Copper Toxicity Affects Phosphorus Uptake Mechanisms at Molecular and Physiological Levels in Cucumis sativus Plants. Plant Physiol. Biochem. 2020, 157, 138–147. [Google Scholar] [CrossRef]
  3. Farhat, N.; Elkhouni, A.; Zorrig, W.; Smaoui, A.; Abdelly, C.; Rabhi, M. Effects of Magnesium Deficiency on Photosynthesis and Carbohydrate Partitioning. Acta Physiol. Plant. 2016, 38, 145. [Google Scholar] [CrossRef]
  4. Gate, T.; Hill, L.; Miller, A.J.; Sanders, D. AtIAR1 Is a Zn Transporter That Regulates Auxin Metabolism in Arabidopsis thaliana. J. Exp. Bot. 2023, 75, 1437–1450. [Google Scholar] [CrossRef]
  5. Mary, V.; Ramos, M.S.; Gillet, C.; Socha, A.L.; Giraudat, J.; Agorio, A.; Merlot, S.; Clairet, C.; Kim, S.A.; Punshon, T.; et al. Bypassing Iron Storage in Endodermal Vacuoles Rescues the Iron Mobilization Defect in the Natural Resistance Associated-Macrophage Protein 3 Natural Resistance Associated-Macrophage Protein 4 Double Mutant. Plant Physiol. 2015, 169, 748–759. [Google Scholar] [CrossRef]
  6. Pirooz, P.; Amooaghaie, R.; Bakhtiari, S. Interactive Effect of Silicon and Nitric Oxide Effectively Contracts Copper Toxicity in Salvia officinalis L. Int. J. Phytoremediat. 2023, 25, 1801–1809. [Google Scholar] [CrossRef]
  7. Niekerk, L.-A.; Carelse, M.F.; Bakare, O.O.; Mavumengwana, V.; Keyster, M.; Gokul, A. The Relationship between Cadmium Toxicity and the Modulation of Epigenetic Traits in Plants. Int. J. Mol. Sci. 2021, 22, 7046. [Google Scholar] [CrossRef]
  8. Zhu, T.; Li, L.; Duan, Q.; Liu, X.; Chen, M. Progress in Our Understanding of Plant Responses to the Stress of Heavy Metal Cadmium. Plant Signal. Behav. 2021, 16, 1836884. [Google Scholar] [CrossRef] [PubMed]
  9. Nawaz, T.; Joshi, N.; Fahad, S.; Saud, S.; Ur Rahman, T.; Khan, M.N.R.; Hassan, S. Solar-Powered N2-Fixing Cyanobacteria for Bio-Nitrogen Fertilizer Production and Soil Health Improvement: A Sustainable Farming Approach. In Environment, Climate, Plant and Vegetation Growth; Fahad, S., Saud, S., Nawaz, T., Gu, L., Ahmad, M., Zhou, R., Eds.; Springer Nature: Cham, Switzerland, 2024; pp. 75–113. ISBN 978-3-031-69417-2. [Google Scholar]
  10. Khalid, S.; Shahid, M.; Niazi, N.K.; Murtaza, B.; Bibi, I.; Dumat, C. A Comparison of Technologies for Remediation of Heavy Metal Contaminated Soils. J. Geochem. Explor. 2017, 182, 247–268. [Google Scholar] [CrossRef]
  11. Zheng, H.; Dang, Y.; Sui, N. Sorghum: A Multipurpose Crop. J. Agric. Food Chem. 2023, 71, 17570–17583. [Google Scholar] [CrossRef]
  12. Schmidt, J.J.; Yerka, M.K.; Pedersen, J.F.; Lindquist, J.L. Growth, Fitness, and Overwinter Survival of a Shattercane (Sorghum bicolor ssp. drummondii) × Grain Sorghum (Sorghum bicolor ssp. bicolor) F2 Population. Weed Sci. 2018, 66, 634–641. [Google Scholar] [CrossRef]
  13. Ma, J.; Liu, Z.; Guo, Z.; Wang, X.; Zou, C.; Zhang, C.; Gai, Z. Identification and Function Analysis of Drought-Responsive miRNAs in Sorghum (Sorghum bicolor). Braz. J. Bot. 2025, 48, 30. [Google Scholar] [CrossRef]
  14. Li, H.; Xu, J.; Sun, Q.; Wang, X.; Lin, J.; Chen, S.; Ma, H.; Zhong, M. Two Petroleum-Induced Small Heat Shock Proteins of Mirabilis Jalapa Confer Tunicamycin Tolerance in Transgenic Saccharomyces Cerevisiae. Environ. Eng. Sci. 2020, 37, 826–837. [Google Scholar] [CrossRef]
  15. Smith, N.E.G.; Tooley, E.G.; Maricle, B.R. Inorganic Fertilizer and Salt Tolerance in Sorghum bicolor (L.) Moench ssp. Bicolor. J. Plant Nutr. 2020, 43, 1390–1399. [Google Scholar] [CrossRef]
  16. Rahman, T.U.; Shah, S.; Hassan, S.; Fahad, S. Food Security Challenges and Adaptation Strategies in China amidst Global Climate Change. J. Umm Al-Qura Univ. Appll. Sci. 2025. [Google Scholar] [CrossRef]
  17. Qin, L.; Han, P.; Chen, L.; Walk, T.C.; Li, Y.; Hu, X.; Xie, L.; Liao, H.; Liao, X. Genome-Wide Identification and Expression Analysis of NRAMP Family Genes in Soybean (Glycine max L.). Front. Plant Sci. 2017, 8, 1436. [Google Scholar] [CrossRef] [PubMed]
  18. Chen, Y.; Zhao, X.; Li, G.; Kumar, S.; Sun, Z.; Li, Y.; Guo, W.; Yang, J.; Hou, H. Genome-Wide Identification of the Nramp Gene Family in Spirodela polyrhiza and Expression Analysis under Cadmium Stress. Int. J. Mol. Sci. 2021, 22, 6414. [Google Scholar] [CrossRef] [PubMed]
  19. Mani, A.; Sankaranarayanan, K. In Silico Analysis of Natural Resistance-Associated Macrophage Protein (NRAMP) Family of Transporters in Rice. Protein J. 2018, 37, 237–247. [Google Scholar] [CrossRef]
  20. Yang, Y.; Zheng, J.; Liang, Y.; Wang, X.; Li, K.; Chen, L.; Aduragbemi, A.; Han, Y.; Sun, Z.; Li, H.; et al. Natural Resistance-Associated Macrophage Protein (Nramp) Family in Foxtail Millet (Setaria italica): Characterization, Expression Analysis and Relationship with Metal Content Under Cd Stress. Agronomy 2023, 13, 2000. [Google Scholar] [CrossRef]
  21. Zhang, X.D.; Meng, J.G.; Zhao, K.X.; Chen, X.; Yang, Z.M. Annotation and Characterization of Cd-Responsive Metal Transporter Genes in Rapeseed (Brassica napus). Biometals 2017, 31, 107–121. [Google Scholar] [CrossRef]
  22. Mäser, P.; Thomine, S.; Schroeder, J.I.; Ward, J.M.; Hirschi, K.; Sze, H.; Talke, I.N.; Amtmann, A.; Maathuis, F.J.; Sanders, D.; et al. Phylogenetic Relationships within Cation Transporter Families of Arabidopsis. Plant Physiol. 2001, 126, 1646–1667. [Google Scholar] [CrossRef]
  23. Meng, J.G.; Zhang, X.D.; Tan, S.K.; Zhao, K.X.; Yang, Z.M. Genome-Wide Identification of Cd-Responsive NRAMP Transporter Genes and Analyzing Expression of NRAMP 1 Mediated by miR167 in Brassica napus. Biometals 2017, 30, 917–931. [Google Scholar] [CrossRef]
  24. Takahashi, R.; Ishimaru, Y.; Nakanishi, H.; Nishizawa, N.K. Role of the Iron Transporter OsNRAMP1 in Cadmium Uptake and Accumulation in Rice. Plant Signal. Behav. 2011, 6, 1813–1816. [Google Scholar] [CrossRef]
  25. Wang, N.; Qiu, W.; Dai, J.; Guo, X.; Lu, Q.; Wang, T.; Li, S.; Liu, T.; Zuo, Y. AhNRAMP1 Enhances Manganese and Zinc Uptake in Plants. Front. Plant Sci. 2019, 10, 415. [Google Scholar] [CrossRef]
  26. Yu, Y.; Rong, K.; Sui, X.; Zhang, L.; Zhang, M.; Hu, H.; Jia, J.; Wu, J.; Li, C. Analysis of NRAMP Genes in the Triticeae Reveals That TaNRAMP5 Positively Regulates Cadmium (Cd) Tolerance in Wheat (Triticum aestivum). Plant Physiol. Biochem. 2025, 219, 109321. [Google Scholar] [CrossRef] [PubMed]
  27. Toyokura, K.; Naito, K.; Makabe, K.; Nampei, M.; Natsume, H.; Fukazawa, J.; Kusaba, M.; Ueda, A. A Chromosome-Level Genome Sequence Reveals Regulation of Salt Stress Response in Mesembryanthemum crystallinum. Physiol. Plant. 2025, 177, e70057. [Google Scholar] [CrossRef] [PubMed]
  28. Yang, M.; Zhang, Y.; Zhang, L.; Hu, J.; Zhang, X.; Lu, K.; Dong, H.; Wang, D.; Zhao, F.-J.; Huang, C.-F.; et al. OsNRAMP5 Contributes to Manganese Translocation and Distribution in Rice Shoots. J. Exp. Bot. 2014, 65, 4849–4861. [Google Scholar] [CrossRef]
  29. Yue, J.; Tan, Y.; Wei, R.; Wang, X.; Mubeen, S.; Chen, C.; Cao, S.; Wang, C.; Chen, P. Genome-Wide Identification of bHLH Transcription Factors in Kenaf (Hibiscus cannabinus L.) and Gene Function Analysis of HcbHLH88. Physiol. Mol. Biol. Plants 2024, 30, 1517–1532. [Google Scholar] [CrossRef]
  30. Nelson, N. Metal Ion Transporters and Homeostasis. EMBO J. 1999, 18, 4361–4371. [Google Scholar] [CrossRef] [PubMed]
  31. Liu, S.; Long, T.; Chen, Z.; Liu, J.; Cui, W.; Leng, H.; Xing, Y.; Rodriguez, L.G.; Gao, Y.; Yao, Y. Genome-Wide Identification of NRAMP Family Genes in Populus trichocarpa and Their Roles in Transport of Heavy Metals. Tree Genet. Genomes 2023, 19, 51. [Google Scholar] [CrossRef]
  32. Kanwal, F.; Riaz, A.; Ali, S.; Zhang, G. NRAMPs and Manganese: Magic Keys to Reduce Cadmium Toxicity and Accumulation in Plants. Sci. Total Environ. 2024, 921, 171005. [Google Scholar] [CrossRef]
  33. Belouchi, A.; Kwan, T.; Gros, P. Cloning and Characterization of the OsNramp Family from Oryza sativa, a New Family of Membrane Proteins Possibly Implicated in the Transport of Metal Ions. Plant Mol. Biol. 1997, 33, 1085–1092. [Google Scholar] [CrossRef]
  34. Zhou, G.; An, Q.; Liu, Z.; Bao, W.; Wan, Y. Systematic Analysis of NRAMP Family Genes in Areca Catechu and Its Response to Zn/Fe Deficiency Stress. Int. J. Mol. Sci. 2023, 24, 7383. [Google Scholar] [CrossRef]
  35. Li, J.; Duan, Y.; Han, Z.; Shang, X.; Zhang, K.; Zou, Z.; Ma, Y.; Li, F.; Fang, W.; Zhu, X. Genome-Wide Identification and Expression Analysis of the NRAMP Family Genes in Tea Plant (Camellia sinensis). Plants 2021, 10, 1055. [Google Scholar] [CrossRef]
  36. Liu, Q.; Li, S.; Du, G.; An, X. Genome-Wide Analysis of the Nramp Gene Family in Kenaf (Hibiscus cannabinus): Identification, Expression Analysis, and Response to Cadmium Stress. Plants 2024, 13, 2514. [Google Scholar] [CrossRef]
  37. Zhang, Y.; Sharan, S.; Rinnan, Å.; Orlien, V. Survey on Methods for Investigating Protein Functionality and Related Molecular Characteristics. Foods 2021, 10, 2848. [Google Scholar] [CrossRef] [PubMed]
  38. Tan, Z.; Li, J.; Guan, J.; Wang, C.; Zhang, Z.; Shi, G. Genome-Wide Identification and Expression Analysis Reveals Roles of the NRAMP Gene Family in Iron/Cadmium Interactions in Peanut. Int. J. Mol. Sci. 2023, 24, 1713. [Google Scholar] [CrossRef] [PubMed]
  39. Li, J.; Wang, Y.; Zheng, L.; Li, Y.; Zhou, X.; Li, J.; Gu, D.; Xu, E.; Lu, Y.; Chen, X.; et al. The Intracellular Transporter AtNRAMP6 Is Involved in Fe Homeostasis in Arabidopsis. Front. Plant Sci. 2019, 10, 1124. [Google Scholar] [CrossRef] [PubMed]
  40. Zhu, X.; Pan, T.; Zhang, X.; Fan, L.; Quintero, F.J.; Zhao, H.; Su, X.; Li, X.; Villalta, I.; Mendoza, I.; et al. K Efflux Antiporters 4, 5, and 6 Mediate pH and K Homeostasis in Endomembrane Compartments. Plant Physiol. 2018, 178, 1657–1678. [Google Scholar] [CrossRef]
  41. Segond, D.; Dellagi, A.; Lanquar, V.; Rigault, M.; Patrit, O.; Thomine, S.; Expert, D. NRAMP Genes Function in Arabidopsis thaliana Resistance to Erwinia chrysanthemi Infection. Plant J. 2009, 58, 195–207. [Google Scholar] [CrossRef]
  42. Lanquar, V.; Ramos, M.S.; Lelièvre, F.; Barbier-Brygoo, H.; Krieger-Liszkay, A.; Krämer, U.; Thomine, S. Export of Vacuolar Manganese by AtNRAMP3 and AtNRAMP4 Is Required for Optimal Photosynthesis and Growth under Manganese Deficiency. Plant Physiol. 2010, 152, 1986–1999. [Google Scholar] [CrossRef]
  43. Cailliatte, R.; Schikora, A.; Briat, J.-F.; Mari, S.; Curie, C. High-Affinity Manganese Uptake by the Metal Transporter NRAMP1 Is Essential for Arabidopsis Growth in Low Manganese Conditions. Plant Cell 2010, 22, 904–917. [Google Scholar] [CrossRef]
  44. Cailliatte, R.; Lapeyre, B.; Briat, J.-F.; Mari, S.; Curie, C. The NRAMP6 Metal Transporter Contributes to Cadmium Toxicity. Biochem. J. 2009, 422, 217–228. [Google Scholar] [CrossRef]
  45. Yamaji, N.; Sasaki, A.; Xia, J.X.; Yokosho, K.; Ma, J.F. A Node-Based Switch for Preferential Distribution of Manganese in Rice. Nat. Commun. 2013, 4, 2442. [Google Scholar] [CrossRef] [PubMed]
  46. Takahashi, R.; Ishimaru, Y.; Senoura, T.; Shimo, H.; Ishikawa, S.; Arao, T.; Nakanishi, H.; Nishizawa, N.K. The OsNRAMP1 Iron Transporter Is Involved in Cd Accumulation in Rice. J. Exp. Bot. 2011, 62, 4843–4850. [Google Scholar] [CrossRef] [PubMed]
  47. Sasaki, A.; Yamaji, N.; Yokosho, K.; Ma, J.F. Nramp5 Is a Major Transporter Responsible for Manganese and Cadmium Uptake in Rice. Plant Cell 2012, 24, 2155–2167. [Google Scholar] [CrossRef] [PubMed]
  48. Yang, C.; Zhang, Y.; Huang, C. Reduction in Cadmium Accumulation in Japonica Rice Grains by CRISPR/Cas9-Mediated Editing of OsNRAMP5. J. Integr. Agric. 2019, 18, 688–697. [Google Scholar] [CrossRef]
  49. Ishimaru, Y.; Bashir, K.; Nakanishi, H.; Nishizawa, N.K. OsNRAMP5, a Major Player for Constitutive Iron and Manganese Uptake in Rice. Plant Signal. Behav. 2012, 7, 763–766. [Google Scholar] [CrossRef] [PubMed]
  50. Ueno, D.; Sasaki, A.; Yamaji, N.; Miyaji, T.; Fujii, Y.; Takemoto, Y.; Moriyama, S.; Che, J.; Moriyama, Y.; Iwasaki, K.; et al. A Polarly Localized Transporter for Efficient Manganese Uptake in Rice. Nat. Plants 2015, 1, 15170. [Google Scholar] [CrossRef]
  51. James, A.B.; Sullivan, S.; Nimmo, H.G. Global Spatial Analysis of Arabidopsis Natural Variants Implicates 5′UTR Splicing of Late Elongated Hypocotyl in Responses to Temperature. Plant Cell Environ. 2018, 41, 1524–1538. [Google Scholar] [CrossRef]
  52. Zhang, T.; Li, C.; Zhu, J.; Li, Y.; Wang, Z.; Tong, C.-Y.; Xi, Y.; Han, Y.; Koiwa, H.; Peng, X.; et al. Structured 3′ UTRs Destabilize mRNAs in Plants. Genome Biol. 2024, 25, 54. [Google Scholar] [CrossRef]
  53. Nie, F.; Wang, M.; Liu, L.; Ma, X.; Zhao, J. Genome-Wide Identification and Bioinformatics Analysis of the FK506 Binding Protein Family in Rice. Genes 2024, 15, 902. [Google Scholar] [CrossRef]
  54. Sharma, V.K.; Kumar, N.; Brahmachari, S.K.; Ramachandran, S. Abundance of Dinucleotide Repeats and Gene Expression Are Inversely Correlated: A Role for Gene Function in Addition to Intron Length. Physiol. Genom. 2007, 31, 96–103. [Google Scholar] [CrossRef]
  55. Zhao, Y.; Xie, Q.; Yang, Q.; Cui, J.; Tan, W.; Zhang, D.; Xiang, J.; Deng, L.; Guo, Y.; Li, M.; et al. Genome-Wide Identification and Evolutionary Analysis of the NRAMP Gene Family in the AC Genomes of Brassica Species. BMC Plant Biol. 2024, 24, 311. [Google Scholar] [CrossRef] [PubMed]
  56. Song, L.; Li, W.; Chen, X. Transcription Factor Is Not Just a Transcription Factor. Trends Plant Sci. 2022, 27, 1087–1089. [Google Scholar] [CrossRef]
  57. Han, H.; Wang, C.; Yang, X.; Wang, L.; Ye, J.; Xu, F.; Liao, Y.; Zhang, W. Role of bZIP Transcription Factors in the Regulation of Plant Secondary Metabolism. Planta 2023, 258, 13. [Google Scholar] [CrossRef]
  58. Alejandro, S.; Cailliatte, R.; Alcon, C.; Dirick, L.; Domergue, F.; Correia, D.; Castaings, L.; Briat, J.-F.; Mari, S.; Curie, C. Intracellular Distribution of Manganese by the Trans-Golgi Network Transporter NRAMP2 Is Critical for Photosynthesis and Cellular Redox Homeostasis. Plant Cell 2017, 29, 3068–3084. [Google Scholar] [CrossRef]
  59. Huang, H.; Yamaji, N.; Huang, S.; Ma, J.F. Uptake and Accumulation of Cobalt Is Mediated by OsNramp5 in Rice. Plant Cell Environ. 2025, 48, 3–14. [Google Scholar] [CrossRef]
  60. Hao, X.; Mo, Y.; Ji, W.; Yang, X.; Xie, Z.; Huang, D.; Li, D.; Tian, L. The OsNramp4 Aluminum Transporter Is Involved in Cadmium Accumulation in Rice Grains. Reprod. Breed. 2022, 2, 125–132. [Google Scholar] [CrossRef]
  61. Yuce, M.; Ekinci, M.; Turan, M.; Agar, G.; Aydin, M.; Ilhan, E.; Yildirim, E. Chrysin Mitigates Copper Stress by Regulating Antioxidant Enzymes Activity, Plant Nutrient and Phytohormones Content in Pepper. Sci. Hortic. 2024, 328, 112887. [Google Scholar] [CrossRef]
  62. de Oliveira, R.L.L.; de Mello Prado, R.; Felisberto, G.; Checchio, M.V.; Gratão, P.L. Silicon Mitigates Manganese Deficiency Stress by Regulating the Physiology and Activity of Antioxidant Enzymes in Sorghum Plants. J. Soil Sci. Plant Nutr. 2019, 19, 524–534. [Google Scholar] [CrossRef]
  63. Tauqeer, H.M.; Ali, S.; Rizwan, M.; Ali, Q.; Saeed, R.; Iftikhar, U.; Ahmad, R.; Farid, M.; Abbasi, G.H. Phytoremediation of Heavy Metals by Alternanthera bettzickiana: Growth and Physiological Response. Ecotoxicol. Environ. Saf. 2016, 126, 138–146. [Google Scholar] [CrossRef]
  64. Liu, X.; Zhang, S.; Shan, X.-Q.; Christie, P. Combined Toxicity of Cadmium and Arsenate to Wheat Seedlings and Plant Uptake and Antioxidative Enzyme Responses to Cadmium and Arsenate Co-Contamination. Ecotoxicol. Environ. Saf. 2007, 68, 305–313. [Google Scholar] [CrossRef]
  65. Ye, L.; Yu, J.; Zhang, X.; Yu, F.; Zeng, T.; Gu, L.; Zhu, B.; Wang, H.; Du, X. Physiological, Transcriptomic and Metabolomic Analyses Reveal That Exogenous Arginine Alleviate the Response of Sorghum bicolor L. to Cadmium Stress. Ind. Crops Prod. 2025, 229, 120970. [Google Scholar] [CrossRef]
  66. Livak, K.J.; Schmittgen, T.D. Analysis of Relative Gene Expression Data Using Real-Time Quantitative PCR and the 2−ΔΔCT Method. Methods 2001, 25, 402–408. [Google Scholar] [CrossRef] [PubMed]
  67. Renu, K.; Chakraborty, R.; Haritha, M.; Rajeshwari, K.; Famurewa, A.C.; Madhyastha, H.; Balachandar, V.; George, A.; Abilash, V.G. Molecular Mechanism of Heavy Metals (Lead, Chromium, Arsenic, Mercury, Nickel and Cadmium) Induced Hepatotoxicity—A Review. Chemosphere 2021, 271, 129735. [Google Scholar] [CrossRef]
  68. DeMell, A.; Mendoza, M.R.; Scholthof, H.B. A Tomato Bushy Stunt Virus-Based Vector for Simultaneous Editing and Sensing to Survey the Host Antiviral RNA Silencing Machinery. PNAS Nexus 2023, 3, pgad436. [Google Scholar] [CrossRef] [PubMed]
  69. Min, X.; Liu, Z.; Wang, Y.; Liu, W. Comparative Transcriptomic Analysis Provides Insights into the Coordinated Mechanisms of Leaves and Roots Response to Cold Stress in Common Vetch. Ind. Crops Prod. 2020, 158, 112949. [Google Scholar] [CrossRef]
  70. Wang, H.; Ye, L.; Zhou, L.; Yu, J.; Pang, B.; Zuo, D.; Gu, L.; Zhu, B.; Du, X.; Wang, H. Co-Expression Network Analysis of the Transcriptome Identified Hub Genes and Pathways Responding to Saline–Alkaline Stress in Sorghum bicolor L. Int. J. Mol. Sci. 2023, 24, 16831. [Google Scholar] [CrossRef] [PubMed]
Figure 1. The location of SbNRAMP genes on chromosome. The chromosome number is above, with ‘Chr’ denoting the respective chromosome. The SbNRAMP genes is located on the right side of the chromosome. The scale on the left represents the chromosome length in megabases (Mb). SbNRAMP chromosomal positions were extracted from sorghum GFF files and visualized using TBtools v2.085.
Plants 14 02660 g001
Figure 2. Phylogenetic analysis of 52 NRAMPs in Oryza sativa, Arabidopsis thaliana, Setaria italica, Hordeum vulgare, Zea mays, and Sorghum bicolor. The proteins were divided into three subfamilies. The members of the SbNRAMP family were marked with red fonts, and different species were distinguished by branch nodes with different colors. Note: At represents Arabidopsis thaliana, Si represents Setaria italica, Hv represents Hordeum vulgare, Os represents Oryza sativa, and Zm represents Zea mays. The neighbor-joining tree was created using MEGA11.0 (bootstrap value = 1000). NRAMP sequences can be accessed from the NCBI database.
Plants 14 02660 g002
Figure 3. Conservation motif and gene structure analysis of SbNRAMP genes according to the phylogenetic relationship. (a) Phylogenetic tree: The maximum likelihood tree was constructed using MEGA11.0 software, based on SbNRAMP sequences sourced from Phytozome v13 and NCBI, with 1000 bootstrap replicates; blue, green, and purple backgrounds represent subfamilies I, II, and III. (b) Gene structure: Orange and green squares represent exons and untranslated regions (UTRs), respectively. Black solid line represents intron; the following bar scale represents the gene length. (c) Conserved motif: Motifs (1 to 10) were identified using TBtools and are represented by colored rectangles; the black solid line represents the sequence outside the pattern; the bar scale represents the number of amino acids. (d) Identification of conserved amino acid residue sequences: Sequence logos depict conserved amino acid residue sequences (motifs) identified using the MEME online tool with the number of motifs set to 10 and other parameters at default settings. The X-axis indicates the positions of various amino acids, while the Y-axis represents the corresponding positional values of these amino acids.
Plants 14 02660 g003aPlants 14 02660 g003b
Figure 4. Promoter cis-acting elements. (a) Identification of the cis-acting elements in the promoter of SbNRAMP genes. (b) A heatmap was utilized to visualize the types and counts of identified cis-acting elements within promoter regions for better visualization and understanding of their distribution. Promoter sequences (2 kb upstream of ATG) from SbNRAMP genes were analyzed in PlantCare for cis-acting elements. Target elements were filtered in Microsoft Excel 2019 and visualized using TBtools.
Plants 14 02660 g004
Figure 5. Collinearity analysis of SbNRAMP gene family. (a) Interspecific synteny: The red numbers on the outermost ring correspond to the chromosome numbers, while the red and blue lines in the inner ring indicate distinct replication events of the SbNRAMP genes. Furthermore, the gray lines illustrate the collinear blocks within the plant genome. (b) Synteny analysis of the sorghum NRAMP family in comparison with maize and rice. (c) Synteny analysis of sorghum and A. thaliana NRAMP family: The blue lines in the figure are the common genes between sorghum, A. thaliana, rice, and maize, and the gray lines represent the collinear blocks of the plant genome. Note: Zm represents maize, Os represents rice, and At represents A. thaliana. Data organization was performed using Microsoft Excel 2019. Visualization was generated with Tbtools.
Plants 14 02660 g005
Figure 6. Tissue expression heatmap of SbNRAMP gene family members. Gene expression is expressed in log2 FPKM. The abscissa represents various tissues of sorghum, while the left side of the ordinate displays clustering based on expression levels. The scale on the right side indicates that blue corresponds to low expression and red to high expression. Each grid cell contains a specific expression value. Data source: Sorghum Functional Genomics Database. Visualization was generated with Tbtools.
Plants 14 02660 g006
Figure 7. Screening of key candidate gene SbNRAMP5 from the SbNRAMP gene family under saline–alkali stress. Module–trait associations under saline–alkaline stress at 0h, 6 h, 12 h, and 24 h. The colors, ranging from blue through white to red, indicate low to high correlations. CK represents control samples, T represents street time, and s and r represent the shoots and roots of sorghum samples. Visualization was generated with Tbtools.
Plants 14 02660 g007
Figure 8. The protein–protein interaction (PPI) network of differentially expressed genes (DEGs) under T6h/yellow 0.56 conditions is presented. In this network, nodes represent proteins, while edges indicate interactions between them. The different colors represent the degree centrality of each node, which is the number of interactive connections a protein has. The red ellipse in the outermost layer highlights the gene SbNRAMP5 (ID: Sobic.001G462500). The networks were visualized using Cytoscape (version 3.9.1).
Plants 14 02660 g008
Figure 9. Expression patterns of SbNRAMP genes in sorghum seedling roots and shoots under cadmium (Cd) stress. Transcript levels of SbNRAMP genes in two-leaf- and one-heart-stage sorghum seedlings after 6, 12, and 24 h of treatment with 100 μmol/L CdCl2 were analyzed. Gene expression levels were normalized using the sorghum actin gene (SbACT) as the internal control. The bar colors represent different time points of Cd stress. Data are presented as mean ± standard deviation (SD) from three biological replicates. Different lowercase letters above the bars indicate significant differences (p < 0.05) between time points for each gene. The figure was generated using GraphPad Prism 8. Significance analysis, denoted by letters, was conducted using one-way ANOVA followed by Tukey’s post hoc test with IBM SPSS Statistics 20.
Plants 14 02660 g009
Figure 10. Expression patterns of SbNRAMP genes in sorghum seedling roots and shoots under manganese (Mn) stress. Transcript levels of SbNRAMP genes in two-leaf- and one-heart-stage sorghum seedlings after 6, 12, and 24 h of treatment with 100 μmol/L MnCl2·4H2O were analyzed. Gene expression levels were normalized using the sorghum actin gene (SbACT) as the internal control. The bar colors represent different time points of Mn stress. Data are presented as mean ± standard deviation (SD) from three biological replicates. Different lowercase letters above the bars indicate significant differences (p < 0.05) between time points for each gene. The figure was generated using GraphPad Prism 8. Significance analysis, denoted by letters, was conducted using one-way ANOVA followed by Tukey’s post hoc test with IBM SPSS Statistics 20.
Plants 14 02660 g010
Figure 11. Expression patterns of SbNRAMP genes in sorghum seedling roots and shoots under zinc (Zn) stress. Transcript levels of SbNRAMP genes in two-leaf- and one-heart-stage sorghum seedlings after 6, 12, and 24 h of treatment with 100 μmol/L ZnCl2 were analyzed. Gene expression levels were normalized using the sorghum actin gene (SbACT) as the internal control. The bar colors represent different time points of Zn stress. Data are presented as mean ± standard deviation (SD) from three biological replicates. Different lowercase letters above the bars indicate significant differences (p < 0.05) between time points for each gene. The figure was generated using GraphPad Prism 8. Significance analysis, denoted by letters, was conducted using one-way ANOVA followed by Tukey’s post hoc test with IBM SPSS Statistics 20.
Plants 14 02660 g011
Figure 12. Determination of physiological indexes of sorghum seedlings under metal (Cd, Mn, or Zn) treatments. (a) represents malondialdehyde (MDA) content. (b) represents peroxidase (POD) activity. (c) represents superoxide dismutase (SOD) activity. (d) represents proline (Pro) content. Data are presented as mean ± standard deviation (SD) from three biological replicates. Different lowercase letters (a–c) above the bars within each panel indicate significant differences (p < 0.05) among the different metal treatments for that specific physiological index. Statistical significance was determined using one-way ANOVA followed by Tukey’s post hoc test (IBM SPSS Statistics 20). The figure was generated using GraphPad Prism 8.
Plants 14 02660 g012
Figure 13. SbNRAMP6 is localized to the membrane. The 35S:SbNRAMP6–GFP fusion protein was transiently expressed in tobacco. Nuclei are counterstained with DAPI (blue). Bright-field images show cell morphology, and merged images combine GFP, DAPI, and bright-field channels. Scale bar = 20 µm.
Plants 14 02660 g013
Table 1. Physicochemical properties of sorghum NRAMP family proteins. a amino acid number; b molecular weight; c grand average of hydropathicity; d isoelectric points; atoms total number of atoms. The protein sequences of the twelve SbNRAMPs were obtained either from the sorghum genome or retrieved from UniProt using their respective protein IDs.
Gene NameProtein IDAa aMW b
kDa
pI dNatomsInstabilityAliphatic IndexGRAVY cExonsIntrons
SbNRAMP1A0A1B6QIP346650.757.16728126.38127.340.8365
SbNRAMP2A0A1Z5S5F148653.065.99753333.4116.980.62254
SbNRAMP3A0A1B6QIN81236134.716.0218,94641.6294.730.04876
SbNRAMP4A0A1B6QJE954659.955.57850938.01107.910.44143
SbNRAMP5C5WTQ451656.356.17804834.24114.380.54643
SbNRAMP6A0A1W0W33453558.387.07838338.33121.40.5691211
SbNRAMP7C5 × 2P752556.376.74809738.77127.410.7671312
SbNRAMP8C5XKD61157125.886.0717,69947.1691.21−0.03655
SbNRAMP9A0A194YMG454759.396.03847832.7114.280.5761312
SbNRAMP10A0A1Z5RJE555960.158.52861443.34118.280.681313
SbNRAMP11C5YQG754458.894.89837632.8111.230.46943
SbNRAMP12C5Z7T555059.498.45852132.69118.950.5781312
Table 2. SbNRAMP transmembrane domain number, subcellular localization prediction, and secondary structure prediction information, including alpha helix, extended strand, beta turn, and random coil. Protein secondary structures (SOPMA) and subcellular localization (Plant-mPLoc) were computationally predicted.
Protein NameTM
Domains
Subcellular LocalizationAlpha Helix (%) Extended Strand (%) Beta Turn (%) Random Coil (%)
SbNRAMP111Plasma membrane53.8616.952.5826.61
SbNRAMP210Plasma membrane55.9712.762.8828.40
SbNRAMP310Plasma membrane. nucleus38.3513.353.1645.15
SbNRAMP410Plasma membrane56.2311.722.9329.12
SbNRAMP59Plasma membrane59.1110.473.4926.94
SbNRAMP611Plasma membrane52.9012.712.9931.40
SbNRAMP711Plasma membrane54.2913.523.2428.95
SbNRAMP89Plasma membrane. Chloroplast35.5211.672.5950.22
SbNRAMP910Plasma membrane57.0412.983.2926.69
SbNRAMP1010Plasma membrane58.5011.633.5826.30
SbNRAMP1110Plasma membrane58.2712.682.9426.10
SbNRAMP1212Plasma membrane53.09%13.64%2.9130.36
Disclaimer/Publisher’s Note: The statements, opinions and data contained in all publications are solely those of the individual author(s) and contributor(s) and not of MDPI and/or the editor(s). MDPI and/or the editor(s) disclaim responsibility for any injury to people or property resulting from any ideas, methods, instructions or products referred to in the content.