
Salt Stress Mitigation and Field-Relevant Biostimulant Activity of Prosystemin Protein Fragments: Novel Tools for Cutting-Edge Solutions in Agriculture

 ,
,  , , ,
, , ,  , ,
, ,  ,
,  and
and
Abstract

1. Introduction
2. Results
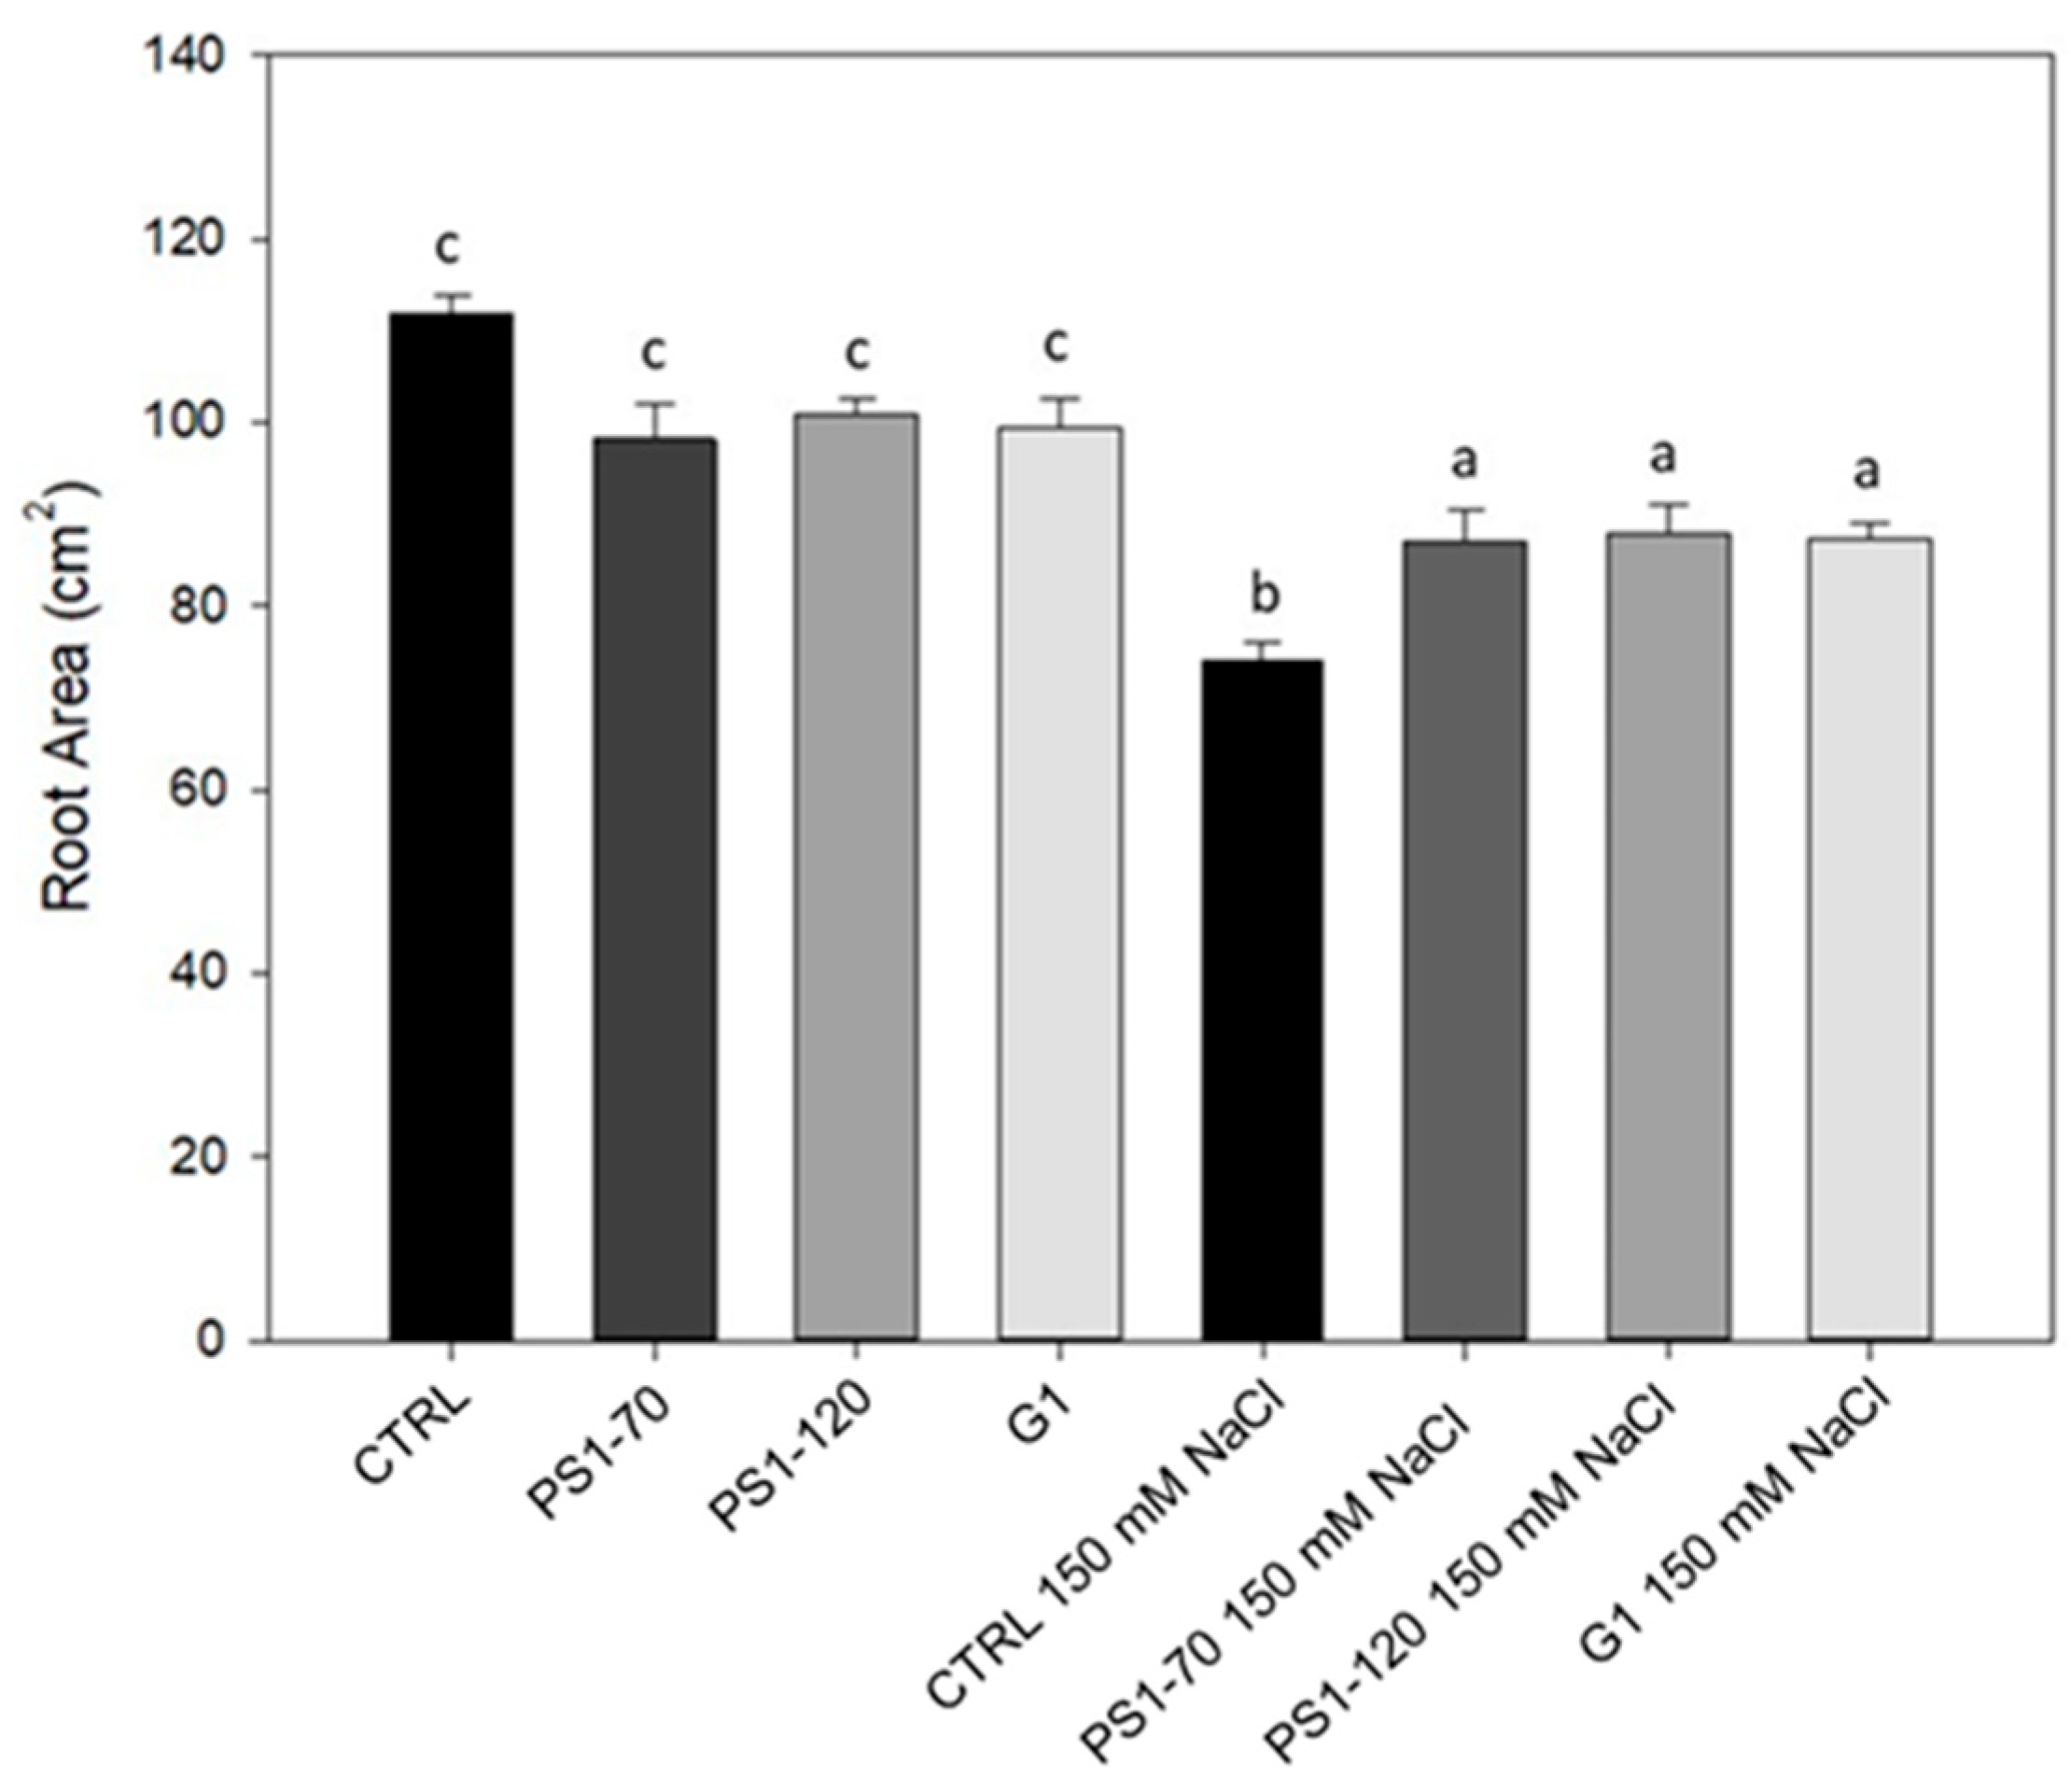
2.1. Experimental Fragments Improve Root Growth Under Salinity and Act as Shoot Biostimulant
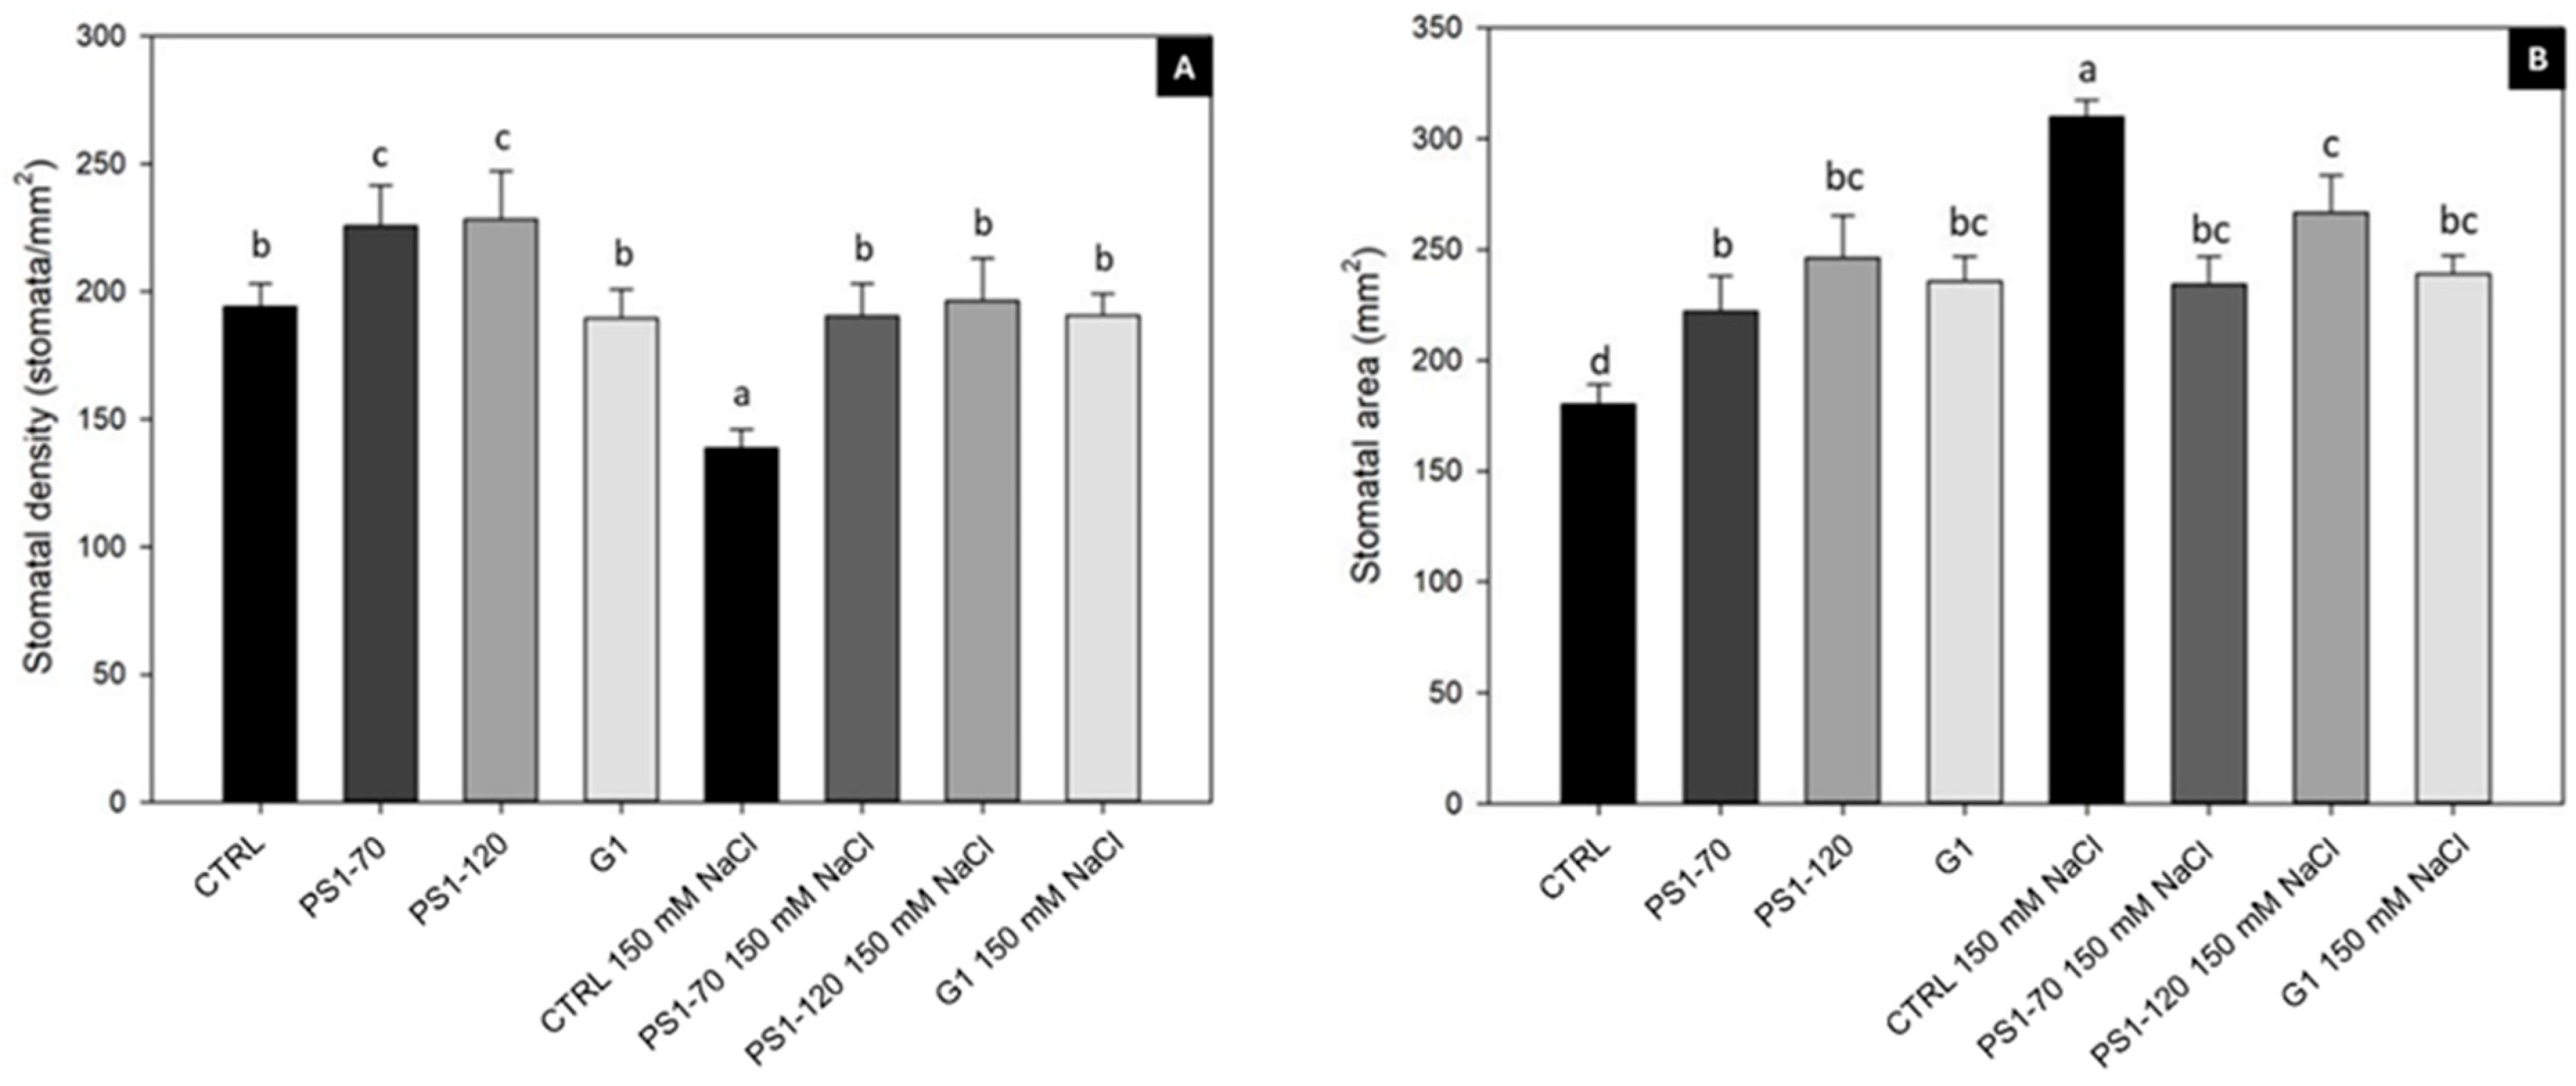
2.2. EFs Positively Affect Stomatal Density and Area
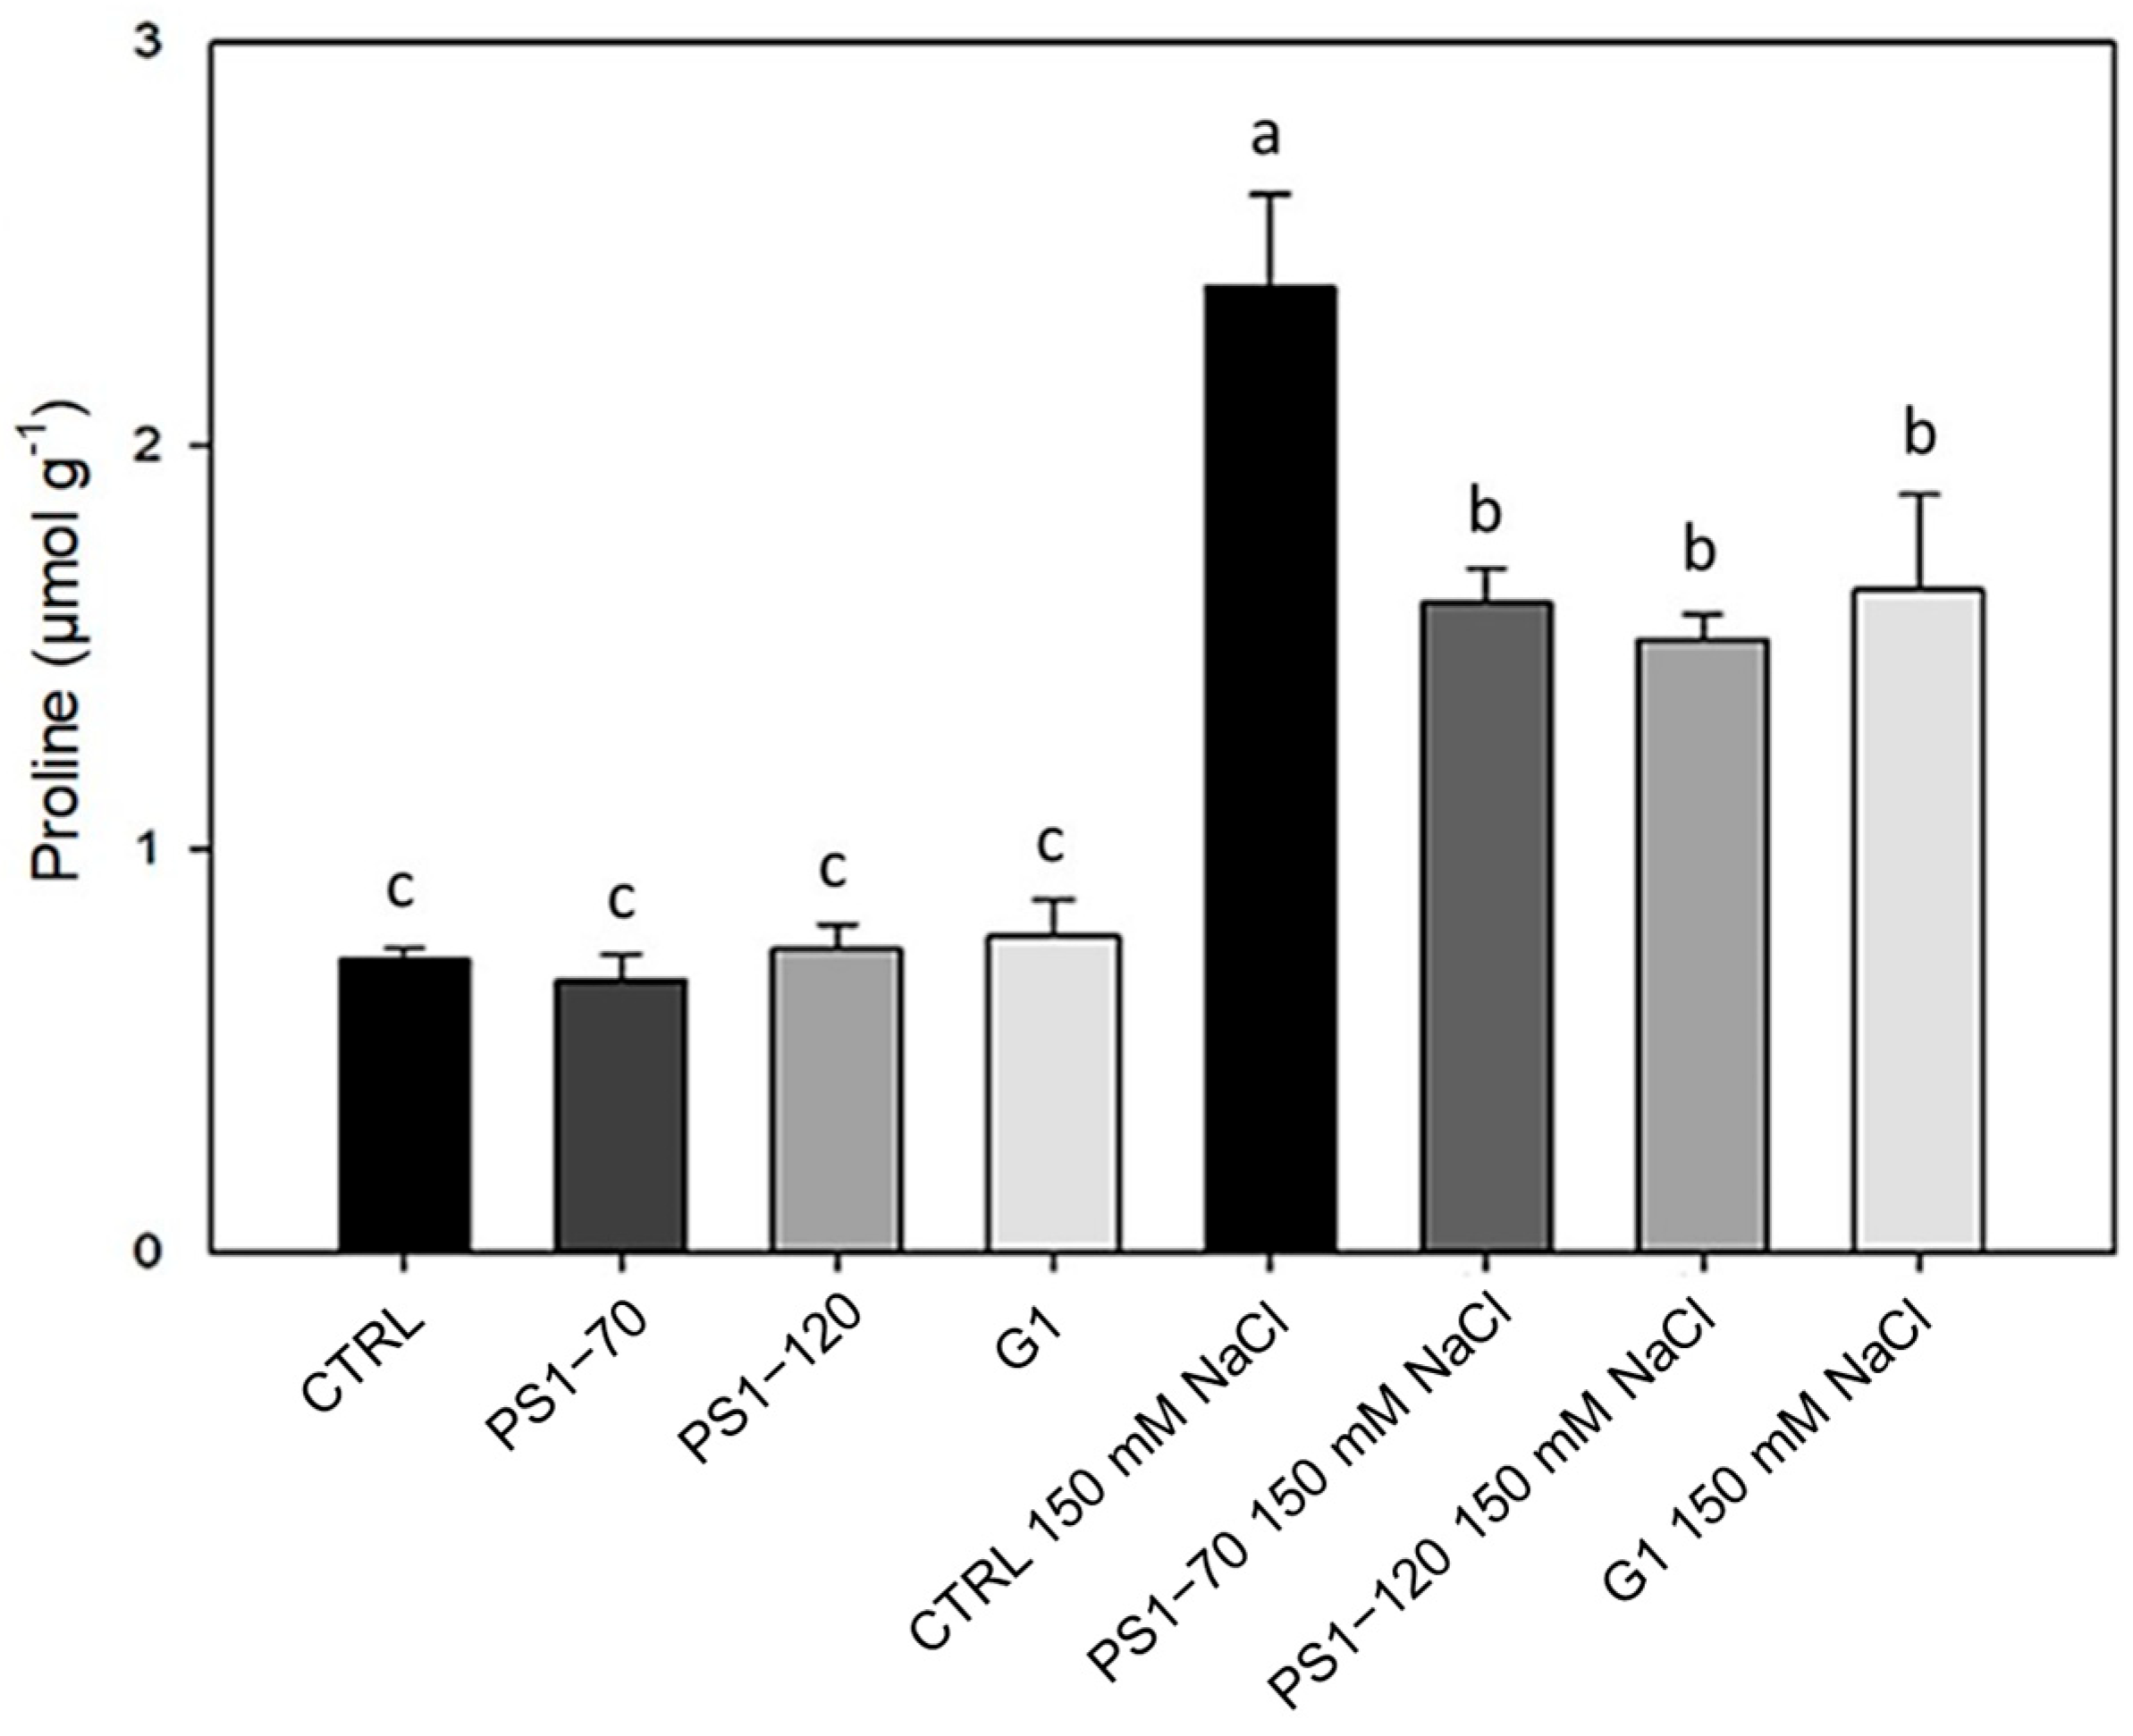
2.3. Proline Content Is Reduced by EF Treatments During Salinity Stress
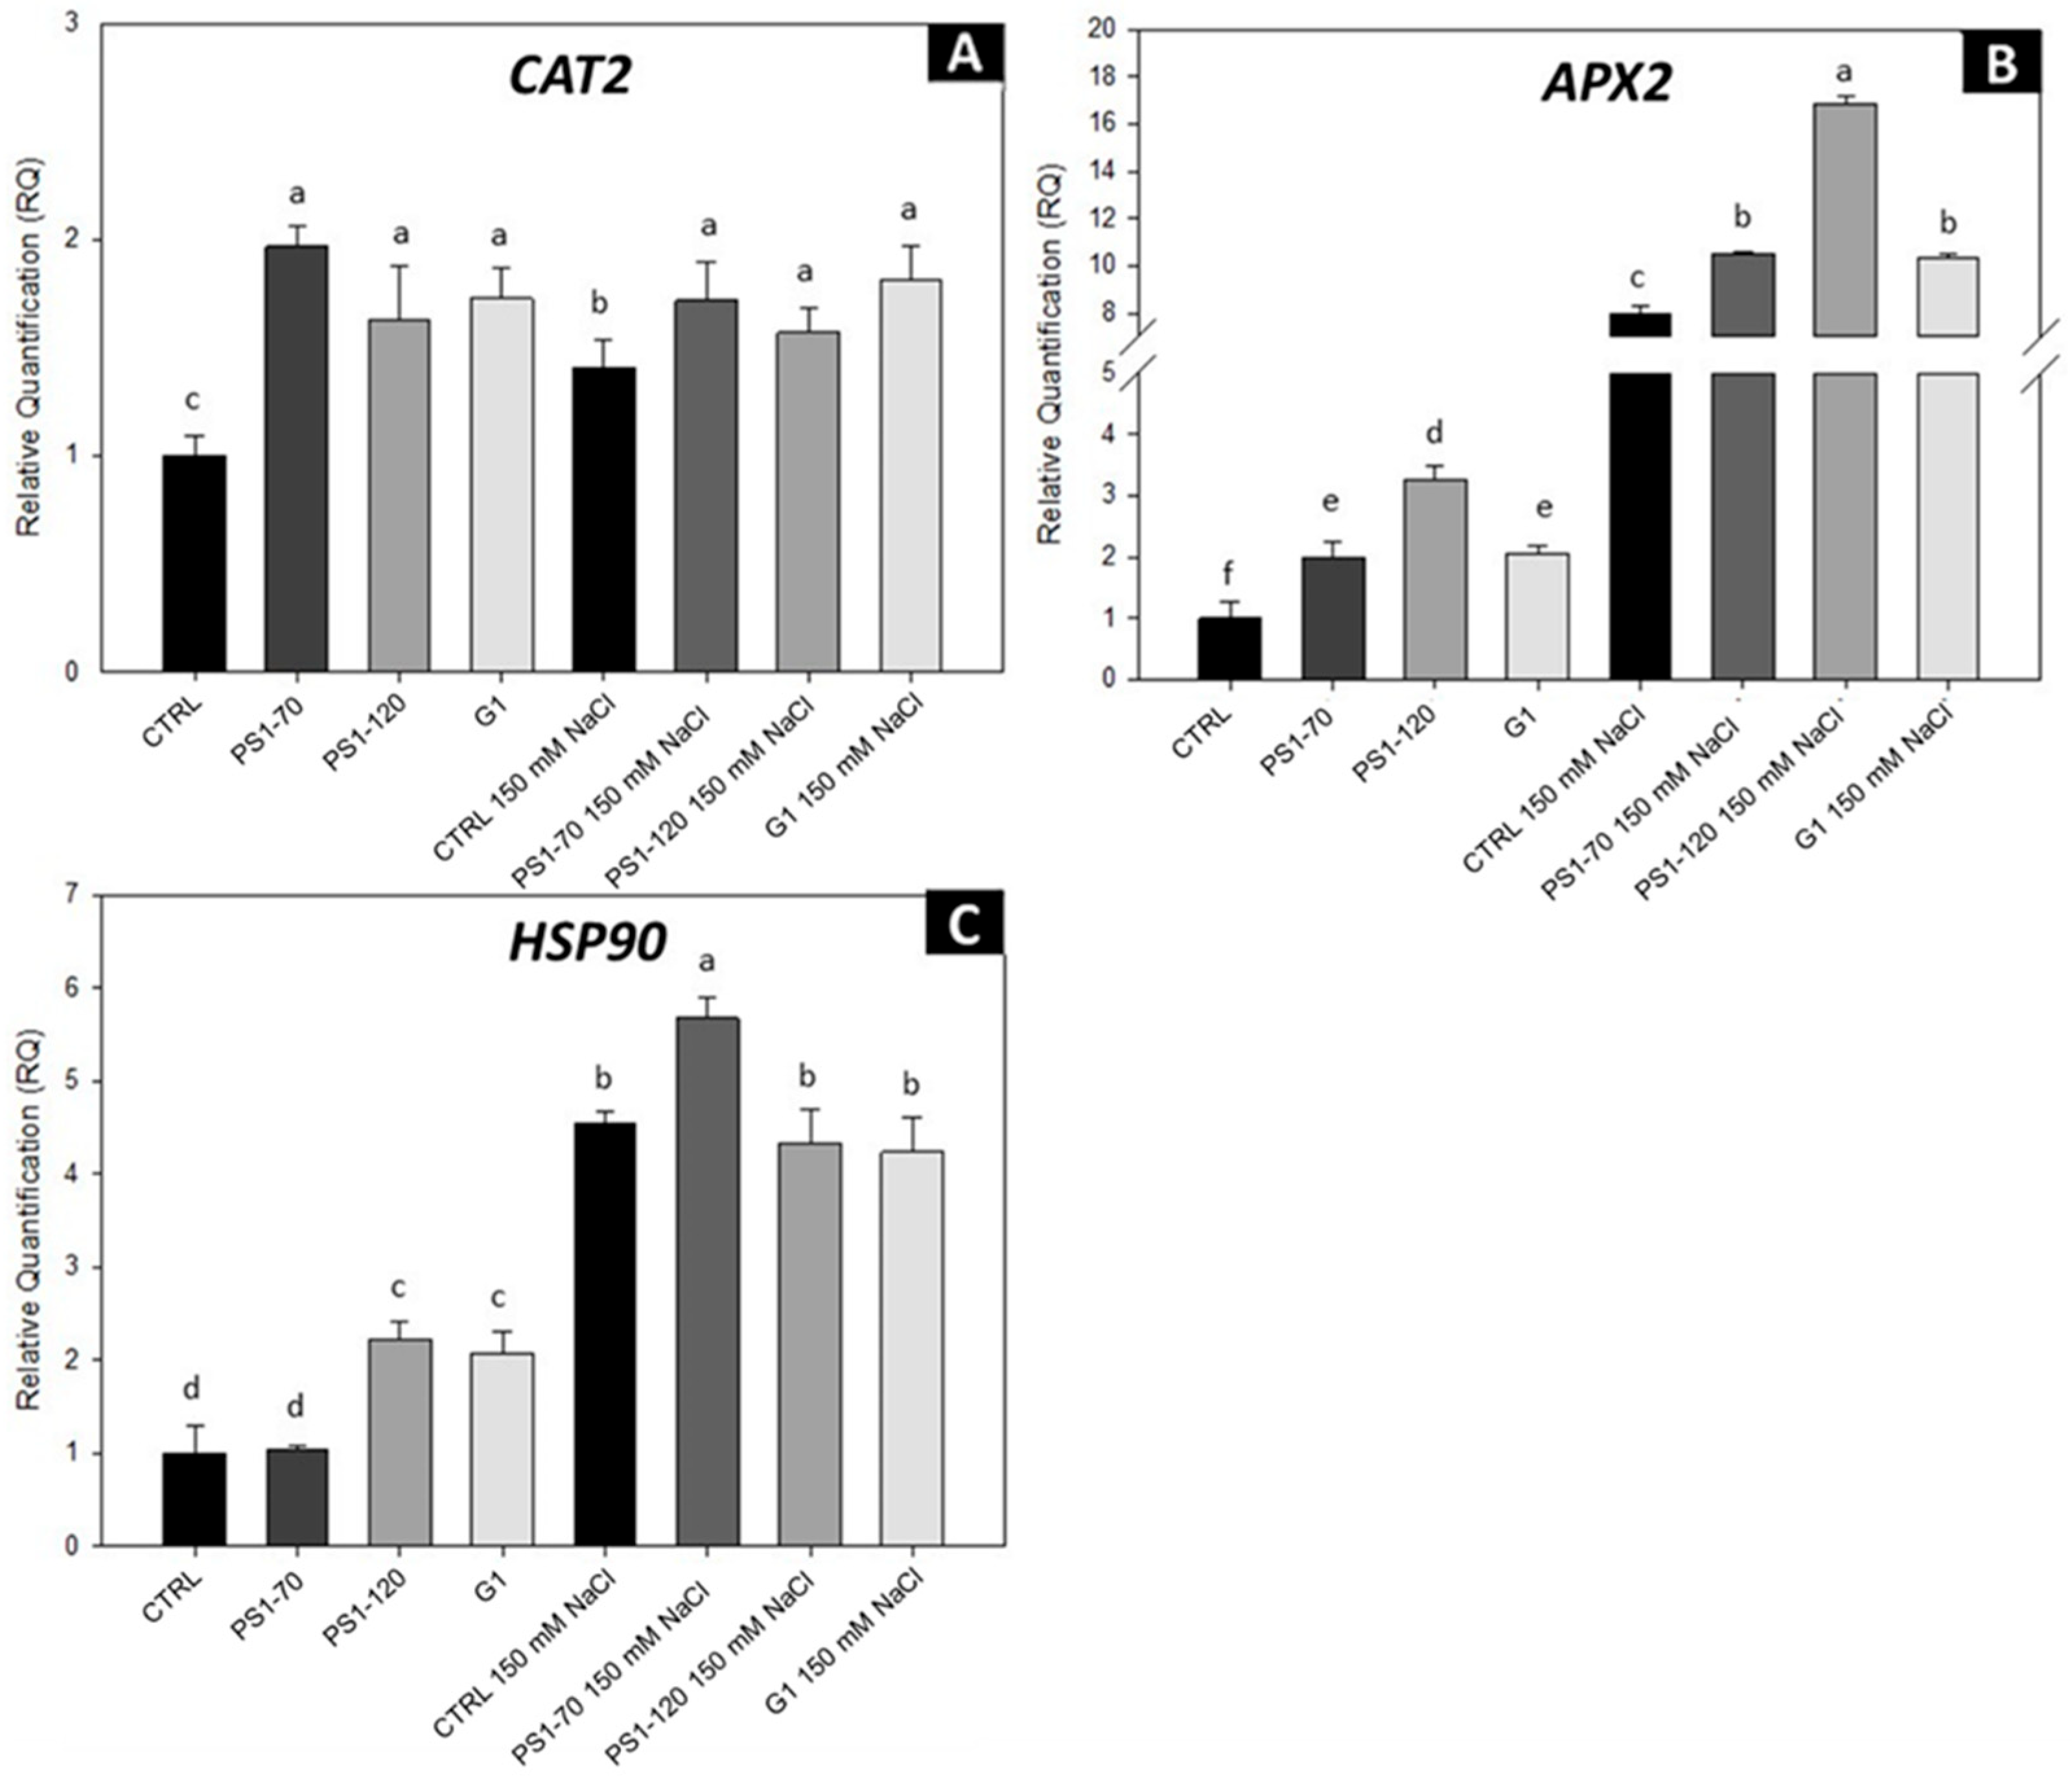
2.4. EFs Modulate the Antioxidant Response of the Plant
2.5. EFs Exhibit Biostimulant Effects on Tomato Plants in Open-Field Experiments
3. Discussion
4. Materials and Methods
4.1. Laboratory Experiments
4.1.1. Plant Material, Growth Conditions and Plant Treatments
4.1.2. PS1-70, PS1-120, G1 and Production
4.1.3. Proline Quantification
4.1.4. Molecular Analysis
4.1.5. Biometric Analysis
4.2. Open-Field Trials
4.2.1. Experimental Setup and Growth Conditions
4.2.2. Experimental Design and Plant Treatments
4.2.3. Plant Harvesting and Quality Analysis
4.3. Statistical Analysis
5. Conclusions
6. Patents
Supplementary Materials
Author Contributions
Funding
Data Availability Statement
Acknowledgments
Conflicts of Interest
Abbreviations
| APX | Ascorbate peroxidase |
| CAT2 | Catalase |
| CDPKs | Calcium-dependent protein kinase |
| CMs | Calmodulins |
| CV | Coefficient of variation |
| EFs | Experimental fragments |
| FW | Fresh weight |
| GEP | Good experimental practice |
| GMP | Gross marketable production |
| HSP90 | Heat shock protein |
| JA | Jasmonic acid |
| LRR-RK | Leucine-rich repeat receptor kinase |
| ProSys | Prosystemin |
| RMs | Repeat motifs |
| ROS | Reactive oxygen species |
| SA | Stomatal area |
| SD | Stomatal density |
| SFW | Shoot fresh weight |
| Sys | Systemin |
| VOCs | Volatile organic compounds |
References
- Chagas, F.O.; Pessotti, R.D.C.; Caraballo-Rodríguez, A.M.; Pupo, M.T. Chemical signaling involved in plant–microbe interactions. Chem. Soc. Rev. 2018, 47, 1652–1704. [Google Scholar] [CrossRef]
- Gust, A.A.; Pruitt, R.; Nürnberger, T. Sensing danger: Key to activating plant immunity. Trends Plant Sci. 2017, 22, 779–791. [Google Scholar] [CrossRef]
- Wang, P.; Wu, T.; Cheng, Y.; Gao, Y.; Huang, B.; Li, Z. The phytocytokine systemin enhances postharvest tomato fruit resistance to Botrytis cinerea. Postharvest Biol. Technol. 2024, 210, 112738. [Google Scholar] [CrossRef]
- Ryan, C.A.; Pearce, G. Systemin: A polypeptide signal for plant defensive genes. Annu. Rev. Cell Dev. Biol. 1998, 14, 1–17. [Google Scholar] [CrossRef]
- Pearce, G.; Strydom, D.; Johnson, S.; Ryan, C.A. A polypeptide from tomato leaves induces wound-inducible proteinase inhibitor proteins. Science 1991, 253, 895–897. [Google Scholar] [CrossRef]
- Wang, L.; Einig, E.; Almeida-Trapp, M.; Albert, M.; Fliegmann, J.; Mithöfer, A.; Kalbacher, H.; Felix, G. The systemin receptor SYR1 enhances resistance of tomato against herbivorous insects. Nat. Plants 2018, 4, 152–156. [Google Scholar] [CrossRef]
- Zhang, H.; Zhang, H.; Lin, J. Systemin-mediated long-distance systemic defense responses. New Phytol. 2020, 226, 1573–1582. [Google Scholar] [CrossRef]
- Cirillo, V.; Molisso, D.; Aprile, A.M.; Maggio, A.; Rao, R. Systemin peptide application improves tomato salt stress tolerance and reveals common adaptation mechanisms to biotic and abiotic stress in plants. Environ. Exp. Bot. 2022, 199, 104865. [Google Scholar] [CrossRef]
- Orsini, F.; Cascone, P.; De Pascale, S.; Barbieri, G.; Corrado, G.; Rao, R.; Maggio, A. Systemin-dependent salinity tolerance in tomato: Evidence of specific convergence of abiotic and biotic stress responses. Physiol. Plant. 2010, 138, 10–21. [Google Scholar] [CrossRef]
- Molisso, D.; Coppola, M.; Buonanno, M.; Di Lelio, I.; Aprile, A.M.; Langella, E.; Rigano, M.M.; Francesca, S.; Chiaiese, P.; Palmieri, G.; et al. Not only systemin: Prosystemin harbors other active regions able to protect tomato plants. Front. Plant Sci. 2022, 13, 887674. [Google Scholar] [CrossRef]
- Castaldi, V.; Langella, E.; Buonanno, M.; Di Lelio, I.; Aprile, A.M.; Molisso, D.; Criscuolo, M.C.; D'Andrea, L.D.; Romanelli, A.; Amoresano, A.; et al. Intrinsically disordered Prosystemin discloses biologically active repeat motifs. Plant Sci. 2024, 340, 111969. [Google Scholar] [CrossRef]
- Chen, Y.L.; Fan, K.T.; Hung, S.C.; Chen, Y.R. The role of peptides cleaved from protein precursors in eliciting plant stress reactions. New Phytol. 2020, 225, 2267–2282. [Google Scholar] [CrossRef]
- Ren, G.; Zhang, Y.; Chen, Z.; Xue, X.; Fan, H. Research progress of small plant peptides on the regulation of plant growth, development, and abiotic stress. Int. J. Mol. Sci. 2024, 25, 4114. [Google Scholar] [CrossRef] [PubMed]
- Segonzac, C.; Monaghan, J. Modulation of plant innate immune signaling by small peptides. Curr. Opin. Plant Biol. 2019, 51, 22–28. [Google Scholar] [CrossRef]
- Aprile, A.M.; Coppola, M.; Turrà, D.; Vitale, S.; Cascone, P.; Diretto, G.; Fiore, A.; Castaldi, V.; Romanelli, A.; Avitabile, C.; et al. Combination of the Systemin peptide with the beneficial fungus Trichoderma afroharzianum T22 improves plant defense responses against pests and diseases. J. Plant Interact. 2022, 17, 569–579. [Google Scholar] [CrossRef]
- Wang, Y.H.; Irving, H.R. Developing a model of plant hormone interactions. Plant Signal. Behav. 2011, 6, 494–500. [Google Scholar] [CrossRef]
- Shabala, L.; Mackay, A.; Tian, Y.; Jacobsen, S.E.; Zhou, D.; Shabala, S. Oxidative stress protection and stomatal patterning as components of salinity tolerance mechanism in quinoa (Chenopodium quinoa). Physiol. Plant. 2012, 146, 26–38. [Google Scholar] [CrossRef] [PubMed]
- Ahmad, R.; Kim, Y.H.; Kim, M.D.; Kwon, S.Y.; Cho, K.; Lee, H.S.; Kwak, S.S. Simultaneous expression of choline oxidase, superoxide dismutase and ascorbate peroxidase in potato plant chloroplasts provides synergistically enhanced protection against various abiotic stresses. Physiol. Plant. 2010, 138, 520–533. [Google Scholar] [CrossRef]
- Wang, W.; Vinocur, B.; Shoseyov, O.; Altman, A. Role of plant heat-shock proteins and molecular chaperones in the abiotic stress response. Trends Plant Sci. 2004, 9, 244–252. [Google Scholar] [CrossRef]
- Soare, R.; Dinu, M.; Apahidean, A.I.; Soare, M. The evolution of some nutritional parameters of the tomato fruit during the harvesting stages. Hortic. Sci. 2019, 46, 132–137. [Google Scholar] [CrossRef]
- Isayenkov, S.V.; Maathuis, F.J.M. Plant salinity stress: Many unanswered questions remain. Front. Plant Sci. 2019, 10, 80. [Google Scholar] [CrossRef]
- Corwin, D.L. Climate change impacts on soil salinity in agricultural areas. Eur. J. Soil Sci. 2020, 72, 842–862. [Google Scholar] [CrossRef]
- Chaudhry, S.; Sidhu, G.P.S. Climate change regulated abiotic stress mechanisms in plants: A comprehensive review. Plant Cell Rep. 2022, 41, 1–31. [Google Scholar] [CrossRef]
- Garcia-Caparros, P.; Ciriello, M.; Rouphael, Y.; Giordano, M. The role of organic extracts and inorganic compounds as alleviators of drought stress in plants. Horticulturae 2025, 11, 91. [Google Scholar] [CrossRef]
- Yamaguchi, Y.; Huffaker, A.; Bryan, A.C.; Tax, F.E.; Ryan, C.A. PEPR2 is a second receptor for the Pep1 and Pep2 peptides and contributes to defense responses in Arabidopsis. Plant Cell 2010, 22, 508–522. [Google Scholar] [CrossRef]
- Liu, Z.; Wu, Y.; Yang, F.; Zhang, Y.; Chen, S.; Xie, Q.; Tian, X.; Zhou, J.M. BIK1 interacts with PEPRs to mediate ethylene-induced immunity. Proc. Natl. Acad. Sci. USA 2013, 110, 6205–6210. [Google Scholar] [CrossRef]
- Shen, W.; Liu, J.; Li, J.F. Type-II metacaspases mediate the processing of plant elicitor peptides in Arabidopsis. Mol. Plant 2019, 12, 1524–1533. [Google Scholar] [CrossRef]
- Nakaminami, K.; Okamoto, M.; Higuchi-Takeuchi, M.; Yoshizumi, T.; Yamaguchi, Y.; Fukao, Y.; Shimizu, M.; Ohashi, C.; Tanaka, M.; Matsui, M.; et al. AtPep3 is a hormone-like peptide that plays a role in the salinity stress tolerance of plants. Proc. Natl. Acad. Sci. USA 2018, 115, 5810–5815. [Google Scholar] [CrossRef]
- Huffaker, A.; Pearce, G.; Ryan, C.A. An endogenous peptide signal in Arabidopsis activates components of the innate immune response. Proc. Natl. Acad. Sci. USA 2006, 103, 10098–10103. [Google Scholar] [CrossRef]
- Natale, R.; Coppola, M.; D’Agostino, N.; Zhang, Y.; Fernie, A.R.; Castaldi, V.; Rao, R. In silico and in vitro approaches allow the identification of the prosystemin molecular network. Comput. Struct. Biotechnol. J. 2023, 21, 212–223. [Google Scholar] [CrossRef]
- Buonanno, M.; Coppola, M.; Di Lelio, I.; Molisso, D.; Leone, M.; Pennacchio, F.; Langella, E.; Rao, R.; Monti, S.M. Prosystemin, a prohormone that modulates plant defense barriers, is an intrinsically disordered protein. Protein Sci. 2018, 27, 620–632. [Google Scholar] [CrossRef]
- Ludwig, A.A.; Romeis, T.; Jones, J.D. CDPK-mediated signalling pathways: Specificity and cross-talk. J. Exp. Bot. 2004, 55, 181–188. [Google Scholar] [CrossRef] [PubMed]
- Fujita, M.; Fujita, Y.; Noutoshi, Y.; Takahashi, F.; Narusaka, Y.; Yamaguchi-Shinozaki, K.; Shinozaki, K. Crosstalk between abiotic and biotic stress responses: A current view from the points of convergence in the stress signaling networks. Curr. Opin. Plant Biol. 2006, 9, 436–442. [Google Scholar] [CrossRef] [PubMed]
- Jogawat, L.A.; Yadav, B.; Chhaya Lakra, N.; Singh, A.K.; Narayan, O.P. Crosstalk between phytohormones and secondary metabolites in the drought stress tolerance of crop plants: A review. Physiol. Plant. 2021, 172, 1106–1132. [Google Scholar] [CrossRef]
- Dombrowski, J.E. Salt stress activation of wound-related genes in tomato plants. Plant Physiol. 2003, 132, 2098–2107. [Google Scholar] [CrossRef]
- Capiati, D.A.; País, S.M.; Téllez-Iñón, M.T. Wounding increases salt tolerance in tomato plants: Evidence on the participation of calmodulin-like activities in cross-tolerance signalling. J. Exp. Bot. 2006, 57, 2391–2400. [Google Scholar] [CrossRef]
- Umeno, A.; Biju, V.; Yoshida, Y. In vivo ROS production and use of oxidative stress-derived biomarkers to detect the onset of diseases such as Alzheimer’s disease, Parkinson’s disease, and diabetes. Free Radic. Res. 2017, 51, 413–427. [Google Scholar] [CrossRef]
- Zhang, T.; Sun, K.; Chang, X.; Ouyang, Z.; Meng, G.; Han, Y.; Shen, S.; Yao, Q.; Piao, F.; Wang, Y. Comparative physiological and transcriptomic analyses of two contrasting pepper genotypes under salt stress reveal complex salt tolerance mechanisms in seedlings. Int. J. Mol. Sci. 2022, 23, 9701. [Google Scholar] [CrossRef] [PubMed]
- Yadav, P.K.; Gupta, N.; Verma, V.; Gupta, A.K. Overexpression of SlHSP90.2 leads to altered root biomass and architecture in tomato (Solanum lycopersicum). Physiol. Mol. Biol. Plants 2021, 27, 713–725. [Google Scholar] [CrossRef]
- Liu, D.; Zhang, X.; Cheng, Y.; Takano, T.; Liu, S. rHsp90 gene expression in response to several environmental stresses in rice (Oryza sativa L.). Plant Physiol. Biochem. 2006, 44, 380–386. [Google Scholar] [CrossRef]
- Prakash, M.; Ramachandran, K. Effects of chemical ameliorants on stomatal frequency and water relations in brinjal (Solanum melongena L.) under moisture stress conditions. J. Agron. Crop Sci. 2000, 185, 237–239. [Google Scholar] [CrossRef]
- Hasanuzzaman, M.; Zhou, M.; Shabala, S. How does stomatal density and residual transpiration contribute to osmotic stress tolerance? Plants 2023, 12, 494. [Google Scholar] [CrossRef]
- Conti, V.; Mareri, L.; Faleri, C.; Nepi, M.; Romi, M.; Cai, G.; Cantini, C. Drought stress affects the response of Italian local tomato (Solanum lycopersicum L.) varieties in a genotype-dependent manner. Plants 2019, 8, 336. [Google Scholar] [CrossRef]
- Parihar, P.; Singh, S.; Singh, R.; Singh, V.P.; Prasad, S.M. Effect of salinity stress on plants and its tolerance strategies: A review. Environ. Sci. Pollut. Res. 2015, 22, 4056–4075. [Google Scholar] [CrossRef]
- Barbieri, G.; Vallone, S.; Orsini, F.; Paradiso, R.; De Pascale, S.; Negre-Zakharov, F.; Maggio, A. Stomatal density and metabolic determinants mediate salt stress adaptation and water use efficiency in basil (Ocimumbasilicum L.). Plant Physiol. 2012, 169, 1737–1746. [Google Scholar] [CrossRef]
- Campobenedetto, C.; Mannino, G.; Beekwilder, J.; Contartese, V.; Karlova, R.; Bertea, C.M. The application of a biostimulant based on tannins affects root architecture and improves tolerance to salinity in tomato plants. Sci. Rep. 2021, 11, 354. [Google Scholar] [CrossRef] [PubMed]
- Goñi, O.; Quille, P.; O’Connell, S. Ascophyllum nodosum extract biostimulants and their role in enhancing tolerance to drought stress in tomato plants. Plant Physiol. Biochem. 2018, 126, 63–73. [Google Scholar] [CrossRef] [PubMed]
- Hasanuzzaman, M.; Shabala, L.; Zhou, M.; Brodribb, T.J.; Corkrey, R.; Shabala, S. Factors determining stomatal and non-stomatal (residual) transpiration and their contribution towards salinity tolerance in contrasting barley genotypes. Environ. Exp. Bot. 2018, 153, 10–20. [Google Scholar] [CrossRef]
- Fu, Y.; Ma, H.; Chen, S.; Gu, T.; Gong, J. Control of proline accumulation under drought via a novel pathway comprising the histone methylase CAU1 and the transcription factor ANAC055. J. Exp. Bot. 2018, 69, 579–588. [Google Scholar] [CrossRef] [PubMed]
- Arif, Y.; Singh, P.; Siddiqui, H.; Bajguz, A.; Hayat, S. Study on the Growth and Physiological Responses of Helianthus tuberosus L. under Salt Stress with Exogenous Silicon. Plant Physiol. Biochem. 2020, 156, 64–77. [Google Scholar] [CrossRef]
- Acosta-Motos, J.R.; Ortuño, M.F.; Bernal-Vicente, A.; Diaz-Vivancos, P.; Sanchez-Blanco, M.J.; Hernandez, J.A. Plant responses to salt stress: Adaptive mechanisms. Agronomy 2017, 7, 18. [Google Scholar] [CrossRef]
- Thakur, R.; Srivastava, S.; Yadav, S. Multitrait Pseudomonas sp. isolated from the rhizosphere of Bergenia ciliata acts as a growth-promoting bioinoculant for plants. Front. Sustain. Food Syst. 2023, 7, 1097587. [Google Scholar] [CrossRef]
- Rouphael, Y.; Carillo, P.; Garcia-Perez, P.; Cardarelli, M.; Senizza, B.; Miras-Moreno, B.; Colla, G.; Lucini, L. Plant biostimulants from seaweeds or vegetal proteins enhance the salinity tolerance in greenhouse lettuce by modulating plant metabolism in a distinctive manner. Sci. Hortic. 2022, 305, 111368. [Google Scholar] [CrossRef]
- Di Mola, I.; Conti, S.; Cozzolino, E.; Melchionna, G.; Ottaiano, L.; Testa, A.; Sabatino, L.; Rouphael, Y.; Mori, M. Plant-based protein hydrolysate improves salinity tolerance in hemp: Agronomical and physiological aspects. Agronomy 2021, 11, 342. [Google Scholar] [CrossRef]
- Zuzunaga-Rosas, J.; Calone, R.; Mircea, D.M.; Shakya, R.; Ibáñez-Asensio, S.; Boscaiu, M.; Fita, A.; Moreno-Ramón, H.; Vicente, O. Mitigation of salt stress in lettuce by a biostimulant that protects the root absorption zone and improves biochemical responses. Front. Plant Sci. 2024, 15, 1341714. [Google Scholar] [CrossRef]
- Hillel, D. Introduction to Soil Physics; Elsevier Academic Press: San Diego, CA, USA, 2004. [Google Scholar]
- Boutahiri, S.; Benrkia, R.; Tembeni, B.; Idowu, O.E.; Olatunji, O.J. Effect of biostimulants on the chemical profile of food crops under normal and abiotic stress conditions. Curr. Plant Biol. 2024, 40, 100410. [Google Scholar] [CrossRef]
- Colla, G.; Hoagland, L.; Ruzzi, M.; Cardarelli, M.; Bonini, P.; Canaguier, R.; Rouphael, Y. Biostimulant action of protein hydrolysates: Unraveling their effects on plant physiology and microbiome. Front. Plant Sci. 2017, 8, 2202. [Google Scholar] [CrossRef]
- Takahashi, F.; Suzuki, T.; Osakabe, Y.; Betsuyaku, S.; Kondo, Y.; Dohmae, N.; Fukuda, H.; Yamaguchi-Shinozaki, K.; Shinozaki, K. A small peptide modulates stomatal control via abscisic acid in long-distance signalling. Nature 2018, 556, 235–238. [Google Scholar] [CrossRef]
- Chien, P.S.; Nam, H.G.; Chen, Y.R. A salt-regulated peptide derived from the CAP superfamily protein negatively regulates salt-stress tolerance in Arabidopsis. J. Exp. Bot. 2015, 66, 5301–5313. [Google Scholar] [CrossRef] [PubMed]
- Gandullo, J.; Ahmad, S.; Darwish, E.; Karlova, R.; Testerink, C. Phenotyping tomato root developmental plasticity in response to salinity in soil rhizotrons. Plant Phenomics 2021, 2021, 2760532. [Google Scholar] [CrossRef] [PubMed]
- Langella, E.; Buonanno, M.; Vullo, D.; Dathan, N.; Leone, M.; Supuran, C.T.; De Simone, G.; Monti, S.M. Biochemical, biophysical and molecular dynamics studies on the proteoglycan-like domain of carbonic anhydrase IX. Cell. Mol. Life Sci. 2018, 75, 3283–3296. [Google Scholar] [CrossRef] [PubMed]
- Claussen, W. Proline as a measure of stress in tomato plants. Plant Sci. 2005, 168, 241–248. [Google Scholar] [CrossRef]
- Corrado, G.; Sasso, R.; Pasquariello, M.; Iodice, L.; Carretta, A.; Cascone, P.; Ariati, L.; Digilio, M.C.; Guerrieri, E.; Rao, R. Systemin regulates both systemic and volatile signaling in tomato plants. J. Chem. Ecol. 2007, 33, 669–681. [Google Scholar] [CrossRef] [PubMed]
- Cirillo, V.; De Pascale, S.; De Micco, V.; Arena, C. Leaf morpho-anatomical traits in Vigna radiata L. affect plant photosynthetic acclimation to changing vapor pressure deficit. Environ. Exp. Bot. 2021, 186, 104453. [Google Scholar] [CrossRef]


| Treatment | SFW (g) | Root Area (cm2) |
|---|---|---|
| Salt (S) | ||
| 0 mM NaCl | 28.4 a | 102.1 a |
| 150 mM NaCl | 21.4 b | 82.8 b |
| EFs | ||
| Control | 23.6 b | 86.7 a |
| PS1-70 | 25.8 a | 92.1 a |
| PS1-120 | 24.3 ab | 95.8 a |
| G1 | 25.7 a | 93.5 a |
| Interaction | ||
| S | *** | *** |
| EFs | * | ns |
| S × EFs | ns | *** |
| Trial | Treatments | GMP (EUR/ha) |
|---|---|---|
| Lagosanto (Ferrara, 2024) | Farm line | 9310.0 d |
| PS1-70 | 14,396.7 bc | |
| G1 | 15,843.3 abc |
| Temperature °C | Relative Humidity % | mm/m2 | Minute | m/s | ||||||||
|---|---|---|---|---|---|---|---|---|---|---|---|---|
| S | M | Y | Date | TMx | TAv | TMn | RH Mx | RH Av | RH Mn | Rainfall | Leaf Wetness | Wind |
| 21 | 5 | 2023 | 23 May 2023 | 29.6 | 21.1 | 12.2 | 100 | 77 | 39 | 0.0 | 540 | 1.1 |
| 21 | 5 | 2023 | 24 May 2023 | 27.3 | 19.7 | 13.3 | 100 | 87 | 51 | 0.0 | 480 | 1.2 |
| 21 | 5 | 2023 | 25 May 2023 | 25.8 | 19.9 | 16.0 | 100 | 93 | 68 | 0.0 | 480 | 1.5 |
| 22 | 5 | 2023 | 26 May 2023 | 29.4 | 21.2 | 12.1 | 100 | 78 | 42 | 0.0 | 540 | 1.4 |
| 22 | 5 | 2023 | 27 May 2023 | 27.4 | 21.0 | 15.8 | 100 | 81 | 45 | 6.0 | 540 | 1.3 |
| 22 | 5 | 2023 | 28 May 2023 | 27.8 | 20.9 | 12.2 | 100 | 73 | 41 | 0.0 | 420 | 1.9 |
| 22 | 5 | 2023 | 29 May 2023 | 28.3 | 20.5 | 12.4 | 100 | 76 | 39 | 0.0 | 600 | 1.3 |
| 22 | 5 | 2023 | 30 May 2023 | 27.8 | 21.0 | 14.2 | 100 | 73 | 41 | 0.0 | 360 | 1.2 |
| 22 | 5 | 2023 | 31 May 2023 | 26.8 | 20.8 | 14.7 | 100 | 74 | 42 | 0.0 | 300 | 1.9 |
| 22 | 6 | 2023 | 1 June 2023 | 27.9 | 20.6 | 12.7 | 100 | 75 | 43 | 0.0 | 420 | 1.8 |
| 23 | 6 | 2023 | 2 June 2023 | 29.8 | 21.8 | 14.2 | 100 | 73 | 36 | 0.0 | 180 | 0.9 |
| 23 | 6 | 2023 | 3 June 2023 | 27.8 | 19.3 | 14.8 | 100 | 90 | 52 | 7.6 | 420 | 0.9 |
| 23 | 6 | 2023 | 4 June 2023 | 26.3 | 19.3 | 13.7 | 100 | 93 | 56 | 6.4 | 840 | 1.5 |
| 23 | 6 | 2023 | 5 June 2023 | 21.1 | 17.9 | 16.7 | 100 | 100 | 99 | 21.2 | 1020 | 1.4 |
| 23 | 6 | 2023 | 6 June 2023 | 27.0 | 20.5 | 16.5 | 100 | 90 | 53 | 0.0 | 600 | 1.1 |
| 23 | 6 | 2023 | 7 June 2023 | 26.5 | 20.1 | 14.4 | 100 | 95 | 65 | 1.2 | 720 | 1.3 |
| 23 | 6 | 2023 | 8 June 2023 | 28.6 | 21.0 | 13.9 | 100 | 83 | 39 | 0.0 | 600 | 1 |
| 24 | 6 | 2023 | 9 June 2023 | 29.6 | 22.2 | 14.7 | 100 | 80 | 43 | 0.0 | 840 | 1.1 |
| 24 | 6 | 2023 | 10 June 2023 | 24.8 | 21.5 | 18.3 | 100 | 97 | 76 | 4.2 | 720 | 0.8 |
| 24 | 6 | 2023 | 11 June 2023 | 28.9 | 22.3 | 15.1 | 100 | 82 | 48 | 0.0 | 540 | 1.5 |
| 24 | 6 | 2023 | 12 June 2023 | 28.4 | 23.2 | 17.4 | 100 | 78 | 45 | 0.0 | 360 | 1.4 |
| 24 | 6 | 2023 | 13 June 2023 | 26.2 | 20.1 | 15.8 | 100 | 93 | 57 | 0.0 | 660 | 2 |
| 24 | 6 | 2023 | 14 June 2023 | 26.5 | 20.2 | 14.6 | 100 | 88 | 55 | 0.6 | 660 | 2.3 |
| 24 | 6 | 2023 | 15 June 2023 | 28.1 | 21.5 | 14.5 | 100 | 75 | 39 | 0.0 | 540 | 1.6 |
| 25 | 6 | 2023 | 16 June 2023 | 28.9 | 22.0 | 14.0 | 100 | 75 | 38 | 0.0 | 420 | 1.4 |
| 25 | 6 | 2023 | 17 June 2023 | 30.4 | 22.6 | 14.0 | 100 | 72 | 21 | 7.6 | 420 | 1.5 |
| 25 | 6 | 2023 | 18 June 2023 | 31.1 | 23.1 | 13.9 | 100 | 75 | 38 | 0.0 | 600 | 1.1 |
| 25 | 6 | 2023 | 19 June 2023 | 32.1 | 24.6 | 17.0 | 100 | 69 | 36 | 0.0 | 60 | 0.8 |
| 25 | 6 | 2023 | 20 June 2023 | 32.2 | 25.0 | 16.8 | 100 | 60 | 35 | 0.0 | 0 | 0.9 |
| 25 | 6 | 2023 | 21 June 2023 | 33.1 | 25.7 | 17.9 | 100 | 72 | 39 | 0.0 | 60 | 1 |
| 25 | 6 | 2023 | 22 June 2023 | 35.0 | 27.4 | 20.2 | 100 | 74 | 39 | 0.0 | 180 | 1 |
| 26 | 6 | 2023 | 23 June 2023 | 31.1 | 24.8 | 19.0 | 100 | 77 | 51 | 0.0 | 120 | 1.2 |
| 26 | 6 | 2023 | 24 June 2023 | 30.7 | 24.4 | 15.8 | 100 | 70 | 33 | 0.0 | 480 | 1.6 |
| 26 | 6 | 2023 | 25 June 2023 | 30.7 | 23.8 | 15.3 | 100 | 66 | 32 | 0.0 | 420 | 1.7 |
| 26 | 6 | 2023 | 26 June 2023 | 34.0 | 25.1 | 14.6 | 100 | 65 | 28 | 0.0 | 360 | 1.7 |
| 26 | 6 | 2023 | 27 June 2023 | 34.9 | 26.5 | 17.4 | 100 | 71 | 38 | 8.4 | 480 | 1.8 |
| 26 | 6 | 2023 | 28 June 2023 | 26.9 | 22.7 | 19.9 | 100 | 92 | 66 | 0.0 | 240 | 1.3 |
| 26 | 6 | 2023 | 29 June 2023 | 30.2 | 24.4 | 16.9 | 100 | 66 | 33 | 0.0 | 60 | 2.7 |
| 27 | 6 | 2023 | 30 June 2023 | 25.4 | 21.5 | 18.7 | 100 | 89 | 58 | 1.2 | 360 | 2.8 |
| 27 | 7 | 2023 | 1 July 2023 | 28.0 | 22.1 | 17.4 | 100 | 85 | 53 | 0.0 | 420 | 1.7 |
| 27 | 7 | 2023 | 2 July 2023 | 32.6 | 25.0 | 16.5 | 100 | 75 | 41 | 0.0 | 420 | 1.2 |
| 27 | 7 | 2023 | 3 July 2023 | 32.7 | 24.2 | 18.5 | 100 | 84 | 44 | 29.4 | 480 | 1.6 |
| 27 | 7 | 2023 | 4 July 2023 | 30.3 | 23.9 | 17.0 | 100 | 79 | 44 | 1.0 | 240 | 1.6 |
| 27 | 7 | 2023 | 5 July 2023 | 31.0 | 24.4 | 17.1 | 100 | 79 | 48 | 0.0 | 900 | 2.6 |
| 27 | 7 | 2023 | 6 July 2023 | 26.3 | 22.5 | 17.5 | 100 | 90 | 66 | 0.0 | 1140 | 1 |
| 28 | 7 | 2023 | 7 July 2023 | 30.8 | 23.8 | 15.8 | 100 | 75 | 42 | 0.0 | 900 | 2.1 |
| 28 | 7 | 2023 | 8 July 2023 | 32.3 | 24.8 | 14.9 | 100 | 68 | 34 | 0.0 | 660 | 1.7 |
| 28 | 7 | 2023 | 9 July 2023 | 34.4 | 27.1 | 18.2 | 100 | 69 | 36 | 0.0 | 540 | 2.3 |
| 28 | 7 | 2023 | 10 July 2023 | 36.6 | 28.6 | 20.2 | 100 | 71 | 37 | 0.0 | 480 | 1.1 |
| 28 | 7 | 2023 | 11 July 2023 | 36.5 | 29.4 | 21.3 | 100 | 67 | 38 | 0.0 | 360 | 1.5 |
| 28 | 7 | 2023 | 12 July 2023 | 34.8 | 28.3 | 22.2 | 100 | 78 | 50 | 0.0 | 1140 | 1 |
| 28 | 7 | 2023 | 13 July 2023 | 30.3 | 25.8 | 23.0 | 100 | 92 | 68 | 0.0 | 1020 | 2 |
| 29 | 7 | 2023 | 14 July 2023 | 32.7 | 26.8 | 21.7 | 100 | 82 | 51 | 0.0 | 600 | 1.5 |
| 29 | 7 | 2023 | 15 July 2023 | 34.6 | 27.3 | 19.5 | 100 | 72 | 38 | 0.0 | 420 | 2.1 |
| 29 | 7 | 2023 | 16 July 2023 | 36.8 | 28.6 | 19.5 | 100 | 69 | 33 | 0.0 | 420 | 1.5 |
| 29 | 7 | 2023 | 17 July 2023 | 36.2 | 28.7 | 19.2 | 100 | 64 | 37 | 0.0 | 180 | 1 |
| 29 | 7 | 2023 | 18 July 2023 | 36.8 | 28.8 | 20.0 | 100 | 75 | 45 | 0.0 | 360 | 0.9 |
| 29 | 7 | 2023 | 19 July 2023 | 36.5 | 29.3 | 22.4 | 100 | 79 | 41 | 0.0 | 360 | 1.8 |
| 29 | 7 | 2023 | 20 July 2023 | 33.7 | 27.1 | 19.5 | 100 | 78 | 49 | 0.0 | 300 | 1.8 |
| 30 | 7 | 2023 | 21 July 2023 | 32.9 | 25.9 | 18.7 | 100 | 82 | 42 | 0.0 | 480 | 1.9 |
| 30 | 7 | 2023 | 22 July 2023 | 31.7 | 24.9 | 20.3 | 100 | 92 | 55 | 6.0 | 660 | 2.3 |
| 30 | 7 | 2023 | 23 July 2023 | 33.5 | 25.2 | 16.6 | 100 | 81 | 43 | 0.0 | 540 | 1.6 |
| 30 | 7 | 2023 | 24 July 2023 | 32.8 | 24.9 | 17.0 | 100 | 87 | 46 | 0.0 | 420 | 1.2 |
| 30 | 7 | 2023 | 25 July 2023 | 31.3 | 24.9 | 20.0 | 100 | 79 | 25 | 0.0 | 60 | 2.2 |
| 30 | 7 | 2023 | 26 July 2023 | 30.0 | 23.1 | 16.6 | 100 | 72 | 37 | 0.6 | 240 | 2.2 |
| 30 | 7 | 2023 | 27 July 2023 | 30.5 | 22.9 | 14.6 | 100 | 74 | 34 | 0.0 | 300 | 1.8 |
| 31 | 7 | 2023 | 28 July 2023 | 31.0 | 23.3 | 15.5 | 100 | 72 | 38 | 0.0 | 120 | 2.4 |
| 31 | 7 | 2023 | 29 July 2023 | 33.6 | 25.9 | 17.0 | 100 | 72 | 42 | 0.0 | 240 | 0.9 |
| 31 | 7 | 2023 | 30 July 2023 | 33.2 | 27.1 | 20.3 | 100 | 70 | 43 | 0.0 | 960 | 1.2 |
| 31 | 7 | 2023 | 31 July 2023 | 32.9 | 26.2 | 19.7 | 100 | 79 | 45 | 0.0 | 960 | 1.5 |
| 31 | 8 | 2023 | 1 August 2023 | 33.1 | 25.3 | 18.6 | 100 | 72 | 34 | 0.0 | 960 | 1.6 |
| 31 | 8 | 2023 | 2 August 2023 | 33.7 | 25.2 | 16.3 | 100 | 70 | 39 | 0.0 | 1080 | 1.6 |
| 31 | 8 | 2023 | 3 August 2023 | 34.5 | 27.1 | 19.1 | 100 | 64 | 40 | 0.0 | 1020 | 2 |
| 32 | 8 | 2023 | 4 August 2023 | 26.5 | 23.2 | 17.8 | 100 | 66 | 39 | 0.8 | 1080 | 1.7 |
| 32 | 8 | 2023 | 5 August 2023 | 22.4 | 18.4 | 16.1 | 100 | 98 | 74 | 13.8 | 1080 | 1.9 |
| 32 | 8 | 2023 | 6 August 2023 | 30.4 | 22.0 | 14.1 | 100 | 66 | 20 | 0.0 | 420 | 2.6 |
| 32 | 8 | 2023 | 7 August 2023 | 28.3 | 20.4 | 13.7 | 100 | 64 | 23 | 0.0 | 480 | 2.5 |
| 32 | 8 | 2023 | 8 August 2023 | 30.0 | 20.7 | 10.7 | 100 | 58 | 22 | 0.0 | 60 | 2.2 |
| 32 | 8 | 2023 | 9 August 2023 | 31.0 | 22.6 | 14.7 | 83 | 58 | 28 | 0.0 | 420 | 1.2 |
| 32 | 8 | 2023 | 10 August 2023 | 31.0 | 23.7 | 15.3 | 100 | 73 | 41 | 0.0 | 540 | 1.6 |
| 33 | 8 | 2023 | 11 August 2023 | 31.8 | 25.0 | 16.7 | 100 | 68 | 42 | 0.0 | 480 | 1.9 |
| 33 | 8 | 2023 | 12 August 2023 | 33.1 | 25.1 | 15.8 | 100 | 70 | 39 | 0.0 | 480 | 1.9 |
| 33 | 8 | 2023 | 13 August 2023 | 33.4 | 26.5 | 18.1 | 100 | 71 | 45 | 0.0 | 420 | 1.9 |
| 33 | 8 | 2023 | 14 August 2023 | 34.1 | 26.3 | 16.5 | 100 | 70 | 33 | 0.0 | 480 | 1.4 |
| 33 | 8 | 2023 | 15 August 2023 | 34.2 | 26.3 | 17.3 | 100 | 70 | 38 | 0.0 | 420 | 1.8 |
| 33 | 8 | 2023 | 16 August 2023 | 34.1 | 27.0 | 18.6 | 100 | 70 | 37 | 0.0 | 480 | 1.3 |
| 33 | 8 | 2023 | 17 August 2023 | 33.1 | 26.1 | 18.9 | 100 | 78 | 44 | 0.0 | 600 | 1.3 |
| 34 | 8 | 2023 | 18 August 2023 | 34.2 | 26.9 | 18.6 | 100 | 72 | 41 | 0.0 | 420 | 1 |
| 34 | 8 | 2023 | 19 August 2023 | 35.3 | 27.7 | 19.3 | 100 | 70 | 38 | 0.0 | 420 | 1.3 |
| 34 | 8 | 2023 | 20 August 2023 | 35.0 | 27.4 | 19.1 | 100 | 70 | 38 | 0.0 | 420 | 1.1 |
| 34 | 8 | 2023 | 21 August 2023 | 35.5 | 28.1 | 20.8 | 100 | 65 | 36 | 0.0 | 240 | 1.3 |
| 34 | 8 | 2023 | 22 August 2023 | 36.6 | 28.2 | 19.3 | 100 | 66 | 31 | 0.0 | 420 | 1.2 |
| 34 | 8 | 2023 | 23 August 2023 | 37.9 | 28.8 | 18.9 | 100 | 62 | 26 | 0.0 | 420 | 1.4 |
| 34 | 8 | 2023 | 24 August 2023 | 38.8 | 29.2 | 18.9 | 100 | 59 | 23 | 0.0 | 360 | 1.3 |
| 35 | 8 | 2023 | 25 August 2023 | 38.5 | 29.7 | 20.6 | 96 | 56 | 30 | 0.0 | 420 | 1.8 |
| 35 | 8 | 2023 | 26 August 2023 | 37.2 | 27.7 | 18.6 | 100 | 57 | 27 | 0.0 | 180 | 1.1 |
| 35 | 8 | 2023 | 27 August 2023 | 30.4 | 25.2 | 20.0 | 100 | 69 | 47 | 0.0 | 240 | 1.2 |
| 35 | 8 | 2023 | 28 August 2023 | 28.9 | 23.0 | 17.6 | 100 | 80 | 43 | 1.0 | 720 | 1.9 |
| 35 | 8 | 2023 | 29 August 2023 | 20.0 | 17.5 | 15.5 | 100 | 100 | 100 | 10.8 | 1200 | 3.5 |
| 35 | 8 | 2023 | 30 August 2023 | 25.0 | 20.5 | 15.6 | 100 | 77 | 50 | 0.2 | 480 | 1.4 |
| 35 | 8 | 2023 | 31 August 2023 | 27.9 | 20.4 | 13.6 | 100 | 80 | 44 | 0.0 | 540 | 1.6 |
| 36 | 9 | 2023 | 1 September 2023 | 29.1 | 22.0 | 14.5 | 100 | 74 | 43 | 0.0 | 120 | 1.3 |
| 36 | 9 | 2023 | 2 September 2023 | 30.8 | 23.4 | 15.9 | 100 | 76 | 41 | 0.0 | 300 | 1.4 |
| 36 | 9 | 2023 | 3 September 2023 | 31.6 | 24.3 | 17.3 | 100 | 75 | 39 | 0.0 | 180 | 1.5 |
| 36 | 9 | 2023 | 4 September 2023 | 29.3 | 23.8 | 17.9 | 100 | 71 | 44 | 0.0 | 600 | 1.6 |
| 36 | 9 | 2023 | 5 September 2023 | 26.8 | 22.3 | 16.1 | 81 | 58 | 38 | 0.0 | 480 | 3.2 |
| 36 | 9 | 2023 | 6 September 2023 | 29.2 | 21.1 | 13.6 | 100 | 66 | 40 | 0.0 | 600 | 2.2 |
| 36 | 9 | 2023 | 7 September 2023 | 29.9 | 22.1 | 15.4 | 100 | 69 | 37 | 0.0 | 600 | 1.1 |
| 37 | 9 | 2023 | 8 September 2023 | 30.5 | 22.5 | 14.7 | 100 | 64 | 36 | 0.0 | 600 | 1.3 |
| 37 | 9 | 2023 | 9 September 2023 | 30.8 | 22.7 | 14.7 | 100 | 66 | 32 | 0.0 | 540 | 1.2 |
| 37 | 9 | 2023 | 10 September 2023 | 30.9 | 22.6 | 14.8 | 99 | 64 | 36 | 0.0 | 480 | 1.1 |
| 37 | 9 | 2023 | 11 September 2023 | 31.6 | 23.3 | 14.2 | 100 | 65 | 33 | 0.0 | 360 | 0.8 |
| 37 | 9 | 2023 | 12 September 2023 | 33.0 | 24.1 | 14.3 | 100 | 64 | 29 | 0.0 | 420 | 1.8 |
| 37 | 9 | 2023 | 13 September 2023 | 29.8 | 23.2 | 17.0 | 100 | 69 | 37 | 0.0 | 360 | 1.5 |
| 37 | 9 | 2023 | 14 September 2023 | 29.5 | 22.5 | 16.2 | 100 | 80 | 49 | 0.0 | 600 | 1.7 |
| 38 | 9 | 2023 | 15 September 2023 | 26.8 | 21.4 | 18.6 | 100 | 94 | 61 | 8.4 | 1020 | 1.5 |
| 38 | 9 | 2023 | 16 September 2023 | 26.6 | 20.7 | 15.9 | 100 | 99 | 87 | 0.6 | 780 | 1.4 |
| 38 | 9 | 2023 | 17 September 2023 | 28.5 | 22.7 | 18.4 | 100 | 92 | 60 | 0.2 | 720 | 1.5 |
| 38 | 9 | 2023 | 18 September 2023 | 26.3 | 22.2 | 18.5 | 100 | 97 | 77 | 0.0 | 480 | 1 |
| 38 | 9 | 2023 | 19 September 2023 | 29.7 | 22.7 | 16.2 | 100 | 87 | 54 | 3.4 | 420 | 1.4 |
| 38 | 9 | 2023 | 20 September 2023 | 25.2 | 20.2 | 15.1 | 100 | 94 | 73 | 0.0 | 240 | 1.1 |
| 38 | 9 | 2023 | 21 September 2023 | 27.8 | 22.0 | 17.4 | 100 | 84 | 51 | 0.4 | 480 | 1.5 |
| 39 | 9 | 2023 | 22 September 2023 | 25.0 | 21.6 | 17.2 | 100 | 88 | 52 | 0.0 | 60 | 1.5 |
| 39 | 9 | 2023 | 23 September 2023 | 26.4 | 19.6 | 12.8 | 100 | 75 | 39 | 10.2 | 420 | 2 |
| 39 | 9 | 2023 | 24 September 2023 | 24.0 | 17.5 | 12.5 | 100 | 81 | 43 | 0.2 | 480 | 1.7 |
| 39 | 9 | 2023 | 25 September 2023 | 25.7 | 17.7 | 10.5 | 100 | 82 | 42 | 0.0 | 480 | 1.9 |
| 39 | 9 | 2023 | 26 September 2023 | 26.8 | 19.0 | 12.4 | 100 | 85 | 52 | 0.0 | 60 | 1 |
| 39 | 9 | 2023 | 27 September 2023 | 27.9 | 19.8 | 13.6 | 100 | 82 | 41 | 0.0 | 360 | 1.3 |
| 39 | 9 | 2023 | 28 September 2023 | 28.1 | 19.6 | 12.4 | 100 | 77 | 39 | 0.0 | 240 | 1.3 |
| 40 | 9 | 2023 | 29 September 2023 | 28.4 | 19.6 | 12.6 | 100 | 75 | 37 | 0.0 | 420 | 1 |
| 40 | 9 | 2023 | 30 September 2023 | 28.5 | 19.8 | 12.1 | 100 | 72 | 32 | 0.0 | 240 | 0.8 |
| Temperature °C | Relative Humidity % | mm/m2 | Minute | m/s | ||||||||
|---|---|---|---|---|---|---|---|---|---|---|---|---|
| S | M | Y | Date | TMx | TAv | TMn | RH Mx | RH Av | RH Mn | Rainfall | Leaf Wetness | Wind |
| 18 | 5 | 2024 | 1 May 2024 | 17.8 | 14.6 | 11.8 | 100 | 96 | 0 | 10.8 | 1075 | 1.3 |
| 18 | 5 | 2024 | 2 May 2024 | 18.9 | 15.2 | 11.3 | 100 | 83 | 0 | 1.0 | 660 | 2.4 |
| 18 | 5 | 2024 | 3 May 2024 | 19.1 | 14.3 | 10.9 | 100 | 83 | 0 | 1.0 | 725 | 1.1 |
| 18 | 5 | 2024 | 4 May 2024 | 20.8 | 14.4 | 6.0 | 100 | 81 | 0 | 0.0 | 630 | 0.8 |
| 19 | 5 | 2024 | 5 May 2024 | 22.5 | 14.8 | 6.1 | 100 | 75 | 0 | 0.0 | 490 | 0.9 |
| 19 | 5 | 2024 | 6 May 2024 | 22.7 | 16.1 | 8.0 | 99 | 74 | 0 | 0.0 | 255 | 2 |
| 19 | 5 | 2024 | 7 May 2024 | 21.6 | 16.6 | 12.5 | 100 | 88 | 55 | 7.0 | 670 | 1.7 |
| 19 | 5 | 2024 | 8 May 2024 | 23.7 | 16.2 | 9.3 | 100 | 86 | 49 | 0.2 | 550 | 1.2 |
| 19 | 5 | 2024 | 9 May 2024 | 26.4 | 19.5 | 12.3 | 100 | 69 | 68 | 0.0 | 300 | 2.5 |
| 19 | 5 | 2024 | 10 May 2024 | 26.6 | 19.4 | 11.8 | 87 | 60 | 58 | 0.0 | 0 | 2.6 |
| 19 | 5 | 2024 | 11 May 2024 | 27.8 | 18.5 | 8.9 | 94 | 63 | 60 | 0.0 | 0 | 1.5 |
| 20 | 5 | 2024 | 12 May 2024 | 25.0 | 17.8 | 9.0 | 100 | 76 | 53 | 0.0 | 405 | 0.9 |
| 20 | 5 | 2024 | 13 May 2024 | 24.6 | 17.8 | 10.3 | 100 | 82 | 60 | 0.0 | 585 | 1.1 |
| 20 | 5 | 2024 | 14 May 2024 | 25.9 | 18.0 | 9.5 | 100 | 79 | 53 | 0.0 | 460 | 1 |
| 20 | 5 | 2024 | 15 May 2024 | 26.2 | 19.5 | 11.8 | 100 | 78 | 56 | 0.0 | 480 | 2.1 |
| 20 | 5 | 2024 | 16 May 2024 | 25.1 | 19.0 | 14.0 | 100 | 84 | 56 | 0.0 | 550 | 1.2 |
| 20 | 5 | 2024 | 17 May 2024 | 24.6 | 18.4 | 10.8 | 100 | 77 | 50 | 0.0 | 625 | 1.8 |
| 20 | 5 | 2024 | 18 May 2024 | 27.0 | 18.5 | 9.7 | 100 | 72 | 50 | 0.2 | 490 | 1.3 |
| 21 | 5 | 2024 | 19 May 2024 | 25.0 | 17.8 | 11.5 | 100 | 85 | 56 | 0.0 | 670 | 1.2 |
| 21 | 5 | 2024 | 20 May 2024 | 26.2 | 19.2 | 13.4 | 100 | 88 | 72 | 17.8 | 805 | 1.3 |
| 21 | 5 | 2024 | 21 May 2024 | 26.1 | 19.9 | 14.8 | 100 | 83 | 40 | 10.0 | 775 | 1.2 |
| 21 | 5 | 2024 | 22 May 2024 | 25.7 | 18.9 | 10.8 | 100 | 74 | 67 | 0.2 | 450 | 1.3 |
| 21 | 5 | 2024 | 23 May 2024 | 33.8 | 19.9 | 10.5 | 100 | 61 | 35 | 1.0 | 0 | 1.2 |
| 21 | 5 | 2024 | 24 May 2024 | 35.2 | 22.9 | 12.3 | 57 | 47 | 33 | 0.0 | 0 | 0.9 |
| 21 | 5 | 2024 | 25 May 2024 | 31.5 | 21.0 | 15.0 | 66 | 56 | 44 | 0.0 | 0 | 0.8 |
| 22 | 5 | 2024 | 26 May 2024 | 37.7 | 24.4 | 11.3 | 72 | 53 | 40 | 0.0 | 0 | 0.9 |
| 22 | 5 | 2024 | 27 May 2024 | 29.6 | 22.0 | 13.5 | 88 | 52 | 38 | 0.8 | 0 | 0.7 |
| 22 | 5 | 2024 | 28 May 2024 | 24.6 | 23.8 | 22.7 | 70 | 59 | 40 | 0.0 | 0 | 0.6 |
| 22 | 5 | 2024 | 29 May 2024 | 25.6 | 24.2 | 22.8 | 63 | 59 | 50 | 0.0 | 0 | 0.5 |
| 22 | 5 | 2024 | 30 May 2024 | 25.9 | 24.1 | 21.2 | 62 | 58 | 51 | 0.0 | 0 | 0.4 |
| 22 | 5 | 2024 | 31 May 2024 | 25.1 | 24.0 | 23.1 | 63 | 59 | 50 | 0.0 | 0 | 0.4 |
| 22 | 6 | 2024 | 1 June 2024 | 25.4 | 24.1 | 22.1 | 58 | 51 | 40 | 0.0 | 0 | 0.9 |
| 23 | 6 | 2024 | 2 June 2024 | 25.2 | 24.2 | 23.0 | 54 | 51 | 43 | 0.0 | 0 | 0.9 |
| 23 | 6 | 2024 | 3 June 2024 | 25.6 | 24.0 | 22.5 | 60 | 54 | 49 | 0.4 | 0 | 0.8 |
| 23 | 6 | 2024 | 4 June 2024 | 31.3 | 25.0 | 21.0 | 55 | 49 | 40 | 2.6 | 0 | 0.9 |
| 23 | 6 | 2024 | 5 June 2024 | 32.6 | 22.8 | 16.6 | 89 | 63 | 41 | 2.2 | 0 | 2 |
| 23 | 6 | 2024 | 6 June 2024 | 28.1 | 23.0 | 15.5 | 96 | 74 | 42 | 0.0 | 0 | 1.7 |
| 23 | 6 | 2024 | 7 June 2024 | 32.3 | 24.9 | 18.1 | 96 | 71 | 51 | 0.0 | 0 | 2.1 |
| 23 | 6 | 2024 | 8 June 2024 | 31.9 | 25.1 | 18.8 | 98 | 72 | 48 | 0.0 | 0 | 2 |
| 24 | 6 | 2024 | 9 June 2024 | 31.2 | 25.0 | 20.4 | 100 | 76 | 39 | 0.0 | 65 | 1.7 |
| 24 | 6 | 2024 | 10 June 2024 | 30.1 | 23.9 | 17.9 | 100 | 76 | 42 | 6.0 | 495 | 1.6 |
| 24 | 6 | 2024 | 11 June 2024 | 28.3 | 22.7 | 16.5 | 100 | 68 | 40 | 0.2 | 155 | 1.4 |
| 24 | 6 | 2024 | 12 June 2024 | 29.1 | 21.5 | 16.6 | 100 | 74 | 49 | 45.4 | 475 | 1.2 |
| 24 | 6 | 2024 | 13 June 2024 | 25.5 | 19.0 | 15.2 | 100 | 82 | 60 | 0.2 | 520 | 1.1 |
| 24 | 6 | 2024 | 14 June 2024 | 25.0 | 20.3 | 12.9 | 100 | 74 | 38 | 0.0 | 450 | 1.8 |
| 24 | 6 | 2024 | 15 June 2024 | 27.6 | 21.8 | 14.1 | 100 | 74 | 47 | 0.0 | 140 | 2.4 |
| 25 | 6 | 2024 | 16 June 2024 | 30.8 | 23.6 | 16.0 | 90 | 59 | 20 | 0.0 | 0 | 1.6 |
| 25 | 6 | 2024 | 17 June 2024 | 31.3 | 23.2 | 14.8 | 100 | 67 | 65 | 0.0 | 0 | 1.9 |
| 25 | 6 | 2024 | 18 June 2024 | 29.6 | 24.2 | 17.0 | 100 | 77 | 61 | 0.0 | 505 | 2.2 |
| 25 | 6 | 2024 | 19 June 2024 | 34.2 | 26.8 | 20.3 | 100 | 74 | 55 | 0.0 | 495 | 1.6 |
| 25 | 6 | 2024 | 20 June 2024 | 32.3 | 26.1 | 20.7 | 100 | 76 | 54 | 0.0 | 0 | 1.2 |
| 25 | 6 | 2024 | 21 June 2024 | 31.1 | 25.1 | 21.2 | 100 | 88 | 55 | 0.0 | 450 | 1.6 |
| 25 | 6 | 2024 | 22 June 2024 | 33.0 | 25.1 | 17.6 | 89 | 62 | 41 | 0.0 | 0 | 1.5 |
| 26 | 6 | 2024 | 23 June 2024 | 23.4 | 20.4 | 16.9 | 100 | 88 | 40 | 1.2 | 395 | 0.7 |
| 26 | 6 | 2024 | 24 June 2024 | 27.7 | 21.6 | 18.0 | 100 | 89 | 50 | 9.8 | 920 | 1 |
| 26 | 6 | 2024 | 25 June 2024 | 29.2 | 21.8 | 18.3 | 100 | 91 | 50 | 5.8 | 745 | 1.1 |
| 26 | 6 | 2024 | 26 June 2024 | 29.0 | 21.6 | 17.5 | 100 | 87 | 56 | 0.4 | 600 | 0.8 |
| 26 | 6 | 2024 | 27 June 2024 | 33.7 | 24.8 | 16.4 | 100 | 75 | 47 | 0.0 | 295 | 1.1 |
| 26 | 6 | 2024 | 28 June 2024 | 33.7 | 26.3 | 19.5 | 100 | 78 | 63 | 0.0 | 130 | 1.8 |
| 26 | 6 | 2024 | 29 June 2024 | 31.4 | 26.7 | 21.0 | 100 | 83 | 59 | 0.0 | 460 | 2.2 |
| 27 | 6 | 2024 | 30 June 2024 | 34.1 | 27.9 | 21.5 | 100 | 66 | 40 | 0.0 | 225 | 1.6 |
| 27 | 7 | 2024 | 1 July 2024 | 32.2 | 25.0 | 18.2 | 100 | 73 | 48 | 14.4 | 255 | 1.7 |
| 27 | 7 | 2024 | 2 July 2024 | 28.9 | 23.1 | 16.4 | 100 | 76 | 40 | 0.2 | 575 | 2.7 |
| 27 | 7 | 2024 | 3 July 2024 | 25.0 | 21.2 | 16.2 | 100 | 81 | 51 | 50.6 | 350 | 2.1 |
| 27 | 7 | 2024 | 4 July 2024 | 28.7 | 21.8 | 16.1 | 100 | 78 | 57 | 6.0 | 610 | 1.2 |
| 27 | 7 | 2024 | 5 July 2024 | 28.4 | 23.2 | 15.8 | 100 | 77 | 50 | 0.0 | 445 | 2 |
| 27 | 7 | 2024 | 6 July 2024 | 31.6 | 25.6 | 19.1 | 100 | 78 | 52 | 0.0 | 365 | 2.1 |
| 28 | 7 | 2024 | 7 July 2024 | 30.6 | 25.8 | 20.9 | 100 | 70 | 69 | 0.0 | 140 | 1.7 |
| 28 | 7 | 2024 | 8 July 2024 | 32.5 | 26.9 | 21.4 | 100 | 80 | 47 | 0.0 | 470 | 1.8 |
| 28 | 7 | 2024 | 9 July 2024 | 36.2 | 28.1 | 20.1 | 100 | 73 | 58 | 0.0 | 355 | 1 |
| 28 | 7 | 2024 | 10 July 2024 | 37.7 | 29.0 | 21.0 | 100 | 76 | 40 | 0.0 | 210 | 1 |
| 28 | 7 | 2024 | 11 July 2024 | 37.5 | 29.5 | 22.9 | 100 | 71 | 42 | 0.0 | 0 | 1.5 |
| 28 | 7 | 2024 | 12 July 2024 | 36.9 | 29.4 | 21.9 | 100 | 68 | 52 | 0.0 | 30 | 1.4 |
| 28 | 7 | 2024 | 13 July 2024 | 35.4 | 28.1 | 22.4 | 100 | 79 | 45 | 0.0 | 460 | 1.4 |
| 29 | 7 | 2024 | 14 July 2024 | 36.0 | 27.5 | 19.6 | 100 | 62 | 50 | 0.0 | 0 | 1.2 |
| 29 | 7 | 2024 | 15 July 2024 | 33.6 | 27.2 | 19.9 | 100 | 74 | 0.0 | 425 | 1.8 | |
| 29 | 7 | 2024 | 16 July 2024 | 35.9 | 28.1 | 20.4 | 100 | 79 | 62 | 0.0 | 420 | 1.5 |
| 29 | 7 | 2024 | 17 July 2024 | 34.8 | 28.1 | 20.1 | 100 | 75 | 45 | 0.0 | 260 | 1.9 |
| 29 | 7 | 2024 | 18 July 2024 | 34.7 | 28.2 | 20.8 | 100 | 79 | 0.0 | 600 | 1.7 | |
| 29 | 7 | 2024 | 19 July 2024 | 36.8 | 29.2 | 21.9 | 100 | 73 | 51 | 0.0 | 415 | 1.1 |
| 29 | 7 | 2024 | 20 July 2024 | 31.6 | 26.2 | 20.3 | 100 | 79 | 54 | 6.0 | 340 | 1.7 |
| 30 | 7 | 2024 | 21 July 2024 | 31.3 | 26.7 | 20.2 | 100 | 82 | 69 | 0.0 | 300 | 1.9 |
| 30 | 7 | 2024 | 22 July 2024 | 33.2 | 25.9 | 22.5 | 100 | 86 | 38 | 0.8 | 705 | 1.3 |
| 30 | 7 | 2024 | 23 July 2024 | 32.6 | 26.8 | 21.3 | 100 | 79 | 31 | 0.2 | 430 | 1.5 |
| 30 | 7 | 2024 | 24 July 2024 | 33.4 | 27.2 | 20.6 | 100 | 77 | 49 | 0.0 | 410 | 1.3 |
| 30 | 7 | 2024 | 25 July 2024 | 30.3 | 26.3 | 21.1 | 100 | 75 | 57 | 0.0 | 65 | 2.3 |
| 30 | 7 | 2024 | 26 July 2024 | 31.0 | 26.5 | 20.0 | 100 | 70 | 53 | 0.0 | 0 | 2.2 |
| 30 | 7 | 2024 | 27 July 2024 | 31.5 | 27.0 | 21.5 | 100 | 79 | 49 | 0.0 | 265 | 2 |
| 31 | 7 | 2024 | 28 July 2024 | 36.1 | 28.3 | 21.2 | 100 | 82 | 55 | 0.0 | 560 | 1.6 |
| 31 | 7 | 2024 | 29 July 2024 | 34.2 | 28.0 | 22.8 | 100 | 79 | 57 | 0.0 | 235 | 1.3 |
| 31 | 7 | 2024 | 30 July 2024 | 31.8 | 26.3 | 20.4 | 100 | 74 | 49 | 0.0 | 425 | 2 |
| 31 | 7 | 2024 | 31 July 2024 | 35.0 | 27.3 | 20.2 | 100 | 76 | 46 | 0.0 | 430 | 1.7 |
| 31 | 8 | 2024 | 1 August 2024 | 34.1 | 28.2 | 22.2 | 100 | 81 | 60 | 0.8 | 595 | 2.1 |
| 31 | 8 | 2024 | 2 August 2024 | 31.4 | 26.2 | 20.5 | 100 | 87 | 43 | 0.0 | 310 | 1.7 |
| 31 | 8 | 2024 | 3 August 2024 | 29.9 | 24.2 | 21.0 | 100 | 94 | 52 | 11.2 | 1085 | 1.1 |
| 32 | 8 | 2024 | 4 August 2024 | 33.0 | 26.3 | 20.2 | 100 | 79 | 52 | 0.2 | 515 | 1.3 |
| 32 | 8 | 2024 | 5 August 2024 | 30.8 | 26.4 | 21.6 | 100 | 80 | 47 | 0.0 | 270 | 1.9 |
| 32 | 8 | 2024 | 6 August 2024 | 32.1 | 26.4 | 21.0 | 100 | 81 | 41 | 0.0 | 415 | 1.6 |
| 32 | 8 | 2024 | 7 August 2024 | 33.8 | 26.5 | 20.2 | 100 | 83 | 48 | 10.6 | 595 | 1.8 |
| 32 | 8 | 2024 | 8 August 2024 | 33.8 | 25.4 | 19.0 | 100 | 84 | 37 | 0.0 | 640 | 1.1 |
| 32 | 8 | 2024 | 9 August 2024 | 33.9 | 27.0 | 20.0 | 100 | 81 | 43 | 0.2 | 490 | 1.7 |
| 32 | 8 | 2024 | 10 August 2024 | 33.4 | 27.9 | 21.4 | 100 | 76 | 55 | 0.0 | 540 | 1.6 |
| 33 | 8 | 2024 | 11 August 2024 | 36.2 | 28.2 | 20.8 | 100 | 76 | 50 | 0.0 | 550 | 1.6 |
| 33 | 8 | 2024 | 12 August 2024 | 36.6 | 28.6 | 20.9 | 100 | 76 | 48 | 0.0 | 480 | 1.7 |
| 33 | 8 | 2024 | 13 August 2024 | 34.7 | 28.7 | 21.8 | 100 | 79 | 52 | 0.0 | 450 | 1.8 |
| 33 | 8 | 2024 | 14 August 2024 | 35.8 | 28.6 | 22.7 | 100 | 74 | 40 | 0.0 | 275 | 1.6 |
| 33 | 8 | 2024 | 15 August 2024 | 34.3 | 26.7 | 19.9 | 100 | 76 | 65 | 0.0 | 185 | 0.9 |
| 33 | 8 | 2024 | 16 August 2024 | 36.2 | 27.9 | 21.4 | 100 | 74 | 54 | 0.0 | 65 | 1 |
| 33 | 8 | 2024 | 17 August 2024 | 36.6 | 26.7 | 21.2 | 100 | 79 | 54 | 10.0 | 365 | 1.1 |
| 34 | 8 | 2024 | 18 August 2024 | 32.1 | 24.8 | 20.4 | 100 | 84 | 61 | 0.0 | 640 | 1.1 |
| 34 | 8 | 2024 | 19 August 2024 | 25.9 | 21.5 | 19.5 | 100 | 100 | 50 | 18.8 | 1425 | 0.8 |
| 34 | 8 | 2024 | 20 August 2024 | 29.7 | 24.5 | 20.9 | 100 | 90 | 53 | 2.6 | 750 | 1.2 |
| 34 | 8 | 2024 | 21 August 2024 | 33.6 | 26.5 | 20.4 | 100 | 80 | 48 | 0.0 | 535 | 1 |
| 34 | 8 | 2024 | 22 August 2024 | 30.6 | 26.2 | 21.3 | 100 | 80 | 44 | 0.0 | 295 | 1.8 |
| 34 | 8 | 2024 | 23 August 2024 | 31.8 | 26.3 | 20.5 | 100 | 83 | 43 | 0.0 | 510 | 1.7 |
| 34 | 8 | 2024 | 24 August 2024 | 34.5 | 27.4 | 21.9 | 100 | 84 | 41 | 0.0 | 635 | 1.7 |
| 35 | 8 | 2024 | 25 August 2024 | 35.7 | 26.9 | 20.0 | 100 | 80 | 38 | 0.2 | 600 | 1.2 |
| 35 | 8 | 2024 | 26 August 2024 | 33.8 | 26.7 | 20.7 | 100 | 82 | 45 | 0.2 | 545 | 1.3 |
| 35 | 8 | 2024 | 27 August 2024 | 31.7 | 23.2 | 20.6 | 100 | 94 | 36 | 0.0 | 415 | 0.5 |
| Temperature °C | Relative Humidity % | mm/m2 | Minute | m/s | ||||||||
|---|---|---|---|---|---|---|---|---|---|---|---|---|
| S | M | Y | Date | TMx | TAv | TMn | RH Mx | RH Av | RH Mn | Rainfall | Leaf Wetness | Wind |
| 18 | 5 | 2024 | 1 May 2024 | 25.4 | 17.3 | 8.2 | 100 | 92 | 70 | 0.0 | 660 | 1.6 |
| 18 | 5 | 2024 | 2 May 2024 | 21.0 | 15.9 | 10.0 | 100 | 79 | 53 | 2.8 | 420 | 1.3 |
| 18 | 5 | 2024 | 3 May 2024 | 19.7 | 15.0 | 9.6 | 100 | 73 | 39 | 0.4 | 240 | 2.5 |
| 18 | 5 | 2024 | 4 May 2024 | 21.8 | 14.7 | 5.6 | 100 | 79 | 53 | 0.2 | 300 | 1.7 |
| 19 | 5 | 2024 | 5 May 2024 | 23.4 | 16.8 | 12.5 | 96 | 65 | 38 | 2.0 | 0 | 1.3 |
| 19 | 5 | 2024 | 6 May 2024 | 26.0 | 18.4 | 11.0 | 97 | 67 | 41 | 0.0 | 120 | 1.3 |
| 19 | 5 | 2024 | 7 May 2024 | 22.6 | 17.4 | 12.9 | 100 | 94 | 80 | 0.0 | 960 | 1.1 |
| 19 | 5 | 2024 | 8 May 2024 | 18.0 | 14.5 | 11.5 | 100 | 88 | 55 | 8.8 | 600 | 1.1 |
| 19 | 5 | 2024 | 9 May 2024 | 22.2 | 15.9 | 11.3 | 100 | 81 | 49 | 2.0 | 180 | 1.3 |
| 19 | 5 | 2024 | 10 May 2024 | 24.2 | 17.4 | 11.3 | 100 | 71 | 35 | 0.0 | 360 | 1.2 |
| 19 | 5 | 2024 | 11 May 2024 | 25.0 | 17.3 | 9.7 | 96 | 64 | 36 | 0.0 | 0 | 1.3 |
| 20 | 5 | 2024 | 12 May 2024 | 27.5 | 18.4 | 9.0 | 96 | 67 | 35 | 0.0 | 60 | 1.2 |
| 20 | 5 | 2024 | 13 May 2024 | 27.1 | 19.3 | 11.4 | 100 | 79 | 47 | 0.0 | 360 | 1.8 |
| 20 | 5 | 2024 | 14 May 2024 | 25.2 | 18.8 | 12.2 | 100 | 83 | 48 | 12.4 | 420 | 1.5 |
| 20 | 5 | 2024 | 15 May 2024 | 24.9 | 19.1 | 14.2 | 100 | 95 | 77 | 0.0 | 840 | 2 |
| 20 | 5 | 2024 | 16 May 2024 | 25.1 | 20.1 | 15.0 | 100 | 95 | 78 | 0.0 | 120 | 2.3 |
| 20 | 5 | 2024 | 17 May 2024 | 25.0 | 20.1 | 15.2 | 99 | 61 | 34 | 0.0 | 60 | 1.6 |
| 20 | 5 | 2024 | 18 May 2024 | 25.2 | 19.7 | 14.2 | 100 | 74 | 45 | 2.0 | 240 | 1.2 |
| 21 | 5 | 2024 | 19 May 2024 | 23.0 | 19.5 | 16.0 | 100 | 81 | 41 | 0.0 | 420 | 1.8 |
| 21 | 5 | 2024 | 20 May 2024 | 22.0 | 18.5 | 15.0 | 100 | 94 | 74 | 0.0 | 960 | 1.5 |
| 21 | 5 | 2024 | 21 May 2024 | 24.5 | 19.9 | 15.3 | 100 | 85 | 54 | 17.4 | 720 | 1.9 |
| 21 | 5 | 2024 | 22 May 2024 | 25.1 | 20.6 | 16.1 | 100 | 75 | 44 | 1.2 | 360 | 1.8 |
| 21 | 5 | 2024 | 23 May 2024 | 27.0 | 21.1 | 15.1 | 100 | 77 | 44 | 0.0 | 540 | 1.3 |
| 21 | 5 | 2024 | 24 May 2024 | 25.0 | 20.5 | 16.0 | 100 | 82 | 51 | 1.8 | 540 | 1.5 |
| 21 | 5 | 2024 | 25 May 2024 | 23.0 | 19.5 | 16.0 | 100 | 89 | 65 | 12.6 | 300 | 1.6 |
| 22 | 5 | 2024 | 26 May 2024 | 24.0 | 19.0 | 14.0 | 100 | 77 | 44 | 1.4 | 420 | 1.4 |
| 22 | 5 | 2024 | 27 May 2024 | 22.3 | 18.8 | 15.3 | 100 | 78 | 45 | 0.0 | 360 | 1.4 |
| 22 | 5 | 2024 | 28 May 2024 | 24.0 | 19.0 | 14.0 | 100 | 86 | 62 | 0.0 | 120 | 1.6 |
| 22 | 5 | 2024 | 29 May 2024 | 21.0 | 18.0 | 15.0 | 100 | 82 | 51 | 0.0 | 480 | 1.4 |
| 22 | 5 | 2024 | 30 May 2024 | 26.0 | 20.2 | 14.1 | 100 | 78 | 49 | 0.0 | 480 | 1.2 |
| 22 | 5 | 2024 | 31 May 2024 | 26.1 | 20.1 | 14.0 | 100 | 84 | 63 | 2.6 | 420 | 1.4 |
| 22 | 6 | 2024 | 1 June 2024 | 22.2 | 16.5 | 11.7 | 94 | 67 | 31 | 8.8 | 0 | 1.6 |
| 23 | 6 | 2024 | 2 June 2024 | 26.9 | 19.4 | 9.5 | 100 | 79 | 49 | 0.0 | 180 | 1.5 |
| 23 | 6 | 2024 | 3 June 2024 | 23.8 | 18.2 | 13.7 | 100 | 76 | 50 | 0.0 | 180 | 1.7 |
| 23 | 6 | 2024 | 4 June 2024 | 25.2 | 18.8 | 13.7 | 98 | 77 | 40 | 1.2 | 180 | 1.5 |
| 23 | 6 | 2024 | 5 June 2024 | 27.1 | 20.3 | 14.3 | 100 | 71 | 36 | 0.0 | 300 | 1.3 |
| 23 | 6 | 2024 | 6 June 2024 | 29.1 | 22.0 | 14.4 | 97 | 69 | 41 | 0.0 | 0 | 1.5 |
| 23 | 6 | 2024 | 7 June 2024 | 30.5 | 23.2 | 15.7 | 92 | 67 | 44 | 0.0 | 0 | 1.4 |
| 23 | 6 | 2024 | 8 June 2024 | 31.7 | 24.7 | 17.5 | 87 | 61 | 43 | 0.0 | 0 | 1.3 |
| 24 | 6 | 2024 | 9 June 2024 | 31.8 | 25.3 | 18.7 | 94 | 73 | 57 | 0.0 | 0 | 1.3 |
| 24 | 6 | 2024 | 10 June 2024 | 27.3 | 23.1 | 19.4 | 100 | 69 | 44 | 0.4 | 300 | 1.2 |
| 24 | 6 | 2024 | 11 June 2024 | 28.7 | 23.4 | 18.6 | 78 | 59 | 36 | 1.4 | 240 | 2.1 |
| 24 | 6 | 2024 | 12 June 2024 | 28.1 | 22.4 | 16.5 | 100 | 69 | 48 | 0.0 | 240 | 1.9 |
| 24 | 6 | 2024 | 13 June 2024 | 27.0 | 19.8 | 14.4 | 100 | 85 | 50 | 18.4 | 600 | 2 |
| 24 | 6 | 2024 | 14 June 2024 | 24.1 | 18.6 | 13.9 | 100 | 69 | 38 | 0.0 | 360 | 1.5 |
| 24 | 6 | 2024 | 15 June 2024 | 26.9 | 20.7 | 12.0 | 94 | 59 | 36 | 0.0 | 60 | 1.1 |
| 25 | 6 | 2024 | 16 June 2024 | 29.8 | 23.2 | 14.0 | 75 | 51 | 35 | 0.0 | 0 | 1.5 |
| 25 | 6 | 2024 | 17 June 2024 | 29.7 | 22.9 | 16.1 | 92 | 57 | 28 | 0.0 | 60 | 1.3 |
| 25 | 6 | 2024 | 18 June 2024 | 31.8 | 23.6 | 15.1 | 97 | 62 | 33 | 0.0 | 60 | 1.5 |
| 25 | 6 | 2024 | 19 June 2024 | 32.8 | 24.5 | 15.8 | 100 | 69 | 33 | 0.0 | 300 | 1.5 |
| 25 | 6 | 2024 | 20 June 2024 | 33.4 | 25.4 | 18.0 | 94 | 69 | 46 | 0.0 | 60 | 1.1 |
| 25 | 6 | 2024 | 21 June 2024 | 31.4 | 26.5 | 20.9 | 97 | 75 | 57 | 0.0 | 0 | 1.1 |
| 25 | 6 | 2024 | 22 June 2024 | 29.9 | 25.9 | 21.2 | 90 | 59 | 34 | 0.0 | 0 | 1.8 |
| 26 | 6 | 2024 | 23 June 2024 | 31.0 | 24.2 | 17.1 | 100 | 89 | 68 | 0.0 | 840 | 1.9 |
| 26 | 6 | 2024 | 24 June 2024 | 21.1 | 19.6 | 18.0 | 100 | 93 | 79 | 1.0 | 720 | 1.4 |
| 26 | 6 | 2024 | 25 June 2024 | 23.6 | 19.9 | 17.6 | 100 | 89 | 68 | 17.0 | 660 | 1.8 |
| 26 | 6 | 2024 | 26 June 2024 | 24.4 | 20.1 | 17.1 | 100 | 86 | 58 | 3.0 | 540 | 1.9 |
| 26 | 6 | 2024 | 27 June 2024 | 27.7 | 21.2 | 16.7 | 97 | 66 | 39 | 0.0 | 60 | 1.4 |
| 26 | 6 | 2024 | 28 June 2024 | 32.1 | 25.1 | 16.9 | 94 | 67 | 42 | 0.0 | 0 | 1.5 |
| 26 | 6 | 2024 | 29 June 2024 | 33.7 | 26.9 | 19.7 | 99 | 74 | 47 | 0.0 | 180 | 1.5 |
| 27 | 6 | 2024 | 30 June 2024 | 32.8 | 26.6 | 20.0 | 99 | 60 | 32 | 0.0 | 120 | 1.8 |
| 27 | 7 | 2024 | 1 July 2024 | 32.3 | 26.7 | 20.9 | 100 | 73 | 44 | 0.0 | 660 | 1.6 |
| 27 | 7 | 2024 | 2 July 2024 | 31.0 | 24.0 | 17.2 | 100 | 72 | 37 | 14.4 | 540 | 1.5 |
| 27 | 7 | 2024 | 3 July 2024 | 28.7 | 22.7 | 16.5 | 100 | 88 | 61 | 0.2 | 660 | 2 |
| 27 | 7 | 2024 | 4 July 2024 | 23.2 | 19.8 | 17.6 | 100 | 75 | 41 | 11.6 | 360 | 2.2 |
| 27 | 7 | 2024 | 5 July 2024 | 27.8 | 21.6 | 16.0 | 100 | 71 | 40 | 0.0 | 420 | 1.3 |
| 27 | 7 | 2024 | 6 July 2024 | 29.3 | 23.4 | 15.9 | 100 | 64 | 33 | 0.0 | 360 | 1.9 |
| 28 | 7 | 2024 | 7 July 2024 | 31.7 | 25.4 | 17.2 | 96 | 65 | 41 | 0.0 | 180 | 1.6 |
| 28 | 7 | 2024 | 8 July 2024 | 30.3 | 25.2 | 19.4 | 98 | 73 | 44 | 0.0 | 120 | 1.5 |
| 28 | 7 | 2024 | 9 July 2024 | 31.6 | 26.2 | 19.9 | 99 | 69 | 42 | 0.0 | 120 | 1.5 |
| 28 | 7 | 2024 | 10 July 2024 | 33.5 | 27.3 | 20.8 | 95 | 63 | 33 | 0.0 | 0 | 1.3 |
| 28 | 7 | 2024 | 11 July 2024 | 35.6 | 28.6 | 20.3 | 91 | 56 | 30 | 0.0 | 0 | 1.5 |
| 28 | 7 | 2024 | 12 July 2024 | 36.7 | 29.3 | 21.4 | 89 | 59 | 29 | 0.0 | 0 | 1.3 |
| 28 | 7 | 2024 | 13 July 2024 | 34.3 | 28.1 | 21.1 | 79 | 54 | 31 | 0.0 | 0 | 1.5 |
| 29 | 7 | 2024 | 14 July 2024 | 33.9 | 27.7 | 21.7 | 86 | 54 | 32 | 0.0 | 0 | 1.5 |
| 29 | 7 | 2024 | 15 July 2024 | 33.5 | 26.4 | 18.3 | 90 | 58 | 28 | 0.0 | 0 | 1.3 |
| 29 | 7 | 2024 | 16 July 2024 | 34.5 | 27.5 | 19.2 | 88 | 48 | 29 | 0.0 | 0 | 1.5 |
| 29 | 7 | 2024 | 17 July 2024 | 35.7 | 28.1 | 19.8 | 81 | 52 | 24 | 0.0 | 0 | 1.4 |
| 29 | 7 | 2024 | 18 July 2024 | 35.4 | 28.2 | 19.8 | 83 | 58 | 34 | 0.0 | 0 | 1.5 |
| 29 | 7 | 2024 | 19 July 2024 | 34.9 | 28.1 | 19.3 | 94 | 65 | 37 | 0.0 | 0 | 1.3 |
| 29 | 7 | 2024 | 20 July 2024 | 35.4 | 28.6 | 21.8 | 100 | 75 | 46 | 0.0 | 300 | 1.5 |
| 30 | 7 | 2024 | 21 July 2024 | 31.5 | 25.5 | 19.3 | 100 | 72 | 39 | 26.0 | 300 | 1.8 |
| 30 | 7 | 2024 | 22 July 2024 | 32.9 | 27.1 | 19.6 | 100 | 77 | 53 | 0.0 | 360 | 1.4 |
| 30 | 7 | 2024 | 23 July 2024 | 32.3 | 25.4 | 21.0 | 100 | 71 | 40 | 0.6 | 360 | 1.6 |
| 30 | 7 | 2024 | 24 July 2024 | 32.7 | 26.5 | 20.2 | 97 | 67 | 43 | 0.0 | 0 | 1.2 |
| 30 | 7 | 2024 | 25 July 2024 | 32.5 | 26.8 | 20.6 | 98 | 69 | 38 | 0.0 | 60 | 1.6 |
| 30 | 7 | 2024 | 26 July 2024 | 31.9 | 25.8 | 20.5 | 94 | 61 | 32 | 0.0 | 0 | 2 |
| 30 | 7 | 2024 | 27 July 2024 | 32.7 | 26.4 | 17.9 | 92 | 66 | 36 | 0.0 | 0 | 1.8 |
| 31 | 7 | 2024 | 28 July 2024 | 34.8 | 27.4 | 19.5 | 91 | 60 | 34 | 0.0 | 0 | 1.3 |
| 31 | 7 | 2024 | 29 July 2024 | 35.9 | 28.9 | 20.9 | 99 | 71 | 47 | 0.0 | 60 | 1.8 |
| 31 | 7 | 2024 | 30 July 2024 | 32.8 | 27.4 | 22.4 | 98 | 61 | 35 | 0.0 | 120 | 1.6 |
| 31 | 7 | 2024 | 31 July 2024 | 33.1 | 27.0 | 20.3 | 87 | 58 | 34 | 0.0 | 0 | 1.6 |
| 31 | 8 | 2024 | 1 August 2024 | 35.9 | 27.8 | 19.0 | 88 | 58 | 25 | 0.0 | 0 | 1.2 |
| 31 | 8 | 2024 | 2 August 2024 | 36.2 | 28.3 | 21.5 | 100 | 79 | 44 | 1.0 | 540 | 1.6 |
| 31 | 8 | 2024 | 3 August 2024 | 34.1 | 26.8 | 20.6 | 100 | 84 | 58 | 0.0 | 480 | 1.4 |
| 32 | 8 | 2024 | 4 August 2024 | 30.1 | 25.3 | 20.7 | 100 | 70 | 36 | 0.0 | 420 | 1.7 |
| 32 | 8 | 2024 | 5 August 2024 | 32.9 | 26.1 | 19.3 | 97 | 66 | 33 | 0.0 | 240 | 1.5 |
| 32 | 8 | 2024 | 6 August 2024 | 33.5 | 27.1 | 19.2 | 94 | 69 | 41 | 0.0 | 240 | 1.8 |
| 32 | 8 | 2024 | 7 August 2024 | 33.4 | 27.1 | 20.6 | 100 | 73 | 39 | 0.0 | 300 | 1.6 |
| 32 | 8 | 2024 | 8 August 2024 | 34.8 | 25.8 | 19.7 | 100 | 72 | 39 | 22.8 | 420 | 1.7 |
| 32 | 8 | 2024 | 9 August 2024 | 32.0 | 25.4 | 19.2 | 100 | 69 | 35 | 0.0 | 360 | 1.3 |
| 32 | 8 | 2024 | 10 August 2024 | 33.9 | 27.2 | 20.5 | 93 | 64 | 39 | 0.0 | 60 | 1.1 |
| 33 | 8 | 2024 | 11 August 2024 | 34.9 | 28.1 | 21.2 | 93 | 60 | 32 | 0.0 | 60 | 1.2 |
| 33 | 8 | 2024 | 12 August 2024 | 35.9 | 28.6 | 21.3 | 87 | 57 | 29 | 0.0 | 0 | 1.1 |
| 33 | 8 | 2024 | 13 August 2024 | 37.2 | 29.5 | 21.4 | 83 | 57 | 30 | 0.0 | 0 | 1.8 |
| 33 | 8 | 2024 | 14 August 2024 | 37.7 | 29.6 | 22.6 | 80 | 61 | 31 | 0.0 | 0 | 1.6 |
| 33 | 8 | 2024 | 15 August 2024 | 36.3 | 26.9 | 20.5 | 92 | 67 | 48 | 33.4 | 60 | 0.9 |
| 33 | 8 | 2024 | 16 August 2024 | 30.5 | 25.3 | 20.3 | 86 | 64 | 42 | 0.0 | 0 | 1 |
| 33 | 8 | 2024 | 17 August 2024 | 33.0 | 26.0 | 21.7 | 100 | 68 | 32 | 0.0 | 300 | 1.1 |
| 34 | 8 | 2024 | 18 August 2024 | 33.3 | 25.8 | 21.4 | 100 | 81 | 43 | 3.6 | 540 | 1.1 |
| 34 | 8 | 2024 | 19 August 2024 | 30.0 | 23.8 | 19.9 | 100 | 97 | 86 | 13.2 | 720 | 0.8 |
| 34 | 8 | 2024 | 20 August 2024 | 23.5 | 21.5 | 19.6 | 100 | 93 | 64 | 17.8 | 540 | 1.2 |
| 34 | 8 | 2024 | 21 August 2024 | 28.4 | 23.8 | 20.7 | 100 | 76 | 44 | 11.2 | 120 | 1 |
| 34 | 8 | 2024 | 22 August 2024 | 32.5 | 26.1 | 19.8 | 100 | 82 | 55 | 0.0 | 420 | 1.8 |
| 34 | 8 | 2024 | 23 August 2024 | 31.0 | 25.7 | 20.2 | 100 | 79 | 48 | 0.0 | 420 | 1.7 |
| 34 | 8 | 2024 | 24 August 2024 | 33.8 | 26.6 | 20.8 | 99 | 70 | 37 | 0.0 | 60 | 1.7 |
| 35 | 8 | 2024 | 25 August 2024 | 34.3 | 27.2 | 19.9 | 84 | 57 | 26 | 0.0 | 0 | 1.2 |
| 35 | 8 | 2024 | 26 August 2024 | 34.8 | 27.2 | 19.6 | 92 | 70 | 46 | 0.0 | 0 | 1.3 |
| 35 | 8 | 2024 | 27 August 2024 | 32.9 | 26.2 | 20.7 | 100 | 87 | 57 | 0.0 | 540 | 0.5 |
| Experiment | Transplanting | 1st Application (dpt) | 2nd Application Interval (d) | 3rd Application Interval (d) |
|---|---|---|---|---|
| 1 | 23 May 2023 | 15 | 30 | 30 |
| 2a | 20 May 2024 | 15 | 30 | 30 |
| 2b | 20 May 2024 | 15 | 20 | 20 |
| 3 | 9 May 2024 | 30 | 20 | 20 |
Disclaimer/Publisher’s Note: The statements, opinions and data contained in all publications are solely those of the individual author(s) and contributor(s) and not of MDPI and/or the editor(s). MDPI and/or the editor(s) disclaim responsibility for any injury to people or property resulting from any ideas, methods, instructions or products referred to in the content. |
© 2025 by the authors. Licensee MDPI, Basel, Switzerland. This article is an open access article distributed under the terms and conditions of the Creative Commons Attribution (CC BY) license (https://creativecommons.org/licenses/by/4.0/).
Share and Cite
Criscuolo, M.C.; Magliulo, R.; Castaldi, V.; Cirillo, V.; Cristiani, C.; Negroni, A.; Aprile, A.M.; Molisso, D.; Buonanno, M.; Esposito, D.; et al. Salt Stress Mitigation and Field-Relevant Biostimulant Activity of Prosystemin Protein Fragments: Novel Tools for Cutting-Edge Solutions in Agriculture. Plants 2025, 14, 2411. https://doi.org/10.3390/plants14152411
Criscuolo MC, Magliulo R, Castaldi V, Cirillo V, Cristiani C, Negroni A, Aprile AM, Molisso D, Buonanno M, Esposito D, et al. Salt Stress Mitigation and Field-Relevant Biostimulant Activity of Prosystemin Protein Fragments: Novel Tools for Cutting-Edge Solutions in Agriculture. Plants. 2025; 14(15):2411. https://doi.org/10.3390/plants14152411
Chicago/Turabian StyleCriscuolo, Martina Chiara, Raffaele Magliulo, Valeria Castaldi, Valerio Cirillo, Claudio Cristiani, Andrea Negroni, Anna Maria Aprile, Donata Molisso, Martina Buonanno, Davide Esposito, and et al. 2025. "Salt Stress Mitigation and Field-Relevant Biostimulant Activity of Prosystemin Protein Fragments: Novel Tools for Cutting-Edge Solutions in Agriculture" Plants 14, no. 15: 2411. https://doi.org/10.3390/plants14152411
APA StyleCriscuolo, M. C., Magliulo, R., Castaldi, V., Cirillo, V., Cristiani, C., Negroni, A., Aprile, A. M., Molisso, D., Buonanno, M., Esposito, D., Langella, E., Monti, S. M., & Rao, R. (2025). Salt Stress Mitigation and Field-Relevant Biostimulant Activity of Prosystemin Protein Fragments: Novel Tools for Cutting-Edge Solutions in Agriculture. Plants, 14(15), 2411. https://doi.org/10.3390/plants14152411