
Phenotypic Profiling of Anchote (Coccinia abyssinica (Lam.) Cogn.) Accessions Through Agro-Morphological and Physiological Markers


Abstract
1. Introduction
2. Results
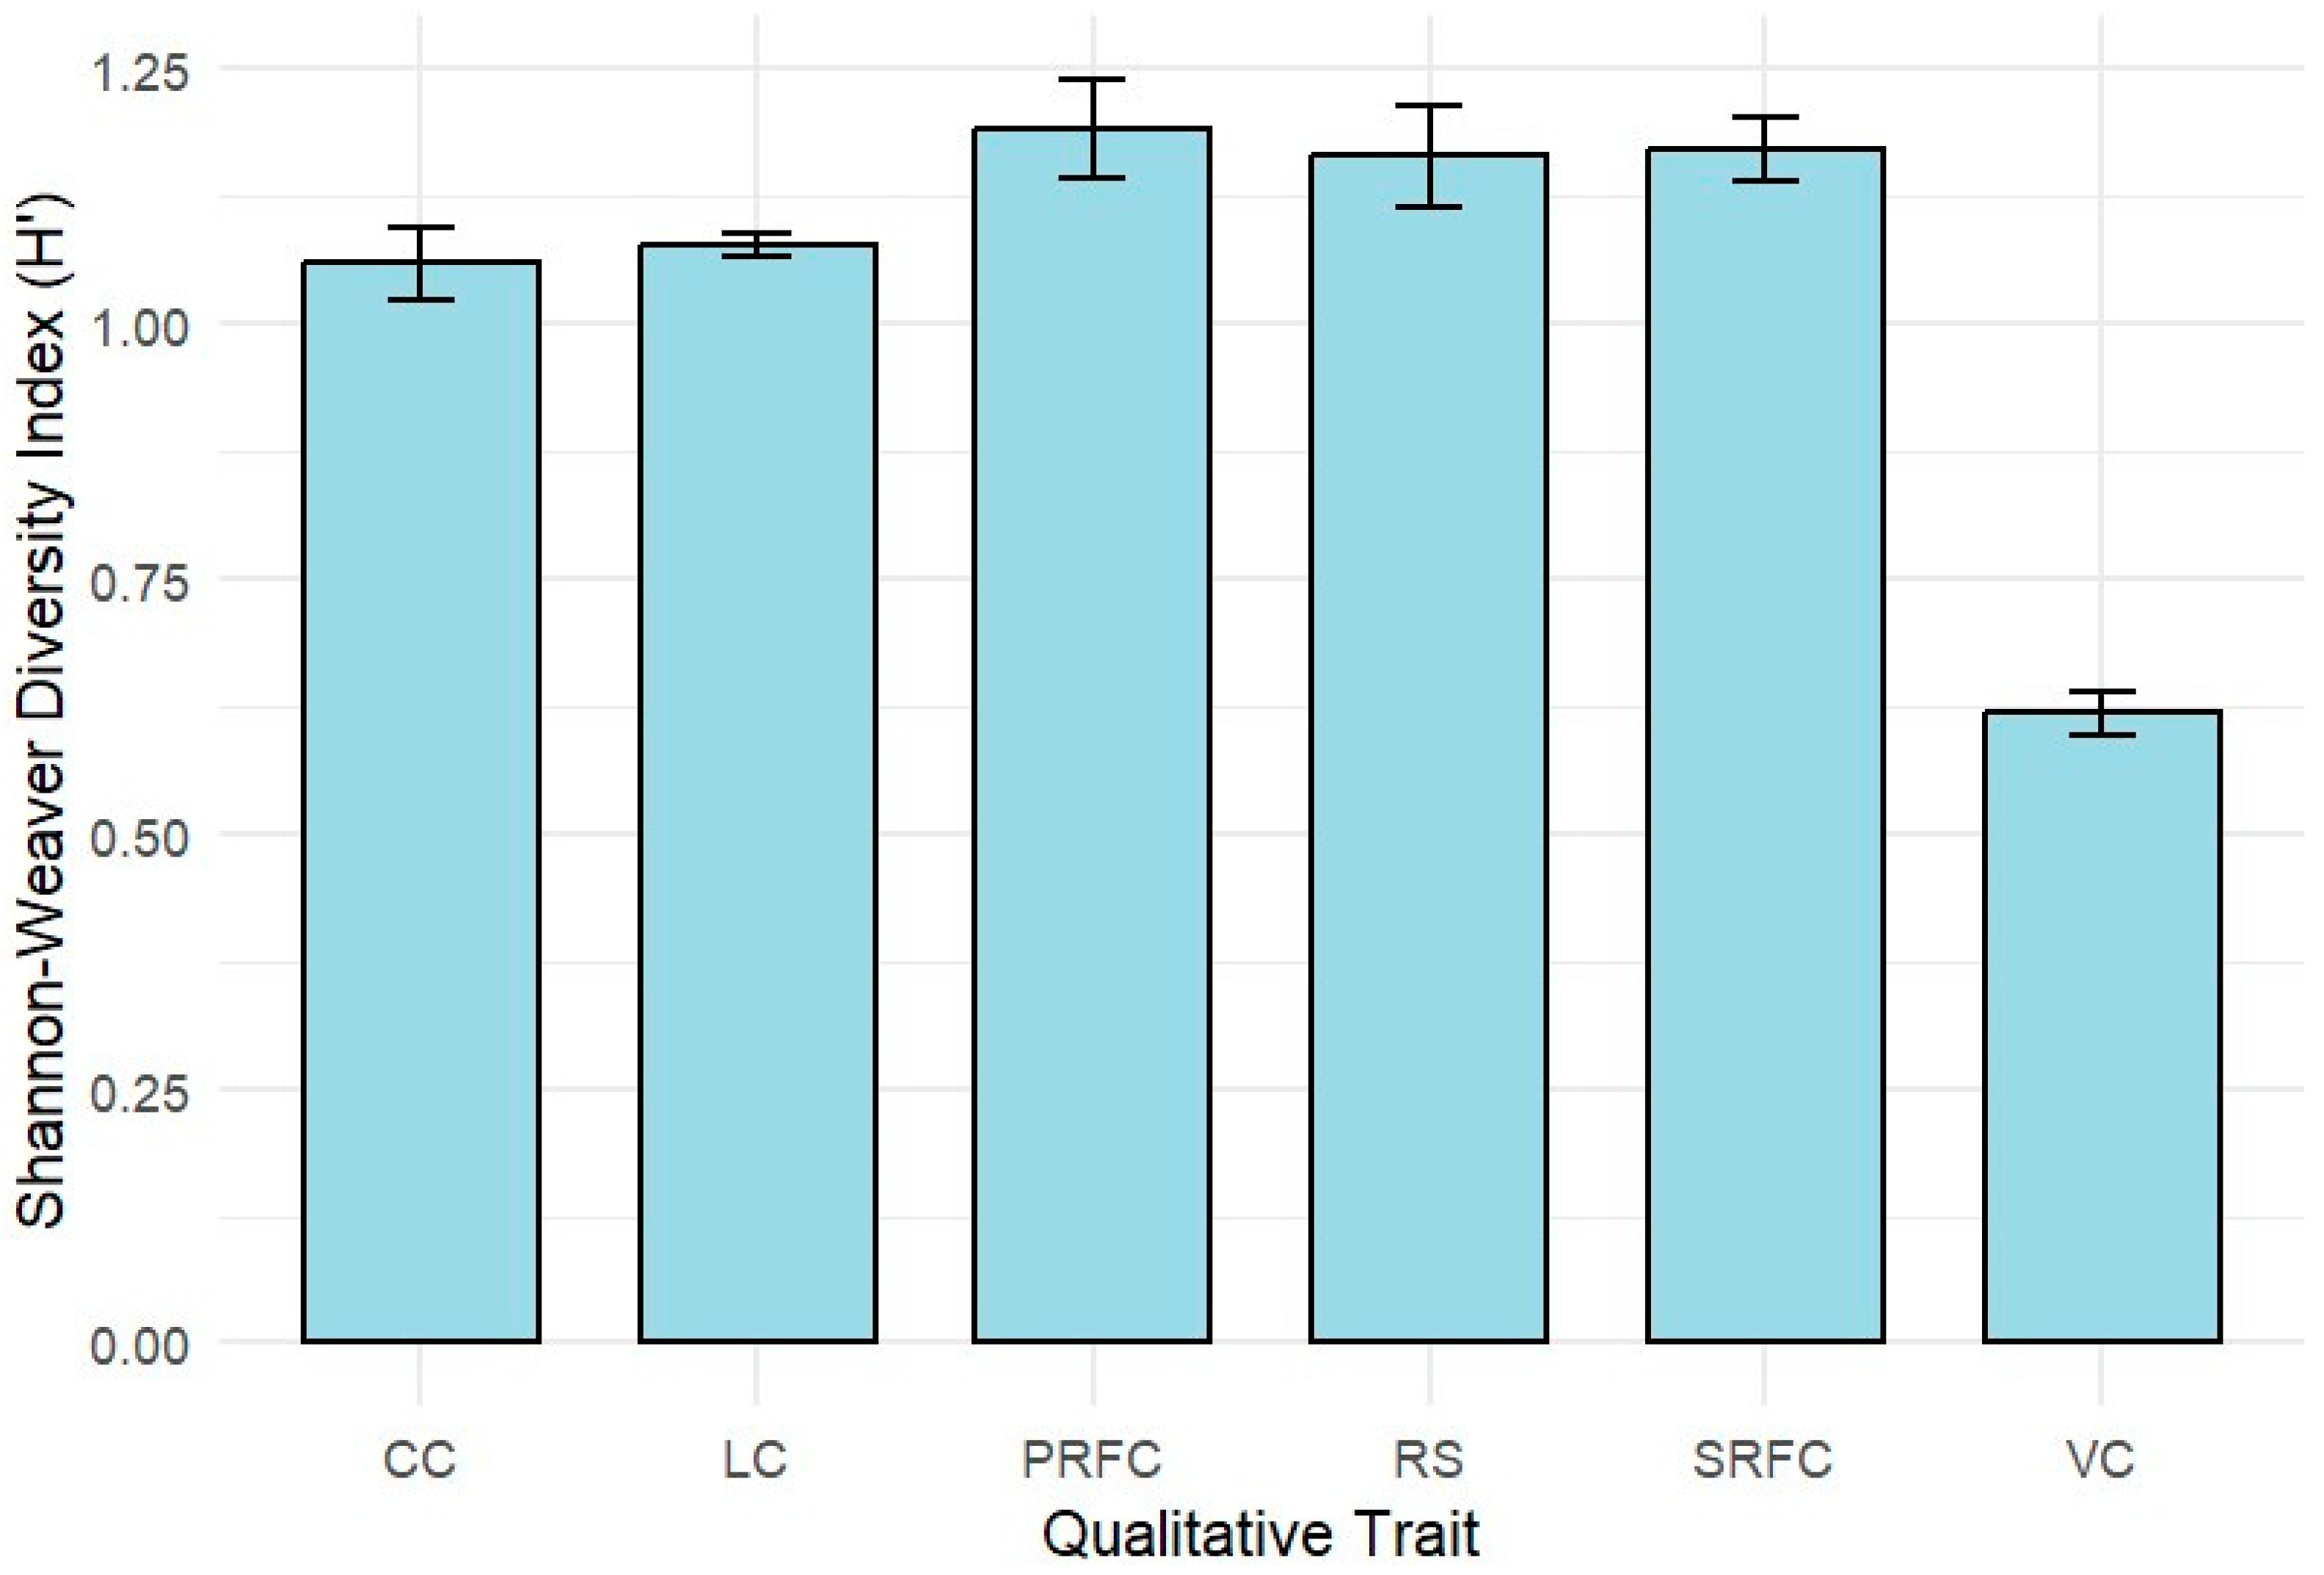
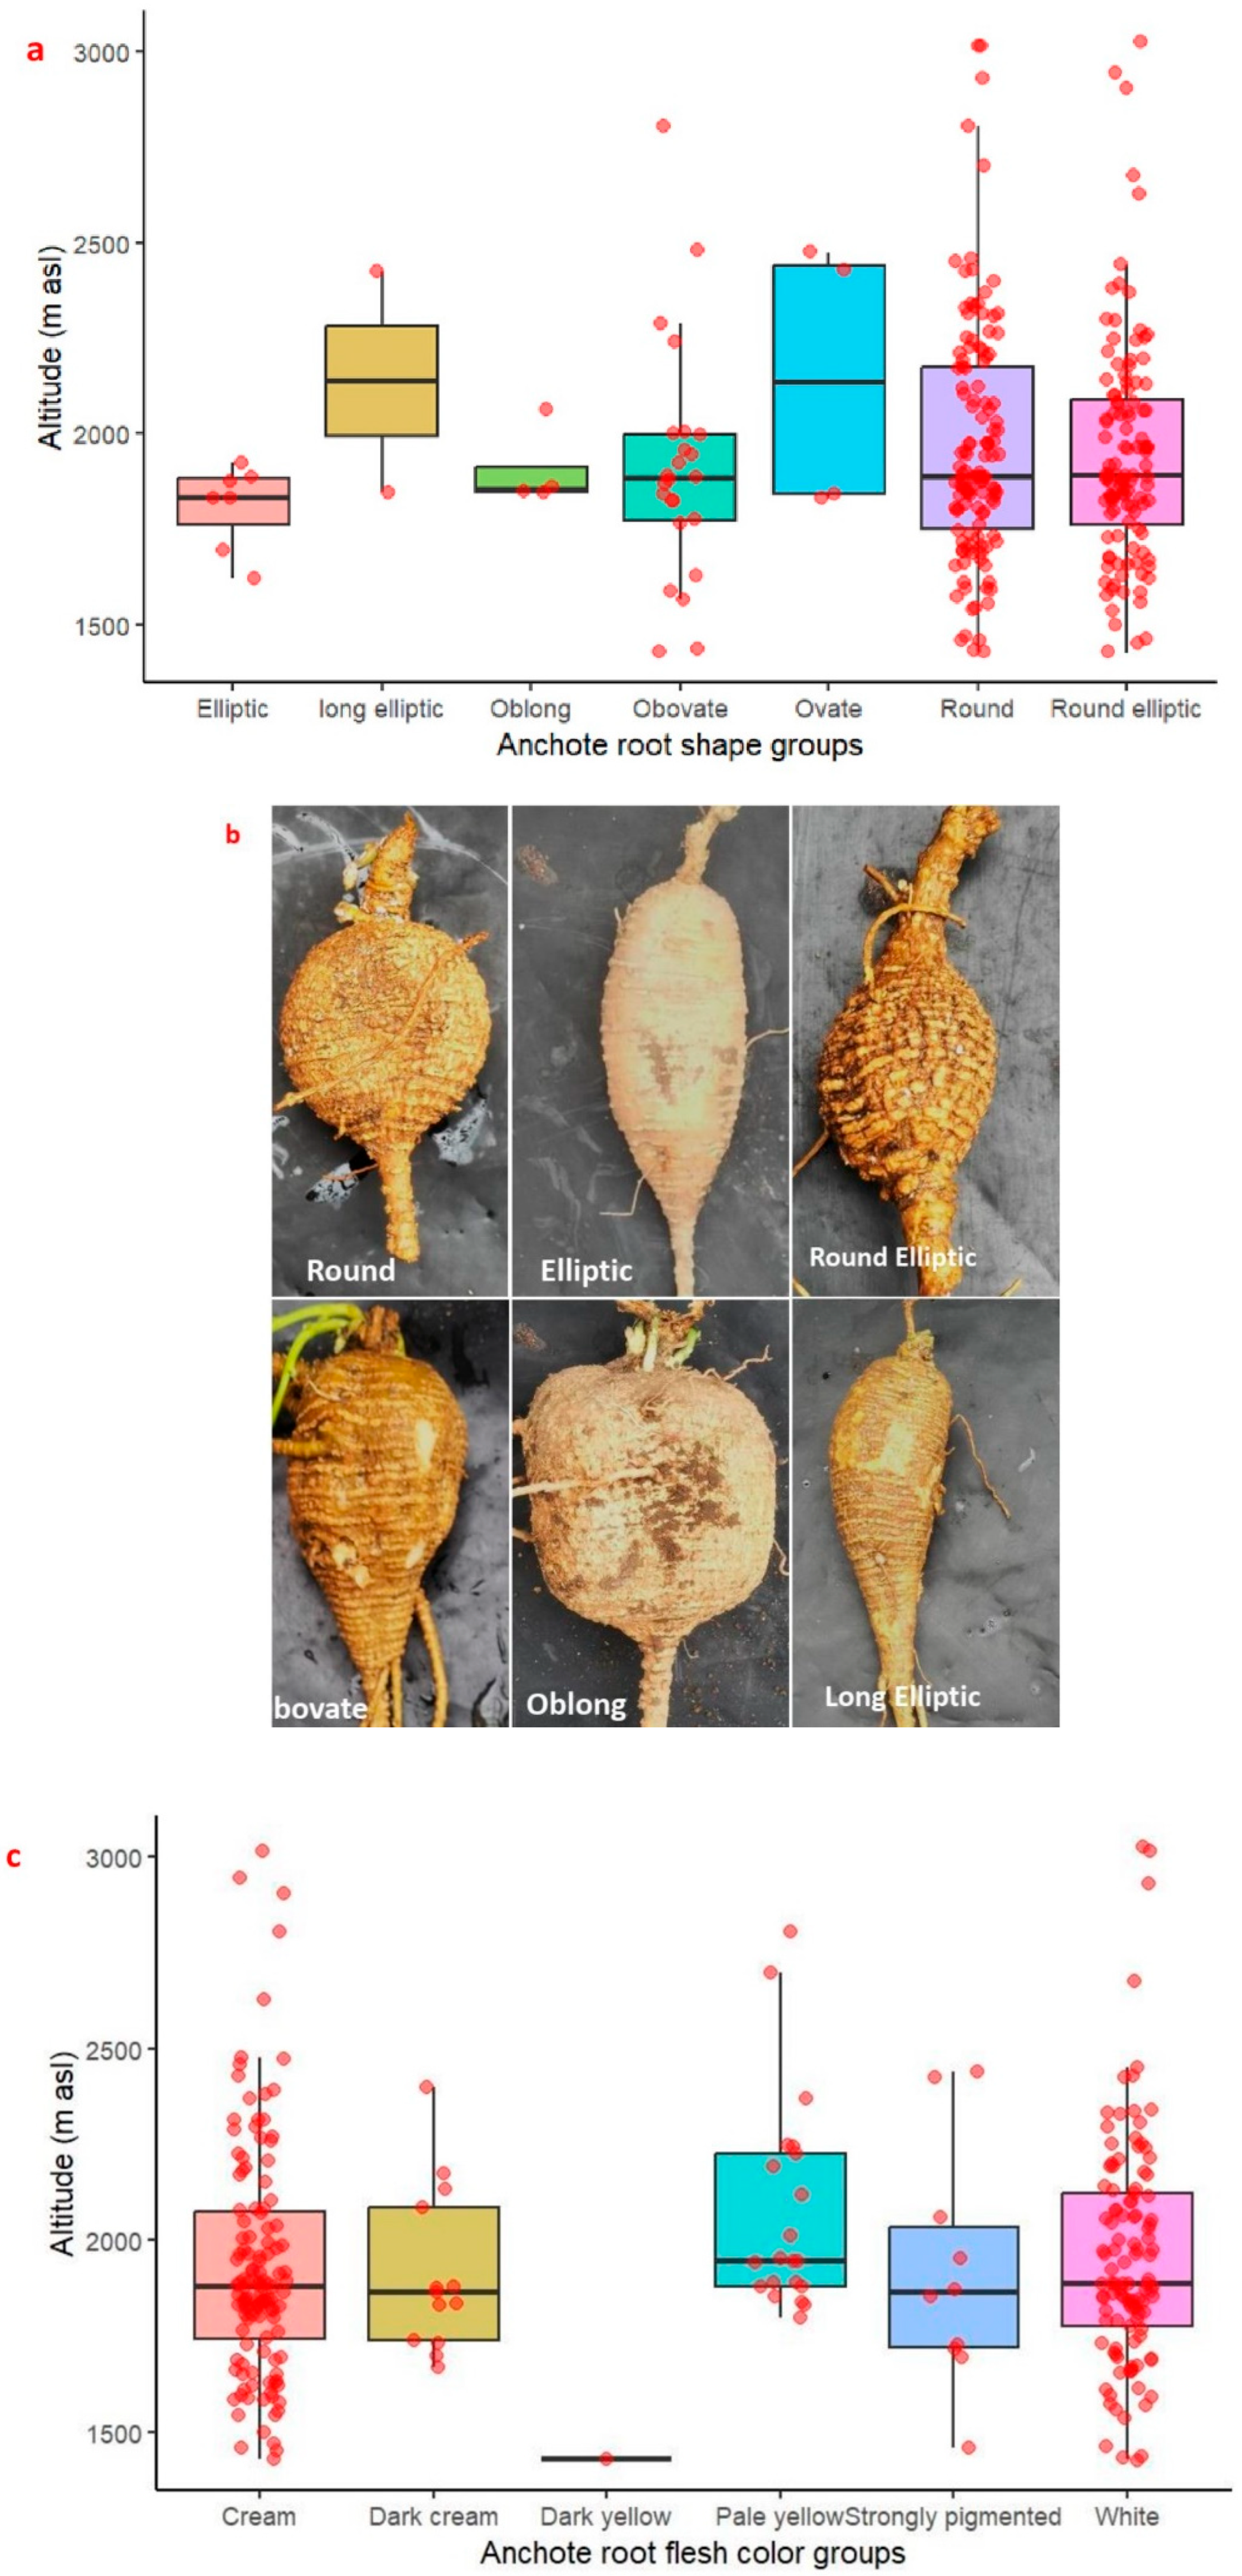
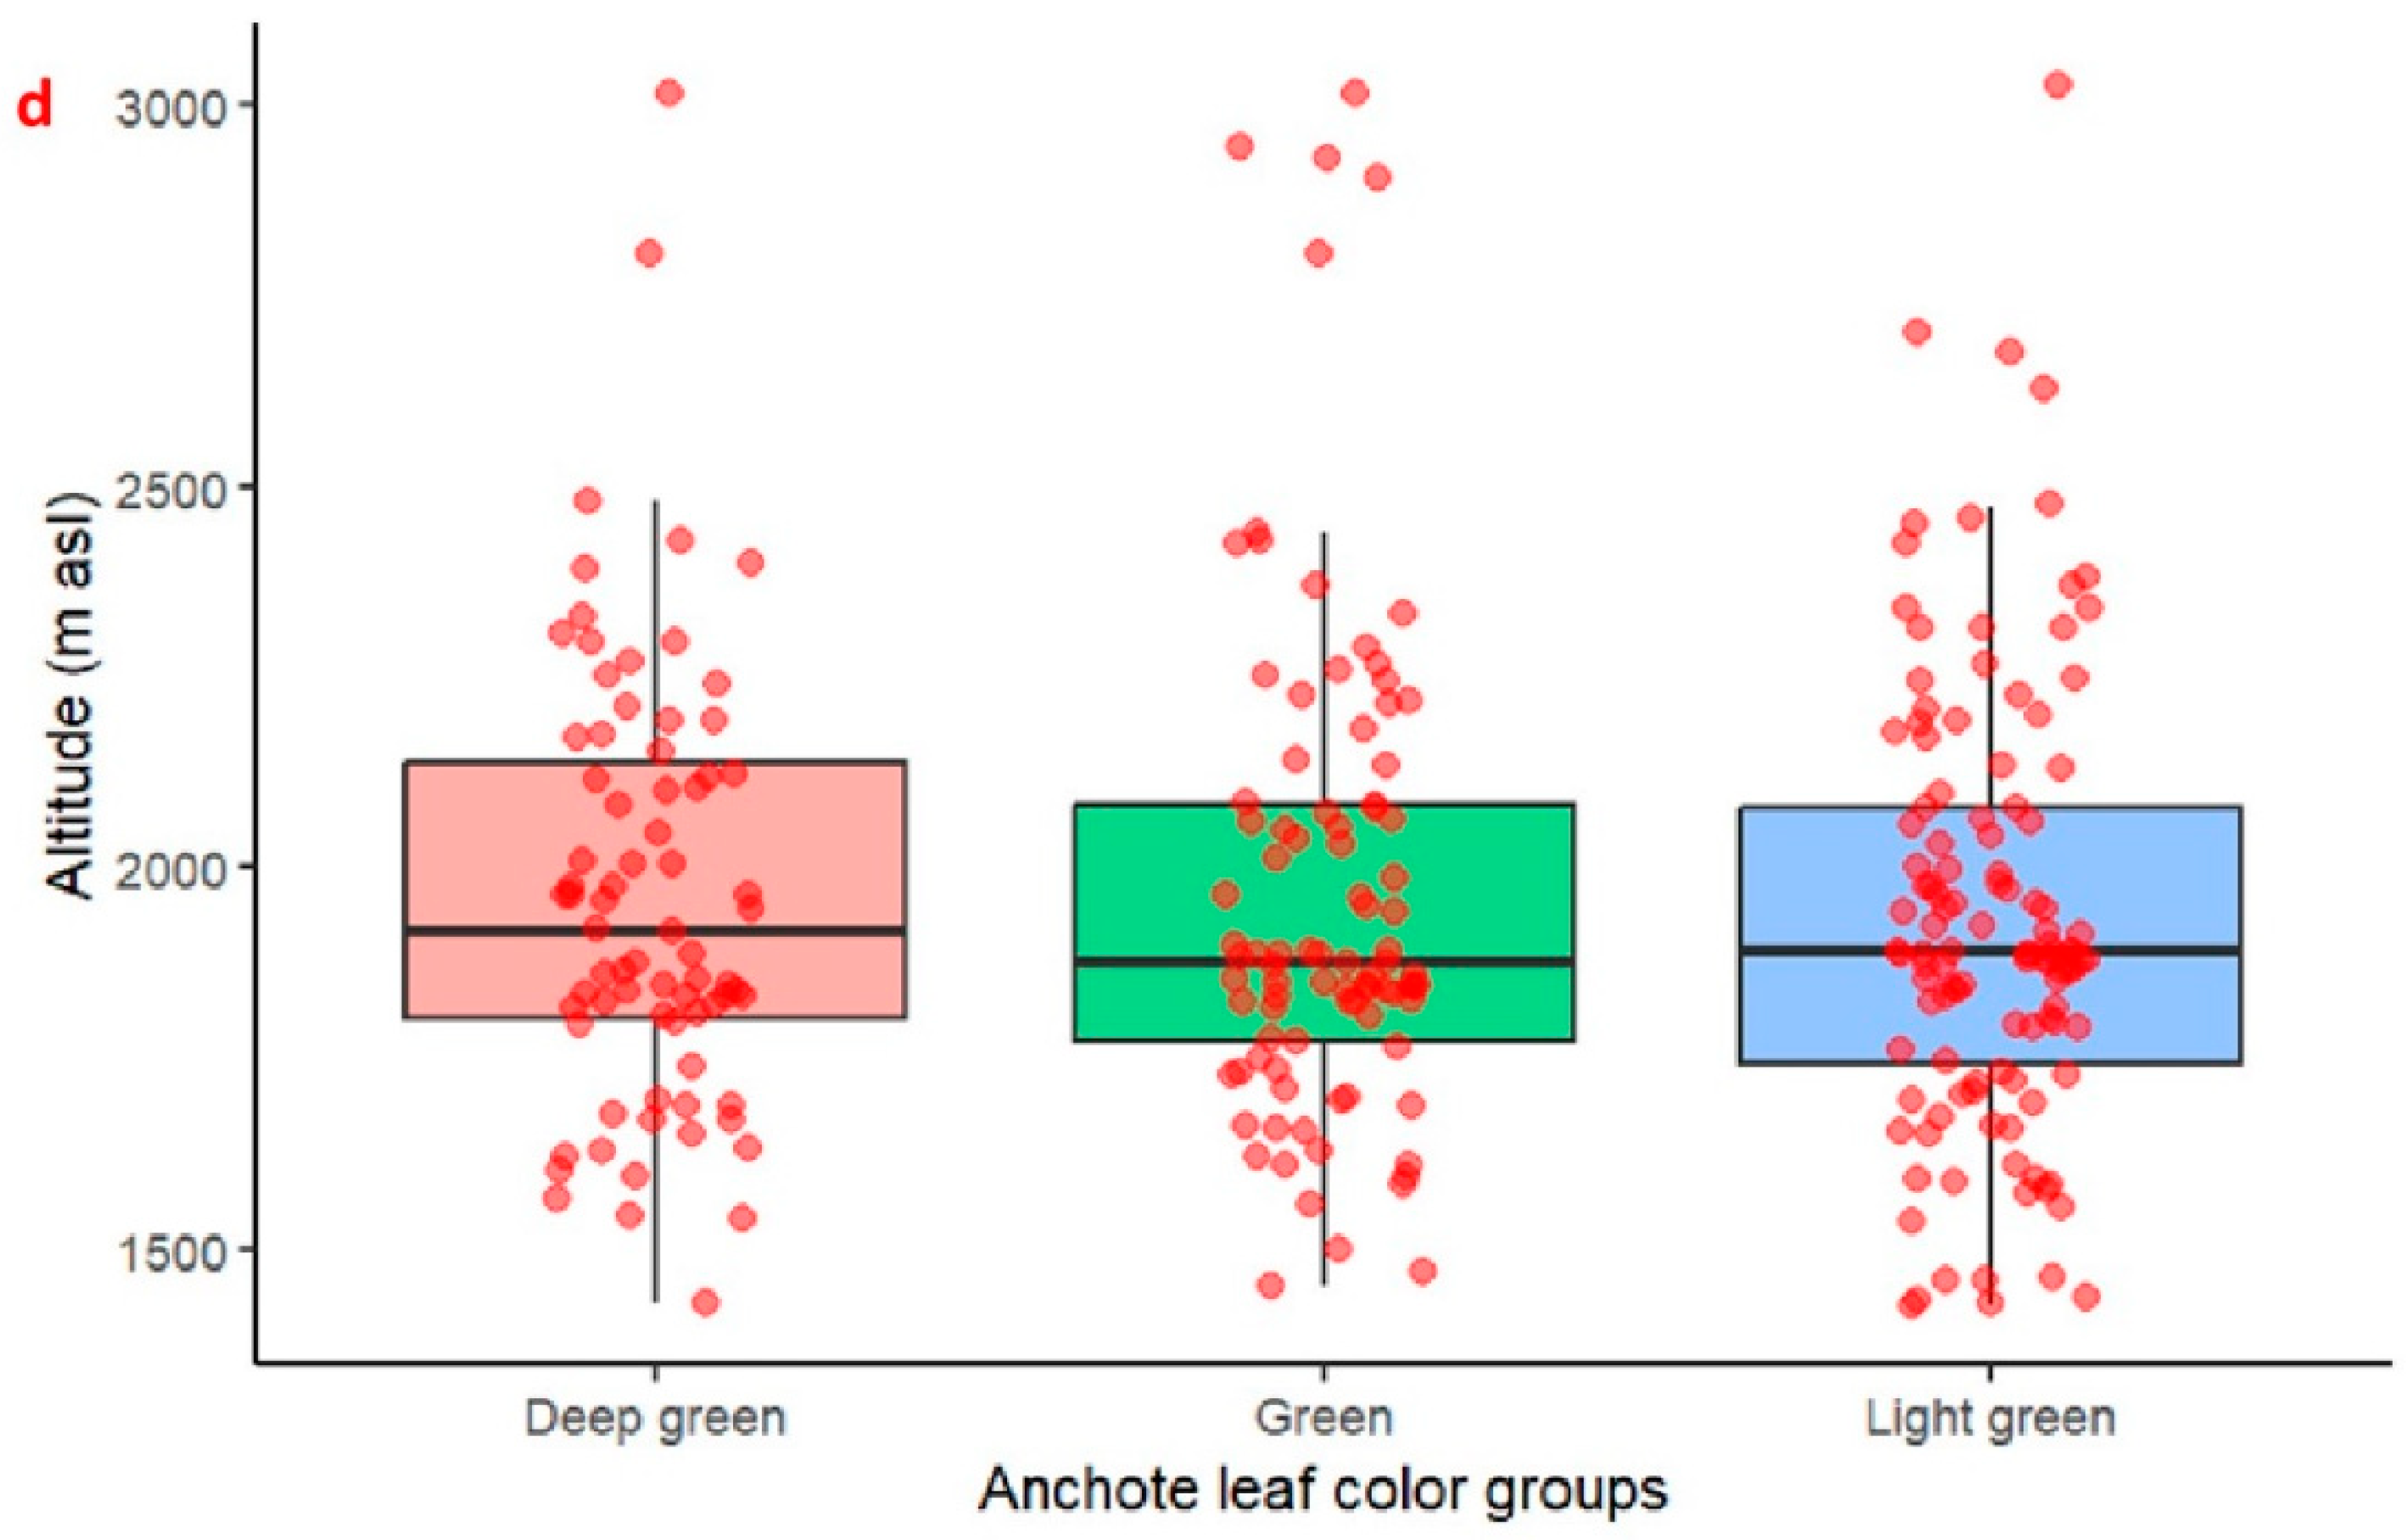
2.1. Agro-Morphological Trait Diversity of Anchote Accessions Based on Qualitative Traits
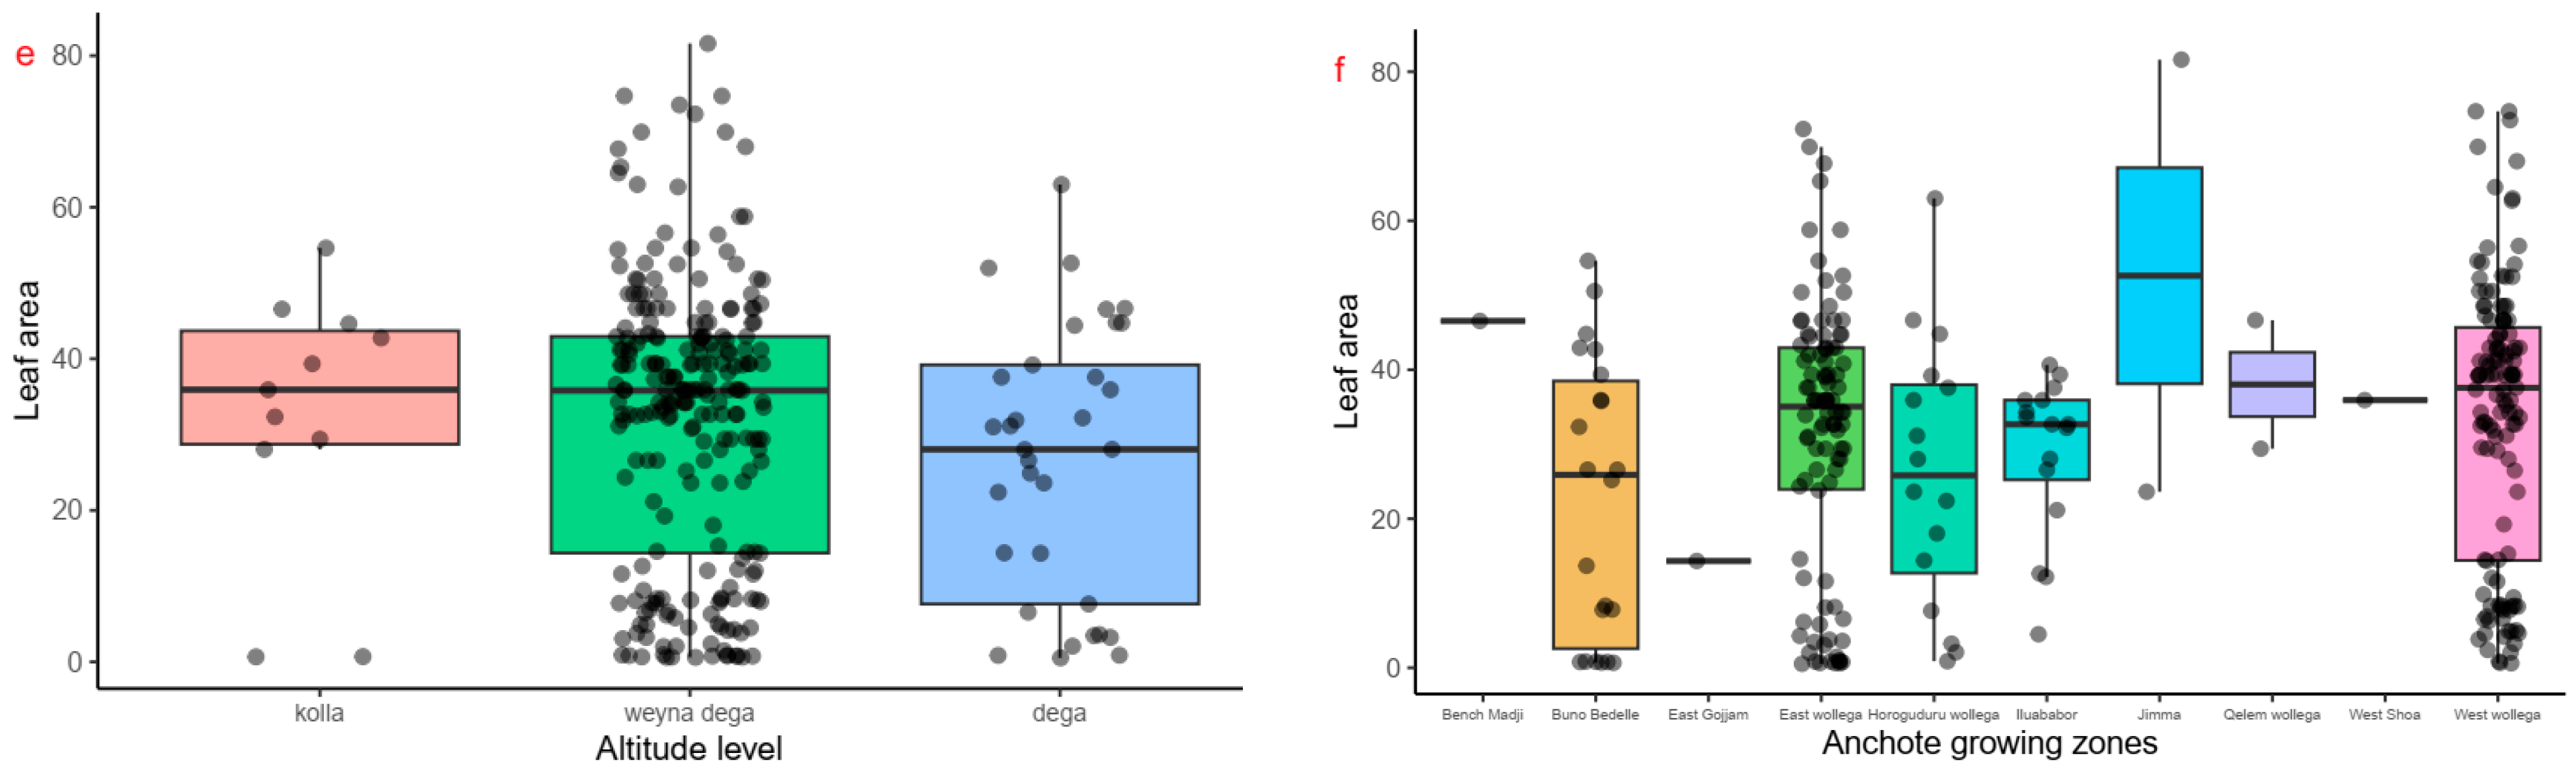
2.2. Quantitative Agro-Morphological and Physiological Trait Variability of Anchote Accessions
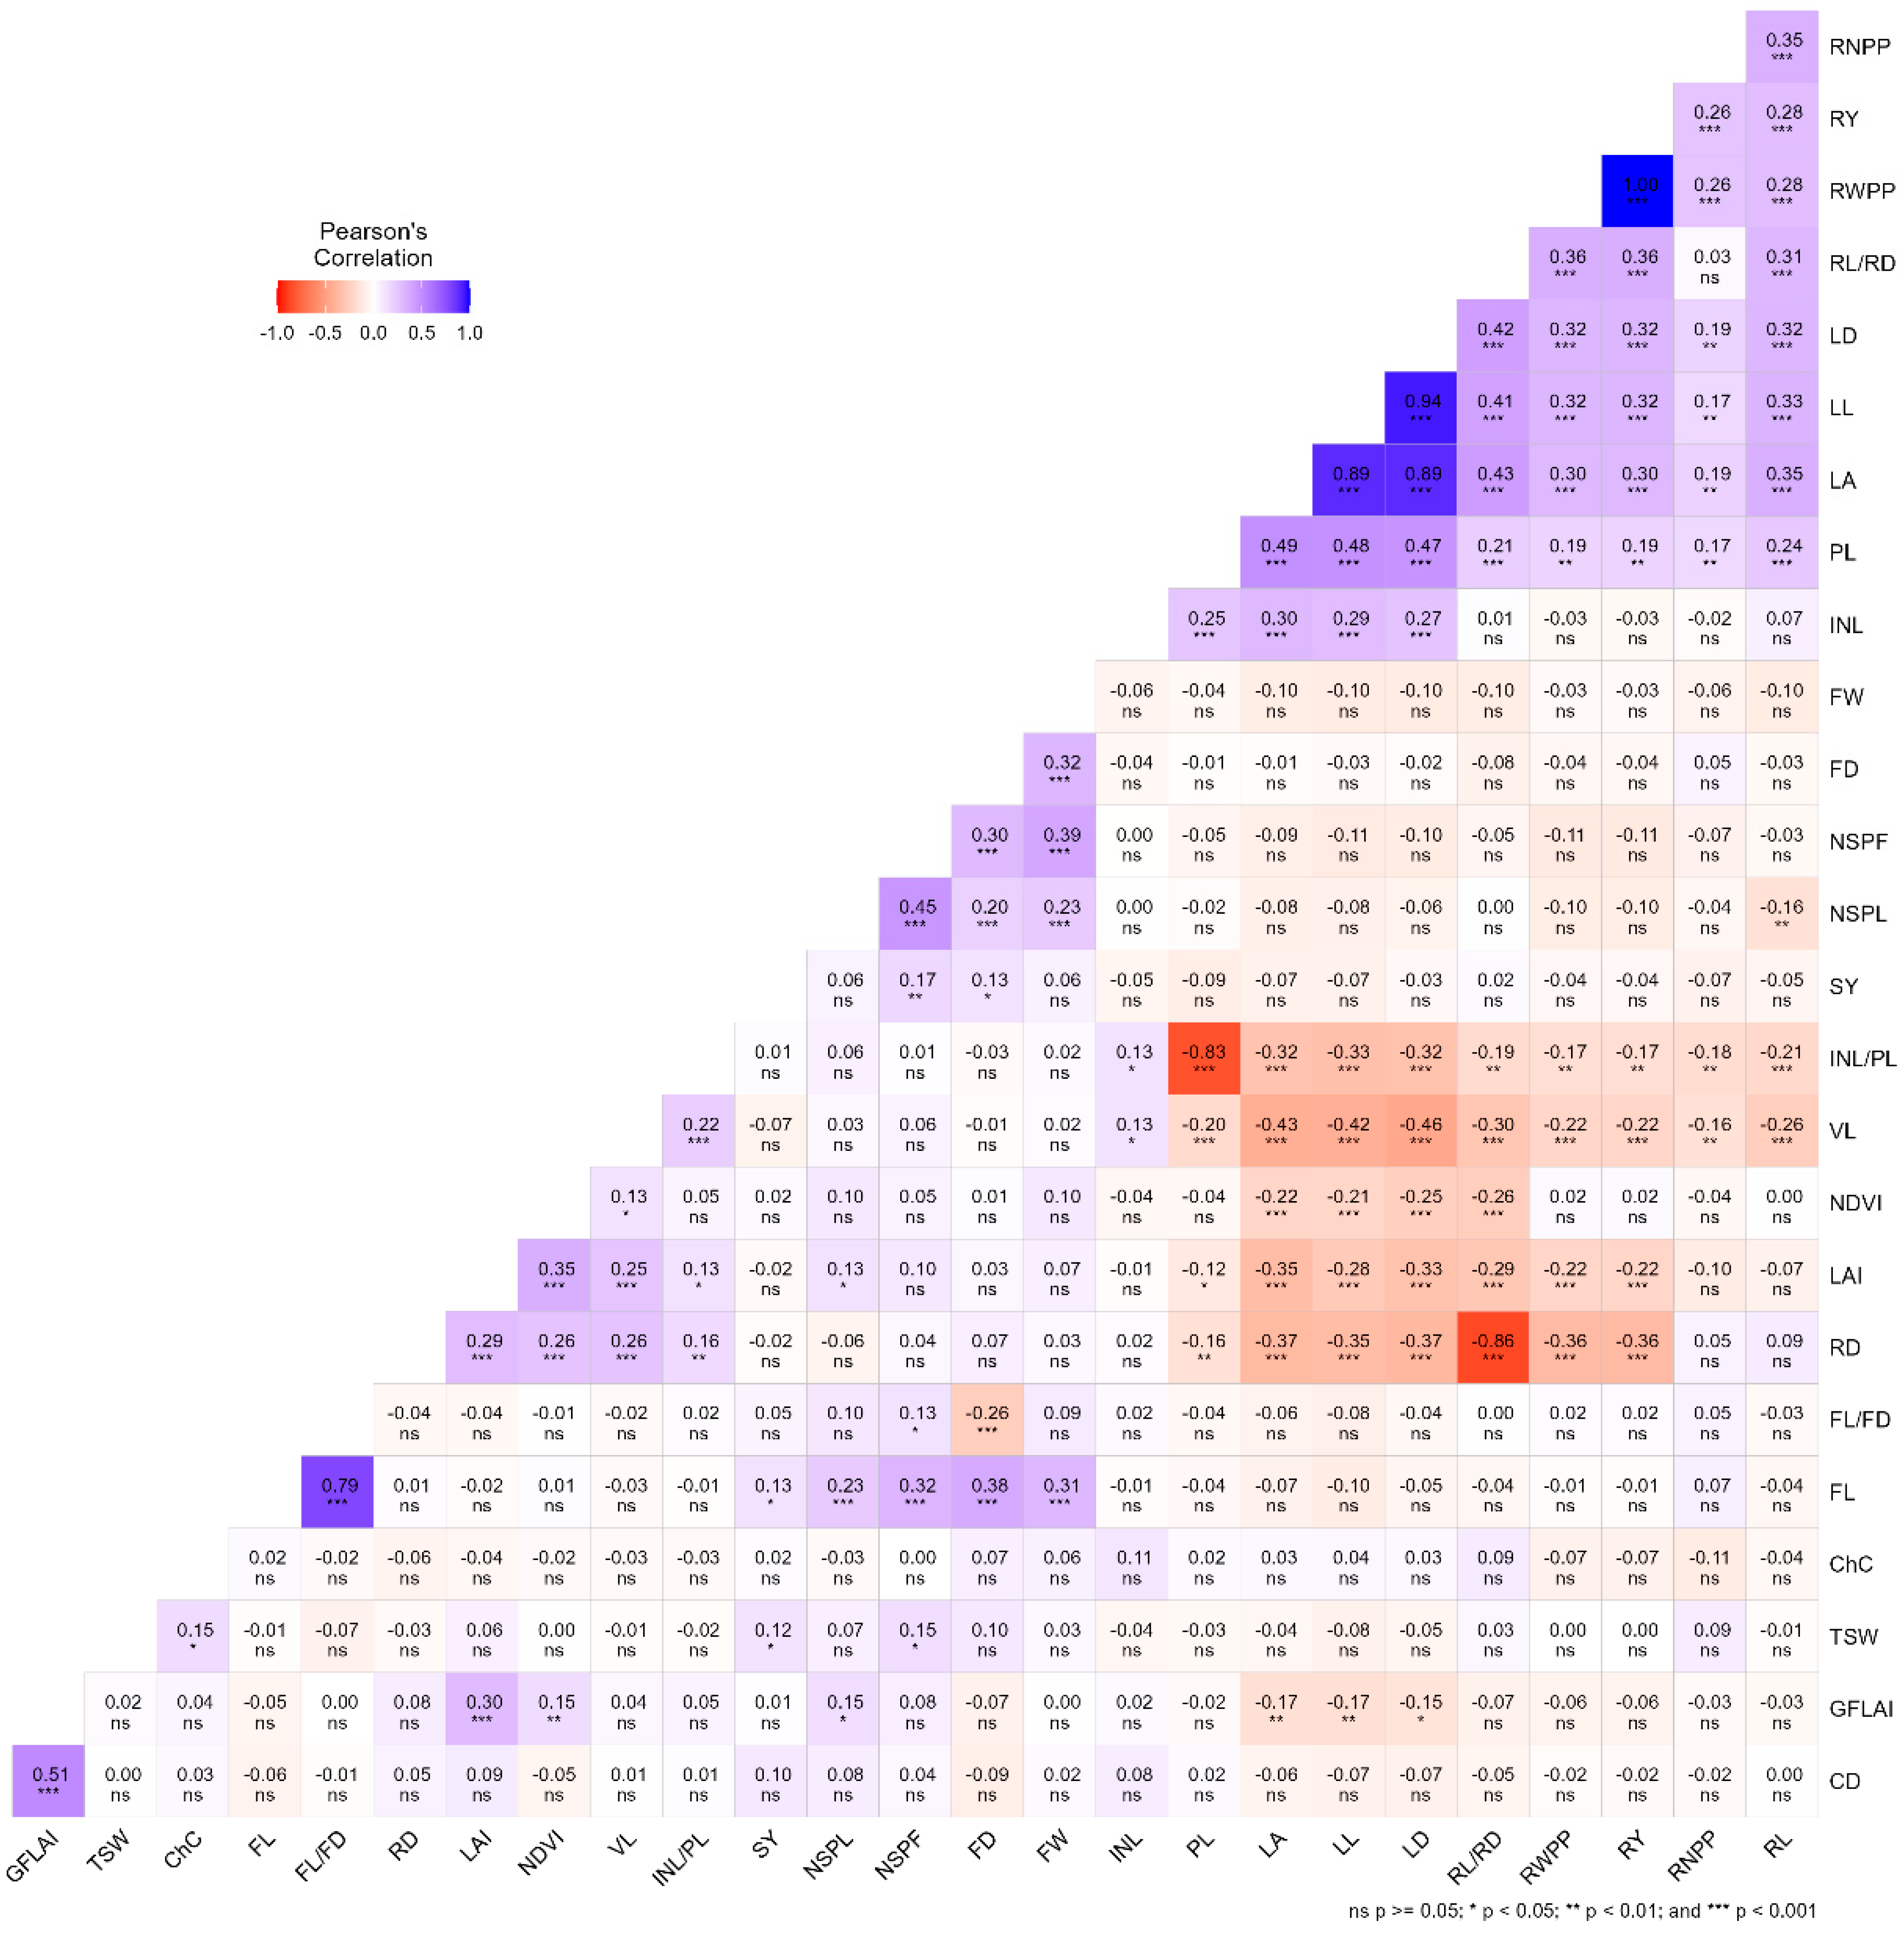
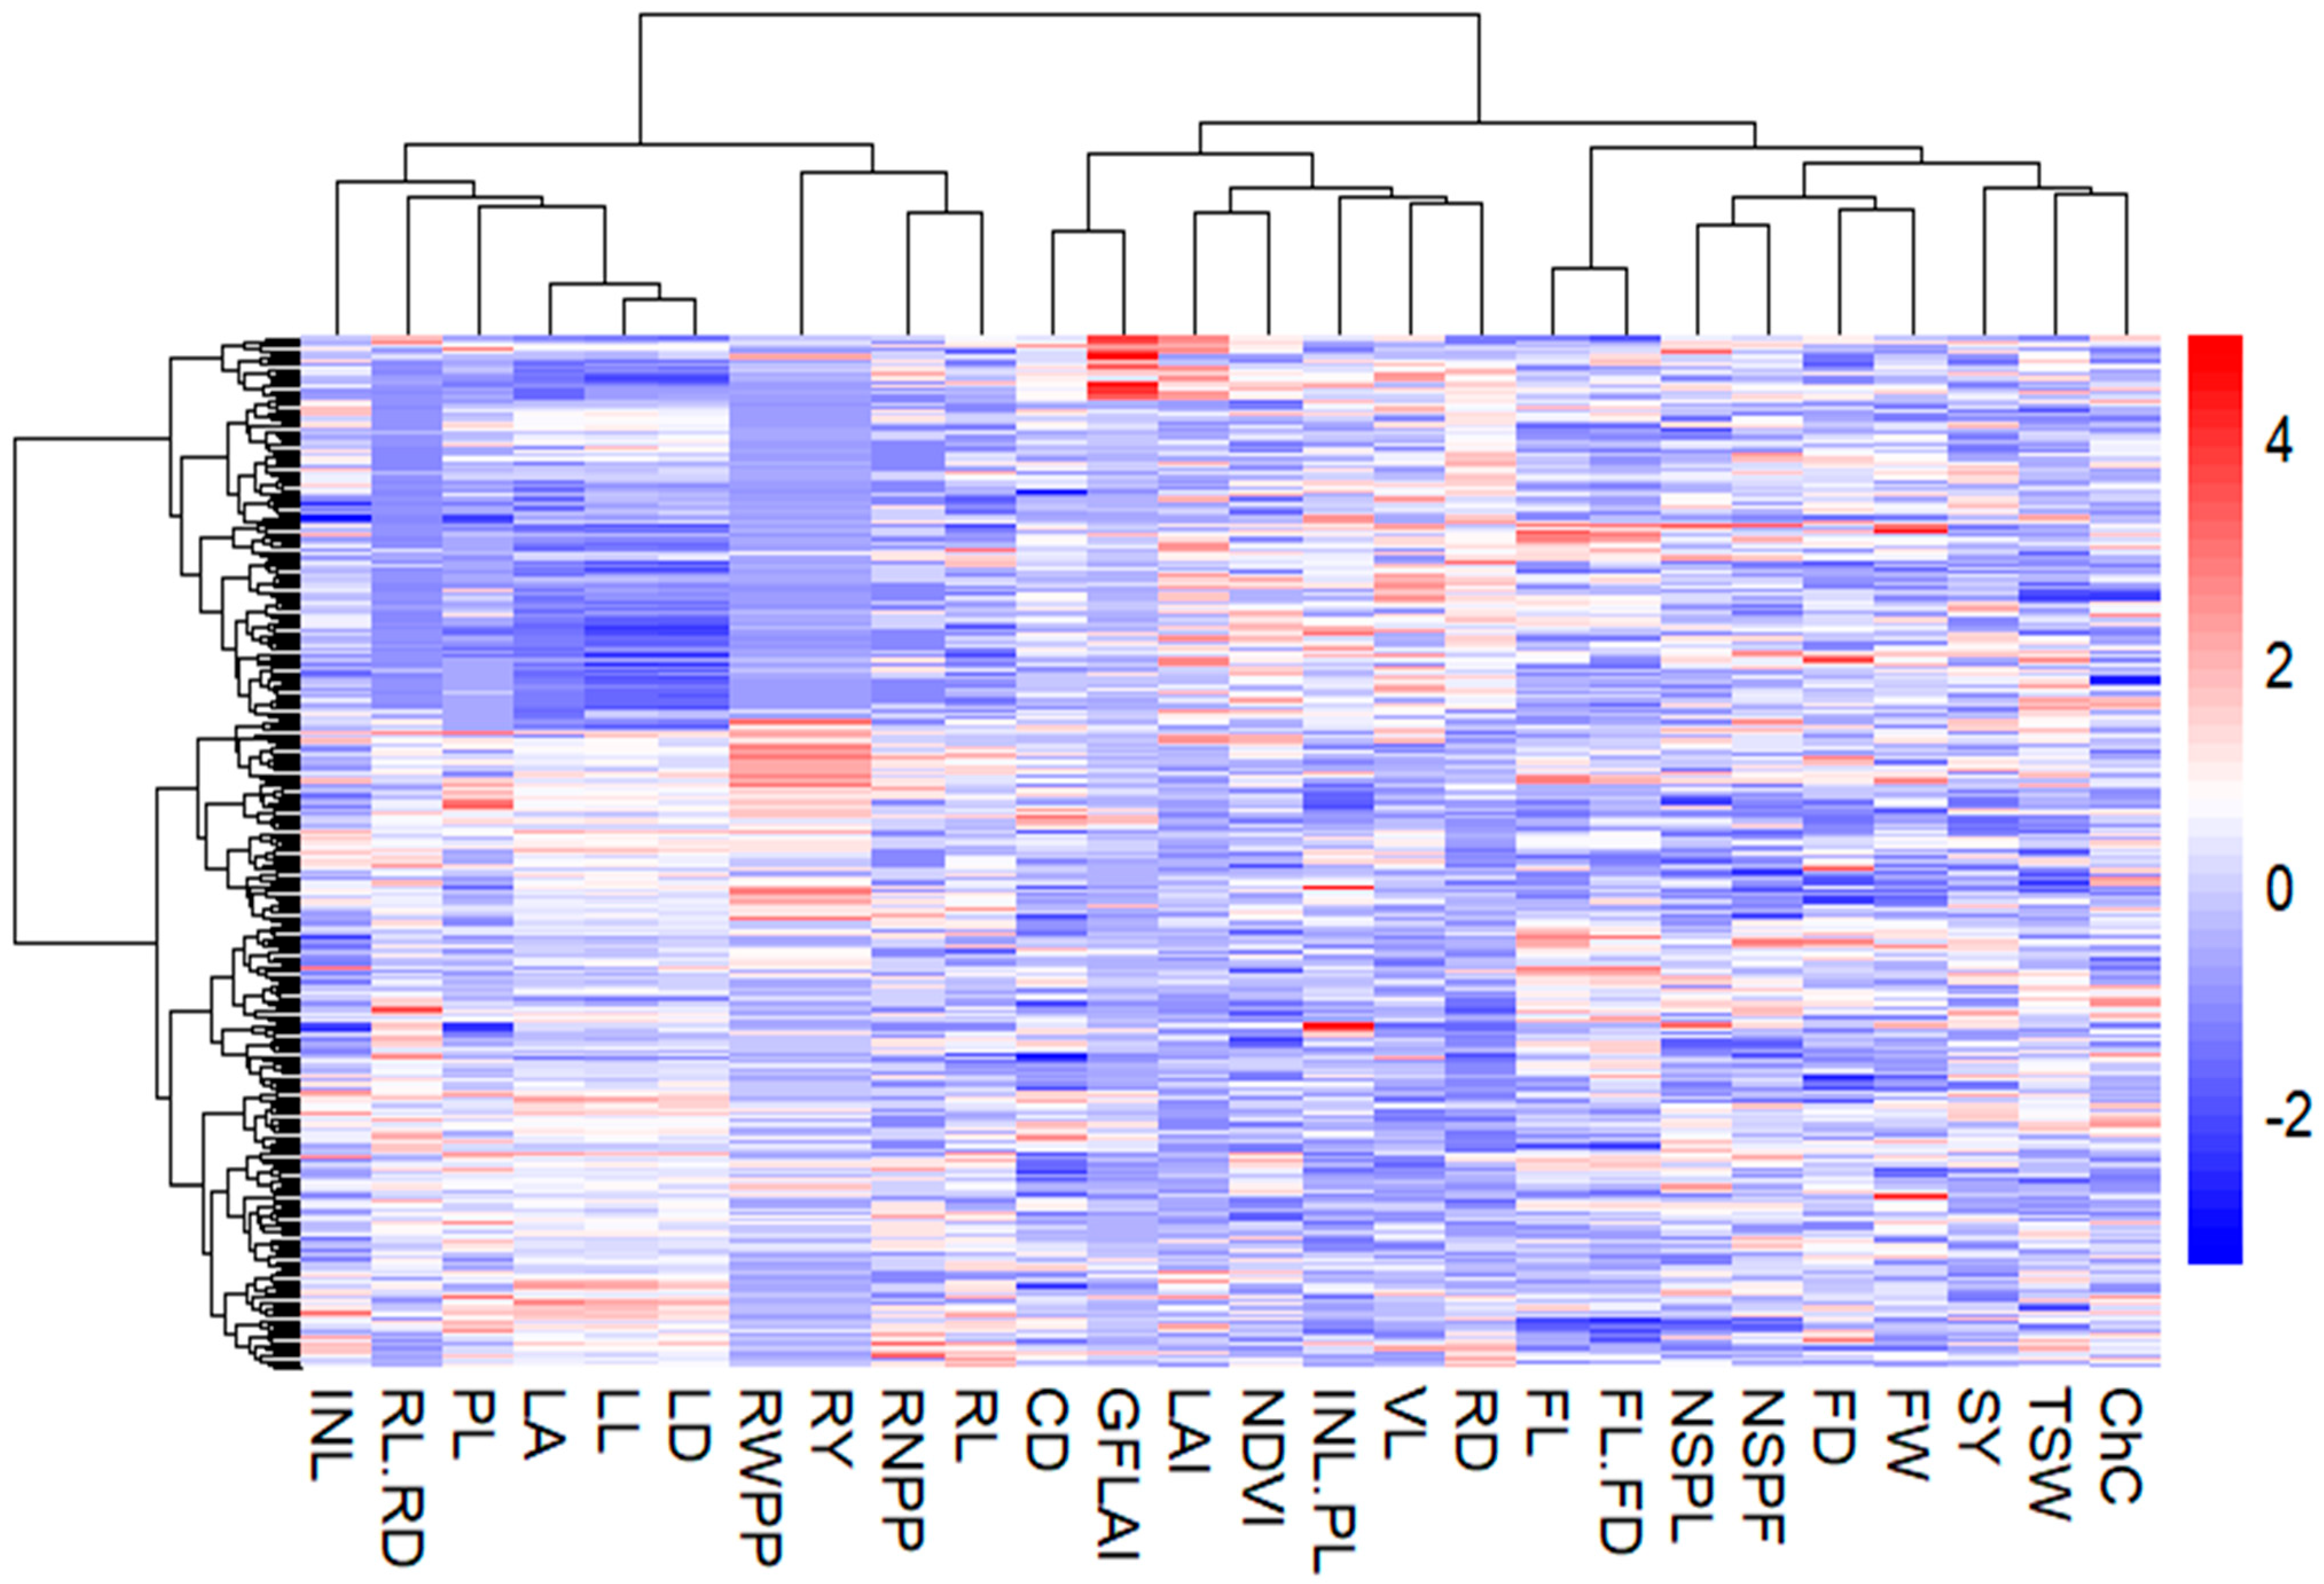
2.3. Inter-Trait Association of Quantitative Traits
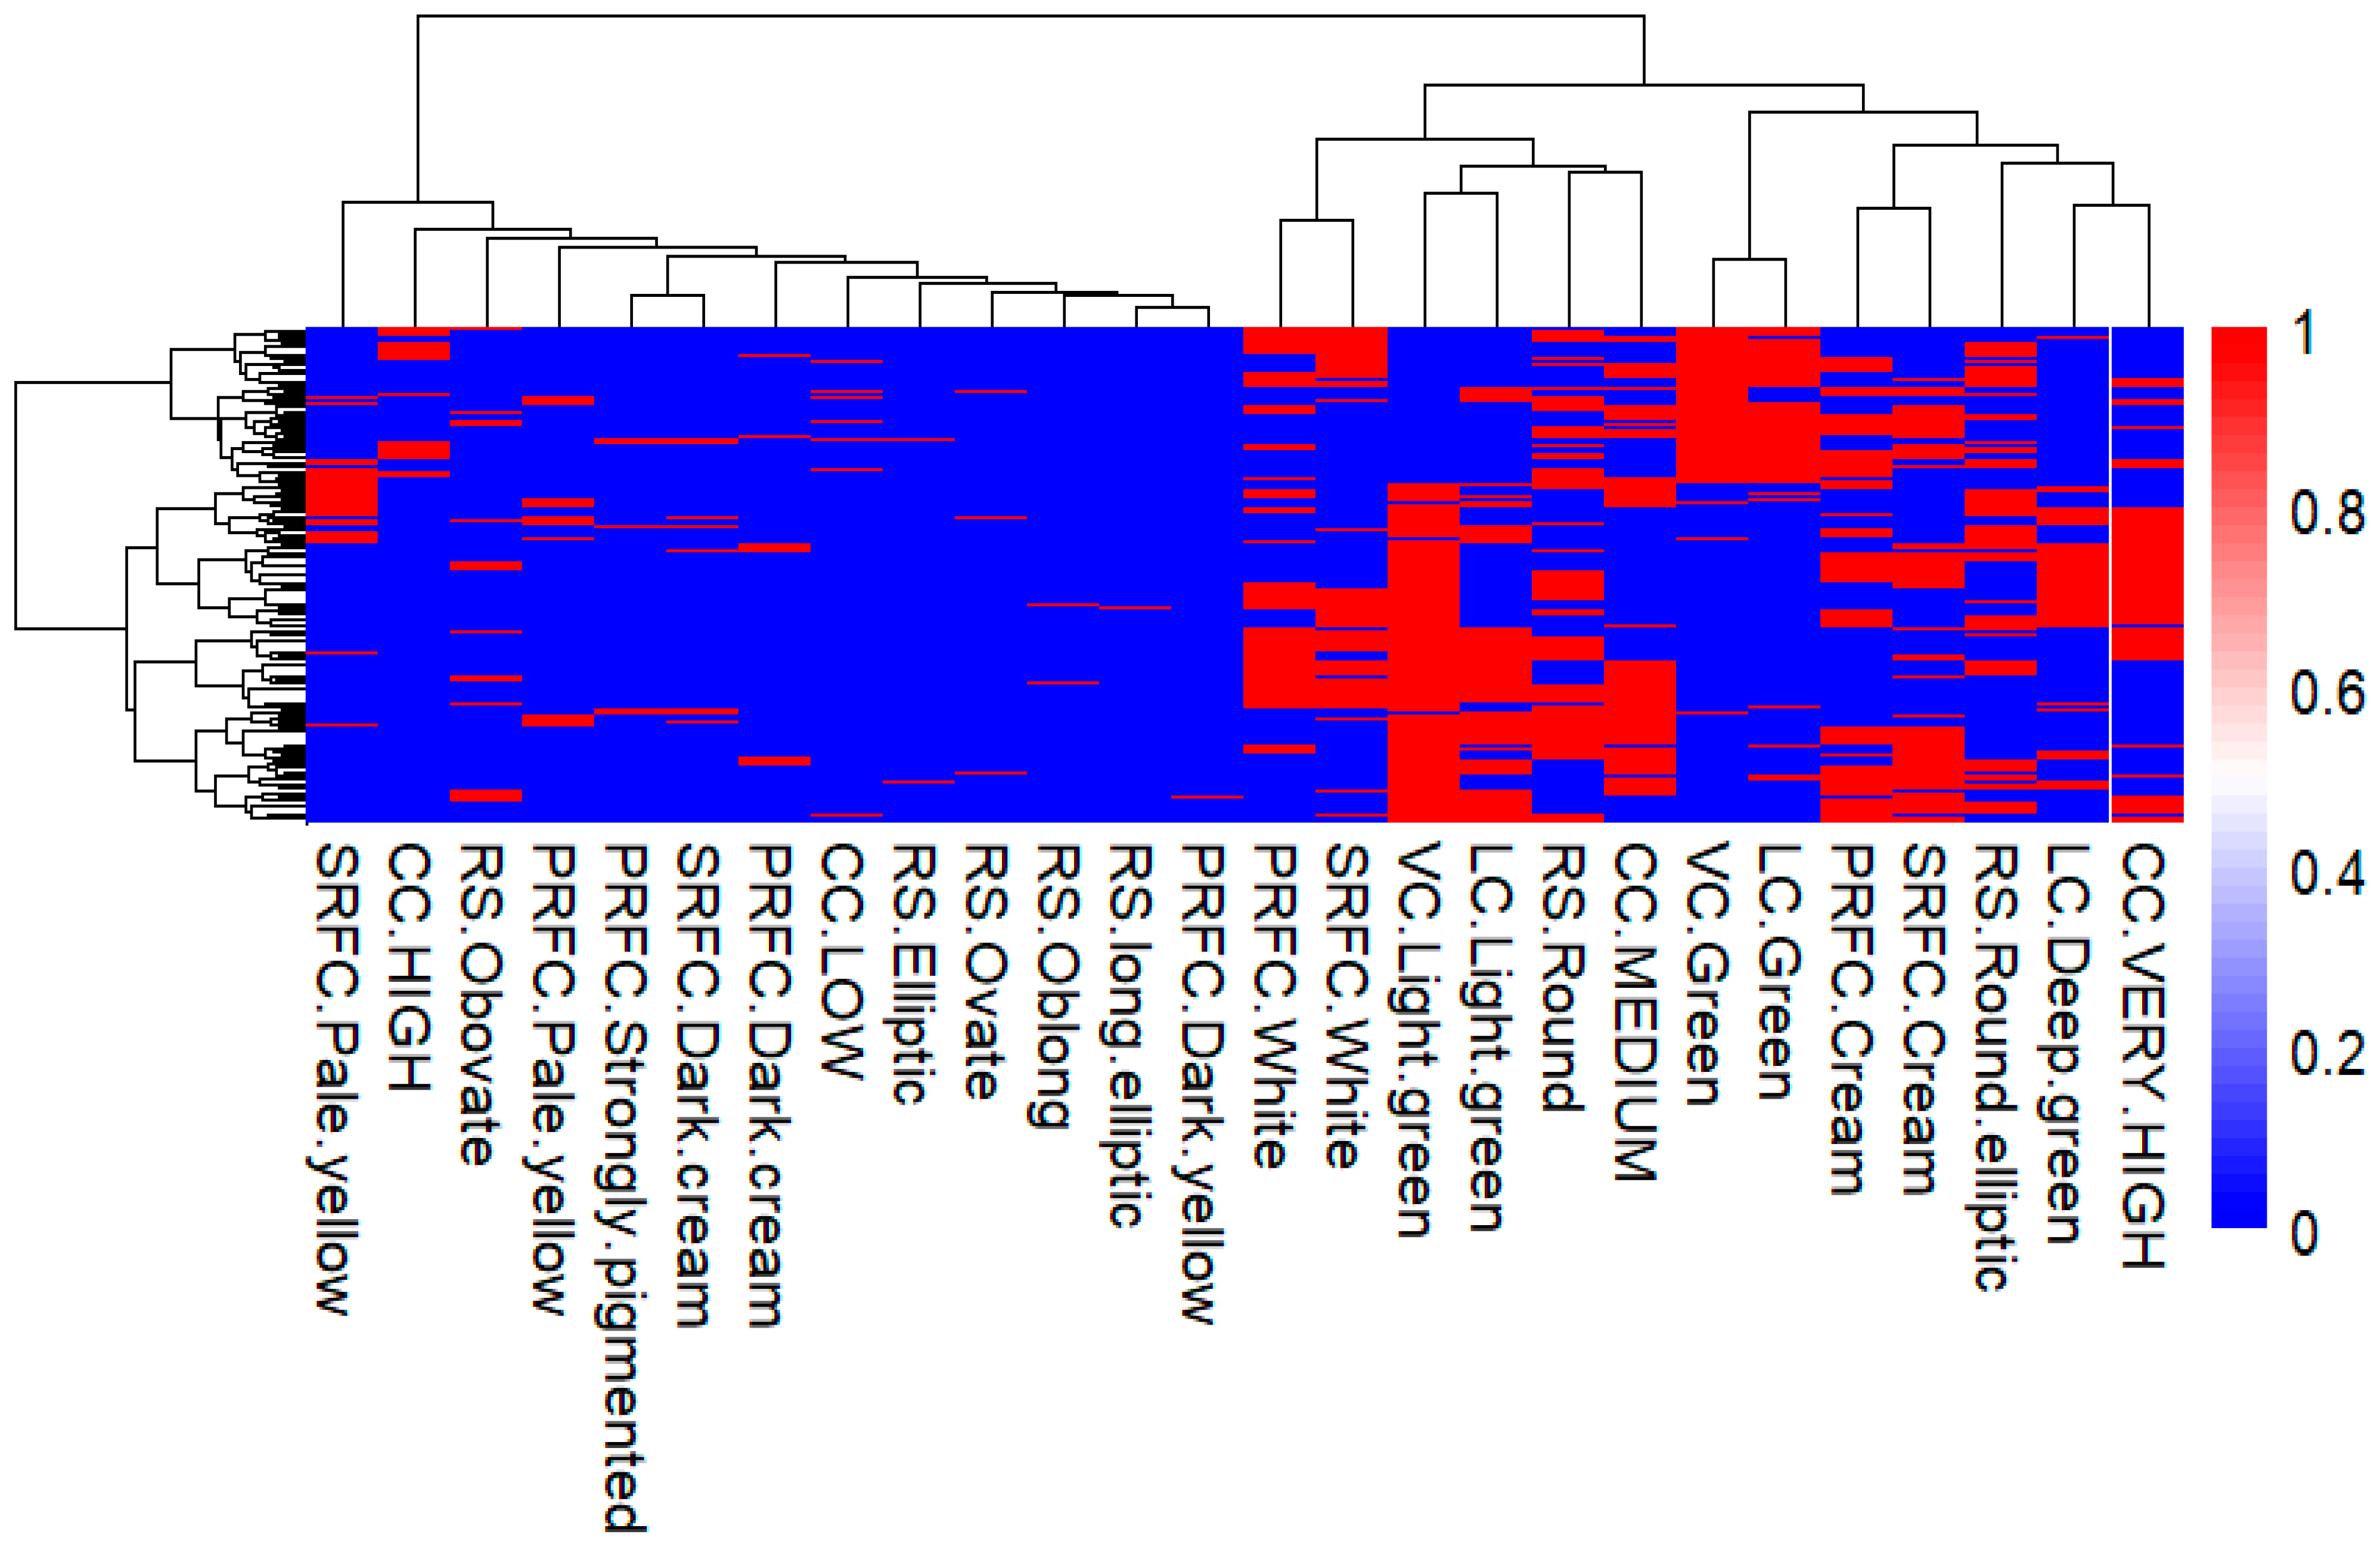
2.3.1. Principal Component Analysis of the Qualitative Morphological Traits
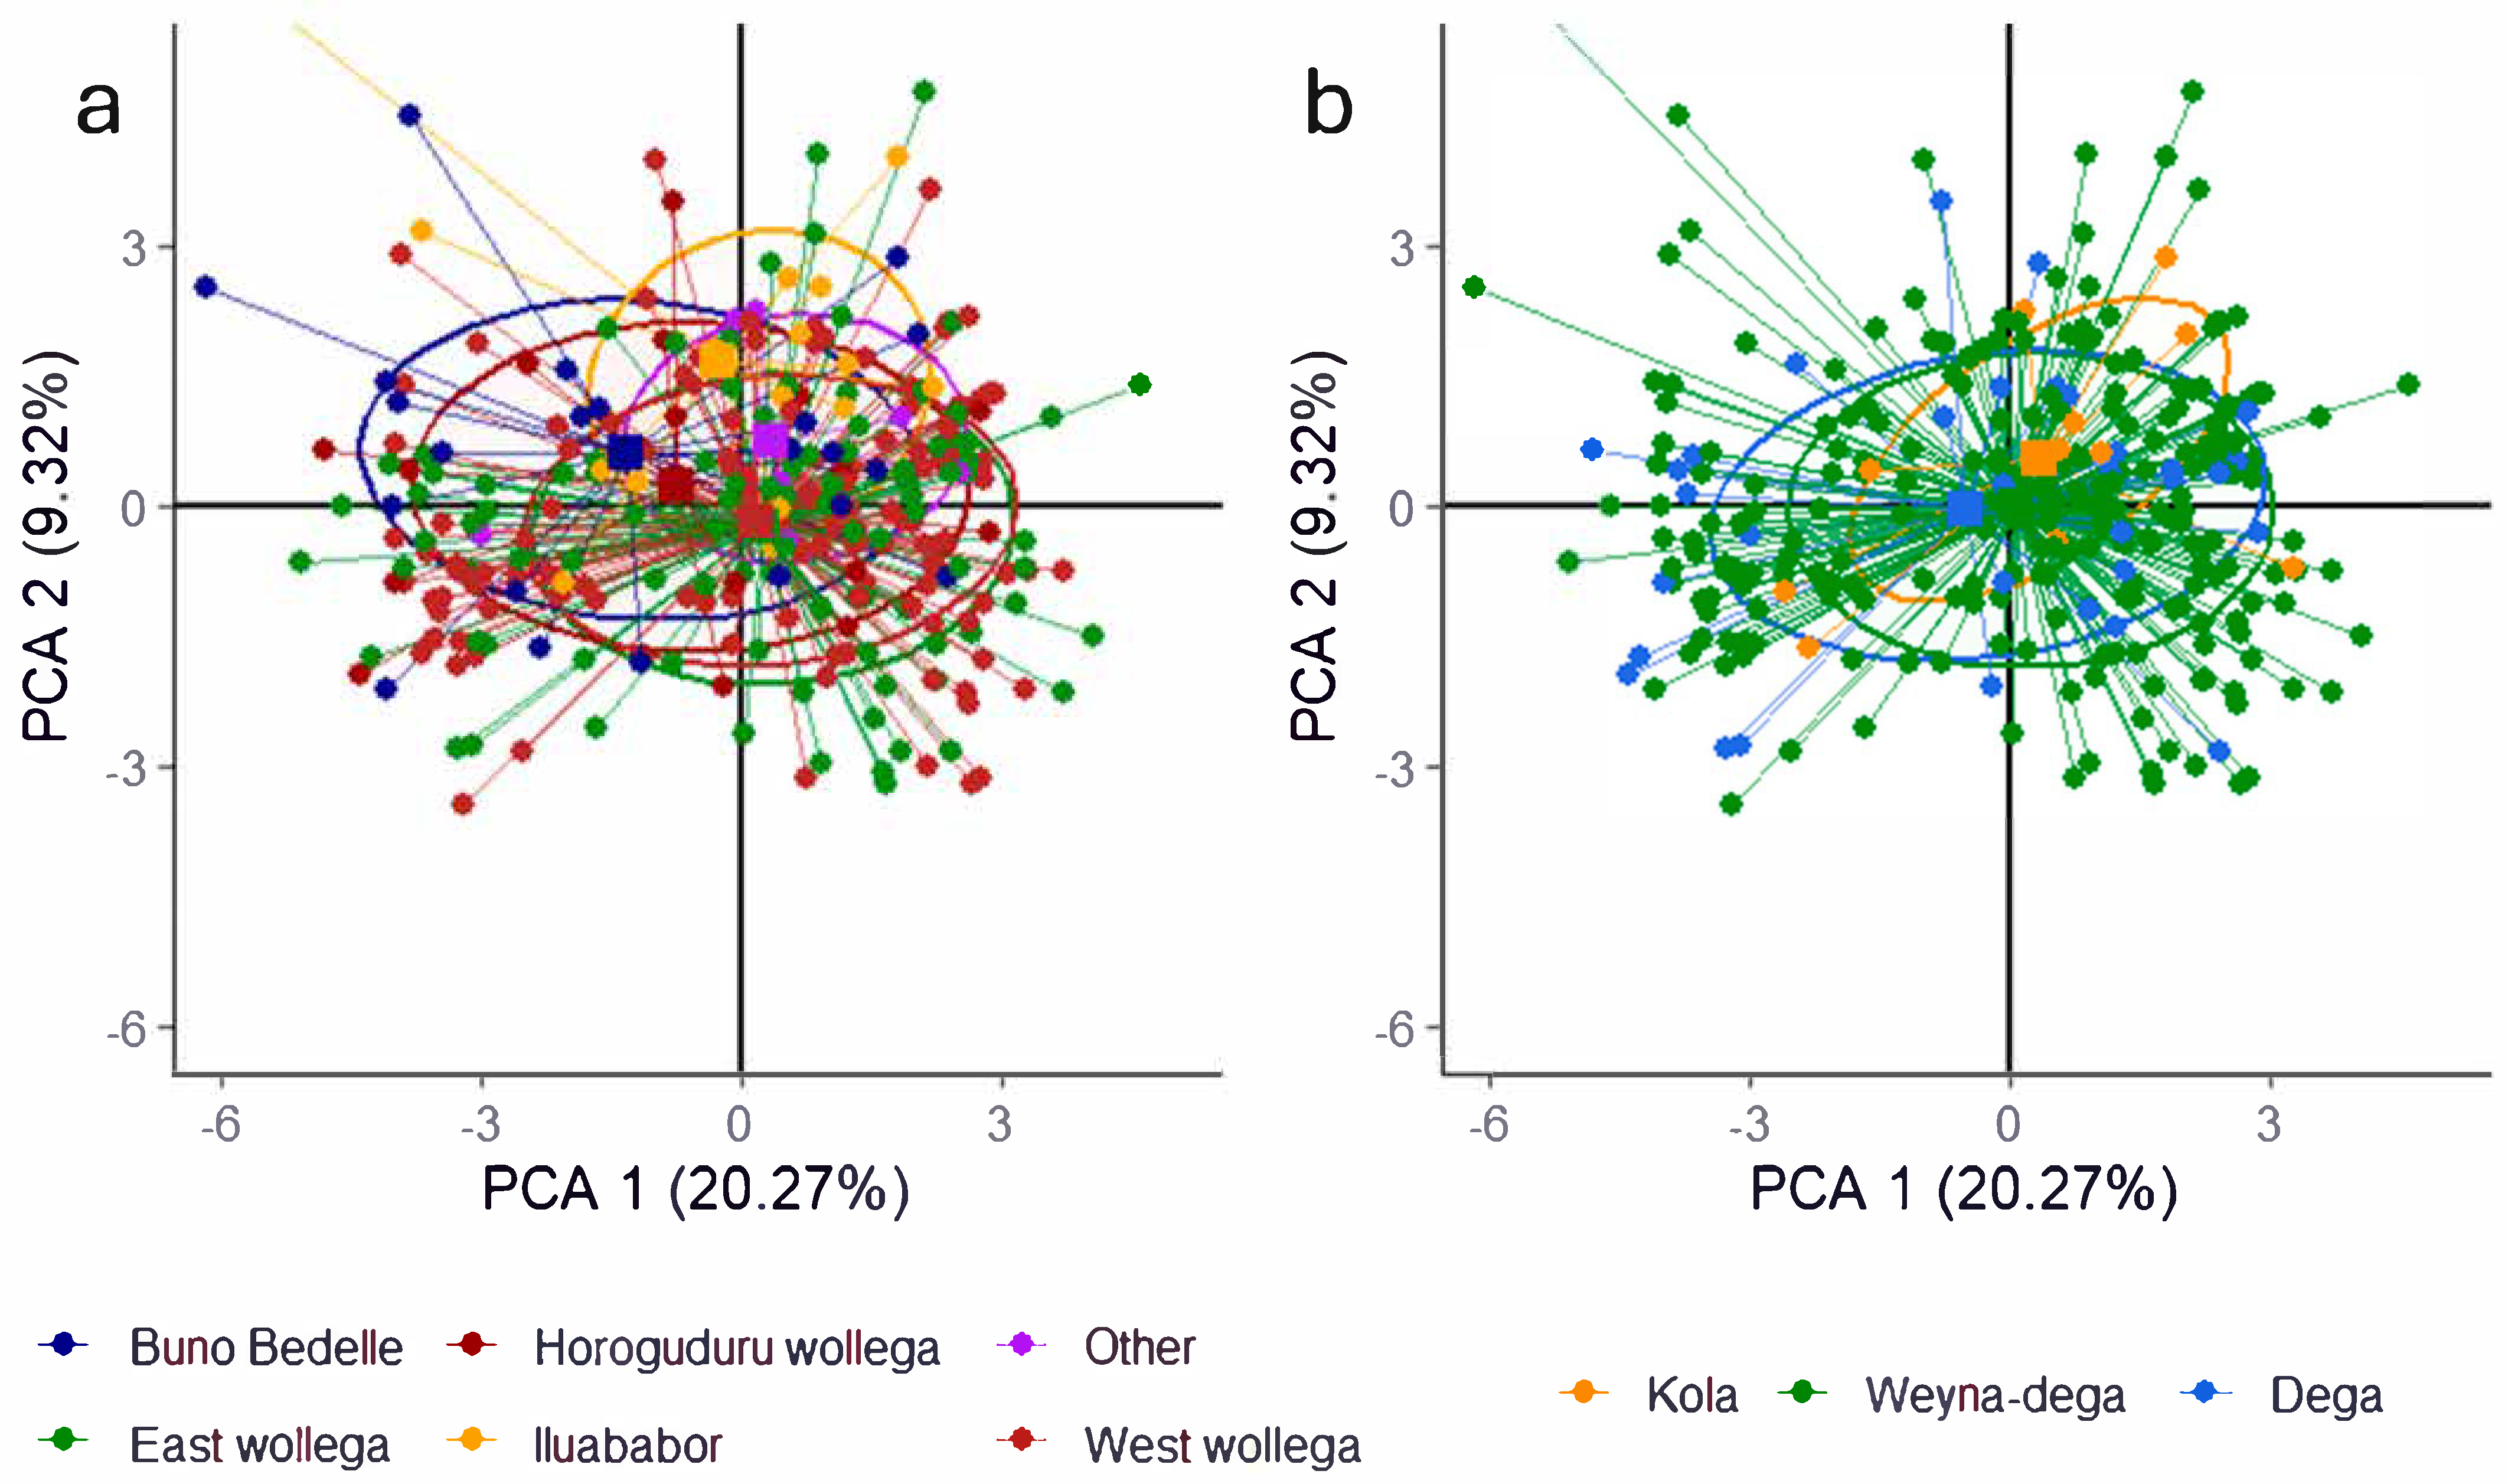
2.3.2. Principal Component Analysis of the Quantitative Agro-Morphological and Physiological Traits
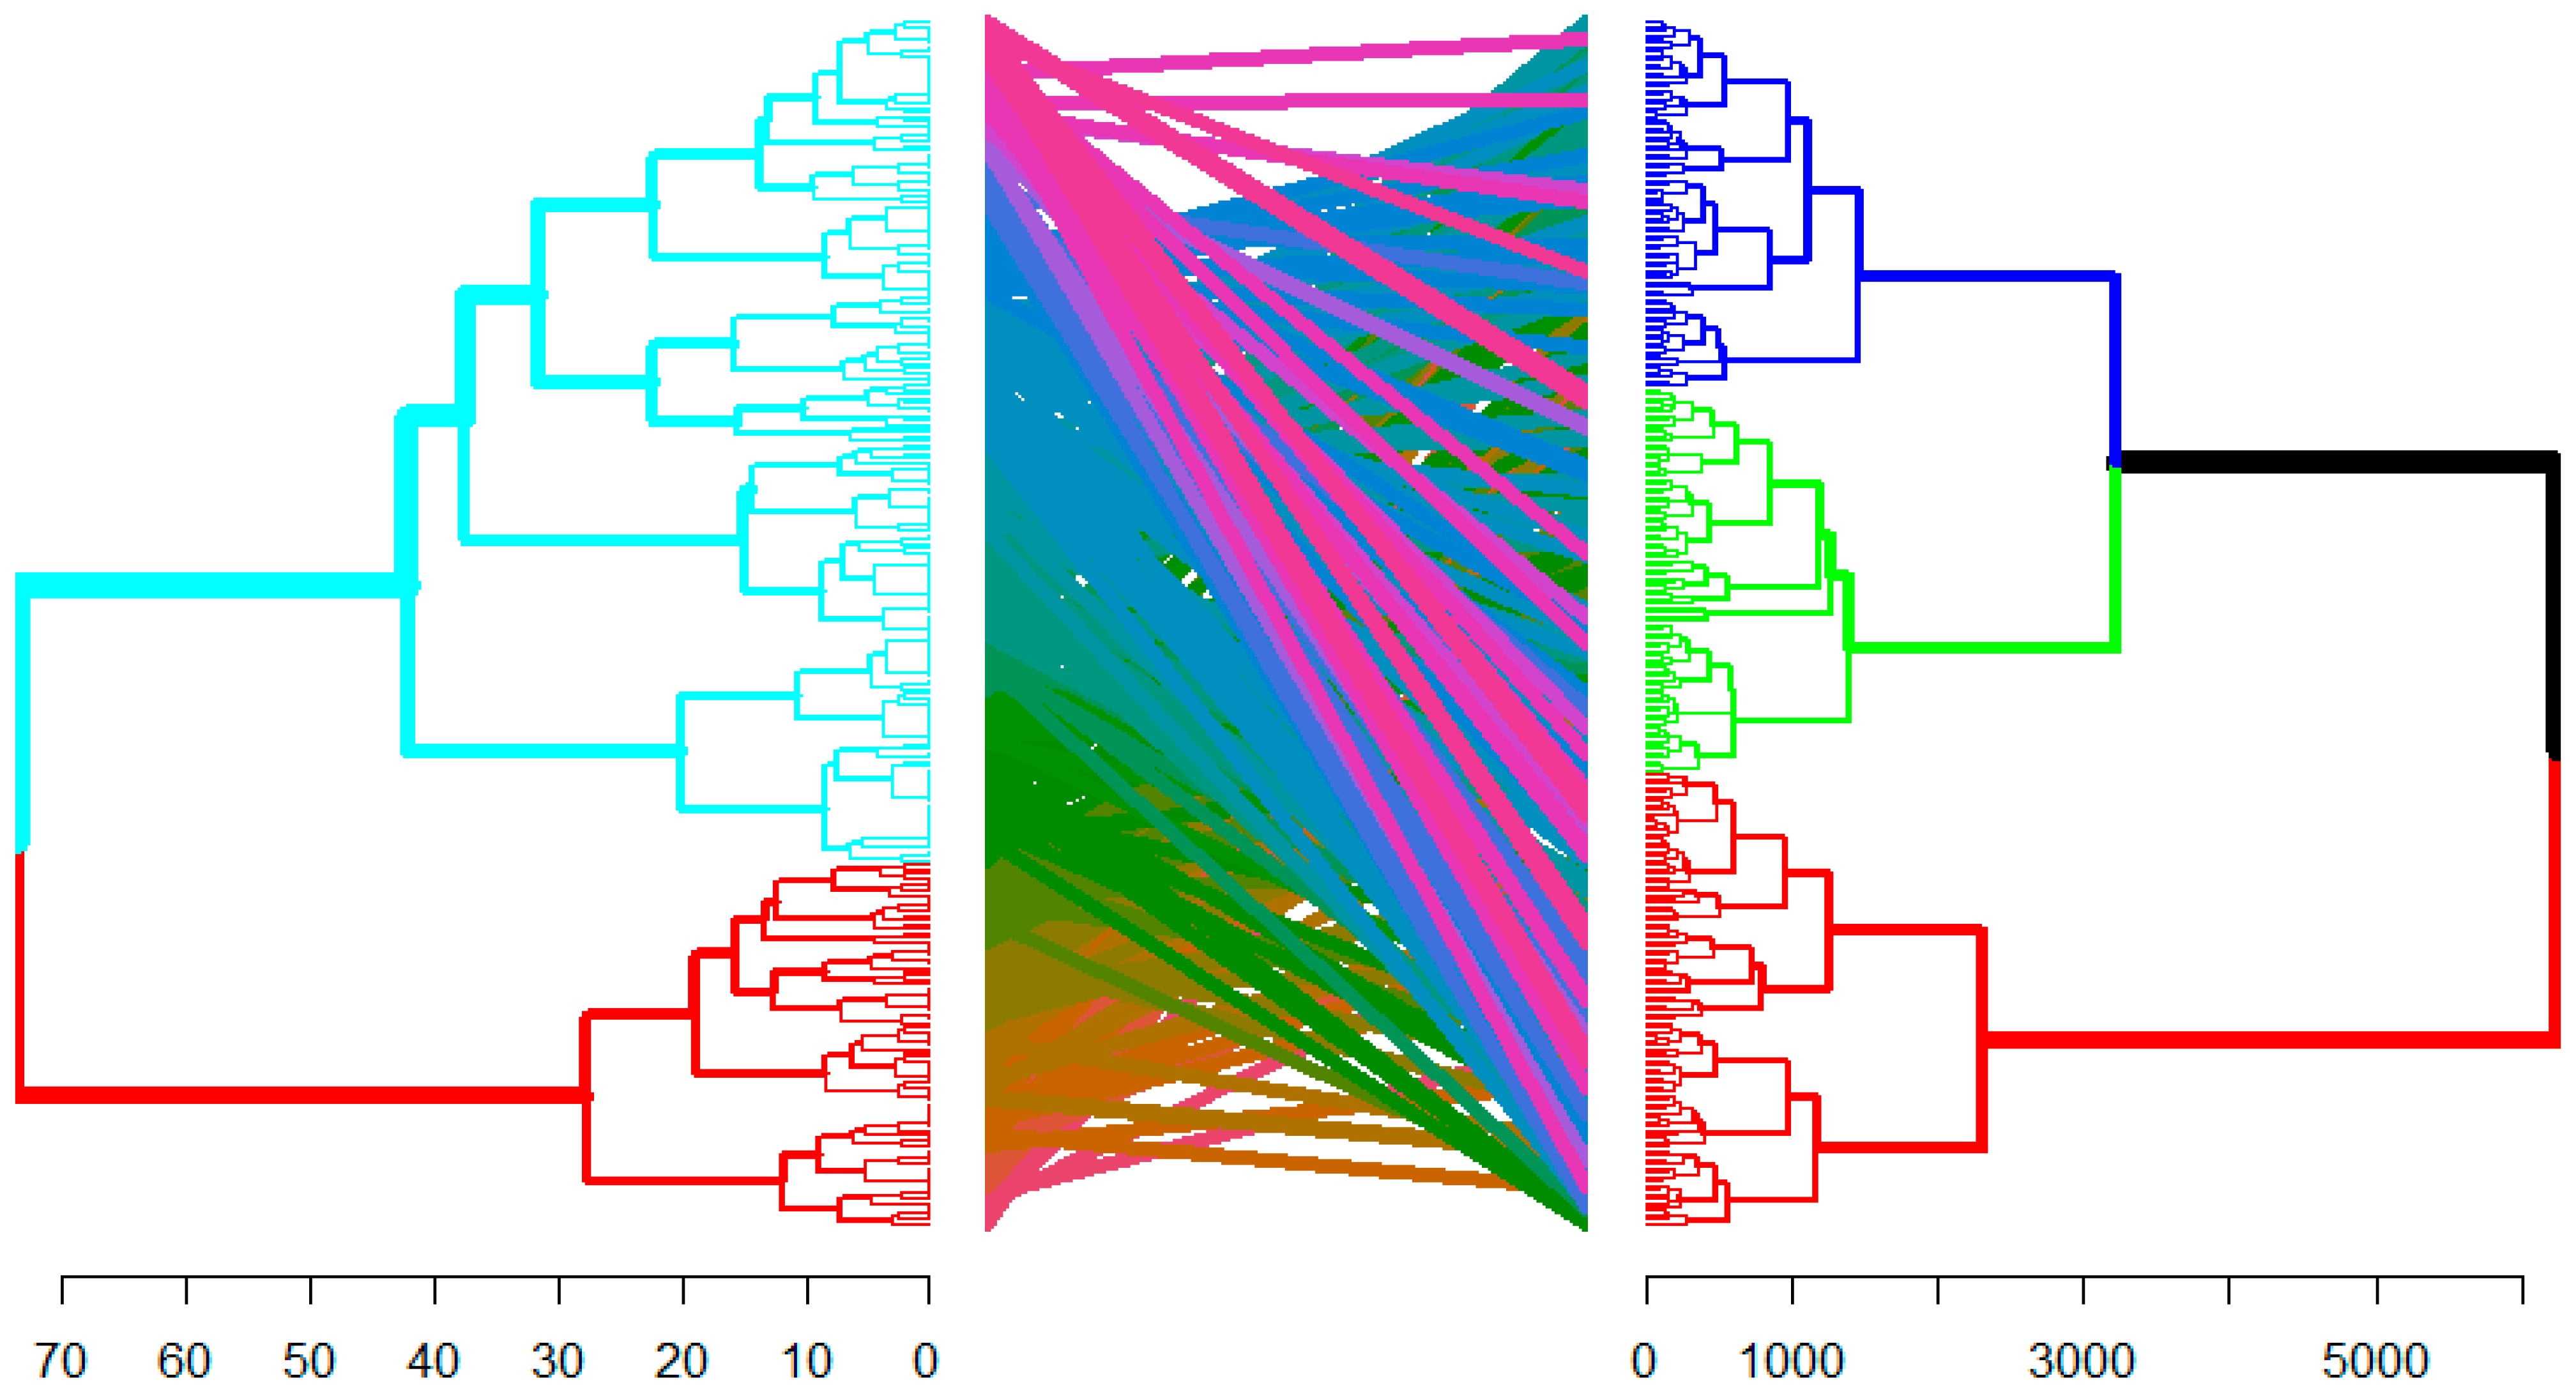
2.3.3. Inter-Trait Relatedness of Qualitative and Quantitative Agro-Morphological and Physiological Traits
3. Discussion
3.1. Agro-Morphological and Physiological Traits Variation Among Anchote Accessions
3.2. Inter-Trait Relationship and Divergence
4. Materials and Methods
4.1. Materials Used
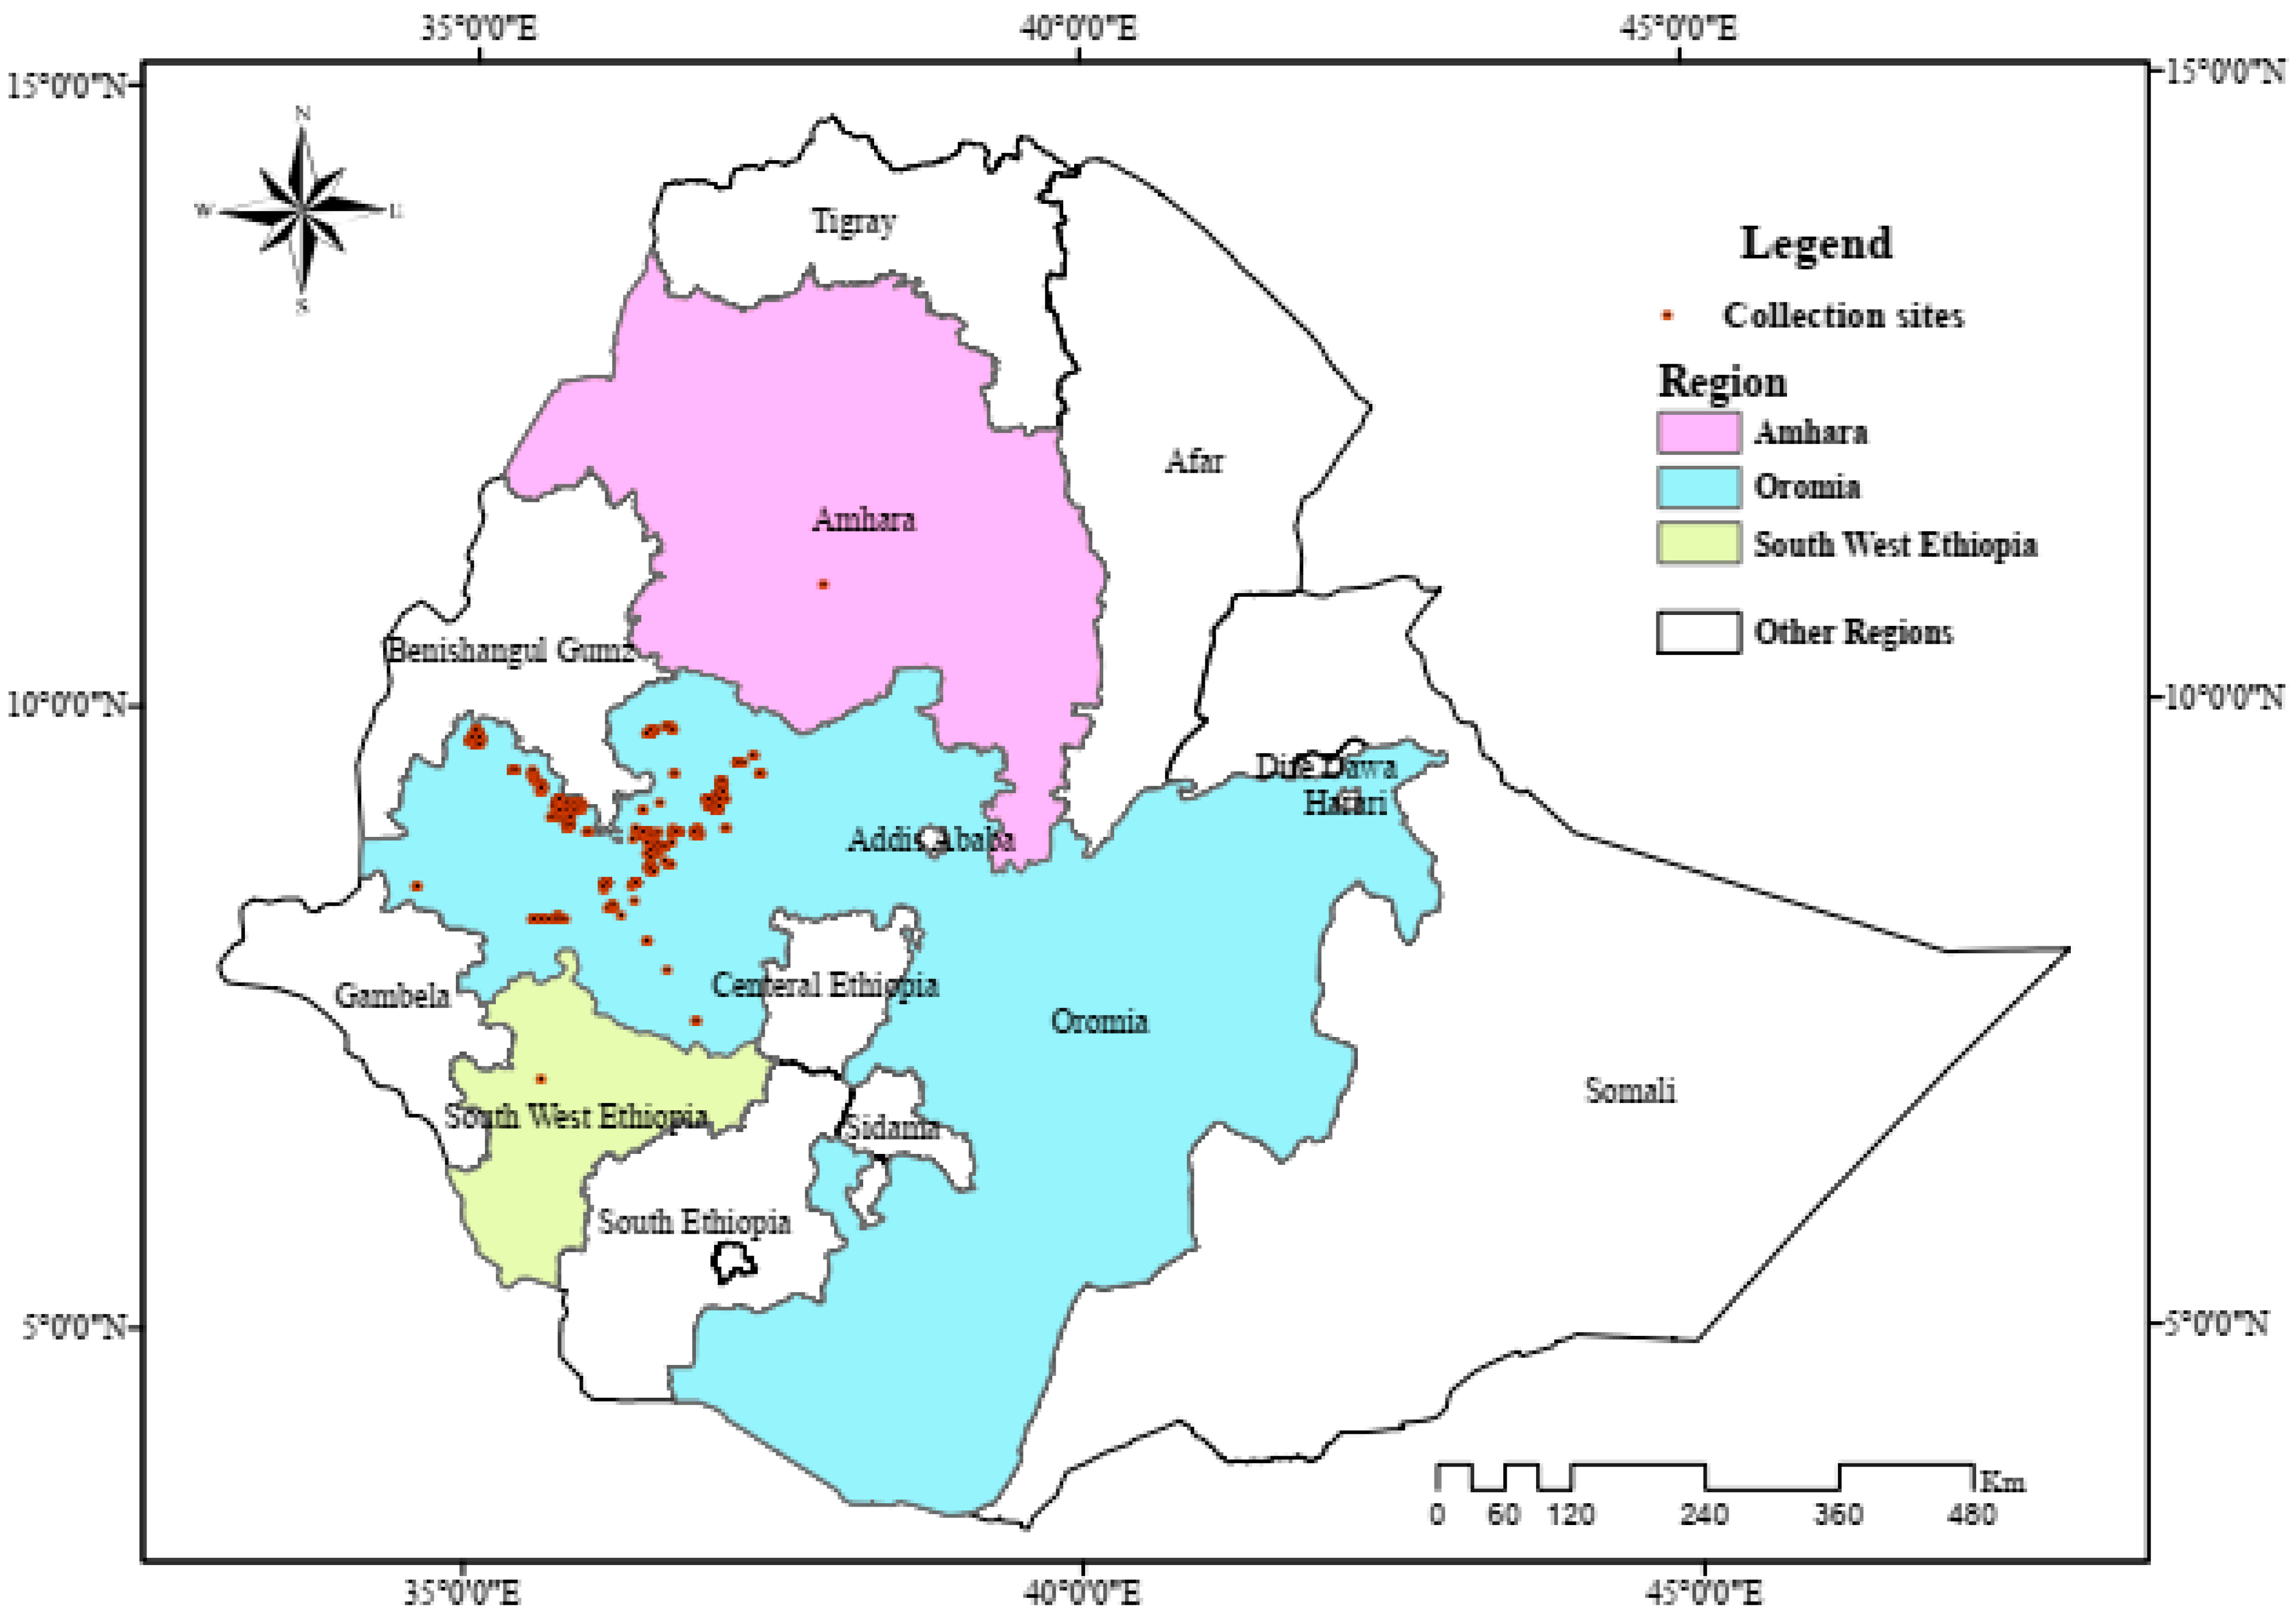
4.2. Description of the Study Area
4.3. Experimental Design and Field Management
- Yij: observed value of the response in block j, treatment (or genotype) i;
- μ: overall mean;
- Bj: fixed effect of block j;
- Ti: fixed effect of treatment i (includes both checks and unreplicated test entries);
- ϵij: random error term.
4.4. Data Collection
Agro-Morphological and Physiological Traits
4.5. Data Analysis
5. Conclusions
Supplementary Materials
Author Contributions
Funding
Data Availability Statement
Acknowledgments
Conflicts of Interest
Abbreviations
| ANOVA | Analysis of variance |
| DZARC | Debre Zeit Agricultural Research Center |
| GA | Genetic advance |
| GAM | Genetic advance as a percentage of the mean |
| GCV | Genotypic coefficient of variation |
| PC | Principal component |
| PCA | Principal component analysis |
| PCV | Phenotypic coefficient of variation |
References
- Kenyon, L.; Anandajayasekeram, P.; Ochieng, C. A Synthesis/Lesson-Learning Study of the Research Carried out on Root and Tuber Crops Commissioned Through the DFID RNRRS Research Programmes Between 1995 and 2005. A Report Submitted to the Crop Protection Program (CPP) of the UK Department for Inter. Natural Resources Institute & IFPRI-ISNAR, UK 2006. Available online: https://www.researchgate.net/publication/216088436 (accessed on 20 June 2025).
- Habtamu, F.G. Nutritional composition, antinutritional factors and effect of boiling on nutritional composition of Anchote (Coccinia abyssinica) tubers. J. Sci. Innov. Res. 2014, 3, 177–188. [Google Scholar] [CrossRef]
- Tilahun, W.; Sentayehu, A.; Amsalu, A.; Weyessa, G. Genetic diversity analysis among Anchote (Coccinia abyssinica) Accessions in Western Ethiopia. Int. J. Agric. Res. 2014, 9, 149–157. [Google Scholar] [CrossRef]
- Tileye, F. Coccinia abyssinica (lam.) Cogn. (anchote) biology, productivity, and prospects of genetic improvement using biotechnological tools. J. Hortic. Res. 2020, 28, 1–10. [Google Scholar] [CrossRef]
- Holstein, N.; Renner, S. A dated phylogeny and collection records reveal repeated biome shifts in the African genus Coccinia (Cucurbitaceae). BMC Evol. Biol. 2011, 11, 28. [Google Scholar] [CrossRef]
- Getahun, A. Developmental anatomy of tubers of Anchote: A potential dryland tuber crop. Acta Hort. 1973, 33, 51–64. [Google Scholar] [CrossRef]
- Hassen, Y.; Ali, M.; Desta, F.; Seid, H. Effect of Flower Bud Removal on Growth and Yield of Anchote Root (Coccinia abyssinica (Lam.) Cogn.) Accessions at Bishoftu. Adv. Res. J. Plant Anim. Sci. 2013, 1, 7–13. [Google Scholar]
- Abreham, B.; Tileye, F.; Kassahun, T. Genetic diversity of anchote (Coccinia abyssinica (Lam.) Cogn.) from Ethiopia as revealed by ISSR markers. Genet. Resour. Crop Evol. 2014, 61, 707–719. [Google Scholar] [CrossRef]
- Bekele, S.T. Morphological and Molecular Genetic Diversity and Cytogenetics of Cultivated Anchote (Coccinia abyssinica (Lam.) Cogn.) from Ethiopia. A Dissertation Submitted to the Department of Microbial Cellular and Molecular Biology, School of Graduate Studies, Addis Ababa University 2017. Available online: https://etd.aau.edu.et/server/api/core/bitstreams/8b4b642f-a64f-4bb3-822a-0fe1a80ba456/content (accessed on 10 May 2025).
- Ayalew, Y.; Retta, N.; Mohammed, A.; Kim, K.S.; Kobue, L.; Haki, R.I. Phytochemical constituents in edible parts of anchote (Coccinia abyssinica (lam.) (cogn.)) accessions from Ethiopia. Botsw. J. Agric. Appl. Sci. 2019, 13, 1–9. Available online: https://bojaas.buan.ac.bw (accessed on 10 May 2025). [CrossRef]
- Habtamu, F.M.; Wubeshet, M.; Mebrate, D.; Bekele, S. Nutritional and phenolic profiles of leaves of fifteen Anchote (Coccinia abyssinica) accessions. Cogent Food Agric. 2021, 7, 1911031. [Google Scholar] [CrossRef]
- Desta, F.M. Phenotypic and Nutritional Characterization of Anchote [Coccinia abyssinica (Lam.) Cogn.] Accessions of Ethiopia. Master’s Thesis, Jimma University, Jimma, Ethiopia, 2011. [Google Scholar]
- Aga, H.; Badada, K. Nutritional and antinutritional characteristics of anchote (Coccinia abyssinica). Ethiop. J. Health Dev. 1997, 11, 163–168. [Google Scholar]
- Adugna, M.B.; Yetenayet, B.T.; Tarekegn, B.S.; Sirawdink, F.F. Anchote (Coccinia abyssinica [Lam.] Cogn.) powder, an underutilized indigenous crop, as a substitute to commercial pectin in the production of strawberry jam. Heliyon 2022, 8, e10700. [Google Scholar] [CrossRef] [PubMed]
- Yohannes, T.W. Anchote (Coccinia abyssinica (Lam.) Cogn.) Starch and Flour Modification Using Hydrothermal Treatments and Valorization as Functional Ingredients in the Development of Food Products. Ph.D. Dissertation, Addis Ababa University, Addis Ababa, Ethiopia, 2024. [Google Scholar]
- Melese, A.D.; Abera, S.; Mitiku, D.H. Investigation of wheat—Anchote (Coccinia abyssinica (Lam.)) composite flours and baking temperature for cookies production. Food Res. 2021, 5, 252–265. [Google Scholar] [CrossRef] [PubMed]
- Hailu, R.G.; Dassalegn, D.J.; Dinka, M.B.; Bezuayehu, G.A.; Kassaye, T.S.; Desta, F.M. Nutritional and anti-nutritional composition of anchote (Coccinia abyssinica((Lam.) Cogn.) accessions in Ethiopia. J. Agric. Food Res. 2024, 115, 100980. [Google Scholar] [CrossRef]
- Tura, S.; Sandeep, B.V.; Sudhakar, P.; Aschalew, T. Synthesis and characterization of zinc oxide nanoparticles using tuber extract of anchote (Coccinia abyssinica (Lam.) Cong.) for antimicrobial and antioxidant activity assessment. Open Nano 2018, 3, 56–63. [Google Scholar] [CrossRef]
- Desta, F.M.; Sentayehu, A.; Kibebew, A.; Mandefro, N. Qualitative traits diversity in anchote [Coccinia abyssinica (lam.) cogn.] Accessions from Ethiopia. Asian J. Sci. Technol. 2024, 15, 13023–13039. [Google Scholar]
- Zerihun, T.; Meseret, T.T.; Bizuayehu, T.; Eleni, S.; Temesgen, M.O. Genetic diversity in anchote (coccinia abyssinica (Lam.) Cogn.) using microsatellite markers. Curr. Plant Biol. 2020, 24, 100167. [Google Scholar] [CrossRef]
- Govindaraj, M.; Vetriventhan, M.; Srinivasan, M. Importance of Genetic Diversity Assessment in Crop Plants and Its Recent Advances: An Overview of Its Analytical Perspectives. Genet. Res. Int. 2015, 2015, 431487. [Google Scholar] [CrossRef]
- Mekonnen, Y.; Andargachew, G.; Bizuayehu, T.; Hewan, D. Agro-morphological genetic diversity assessment of Amaranthus genotypes from Ethiopia based on qualitative traits. CABI Agric. Biosci. 2024, 5, 95. [Google Scholar] [CrossRef]
- Pooran, G. Breeding improvements in safflower (Carthamus tinctorius L.): A review. Aust. J. Crop Sci. 2014, 8, 1079–1085. [Google Scholar]
- Habte, J.; Kebebew, A.; Kassahun, T.; Kifle, D.; Zerihun, T. Diversity in Qualitative and Quantitative Traits Reveals Huge Potential for the Improvement of an Orphan Crop Tef [Eragrostis tef (Zucc.) Trotter]. J. Exp. Agric. Int. (JEAI) 2020, 42, 60–75. [Google Scholar] [CrossRef]
- Nigussie, K.; Solomon, B.; Gizachew, H.; Asnake, F.; Martin, J. Agro-morphological characterization and comparative performance of Ethiopian and exotic lentil (Lens culinaris Medik) germplasm. Genet. Resour. Crop Evol. 2024, 72, 4491–4506. [Google Scholar] [CrossRef]
- Guo, L.J. Molecular Markers and Marker-Assisted Breeding in Plants. In Plant Breeding from Laboratories to Fields; Intech Open: London, UK, 2013. [Google Scholar] [CrossRef]
- Sadia, B.; Awan, F.S.; Saleem, F.; Altaf, J.; Bin, U.A.; Nadeem, M.; Hameed, S.; Ashraf, F.; Nasir, M. Exploring Plant Genetic Variations with Morphometric and Molecular Markers. In Genetic Variation; Maia, R.T., Campos, M.A., Eds.; IntechOpen: London, UK, 2020. [Google Scholar] [CrossRef]
- Desta, F.M.; Sentayehu, A.; Kibebew, A.; Mandefro, N. Quantitative Traits Diversity in Anchote (Coccinia abyssinica (Lam.) Cogn.)) Accessions from Ethiopia. Ethiop. J. Crop Sci. 2022, 9, 2. [Google Scholar]
- Sivasubramanian, S.S.; Madhava, M.P. Genotypic and phenotypic variability in rice. Madras Agric. J. 1973, 60, 1093–1096. [Google Scholar]
- Robinson, H.F.; Comstock, R.E.; Harvey, P.H. Estimates of heritability and the degree of dominance in corn. Agron. J. 1949, 41, 353–359. [Google Scholar] [CrossRef]
- Zhi-Gang, W.; Wu, J.; Nitin, M.; Xiao-Qing, B.; Song-Lin, C.; Zheng-Ming, T. Transcriptome analysis reveals flavonoid biosynthesis regulation and simple sequence repeats in yam (Dioscorea alata L.) tuber. BMC Genom. 2015, 16, 346. [Google Scholar] [CrossRef]
- Hanna, A.; Chuntao, S.; Akwasi, Y.; Chunhua, C.; Shaoxia, Y.; Hongbo, Z.; Miao, C. Flesh Color Diversity of Sweet Potato: An Overview of the Composition, Functions, Biosynthesis, and Gene Regulation of the Major Pigments. Phyton-Int. J. Exp. Bot. 2020, 89, 4. [Google Scholar] [CrossRef]
- Badu, M.; Asho, P.; Patro, T.S.K.; Sasikala, K. Studies on genetic variability, heritability, and genetic advance for growth, yield, and quality parameters among orange flesh sweet potato (Ipomoea batatas L. Lam.) genotypes. Int. J. Curr. Microbiol. Appl. Sci. 2017, 6, 1894–1903. [Google Scholar] [CrossRef]
- Tewodros, M.; Firew, M.; Shimeles, H.; Endale, G. Genetic Variability, Correlation and Path Analysis on the Storage Tuber Yield and Yield Components of Yam (Dioscorea spp.) from Southwest Ethiopia. Ethiop. J. Crop Sci. 2023, 11, 98–118. [Google Scholar]
- Oladosu, Y.; Rafii, M.Y.; Abdullah, N.; Malek, M.A.; Rahim, H.A.; Hussin, G.; Latif, M.A.; Kareem, I. Genetic Variability and Selection Criteria in Rice Mutant Lines as Revealed by Quantitative Traits. Sci. World J. 2014, 2014, 190531. [Google Scholar] [CrossRef]
- Prince, E.N.; Pangirayi, B.T.; Agyemang, D.; Eric, Y.D.; Paterne, A.A.; Afolabi, A.; Robert, A.; Asrat, A. Genetic parameter estimation and selection in advanced breeding population of white Guinea yam. J. Crop Improv. 2021, 35, 790–815. [Google Scholar] [CrossRef]
- Choudhary, V.K.; Kumar, P.S.; George, J.; Kanwat, M.; Saravanan, R. Genetic Variability and Character Association in Taro (Colocasia esculenta (L.) Schott.) Under Mid-Hills of Arunachal Pradesh. J. Root Crops 2011, 37, 155–161. [Google Scholar]
- Adhi, S.; Reddy, R.V.S.K.; Sujatha, M.; Pratap, M. Genetic Variability Studies in F1 Generation of Tomato (Solanum lycopersicon L.). IOSR J. Agric. Vet. Sci. 2013, 4, 31–34. [Google Scholar]
- Lingaiah, N.; Satish, C.; Venkanna, B.; Rukmini, D.K.; Hari, Y. Genetic Variability and Correlation Studies in Yield Traits of Elite Rice (Oryza sativa L.) Genotypes. Ind. J. Pure App. Biosci. 2020, 8, 359–363. [Google Scholar] [CrossRef]
- Likeng-Li-Ngue, B.C.; Ibram, A.A.M.M.; Zenabou, N.; Zoa, F.B.; Fort, M.N.L.; Nathalie, M.; Seyum, E.G.; Bille, H.N.; Bell, J.M. Genetic Variability, Heritability and Correlation of Some Morphological and Yield Components Traits in Potato (Solanum tuberosum L.) Collections. Am. J. Plant Sci. 2023, 14, 1029–1042. [Google Scholar] [CrossRef]
- Rasheed, A.; Ilyas, M.; Khan, T.N.; Mahmood, A.; Riaz, U.; Chattha, M.B.; Al Kashgry, N.A.T.; Binothman, N.; Hassan, M.U.; Wu, Z.; et al. Study of genetic variability, heritability, and genetic advance for yield-related traits in tomato (Solanum lycopersicon MILL.). Front. Genet. 2023, 13, 1030309. [Google Scholar] [CrossRef]
- Alfredo, A.C.A. Cassava Botany and Physiology. In Cassava: Biology, Production and Utilization; Hillocks, R.J., Thresh, J.M., Bellotti, A.C., Eds.; CABI Publishing: Wallingford, UK, 2002; pp. 67–89. [Google Scholar]
- Regessa, M.D.; Jiru, N.C.; Here, A.; Mulugeta, N. Correlation and Mean Performance Evaluation of Sweet Potato (Ipomoea batatas (L.) Lam.) Genotypes Middle Awash Areas, Ethiopia. Adv. Crop Sci. Tech. 2023, 11, 562. [Google Scholar]
- Wubeshet, T.; Nesru, T. Analysis on Production Potential of Anchote (Coccinia abyssinica) In East Wollega Zone, Oromia, Regional State, Ethiopia. Int. J. Adv. Res. Biol. Sci. 2021, 8, 8–17. [Google Scholar] [CrossRef]
- Zeleke, W.; Hongxu, D.; Andrew, H.P.; Walelign, W.; Kassahun, B. Genetic diversity, population structure, and selection signature in Ethiopian sorghum [Sorghum bicolor L. (Moench)] germplasm. G3 Genes Genomes Genet. 2021, 11, 6. [Google Scholar] [CrossRef]
- Hair, J.F.; Anderson, R.E.; Tatham, R.L.; Black, W.C. Multivariate Date Analysis with Readings; Prentce: Englewood Cliff, NJ, USA, 1995. [Google Scholar]
- Aghaee, M.; Mohammadi, R.; Nabovati, S. Agro-morphological characterization of durum wheat accessions using pattern analysis. Aust. J. Crop Sci. 2010, 4, 505–514. [Google Scholar]
- Rahman, M.; Munsur, M. Genetic divergence analysis of lime. J. Bangladesh Agric. Univer. 2009, 7, 33–37. [Google Scholar] [CrossRef]
- Basazinew, D.G.; Bizuayehu, T.A.; Wendawek, A.M.; Kebebew, A.A. Morpho-Agronomic Characterization of Ethiopian Black cumin (Nigella sativa L.). Genotypes. Res. Sq. 2023. [Google Scholar] [CrossRef]
- DZARC. Annual Research Report, 2004/2005; Debre Zeit Agricultural Research Center: Debre Zeit, Ethiopia, 2008. [Google Scholar]
- ECPGR. Minimum Descriptors for Cucurbit spp., Cucumber, Melon and Water Melon; The European Cooperative Programmes for Plant Genetic Resources: Rome, Italy, 2008; pp. 1–15. [Google Scholar]
- International Plant Genetic Resources Institute (IPGRI). Descriptors for Melon (Cucumis melo L.); International Plant Genetic Resources Institute: Rome, Italy, 2003; p. 64. Available online: https://hdl.handle.net/10568/72690 (accessed on 25 April 2025).
- R Core Team. R: A Language and Environment for Statistical Computing (Version 4.4.1); R Foundation for Statistical Computing: Vienna, Austria, 2024; Available online: https://www.R-project.org/ (accessed on 13 February 2025).
- Oksanen, J.; Simpson, G.; Blanchet, F.; Kindt, R.; Legendre, P.; Minchin, P.; O’Hara, R.B.; Solymos, P.; Stevens, M.H.H.; Szoecs, E.; et al. Vegan: Community Ecology Package. R Package Version 2, 2024; pp. 6–8. Available online: https://CRAN.R-project.org/package=vegan (accessed on 13 February 2025).
- Shannon, C.E.; Weaver, W. The Mathematical Theory of Communication; University of Illinois Press: Champaign, IL, USA, 1949. [Google Scholar]
- Aravind, J.; Mukesh, S.S.; Wankhede, D.P.; Kaur, V. augmentedRCBD: Analysis of Augmented Randomized Complete Block Designs. R Package Version 0.1.7. 2023. Available online: https://aravind-j.github.io/augmentedRCBD/ (accessed on 20 June 2025).
- Wei, T.; Simko, V.R. Package ‘Corrplot’: Visualization of a Correlation Matrix. (Version 0.95). 2024. Available online: https://github.com/taiyun/corrplot (accessed on 14 February 2025).
- Olivoto, T.; Lúcio, A.D. metan: An R package for multi-environment trial analysis. Methods Ecol. Evol. 2020, 11, 783–789. [Google Scholar] [CrossRef]
- Kassambara, A.; Mundt, F. Factoextra: Extract and Visualize the Results of Multivariate Data Analyses. R Package Version 1.0.7. 2020. Available online: https://CRAN.R-project.org/package=factoextra (accessed on 20 February 2025).
- Venables, W.N.; Ripley, B.D. Modern Applied Statistics with S, 4th ed.; Springer: New York, NY, USA, 2002; ISBN 0-387-95457-0. Available online: https://www.stats.ox.ac.uk/pub/MASS4/ (accessed on 20 February 2025).
- Wickham, H. ggplot2: Elegant Graphics for Data Analysis; Springer: New York, NY, USA, 2016; ISBN 978-3-319-24277-4. Available online: https://ggplot2.tidyverse.org (accessed on 21 February 2025).
- Maechler, M.; Rousseeuw, P.; Struyf, A.; Hubert, M.; Hornik, K. cluster: Cluster Analysis Basics and Extensions. R Package Version 2.1.4. 2023. Available online: https://CRAN.R-project.org/package=cluster (accessed on 21 February 2025).
- Wickham, H.; François, R.; Henry, L.; Müller, K. dplyr: A Grammar of Data Manipulation. R Package Version 1.1.4. 2023. Available online: https://CRAN.R-project.org/package=dplyr (accessed on 25 February 2025).
- Gower, J.C. A general coefficient of similarity and some of its properties. Biometrics 1971, 27, 857–871. [Google Scholar] [CrossRef]
- Ward, J.H. Hierarchical Grouping to Optimize an Objective Function. J. Am. Stat. Assoc. 1963, 58, 236–244. [Google Scholar] [CrossRef]
- Maechler, M. Finding groups in data: Cluster analysis extended rousseeuw Et. R Package Version 2019, 2, 242–248. [Google Scholar]
- Van, H. Hierarchical approaches to the analysis of genetic diversity in crop plants. In Core Collection of Plant Genetic Resources; Hodgkin, T., Brown, A.H.D., Van Hintum, T.J.L., Morales, E.A.V., Eds.; Wiley Sayce Publication: New York, NY, USA, 1995; pp. 23–34. [Google Scholar]
- Raivo, K. pheatmap: Pretty Heatmaps (Version 1.0.12). R Foundation for Statistical Computing 2020. Available online: https://cran.r-project.org/package=pheatmap (accessed on 26 February 2025).
- Mantel, N. The detection of disease clustering and a generalized regression approach. Cancer Res. 1967, 27, 209–220. [Google Scholar] [PubMed]
- Galili, T. dendextend: An R package for visualizing, adjusting, and comparing trees of hierarchical clustering. Bioinformatics 2015, 31, 3718–3720. [Google Scholar] [CrossRef] [PubMed]

| Qualitative Marker | Character State | Proportion | % Proportion | Chi-Square |
|---|---|---|---|---|
| Root shape (RS) | Elliptic | 7 | 2.48227 | 456.77 *** |
| Long elliptic | 2 | 0.70922 | ||
| Oblong | 4 | 1.41844 | ||
| Obovate | 24 | 8.510638 | ||
| Ovate | 4 | 1.41844 | ||
| Round | 126 | 44.68085 | ||
| Round elliptic | 115 | 40.78014 | ||
| Predominant root flesh color (PRFC) | Cream | 124 | 43.97163 | 331.95 *** |
| Dark cream | 13 | 4.609929 | ||
| Dark yellow | 1 | 0.35461 | ||
| Pale yellow | 21 | 7.446809 | ||
| Strongly pigmented | 10 | 3.546099 | ||
| White | 113 | 40.07092 | ||
| Secondary Root flesh color (SRFC) | Cream | 123 | 43.61702 | 103.56 *** |
| Dark cream | 12 | 4.255319 | ||
| Pale yellow | 50 | 17.7305 | ||
| White | 97 | 34.39716 | ||
| Vine color (VC) | Green | 92 | 32.62411 | 34.05 *** |
| Light green | 190 | 67.37589 | ||
| Leaf color (LC) | Deep green | 75 | 26.59574 | 9.08 * |
| Green | 91 | 32.2695 | ||
| Light green | 116 | 41.13475 | ||
| Canopy coverage (CC) | High | 29 | 10.28369 | 153.57 *** |
| Low | 9 | 3.191489 | ||
| Medium | 125 | 44.32624 | ||
| Very high | 119 | 42.19858 |
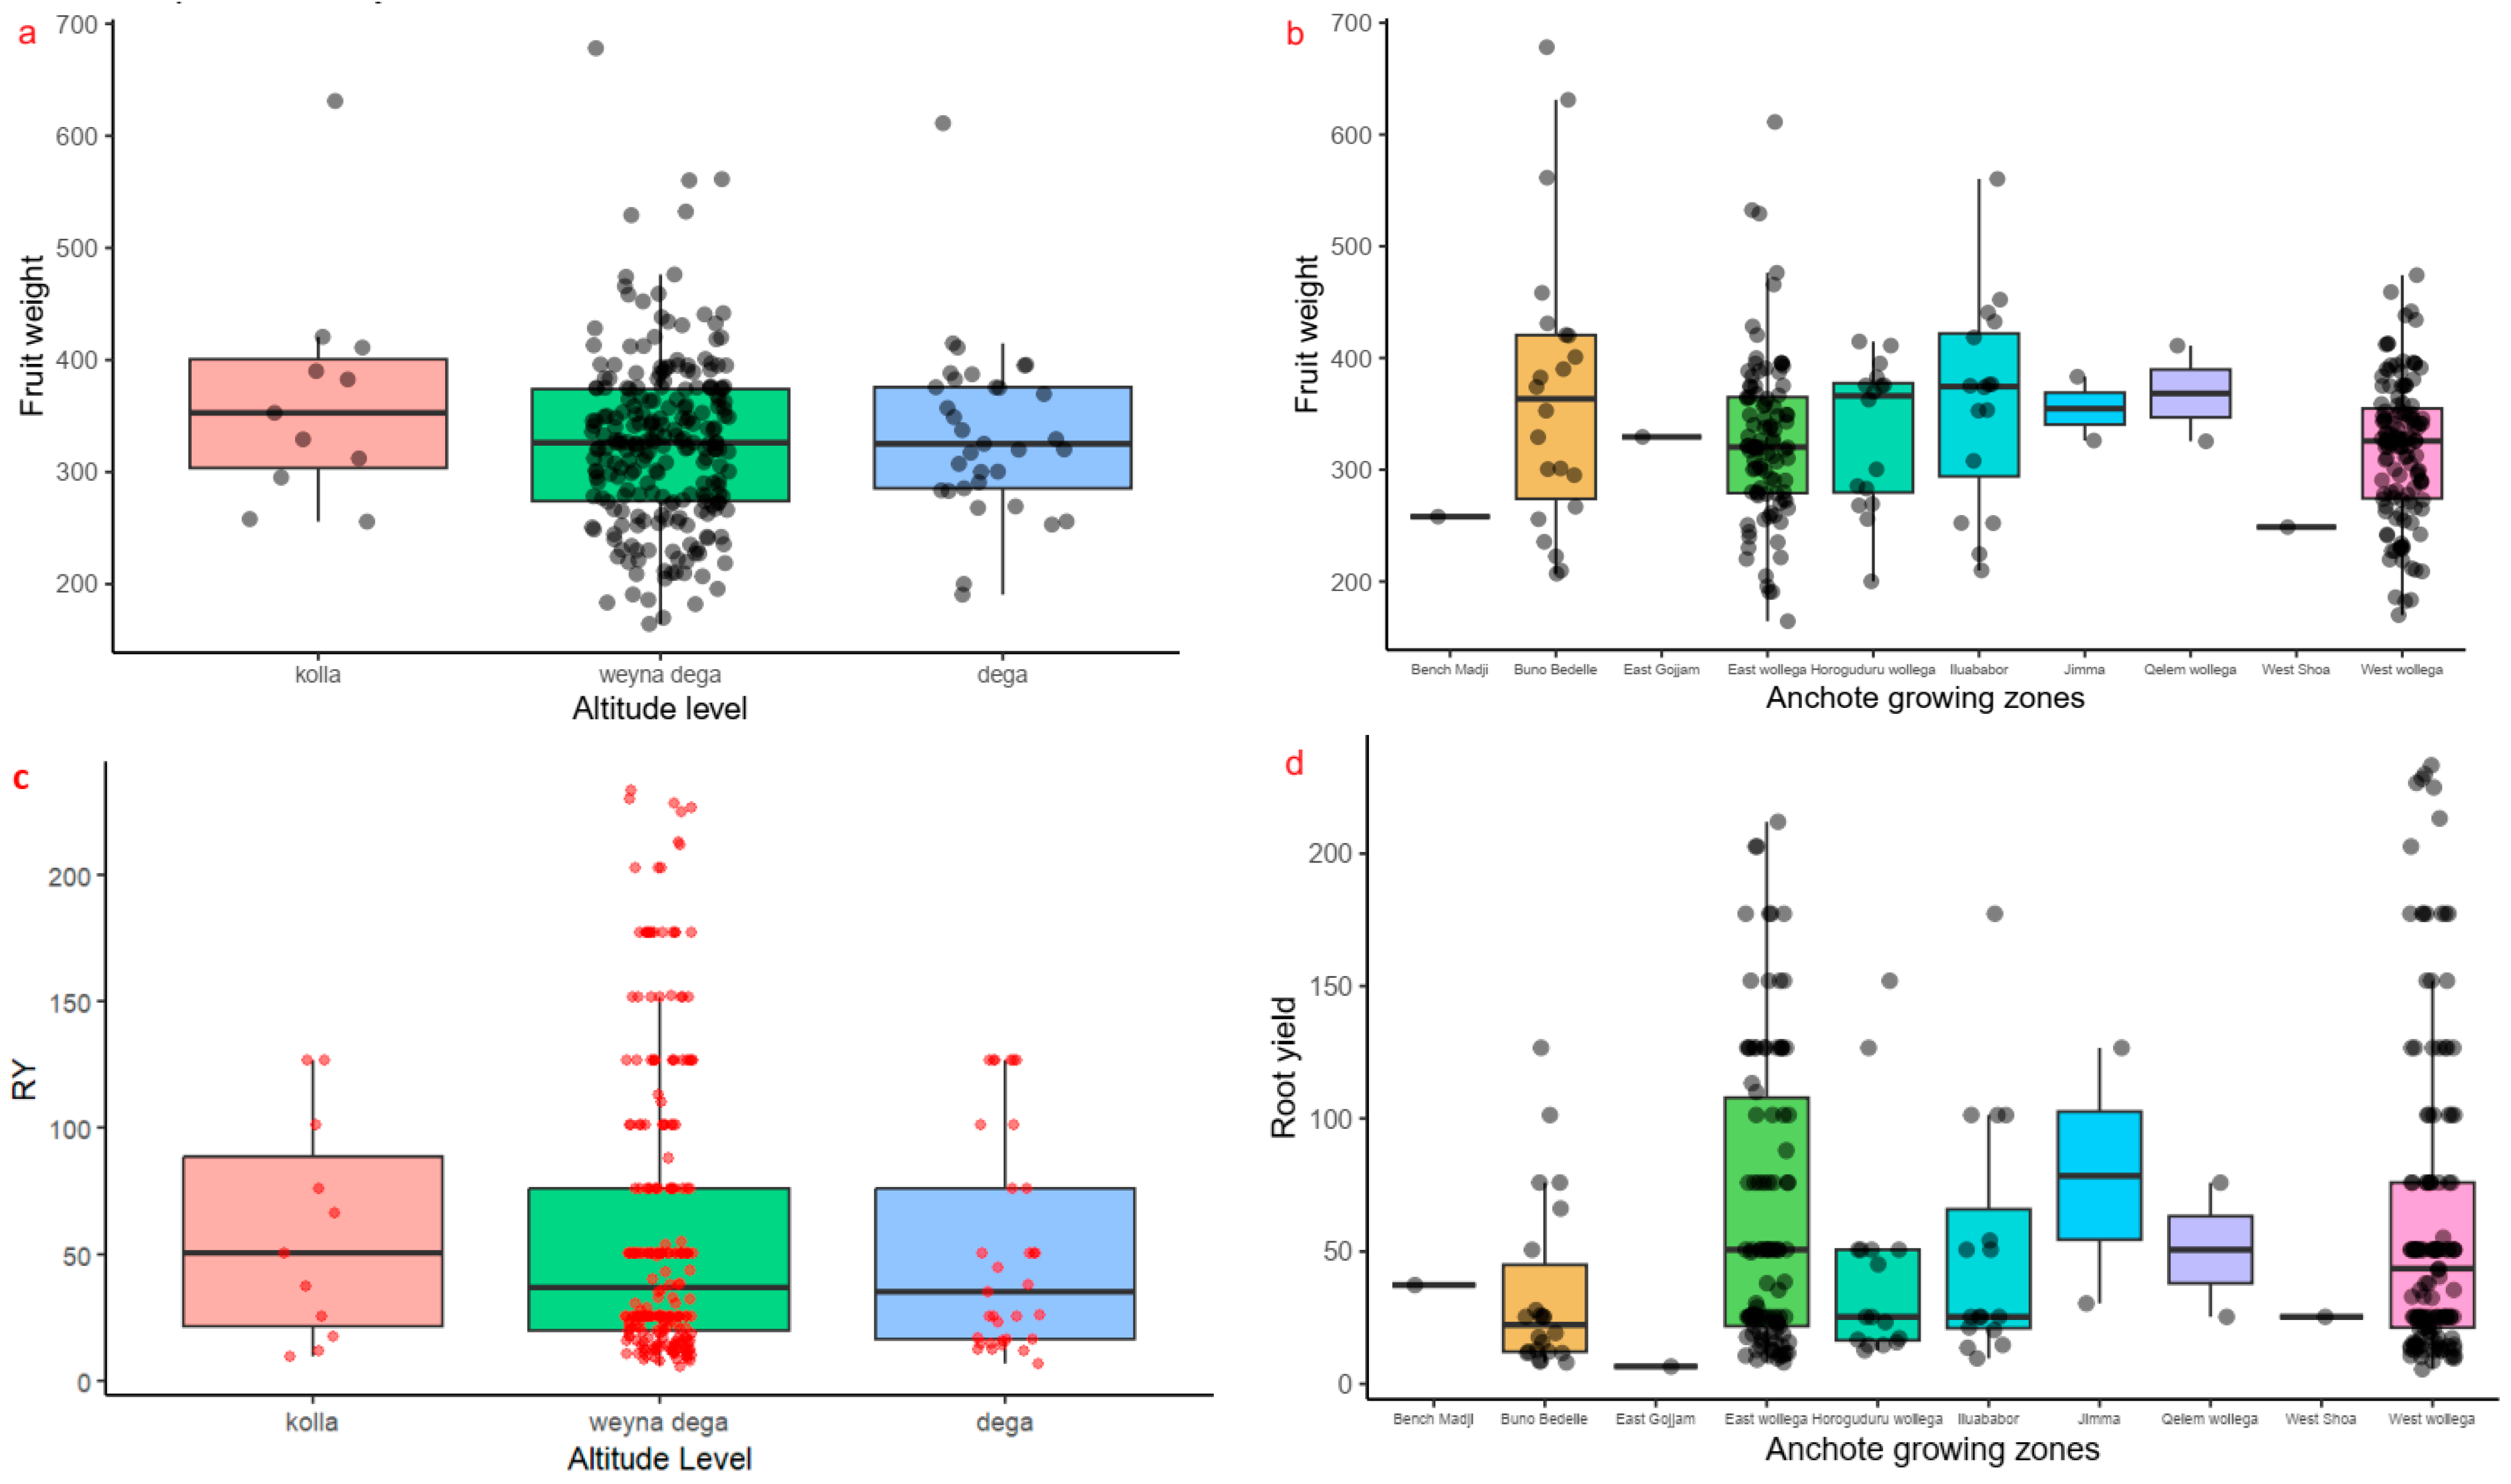
| Traits | Mean | SE | Minimum | Acc (min) | Maximum | Acc (max) | CV |
|---|---|---|---|---|---|---|---|
| Petiole length (PL) | 3.72 | 0.09 | 1.00 | Acc.202 | 7.60 | Acc.19 | 30.09 |
| Leaf length (LL) | 6.54 | 0.12 | 1.00 | Acc.236 | 10.67 | Acc.120 | 19.62 |
| Leaf diameter (LD) | 6.69 | 0.12 | 1.10 | Acc.236 | 11.00 | Acc.379 | 19.34 |
| Internode length (INL) | 10.25 | 0.11 | 5.50 | Acc.151 | 15.20 | Acc.124 | 12.30 |
| Vine length (VL) | 2.16 | 0.04 | 1.00 | Acc.52 | 3.90 | Acc.145 | 19.93 |
| Internode length to petiole length ratio (INL/PL) | 2.98 | 0.07 | 1.05 | Acc.19 | 7.33 | Acc.3 | 24.35 |
| Fruit length (FL) | 5.32 | 0.06 | 3.20 | Acc.170 | 8.60 | Acc.348 | 12.98 |
| Fruit diameter (FD) | 4.12 | 0.03 | 2.80 | Acc.50 | 5.80 | Acc.117 | 9.84 |
| Fruit length-to-diameter ratio (FL/FD) | 1.30 | 0.01 | 0.74 | Acc.271 | 2.00 | Acc.363 | 13.11 |
| Number of seeds per locule (NSPL) | 17.99 | 0.22 | 10.40 | Acc.7 | 29.40 | Acc.363 | 16.54 |
| Number of seeds per fruit (NSPF) | 102.55 | 1.41 | 50.00 | Acc.85 | 166.60 | Acc.363 | 13.64 |
| Fruit weight (FW) | 328.37 | 5.95 | 164.41 | Acc.51 | 678.20 | Acc.348 | 18.96 |
| Thousand seed weight (TSW) | 45.20 | 0.66 | 21.10 | Acc.146 | 71.20 | Acc.117 | 18.85 |
| Seed yield (SY) | 463.23 | 14.53 | 99.80 | Acc.160 | 973.80 | Acc.412 | 31.18 |
| Root number per plot (RNPP) | 1.98 | 0.06 | 1.00 | Acc.7 | 5.00 | D-01 | 37.55 |
| Root length (RL) | 11.70 | 0.14 | 7.32 | Acc.363 | 17.50 | D-01 | 17.99 |
| Root diameter (RD) | 8.07 | 0.21 | 2.50 | Acc.57 | 16.44 | Acc.200 | 25.76 |
| Root length-to-diameter ratio (RL/RD) | 1.61 | 0.05 | 0.91 | Acc.345 | 3.75 | Acc.241 | 29.66 |
| Root weight per plot (RWPP) | 1.79 | 0.10 | 0.17 | Acc.68 | 7.00 | Acc.129 | 50.80 |
| Root yield (RY) | 59.67 | 3.40 | 5.57 | Acc.68 | 233.33 | Acc.129 | 50.80 |
| Leaf area (LA) | 30.93 | 1.11 | 0.53 | Acc.334 | 81.6 | Acc.379 | 38.83 |
| Leaf area index (LAI) | 0.91 | 0.05 | 0.100 | Acc.6 | 2.90 | Acc.262 | 42.81 |
| Canopy density (CD) | 37.33 | 0.51 | 13.20 | Acc.68 | 59.9 | Acc.207 | 14.03 |
| Gap fraction leaf area index (GFLAI) | 0.57 | 0.02 | 0.100 | Acc.57 | 2.40 | Acc.278 | 15.77 |
| Chlorophyl content (ChC) | 52.66 | 0.64 | 24.30 | Acc.291 | 79.7 | Acc.57 | 15.68 |
| Normalized difference vegetative index (NDVI) | 59.35 | 0.85 | 27.00 | Acc.224 | 87.0 | Acc.105 | 11.52 |
| Traits | Mean | PCV (%) | GCV (%) | Hb2 % | GA | GAM % |
|---|---|---|---|---|---|---|
| Petiole length (PL) | 3.70 | 30.49 | ||||
| Leaf length (LL) | 6.51 | 30.15 | 22.67 | 56.54 | 2.29 | 35.17 |
| Leaf diameter (LD) | 6.67 | 30.07 | 22.89 | 57.93 | 2.40 | 35.93 |
| Internode length (INL) | 10.20 | 14.75 | 8.21 | 30.99 | 0.96 | 9.43 |
| Vine length (VL) | 2.15 | 32.20 | 25.48 | 62.62 | 0.90 | 41.60 |
| Internode length to petiole length ratio (INL/PL) | 2.98 | 30.22 | 18.52 | 37.54 | 0.70 | 23.40 |
| Fruit length (FL) | 5.30 | 18.29 | 12.69 | 48.14 | 0.96 | 18.17 |
| Fruit diameter (FD) | 4.11 | 11.49 | 5.83 | 25.76 | 0.25 | 6.11 |
| Fruit length-to-diameter ratio (FL/FD) | 1.30 | 17.17 | 10.97 | 40.83 | 0.19 | 14.47 |
| Number of seeds per locule (NSPL) | 17.87 | 17.96 | 6.69 | 13.85 | 0.92 | 5.13 |
| Number of seeds per fruit (NSPF) | 102.66 | 18.09 | 11.80 | 42.57 | 16.31 | 15.88 |
| Fruit weight (FW) | 327.85 | 23.25 | 13.06 | 31.52 | 49.58 | 15.12 |
| Thousand seed weight (TSW) | 45.37 | 22.76 | 13.10 | 33.11 | 7.05 | 15.55 |
| Seed yield (SY) | 462.67 | 49.73 | 38.68 | 60.49 | 287.13 | 62.06 |
| Root number per plot (RNPP) | 1.97 | 43.77 | 21.13 | 23.30 | 0.41 | 21.04 |
| Root length (RL) | 11.62 | 15.90 | ||||
| Root diameter (RD) | 7.96 | 31.82 | 18.27 | 32.97 | 1.72 | 21.64 |
| Root length-to-diameter ratio (RL/RD) | 1.62 | 36.04 | 20.35 | 31.87 | 0.38 | 23.70 |
| Root weight per plot (RWPP) | 1.79 | 92.76 | 77.65 | 70.06 | 2.40 | 134.08 |
| Root yield (RY) | 59.77 | 92.76 | 77.6 | 70.06 | 80.13 | 134.08 |
| Leaf area (LA) | 30.93 | 59.56 | 44.65 | 56.20 | 21.51 | 69.06 |
| Leaf area index (LAI) | 0.91 | 79.60 | 68.58 | 74.22 | 1.14 | 121.89 |
| Canopy density (CD) | 37.33 | 19.29 | 13.23 | 47.03 | 6.98 | 18.71 |
| Gap fraction leaf area index (GFLAI) | 0.57 | 68.85 | 67.13 | 95.05 | 0.78 | 135.01 |
| Chlorophyl content (ChC) | 52.66 | 19.34 | 11.29 | 34.08 | 7.16 | 13.60 |
| Normalized difference vegetative index (NDVI) | 59.35 | 21.86 | 18.49 | 71.58 | 19.16 | 32.28 |
| PC1 | PC2 | PC3 | PC4 | PC5 | PC6 | PC7 | PC8 | PC9 | PC 10 | |
|---|---|---|---|---|---|---|---|---|---|---|
| RS.Elliptic | 0.08 | 0.00 | 2.57 | 3.57 | 0.04 | 0.00 | 0.98 | 12.95 | 0.19 | 1.16 |
| RS.long.elliptic | 0.14 | 1.34 | 0.22 | 0.03 | 0.03 | 0.42 | 0.44 | 1.97 | 0.93 | 2.82 |
| RS.Oblong | 0.01 | 0.38 | 0.01 | 0.91 | 0.18 | 1.45 | 0.04 | 1.58 | 0.01 | 3.32 |
| RS.Obovate | 0.64 | 0.55 | 0.25 | 1.30 | 0.01 | 0.57 | 25.17 | 2.86 | 21.86 | 0.24 |
| RS.Ovate | 0.01 | 1.05 | 1.37 | 0.06 | 0.00 | 0.08 | 2.74 | 3.57 | 5.84 | 35.58 |
| RS.Round | 0.11 | 0.72 | 4.65 | 7.56 | 15.64 | 17.85 | 7.59 | 1.13 | 0.04 | 2.08 |
| RS.Round.elliptic | 0.58 | 0.29 | 6.95 | 9.19 | 15.52 | 12.24 | 0.88 | 4.09 | 3.49 | 0.01 |
| PRFC.Cream | 0.03 | 23.21 | 0.49 | 1.82 | 0.79 | 0.02 | 0.46 | 3.72 | 9.61 | 8.42 |
| PRFC.Dark.cream | 0.16 | 0.68 | 0.04 | 0.06 | 0.48 | 1.59 | 12.41 | 6.61 | 6.46 | 28.27 |
| PRFC.Dark.yellow | 0.18 | 0.14 | 0.00 | 0.11 | 0.01 | 0.15 | 16.72 | 3.51 | 18.63 | 0.05 |
| PRFC.Pale.yellow | 0.05 | 0.15 | 4.95 | 9.77 | 4.35 | 11.89 | 0.16 | 0.07 | 4.68 | 0.82 |
| PRFC.Strongly. pigmented | 0.31 | 0.00 | 9.42 | 8.64 | 12.22 | 11.27 | 0.02 | 0.32 | 0.06 | 2.94 |
| PRFC.White | 0.10 | 25.84 | 2.41 | 2.19 | 0.15 | 0.02 | 0.24 | 0.31 | 0.22 | 0.64 |
| SRFC.Cream | 0.30 | 19.13 | 0.48 | 12.28 | 0.13 | 1.37 | 0.24 | 2.49 | 0.65 | 1.02 |
| SRFC.Dark.cream | 0.04 | 0.01 | 11.52 | 13.86 | 10.80 | 8.60 | 0.00 | 0.15 | 0.02 | 0.01 |
| SRFC.Pale.yellow | 0.00 | 0.00 | 0.01 | 14.35 | 9.43 | 17.43 | 0.99 | 0.01 | 2.42 | 0.79 |
| SRFC.White | 0.18 | 20.57 | 4.44 | 0.94 | 0.48 | 0.79 | 1.71 | 1.95 | 4.60 | 0.09 |
| VC.Green | 23.74 | 0.30 | 0.04 | 0.01 | 0.23 | 0.74 | 0.25 | 0.06 | 0.01 | 0.48 |
| VC.Light.green | 23.74 | 0.30 | 0.04 | 0.01 | 0.23 | 0.74 | 0.25 | 0.06 | 0.01 | 0.48 |
| LC.Deep.green | 6.12 | 0.69 | 9.00 | 1.43 | 5.05 | 0.00 | 4.63 | 18.38 | 1.84 | 0.34 |
| LC.Green | 21.25 | 0.23 | 0.83 | 0.18 | 0.00 | 0.05 | 0.28 | 0.05 | 1.36 | 0.02 |
| LC.Light.green | 4.66 | 1.46 | 12.65 | 0.44 | 4.17 | 0.03 | 5.94 | 16.50 | 5.41 | 0.15 |
| CC.HIGH | 10.34 | 0.00 | 0.96 | 0.14 | 1.44 | 0.04 | 0.10 | 2.38 | 0.28 | 2.11 |
| CC.LOW | 0.95 | 0.58 | 2.16 | 0.43 | 0.43 | 6.58 | 9.95 | 1.65 | 8.89 | 8.03 |
| CC.MEDIUM | 0.03 | 1.51 | 12.48 | 6.39 | 11.92 | 4.35 | 6.34 | 8.05 | 2.02 | 0.11 |
| CC.VERY.HIGH | 6.25 | 0.87 | 12.06 | 4.33 | 6.27 | 1.71 | 1.48 | 5.59 | 0.48 | 0.04 |
| Eigenvalue | 3.7 | 2.58 | 2.22 | 2 | 1.86 | 1.49 | 1.36 | 1.28 | 1.19 | 1.08 |
| Proportion | 14.22 | 9.92 | 8.56 | 7.68 | 7.16 | 5.73 | 5.25 | 4.92 | 4.59 | 4.17 |
| Cumulative | 14.22 | 24.14 | 32.7 | 40.38 | 47.54 | 53.27 | 58.52 | 63.44 | 68.03 | 72.2 |
| Traits | Principal Components | ||||||||
|---|---|---|---|---|---|---|---|---|---|
| PC1 | PC2 | PC3 | PC4 | PC5 | PC6 | PC7 | PC8 | PC9 | |
| Eigenvalue | 5.27 | 2.43 | 1.90 | 1.81 | 1.65 | 1.53 | 1.28 | 1.21 | 1.10 |
| Proportion | 20.27 | 9.33 | 7.32 | 6.95 | 6.35 | 5.89 | 4.94 | 4.67 | 4.25 |
| Cumulative | 20.27 | 29.60 | 36.92 | 43.87 | 50.21 | 56.11 | 61.05 | 65.72 | 69.96 |
| Eigenvectors | |||||||||
| Petiole length | 0.254 | −0.047 | 0.335 | −0.218 | 0.042 | −0.020 | −0.361 | 0.247 | −0.093 |
| Leaf length | 0.370 | −0.008 | 0.225 | 0.059 | 0.029 | −0.030 | 0.187 | 0.024 | 0.062 |
| Lea diameter | 0.374 | −0.036 | 0.205 | 0.076 | 0.029 | −0.045 | 0.167 | −0.029 | 0.074 |
| Internode length | 0.078 | 0.027 | 0.323 | 0.064 | −0.010 | −0.256 | 0.459 | 0.143 | −0.289 |
| Vine length | −0.230 | 0.091 | 0.015 | −0.007 | 0.028 | −0.034 | 0.101 | 0.327 | −0.206 |
| Internode length to petiole length ratio | −0.211 | 0.076 | −0.211 | 0.231 | −0.063 | −0.087 | 0.603 | −0.146 | 0.042 |
| Fruit length | −0.046 | −0.512 | −0.088 | 0.011 | 0.255 | −0.276 | −0.028 | −0.058 | −0.109 |
| Fruit diameter | −0.038 | −0.319 | 0.128 | −0.004 | 0.057 | 0.452 | 0.145 | −0.063 | 0.054 |
| Fruit length-to-diameter ratio | −0.023 | −0.319 | −0.175 | 0.017 | 0.230 | −0.588 | −0.120 | −0.030 | −0.156 |
| Number of seeds per locule | −0.074 | −0.351 | 0.099 | −0.005 | −0.219 | 0.018 | 0.091 | 0.187 | 0.238 |
| Number of seeds per fruit | −0.086 | −0.434 | 0.121 | −0.013 | −0.118 | 0.117 | 0.091 | 0.029 | 0.117 |
| Fruit weight | −0.075 | −0.375 | 0.041 | −0.032 | −0.020 | 0.162 | 0.091 | 0.141 | 0.048 |
| Thousand seed weight | −0.019 | −0.096 | 0.002 | −0.020 | −0.167 | 0.280 | −0.060 | −0.304 | −0.462 |
| Seed yield | −0.034 | −0.172 | −0.026 | 0.066 | −0.141 | 0.083 | −0.069 | −0.361 | −0.005 |
| Root number per plot | 0.130 | −0.041 | −0.057 | −0.334 | 0.216 | 0.029 | 0.042 | −0.349 | 0.018 |
| Root length | 0.197 | 0.025 | 0.022 | −0.303 | 0.117 | 0.007 | 0.124 | −0.301 | −0.019 |
| Root diameter | −0.245 | 0.102 | 0.247 | −0.298 | 0.329 | 0.009 | 0.139 | −0.215 | 0.007 |
| Root length-to-diameter ratio | 0.283 | −0.072 | −0.200 | 0.211 | −0.288 | −0.005 | −0.098 | 0.057 | −0.042 |
| Root weight per plot | 0.255 | −0.041 | −0.416 | −0.294 | −0.083 | 0.063 | 0.170 | 0.140 | −0.094 |
| Root yield | 0.255 | −0.041 | −0.416 | −0.294 | −0.083 | 0.063 | 0.170 | 0.140 | −0.094 |
| Leaf area | 0.371 | −0.027 | 0.217 | 0.069 | 0.032 | −0.034 | 0.180 | −0.015 | 0.052 |
| Leaf area index | −0.202 | 0.017 | 0.139 | −0.280 | −0.125 | −0.003 | 0.073 | 0.180 | −0.075 |
| Canopy density | −0.042 | 0.011 | 0.125 | −0.193 | −0.465 | −0.290 | −0.013 | −0.256 | 0.136 |
| Gap fraction LAI | −0.094 | 0.004 | 0.115 | −0.288 | −0.484 | −0.262 | −0.011 | −0.101 | 0.066 |
| Chlorophyl content | 0.010 | −0.043 | 0.131 | 0.160 | −0.163 | 0.052 | −0.031 | −0.099 | −0.672 |
| Normalized difference vegetative index | −0.128 | −0.017 | −0.001 | −0.374 | 0.014 | 0.072 | 0.102 | 0.287 | −0.163 |
| Traits | Clusters | ||
|---|---|---|---|
| Cluster I | Cluster II | Cluster III | |
| Petiole length (cm) | 4.061 | 4.054 | 3.173 |
| Leaf length (cm) | 7.448 | 7.624 | 4.919 |
| Leaf diameter (cm) | 7.743 | 7.684 | 4.984 |
| Internode length (cm) | 10.294 | 10.365 | 10.135 |
| Vine length (m) | 1.830 | 2.103 | 2.588 |
| Internode length to petiole length ratio (cm) | 2.705 | 2.822 | 3.363 |
| Fruit length (cm) | 5.437 | 5.075 | 5.298 |
| Fruit diameter (cm) | 4.142 | 4.027 | 4.129 |
| Fruit length-to-diameter ratio (cm) | 1.322 | 1.265 | 1.290 |
| Number of seeds per locule | 18.197 | 16.767 | 18.310 |
| Number of seeds per fruit | 104.203 | 94.037 | 104.688 |
| Fruit weight (gm) | 329.828 | 305.729 | 337.918 |
| Thousand seed weight (gm) | 47.040 | 42.904 | 44.358 |
| Seed yield (gm) | 475.791 | 419.218 | 471.594 |
| Root number per plot | 2.112 | 2.236 | 1.695 |
| Root length (cm) | 12.148 | 12.461 | 10.811 |
| Root diameter (cm) | 6.888 | 6.719 | 10.138 |
| Root length-to-diameter ratio (cm) | 1.910 | 1.918 | 1.101 |
| Root weight per plot (kg) | 1.603 | 4.331 | 0.689 |
| Root yield (t) | 53.449 | 144.351 | 22.960 |
| Leaf area | 40.916 | 40.934 | 15.033 |
| Leaf area index | 0.672 | 0.649 | 1.321 |
| Canopy density | 36.467 | 38.213 | 38.380 |
| Gap fraction leaf area index | 0.487 | 0.524 | 0.705 |
| Chlorophyl content | 53.671 | 52.575 | 51.793 |
| Normalized difference vegetative index | 55.670 | 59.436 | 64.029 |
Disclaimer/Publisher’s Note: The statements, opinions and data contained in all publications are solely those of the individual author(s) and contributor(s) and not of MDPI and/or the editor(s). MDPI and/or the editor(s) disclaim responsibility for any injury to people or property resulting from any ideas, methods, instructions or products referred to in the content. |
© 2025 by the authors. Licensee MDPI, Basel, Switzerland. This article is an open access article distributed under the terms and conditions of the Creative Commons Attribution (CC BY) license (https://creativecommons.org/licenses/by/4.0/).
Share and Cite
Dibaba, D.B.; Olango, T.M.; Asfaw, B.T.; Mijena, D.F.; Terfa, M.T. Phenotypic Profiling of Anchote (Coccinia abyssinica (Lam.) Cogn.) Accessions Through Agro-Morphological and Physiological Markers. Plants 2025, 14, 2334. https://doi.org/10.3390/plants14152334
Dibaba DB, Olango TM, Asfaw BT, Mijena DF, Terfa MT. Phenotypic Profiling of Anchote (Coccinia abyssinica (Lam.) Cogn.) Accessions Through Agro-Morphological and Physiological Markers. Plants. 2025; 14(15):2334. https://doi.org/10.3390/plants14152334
Chicago/Turabian StyleDibaba, Dejene Bekele, Temesgen Magule Olango, Bizuayehu Tesfaye Asfaw, Desta Fikadu Mijena, and Meseret Tesema Terfa. 2025. "Phenotypic Profiling of Anchote (Coccinia abyssinica (Lam.) Cogn.) Accessions Through Agro-Morphological and Physiological Markers" Plants 14, no. 15: 2334. https://doi.org/10.3390/plants14152334
APA StyleDibaba, D. B., Olango, T. M., Asfaw, B. T., Mijena, D. F., & Terfa, M. T. (2025). Phenotypic Profiling of Anchote (Coccinia abyssinica (Lam.) Cogn.) Accessions Through Agro-Morphological and Physiological Markers. Plants, 14(15), 2334. https://doi.org/10.3390/plants14152334