

A Sustainable Approach to Phosphorus Nutrition in Banana Plantations

 , ,
, ,  , , , and
Abstract
1. Introduction
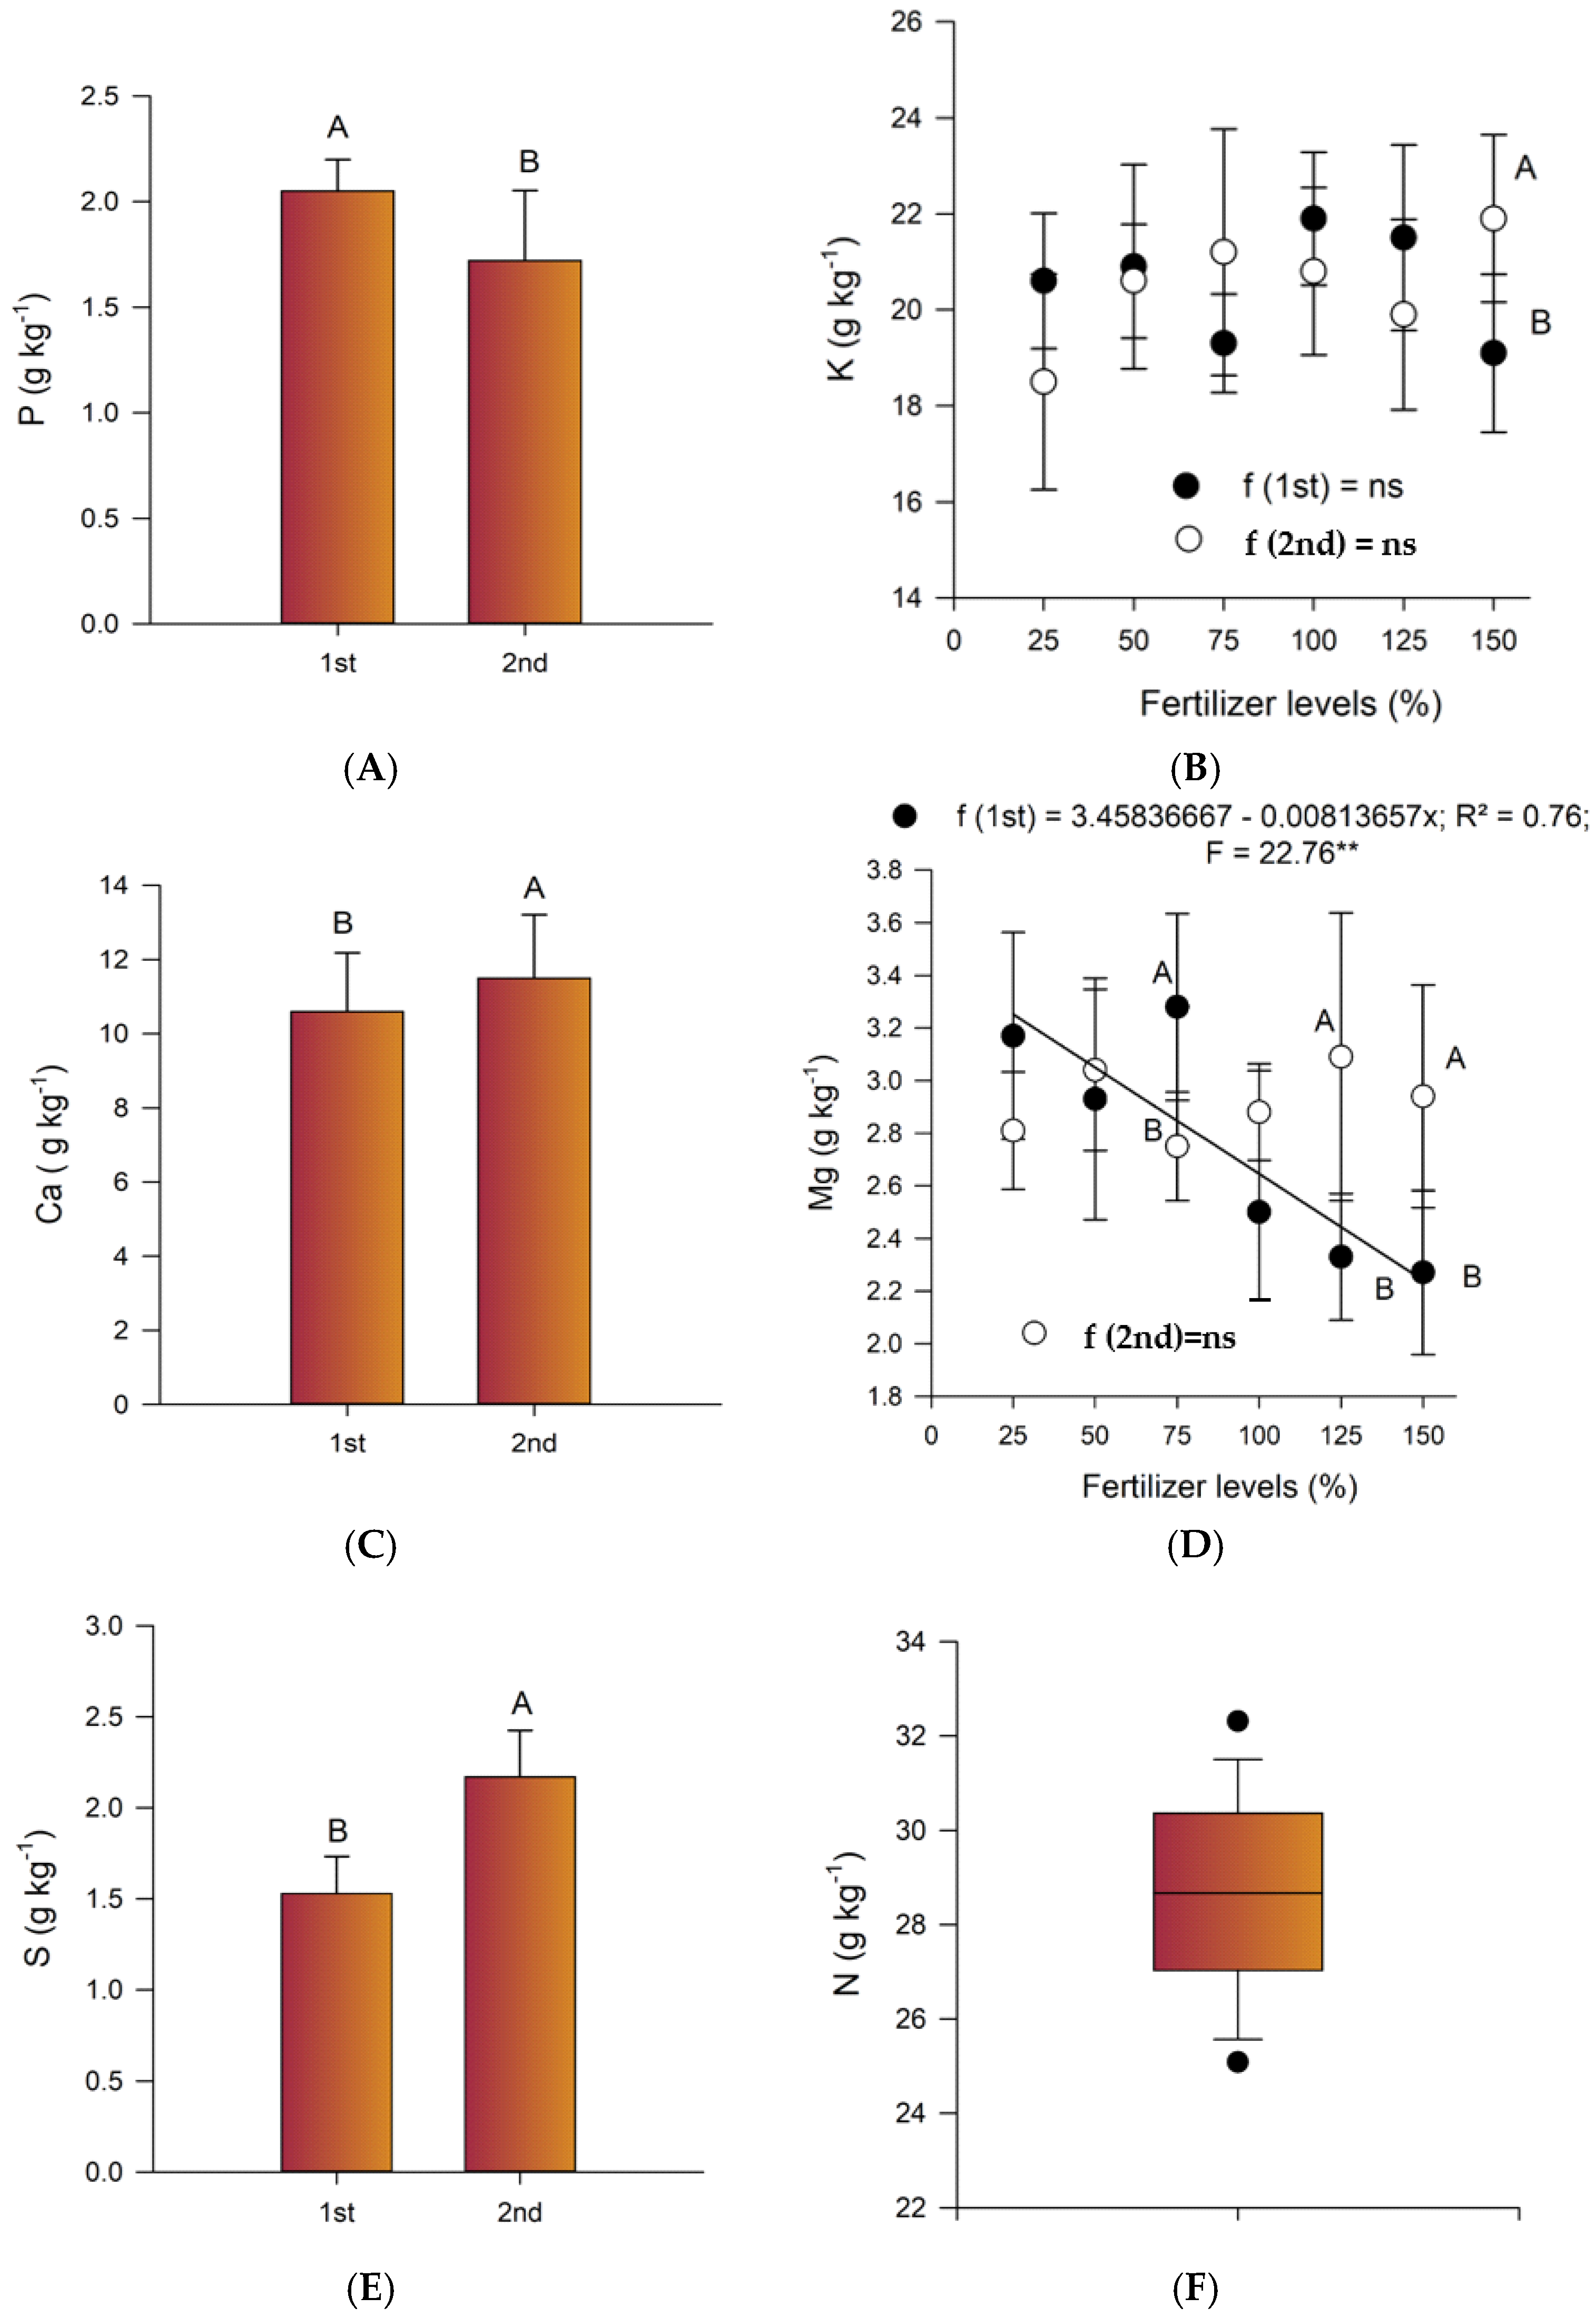
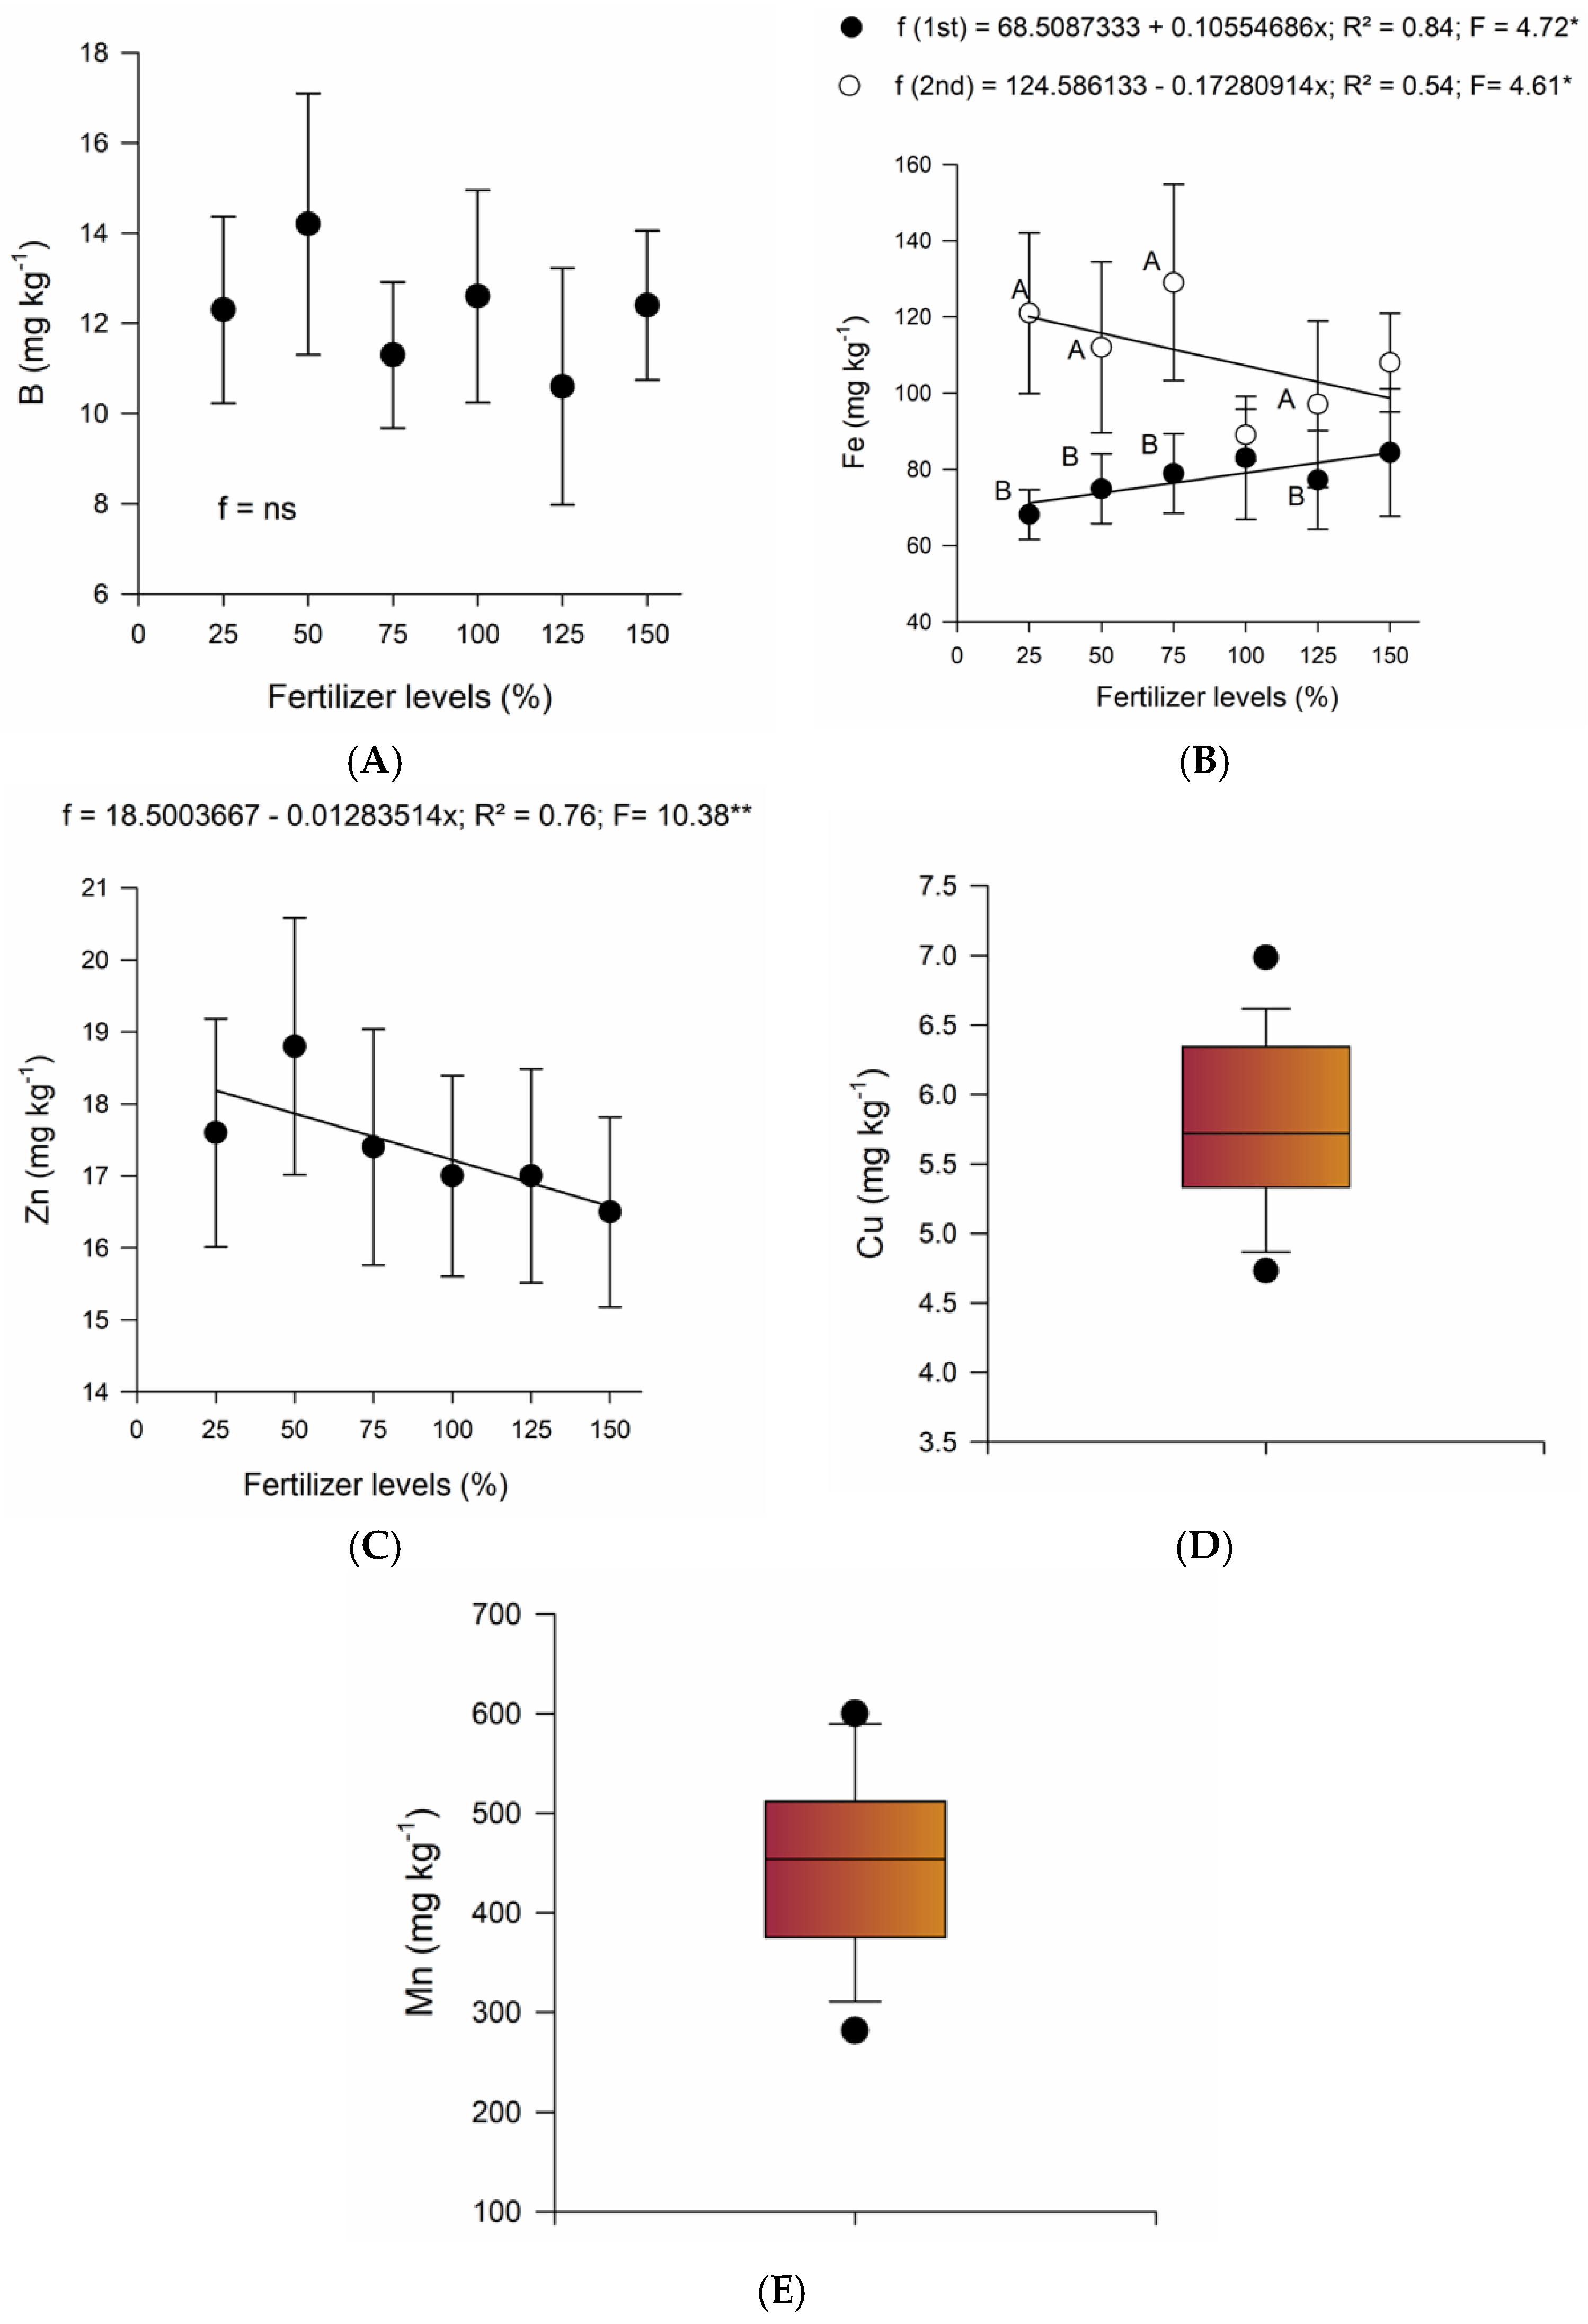
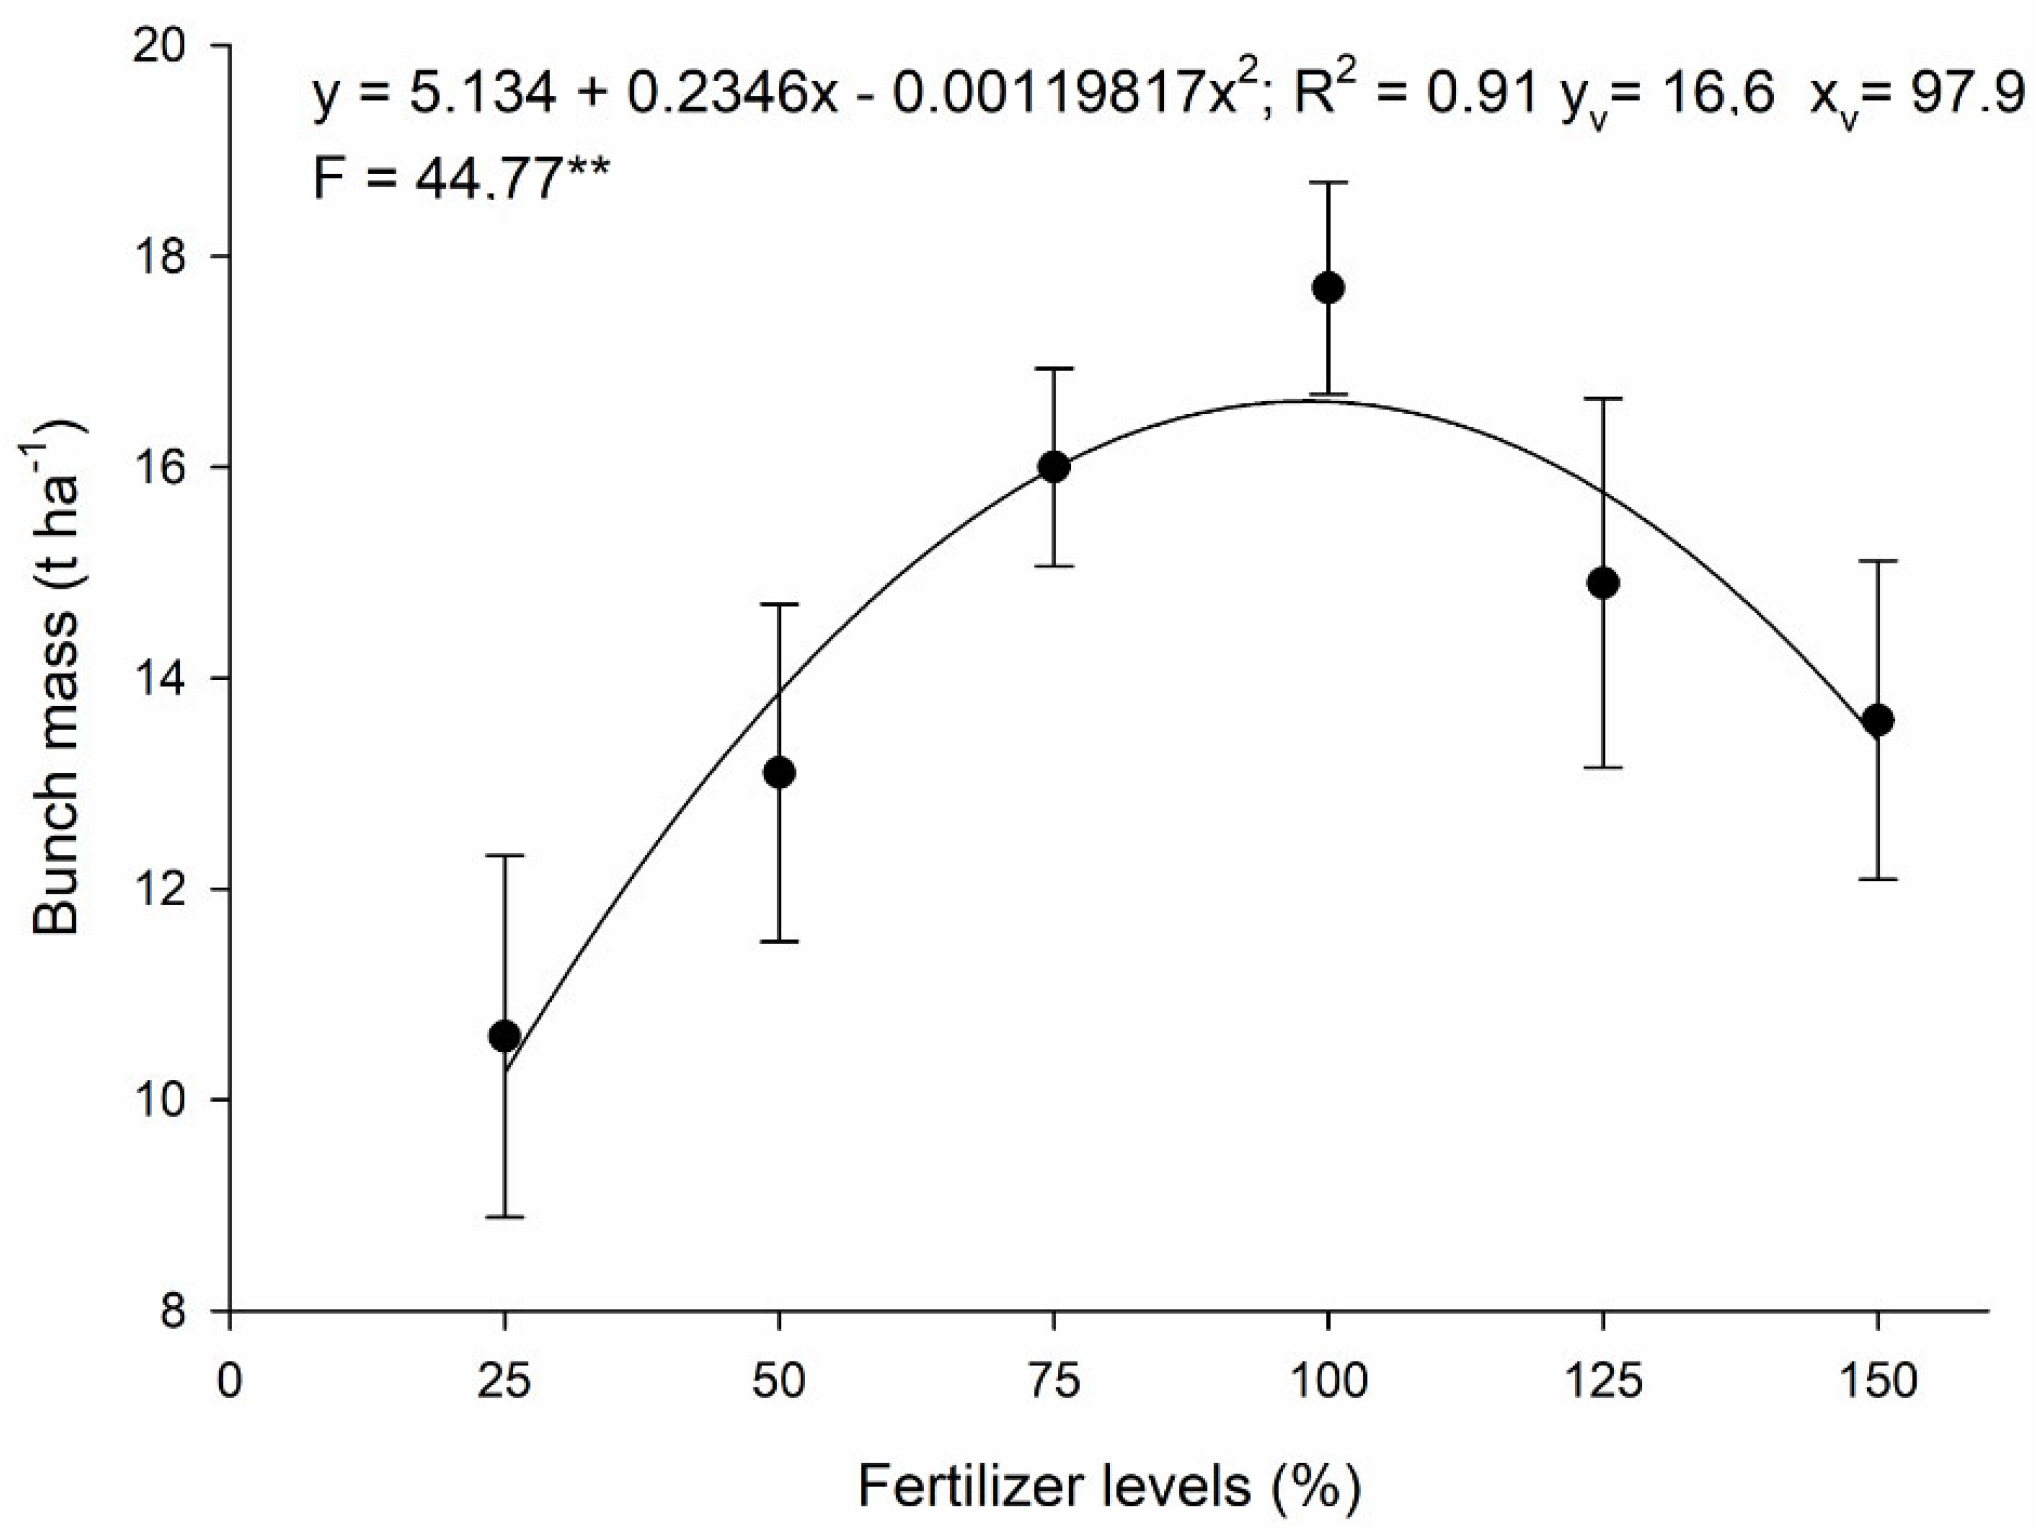
2. Results
2.1. Chemical Soil Properties
2.2. Leaf Nutrient Contents
3. Discussion
4. Materials and Methods
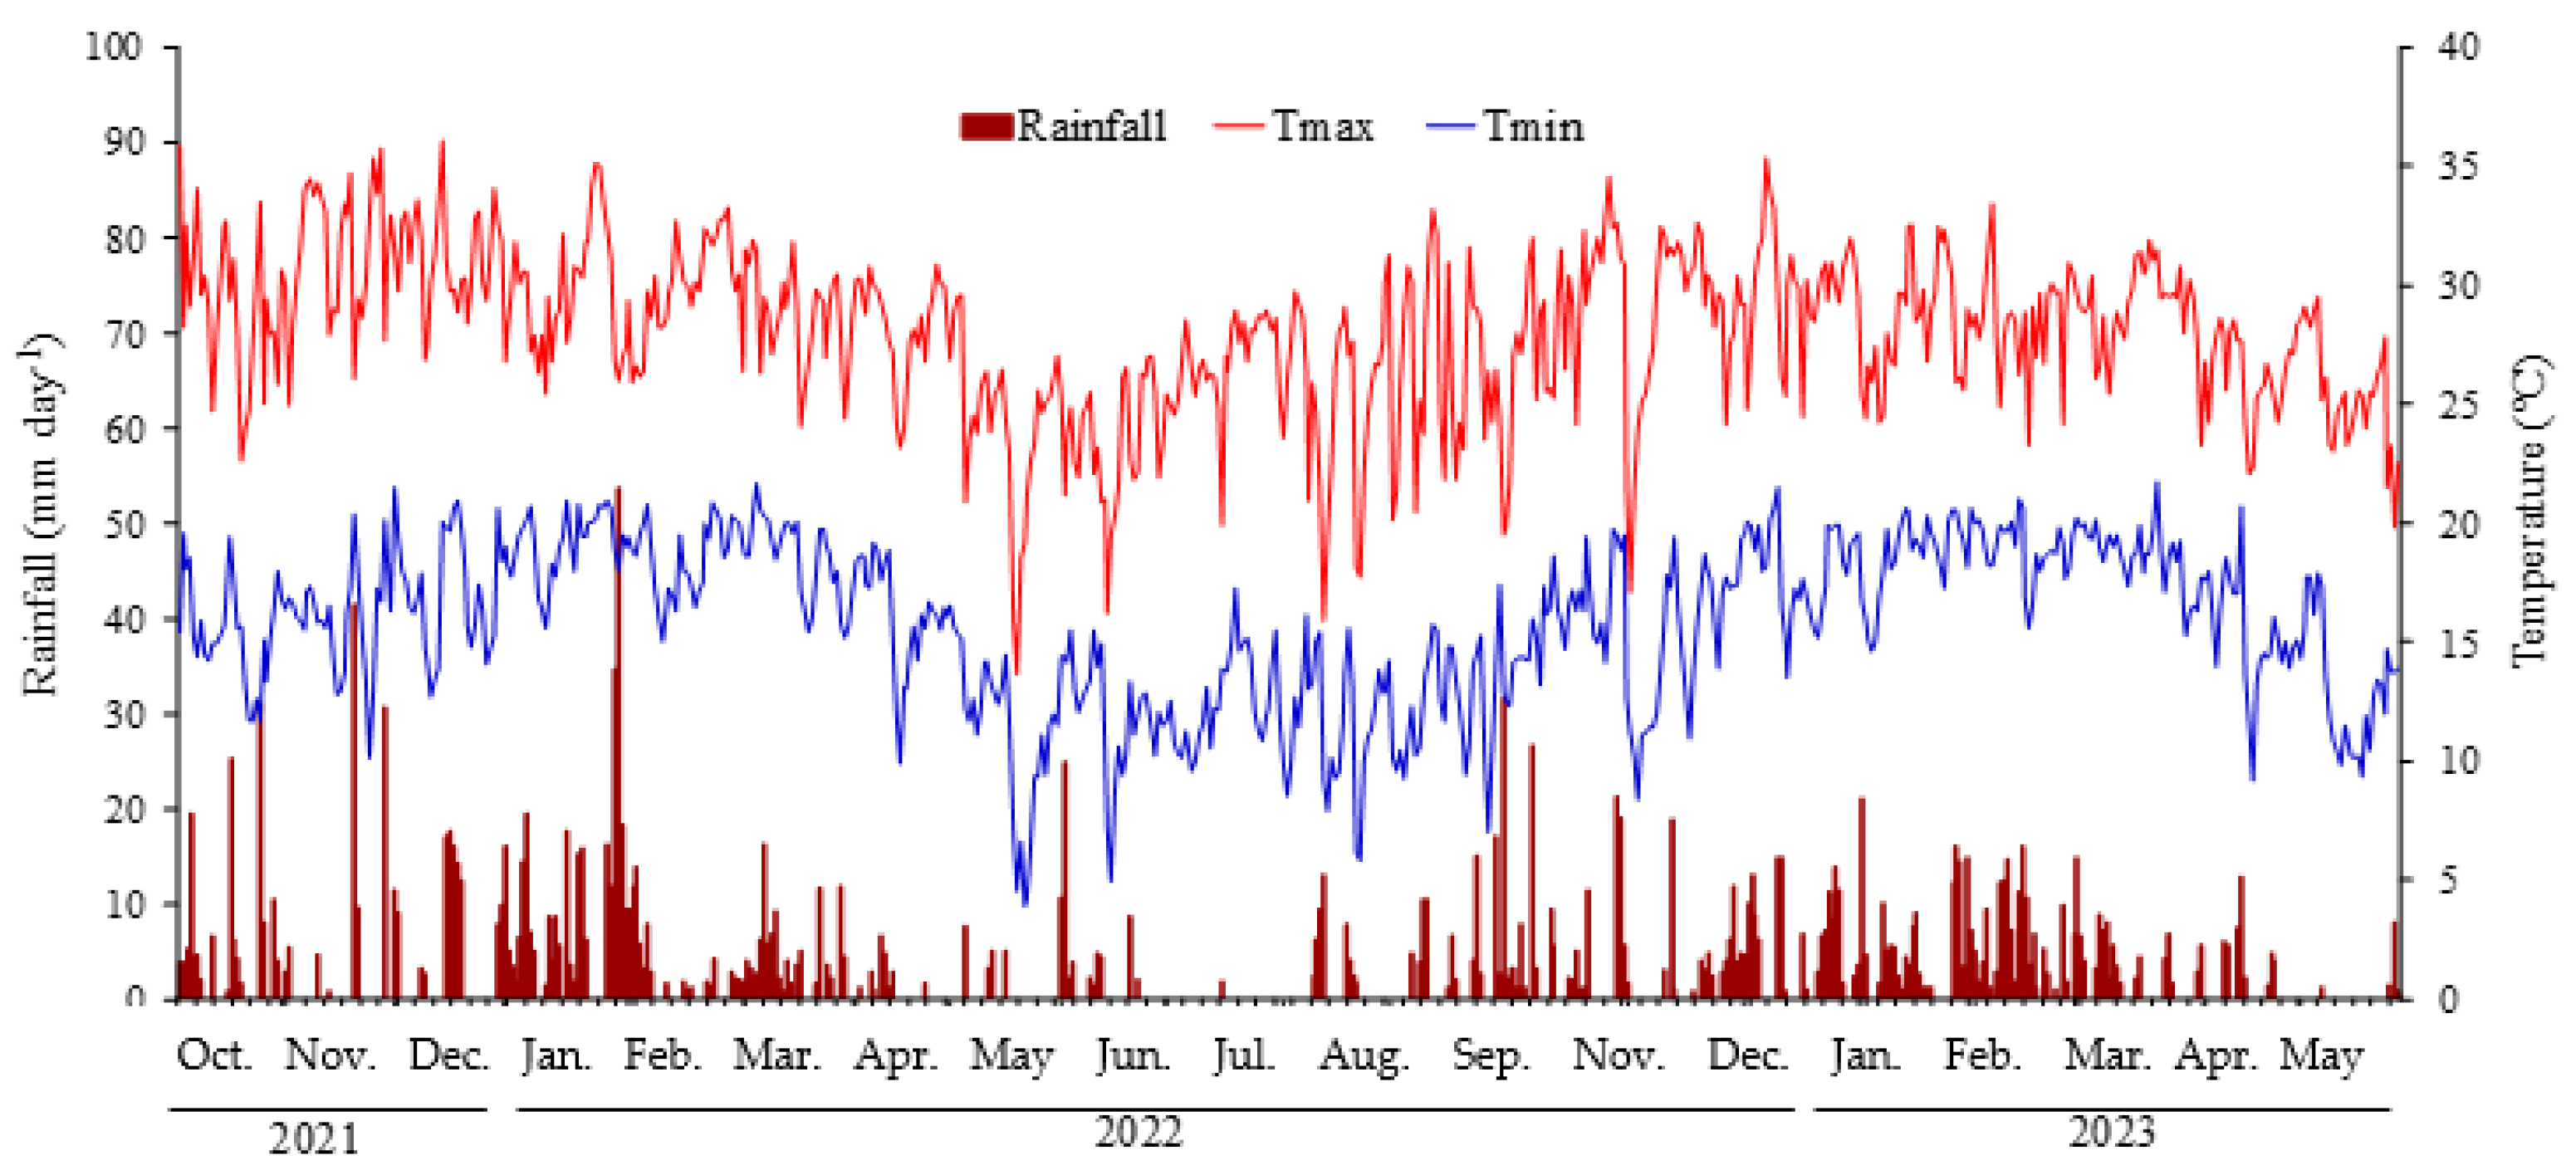
4.1. Site Description and Crop Management
4.2. Treatments and Experimental Design
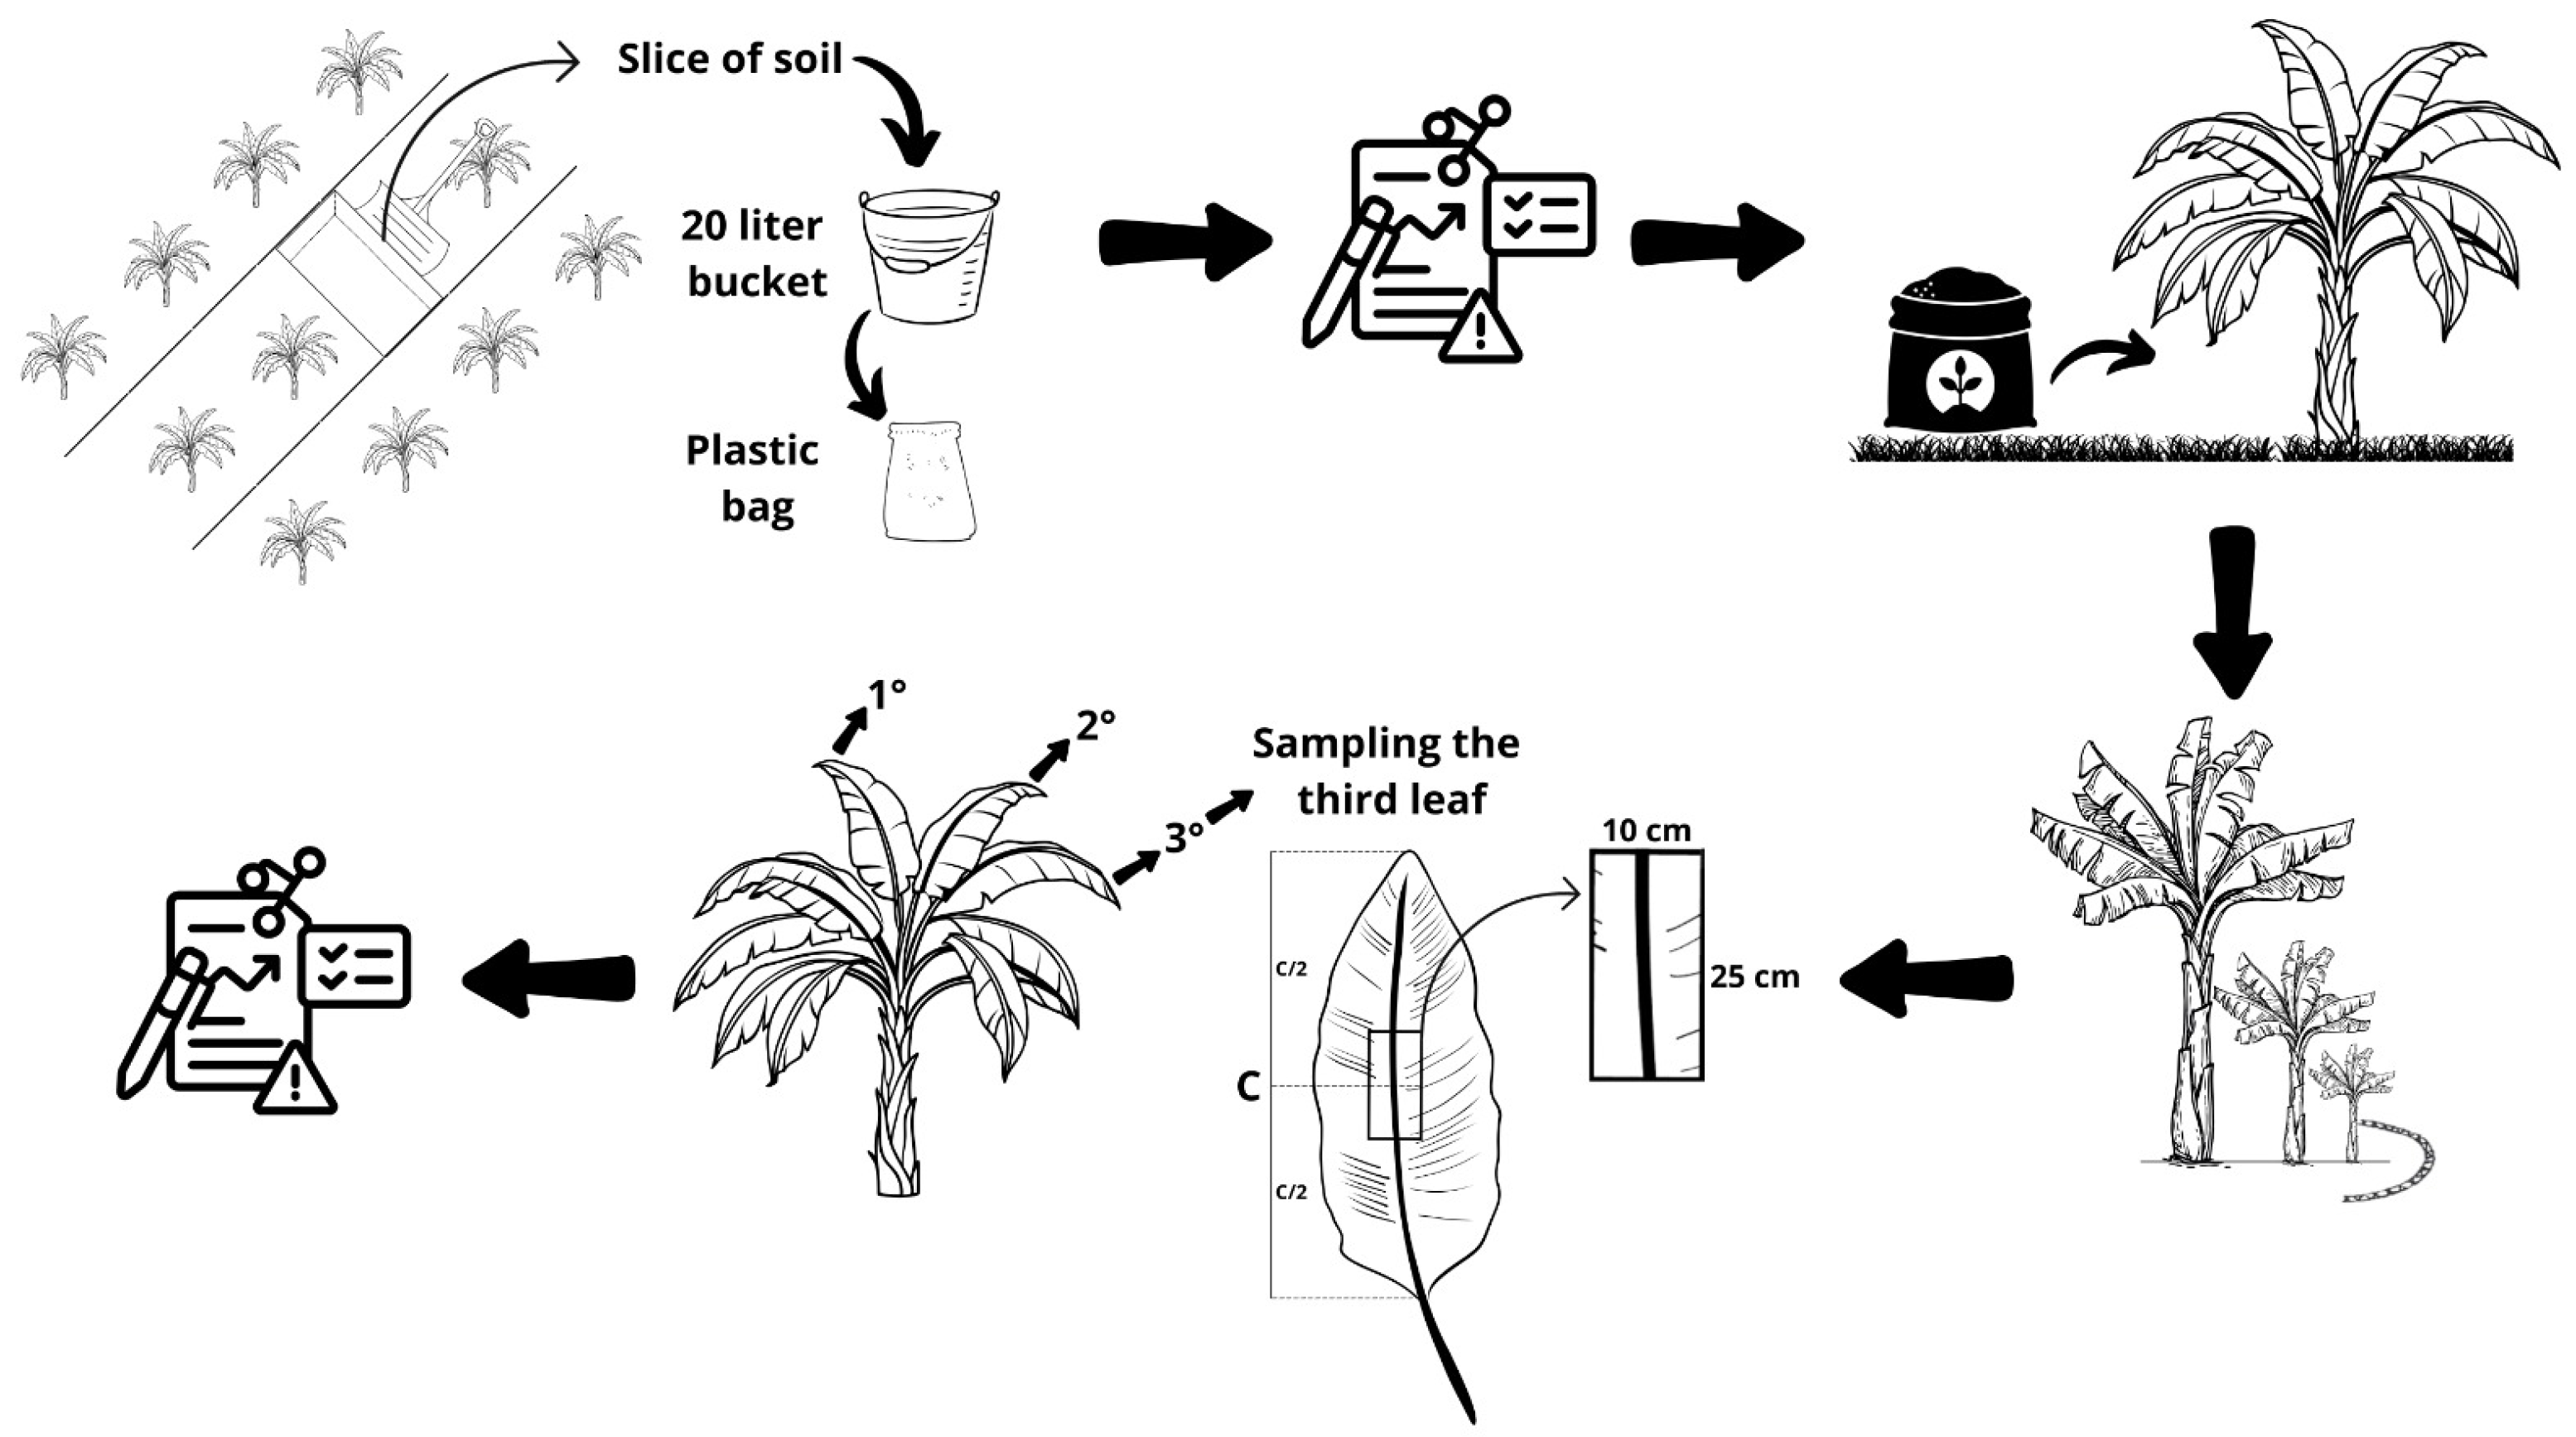
4.3. Soil and Leaf Analysis
4.4. Harvesting, Bunch Mass and Harvest Season Assessments
4.5. Statistical Analysis
5. Conclusions
Author Contributions
Funding
Data Availability Statement
Conflicts of Interest
References
- Kalaivanan, D.; Sudhir, K.; Venugopalan, R. Growth, Phosphorus Uptake and Yield of ‘Robusta’ Banana (Musa × paradisiaca) as Influenced by Dose and Placement of 32P Labelled Single Super Phosphate. Int. J. Curr. Microbiol. Appl. Sci. 2018, 7, 2338–2351. [Google Scholar] [CrossRef]
- Johnston, E.A.; Poulton, P.R.; Fixen, P.E.; Curtin, D. Phosphorus: Its Efficient Use in Agriculture. Adv. Agron. 2014, 123, 177–228. [Google Scholar] [CrossRef]
- Martinez, H.E.P.; Lucena, J.J.; Bonilla, I. Relações Solo-Planta: Bases para a Nutrição e Produção Vegetal; Editora UFV: Viçosa, Brazil, 2021. [Google Scholar]
- Benício, L.P. Overview of the Use of Phosphate Fertilizers in Brazil, a Review. Rev. Agri-Environ. Sci. 2022, 8, e022008. [Google Scholar] [CrossRef]
- Sasabuchi, I.T.M.; Krieger, K.S.; Nunes, R.S.; Ferreira, A.C.; Xavier, G.T.M.; Urzedo, A.L.; Carvalho, W.A.; Fadini, P.S. Sustainability in Phosphorus Use: A Bibliographic Review Focusing on the Current Situation in the State of São Paulo, Brazil. Quim. Nova 2023, 46, 185–198. [Google Scholar] [CrossRef]
- Xiong, R.; Tang, H.; Xu, M.; Zeng, C.; Peng, Y.; He, R.; Yan, Z.; Qi, Z.; Cheng, Y. Transcriptomic Analysis of Banana in Response to Phosphorus Starvation Stress. Agronomy 2018, 8, 141. [Google Scholar] [CrossRef]
- Bolfarini, A.C.B.; Leonel, S.; Leonel, M.; Tecchio, M.A.; Silva, M.S.; Souza, J.M.A. Growth, Yield and Fruit Quality of ‘Maçã’ Banana under Different Rates of Phosphorus Fertilization. Aust. J. Crop Sci. 2016, 10, 1368–1374. [Google Scholar] [CrossRef]
- Bolfarini, A.C.B.; Putti, F.F.; Souza, J.M.A.; Silva, M.S.; Ferreira, R.B.; Leonel, M.; Tecchio, M.A.; Leonel, S. Application of Phosphate Fertilization on Banana Hybrid ‘FHIA 18’ and Its Impact on Production Performance. Aust. J. Crop Sci. 2020, 14, 744–750. [Google Scholar] [CrossRef]
- Leonel, S.; Bolfarini, A.C.B.; Souza, J.M.A.; Leonel, M.; Ferreira, R.B.; Putti, F.F.; Tecchio, M.A. Agronomic Performance of Banana ‘FHIA 18’ in Response to Phosphate Fertilization. Agron. J. 2020, 112, 2033–2046. [Google Scholar] [CrossRef]
- Guimarães, G.G.F.; Deus, J.A.L.; Rozane, D.E. Calagem, Adubações e Valores de Referência de Nutrientes na Cultura da Banana. In Atualização Sobre Calagem e Adubação em Frutíferas; Brunetto, G., Ed.; Núcleo Regional Sul da Sociedade Brasileira de Ciência do Solo: Porto Alegre, Brazil, 2020; pp. 65–77. [Google Scholar]
- Fageria, N.K.; Santos, A.B. Lowland Rice Response to Thermophosphate Fertilization. Commun. Soil Sci. Plant Anal. 2008, 39, 873–889. [Google Scholar] [CrossRef]
- Keeping, M.G. Uptake of Silicon by Sugarcane from Applied Sources May Not Reflect Plant-Available Soil Silicon and Total Silicon Content of Sources. Front. Plant Sci. 2017, 8, 760. [Google Scholar] [CrossRef]
- Rufyikiri, G.; Dufey, J.E.; Nootens, D.; Delvaux, B. Effect of Aluminium on Bananas (Musa spp.) Cultivated in Acid Solutions. II. Water and Nutrient Uptake. Fruits 2001, 56, 5–16. [Google Scholar] [CrossRef]
- Rufyikiri, G.; Nootens, D.; Dufey, J.E.; Delvaux, B. Mobilization of Aluminium and Magnesium by Roots of Banana (Musa spp.) from Kaolinite and Smectite Clay Minerals. Appl. Geochem. 2004, 19, 633–643. [Google Scholar] [CrossRef]
- Napoleão, G.M.; Jesus, P.R.R.; Leonel, S. Cultivar Diversification of Banana Production in Brazil. Agron. Sci. Biotechnol. 2021, 7, 1–14. [Google Scholar] [CrossRef]
- Donato, S.L.R.; Borém, A.; Rodrigues, M.G.V. Banana: Do Plantio à Colheita; Epamig: Belo Horizonte, Brazil, 2021. [Google Scholar]
- Scherer, R.F.; Lichtemberg, L.A.; Maro, L.A.C.; Beltrame, A.B.; Klabunde, G.H.F.; Sônego, M.; Peruch, L.A.M.; Amorim, E.P.; Serejo, J.A.S.; Ferreira, C.F.; et al. BRS SCS Belluna—A New Banana Cultivar for Processing and Fresh Consumption. Agropecu. Catarin. 2020, 33, 32–37. [Google Scholar] [CrossRef]
- Leonel, S.; Leonel, M.; Tecchio, M.A.; Candeias, C.S.; Jesus, P.R.R.; Cândido, H.T.; Duarte Filho, J. Diversificação de Cultivares de Bananeira nas Regiões Centro Sul e Oeste do Estado de São Paulo; CERAT/UNESP: Botucatu, Brazil, 2025; Boletim Técnico-Científico; Volume 1, no. 2; 24p. [Google Scholar]
- Borges, A.L.; Oliveira e Silva, S.; Caldas, R.C.; Ledo, C.A.S. Teores Foliares de Nutrientes em Genótipos de Bananeira. Rev. Bras. Frutic. 2006, 28, 314–318. [Google Scholar] [CrossRef]
- Abdel-Fattah, M.K.; Mohamed, E.S.; Wagdi, E.M.; Shahin, S.A.; Aldosari, A.A.; Lasaponara, R.; Alnaimy, M.A. Quantitative Evaluation of Soil Quality Using Principal Component Analysis: The Case Study of El-Fayoum Depression Egypt. Sustainability 2021, 13, 1824. [Google Scholar] [CrossRef]
- Fernandes, M.S.; Souza, S.R.; Santos, L.A. Nutrição Mineral de Plantas [Mineral Nutrition of Plants], 2nd ed.; SBCS: Viçosa, Brazil, 2018. [Google Scholar]
- Cândido, H.T.; Leonel, M.; Nomura, E.S.; Leonel, S. O Fósforo no Cultivo de Bananeiras. In Ciências Agrárias e da Natureza: Novas Abordagens Para a Coexistência e o Desenvolvimento Sustentável; Santos, E.D., Barbosa, M.S., Mello, R.G., Eds.; e-Publicar: Rio de Janeiro, Brazil, 2024; pp. 2012–2028. [Google Scholar] [CrossRef]
- Li, J.; Wu, B.; Zhang, D.; Cheng, X. Elevational Variation in Soil Phosphorus Pools and Controlling Factors in Alpine Areas of Southwest China. Geoderma 2023, 431, 116361. [Google Scholar] [CrossRef]
- Pastore, G.; Kernchen, S.; Spohn, M. Microbial Solubilization of Silicon and Phosphorus from Bedrock in Relation to Abundance of Phosphorus-Solubilizing Bacteria in Temperate Forest Soils. Soil Biol. Biochem. 2020, 151, 108050. [Google Scholar] [CrossRef]
- Cartes, P.; Cea, M.; Jara, A.; Violante, A.; Mora, M.L. Description of Mutual Interactions between Silicon and Phosphorus in Andisols by Mathematical and Mechanistic Models. Chemosphere 2015, 131, 164–170. [Google Scholar] [CrossRef]
- Moreira, A.; Fageria, N.K. Repartition and Remobilization of Nutrients in Banana Trees. Rev. Bras. Frutic. 2009, 31, 574–581. [Google Scholar] [CrossRef]
- van Raij, B.; Andrade, J.C.; Cantarella, H.; Quaggio, J.A. Análise Química para Avaliação da Fertilidade de Solos Tropicais; Instituto Agronômico: Campinas, Brazil, 2001. [Google Scholar]
- Franco, J.R.; Dal Pai, E.; Calça, M.V.C.; Raniero, M.R.; Dal Pai, A.; Sarnighausen, V.C.R.; Román, R.M.S. Update of Climatological Normal and Köppen Climate Classification for the Municipality of Botucatu-SP. Irriga 2023, 28, 77–92. [Google Scholar] [CrossRef]
- Cunha, A.R.; Martins, D. Classificação Climática para os Municípios de Botucatu e São Manuel, SP. Irriga 2009, 14, 1–11. [Google Scholar] [CrossRef]
- Costa, L.G.A.F.; Rozane, D.E.; Silva, S.A.; Oliveira, C.T.; Pavarin, L.G.F.; Silva, S.H.M.G. Seasonality in Nutrient Content of Banana Diagnostic Leaf. Rev. Bras. Frutic. 2019, 41, e-151. [Google Scholar] [CrossRef]
- Teixeira, L.A.J.; Zambrosi, F.C.B.; Bettiol Neto, J.E. Avaliação do Estado Nutricional de Bananeiras do Subgrupo Cavendish no Estado de São Paulo: Normas DRIS e Níveis Críticos de Nutrientes. Rev. Bras. Frutic. 2007, 29, 613–620. [Google Scholar] [CrossRef]
- Saha, S.; Verna, B.C.; Bhaduri, D.; Roy, S. Managment of phosphorus-zinc antagonism to improve nutrient use efficiency. Food Sci. Rep. 2022, 3, 40–42. [Google Scholar]
- Cakmak, I.; Hengeler, C.; Marschner, H. Partitioning of shoot and root dry matter and carbohydrates in bean plants suffering from phosphorus, potassium and magnesium deficiency. J. Exp. Bot. 1994, 45, 1245–1250. [Google Scholar] [CrossRef]
- Xie, K.; Cakmak, I.; Wang, S.; Zhang, F.; Guo, S. Synergistic and antagonistic interactions between potassium and magnesium in higher plants. Crop J. 2021, 9, 249–256. [Google Scholar] [CrossRef]
- Oliveira, O.; Rozane, D.E.; Lima Neto, A.J.d.; Natale, W. Nutrient parameters limiting banana plant development in Vale do Ribeira, São Paulo State, Brazil. Cienc. Rural. 2024, 54, e20220410. [Google Scholar] [CrossRef]
- Teixeira, L.A.J.; van Raij, B.; Bettiol Neto, J.E. Estimativa das Necessidades Nutricionais de Bananeiras do Subgrupo Cavendish Cultivadas no Estado de São Paulo. Rev. Bras. Frutic. 2008, 30, 540–545. [Google Scholar] [CrossRef]
- Teixeira, L.A.J.; Quaggio, J.A.; Rozane, D.E.; Nomura, E.S. Banana (Diversas Plantas do Gênero Musa). In Recomendações de Adubação e Calagem para o Estado de São Paulo; Cantarela, H., Quaggio, J.A., Mattos, D., Jr., Boaretto, R.M., van Raij, B., Eds.; Instituto Agronômico de Campinas: Campinas, Brazil, 2022; Boletim 100. [Google Scholar]
- Debicka, M. The Role of Organic Matter in Phosphorus Retention in Eutrophic and Distrophic Terrestrial Ecosystems. Agronomy 2024, 14, 1688. [Google Scholar] [CrossRef]
- Horta, C. Fertilisation with Compost: Effect on Soil Phosphorus Sorption and on Phosphorus Availability in Acid Soils. Open J. Soil Sci. 2019, 9, 255–268. [Google Scholar] [CrossRef]
- Gao, Y.; Zhu, B.; He, N.; Yu, G.; Wang, T.; Chen, W.; Tian, J. Phosphorus and Carbon Competitive Sorption-desorption and Associated Non-point Loss Respond To Natural Rainfall Events. J. Hydrol. 2014, 517, 447–457. [Google Scholar] [CrossRef]
- Soil Survey Staff. Keys to Soil Taxonomy, 12th ed.; USDA, Natural Resources Conservation Service: Washington, DC, USA, 2014. [Google Scholar]
- Oliveira, H.S.; Lemos, O.F.; Miranda, V.S.; Moura, H.C.P.; Campelo, M.F.; Santos, L.R.R. Estabelecimento e multiplicação in vitro de brotos no processo de micropropagação de cultivares de bananeira (Musa spp.). Acta Amaz. 2011, 41, 369–376. [Google Scholar] [CrossRef]
- Teixeira, L.A.J.; Nomura, E.S.; Damatto, E.R., Jr.; Fuzitani, E.J. Banana Musa spp. In Instruções Agrícolas Para as Principais Culturas Econômicas, 7th ed.; Aguiar, A.T.E., Gonçalves, C., Paterniani, M.E.A.G.Z., Tucci, M.L.S., Castro, C.E.F., Eds.; Instituto Agronômico de Campinas: Campinas, Brazil, 2014; Boletim 200. [Google Scholar]
- Malavolta, E.; Vitti, G.C.; Oliveira, S.A. Avaliação do Estado Nutricional das Plantas: Princípios e Aplicações, 2nd ed.; Potafos: Piracicaba, Brazil, 1997. [Google Scholar]
- R Core Team. R: A Language and Environment for Statistical Computing; R Foundation for Statistical Computing: Vienna, Austria, 2023; Available online: https://www.R-project.org/ (accessed on 13 February 2025).
- Lumivero. XLSTAT Statistical and Data Analysis Solution; Lumivero: New York, NY, USA, 2024. [Google Scholar]


| Fertilization Levels | OM (g dm−3) | pH * | Al3+ (mmolc dm−3) | H (mmolc dm−3) | CEC (mmolc dm−3) | BS (%) |
|---|---|---|---|---|---|---|
| 25% | 7.07 | 4.65 | 1.35 | 17.9 | 38.6 | 49.2 |
| 50% | 7.39 | 4.42 | 2.37 | 17.3 | 37.3 | 47.0 |
| 75% | 8.38 | 4.67 | 1.58 | 17.1 | 38.9 | 50.9 |
| 100% | 7.71 | 4.59 | 1.55 | 16.2 | 37.1 | 49.8 |
| 125% | 6.78 | 4.82 | 0.99 | 17.6 | 38.2 | 50.7 |
| 150% | 9.03 | 4.71 | 1.69 | 17.3 | 39.3 | 50.9 |
| p-value | 0.4971 | 0.6815 | 0.6086 | 0.6871 | 0.9560 | 0.9812 |
| Average | 7.73 | 4.64 | 1.59 | 17.2 | 38.2 | 49.7 |
| CV (%) | 12.4 | 3.30 | 25.1 | 5.27 | 6.73 | 11.8 |
| Fertilization Levels | K (mmolc dm−3) | Ca (mmolc dm−3) | Mg (mmolc dm−3) | S (mg dm−3) | Si (mg dm−3) |
|---|---|---|---|---|---|
| 25% | 2.86 | 11.9 | 2.67 | 3.31 | 4.20 |
| 50% | 2.64 | 11.9 | 3.04 | 5.08 | 4.55 |
| 75% | 3.08 | 13.1 | 3.33 | 4.02 | 4.42 |
| 100% | 3.47 | 11.6 | 3.42 | 4.48 | 4.48 |
| 125% | 2.46 | 13.6 | 3.55 | 3.31 | 5.42 |
| 150% | 2.70 | 13.8 | 3.89 | 4.90 | 5.14 |
| p-value | 0.4597 | 0.9497 | 0.2271 | 0.0804 | 0.8757 |
| Average | 2.87 | 12.5 | 3.32 | 4.18 | 4.70 |
| CV (%) | 14.4 | 18.9 | 11.8 | 13.4 | 17.5 |
| Fertilization Levels | Presin | Ptotal | Ptotal − Presin |
|---|---|---|---|
| (mg dm−3) | |||
| 25% | 7.56 | 237.2 | 229.7 |
| 50% | 6.99 | 239.4 | 232.4 |
| 75% | 6.69 | 216.6 | 209.9 |
| 100% | 9.64 | 268.4 | 258.8 |
| 125% | 12.1 | 237.0 | 225.0 |
| 150% | 13.5 | 228.2 | 214.5 |
| p-value | 0.3249 | 0.6048 | 0.5962 |
| Average | 9.40 | 237.8 | 228.4 |
| CV (%) | 29.7 | 8.86 | 9.06 |
| Nutrient | Equation | R2 | F Value |
|---|---|---|---|
| Ca | y = 10.8620000 + 0.01894857x | 0.6408 | 0.94 |
| y = 10.9970000 + 0.01489857x + 0.00002314x2 | 0.6421 | >0.00 | |
| Mg | y = 2.54266667 + 0.00884571x | 0.9558 | 7.21 * |
| y = 2.40700000 + 0.01291571x − 0.00002326x2 | 0.9646 | 0.24 | |
| Si | y = 3.96440000 + 0.00841829x | 0.6970 | 1.15 |
| y = 4.15040000 + 0.00283829x + 0.00003189x2 | 0.7103 | 0.03 | |
| P | y = 4.63693333 + 0.05443886x | 0.8084 | 4.78 * |
| y = 8.09160000 − 0.04920114x + 0.00059223x2 | 0.9359 | 0.68 |
| Fertilizer Levels | B (mg dm−3) | Cu (mg dm−3) | Fe (mg dm−3) | Mn (mg dm−3) | Zn (mg dm−3) |
|---|---|---|---|---|---|
| 25% | 0.14 | 2.42 | 28.6 | 5.37 | 2.56 |
| 50% | 0.16 | 3.10 | 29.8 | 6.90 | 2.58 |
| 75% | 0.15 | 2.96 | 26.3 | 7.50 | 2.73 |
| 100% | 0.18 | 3.19 | 27.5 | 8.13 | 3.09 |
| 125% | 0.15 | 3.21 | 28.5 | 7.75 | 3.00 |
| 150% | 0.19 | 2.88 | 25.8 | 6.50 | 2.12 |
| p-value | 0.3046 | 0.3248 | 0.8587 | 0.5364 | 0.7018 |
| Average | 0.16 | 2.96 | 27.7 | 7.02 | 2.68 |
| CV (%) | 13.0 | 10.4 | 10.8 | 18.1 | 19.6 |
| Factors | N | P | K | Ca | Mg | S |
|---|---|---|---|---|---|---|
| F value | ||||||
| TF | 2.25 | 1.23 | 1.07 | 2.28 | 3.14 * | 0.79 |
| CS | 0.25 | 27.4 ** | 0.03 | 5.40 * | 4.53 * | 117.1 ** |
| TFxCS | 0.77 | 1.04 | 2.85 * | 0.56 | 6.12 ** | 2.04 |
| (g kg−1) | ||||||
| Average | 28.5 | 1.89 | 20.5 | 11.0 | 2.83 | 1.85 |
| CV (%) | 4.25 | 6.78 | 4.97 | 7.36 | 6.10 | 6.36 |
| B | Cu | Fe | Mn | Zn | ||
| F value | ||||||
| TF | 3.28 * | 1.05 | 1.69 | 2.32 | 3.64 ** | |
| CS | 2.55 | 2.61 | 67.7 ** | 2.73 | 1.59 | |
| TFxCS | 0.59 | 1.56 | 3.54 ** | 2.08 | 1.85 | |
| (mg kg−1) | ||||||
| Average | 12.2 | 5.78 | 93.6 | 440 | 17.4 | |
| CV (%) | 9.08 | 5.80 | 7.86 | 10.6 | 4.03 | |
Disclaimer/Publisher’s Note: The statements, opinions and data contained in all publications are solely those of the individual author(s) and contributor(s) and not of MDPI and/or the editor(s). MDPI and/or the editor(s) disclaim responsibility for any injury to people or property resulting from any ideas, methods, instructions or products referred to in the content. |
© 2025 by the authors. Licensee MDPI, Basel, Switzerland. This article is an open access article distributed under the terms and conditions of the Creative Commons Attribution (CC BY) license (https://creativecommons.org/licenses/by/4.0/).
Share and Cite
Cândido, H.T.; Leonel, M.; Leonel, S.; Fernandes, A.M.; Souza, J.M.A.; dos Ouros, L.F.; de Jesus, P.R.R. A Sustainable Approach to Phosphorus Nutrition in Banana Plantations. Plants 2025, 14, 1923. https://doi.org/10.3390/plants14131923
Cândido HT, Leonel M, Leonel S, Fernandes AM, Souza JMA, dos Ouros LF, de Jesus PRR. A Sustainable Approach to Phosphorus Nutrition in Banana Plantations. Plants. 2025; 14(13):1923. https://doi.org/10.3390/plants14131923
Chicago/Turabian StyleCândido, Hebert Teixeira, Magali Leonel, Sarita Leonel, Adalton Mazetti Fernandes, Jackson Myrellis Azevêdo Souza, Lucas Felipe dos Ouros, and Paulo Ricardo Rodrigues de Jesus. 2025. "A Sustainable Approach to Phosphorus Nutrition in Banana Plantations" Plants 14, no. 13: 1923. https://doi.org/10.3390/plants14131923
APA StyleCândido, H. T., Leonel, M., Leonel, S., Fernandes, A. M., Souza, J. M. A., dos Ouros, L. F., & de Jesus, P. R. R. (2025). A Sustainable Approach to Phosphorus Nutrition in Banana Plantations. Plants, 14(13), 1923. https://doi.org/10.3390/plants14131923