Article

Genetic Diversity and Population Structure of Wild Ancient Camellia tetracocca in Pu’an, Guizhou, China

1
Engineering Technology Research Center of National Forestry and Grassland Administration on Southwest Landscape Architecture, College of Landscape Architecture and Horticulture Sciences, Southwest Forestry University, Kunming 650224, China
2
Yunnan Key Laboratory of Genetic Improvement of Herbal Oil Crops, Industrial Crops Research Institute, Yunnan Academy of Agricultural Sciences, Kunming 650225, China
3
Zhenyuan Yi Hani Lahu Autonomous County Forestry Science and Technology Extension Center, Lincang 666599, China
*
Authors to whom correspondence should be addressed.
These authors contributed equally to this work.
Plants 2025, 14(11), 1709; https://doi.org/10.3390/plants14111709
Submission received: 19 April 2025 / Revised: 28 May 2025 / Accepted: 30 May 2025 / Published: 4 June 2025
(This article belongs to the Special Issue Genetic Diversity and Population Structure of Plants)

Abstract

Pu’an County, located in southwestern Guizhou Province, China, is one of the original habitats for wild tea plants. It is renowned not only as the “Home of Ancient Tea Trees in China” but also as the “Core Production Area for High-Quality Early Tea in China”. The wild ancient Camellia tetracocca tea trees are considered “living fossil”. Understanding the genetic diversity of wild ancient C. tetracocca in Pu’an, Guizhou, is of great significance for addressing conservation concerns and mitigating genetic erosion in this endemic species. This study investigates the genetic diversity and population structure of wild ancient C. tetracocca tea plants in Pu’an County to support the development of conservation strategies. We genotyped 138 ancient wild C. tetracocca specimens using 40 intron-length polymorphism markers. A total of 180 alleles were detected, with the allele numbers per locus ranging from 2 to 10 and an average of 4.50. The number of effective alleles varied from 1.36 to 8.01, with an average of 2.86. The Shannon information index ranged from 0.28 to 2.19, with an average of 1.10. Nei’s gene diversity index ranged from 0.14 to 0.88, with an average of 0.58. The polymorphic information content (PIC) varied from 0.14 to 0.85, with an average of 0.58. Our findings indicate that the genetic diversity of wild ancient C. tetracocca tea plants in Pu’an is high. Specifically, the genetic diversity in Qingshan Township surpassed that in Xindian Township. Analysis of molecular variance indicated that 91.59% of the genetic variation occurred within the subpopulations, suggesting limited differentiation. Despite their geographical separation, populations from Qingshan and Xindian showed a complex genetic relationship (FST = 0.04). STRUCTURE analysis identified three distinct genetic clusters, indicating a complex demographic history. These findings underscore the conservation significance of wild C. tetracocca populations in Pu’an and highlight the need for conservation strategies that prioritize the protection of genetically diverse subpopulations, especially in the Qingshan region.

1. Introduction

Camellia tetracocca is a perennial wild tea plant that belongs to the genus Camellia L., subgenus Thea, series Quiquelocularis [1]. This rare and unique species is endemic to Pu’an County, Guizhou Province, China, and is often referred to as the ‘drinkable living fossil’. It primarily grows in Majiaping Village, Pubai Forest Farm, and other mountainous and forested areas at elevations ranging from 1700 to 1950 m above sea level in Pu’an County, in southwest Guizhou Province. The population comprises wild, cultivated, and transitional types that exhibit distinct characteristics influenced by the growing environment [2,3,4]. Significant morphological differences were observed among wild, transitional, and cultivated tea plants of Puan’s C. tetracocca, which stemmed from factors such as the growing environment, level of human intervention, and tree age. Wild tea trees are typically tall and upright, with a prominent main trunk. Their posture is either erect or semi-spreading, with fewer and irregular branches. After pruning, transitional tea plants tend to have a broader canopy, more branches, and clearer layering, with a shortened main trunk. In contrast, cultivated tea plants, owing to dense planting and pruning techniques, grow in a bushy form, with a low and dense canopy and no distinct main trunk. The discovery of C. tetracocca seed fossil in Yuntou Mountain, Pu’an County, dating back over one million years, indicates its long history in southwest Guizhou and highlights its significant historical and cultural value [2]. The leaves of C. tetracocca, similar to those of the cultivated tea plants (C. sinensis), are used by locals to prepare tea, a popular non-alcoholic beverage known for its health benefits [5]. Owing to its primitive growth environment and slow growth rate, C. tetracocca is characterized by low yield and high quality, making it ideal for producing premium black tea [6]. The limited and distinct distribution of tea means that it is currently cultivated and consumed exclusively in a local area [7]. Although tea production has notably boosted local incomes, its wild habitat has been severely affected by over-harvesting, environmental degradation, large-scale pest outbreaks, and plant diseases [8]. C. tetracocca’s unique genetic composition and chemical characteristics make it a valuable resource for developing new tea cultivars with enhanced flavors and health benefits [9]. The presence of specific secondary metabolites, such as catechins and theacrine [5], presents opportunities for breeding tea plants that possess superior antioxidant properties and lower caffeine content in response to the growing consumer demand for healthier tea options [6].
In recent years, research has increasingly focused on exploring the genetic diversity of tea germplasms using polymorphic DNA-based techniques, with molecular markers emerging as the most effective methods. Molecular markers offer significant advantages by directly detecting variations in DNA, thereby avoiding interference from environmental factors such as temperature, light, and nutrition, as well as phenotypic traits. Owing to their high precision, throughput, and objectivity, molecular markers have become essential tools for studying plant genetic diversity [10]. Advances in molecular marker technologies have significantly enhanced several research fields, including the differentiation of plant varieties and cultivars, the assessment of genetic stability, the analysis of genetic diversity and relationships, and the construction of genetic maps [11]. Various molecular markers, such as inter-simple sequence repeats (ISSR) [12], amplified fragment length polymorphism (AFLP) [13], single nucleotide polymorphisms (SNP) [14,15,16,17,18,19], and microsatellites or simple sequence repeats (SSR) [20,21,22,23], have been employed to assess genetic diversity, relationships, and construct genetic maps in tea plants. These studies demonstrate that molecular markers can effectively authenticate tea plant varieties and clarify their genetic relationships [12,13,14,22]. It is widely believed that tea plants originated in the southwestern region of Yunnan, China [13,16]. Furthermore, tea plants from regions such as Yunnan, Guizhou, Sichuan, and Fujian exhibit considerable genetic diversity, making these areas vital for resource conservation and utilization [13,16,17,18,19,20,24]. Additionally, significant genetic differentiation has been observed between wild and cultivated tea plants [13,16]. These methods provide valuable tools for the comprehensive evaluation of genetic variation within tea germplasm resources. Among these techniques, Intron Length Polymorphism (ILP) has gained particular recognition as a vital tool in tea plant genetics and breeding, owing to its high abundance, substantial polymorphism, reliability, and cross-species transferability [24,25]. Molecular marker technologies have revealed that wild ancient tea trees possess considerable genetic diversity, with distinct geographic differentiation observed in the genetic structure of populations across different regions [17,26,27,28]. These discoveries provide critical scientific data for the conservation and rational utilization of wild ancient tea tree resources. Furthermore, the genetic diversity observed in ancient tea trees results not only from natural evolutionary processes but also reflects the influence of domestication and modern breeding practices. The identification of domestication and breeding sweeps within the tea plant genome highlights the selective pressures shaping the genetic composition of current tea cultivars. These findings are essential for understanding the genetic basis of key agronomic traits and for developing future breeding strategies [29].
Molecular markers have played a pivotal role in revealing the extensive genetic diversity of wild ancient tea trees. Genetic variability is a crucial resource for the conservation and enhancement of tea plants, contributing to their resilience and adaptability to environmental changes and evolving agricultural demands [30]. In the present study, we used 40 pairs of ILP molecular markers to investigate the genetic diversity and population structure of 138 wild ancient C. tetracocca tea trees from two townships in Pu’an County, Guizhou Province, China. The primary goal of this study was to gain a deeper understanding of the genetic traits of wild ancient C. tetracocca in this area and provide essential scientific insights and baseline data to support its development, conservation, and molecular marker-assisted breeding.

2. Results

2.1. Evaluation of Genetic Parameters and the Degree of Diversity at ILP Loci

Genetic diversity analysis was conducted on 138 wild-type ancient C. tetracocca tea plants collected from Qingshan and Xindian towns in Pu’an County (Table 1). The results revealed 180 observed alleles (Na) across 40 loci. Na per ILP locus ranging from 2 to 10, with an average of 4.56. The effective allele numbers (Ne) ranged from 1.16 to 8.01, with the lowest value observed at Tea_ILP3087 and the highest at Tea_ILP1986, yielding an average Ne of 2.86. Observed heterozygosity (Ho) varied from 0.00 to 0.89, with an average of 0.20, while expected heterozygosity (He) varied from 0.14 to 0.88, with a mean of 0.58. Shannon’s information index (I) ranged from 0.28 to 2.19, with the lowest value at Tea_ILP3087 and the highest at locus Tea_ILP1986, with an average of 1.10. Similarly, Nei’s gene diversity index (H) ranged from 0.14 to 0.88, with the smallest and largest values observed for Tea_ILP3087 and Tea_ILP1986, respectively, yielding a mean of 0.58. Polymorphic Information Content (PIC) ranged from 0.14 to 0.85, with a mean of 0.58. Notably, the locus Tea_ILP3087 was the only site with a polymorphism below 0.25, categorized as low polymorphism, whereas the remaining loci exhibited medium to high polymorphism levels, with a mean of 59.26%.

2.2. Evaluation of the Genetic Diversity Level of Wild Ancient Tea Populations in Pu’an

Genetic diversity analysis was conducted on wild-type ancient C. tetracocca populations from two locations in Pu’an, Qingshan Town, and Xindian Town (Table 2). Na for the two populations were 4.38 and 4.05, respectively. The Ne values were 2.98 and 2.30, respectively. Both populations exhibited a heterozygosity (Ho) value of 0.20, while the expected heterozygosity (He) values were 0.60 and 0.50, respectively. Additionally, the values for Shannon’s index (I) were 1.13 and 0.90, and the values for Nei’s genetic diversity index (H) were 0.60 and 0.50, respectively. The wild ancient tea populations of Qingshan Town and Xindian Town exhibited significant differences (p < 0.05) in genetic diversity parameters, including I, He, H, and AR.

2.3. Genetic Relationship and Genetic Differentiation of Wild Ancient C. tetracocca Population in Pu’an

The genetic similarity coefficient between the wild ancient C. tetracocca populations in Qingshan and Xindian towns was 0.92, whereas the genetic distance was 0.09. The genetic relationship between these two populations in Pu’an County was relatively close, likely because of the frequent gene flow between the wild tea trees in both regions, which led to a high degree of genetic similarity.
Genetic differentiation among populations was analyzed using POPGENE, which revealed an inbreeding coefficient (Fis) of 0.64 within populations and a total population inbreeding coefficient (Fit) of 0.65. The population differentiation coefficient (Fst) was 0.04, indicating that the genetic variability in the wild-type ancient C. tetracocca populations was primarily within populations. Gene flow (Nm) between populations was 6.85, suggesting substantial gene exchange. Furthermore, AMOVA analysis showed that 8.41% of the genetic variation was attributed to inter-population differences, while a significant 91.59% occurred within populations (Table 3).

2.4. Genetic Structure of Wild Ancient C. tetracocca Population in Pu’an

Based on this analysis, the optimal number of genetic clusters was determined to be K = 3, representing the most biologically meaningful subdivision of C. tetracocca populations (Figure 1A). These three subpopulations exhibited distinct genetic structures, as illustrated in the STRUCTURE bar plot. The S1 cluster (red bar) comprised 26 samples, 24 of which (92%) were wild ancient C. tetracocca individuals from the town of Qingshan. The S2 cluster (green bar) consists exclusively of 44 wild ancient C. tetracocca samples from Qingshan Town. In contrast, the S3 cluster (blue bar) includes 68 samples: 22 (32%) from Qingshan Town and 46 (68%) from Xindian Town. This uneven distribution highlights significant geographic differentiation, with Qingshan Town contributing disproportionately to both the homogeneous (S2) and admixed (S3) clusters, whereas Xindian Town was represented solely within S3.
Principal component analysis (PCoA) was applied to analyze the wild ancient C. tetracocca population in Pu’an (Figure 1B). The analysis revealed a distinct clustering of wild-type ancient tea trees within individual regions, with partial overlaps between clusters. These findings are consistent with the results from the phylogenetic and STRUCTURE analyses, which similarly identified heightened genetic affinity between the Qingshan and Xindian populations (Figure 1A,C).
A hierarchical clustering tree was constructed using MEGA11 (v. 11.0.13), which classified the 138 ancient wild tea plant germplasms into three distinct groups (Figure 1C). Group I comprised 41 ancient wild tea germplasms, 39 of which were from Qingshan Town. Group II comprised 62 germplasm lines, including 15 from Xindian Town and 47 from Qingshan Town. Group III consisted of 35 germplasms, predominantly from Xindian, with only 5 germplasms from Qingshan. Notably, genotypic crossovers were primarily observed in the germplasm resources of Qingshan Town and Xindian Town in Group II, indicating genetic exchange between these populations. This finding aligns with those of the population structure and PCoA analyses (Figure 1A,B). Additionally, the clustering map indicated that although ancient wild tea plant germplasms from Qingshan Town and Xindian Town showed some overlap, they maintained distinct genetic characteristics.

3. Discussion

3.1. Genetic Diversity of Wild Ancient Tea Plants of C. tetracocca Using ILP Markers

The recent availability of high-quality tea plant genomes, including Yunkang10 [31], Shuchazao [32], wild tea accessions [28], Longjing43 [33], Tieguanyin [34], Biyun [35], and Huangdan [36], has led to significantly advanced functional and comparative genomic studies [15,16]. The tea plant genome is notable for its high intron density, which provides considerable advantages for species identification and the development of molecular markers [25]. ILP markers have emerged as a powerful tool for evaluating genetic diversity in C. sinensis, demonstrating superior effectiveness compared to traditional markers such as SSRs and SNPs [25]. ILP markers target polymorphic regions within intron non-coding sequences that exhibit higher mutation rates than exons, owing to relaxed selective pressures. This variability makes ILPs particularly useful for detecting subtle genetic differences among closely related tea cultivars, allowing them to effectively capture intra-specific diversity [28]. However, for non-model organisms lacking genomic information, the detection cost and technical barriers for ILP markers remain relatively high. Although introns are non-coding regions that may participate in the regulation of gene expression, some ILP markers are influenced by natural selection. This contradicts the neutral evolution hypothesis, resulting in analysis outcomes confounded by population history and selective pressures.
In this study, we analyzed the genetic diversity and relationships of 138 ancient wild tea plants collected from Qingshan and Xindian Towns in Pu’an County using 40 pairs of ILP loci. The He value is a key indicator of a marker’s utility for cultivar identification, as it reflects the diversity within a species [37]. A higher He value indicates that the marker is more informative and reveals greater genetic variation among sampled individuals [38]. In contrast, Ho represents the probability that the alleles of two randomly selected samples differ. The results for Ho and He across the 40 pairs of ILP loci in this study (Table 1) show that Ho ranges from 0.00 to 0.89, with an average of 0.20, while He ranges from 0.14 to 0.88, with an average of 0.58. The observed deficit in heterozygosity (Ho < He) in wild ancient C. tetracocca populations in Pu’an suggests notable genetic constraints and population substructures. Such patterns are often linked to inbreeding, Wahlund effects caused by undetected subpopulations, or genetic drift in fragmented habitats.
The PIC value, which measures locus polymorphism [39], is useful for assessing genetic diversity [40]. In this study, PIC values ranged from 0.14 to 0.85, with an average of 0.58. Among the loci analyzed, 29 displayed high polymorphism (PIC ≥ 0.5), 10 exhibited moderate polymorphism (0.25 ≤ PIC < 0.5), and one showed low polymorphism (PIC < 0.25). These findings suggested that the primers generally exhibited strong polymorphism [41]. The mean PIC value for all ILP markers was 0.58, indicating a high level of genetic diversity within wild ancient C. tetracocca, which aligns with the findings of previous studies [4]. However, it was lower than those reported by [42] (0.86) and [23] (0.69) yet higher than the values observed by [20] (0.45) and [25] (0.48). The degree of polymorphism is related to primer discrimination; a higher degree of polymorphism enhances primer discrimination. Moreover, comparisons should be made with caution due to differences in sample size, marker type and number, and the specific statistical approaches used to estimate genetic diversity.
Life-history traits and geographic factors play a crucial role in shaping genetic diversity [43]. Species with restricted distributions generally exhibit lower genetic diversity than those with broader distributions [26,44], often because of smaller population sizes and adaptation to specific habitats resulting from isolation [45]. Although the effects of habitat fragmentation on population genetics have been studied for several decades, clear response patterns remain elusive [46]. Previous research has indicated that favorable environmental conditions promote gene flow among plant populations, thereby enhancing genetic diversity. For instance, plant populations at mid-altitudes often display higher genetic diversity than those at lower or higher altitudes, probably because of the more favorable environmental conditions at these elevations [46,47]. In the present study, the genetic diversity indices (I = 1.13, H = 0.60) for the Qingshan Town population were significantly higher than those for the Xindian Town population (I = 0.90, H = 0.50), suggesting greater genetic diversity in the Qingshan Town population. A plausible explanation is that, despite being a restricted-range and endangered endemic species, C. tetracocca thrives at the moderate elevation of Qingshan Town (1699–1744 m), which provides more favorable temperature and soil conditions than Xindian Town (1822–1834 m), thereby promoting population growth [28]. Additionally, the self-incompatibility of tea plants fosters genetic diversity, enriching the genetic pool and enhancing the species’ ability to adapt to environmental changes.

3.2. Molecular Variation and Population Genetic Structure

High-frequency alleles from plants bred outdoors, such as cross-pollinated wind-borne species, were observed in each population, showing high similarity and minimal genetic variation [48]. AMOVA in this study revealed that 8.41% of the genetic variation occurred among populations, whereas 91.59% occurred within populations (Table 2), which is consistent with the characteristics of a wild outcrossing species. This indicates significant gene flow between populations (Nm = 6.85). Similar results were found in SSR analyses of the ancient tea germplasm of Sandu County, Guizhou Province, China, which indicated that 95% of genetic diversity resides within populations [49]). Similarly, SSR analysis of Korean cultivated tea germplasm indicated that 99% of the genetic diversity was within the populations [50]. The tea plant, a long-lived woody species with high rates of cross-pollination, facilitates gene exchange across populations, resulting in low genetic differentiation.
Genetic structure analysis, including PCoA and phylogenetic cluster analysis, revealed that the two wild ancient tea populations could be grouped into three clusters. We propose two explanations for this classification. First, environmental factors—such as geology, altitude, temperature, rainfall, and light—significantly affect tea plant growth. Specifically, altitude and geological conditions play crucial roles in the distribution, population structure, and evolutionary trajectory of wild plant germplasm [51,52]. Geographical distance between tea populations is often highly correlated with genetic distance [7,15], and local populations in geographically contiguous areas tend to share closer genetic relationships [23,53]. Qingshan Town and Xindian Town are geographically close and are situated in the southern part of Pu’an County, Guizhou Province (Figure 2). Genetic differentiation and consistency analyses of the two populations showed minimal differentiation and high genetic consistency, confirming the close genetic relationship between local populations in nearby geographical areas. The second factor influencing gene exchange is geographical proximity, which likely facilitates gene flow among populations. Zhao et al. [54] classified tea plants cultivated in the Guizhou Plateau into four groups based on river basin distributions. In this study, Qingshan Town and Xindian Town, located approximately 70 km apart in the northern part of Pu’an County (Figure 2), showed a high potential for gene flow because of their proximity. Genetic differentiation and consistency analyses of the two populations revealed minimal differentiation, suggesting that gene flow played a significant role in reducing genetic differentiation. When Nm is greater than one, a sufficient gene flow exists to counteract genetic drift, which typically leads to population divergence [47]. The high gene flow observed in this study (Nm = 6.85) likely explains the low genetic differentiation found among the wild ancient tea populations. This can be attributed to several factors, including the wind-pollinated nature of C. tetracocca, which allows it to travel over long distances. Additionally, the unique biological traits of the species, such as monoecy, high outcrossing rates, long lifespans, and overlapping generations, contribute to the reduced genetic differentiation between populations.

3.3. Wild Ancient Tea Germplasm Conservation and Utilization

The study of genetic diversity within species and the genetic structure of populations is crucial for the development and implementation of effective conservation strategies [55]. This study revealed that the wild ancient populations of the endemic species C. tetracocca in Pu’an exhibited relatively high genetic diversity, positioning them as a key germplasm resource for tea plant genetic improvement. The findings underscore the urgent need for conservation measures in light of the increasing demand for raw tea materials and the unsustainable pressures faced by these populations due to over-exploitation [56,57]. Furthermore, non-selective deforestation and habitat destruction driven by agricultural expansion exacerbates survival threats to these wild populations. As the market demand for organic tea products increases, the over-harvesting of tea trees by local communities has become more pronounced. Additionally, poorly planned harvesting and plant transplantation strategies have resulted in the irreversible loss of valuable genetic resources [4].
Biotic stress factors, such as pests and diseases, combined with abiotic stressors, such as climate change, further underscore the importance of conserving the germplasm of wild ancient tea tree species. This conservation effort is essential not only for maintaining ecological resilience but also for ensuring the sustainable development of the tea industry. In response to these challenges, it is crucial to establish an ecological compensation mechanism to safeguard the interests of the stakeholders involved in the conservation of wild ancient tea tree populations [22]. Furthermore, the biological characteristics of C. tetracocca enhance its conservation potential. This species exhibits remarkable cold tolerance (≤6.0 °C), and its genome offers valuable resources for distant hybridization and gene introgression breeding, positioning it as key genetic material for developing breakthrough tea tree varieties [4,58].
Wild resources of C. tetracocca are rare and of exceptional quality. Therefore, it is crucial to conserve these resources by covering as many types of germplasm as possible to maximize genetic diversity [43]. In addition to in situ conservation, we recommend the following measures: (1) establishing a germplasm resource bank for C. tetracocca; (2) developing and promoting artificial cultivation methods; (3) enhancing scientific research on the species, particularly in the fields of ecology, genetics, and reproductive biology; (4) raising awareness among local communities and the general public about the protection of wild C. tetracocca, encouraging their active participation in conservation efforts. These actions support the long-term survival and development of C. tetracocca, a species endemic to Guizhou while preserving its genetic diversity through a comprehensive, multi-tiered conservation approach based on in situ conservation. Niu et al. [27] noted that the Guizhou Plateau is rich in ancient local varieties and pure wild germplasm resources, which form an important foundation for tea tree breeding programs. Wild tea tree populations of C. tetracocca have significant scientific value in the conservation and research of tea tree genetic resources. Using single-plant breeding methods, new tea tree varieties can be developed from these germplasm resources, which are both practical for production and valuable genetic parent material.

4. Materials and Methods

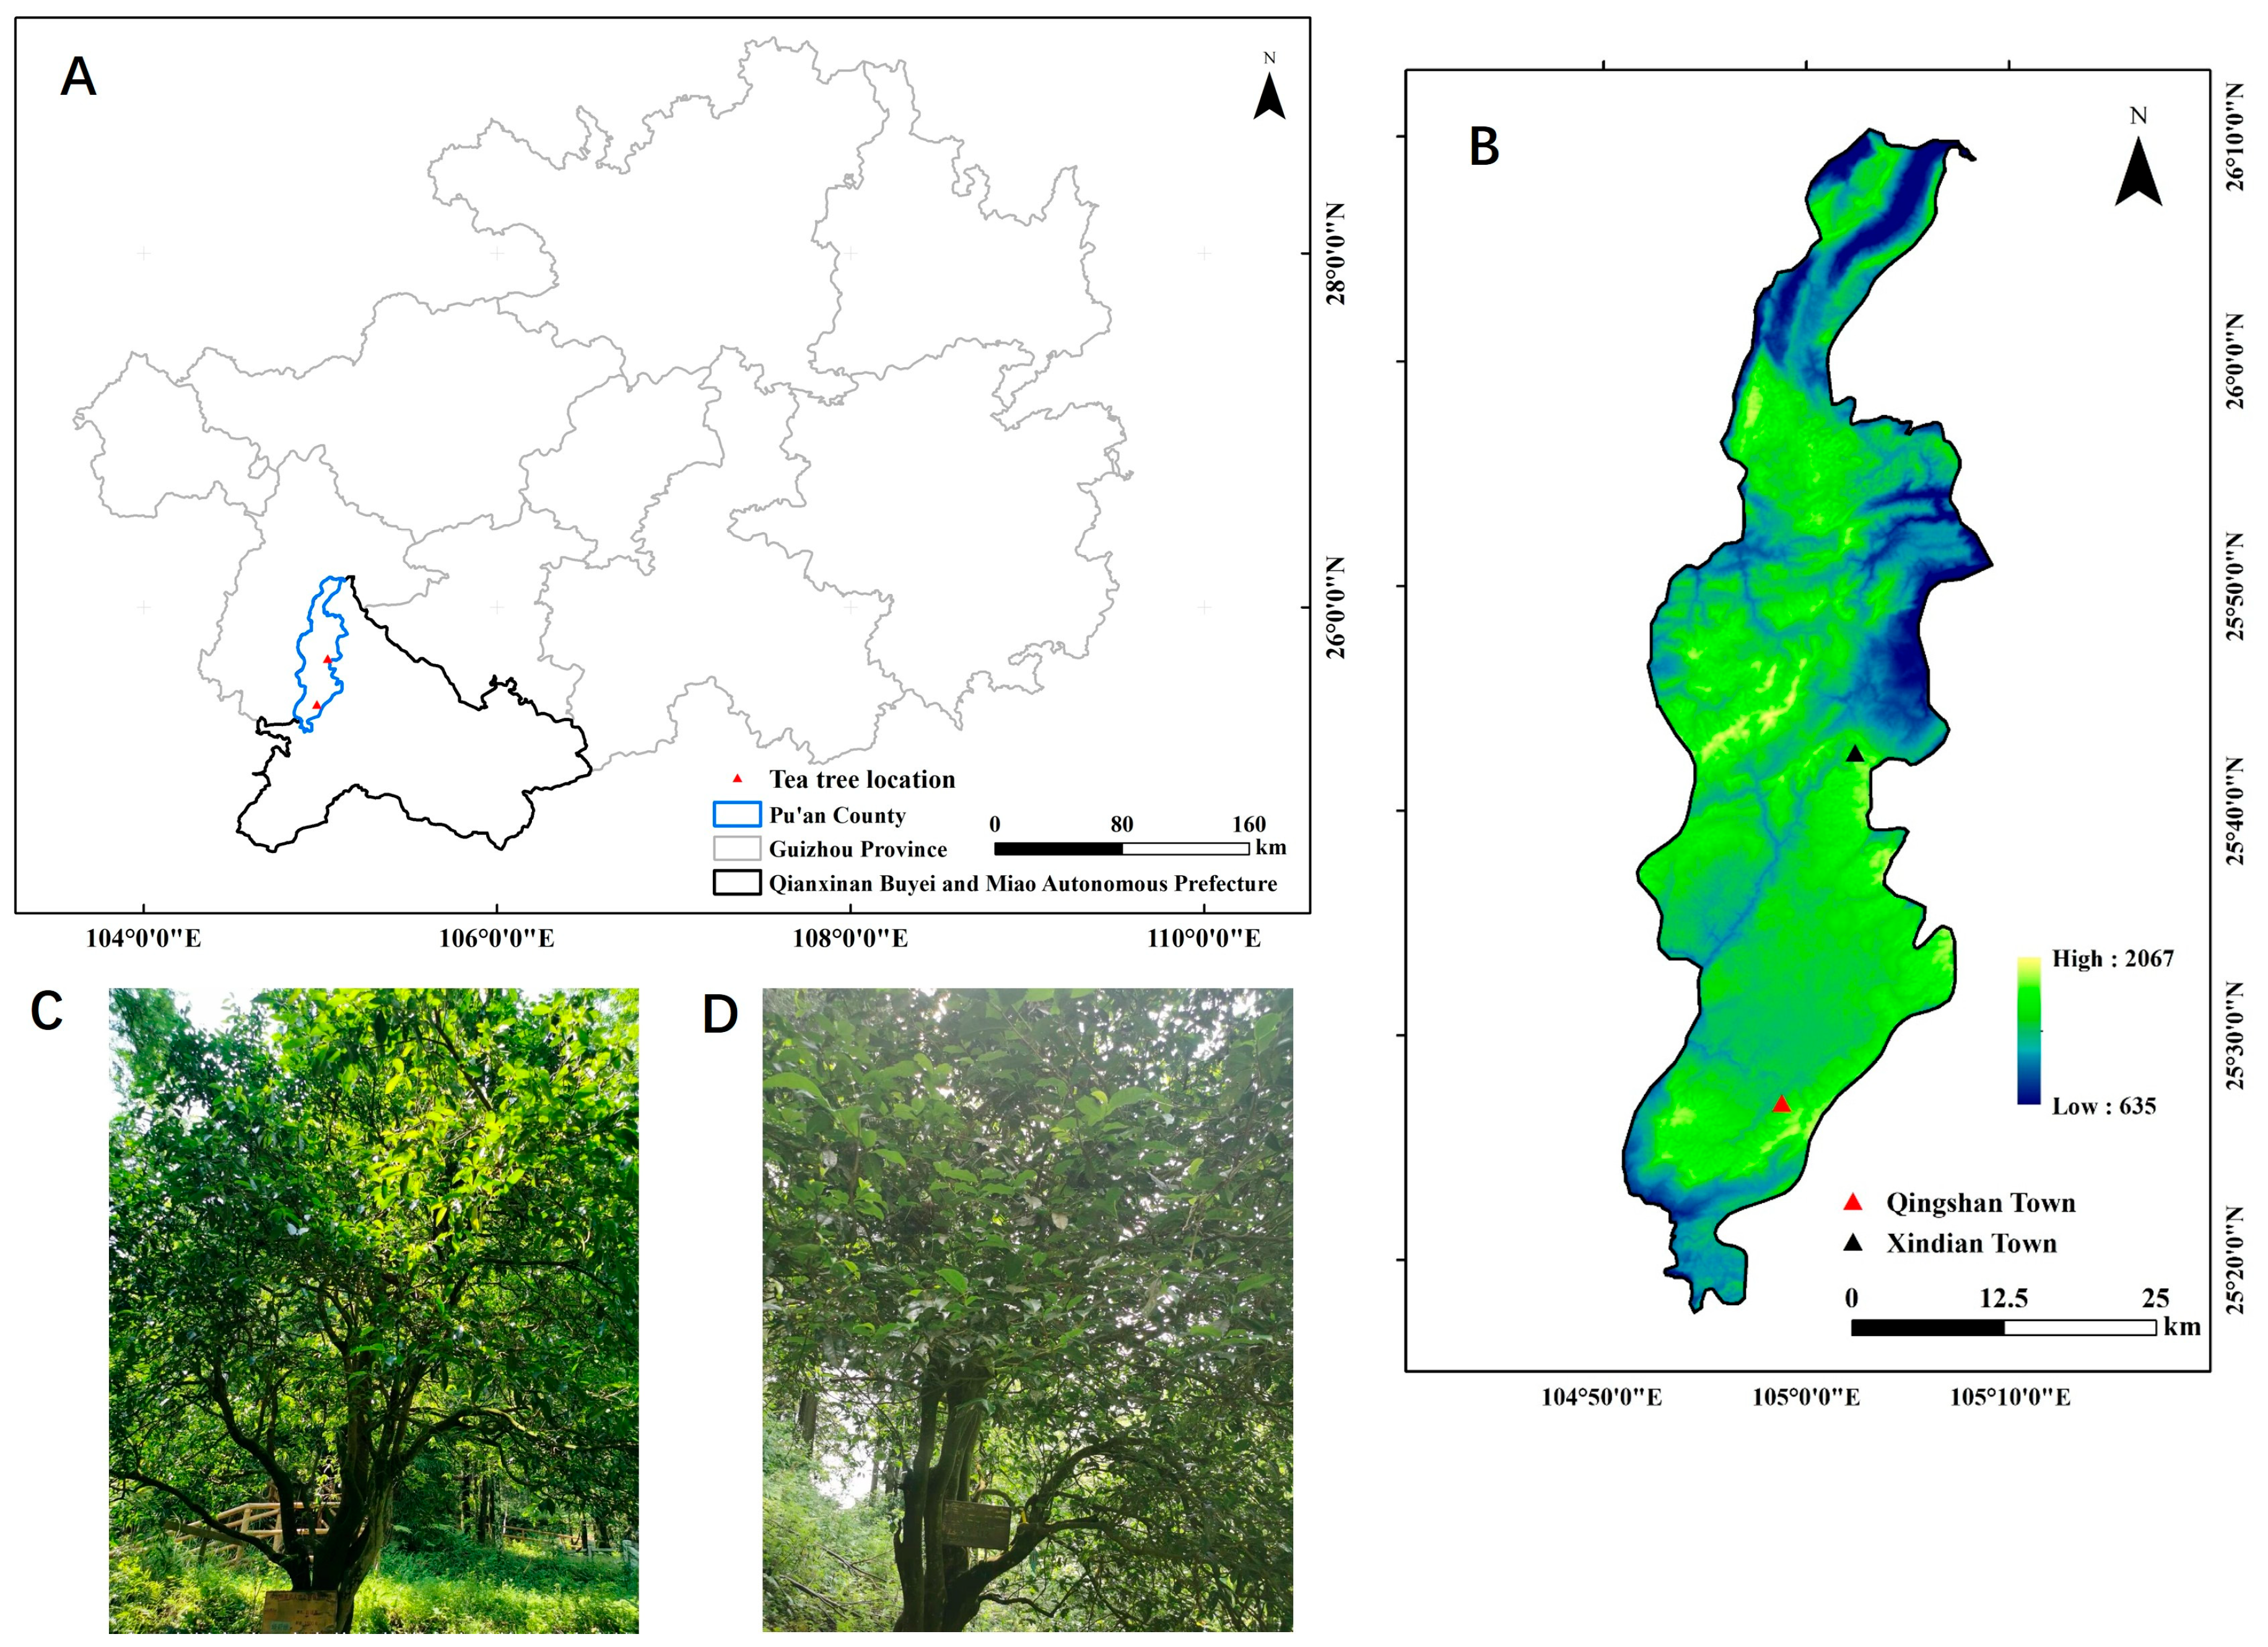
4.1. Plant Materials

This study focused on wild ancient C. tetracocca located across Pu’an County, Guizhou Province (Figure 2). The distribution area of the wild ancient C. tetracocca is very narrow, primarily concentrated on the mountain slopes and forest edges of the Pu’bai Forest Farm in Qingshan Town, within an elevation range of 1700–1950 m [2], with a small distribution in other towns, such as Xindian Town. The total distribution area is less than 60 km2, and it is an endemic species of Pu’an County, with the type specimen collected in the Pu’bai Forest Farm. The climate of this region is subtropical humid monsoon. The average annual temperature is 14 °C, with an extreme minimum temperature of −6.9 °C and an extreme maximum temperature of 33.4 °C. The frost-free period lasted for 297 days, with abundant rainfall, an annual precipitation of 1257 mm, and high humidity, with a relative humidity of over 80%. The average annual sunshine duration is 1287 h. In total, 138 specimens were collected for experimental analysis, with 90 wild-type C. tetracocca trees sampled from Qingshan Town and 48 from Xindian Town, both within the county. Upon collection, leaf samples were immediately placed in self-sealing bags with color-changing silica gel for drying and preliminary processing. Appropriate labels were simultaneously affixed to the samples, which were then stored at room temperature. Detailed characteristics and information regarding each tea plant variety are provided in Table 4.

4.2. ILP Primer Sources

We amplified six randomly selected samples of C. tetracocca DNA templates using 230 ILP primer pairs and obtained 40 primer pairs with abundant polymorphism and clear amplification bands for genetic diversity analysis of wild ancient tea trees [25]. Detailed information on these 40 primer pairs is provided in Table 5.

4.3. DNA Extraction, PCR Amplification, and Product Detection

DNA was extracted from Tetrahymena using a modified CTAB method, following the protocol described by Tang et al. [59]. The PCR reaction system and procedure were based on the method outlined by Jayaswall et al. [60] with a total volume of 10 µL. The PCR mixture consisted of 2 µL of DNA template (50 ng/µL), 0.5 µL of primer (10 µmol/µL), and 7.5 µL of 2× Taq master mix. After gentle mixing, the mixture was briefly centrifuged for 30 s and sealed on a PCR plate with a silicone gel cover to minimize evaporation during amplification using the ABI-PCR system. The Touch-Down amplification method included an initial pre-denaturation step at 94 °C for 3 min, followed by cycles of denaturation at 94 °C for 30 s, annealing starting at 65 °C for 45 s with a decrease of 0.7 °C per cycle for 13 cycles, and extension at 72 °C for 1 min. This was followed by 23 cycles of denaturation at 94 °C for 30 s, annealing at 56 °C for 45 s, and extension at 72 °C for 1 m, with a final extension at 72 °C for 5 min. This post-mixing centrifugation step was repeated for 30 s. The ILP amplification products were run on a 6% non-denaturing polyacrylamide gel, with each well supplemented with 2 µL of 10 × Loading Buffer, followed by a 30 s centrifugation to ensure proper loading.

4.4. Data Analysis

The electropherograms (Figure S1) generated from the experiments were interpreted manually. Clearly visible bands were assigned a value of “1”, while the absence of bands was denoted as “0”. This process produced raw data binary data (0 and 1) for subsequent analyses. Initial calculations and analyses of the electrophoretic bands were performed using Microsoft Excel. The binary data were then converted into genotypic data using DataFormater 2.7 software [61]. Genetic diversity analysis was analyzed using Popgene 1.31 software [62], which calculated several indices, including the number of observed alleles (Na), effective alleles (Ne), Shannon index (I), observed heterozygosity Ho), expected heterozygosity (He), Nei diversity index (H), genetic similarity coefficient (S), genetic distance (D), and gene flow (Nm). Allele richness (Ar) and private allele richness (PA) were calculated using the HP-RARE 1.1 software [63]. The nonparametric Kruskal–Wallis test was conducted in SPSS 25 to evaluate significant differences in Na, Ne, I, He, Ho, and AR between the two tea tree populations. Allele frequencies derived from this analysis were used to calculate the primer polymorphic information content (PIC) of each primer using the PIC_CALC tool (version 0.6) [39]. Genetic variation within and between populations was assessed using the WINAMOVA v1.55 program. The significance of the variance components was evaluated using nonparametric permutation tests, with 1000 permutations performed for statistical validation [64].
The genetic structure of the population was assessed using Structure 2.3.4 [65], with the K value for population structure analysis ranging from 2 to 7. For each K value, the analysis was repeated ten times to improve reliability. A burn-in period of 50,000 was set, and Markov Chain Monte Carlo (MCMC) simulations were conducted for 100,000 iterations. The optimal K value was determined based on the likelihood value (Ln P(D)) and ΔK. Clustering was performed using MEGA11 (v. 11.0.13) based on genetic distance, and the Unweighted Pair Group Method with Arithmetic Averaging (UPGMA), and a dendrogram was constructed. Finally, PCoA was performed using GenALEx 6.503 software [66], which provided a graphical representation of the genetic relationships and variations observed in the dataset.

5. Conclusions

In conclusion, this study provides important insights into the genetic diversity and population structure of wild ancient C. tetracocca populations in Pu’an, Guizhou, China. The results indicate a high level of genetic diversity within the population, with Qingshan Township exhibiting greater genetic diversity than Xindian Township. This suggests that geographical factors play significant roles in shaping genetic diversity. These findings highlight the importance of conserving the genetic diversity of wild ancient C. tetracocca populations in Pu’an and offer scientific guidance for the development of targeted conservation strategies. Conservation efforts should prioritize the comprehensive protection of genetically diverse subpopulations, particularly in the Qingshan area, to ensure the long-term survival and sustainability of this unique and valuable species.

Supplementary Materials

The following supporting information can be downloaded at: https://www.mdpi.com/article/10.3390/plants14111709/s1, Figure S1: Detection of ILP marker amplification products of wild ancient tea tree population using PAGE gel electrophoresis.

Author Contributions

Conceptualization, X.C., F.Z. X.H. and J.F; investigation, L.W., F.Z. and X.H.; data curation, D.L., L.L., S.C., J.F.; funding acquisition, X.C. F.Z. and H.H.; validation, L.W., D.L. and S.Z.; writing—original draft, D.L. and L.L.; writing—review and editing, X.C., F.Z. and H.H. All authors have read and agreed to the published version of the manuscript.

Funding

This research was funded by the Outstanding Young Talents Support Program of Yunnan Province (YNWR-QNBJ-2019-280), Yunnan Program of Technology Innovation and Talent Cultivation (202305AD160025), Yunnan Provincial High-level Talents Introduction of Young Talents Special Competitive Training Support Funds (YNQR-QNRC-2018-122), Yunnan Seed laboratory (202205AR070001).

Data Availability Statement

All data were shown in Tables and Figures in the main text or Supplementary Materials.

Conflicts of Interest

The authors declare no conflicts of interest.

References

  1. Zhang, H.D. Systematic classification of tea plants. Acta Sci. Nat. Univ. Sunyatseni 1981, 1, 87–99. [Google Scholar]
  2. Yuan, M.Q.; Qian, C.J. Study on endemic plant Camellia tetracocca in Pu’an county, Guizhou. Guizhou Sci. 2009, 2, 80–85. [Google Scholar]
  3. Duan, X.Y.; Hu, H.J.; Wang, J.L.; Cao, Y.; Zhao, H.F. Present situation, protection and utilization of big tea tree resources in southwest Guizhou. Agric. Technol. Serv. 2011, 28, 1736–1737. [Google Scholar]
  4. Luo, W.; Chen, Y.Y.; Yin, S.H.; Wang, L.F.; Huang, X.X.; Geng, F.; Chen, X.M. Genetic diversity of Camellia tetracocca Zhang germplasm resources in Pu’an, Guizhou Province. Acta Agric. Univ. Jiangxiensis 2022, 44, 74–85. [Google Scholar]
  5. Xie, L.; Yuan, Y.; Yang, F.; Jiang, H.; Yang, F.; Yang, C.; Yu, Z. Comparative analysis of antioxidant activities and chemical compositions in the extracts of different edible parts from Camellia tetracocca Zhang (C. tetracocca) with two distinct color characteristics. Food Chem. 2024, 22, 101496. [Google Scholar] [CrossRef]
  6. Li, Y.F.; Ouyang, S.H.; Chang, Y.Q.; Wang, T.M.; Li, W.X.; Tian, H.Y.; Cao, H.; Kurihara, H.; He, R.R. A comparative analysis of chemical compositions in Camellia sinensis var. Pu’anensis Kurihara, a novel Chinese tea, by HPLC and UFLC-Q-TOF-MS/MS. Food Chem. 2017, 216, 282–288. [Google Scholar] [CrossRef] [PubMed]
  7. Liu, Y.J.; Zhao, G.F.; Li, X.; Shen, Q.; Wu, Q.; Zhuang, J.H.; Zhang, X.Q.; Xia, E.H.; Zhang, Z.Z.; Qian, Y.M.; et al. Comparative analysis of phenolic compound metabolism among tea plants in the section Thea of the genus Camellia. Food Res. Int. 2020, 135, 109276. [Google Scholar] [CrossRef]
  8. Zhang, N.; Tan, W.; Luo, G.; Pu, T.; Wang, J.; Zhang, X.; Song, Y. Untargeted metabolite profiling of camellia tetracocca’s response to an empoasca onukii attack using GC-MS and LC-MS. Agronomy 2023, 13, 791. [Google Scholar] [CrossRef]
  9. Zhang, Y.; Pan, H.; Wu, Q.; Zha, Y.; Su, J.; Li, F.; Tong, W.; Zhang, L.; Xia, E. Natural variation in promoters of F3’5’H and ANS correlates with catechins diversification in thea species of genus Camellia. Plant J. 2025, 121, e70108. [Google Scholar] [CrossRef]
  10. Jlassi, I.; Bnejdi, F.; Saadoun, M.; Hajji, A.; Mansouri, D.; Ben-Attia, M.; El-Gazzah, M.; El-Bok, S. SSR markers and seed quality traits revealed genetic diversity in durum wheat (Triticum durum desf.). Mol. Biol. Rep. 2021, 48, 3185–3193. [Google Scholar] [CrossRef]
  11. Huang, H.C.; Jiang, W.X.; Liang, C.X.; Yao, Q.; Nie, H.Q.; Bai, T.D. Est-SSR-based analysis on genetic diversity of ancient Liupao tea trees and their progeny in Guangxi. Mol. Plant Breed. 2021, 19, 2410–2418. [Google Scholar]
  12. Liu, B.Y.; Zhao, C.M.; Sun, X.M.; Li, Y.Y.; Jiang, H.B.; Wang, Y.G.; Machtelinckx, L.; Duan, Z.F. Establishment of DNA fingerprinting in clonal tea improved cultivars from yunnan of china using ISSR markers. Pak. J. Bot. 2015, 47, 1333–1340. [Google Scholar]
  13. Ji, P.Z.; Gao, J.; Liang, M.Z.; Huang, X.Q. AFLP analysis of genetic variation among cloned, seed produced and wild Camellia sinensis var. assamica tea plant in Yunnan, China. Pak. J. Bot. 2012, 44, 1989–1992. [Google Scholar]
  14. Wang, Z.H.; Yang, P.X.; Peng, H.; Li, C.; Yue, C.N.; Li, W.J.; Jiang, X.F. Comprehensive evaluation of 47 tea [Camel-liasinensis (L.) O. Kuntze] germplasm based on entropy weight method and grey relational degree. Genet. Resour. Crop Evol. 2021, 68, 3257–3270. [Google Scholar] [CrossRef]
  15. Chen, L.H.; Zhong, J.M.; He, Y.Y.; Fu, W.F.; Yang, J.; Wen, L.G. Genetic relationship and diversity of tea plant germplasm in Fu’an. J. Tea. Commun. 2022, 49, 173–180. [Google Scholar]
  16. Wei, K.; Wang, X.C.; Hao, X.Y.; Qian, Y.H.; Li, X.; Xu, L.Y.; Ruan, L.; Wang, Y.X.; Zhang, Y.Z.; Bai, P.X.; et al. Development of a genome-wide 200K SNP array and its application for high-density genetic mapping and origin analysis of Camellia sinensis. Plant Biotechnol. J. 2022, 20, 414–416. [Google Scholar] [CrossRef]
  17. Zhu, Y.; Fan, X.; Yu, W.; Liu, C.; Wang, P.; Wei, M.; Lu, M.J.; Lv, S.Y.; Cai, C.P.; Ye, N.X. Genetic variation of tea plant in Ningde and its adjacent regions revealed by single nucleotide polymorphism genotyping. Agron. J. 2023, 115, 2829–2842. [Google Scholar] [CrossRef]
  18. Sun, W.; Chen, C.; Xu, L.; Tao, L.; Tong, X.; Tian, Y.; Jiang, H.; Chen, L.; Wen, H.; Liu, S.; et al. Genetic diversity analysis and core collection construction of tea plant from the Yunnan Province of China using ddRAD sequencing. BMC Plant Biol. 2024, 24, 1163. [Google Scholar] [CrossRef]
  19. Jiang, L.; Xie, S.; Zhou, C.; Tian, C.; Zhu, C.; You, X.; Chen, C.; Lai, Z.; Guo, Y. Analysis of the genetic diversity in tea plant germplasm in fujian province based on restriction site-associated DNA sequencing. Plants 2024, 13, 100. [Google Scholar] [CrossRef]
  20. Huang, H.; He, S.; Zheng, X.; Shi, D.; Bai, P.; Zhao, Y.; Yu, J.; Niu, X. Simple sequence repeat marker-based genetic diversity and chemical composition analysis of ancient Camellia sinensis in jiulong county, Sichuan Province, China. Genes 2024, 15, 1317. [Google Scholar] [CrossRef]
  21. Xia, E.; Tong, W.; Hou, Y.; An, Y.; Chen, L.; Wu, Q.; Liu, Y.; Yu, J.; Li, F.; Li, R.; et al. The reference genome of tea plant and resequencing of 81 diverse accessions provide insights into its genome evolution and adaptation. Mol. Plant 2020, 13, 1013–1026. [Google Scholar] [CrossRef] [PubMed]
  22. Li, J.W.; Li, H.; Liu, Z.W.; Wang, Y.X.; Chen, Y.; Yang, N.; Hu, Z.H.; Li, T.; Zhuang, J. Molecular markers in tea plant (Camellia sinensis): Applications to evolution, genetic identification, and molecular breeding. Plant Physiol. Bioch. 2023, 198, 107704. [Google Scholar] [CrossRef] [PubMed]
  23. Wang, Z.; Peng, H.; Yue, C.; Ye, C.; Li, W.; Yang, P. Molecular markers and phenotypic identification reveal the genetic diversity and structure of four local tea plant populations in China. Genet. Resour. Crop Evol. 2024, 71, 635–649. [Google Scholar] [CrossRef]
  24. Zhang, Z.; Min, X.; Wang, Z.; Wang, Y.; Liu, Z.; Liu, W. Genome-wide development and utilization of novel intron-length polymorphic (ILP) markers in Medicago sativa. Mol. Breed. 2017, 37, 87. [Google Scholar] [CrossRef]
  25. Shen, Y.; He, X.; Zu, F.; Huang, X.; Yin, S.; Wang, L.; Geng, F.; Cheng, X. Development of genome-wide intron length polymorphism (ILP) markers in tea plant (Camellia sinensis) and related applications for genetics research. Int. J. Mol. Sci. 2024, 25, 3241. [Google Scholar] [CrossRef]
  26. He, L.; Luo, J.; Niu, S.; Bai, D.; Chen, Y. Population structure analysis to explore genetic diversity and geographical distribution characteristics of wild tea plant in Guizhou Plateau. BMC Plant Biol. 2023, 23, 255. [Google Scholar] [CrossRef]
  27. Niu, S.Z.; Song, Q.F.; Koiwa, H.; Qiao, D.H.; Zhao, D.G.; Chen, Z.W.; Liu, X.; Wen, X.P. Genetic diversity, linkage disequilibrium, and population structure analysis of the tea plant (Camellia sinensis) from an origin center, Guizhou plateau, using genome-wide SNPs developed by genotyping-by-sequencing. BMC Plant Biol. 2019, 19, 328. [Google Scholar] [CrossRef]
  28. Zhang, W.Y.; Zhang, Y.J.; Qiu, H.J.; Guo, Y.F.; Wan, H.L.; Zhang, X.L.; Scossa, F.; Alseekh, S.; Zhang, Q.H.; Wang, P.; et al. Genome assembly of wild tea tree DASZ reveals pedigree and selection history of tea varieties. Nat. Commun. 2020, 11, 3719. [Google Scholar] [CrossRef]
  29. Pinosio, S.; Marroni, F.; Zuccolo, A.; Vitulo, N.; Mariette, S.; Sonnante, G.; Aravanopoulos, F.A.; Ganopoulos, I.; Palasciano, M.; Vidotto, M.; et al. A draft genome of sweet cherry (Prunus avium L.) reveals genome-wide and local effects of domestication. Plant J. 2020, 103, 1420–1432. [Google Scholar] [CrossRef]
  30. Tong, W.; Wang, Y.; Li, F.; Zhai, F.; Su, J.; Wu, D.; Yi, L.; Gao, Q.; Wu, Q.; Xia, E. Genomic variation of 363 diverse tea accessions unveils the genetic diversity, domestication, and structural variations associated with tea adaptation. J. Integr. Plant Biol. 2024, 66, 2175–2190. [Google Scholar] [CrossRef]
  31. Xia, E.H.; Zhang, H.B.; Sheng, J.; Li, K.; Zhang, Q.J.; Kim, C.; Zhang, Y.; Liu, Y.; Zhu, T.; Li, W.; et al. The tea tree genome provides insights into tea flavor and independent evolution of caffeine biosynthesis. Mol. Plant 2017, 10, 866–877. [Google Scholar] [CrossRef] [PubMed]
  32. Xia, E.; Li, F.; Tong, W.; Yang, H.; Wang, S.; Zhao, J.; Liu, C.; Gao, L.; Tai, Y.; She, G.; et al. The tea plant reference genome and improved gene annotation using long-read and paired-end sequencing data. Sci. Data. 2019, 6, 122. [Google Scholar] [CrossRef] [PubMed]
  33. Wang, X.C.; Feng, H.; Chang, Y.X.; Ma, C.L.; Wang, L.Y.; Hao, X.Y.; Li, A.L.; Cheng, H.; Wang, L.; Cui, P.; et al. Population sequencing enhances understanding of tea plant evolution. Nat. Commun. 2020, 11, 4447. [Google Scholar] [CrossRef] [PubMed]
  34. Zhang, X.; Chen, S.; Shi, L.; Gong, D.; Zhang, S.; Zhao, Q.; Zhan, D.; Vasseur, L.; Wang, Y.; Yu, J.; et al. Haplotype-resolved genome assembly provides insights into evolutionary history of the tea plant Camellia sinensis. Nat. Genet. 2021, 53, 1250–1259. [Google Scholar] [CrossRef]
  35. Zhang, Q.J.; Li, W.; Li, K.; Nan, H.; Shi, C.; Zhang, Y.; Dai, Z.Y.; Lin, Y.L.; Yang, X.L.; Tong, Y.; et al. The chromosome-level reference genome of tea tree unveils recent bursts of non-autonomous LTR retrotransposons in driving genome size evolution. Mol. Plant 2020, 13, 935–938. [Google Scholar] [CrossRef]
  36. Wang, P.; Yu, J.; Jin, S.; Chen, S.; Yue, C.; Wang, W.; Gao, S.; Cao, H.; Zheng, Y.; Gu, M.; et al. Genetic basis of high aroma and stress tolerance in the oolong tea cultivar genome. Hortic. Res. 2021, 8, 107. [Google Scholar] [CrossRef]
  37. Gomes, S.; Martins-Lopes, P.; Lopes, J.; Guedes-Pinto, H. Assessing genetic diversity in Olea europaea L. using ISSR and SSR markers. Plant Mol. Biol. Rep. 2009, 27, 365–373. [Google Scholar] [CrossRef]
  38. Diaz, A.; De la Rosa, R.; Martín, A.; Rallo, P. Development, characterization and inheritance of new microsatellites in olive (Olea europaea L.) and evaluation of their usefulness in cultivar identification and genetic relationship studies. Tree Genet. Genomes 2006, 2, 165–175. [Google Scholar] [CrossRef]
  39. Botstein, D.; White, R.L.; Skolnick, M.; Davis, R.W. Construction of a genetic linkage map in man using restriction fragment length polymorphisms. Am. J. Hum. Genet. 1980, 32, 314. [Google Scholar]
  40. Ni, J.; Colowit, P.M.; Mackill, D.J. Evaluation of genetic diversity in rice subspecies using microsatellite markers. Crop Sci. 2002, 42, 601–607. [Google Scholar] [CrossRef]
  41. Yao, M.Z.; Ma, C.L.; Qiao, T.T.; Jin, J.Q.; Chen, L. Diversity distribution and population structure of tea germplasms in China revealed by EST-SSR markers. Tree Genet. Genomes 2012, 8, 205–220. [Google Scholar] [CrossRef]
  42. Liu, S.; Liu, H.; Wu, A.; Hou, Y.; An, Y.; Wei, C. Construction of fingerprinting for tea plant (Camellia sinensis) accessions using new genomic SSR markers. Mol. Breed. 2017, 37, 93. [Google Scholar] [CrossRef]
  43. Garnier, J.; Lafontaine, P. Life history traits and dispersal shape neutral genetic diversity in metapopulations. J. Math. Biol. 2022, 6, 45. [Google Scholar] [CrossRef] [PubMed]
  44. Huh, M.K.; Huh, H.W. Patterns of genetic diversity and population structure of the clonal herb, Potentilla fragarioides var. sprengeliana (Rosaceae) in Korea. Acta. Bot. Sin. 2000, 42, 64–70. [Google Scholar]
  45. Barrett, S.C.H.; Kohn, J.K. Genetic and evolutionary consequences of small population size in plants: Implications for conservation. In Genetics & Conservation of Rare Plants; Falk, D.A., Holsinger, K.E., Eds.; Oxford University Press: New York, NY, USA, 1991; pp. 3–33. [Google Scholar]
  46. Tackett, M.; Berg, C.; Simmonds, T.; Lopez, O.; Brown, J.; Ruggiero, R.; Weber, J. Breeding system and geospatial variation shape the population genetics of Triodanis perfoliata. Ecol. Evol. 2022, 12, e9382. [Google Scholar] [CrossRef]
  47. Wang, F.; Cheng, X.; Cheng, S.; Li, W.; Huang, X. Genetic diversity of the wild ancient tea tree (Camellia taliensis) populations at different altitudes in Qianjiazhai. PLoS ONE 2023, 18, e0283189. [Google Scholar] [CrossRef]
  48. Zhong, R.W. Plant Allozyme Analysis; Science Press: Beijing, China, 1996; pp. 103–106. [Google Scholar]
  49. Zhao, Y.; Wang, R.; Liu, Q.; Dong, X.; Zhao, D.G. Genetic diversity of ancient camellia sinensis (L.) o. kuntze in sandu county of Guizhou Province in China. Diversity 2021, 13, 276. [Google Scholar] [CrossRef]
  50. Lee, K.J.; Lee, J.R.; Sebastin, R.; Shin, M.J.; Kim, S.H.; Cho, G.T.; Hyun, D.Y. Assessment of genetic diversity of tea germplasm for its management and sustainable use in Korea genebank. Forests 2019, 10, 780. [Google Scholar] [CrossRef]
  51. Bemmels, J.B.; Title, P.O.; Ortego, J.; Knowles, L.L. Tests of species-specific models reveal the importance of drought in postglacial range shifts of a Mediterranean-climate tree: Insights from integrative distributional, demographic and coalescent modelling and ABC model selection. Mol. Ecol. 2016, 25, 4889–4906. [Google Scholar] [CrossRef]
  52. Yan, X.L.; Zhang, F.S. Plant Nutrition Genetics; Agriculture Press: Beijing, China, 1997; Volume 22, pp. 40–41. [Google Scholar]
  53. Ruan, X.; Xu, Y.D.; Wu, Q.; Liu, D.D.; Shen, J.X.; Wang, L.G.; Wang, W.J. Genetic diversity analysis and fingerprinting of tea lines from tea regions in Anhui Province. Mol. Plant Breed. 2020, 18, 4692–4701. [Google Scholar]
  54. Zhao, Z.; Song, Q.; Bai, D.; Niu, S.; He, Y.; Qiao, D.; Chen, Z.; Li, C.; Luo, J.; Li, F. Population structure analysis to explore genetic diversity and geographical distribution characteristics of cultivated-type tea plant in Guizhou Plateau. BMC Plant Biol. 2022, 22, 55. [Google Scholar] [CrossRef] [PubMed]
  55. Li, M.M.; Meegahakumbura, M.K.; Wambulwa, M.C.; Burgess, K.S.; Möller, M.; Shen, Z.F.; Li, D.Z.; Gao, L.M. Genetic analyses of ancient tea trees provide insights into the breeding history and dissemination of Chinese Assam tea (Camellia sinensis var. assamica). Plant Divers. 2024, 46, 229–237. [Google Scholar] [CrossRef] [PubMed]
  56. Ji, P.Z.; Li, H.; Gao, L.Z.; Zhang, J.; Cheng, Z.Q.; Huang, X.Q. ISSR diversity and genetic differentiation of ancient tea (Camellia sinensis var. assamica) plantations from China: Implications for precious tea germplasm conservation. Pak. J. Bot. 2011, 43, 281–291. [Google Scholar]
  57. Zhao, D.W.; Yang, J.B.; Yang, S.X.; Kato, K.; Luo, J.P. Genetic diversity and domestication origin of tea plant Camellia taliensis (Theaceae) as revealed by microsatellite markers. BMC Plant Biol. 2014, 14, 14. [Google Scholar] [CrossRef]
  58. Niu, S.; Fan, W. The physiological responds of cutting seedlings of ancient tea plant to drought stress and the comprehensive evaluation on their drought resistance capacity in karst region. Acta Hortic. Sin. 2013, 40, 1541. [Google Scholar]
  59. Tang, Y.; Guo, C.; Zhang, M. A method for extracting genomic DNA of tea tree by modified CTAB method. J. Fujian Inst. Educ. 2007, 99–101. [Google Scholar]
  60. Jayaswall, K.; Sharma, H.; Bhandawat, A.; Sagar, R.; Yadav, V.K.; Sharma, V.; Mahajan, V.; Roy, J.; Singh, M. Development of intron length polymorphic (ILP) markers in onion (Allium cepa L.), and their cross-species transferability in garlic (A. sativum L.) and wild relatives. Genet. Resour. Crop Evol. 2019, 66, 1379–1388. [Google Scholar] [CrossRef]
  61. Fan, W.Q.; Gai, H.M.; Sun, X.; Yang, A.G.; Zhang, Z.F.; Ren, M. SSR data format conversion software DataFormater. Mol. Plant Breed. 2016, 14, 265–270. [Google Scholar]
  62. Yeh, F.C.; Yang, R. POPGENE(Version 1.31): Population Genetic Analysis Software; University of Alberta and Tim Boyle Center for International Forestry Research: Edmonton, AB, Canada, 1999. [Google Scholar]
  63. Kalinowski, S.T. HP-RARE 1.0: A computer program for performing rarefaction on measures of allelic richness. Mol. Ecol. Notes 2004, 5, 187–189. [Google Scholar] [CrossRef]
  64. Excoffier, L.; Smouse, P.E.; Quattro, J.M. Analysis of molecular variance inferred from metric distance among DNA haplotypes: Application to human mitochondrial DNA restriction data. Genetics 1992, 131, 479–491. [Google Scholar] [CrossRef]
  65. Evanno, G.; Regnaut, S.; Goudet, J. Detecting the number of clusters of individuals using the software STRUCTURE: A simulation study. Mol. Ecol. 2005, 8, 2611–2620. [Google Scholar] [CrossRef] [PubMed]
  66. Peakall, R.; Smouse, P.E. GenAlEx 6.5: Genetic analysis in Excel. Population genetic software for teaching and research—An update. Bioinformatics 2012, 28, 2537–2539. [Google Scholar] [CrossRef] [PubMed]
Figure 1. Distribution of Q values for the population structure of wild ancient C. tetracocca in Pu’an. (A) A total of 138 individuals were categorized into three subpopulations: S1 (red bar), S2 (green bar), and S3 (blue bar), consisting of 26, 44, and 68 individuals, respectively. The samples are numbered from 1 to 138, where (1) corresponds to the population from Qingshan Township and (2) represents the population from Xindian Township. (B) Principal component analysis identified three inferred populations in STRUCTURE, with S1 shown in red, S2 in green, and S3 in blue. (C) Phylogenetic tree of 138 wild ancient tea germplasms and the three inferred populations: Group I, Group II, and Group III. Samples 1–90 correspond to the population from Qingshan Town, and samples 91–138 correspond to the population from Xindian Town.
Plants 14 01709 g001
Figure 2. Qingshan Town and Xindian Town are geographically close, located in the south of Pu’an County, Guizhou Province. (A) shows the location map of Puan County in the Qiannan Buyei and Miao Autonomous Prefecture, Guizhou Province, China. (B) shows the locations of the sampling sites, Qingshan Town and Xindian Town, within Puan County. (C,D) are photos of individual plants from the Qingshan Town and Xindian Town populations, respectively.
Plants 14 01709 g002
Table 1. The genetic parameters of 40 ILP markers.
PrimerNaNeIHoHeHPIC
Tea_ILP11166.003.991.510.000.750.750.75
Tea_ILP14184.002.501.010.890.600.600.60
Tea_ILP13964.002.420.990.220.590.590.59
Tea_ILP10005.002.871.270.000.650.650.65
Tea_ILP15893.002.210.930.390.550.550.55
Tea_ILP9003.001.680.730.280.410.410.41
Tea_ILP10973.002.030.730.000.510.510.51
Tea_ILP10236.004.361.580.040.770.770.77
Tea_ILP12224.002.190.920.170.550.540.54
Tea_ILP11924.001.610.770.180.380.380.38
Tea_ILP10733.001.360.510.210.260.260.26
Tea_ILP5917.005.491.810.000.820.820.82
Tea_ILP11585.004.261.510.480.770.770.77
Tea_ILP0723.001.790.700.580.440.440.44
Tea_ILP0154.003.501.310.000.720.710.71
Tea_ILP2902.001.750.620.000.430.430.43
Tea_ILP3806.004.351.590.390.770.770.77
Tea_ILP4503.001.830.780.460.460.450.45
Tea_ILP2024.002.621.070.000.620.620.62
Tea_ILP2844.003.191.230.000.690.690.69
Tea_ILP18758.006.721.990.000.850.850.85
Tea_ILP19464.003.201.230.000.690.690.69
Tea_ILP198610.008.012.190.000.880.880.88
Tea_ILP21147.002.891.320.000.660.650.65
Tea_ILP21424.001.810.790.010.450.450.45
Tea_ILP21715.003.501.370.000.720.710.71
Tea_ILP19233.002.070.790.820.520.520.52
Tea_ILP19246.001.470.700.000.320.320.32
Tea_ILP19454.002.291.000.610.570.560.56
Tea_ILP19514.002.040.940.380.510.510.51
Tea_ILP19674.003.031.150.000.670.670.67
Tea_ILP19825.001.930.940.000.480.480.48
Tea_ILP19914.002.411.050.580.590.580.58
Tea_ILP20176.003.961.560.000.750.750.75
Tea_ILP25513.001.550.570.440.360.360.35
Tea_ILP31955.002.511.130.000.600.600.60
Tea_ILP19593.002.020.790.720.510.510.51
Tea_ILP30873.001.160.280.130.140.140.14
Tea_ILP19534.002.861.140.000.650.650.65
Tea_ILP23435.003.041.280.000.670.670.67
Mean4.502.861.100.200.580.580.58
Note: the number of observed alleles (Na), the number of effective alleles (Ne), the Shannon information index (I), the observed heterozygosity (Ho), the expected heterozygosity (He), the Nei gene diversity index (H), the polymorphic information content (PIC).
Table 2. Genetic diversity analysis of wild ancient populations of C. tetracocca in Pu’an.
PopulationSample SizeNaNeIHoHeHARPA
Qingshan town904.382.981.13 0.200.60 0.60 2.54 0.89
Xindian town484.052.300.90 0.20 0.500.50 2.21 0.57
p value 0.04 *0.03 *0.02 *0.700.03 *0.03 *0.02 *0.00 *
Note: the number of observed alleles (Na), the number of effective alleles (Ne), the Shannon information index (I), the observed heterozygosity (Ho), the expected heterozygosity (He), the Nei gene diversity index (H), Allelic richness (AR), Private allelic richness (PA), * indicate a significant difference at the 0.05 level.
Table 3. Genetic differentiation among wild ancient tea populations of C. tetracocca in Pu’an.
POPGENE AMOVA
FisFitFstNmSource of VariationdfSSvar. ComponentsPMV%
0.640.650.046.85Among population1519.241.938.41 (p < 0.001)
Within populations1364631.6821.0291.59 (p < 0.001)
Note: inbreeding coefficient within a population, Fis; total population inbreeding coefficient, Fit; population differentiation coefficients, Fst; population gene flow, Nm; degrees of freedom, df; square deviation, SS; variance components, var. components; percentage of molecular variance, PMV.
Table 4. The information on wild ancient tea populations of C. tetracocca.
PopulationTypologySample SizeLongitudeLatitudeAltitude (m)
Qingshan townWild-type 90104.96–104.9825.43–25.451691–1744
Xindian townWild-type 48105.03–105.0425.70–25.711822–1834
Table 5. A total of 40 Tea_ILP markers were used in the genetic diversity and population structure analysis of C. tetracocca.
Marker IDForward Primer 5′-3′Reverse Primer 5′-3′
Tea_ILP1116AGTAGGGTTTTTGCCTCCGTAAGTACCGTACCCGCACTTG
Tea_ILP1418ATTGCATTCTTCCTCGCACTTCACAAATCAATTCCACCGA
Tea_ILP1396CATCTCTCTCCTCCCTGCTGTGTTCTATGGGATCTTCGCC
Tea_ILP1000CCACCGGTTTCTGAAGATGTCGCCTCCTTCTCTTTCCTCT
Tea_ILP1589TCTGCTGCTAGATGCAAATGAAGGAGCAACATAATTTGGCG
Tea_ILP900GCTCGCACTCCAAGTAGGATTGACCTTGAAGCCAAAATTAAA
Tea_ILP1097GCAGGAGACCTACTGGATGCAAAGCGACAGTAGCCAGGAA
Tea_ILP1023GGTGTAACCCAAGATCCCCTTCCCACTGTCGATGTCTCAG
Tea_ILP1222GCTGAGTTTCCTTTGGCAAGCAAATGCATAATGTGGTCGC
Tea_ILP1192GGCTGGGAATATGCTCTCAATTTGCAGAGCACTGAGGTTG
Tea_ILP1073AATTCAGCCATCTGTCCAGCTGACAGGATGGGCTTAAAGG
Tea_ILP591TCATCGTTGTCGAGATTGGAGACATGGCTGAGAGGAGAGG
Tea_ILP1158CTTCGACTGAACACCCTCGTGGAGGTGCAAACCACCTTTA
Tea_ILP072TGCTTCATGTGCAGAACCATCTTGAACGACAACCCTCCAT
Tea_ILP015AGATGCAGACGGAGAGCAATGCTTGCTTGGTTCAGGTAGC
Tea_ILP290TTGAGATTCACTGCATAGCCAAAATTCACTCAAACGGCCTG
Tea_ILP380CTCGATAGGTTTGGGGTCAAAATTGTGGGTGGCTCGTTAC
Tea_ILP450TTGGGTTCGAAGAGTTGAGGTAGCGAAAACGAAAGCCAGT
Tea_ILP202TGAATCCGCCTTAACCAAACGAGCAACAACAGTTGGCTGA
Tea_ILP284GAAATGAAACTGCCCATGCTTAGGAGCAGGTGCTGGAACT
Tea_ILP1875ACGACTCCAAGGTGGTTTTGAAGGAAGCCCTTTCTGGATG
Tea_ILP1946TTTCGCATTCTATCAAACATGGTGATGGTATGACATGGTGCC
Tea_ILP1986TTTCTTCCTCCACAGCAAGCCTTGCGCACTTCTTCCTTGT
Tea_ILP2114GATTTTGGCGCTCATCATTTGCTTTTATCGTCCATCGGAA
Tea_ILP2142CAAATTCCAACAACAATGCGTTCCCCACCAAATTCGTTT
Tea_ILP2171TGAAGTATGCCCACTTGGAATAAAGGATGCAGTTGGTCGG
Tea_ILP1923GCTTCAAAGCCTATGCAAGAAGGGAAGATCAGAGGCATTCA
Tea_ILP1924GAGCACGGATTCAGTTGTCAGAGCCACCCTTCCCAATTAT
Tea_ILP1945AAGGCCATTGAGCACAAAACGGGGCAATAAATGACAATGG
Tea_ILP1951AAGGCAATCAAGCAAGCACTGAGGAAGCAGTTGCATCACA
Tea_ILP1967TCTCGTGTTGTGGGCAAATATTGTTCAGGGCTCTTGCTTT
Tea_ILP1982GCAAATGGAAAGCTTGTGCTAATGCCATCCTCTCAAATGC
Tea_ILP1991AAAGCTGGCAGGGTCATCTGGCAAGGATGACAAGGCTAA
Tea_ILP2017GATGTGCCGTGTTGTGAGACGCATTGCATATGAGGAGGGT
Tea_ILP2551GGATTCCTCCTCAAACTCTTCATGCCAGCCTTCTTCTCTTTC
Tea_ILP3195CATTACCAATGGCAAATCCCCTCGAGTCCACCAAGGAAAC
Tea_ILP1959ACACTGTGTCAGTTGGCGAGTTCGAGATCGAATGTTTAGGC
Tea_ILP3087GACCAGAAAATTGGGCATTGAGCTGCATGTTCAGCAACAA
Tea_ILP1953TATGCTGAAGCCCACACATCTGTGGACCATGCAAGGTTAG
Tea_ILP2343AAACCAGCGAGATGGAACACAGATCGACGGGATTGAGTTG
Disclaimer/Publisher’s Note: The statements, opinions and data contained in all publications are solely those of the individual author(s) and contributor(s) and not of MDPI and/or the editor(s). MDPI and/or the editor(s) disclaim responsibility for any injury to people or property resulting from any ideas, methods, instructions or products referred to in the content.

