


Dendrochronology and Isotope Chronology of Juglans neotropica and Its Response to El Niño-Related Rainfall Events in Tropical Highlands of Piura, Northern Peru


Abstract
1. Introduction
- Can J. neotropica be cross-dated [109] accurately using visible wood anatomical features?
- Are ring-based age estimates consistent with radiocarbon and stable isotopic estimates?
- Are variations in growth rates and oxygen isotopic composition of J. neotropica, and their relationship to regional precipitation variations and ENSO, consistent with that demonstrated for other species?
2. Data and Methods
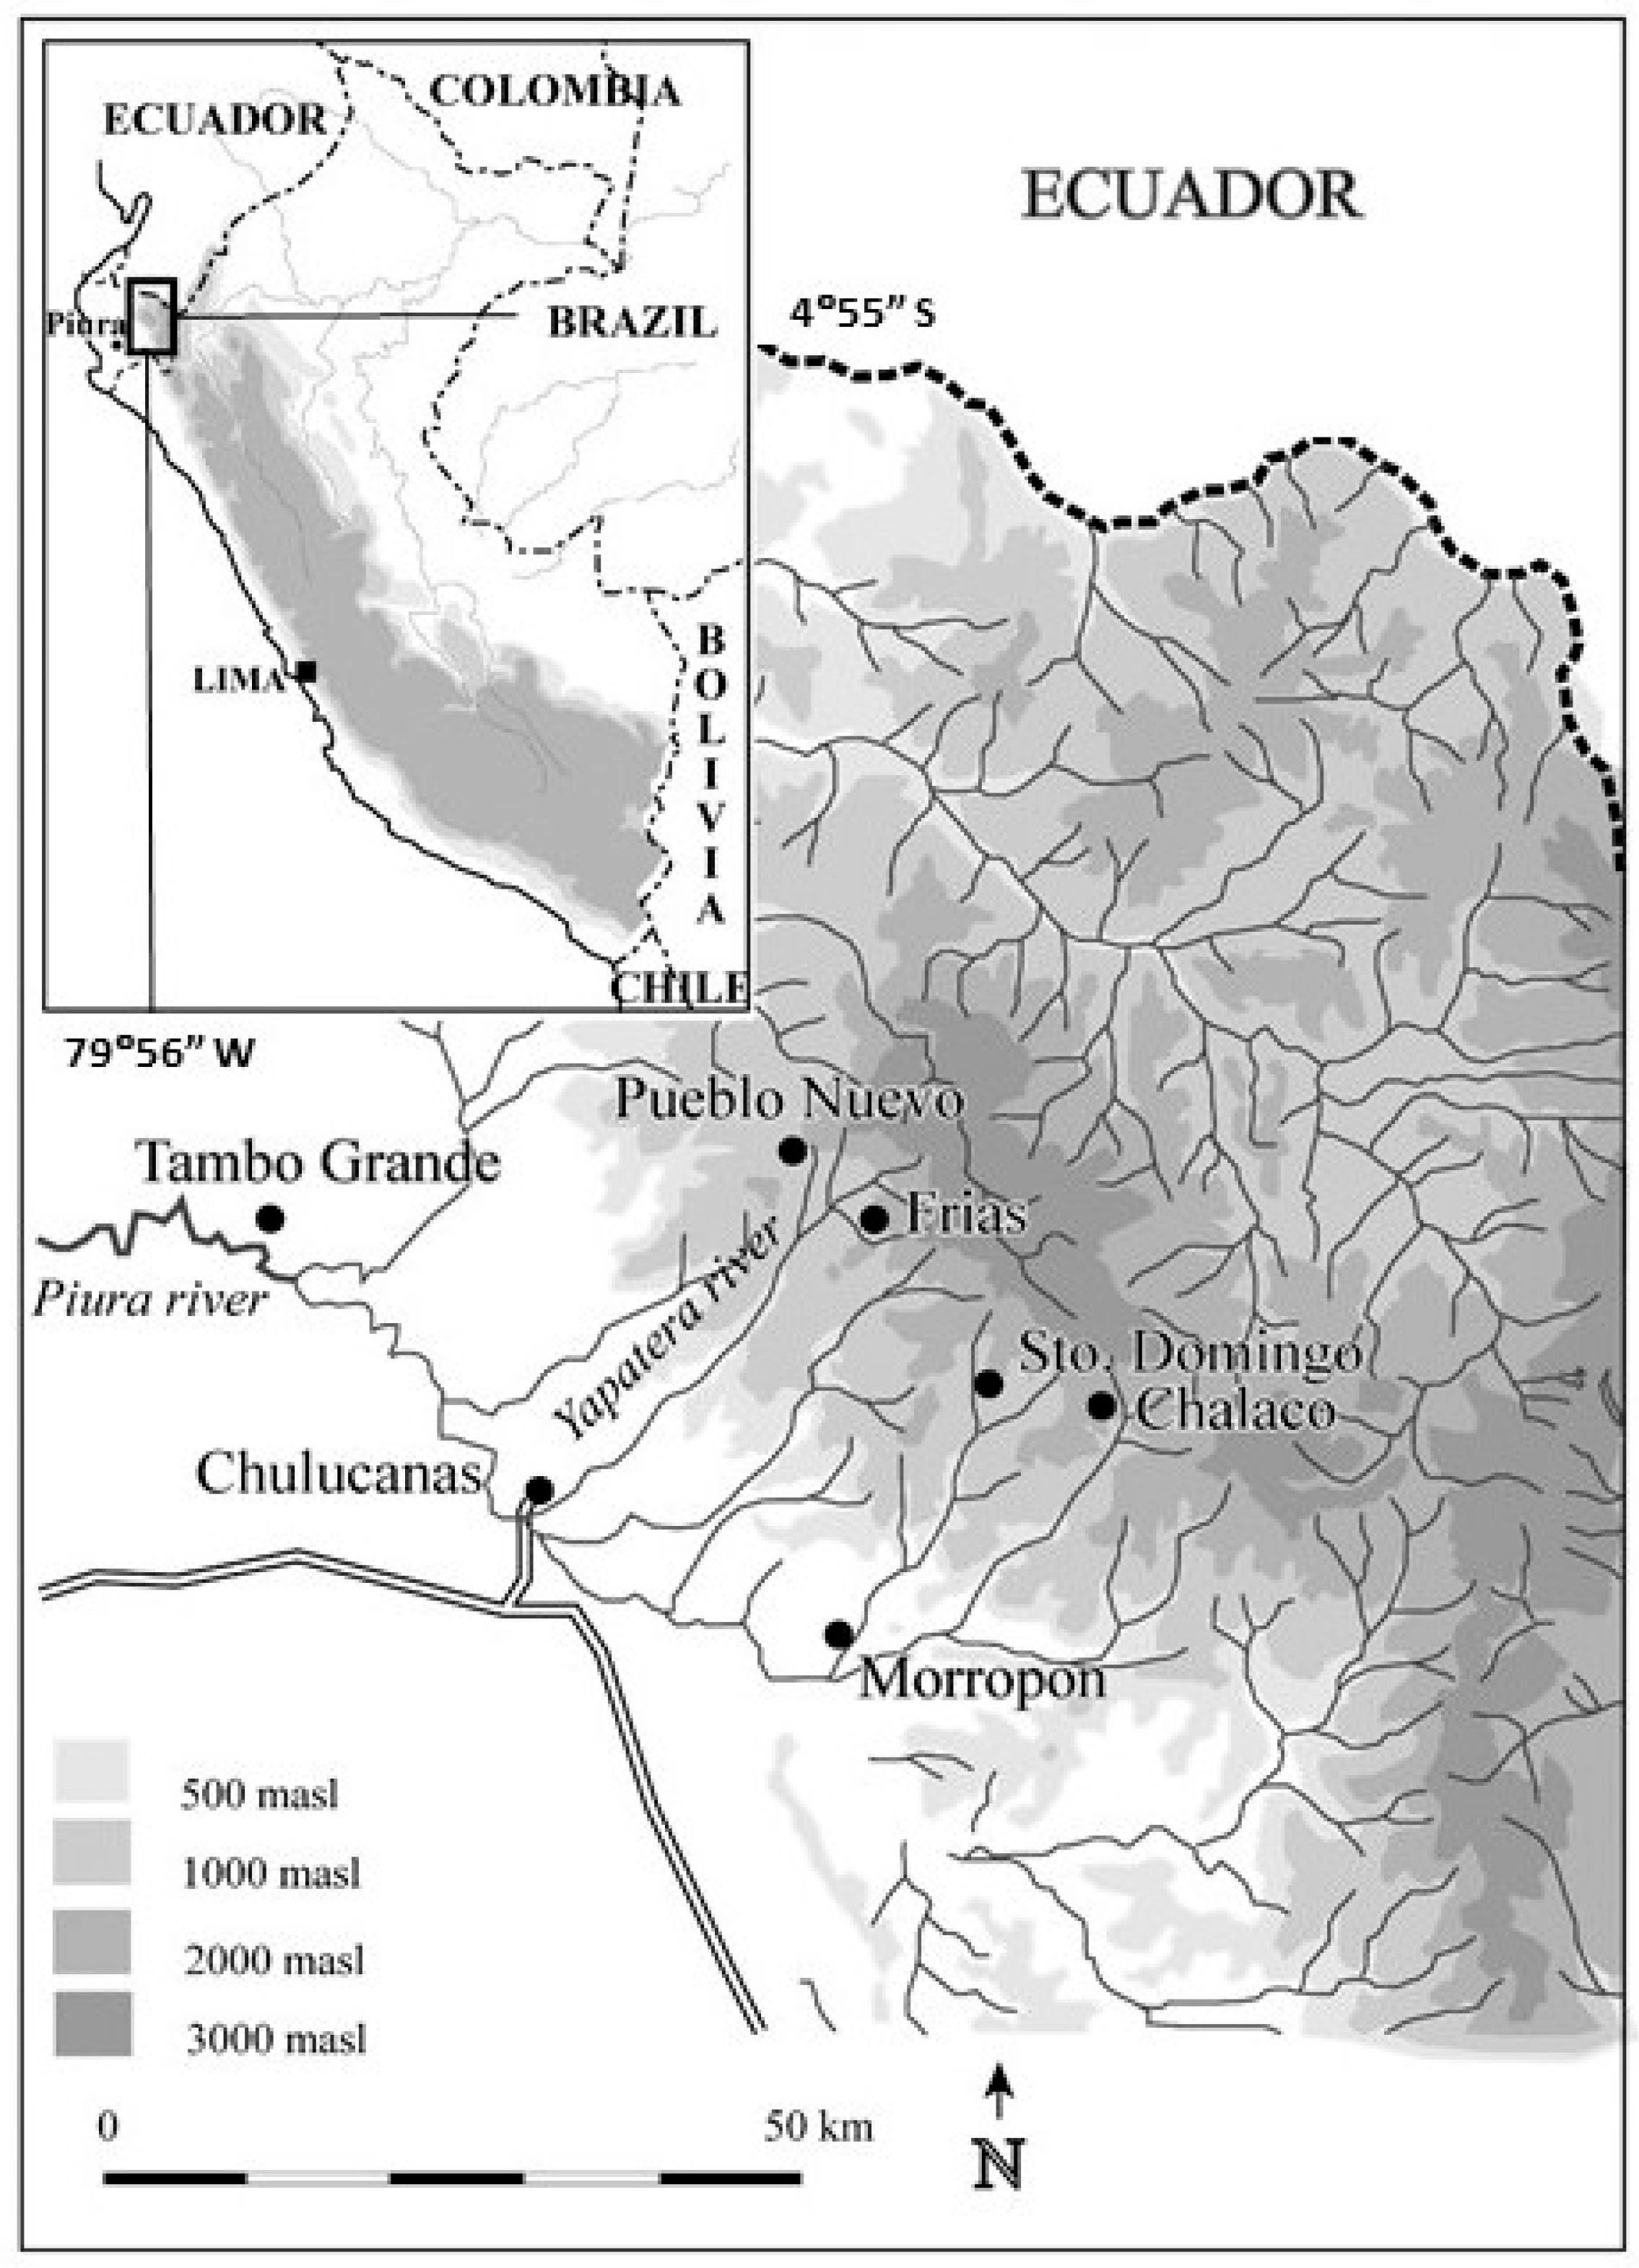
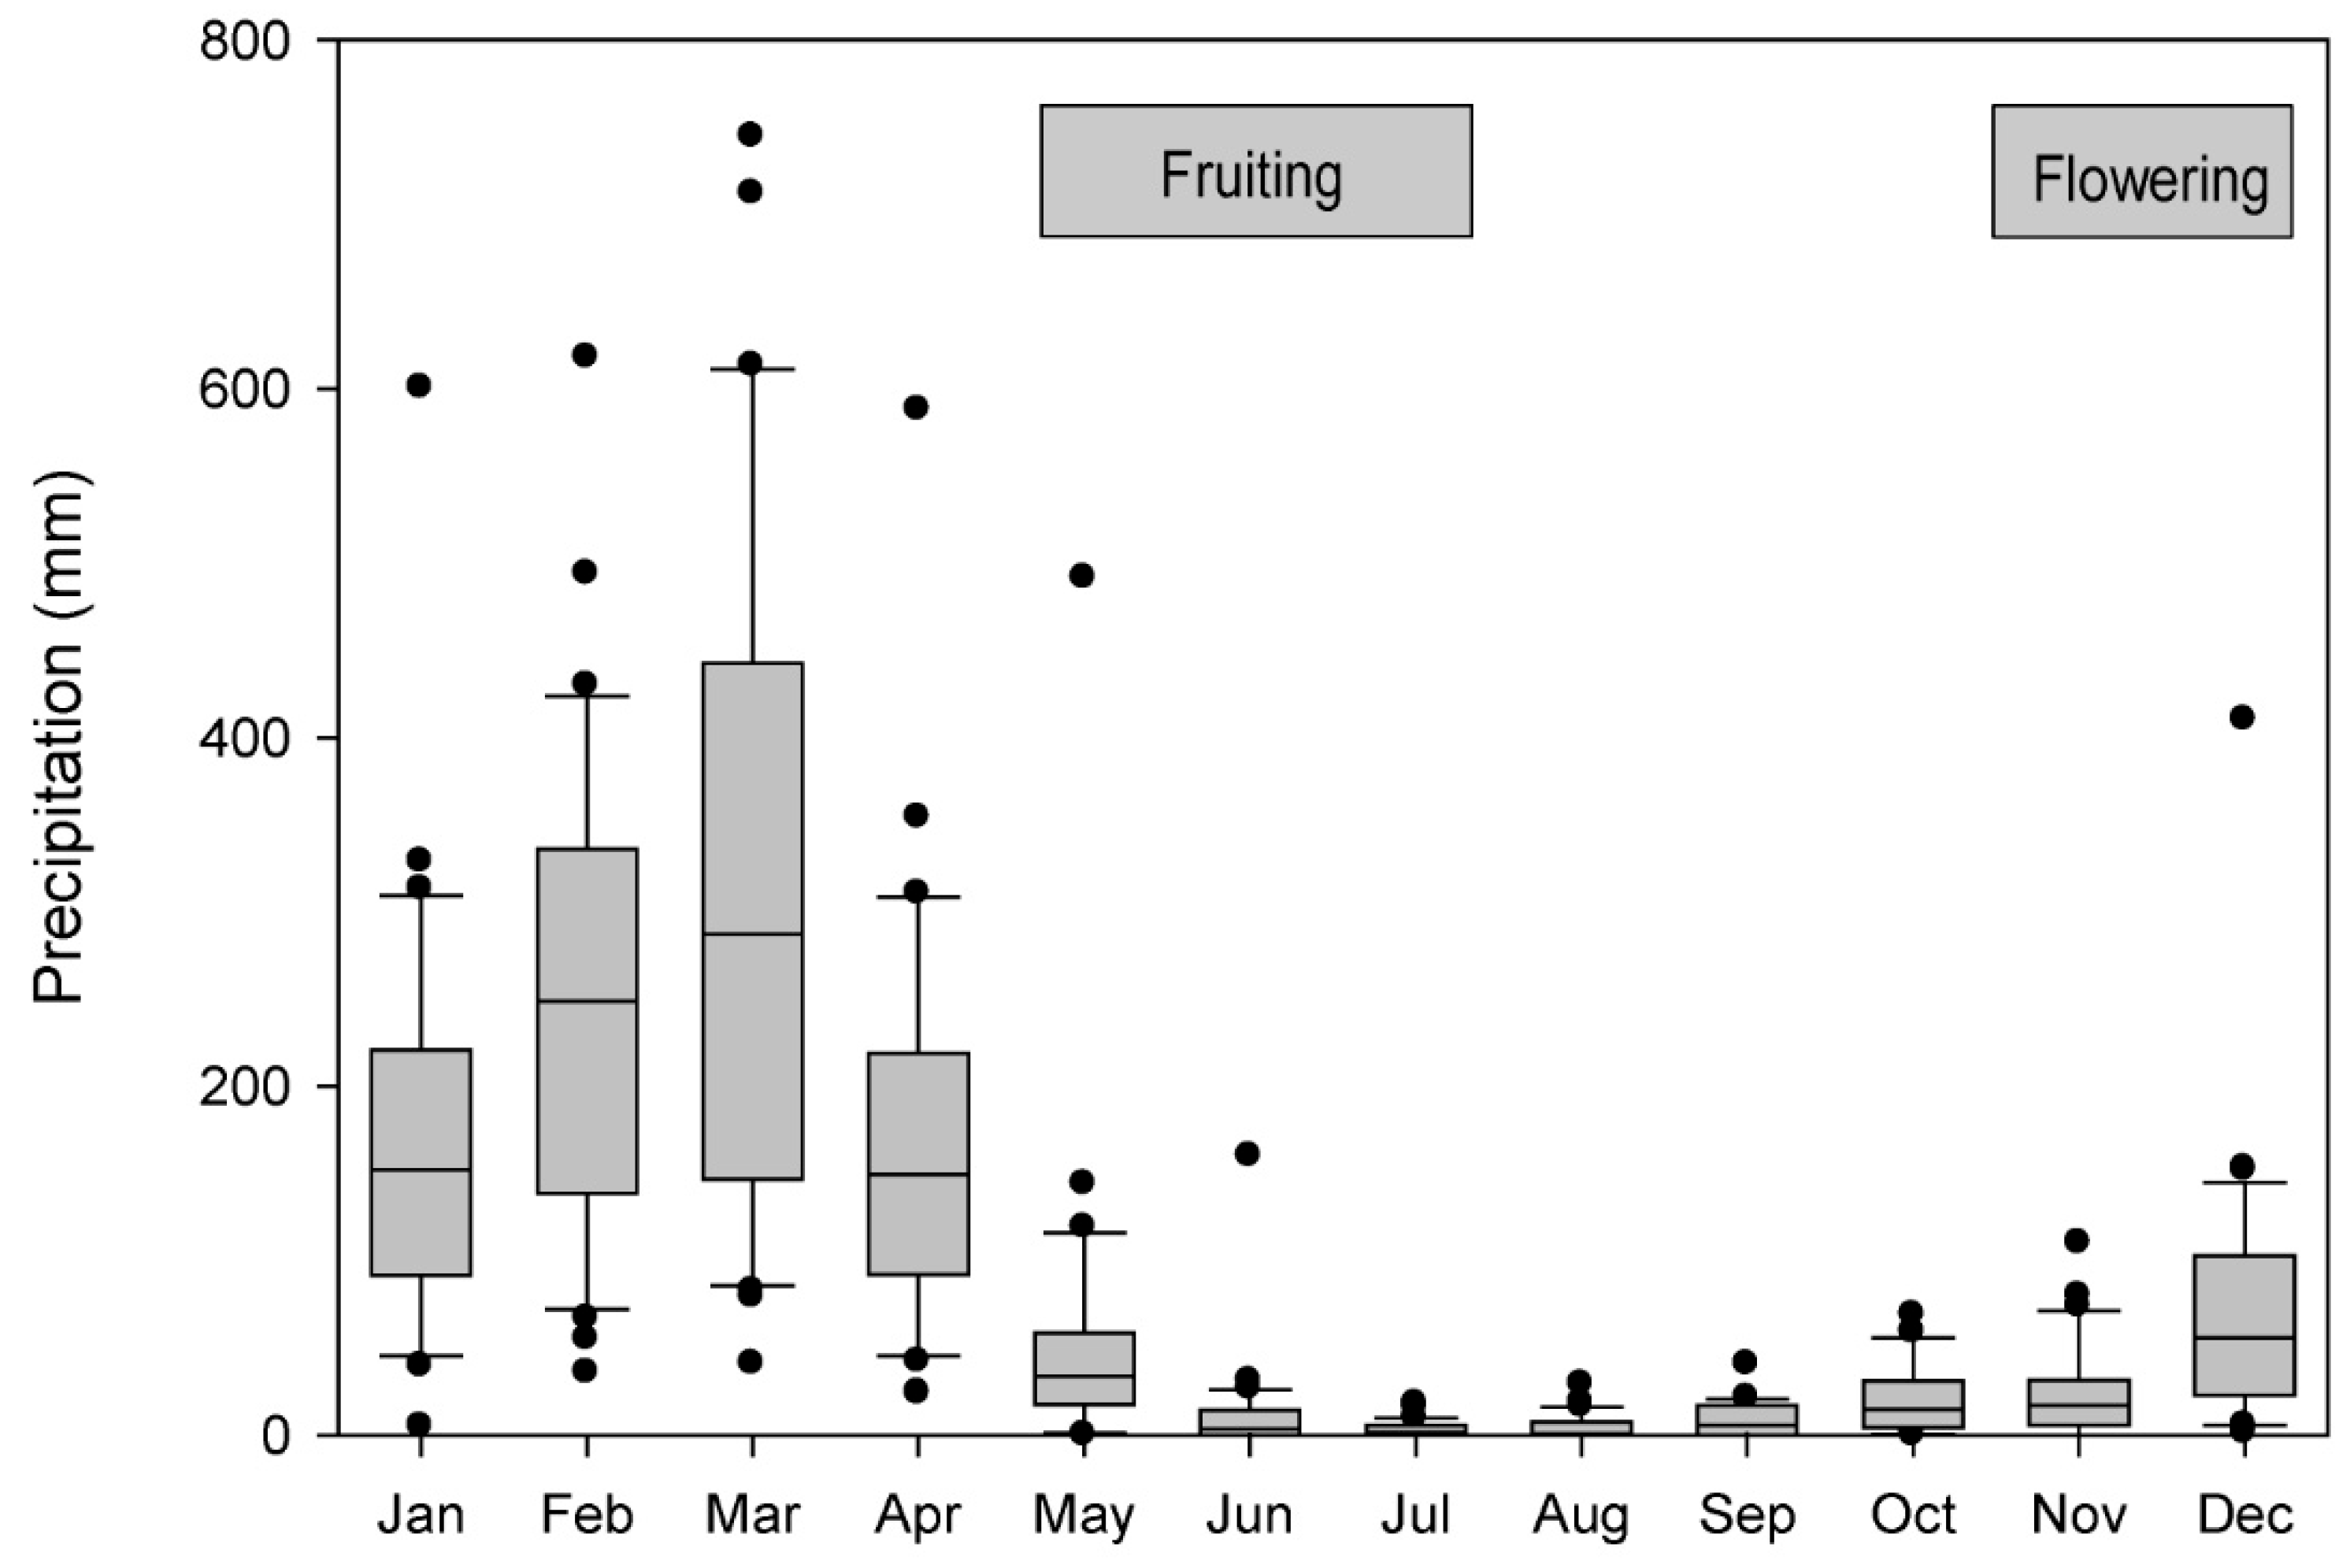
2.1. Study Site
2.2. Field Sampling
2.3. Wood Anatomy
2.4. Dendrochronological Sample Preparation, Tree-Ring Analysis and Modeling
2.5. Oxygen Isotopic Analysis
2.5.1. Sample Preparation and Data Analysis
2.5.2. Isotopic Modeling
2.6. Correlation Analysis
2.7. Radiocarbon Analysis
3. Results
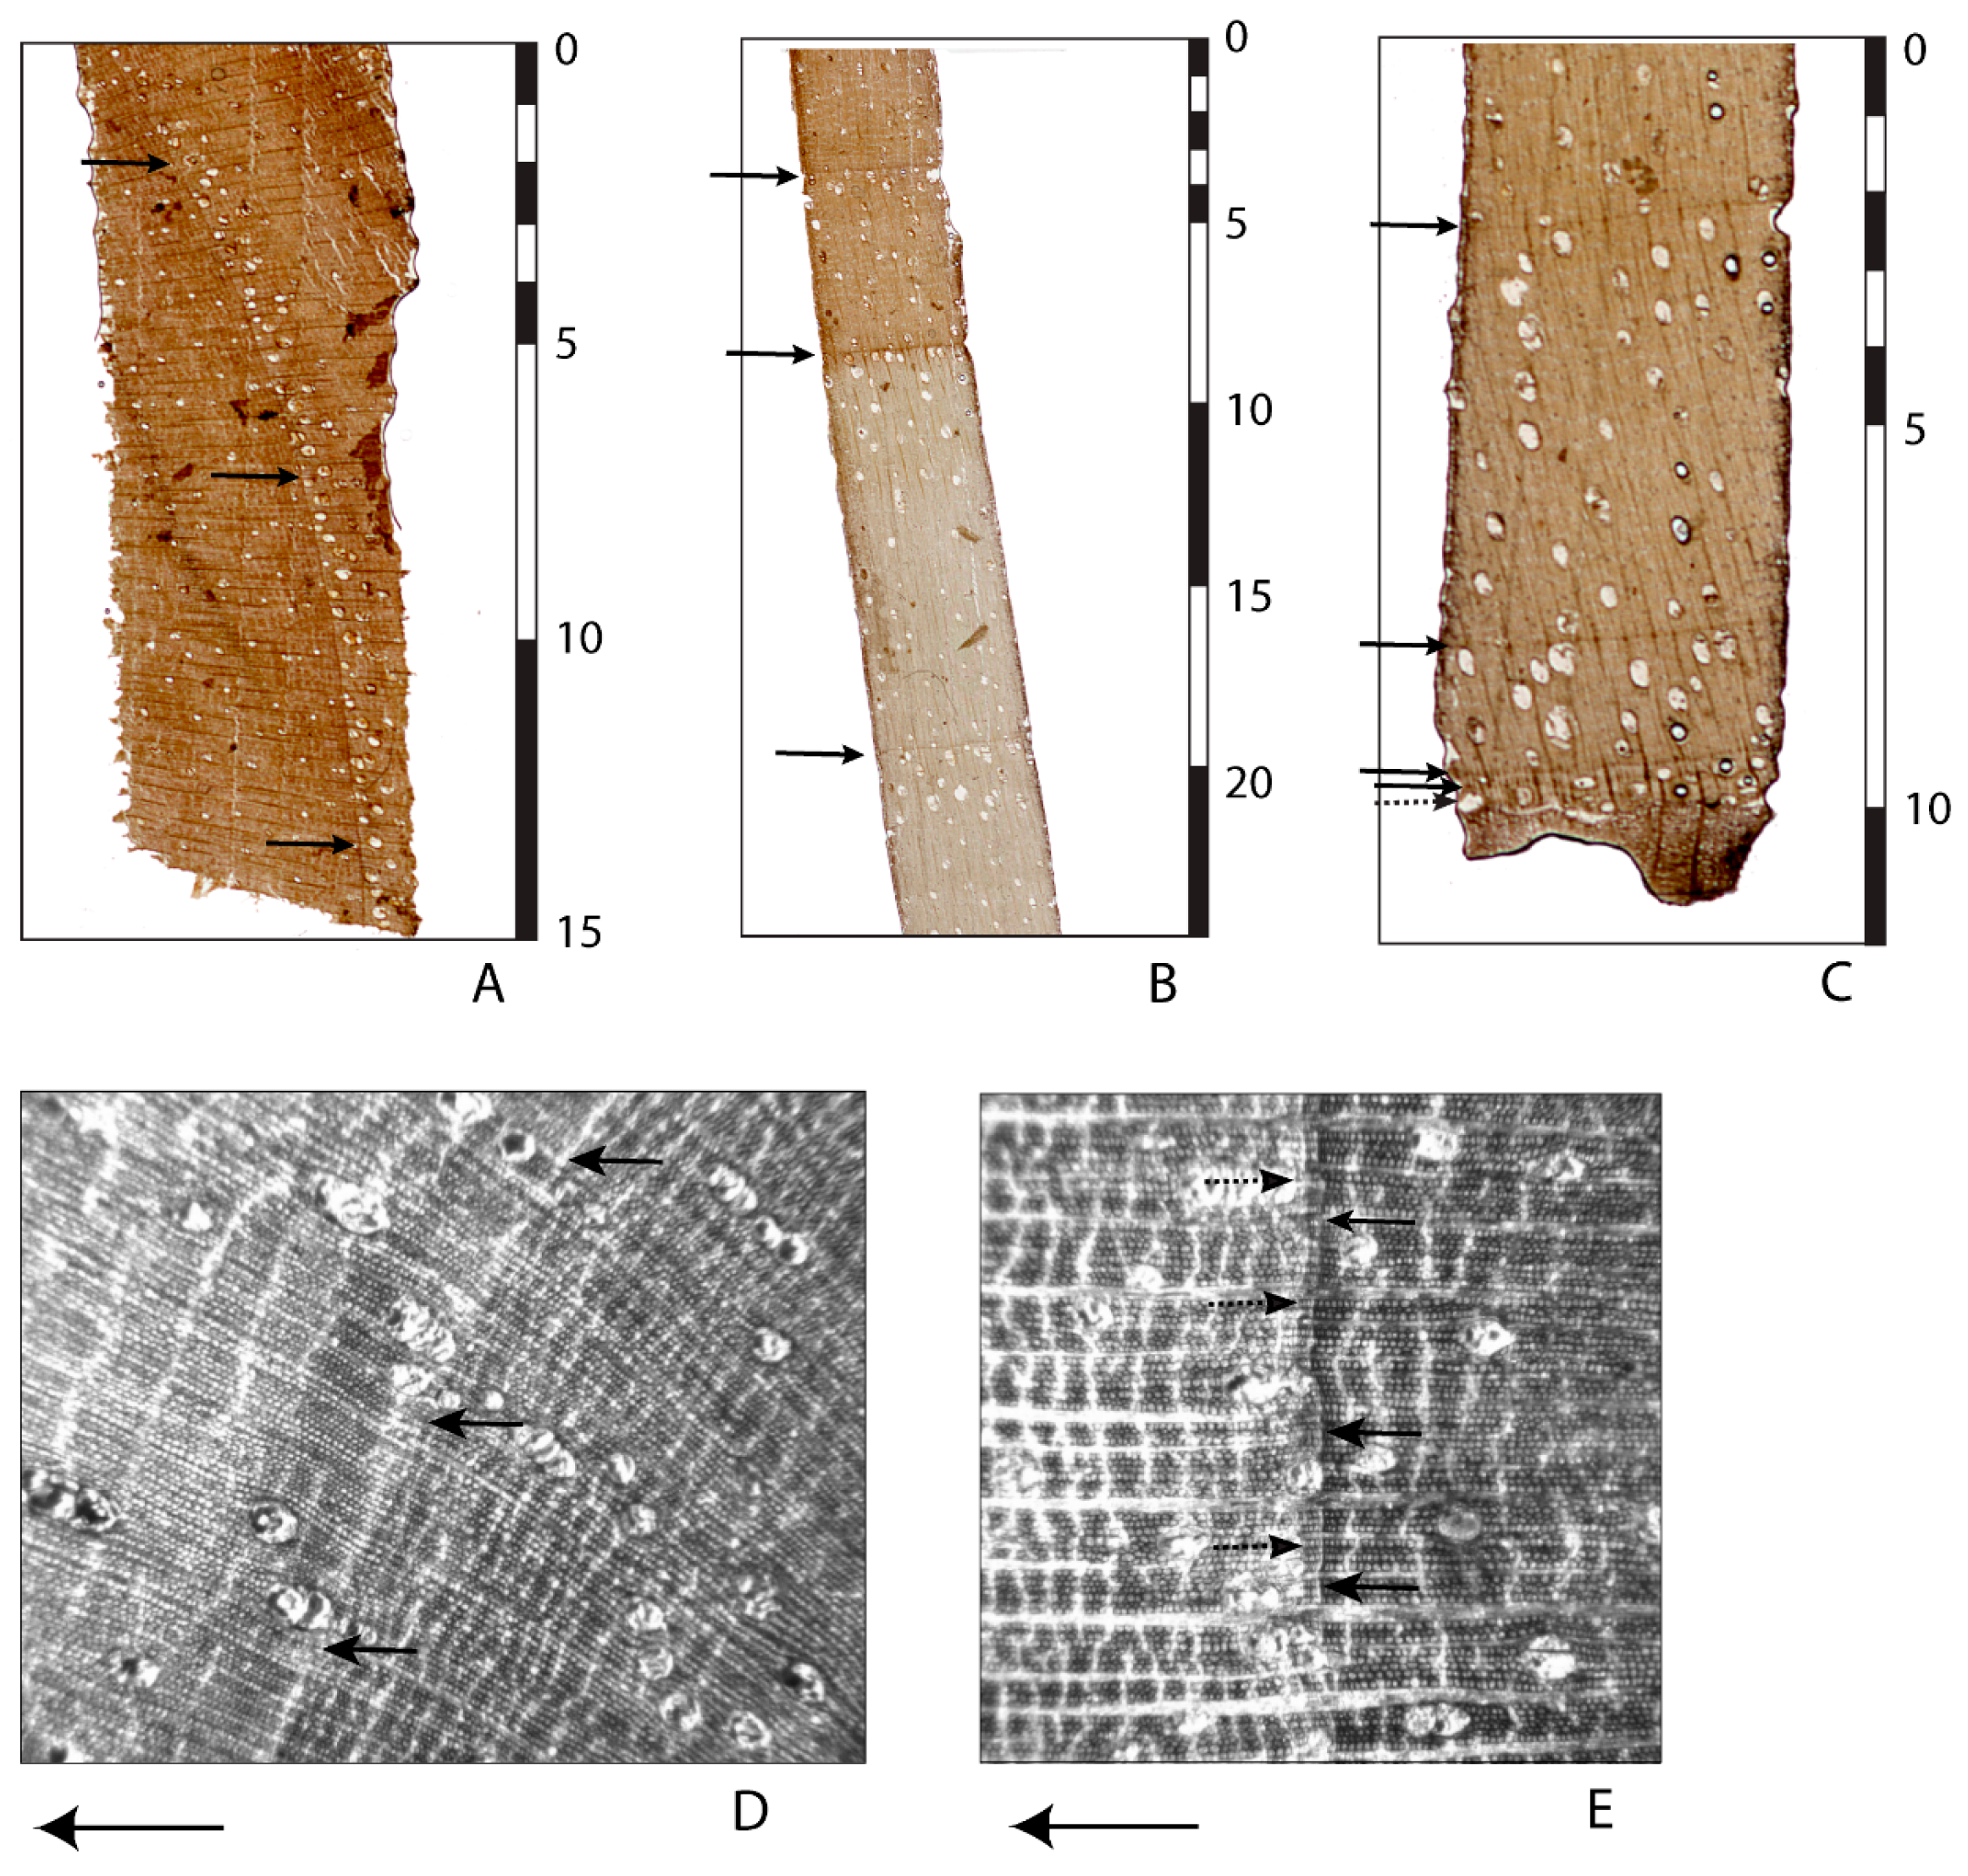
3.1. Wood Anatomy of J. neotropica
3.2. Tree-Ring Chronology of J. neotropica
3.3. Stable Isotopic and Radiocarbon
3.4. Correlation of Tree Growth with Local and Regional Climate

| Period | Strength | Source |
|---|---|---|
| 1951 | M | [41,144] |
| 1953 | M+ | [41,144] |
| 1957/58 | S | [41,144] |
| 1965 | M+ | [41,144] |
| 1968/69 | M− | [41] |
| 1972/73 | S | [41,144] |
| 1976 | M | [41,144] |
| 1982/83 | S+ | [41,113,144] |
| 1987 | M | [41,143] |
| 1997/98 | S+ | [113,144,145] |
| Correlated Variables | r | Student’s t | EDF | p |
|---|---|---|---|---|
| P, TRW | 0.25 | 1.35 | 14 | 0.10 |
| P, observed δ18O | −0.31 | −1.71 | 12 | 0.06 |
| Observed δ18O, simulated δ18O | 0.32 | −1.74 | 12 | 0.03 |
| Observed δ18O, TRW | −0.21 | −1.09 | 12 | 0.15 |
| Observed TRW, NINO12 SST index | 0.34 (0.04, 0.37) | 1.85 | 12 | 0.04 |
| Observed δ18O, NINO12 SST index | −0.35 (−0.39, 0.44) | −1.96 | 12 | 0.04 |
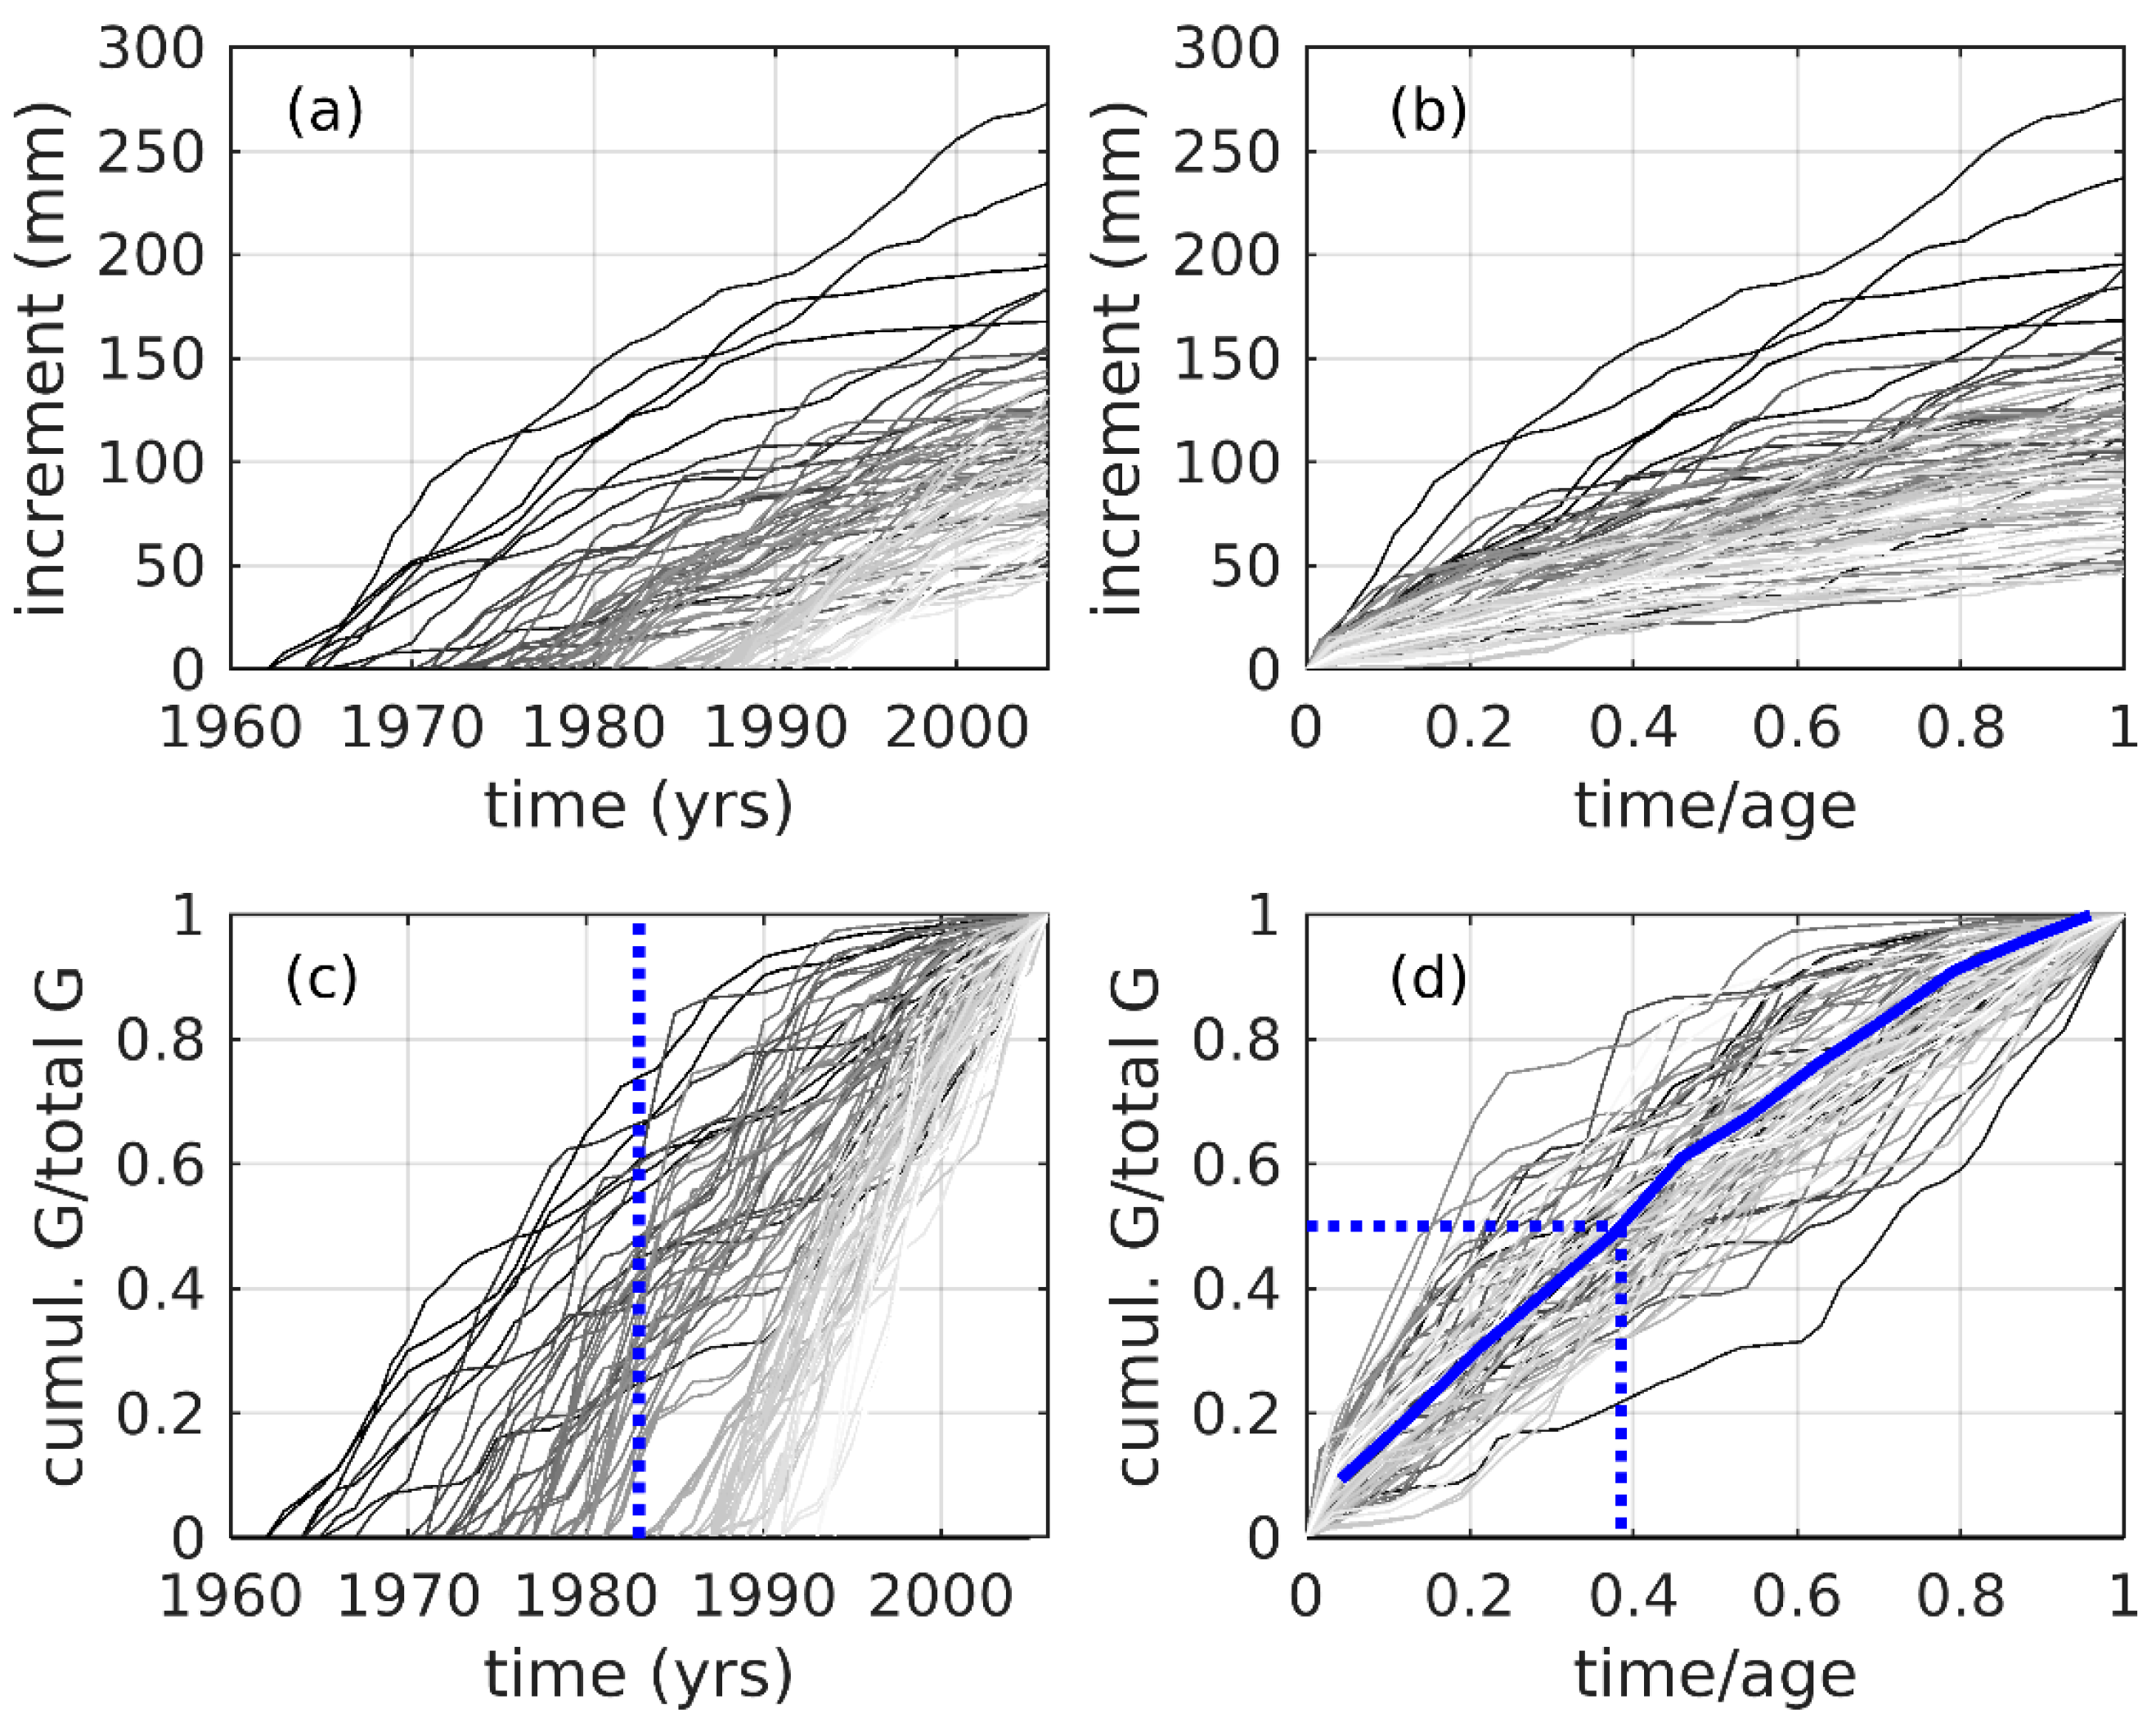
3.5. Cumulative Tree Growth
4. Discussion
4.1. Can J. neotropica Be Crossdated Accurately Using Visible Wood Anatomical Features?
4.2. Are Ring-Based Age Estimates Consistent with Radiocarbon and Stable Isotopic Estimates?
4.3. Are Variations in Ring Widths, Growth Rates and Oxygen Isotopic Composition of J. neotropica at Piura Related to Regional Climate and ENSO, and If So, How?
5. Conclusions
Supplementary Materials
Author Contributions
Funding
Data Availability Statement
Acknowledgments
Conflicts of Interest
References
- von Schnakenburg, P.; Bräuning, A.; Helle, G. Detecting annual growth rhythms from high-frequency densitometry and carbon isotopes in tropical mountain rain forest trees in southern Ecuador. In TRACE—Tree Rings in Archaeology, Climatology and Ecology; Elferts, D., Brumelis, G., Gartner, H., Helle, G., Schleser, G., Eds.; Scientific Technical Report STR 07/05; GFZ Potsdam: Potsdam, Germany, 2008; Volume 6, pp. 96–99. [Google Scholar]
- Fichtler, E. Dendroclimatology using tropical broad-leaved tree species—A review. Erdkunde 2017, 71, 5–22. [Google Scholar] [CrossRef]
- Sánchez-Calderón, O.D.; Carlón-Allende, T.; Mendoza, M.E.; Villanueva-Díaz, J. Dendroclimatology in Latin America: A Review of the State of the Art. Atmosphere 2022, 13, 748. [Google Scholar] [CrossRef]
- Mariaux, A. Growth Periodicity in Tropical Trees. Preface. Int. Assoc. Wood Anat. (IAWA) J. 1995, 16, 327–328. [Google Scholar]
- Eckstein, D.; Sass, U.; Baas, P. Growth periodicity in tropical trees. Kew Bull. 1995, 16, 323–442. [Google Scholar]
- Worbes, M. One hundred years of tree-ring research in the tropics—A brief history and an outlook to future challenges. Dendrochronologia 2002, 20, 217–231. [Google Scholar] [CrossRef]
- Zuidema, P.A.; Baker, P.J.; Groenendijk, P.; Schippers, P.; van der Sleen, P.; Vlam, M.; Sterck, F. Tropical forests and global change: Filling knowledge gaps. Trends Plant Sci. 2013, 18, 413–419. [Google Scholar] [CrossRef]
- Zuidema, P.A.; Groenendijk, P.; Rahman, M.; Trouet, V.; Abiyu, A.; Acuña-Soto, R.; Adenesky-Filho, E.; Alfaro-Sánchez, R.; Anholetto, C.R., Jr.; Vieira Aragão, J.R.; et al. Pantropical tree rings show small effects of drought on stem growth. Science 2025, in press.
- Brienen, R.J.W.; Schöngart, J.; Zuidema, P.A. Tree rings in the tropics: Insights into the ecology and climate sensitivity of tropical trees. In Tropical Tree Physiology; Goldstein, G., Santiago, L., Eds.; Tree Physiology; Springer: Cham, Switzerland, 2016; Volume 6. [Google Scholar] [CrossRef]
- Stahle, D.W.; D’Arrigo, R.D.; Krusic, P.J.; Cleaveland, M.K.; Cook, E.R.; Allan, R.J.; Cole, J.E.; Dunbar, R.B.; Therrell, M.D.; Gay, D.A.; et al. Experimental dendroclimatic reconstruction of the Southern Oscillation. Bull. Am. Meteorol. Soc. 1998, 79, 2137–2152. [Google Scholar] [CrossRef]
- Villalba, R.; Grau, H.R.; Boninsegna, J.A.; Jacoby, G.C.; Ripalta, A. Tree-ring evidence for long-term precipitation changes in subtropical South America. Int. J. Clim. 1998, 18, 1463–1478. [Google Scholar] [CrossRef]
- Borchert, R. Climatic Periodicity, Phenology, and Cambium Activity in Tropical Dry Forest Trees. IAWA J. 1999, 20, 239–247. [Google Scholar] [CrossRef]
- Ciemer, C.; Boers, N.; Hirota, M.; Kurths, J.; Müller-Hansen, F.; Oliveira, R.S.; Winkelmann, R. Higher resilience to climatic disturbances in tropical vegetation exposed to more variable rainfall. Nat. Geosci. 2019, 12, 174–179. [Google Scholar] [CrossRef]
- Granato-Souza, D.; Stahle, D.W.; Barbosa, A.C.; Feng, S.; Torbenson, M.C.A.; Pereira, G.d.A.; Schöngart, J.; Barbosa, J.P.; Griffin, D. Tree rings and rainfall in the equatorial Amazon. Clim. Dyn. 2019, 52, 1857–1869. [Google Scholar] [CrossRef]
- Evans, M.N.; Schrag, D.P. A stable isotope-based approach to tropical dendroclimatology. Geochim. Cosmochim. Acta 2004, 68, 3295–3305. [Google Scholar] [CrossRef]
- Brienen, R.J.W.; Lebrija-Trejos, E.; Van Breugel, M.; Pérez-García, E.A.; Bongers, F.; Meave, J.A.; Martínez-Ramos, M. The Potential of Tree Rings for the Study of Forest Succession in Southern Mexico. Biotropica 2009, 41, 186–195. [Google Scholar] [CrossRef]
- Brienen, R.J.W.; Zuidema, P.A. Relating tree growth to rainfall in Bolivian rain forests: A test for six species using tree ring analysis. Oecologia 2005, 146, 1–12. [Google Scholar] [CrossRef]
- Boninsegna, J.; Argollo, J.; Aravena, J.; Barichivich, J.; Christie, D.; Ferrero, M.; Lara, A.; Le Quesne, C.; Luckman, B.; Masiokas, M.; et al. Dendroclimatological reconstructions in South America: A review. Palaeogeogr. Palaeoclim. Palaeoecol. 2009, 281, 210–228. [Google Scholar] [CrossRef]
- Inga, J.G.; del Valle, J.I. Log-relative growth: A new dendrochronological approach to study diameter growth in Cedrela odorata and Juglans neotropica, Central Forest, Peru. Dendrochronologia 2017, 44, 117–129. [Google Scholar] [CrossRef]
- Alvim, P.d.T. Tree growth periodicity in tropical climates. In The Formation of Wood in Forest Trees; Zimmermann, M.H., Ed.; Academic Press: New York, NY, USA; London, UK; San Francisco, CA, USA, 1964; pp. 479–495. [Google Scholar]
- Boninsegna, J.A.; Villalba, R.; Amarilla, L.; Ocampo, J. Studies on tree rings, growth rates and age-size relationships of tropical trees in Misiones, Argentina. Int. Assoc. Wood Anat. (IAWA) Bull. 1989, 10, 161–169. [Google Scholar]
- Jacoby, G.C. Overview of tree-ring analysis in tropical regions. Int. Assoc. Wood Anat. (IAWA) Bull. 1989, 10, 99–108. [Google Scholar] [CrossRef]
- Stahle, D.W. Useful Strategies for the Development of Tropical Tree-Ring Chronologies. IAWA J. 1999, 20, 249–253. [Google Scholar] [CrossRef]
- Worbes, M. Wood Anatomy and Tree-Ring Structure and Their Importance for Tropical Dendrochronology. In Amazonian Floodplain Forests; Ecological Studies; Junk, W., Piedade, M., Wittmann, F., Schöngart, J., Parolin, P., Eds.; Springer: Dordrecht, The Netherlands, 2010; Volume 210, pp. 329–346. [Google Scholar] [CrossRef]
- Boysen, B.M.; Evans, M.N.; Baker, P.J. δ18O in the tropical conifer Agathis robusta records ENSO-related precipitation variations. PLoS ONE 2014, 9, e102336. [Google Scholar] [CrossRef] [PubMed]
- Layme-Huaman, E.; Ferrero, M.; Palacios-Lazaro, K.; Requena-Rojas, E. Cedrela nebulosa: A novel species for dendroclimatological studies in the montane tropics of South America. Dendrochronologia 2018, 50, 105–112. [Google Scholar] [CrossRef]
- Humanes-Fuente, V.; Ferrero, M.E.; Muñoz, A.A.; González-Reyes, Á.; Requena-Rojas, E.J.; Barichivich, J.; Inga, J.G.; Layme-Huaman, E.T. Two centuries of hydroclimatic variability reconstructed from tree-ring records over the Amazonian Andes of Peru. J. Geophys. Res. Atmos. 2020, 125, e2020JD032565. [Google Scholar] [CrossRef]
- Marcelo-Peña, J.L.; Roig, F.A.; Goodwin, Z.A.; Tomazello-Filho, M. Characterizing growth rings in the trees of Perú: A wood anatomical overview for potential applications in dendroecological-related fields. Dendrochronologia 2020, 62, 125728. [Google Scholar] [CrossRef]
- Villalba, R.; Boninsegna, J.A.; Holmes, R.L. Cedrela augstifolia and Juglans australis: Two new tropical species useful in dendrochronology. Tree-Ring Bull. 1985, 45, 25–35. [Google Scholar]
- Bräuning, A.; Homeier, J.; Cueva, E.; Beck, E.; Günter, S. Growth dynamics of trees in tropical mountain ecosystems. In Gradients in a Tropical Mountain Ecosystem of Ecuador; Beck, E., Bendix, J., Kottke, I., Makeschin, F., Mosandl, R., Eds.; Ecological Studies 198; Springer: Berlin, Germany, 2008; pp. 347–359. ISBN 978-3-540-73526-7. [Google Scholar]
- Bräuning, A.; von Schnakenburg, P.; Volland-Voigt, F.; Peters, T. Seasonal growth dynamics and its climate forcing in a tropical mountain rain forest in southern Ecuador. In TRACE—Tree Rings in Archaeology, Climatology and Ecology; Elferts, D., Brumelis, G., Gartner, H., Helle, G., Schleser, G., Eds.; Scientific Technical Report STR 07/05; GFZ Potsdam: Potsdam, Germany, 2008; Volume 6, pp. 27–30. [Google Scholar]
- Barichivich, J.; Sauchyn, D.J.; Lara, A. Climate signals in high elevation tree-rings from the semiarid Andes of north-central Chile: Responses to regional and large-scale variability. Palaeogeogr. Palaeoclim. Palaeoecol. 2009, 281, 320–333. [Google Scholar] [CrossRef]
- Luckman, B.H. Using multiple high-resolution proxy climate records to reconstruct natural climate variability: An example from the Canadian Rockies. In Mountain Environments in Changing Climates; Beniston, M., Ed.; Routledge: London, UK, 1994; pp. 42–59. [Google Scholar]
- Villalba, R.; Boninsegna, J.A.; Veblen, T.T.; Schmelter, A.; Rubulis, S. Recent trends in tree-ring records from high elevation sites in the andes of northern patagonia. Clim. Change 1997, 36, 425–454. [Google Scholar] [CrossRef]
- Lara, A.; Villalba, R.; Urrutia, R. A 400-year tree-ring record of the Puelo River summer–fall streamflow in the Valdivian Rainforest eco-region, Chile. Clim. Change 2008, 86, 331–356. [Google Scholar] [CrossRef]
- Pucha-Cofrep, D.; Jumbo, N.; Moncada, V.; Burneo, M.; Narvaez, L.; César, F.; Barrera, E.; Castro, J.; Ruiz, J.; Bräuning, A. Impacto de las condiciones climáticas en el crecimiento diamétrico de especies forestales de alto valor comercial. In Efectos del Cambio Climático en el Hábitat de las Especies y los O.D.S. Memorias del Congreso Internacional de Cambio Climático; Benavides-Muñoz, H., Pucha-Cofrep, F., Eds.; La Universidad Católica de Loja: Loja, Equador, 2020; pp. 20–22. [Google Scholar]
- McPhaden, M.J.; Zebiak, S.E.; Glantz, M.H. ENSO as an Integrating Concept in Earth Science. Science 2006, 314, 1740–1745. [Google Scholar] [CrossRef]
- Diaz, H.F.; Hoerling, M.P.; Eischeid, J.K. ENSO variability, teleconnections and climate change. Int. J. Climatol. 2001, 21, 1845–1862. [Google Scholar] [CrossRef]
- Goldberg, R.A.; Tisnado, M.G.; Scofield, R.A. Characteristics of extreme rainfall events in northwestern Peru during the 1982–1983 El Niño period. J. Geophys. Res. Oceans 1987, 92, 14225–14241. [Google Scholar] [CrossRef]
- D’Arrigo, R.D.; Jacoby, G.C. Past changes in climate and tree growth in the Western Americas. In High-Latitude Rainforests and Associated Ecosystems of the West Coast of the Americas: Climate, Hydrology, Ecology, and Conservation; Lawford, R.G., Alaback, P.B., Fuentes, E., Eds.; Ecological Studies 116; Springer: Berlin/Heidelberg, Germany, 1996; pp. 75–88. [Google Scholar]
- Ortlieb, L. The documented historical record of El Niño events in Peru: An update of the Quinn record (sixteenth through nineteenth centuries). In El Niño and the Southern Oscillation: Multiscale Variability and Global and Regional Impacts; Díaz, H.F., Markgraf, V., Eds.; Cambridge University Press: Cambridge, UK, 2000; pp. 207–295. [Google Scholar]
- Rodríguez, R.; Mabres, A.; Luckman, B.; Evans, M.; Masiokas, M.; Ektvedt, T.M. ‘El Niño’ events recorded in dry-forest species of the lowlands of northwest Peru. Dendrochronologia 2005, 22, 181–187. [Google Scholar] [CrossRef]
- Holmgren, M.; López, B.C.; Gutiérrez, J.R.; Squeo, F.A. Herbivory and plant growth rate determine the success of El Niño Southern Oscillation-driven tree establishment in semiarid South America. Glob. Change Biol. 2006, 12, 2263–2271. [Google Scholar] [CrossRef]
- López, B.; Sabaté, S.; Gracia, C.; Rodríguez, R. Wood anatomy, description of annual rings, and responses to ENSO events of Prosopis pallida H.B.K., a wide-spread woody plant of arid and semi-arid lands of Latin America. J. Arid. Environ. 2005, 61, 541–554. [Google Scholar] [CrossRef]
- López, B.C.; Rodríguez, R.; Gracia, C.A.; Sabaté, S. Climatic signals in growth and its relation to ENSO events of two Prosopis species following a latitudinal gradient in South America. Glob. Change Biol. 2006, 12, 897–906. [Google Scholar] [CrossRef]
- López, B.C.; Holmgren, M.; Sabaté, S.; Garcia, C.A. Estimating annual rainfall threshold for establishment of tree species in water-limited ecosystems using tree-ring data. J. Arid. Environ. 2008, 72, 602–611. [Google Scholar] [CrossRef]
- Locosselli, G.M.; Buckeridge, M.S.; Moreira, M.Z.; Ceccantini, G. A multi-proxy dendroecological analysis of two tropical species (Hymenaea spp., Leguminosae) growing in a vegetation mosaic. Trees 2013, 27, 25–36. [Google Scholar] [CrossRef]
- López, L.; Rodríguez-Catón, M.; Villalba, R. Convergence in growth responses of tropical trees to climate driven by water stress. Ecography 2019, 42, 1899–1912. [Google Scholar] [CrossRef]
- Babst, F.; Bodesheim, P.; Charney, N.; Friend, A.D.; Girardin, M.P.; Klesse, S.; Moore, D.J.; Seftigen, K.; Björklund, J.; Bouriaud, O. When tree rings go global: Challenges and opportunities for retro-and prospective insight. Quat. Sci. Rev. 2018, 197, 1–20. [Google Scholar] [CrossRef]
- Rodriguez-Caton, M.; Morales, M.S.; Rao, M.P.; Nixon, T.; Vuille, M.; Rivera, J.A.; Oelkers, R.; Christie, D.A.; Varuolo-Clarke, A.M.; Ferrero, M.E.; et al. A 300-year tree-ring δ18O-based precipitation reconstruction for the South American Altiplano highlights decadal hydroclimate teleconnections. Commun. Earth Environ. 2024, 5, 269. [Google Scholar] [CrossRef]
- Worbes, M.; Junk, W.J. Dating Tropical Trees by Means of 14C from Bomb Tests. Ecology 1989, 70, 503–507. [Google Scholar] [CrossRef]
- Dezzeo, N.; Worbes, M.; Ishii, I.; Herrera, R. Annual tree rings revealed by radiocarbon dating in seasonally flooded forest of the Mapire River, a tributary of the lower Orinoco River, Venezuela. Plant Ecol. 2003, 168, 165–175. [Google Scholar] [CrossRef]
- Fichtler, E.; Clark, D.A.; Worbes, M. Age and Long-term Growth of Trees in an Old-growth Tropical Rain Forest, Based on Analyses of Tree Rings and 14C1. Biotropica 2003, 35, 306. [Google Scholar] [CrossRef]
- Robertson, I.; Froyd, C.A.; Walsh, R.P.D.; Newbery, D.M.; Woodborne, S.; Ong, R.C. The dating of dipterocarp tree rings: Establishing a record of carbon cycling and climatic change in the tropics. J. Quat. Sci. 2004, 19, 657–664. [Google Scholar] [CrossRef]
- Robertson, I.; Loader, N.; Froyd, C.; Zambatis, N.; Whyte, I.; Woodborne, S. The potential of the baobab (Adansonia digitata L.) as a proxy climate archive. Appl. Geochem. 2006, 21, 1674–1680. [Google Scholar] [CrossRef]
- Westbrook, J.A.; Guilderson, T.P.; Colinvaux, P.A. Annual growth rings in a sample of Hymenaea courbaril. Int. Assoc. Wood Anat. (IAWA) J. 2006, 27, 193–197. [Google Scholar] [CrossRef]
- Wils, T.H.; Robertson, I.; Eshetu, Z.; Sass-Klaassen, U.G.; Koprowski, M. Periodicity of growth rings in Juniperus procera from Ethiopia inferred from crossdating and radiocarbon dating. Dendrochronologia 2009, 27, 45–58. [Google Scholar] [CrossRef]
- Norström, E.; Holmgren, K.; Mörth, C.-M. A 600-year-long δ18O record from cellulose of Breonadia salicina trees, South Africa. Dendrochronologia 2008, 26, 21–33. [Google Scholar] [CrossRef]
- Nydal, R.; Lövseth, K. Tracing bomb 14C in the atmosphere 1962–1980. J. Geophys. Res. Ocean. 1983, 88, 3621–3642. [Google Scholar] [CrossRef]
- Reimer, P.J.; Brown, T.A.; Reimer, R.W. Discussion: Reporting and calibration of post-bomb 14C data. Radiocarbon 2004, 46, 1299–1304. [Google Scholar]
- Hua, Q.; Barbetti, M. Review of Tropospheric Bomb 14C Data for Carbon Cycle Modeling and Age Calibration Purposes. Radiocarbon 2004, 46, 1273–1298. [Google Scholar] [CrossRef]
- Mozeto, A.A.; Fritz, P.; Moreira, M.Z.; Vetter, E.; Aravena, R.; Salati, E.; Drimmie, R.J. Growth Rates of Natural Amazonian Forest Trees Based on Radiocarbon Measurements. Radiocarbon 1988, 30, 1–6. [Google Scholar] [CrossRef]
- Biondi, F.; Fessenden, J.E. Radiocarbon Analysis of Pinus lagunae Tree Rings: Implications for Tropical Dendrochronology. Radiocarbon 1999, 41, 241–249. [Google Scholar] [CrossRef]
- Norström, E.; Holmgren, K.; Mörth, C.-M. Rainfall-driven variations in δ13C composition and wood anatomy of Breonadia salicina trees from South Africa between AD 1375 and 1995. S. Afr. J. Sci. 2005, 101, 162–168. [Google Scholar]
- Anchukaitis, K.J.; Evans, M.N. Tropical cloud forest climate variability and the demise of the Monteverde golden toad. Proc. Natl. Acad. Sci. USA 2010, 107, 5036–5040. [Google Scholar] [CrossRef] [PubMed]
- Verheyden, A.; Helle, G.; Schleser, G.H.; Dehairs, F.; Beeckman, H.; Koedam, N. Annual cyclicity in high-resolution stable carbon and oxygen isotope ratios in the wood of the mangrove tree Rhizophora mucronata. Plant Cell Environ. 2004, 27, 1525–1536. [Google Scholar] [CrossRef]
- Poussart, P.F.; Evans, M.N.; Schrag, D.P. Resolving seasonality in tropical trees: Multi-decade, high-resolution oxygen and carbon isotope records from Indonesia and Thailand. Earth Planet. Sci. Lett. 2004, 218, 301–316. [Google Scholar] [CrossRef]
- Poussart, P.F.; Schrag, D.P. Seasonally resolved stable isotope chronologies from northern Thailand deciduous trees. Earth Planet. Sci. Lett. 2005, 235, 752–765. [Google Scholar] [CrossRef]
- Anchukaitis, K.J.; Evans, M.N.; Wheelwright, N.T.; Schrag, D.P. Stable isotope chronology and climate signal calibration in neotropical montane cloud forest trees. J. Geophys. Res. Biogeosci. 2008, 113, G03030. [Google Scholar] [CrossRef]
- Managave, S.R.; Ramesh, R. Isotope dendroclimatology: A review with a special emphasis on tropics. In Handbook of Environmental Isotope Geochemistry, Advances in Isotope Geochemistry; Baskaran, M., Ed.; Springer Science & Business Media: Berlin, Germany, 2012. [Google Scholar] [CrossRef]
- Brienen, R.J.W.; Helle, G.; Pons, T.L.; Guyot, J.-L.; Gloor, M. Oxygen isotopes in tree rings are a good proxy for Amazon precipitation and El Niño-Southern Oscillation variability. Proc. Natl. Acad. Sci. USA 2012, 109, 16957–16962. [Google Scholar] [CrossRef]
- van der Sleen, P.; Zuidema, P.A.; Pons, T.L. Stable isotopes in tropical tree rings: Theory, methods and applications. Funct. Ecol. 2017, 31, 1674–1689. [Google Scholar] [CrossRef]
- Wolfe, A.P.; Csank, A.Z.; Reyes, A.V.; McKellar, R.C.; Tappert, R.; Muehlenbachs, K. Pristine Early Eocene Wood Buried Deeply in Kimberlite from Northern Canada. PLoS ONE 2012, 7, e45537. [Google Scholar] [CrossRef]
- Farquhar, G.D.; Ehleringer, J.R.; Hubick, K.T. Carbon isotope discrimination and photosynthesis. Annu. Rev. Plant Physiol. Plant Mol. Biol. 1989, 40, 503–537. [Google Scholar] [CrossRef]
- Roden, J.S.; Ehleringer, J.R. Hydrogen and oxygen isotope ratios of leaf water and tree-ring cellulose for field-grown riparian trees. Oecologia 2000, 123, 481–489. [Google Scholar] [CrossRef]
- Barbour, M.M.; Roden, J.S.; Ehleringer, J.R.; Farquhar, G.D. Expressing leaf water and cellulose oxygen isotope ratios as enrichment above source water reveals evidence of a Péclet effect. Oecologia 2004, 138, 426–435. [Google Scholar] [CrossRef] [PubMed]
- McCarroll, D.; Loader, N.J. Stable isotopes in tree rings. Quat. Sci. Rev. 2004, 23, 771–801. [Google Scholar] [CrossRef]
- Ehleringer, J.R.; Dawson, T.E. Water uptake by plants: Perspectives from stable isotope composition. Plant Cell Environ. 1992, 15, 1073–1082. [Google Scholar] [CrossRef]
- Dawson, T.E.; Mambelli, S.; Plamboeck, A.H.; Templer, P.H.; Tu, K.P. Stable isotopes in plant ecology. Annu. Rev. Ecol. Syst. 2002, 33, 507–559. [Google Scholar] [CrossRef]
- Vuille, M.; Werner, M. Stable isotopes in precipitation recording South American summer monsoon and ENSO variability: Observations and model results. Clim. Dyn. 2005, 25, 401–413. [Google Scholar] [CrossRef]
- Saurer, M.; Kress, A.; Leuenberger, M.; Rinne, K.T.; Treydte, K.S.; Siegwolf, R.T.W. Influence of atmospheric circulation patterns on the oxygen isotope ratio of tree rings in the Alpine region. J. Geophys. Res. Atmos. 2012, 117, D5. [Google Scholar] [CrossRef]
- Gessler, A.; Brandes, E.; Keitel, C.; Boda, S.; Kayler, Z.E.; Granier, A.; Barbour, M. The oxygen isotope enrichment of leaf-exported assimilates–does it always reflect lamina leaf water enrichment? New Phytol. 2013, 200, 144–157. [Google Scholar] [CrossRef] [PubMed]
- Gessler, A.; Ferrio, J.P.; Hommel, R.; Treydte, K.; Werner, R.A.; Monson, R.K.; Schnitzler, J.-P. Stable isotopes in tree rings: Towards a mechanistic understanding of isotope fractionation and mixing processes from the leaves to the wood. Tree Physiol. 2014, 34, 796–818. [Google Scholar] [CrossRef]
- Rodriguez-Caton, M.; Andreu-Hayles, L.; Morales, M.S.; Daux, V.; Christie, D.A.; Coopman, R.E.; Alvarez, C.; Rao, M.P.; Aliste, D.; Flores, F.; et al. Different climate sensitivity for radial growth, but uniform for tree-ring stable isotopes along an aridity gradient in Polylepis tarapacana, the world’s highest elevation tree species. Tree Phys. 2021, 41, 1353–1371. [Google Scholar] [CrossRef]
- Evans, M.N. Toward forward modeling for paleoclimatic proxy signal calibration: A case study with oxygen isotopic composition of tropical woods. Geochem. Geophys. Geosyst. 2007, 8, Q07008. [Google Scholar] [CrossRef]
- Tropicos v.3.4.2; Missouri Botanical Garden: St. Louis, MO, USA, 2025; Available online: https://tropicos.org/name/16700014 (accessed on 27 May 2025).
- Diels, L. Juglans neotropica. In Urban, Plantae Novae Andinae Imprimis Weberbauerianae; Botanishe Jahrbüchen: Stuttgart, Germany, 1906; Volume 37, p. 398. [Google Scholar]
- Manning, W.E. The Genus Juglans in South America and the West Indies. Brittonia 1960, 12, 1–26. [Google Scholar] [CrossRef]
- Aradhya, M.K.; Potter, D.; Gao, F.; Simon, C.J. Molecular phylogeny of Juglans (Juglandaceae): A biogeographic perspective. Tree Genet. Genomes 2007, 3, 363–378. [Google Scholar] [CrossRef]
- Toro Vanegas, E.; Roldan Rojas, I.E. Estado del arte, progagación y conservación de Juglans neotropica Diels, en zonas Andinas (State of the Art, propagation and conservation of Juglans neotropica Diels., in Andean zones). Madera Bosques 2018, 24, 1. [Google Scholar] [CrossRef]
- Ministry of Agriculture and Forestry. Juglans (Walnut)—Post Entry Quarantine Testing Manual; Biosecurity New Zealand, Ministry of Agriculture and Forestry: Auckland, New Zealand, 2008; 27p. [Google Scholar]
- Pennington, T.D.; Reyel, C.; Daza, A. Illustrated Guide to the Trees of Peru; D Hunt Books: Wallingford, UK, 2004; 848p. [Google Scholar]
- Reynel, C.; Pennington, T.D.; Pennington, R.T.; Marcelo, J.; Daza, A. Árboles Útiles del Ande Peruano. Una guía de Identificación, Ecología y Propagación de las Especies de la Sierra y los Bosques Montaños en el Perú; Darwin Initiative Project: Lima, Peru, 2006; 466p. [Google Scholar]
- Amaya Cubas, J.A. Tratamientos Pre-Germinativos de Juglans neotropica Diels y Podocarpus rospigliosii Pilger, en Inmersiones de agua y Ácido Giberélico. Ph.D. Thesis, Universidad Nacional del Centro del Peru, Facultad de Ingenierio Forestal, Huancayo, Peru, 1985. [Google Scholar]
- Cotler, H.; Maass, J.M. Tree Management in the Northwestern Andean Cordillera of Peru. Mt. Res. Dev. 1999, 19, 153. [Google Scholar] [CrossRef]
- National Research Council (NRC). The Lost Crops of the Incas: Little-Known Plants of the Andes with Promise for Worldwide Cultivation; National Academy Press: Washington, DC, USA, 1989; 415p.
- IUCN (International Union for the Conservation of Nature). Americas Regional Workshop (Conservation & Sustainable Management of Trees, Costa Rica) 1998. Juglans neotropica. In IUCN 2010. IUCN Red List of Threatened Species; Version 2010.2; 2010; Available online: www.iucnredlist.org (accessed on 1 September 2010).
- Lamb, D.; Erskine, P.D.; Parrotta, J.A. Restoration of Degraded Tropical Forest Landscapes. Science 2005, 310, 1628–1632. [Google Scholar] [CrossRef]
- Kribs, D.A. Comparative anatomy of the woods of the Juglandaceae. Trop. Woods 1927, 12, 16–21. [Google Scholar]
- Heimsch, C., Jr.; Wetmore, R.H. The significance of wood anatomy in the taxonomy of the Juglandaceae. Am. J. Bot. 1939, 26, 651–660. [Google Scholar] [CrossRef]
- Fritts, H.C. Tree Rings and Climate; The Blackburn Press: Caldwell, NJ, USA, 1976; 567p. [Google Scholar]
- Villalba, R.; Holmes, R.L.; Boninsegna, J.A. Spatial Patterns of Climate and Tree Growth Variations in Subtropical Northwestern Argentina. J. Biogeogr. 1992, 19, 631. [Google Scholar] [CrossRef]
- Morales, M.S.; Villalba, R.; Grau, H.R.; Paolini, L. Rainfall-controlled tree growth in high-elevation subtropical treelines. Ecology 2004, 85, 3080–3089. [Google Scholar] [CrossRef]
- Morales, M.S.; Villalba, R. Tree rings as a surrogate for economic stress—An example from the Puna of Jujuy, Argentina in the 19th century. Dendrochronologia 2005, 22, 141–147. [Google Scholar]
- Worbes, M. Annual growth rings, rainfall-dependent growth and long-term growth patterns of tropical trees from the Caparo Forest Reserve in Venezuela. J. Ecol. 1999, 87, 391–403. [Google Scholar] [CrossRef]
- Nugent, J.; Boniface, J. Permaculture Plants—A Selection; Chelsea Green Publishing Company: White River Junction, VT, USA, 2005; 160p. [Google Scholar]
- Leuschner, C. Are high elevations in tropical mountains arid environments for plants? Ecology 2000, 81, 1425–1436. [Google Scholar] [CrossRef]
- Biondi, F. A 400-year tree-ring chronology from the tropical treeline of North America. AMBIO J. Hum. Environ. 2001, 30, 162–166. [Google Scholar] [CrossRef]
- Speer, J.H. Fundamentals of Tree-Ring Research; The University of Arizona Press: Tucson, AZ, USA, 2010; 333p. [Google Scholar]
- Instituto Nacional de Recursos Naturales (INRENA). Mapa de Bosques Secos del Departamento de Piura. Memoria Descriptive; Ministerio de Agricultura, Dirección de Estudios y Proyectos de Recursos Naturales: Lima, Peru, 1998; 86p. [Google Scholar]
- Mettier, R.; Schlunegger, F.; Schneider, H.; Rieke-Zapp, D.; Schwab, M. Relationships between landscape morphology, climate and surface erosion in northern Peru at 5°S latitude. Int. J. Earth Sci. (Geol. Rundsch.) 2009, 98, 2009–2022. [Google Scholar] [CrossRef]
- Ektvedt, T.M. Firewood consumption amongst poor inhabitants in a semiarid tropical forest: A case study from Piura, northern Peru. Nor. Geogr. Soc. 2011, 65, 28–41. [Google Scholar] [CrossRef]
- Servicio Nacional de Meteorológica e Hidrológica del Perú (SENAMHI). 2025. Available online: https://www.senamhi.gob.pe/?&p=estaciones (accessed on 17 May 2025).
- ISO 2533:1975.9; Standard Atmosphere. International Organization for Standardization (ISO): Geneva, Switzerland, 1975.
- Bockor, I.; Gamboa, H. Documentación del Proyecto. Resúmenes de publicaciones. INFOR-GTZ. Proyecto Peruano-Alemán; Desarrollo Forestal y Agroforestal en la Selva Central: Lima, Peru, 1987; p. 86. [Google Scholar]
- Estrada, A.W. Manual para la Producción de Nogal. Juglans neotropica Diels; Editorial EDI-U: Loja, Ecuador, 1997; 47p. [Google Scholar]
- Robinson, W.J.; Evans, R. A microcomputer-based tree-ring measuring system. Tree-Ring Bull. 1980, 40, 59–64. [Google Scholar]
- Holmes, R.L. Computer-assisted quality control in tree-ring dating and measurement. Tree-Ring Bull. 1983, 43, 69–78. [Google Scholar]
- Stokes, M.A.; Smiley, T.L. An Introduction to Tree Ring Dating; The University of Arizona Press: Tucson, AZ, USA, 1996; 73p. [Google Scholar]
- Cook, E. The Concept and Methodology of Program ARSTAN, Program Site; Tree-Ring Laboratory, Lamont-Doherty Earth Observatory of Columbia University in Palisades: New York, NY, USA, 1985. [Google Scholar]
- Cook, E.R.; Briffa, K.R.; Shiyatov, S.; Mazepa, V. Tree-ring standardization and growth-trend estimation. In Methods of Dendrochronology: Applications in the Environmental Sciences; Cook, E.R., Kairiukstis, L.A., Eds.; International Institute for Applied Systems Analysis, Kluwer Academic Publishers: Boston, MA, USA, 1990; pp. 104–123. [Google Scholar]
- Tolwinski-Ward, S.E.; Evans, M.N.; Hughes, M.K.; Anchukaitis, K.J. An efficient forward model of the climate controls on interannual variation in tree-ring width. Clim. Dyn. 2010, 36, 2419–2439. [Google Scholar] [CrossRef]
- Evans, M.; Smerdon, J.E.; Kaplan, A.; Tolwinski-Ward, S.; González-Rouco, J.F. Climate field reconstruction uncertainty arising from multivariate and nonlinear properties of predictors. Geophys. Res. Lett. 2014, 41, 9127–9134. [Google Scholar] [CrossRef]
- Brienen, R.J.; Zuidema, P.A. Lifetime growth patterns and ages of Bolivian rain forest trees obtained by tree ring analysis. J. Ecol. 2006, 94, 481–493. [Google Scholar] [CrossRef]
- Groenendijk, P.; Sass-Klaassen, U.; Bongers, F.; Zuidema, P.A. Potential of tree-ring analysis in a wet tropical forest: A case study on 22 commercial tree species in Central Africa. For. Ecol. Manag. 2014, 323, 65–78. [Google Scholar] [CrossRef]
- Pearson, C.; Manning, S.W.; Coleman, M.; Jarvis, K. Can tree-ring chemistry reveal absolute dates for past volcanic eruptions? J. Archaeol. Sci. 2005, 32, 1265–1274. [Google Scholar] [CrossRef]
- Schollaen, K.; Heinrich, I.; Neuwirth, B.; Krusic, P.J.; D’Arrigo, R.D.; Karyanto, O.; Helle, G. Multiple tree-ring chronologies (ring width, δ13C and δ18O) reveal dry and rainy season signals of rainfall in Indonesia. Quat. Sci. Rev. 2013, 73, 170–181. [Google Scholar] [CrossRef]
- Anchukaitis, K.J.; Evans, M.N.; Lange, T.; Smith, D.R.; Leavitt, S.W.; Schrag, D.P. Purity and isotopic results from a rapid cellulose extraction method. Anal. Chem. 2008, 80, 2035–2041. [Google Scholar] [CrossRef] [PubMed]
- Evans, M.N. A reactor for high-temperature pyrolysis and oxygen isotopic analysis of cellulose via induction heating. Rapid Commun. Mass Spectrom. 2008, 22, 2211–2219. [Google Scholar] [CrossRef]
- Comboul, M.; Emile-Geay, J.; Evans, M.N.; Mirnateghi, N.; Cobb, K.M.; Thompson, D.M. A probabilistic model of chronological errors in layer-counted climate proxies: Applications to annually banded coral archives. Clim. Past 2014, 10, 825–841. [Google Scholar] [CrossRef]
- Nurhati, I.S.; Evans, M.N.; Cahyarini, S.Y.; D’arrigo, R.D.; Yoshimura, K.; Herho, S.H.S. δ18O of Marine-Influenced Tectona grandis L. f. From Equatorial Indonesia: A Local Rainfall Amount and Remote ENSO Indicator. Paleoceanogr. 2024, 39, e2023PA004758. [Google Scholar] [CrossRef]
- Harris, I.; Osborn, T.J.; Jones, P.; Lister, D. Version 4 of the CRU TS monthly high-resolution gridded multivariate climate dataset. Sci. Data 2020, 7, 109. [Google Scholar] [CrossRef]
- Bradley, R.S.; Vuille, M.; Hardy, D.; Thompson, L.G. Low latitude ice cores record Pacific sea surface temperatures. Geophys. Res. Lett. 2003, 30, 1174. [Google Scholar] [CrossRef]
- Cobb, K.M.; Adkins, J.F.; Partin, J.W.; Clark, B. Regional-scale climate influences on temporal variations of rainwater and cave dripwater oxygen isotopes in northern Borneo. Earth Planet. Sci. Lett. 2007, 263, 207–220. [Google Scholar] [CrossRef]
- Hu, J.; Emile-Geay, J.; Partin, J. Correlation-based interpretations of paleoclimate data—Where statistics meet past climates. Earth Planet. Sci. Lett. 2017, 459, 362–371. [Google Scholar] [CrossRef]
- Leavitt, S.W.; Danzer, S.R. Method for batch processing small wood samples to holocellulose for stable-carbon isotope analysis. Anal. Chem. 1993, 65, 87–89. [Google Scholar] [CrossRef]
- Bronk Ramsey, C. Bayesian Analysis of Radiocarbon Dates. Radiocarbon 2009, 51, 337–360. [Google Scholar] [CrossRef]
- Oxcal 4.1. Available online: https://c14.arch.ox.ac.uk/oxcal/OxCal.html (accessed on 1 May 2010).
- Banning, E.B. Interpreting radiocarbon dates. In The Archaeologist’s Laboratory. The Analysis of Archeological Data; Banning, E.B., Ed.; Kluwer Academic: Hingham, MA, USA, 2000; pp. 265–275. [Google Scholar]
- Biondi, F.; Queadan, F. A theory-driven approach to tree-ring standardization: Defining the biological trend from expected basal area increment. Tree-Ring Res. 2008, 64, 81–96. [Google Scholar] [CrossRef]
- Applequist, M.B. A simple pith locator for use with off-center increment cores. J. For. 1958, 56, 141. [Google Scholar]
- Block, M.; Richter, M. Impacts of heavy rainfall in El Nino 1997/98 on the vegetation of Sechura Desert in Northern Peru (A preliminary report). Phytocoenologia 2000, 30, 491–517. [Google Scholar] [CrossRef]
- Chen, D.; Cane, M.A. El Niño prediction and predictability. J. Comput. Phys. 2008, 227, 3625–3640. [Google Scholar] [CrossRef]
- Quinn, W.H.; Neal, V.T.; Antinez de Mayolo, S.E. El Nino Occurrences over the past four and a half centuries. J. Geophys. Res. 1987, 92, 14449–14461. [Google Scholar] [CrossRef]
- Climate Prediction Center (CPC). NOAA Oceanic NINO Indices. 2025. Available online: https://www.cpc.ncep.noaa.gov/data/indices/ersst5.nino.mth.91-20.ascii (accessed on 17 March 2025).
- Dode, L.A. Contribution de l’étude du genre Juglans. In Bulletin de la Société Botanique de France; Société Botanique de France: Paris, France, 1909; pp. 165–215. [Google Scholar]
- Loján Idrobo, L. El verdor de Los Andes. Arboles y Arbustos Nativos para el Desarrollo Forestal Altoandino; Proyecto Desarrollo Forestal Participativo en Los Andes; FAO: Quito, Ecuador, 1992; pp. 67–73. [Google Scholar]
- Arias Ninán, E.S. Ensayos de Desinfección y Medios de Cultivo para la Micropropagación del nogal (Juglans neotropica Diels). Bachelor’s Thesis, Universidad Nacional Agraria La Molina, Facultad de Ciencias Forestales, Lima, Peru, 1995. [Google Scholar]
- Van den Eynden, V.; Cueva, E.; Cabrera, O. Plantas Silvestres Comestibles del sur del Ecuador—Wild edible Plants of Southern Ecuador; Ediciones Abya-Yala: Quito, Ecuador, 1999; 221p. [Google Scholar]
- Miller, R.B. Wood Anatomy and Identification of Species of Juglans. Bot. Gaz. 1976, 137, 368–377. [Google Scholar] [CrossRef]
- Vera, A.; Ortega, R.; Pérez, P.; Rosero, J.; Chavesta, M. Avances en la caracterización e identificción anatómica de los anillos de crecimiento de la especie Juglans neotropica Diels (Nogal) para estudios dendrocronológicos en el fundo La Génova, Junín (Perú). XILEMA 2011, 24, 5–11. [Google Scholar]
- Beltrán, L.A.; Valencia, G.M. Anatomía de anillos de crecimiento de 80 especies arbóreas potenciales para estudios dendrochronológicos en la selva central, Peru. Rev. Biol. Trop. 2013, 61, 21–36. [Google Scholar]
- Hoff, J.C. A Practical Guide to BOX-JENKINS Forecasting; Lifetime Learning Publications: Belmont, CA, USA, 1983; pp. 4–93. [Google Scholar]
- Schweingruber, F.H. Trees and Wood in Dendrochronology; Springer: Berlin, Germany, 1993; 402p. [Google Scholar]
- Godwin, H. The value of plant materials for radiocarbon dating. Am. J. Bot. 1969, 56, 723–731. [Google Scholar] [CrossRef]
- Broecker, W.S.; Peng, T.-H. Tracers in the Sea; Eldigio Press: Palisades, NY, USA, 1982; 705p. [Google Scholar]
- Toggweiler, J.R.; Dixon, K.; Bryan, K. Simulations of radiocarbon in a coarse-resolution world ocean model, 2. Distributions of bomb-produced Carbon-14. J. Geophys. Res. 1989, 94, 8243–8264. [Google Scholar] [CrossRef]
- Currie, L. The remarkable metrological history of radiocarbon dating [II]. J. Res. Natl. Inst. Stand. Technol. 2004, 109, 185–217. [Google Scholar] [CrossRef]
- Noy-Meir, I. Desert Ecosystems: Environment and Producers. Annu. Rev. Ecol. Syst. 1973, 4, 25–51. [Google Scholar] [CrossRef]
- Christie, D.A.; Lara, A.; Barichivich, J.; Villalba, R.; Morales, M.S.; Cuq, E. El Niño Southern Oscillation signal in the world’s highest tree-ring chronologies from the Altiplano, Central Andes. Palaeogeogr. Palaeoclimatol. Palaeoecol. 2009, 281, 309–319. [Google Scholar] [CrossRef]
- Ogle, K.; Reynolds, J.F. Plant responses to precipitation in desert ecosystems: Integrating functional types, pulses, thresholds, and delays. Oecologia 2004, 141, 282–294. [Google Scholar] [CrossRef] [PubMed]
- Borchert, R. Soil and Stem Water Storage Determine Phenology and Distribution of Tropical Dry Forest Trees. Ecology 1994, 75, 1437–1449. [Google Scholar] [CrossRef]
- Reynolds, J.F.; Kemp, P.R.; Ogle, K.; Fernandez, R.J. Modifying the ‘Pulse-Reserve’ paradigm for deserts of North America: Precipitation pulses, soil water and plant responses. Oecologia 2004, 141, 194–210. [Google Scholar] [CrossRef]
- Roden, J.S.; Lin, G.; Ehleringer, J.R. Response to the comment of V. J. Terwilliger on “A mechanistic model for interpretation of hydrogen and oxygen isotope ratios in tree-ring cellulose,” by J. S. Roden, G. Lin, and J. R. Ehleringer (2000) Geochim. Cosmochim. Acta 64: 21–35. Geochim. Cosmochim. Acta 2002, 64, 733–734. [Google Scholar] [CrossRef]
- Schwinning, S.; Sala, O.E. Hierarchy of responses to resource pulses in arid and semi-arid ecosystems. Oecologia 2004, 141, 211–220. [Google Scholar] [CrossRef] [PubMed]
- Evans, M.N.; Herho, S.H.S.; Wollney, J.C.; Carter, A.N.; Gbenro, M.A.; Tripp, G.R.; D’Arrigo, R.D.; Cahyarin, S.Y. Three centuries of ENSO variability from Muna, Indonesia teak: Limited response to radiative forcing. Geophy. Res. Lett. 2024, in press.
- Zuidema, P.A.; Poulter, B.; Frank, D.C. A Wood Biology Agenda to Support Global Vegetation Modelling. Trends Plant Sci. 2018, 23, 1006–1015. [Google Scholar] [CrossRef]
- Babst, F.; Friend, A.D.; Karamihalaki, M.; Wei, J.; von Arx, G.; Papale, D.; Peters, R.L. Modeling Ambitions Outpace Observations of Forest Carbon Allocation. Trends Plant Sci. 2021, 26, 210–219. [Google Scholar] [CrossRef]
- Quesada-Román, A.; Ballesteros-Cánovas, J.A.; George, S.S.; Stoffel, M. Tropical and subtropical dendrochronology: Approaches, applications, and prospects. Ecol. Indic. 2022, 144, 109506. [Google Scholar] [CrossRef]

| a. Chronology Time Span: 1963 to 2006 (44 Years), 40 Trees, 112 Radii | |
| Chronology Type | Standard: |
| Mean | 0.9590 |
| Median | 0.9670 |
| Mean sensitivity | 0.1539 |
| Standard deviation | 0.1705 |
| Skewness | 0.7399 |
| Kurtosis | 2.1267 |
| Autocorrelation order 1 | 0.3703 |
| Partial autocorr order 2 | 0.1011 |
| Partial autocorr order 3 | −0.4864 |
| b. Common Interval Time Span: 1977 to 2006 (30 Years, 17 Trees, 28 Radii) | |
| Mean Correlations: | Detrended Series: |
| Among all radii | 0.023 |
| Between trees (Y variance) | −0.007 |
| Within trees | 0.760 |
| Radii vs. mean | 0.176 |
| Signal-to-noise ratio | −0.124 |
| Agreement with population chron | −0.142 |
| Variance in first eigenvector | 23.83% |
| Chron common interval mean | 0.954 |
| Chron common interval std dev | 0.121 |
| r-bar | 0.176 |
| Sample # (Distance Along Core from Bark in cm) | F 14C (from AMS Lab) | Uncertainty in F14C | d 13C (from AMS Lab) | Calibrated Recruitment Year Range at 95.4% Certainty | Expected Recruitment Years | Range of Years in Difference Between Expected and Calibrated Recruitment Year |
|---|---|---|---|---|---|---|
| 1 (19.1) | 1.1238 | 0.0064 | −27.6 | 1956–1961 | 1966–1967 | 5–11 |
| 2 (16.9) | 1.2426 | 0.0095 | −26.1 | 1961–1966 | 1969–1970 | 3–9 |
| 3 (15.3) | 1.5940 | 0.0100 | −25.9 | 1963–1969 | 1972–1973 | 3–10 |
| 4 (9.4) | 1.4080 | 0.0080 | −27.3 | 1980–1986 | 1981–1982 | 1–5 |
| 5 (6.5) | 1.0943 | 0.0063 | −26.0 | 1991–1998 | 1990–1991 | 0–8 |
Disclaimer/Publisher’s Note: The statements, opinions and data contained in all publications are solely those of the individual author(s) and contributor(s) and not of MDPI and/or the editor(s). MDPI and/or the editor(s) disclaim responsibility for any injury to people or property resulting from any ideas, methods, instructions or products referred to in the content. |
© 2025 by the authors. Licensee MDPI, Basel, Switzerland. This article is an open access article distributed under the terms and conditions of the Creative Commons Attribution (CC BY) license (https://creativecommons.org/licenses/by/4.0/).
Share and Cite
Ektvedt, T.M.; Evans, M.N.; Falk, D.A.; Sheppard, P.R. Dendrochronology and Isotope Chronology of Juglans neotropica and Its Response to El Niño-Related Rainfall Events in Tropical Highlands of Piura, Northern Peru. Plants 2025, 14, 1704. https://doi.org/10.3390/plants14111704
Ektvedt TM, Evans MN, Falk DA, Sheppard PR. Dendrochronology and Isotope Chronology of Juglans neotropica and Its Response to El Niño-Related Rainfall Events in Tropical Highlands of Piura, Northern Peru. Plants. 2025; 14(11):1704. https://doi.org/10.3390/plants14111704
Chicago/Turabian StyleEktvedt, Tone Marie, Michael N. Evans, Donald A. Falk, and Paul R. Sheppard. 2025. "Dendrochronology and Isotope Chronology of Juglans neotropica and Its Response to El Niño-Related Rainfall Events in Tropical Highlands of Piura, Northern Peru" Plants 14, no. 11: 1704. https://doi.org/10.3390/plants14111704
APA StyleEktvedt, T. M., Evans, M. N., Falk, D. A., & Sheppard, P. R. (2025). Dendrochronology and Isotope Chronology of Juglans neotropica and Its Response to El Niño-Related Rainfall Events in Tropical Highlands of Piura, Northern Peru. Plants, 14(11), 1704. https://doi.org/10.3390/plants14111704