Article

Potassium-Mediated Variations in the Photosynthetic Induction Characteristics of Phaseolus vulgaris L.

1
Key Laboratory of Plant Genetics and Molecular Breeding, Zhoukou Normal University, Zhoukou 466001, China
2
Henan Plant Gene and Molecular Breeding Engineering Research Center, Zhoukou Normal University, Zhoukou 466001, China
3
College of Life Science and Agriculture, Zhoukou Normal University, Zhoukou 466001, China
*
Authors to whom correspondence should be addressed.
Plants 2025, 14(11), 1623; https://doi.org/10.3390/plants14111623
Submission received: 21 April 2025 / Revised: 19 May 2025 / Accepted: 19 May 2025 / Published: 26 May 2025
(This article belongs to the Special Issue Advances in Plant Photobiology)

Abstract

:
Plants are commonly exposed to fluctuating illumination under natural light conditions, causing dynamic photosynthesis and further affecting plant growth and productivity. In this context, although the vital role of potassium (K) in steady-state photosynthesis has been well-established, knowledge of the dynamic changes in photosynthesis mediated by K remains scarce. Here, the gas-exchange and chlorophyll fluorescence parameters under steady-state and dynamic photosynthetic responses were quantified in Phaseolus vulgaris L. seedlings grown under K-deficient (−K, 0.02 mM K) and normal K (+K, 2 mM K) conditions. After a transition from low to high light, the time course–induction curves of the net photosynthetic rate (A), stomatal conductance (gs), mesophyll conductance (gm), and maximum carboxylation rate (Vcmax) showed an obvious decline in the −K treatment. In comparison with the +K treatment, however, there were no statistical differences in the initial A and Vcmax values in P. vulgaris supplied with deficient K, suggesting that the K-deficiency-induced decreases in A and Vcmax were light-dependent. Interestingly, the time to reach 90% of the maximum A, gs, and gm significantly decreased in the −K treatment in comparison with the +K treatment by 27.2%, 45.6%, and 52.9%, respectively, whereas the time to reach 90% of the maximum Vcmax was correspondingly delayed by almost two-fold. The photosynthetic limitation during the induction revealed that the biochemical limitation was the dominating factor that constrained A under the −K conditions, while, under the +K conditions, the main limiting factor changed from biochemical limitation to stomatal limitation over time. Moreover, gm imposed the smallest limitation on A during induction in both K treatments. These results indicate that a decreased K supply decreases the photosynthetic performance under fluctuating light in P. vulgaris and that improving the induction responses of biochemical components (i.e., Vcmax) has the potential to enhance the growth and productivity of crops grown in K-poor soil.

1. Introduction

Potassium (K), alongside nitrogen and phosphorus, is the most important macronutrient for plant growth. In particular, it participates in many essential physiological processes, e.g., photosynthesis, osmotic regulation, and stomata regulation [1,2]. Consequently, K deficiency is widely recognized as a major limiting factor on photosynthetic carbon assimilation and ultimately impairs plant productivity [3]. In recent years, steady-state photosynthesis under optimal environmental conditions has become a major focus for elucidating how K deficiency limits photosynthetic carbon assimilation, as K-deficiency-induced photosynthesis stress in a leaf is a dynamically aggravated process [4]. Moreover, increasing evidence indicates that the reduction in the net photosynthetic rate (A) under K-limited conditions cannot be ascribed solely to stomatal limitations and is instead due to the integrated contribution of stomatal, mesophyll, and biochemical (carboxylation-related) factors [5,6,7].
Potassium plays an essential role in regulating guard cell turgor [8], and a deficiency or an inadequate supply of K results in a decrease in stomatal conductance (gs), thereby reducing CO2 diffusion into the leaf chloroplast [9]. However, even if gs is partially maintained under these conditions, the photosynthetic capacity remains suboptimal [10,11], suggesting that additional resistances are involved. Mesophyll conductance (gm) from the sub-stomatal cavities to the carboxylation sites inside the chloroplast stroma has emerged as a major constraint of A under K stress. According to Lu et al. [12], K starvation causes disadvantages in leaf structure alterations among different plant species, such as a reduced internal air space, a decreased exposed surface area of chloroplasts in intercellular airspaces, and an increased distance from the chloroplast to the cell wall, which largely impede internal CO2 diffusion and finally reduce gm. In addition, K is essential for the activation of enzymes in the Calvin–Benson cycle, particularly the rubisco enzyme [13]. K-starved plants often exhibit rubisco activity reduction, delayed RuBP regeneration, and disrupted stromal ion homeostasis, which ultimately contribute to declined carboxylation efficiency [14,15]. Overall, elucidating these relative contributions of limiting factors is crucial for optimizing K management strategies to sustain high crop productivity.
However, while a lot of supporting evidence has been found in the literature to explain the effect of K deficiency on the steady-state photosynthesis of plants, such as wheat [16], rice [17], oilseed rape [14], and maize [18], plants in natural or semi-natural ecosystems are rarely exposed to controlled, steady-state conditions. Instead, environmental factors, especially irradiance, change rapidly (over seconds to minutes throughout the day) due to variable solar position, cloud movement, or self-shading under canopies [19]. Plants therefore frequently encounter rapid fluctuations in light intensity, especially in seasons when the weather is changeable. Under these conditions, the capacity of photosynthetic systems to adjust, which is termed “dynamic photosynthesis”, is critical for enhancing daily carbon gain by plants [20]. A previous study showed that faster stomatal opening and the activation of electron transport persevere as the most effective targets for increasing photosynthetic responses by plants under dynamic light conditions [21], which may be largely determined by K ions. However, the role of K in dynamic photosynthesis responses has not yet been fully explored. Therefore, it is essential to understand how K affects the rate and flexibility of photosynthetic responses to changeable environmental conditions.
Similar to steady-state photosynthesis, dynamic photosynthesis is also controlled by gs, gm, and the biochemical capacity (i.e., the maximum carboxylation rate, Vcmax), which are generally downregulated under K-deficient conditions [22,23]. However, the integrated mechanisms that cause the variation in dynamic photosynthesis by K deficiency are complex, and the relative contributions of stomatal, mesophyll, and biochemical limitations during light transitions have not been clearly defined. It is speculated that the increase in the relative ratios of gs, gm, or Vcmax under K deficiency reflect an excess capacity relative to photosynthetic system demands, potentially facilitating faster induction. On the contrary, these unchanged or decreased ratios may imply slower photosynthetic responses. This raises critical questions as to whether K-deficient plants exhibit delayed photosynthetic induction and, more importantly, which components (stomatal, mesophyll, or biochemical factors) exert the predominant limiting factor under such conditions.
To address these questions, we used common bean (Phaseolus vulgaris L.) as an experimental material to investigate the impact of potassium deficiency on both steady-state and dynamic photosynthesis. Specifically, the objectives of this study were to (1) evaluate the effects of K deficiency on steady-state photosynthetic performance; (2) characterize the dynamic variations in A, gs, gm, and Vcmax during photosynthetic induction; and (3) quantify the dominant constraint on photosynthesis during induction using a time-integrated limitation analysis.

2. Results

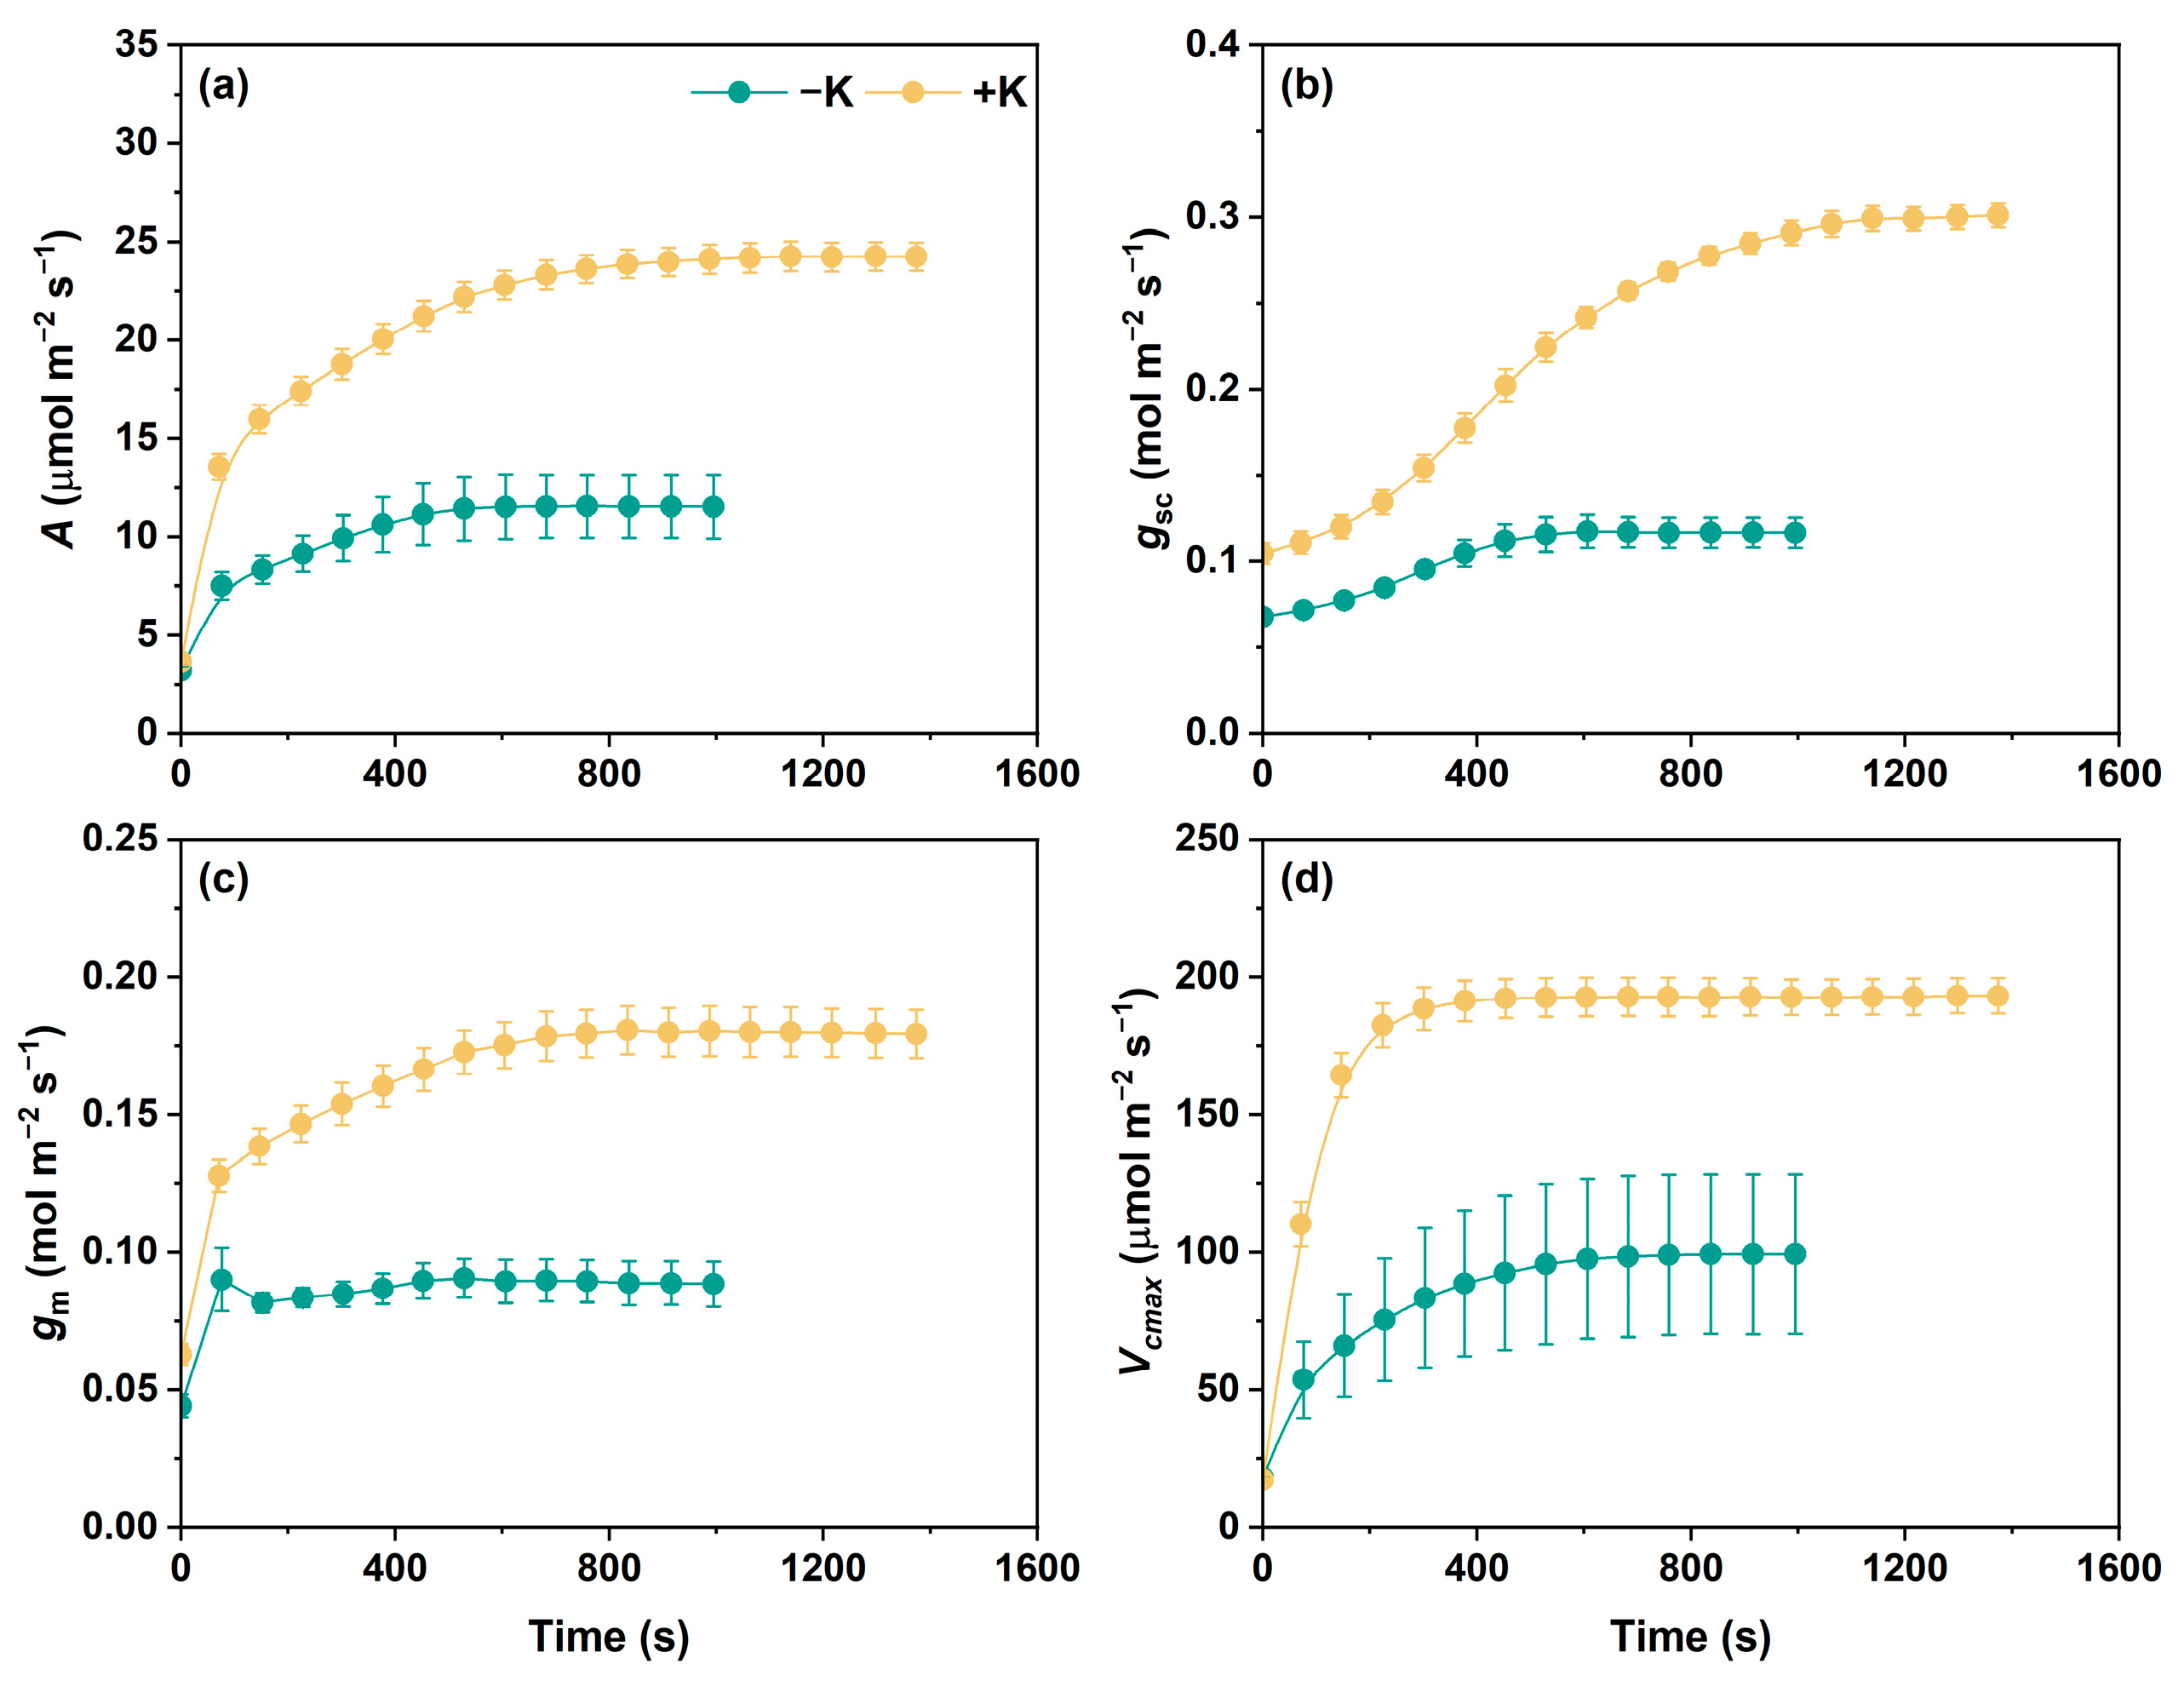
2.1. Photosynthetic Parameter Variations During Photosynthetic Induction

As demonstrated by the curves in Figure 1, the leaf net photosynthetic rate (A), stomatal conductance (gs), mesophyll conductance (gm), and, particularly, the maximum carboxylation rate (Vcmax) rapidly responded when P. vulgaris was exposed to sudden light irradiation. Specifically, the induction curves of A under both potassium-deficient (−K) and normal potassium (+K) conditions showed typical logarithmic increases, and A was markedly higher under +K than under −K throughout the induction period after the low-to-high light transition. Interestingly, P. vulgaris L. under the −K conditions reached steady state faster than that under the +K conditions, within almost 15 min, with this increasing to more than 20 min under the +K conditions. The induction of gsc, gm, and Vcmax showed almost the same responses as A. However, it is worth noting that the improvement in gsc and gm under −K was quite limited. In comparison with the initial gsc, the increase in gsc at the end of the induction period was 42% under −K and 211% under +K. As for photosynthetic system II (PSII), the actual phytochemical efficiency of PSII (ΦPSII) was substantially higher in the +K treatment than in the −K treatment (Figure S1).

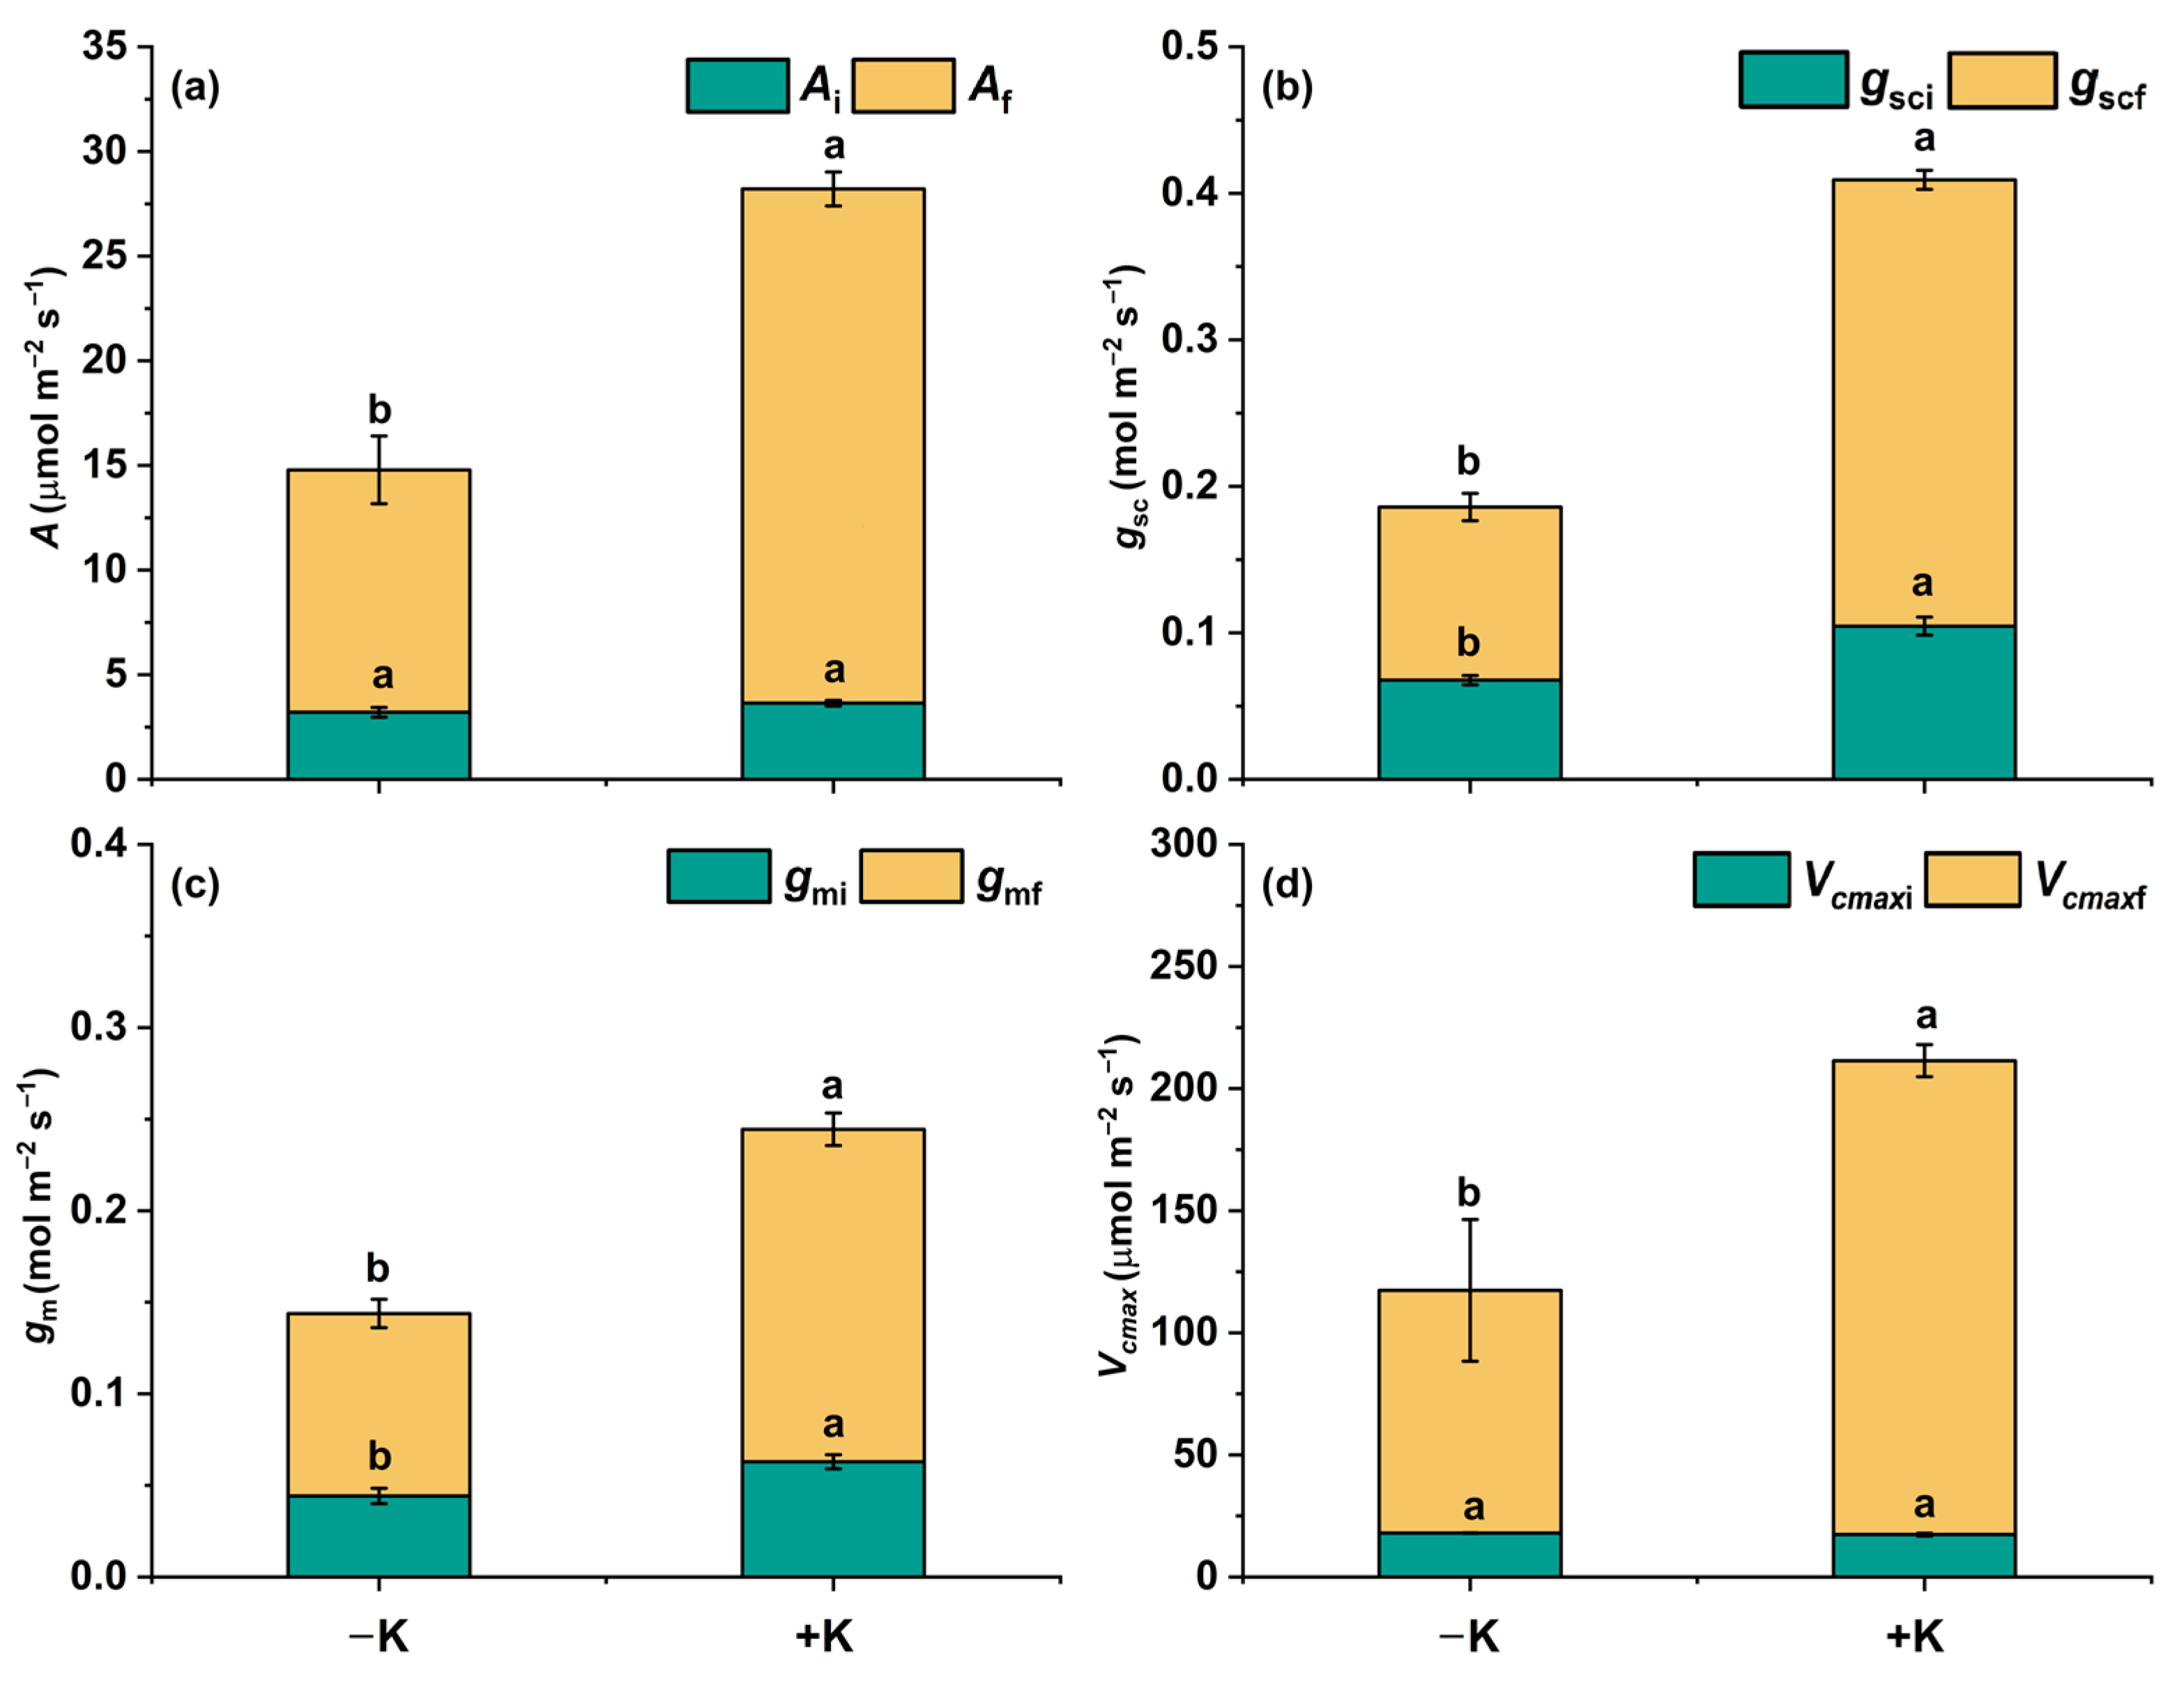
2.2. Steady Changes in Photosynthetic Traits During Photosynthetic Induction

There were no statistical differences between the −K and +K treatments in terms of either Ai or Vcmaxi after low-light induction (100 PPFD); nevertheless, both gsi and gmi were significantly higher under the +K conditions than under the −K conditions, increasing by approx. 54.4% and 42.3% (Figure 2). For P. vulgaris L. exposed to 1000 PPFD light induction, the steady-state photosynthetic parameters Af, gscf, gmf, and Vcmaxf were significantly higher under the +K treatment than under the −K treatment, among which K had the greatest effect on gscf. Compared with the −K treatment, gscf increased by about 158% under the +K treatment (Figure 2).

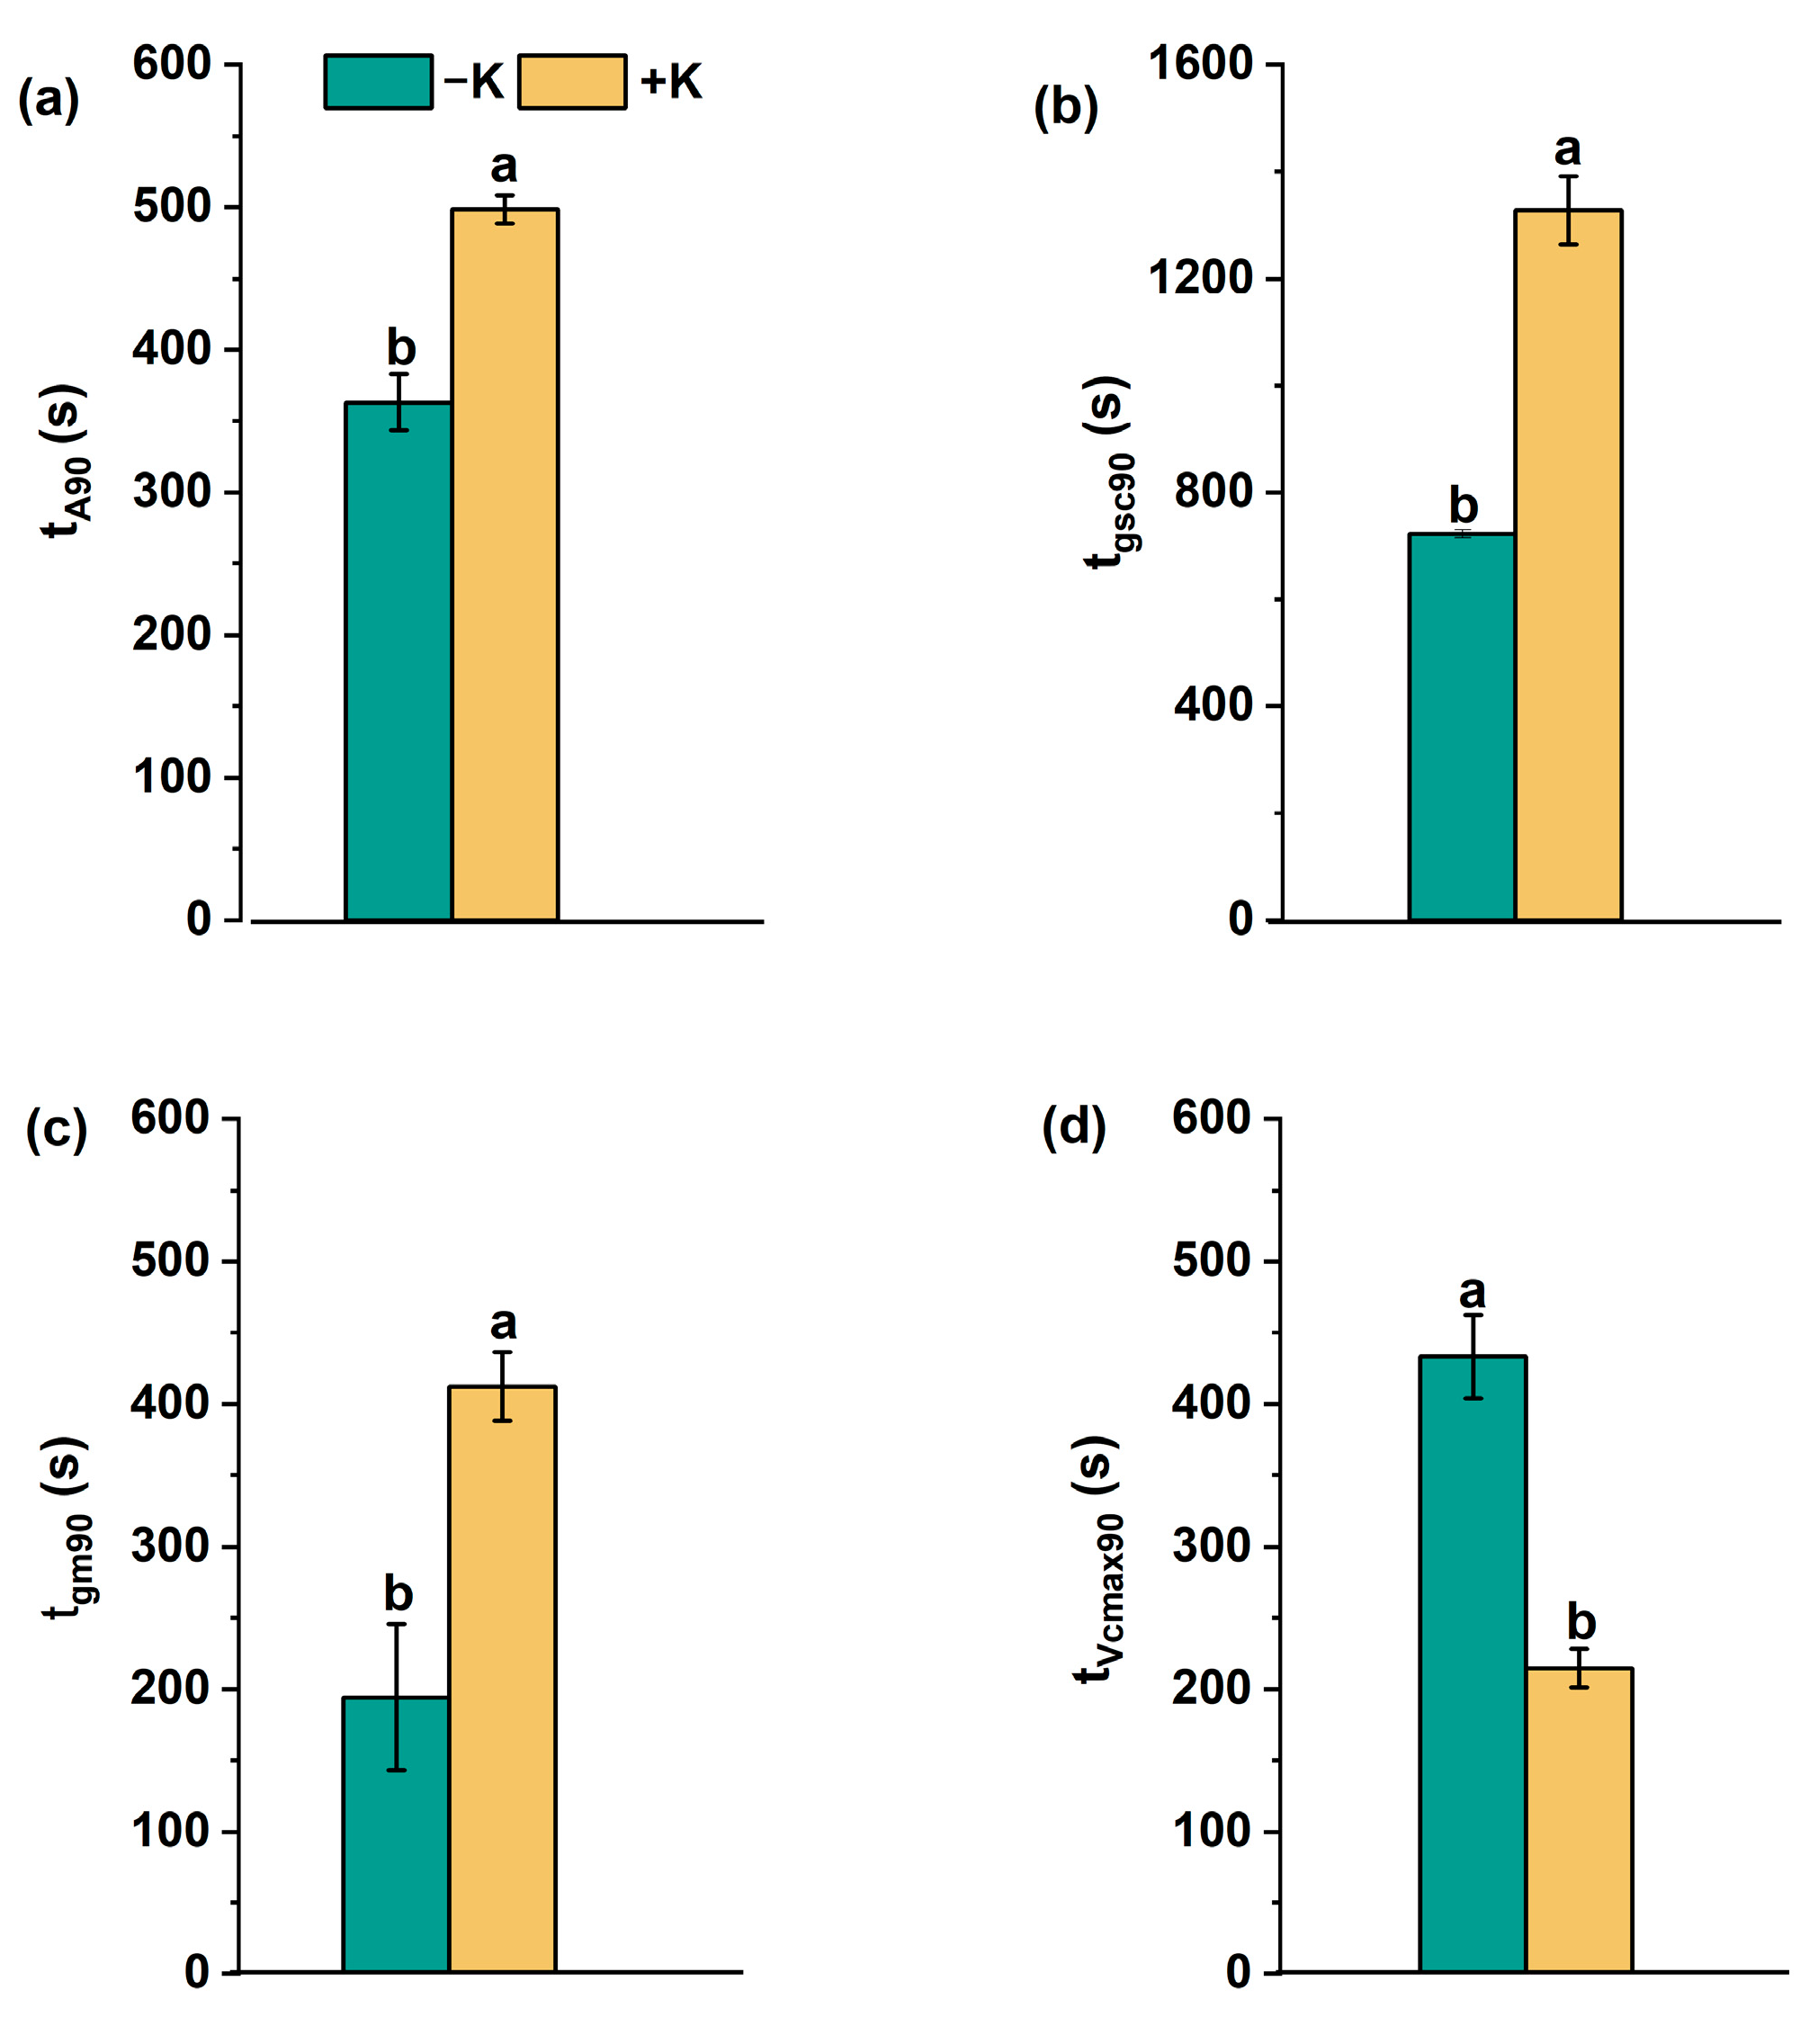
2.3. Dynamic Changes in Photosynthetic Traits During Photosynthetic Induction

In general, during the light induction period (Figure 1), most photosynthetic parameters under the −K treatment were found to approach 90% of full induction more rapidly than under the +K treatment (Figure 3). Specifically, for A, the time to 90% maximum (tA90) was approx. 363 s compared to 498 s, and, for gsc and gm, the time to 90% maximum under +K was 83.7% (tgsc90) and 112.1% (tgm90) longer than that under −K. On the contrary, Vcmax required a significantly longer time to reach the 90% maximum (tvcmax90) under the −K treatment, being almost 2-fold longer than under the +K treatment.

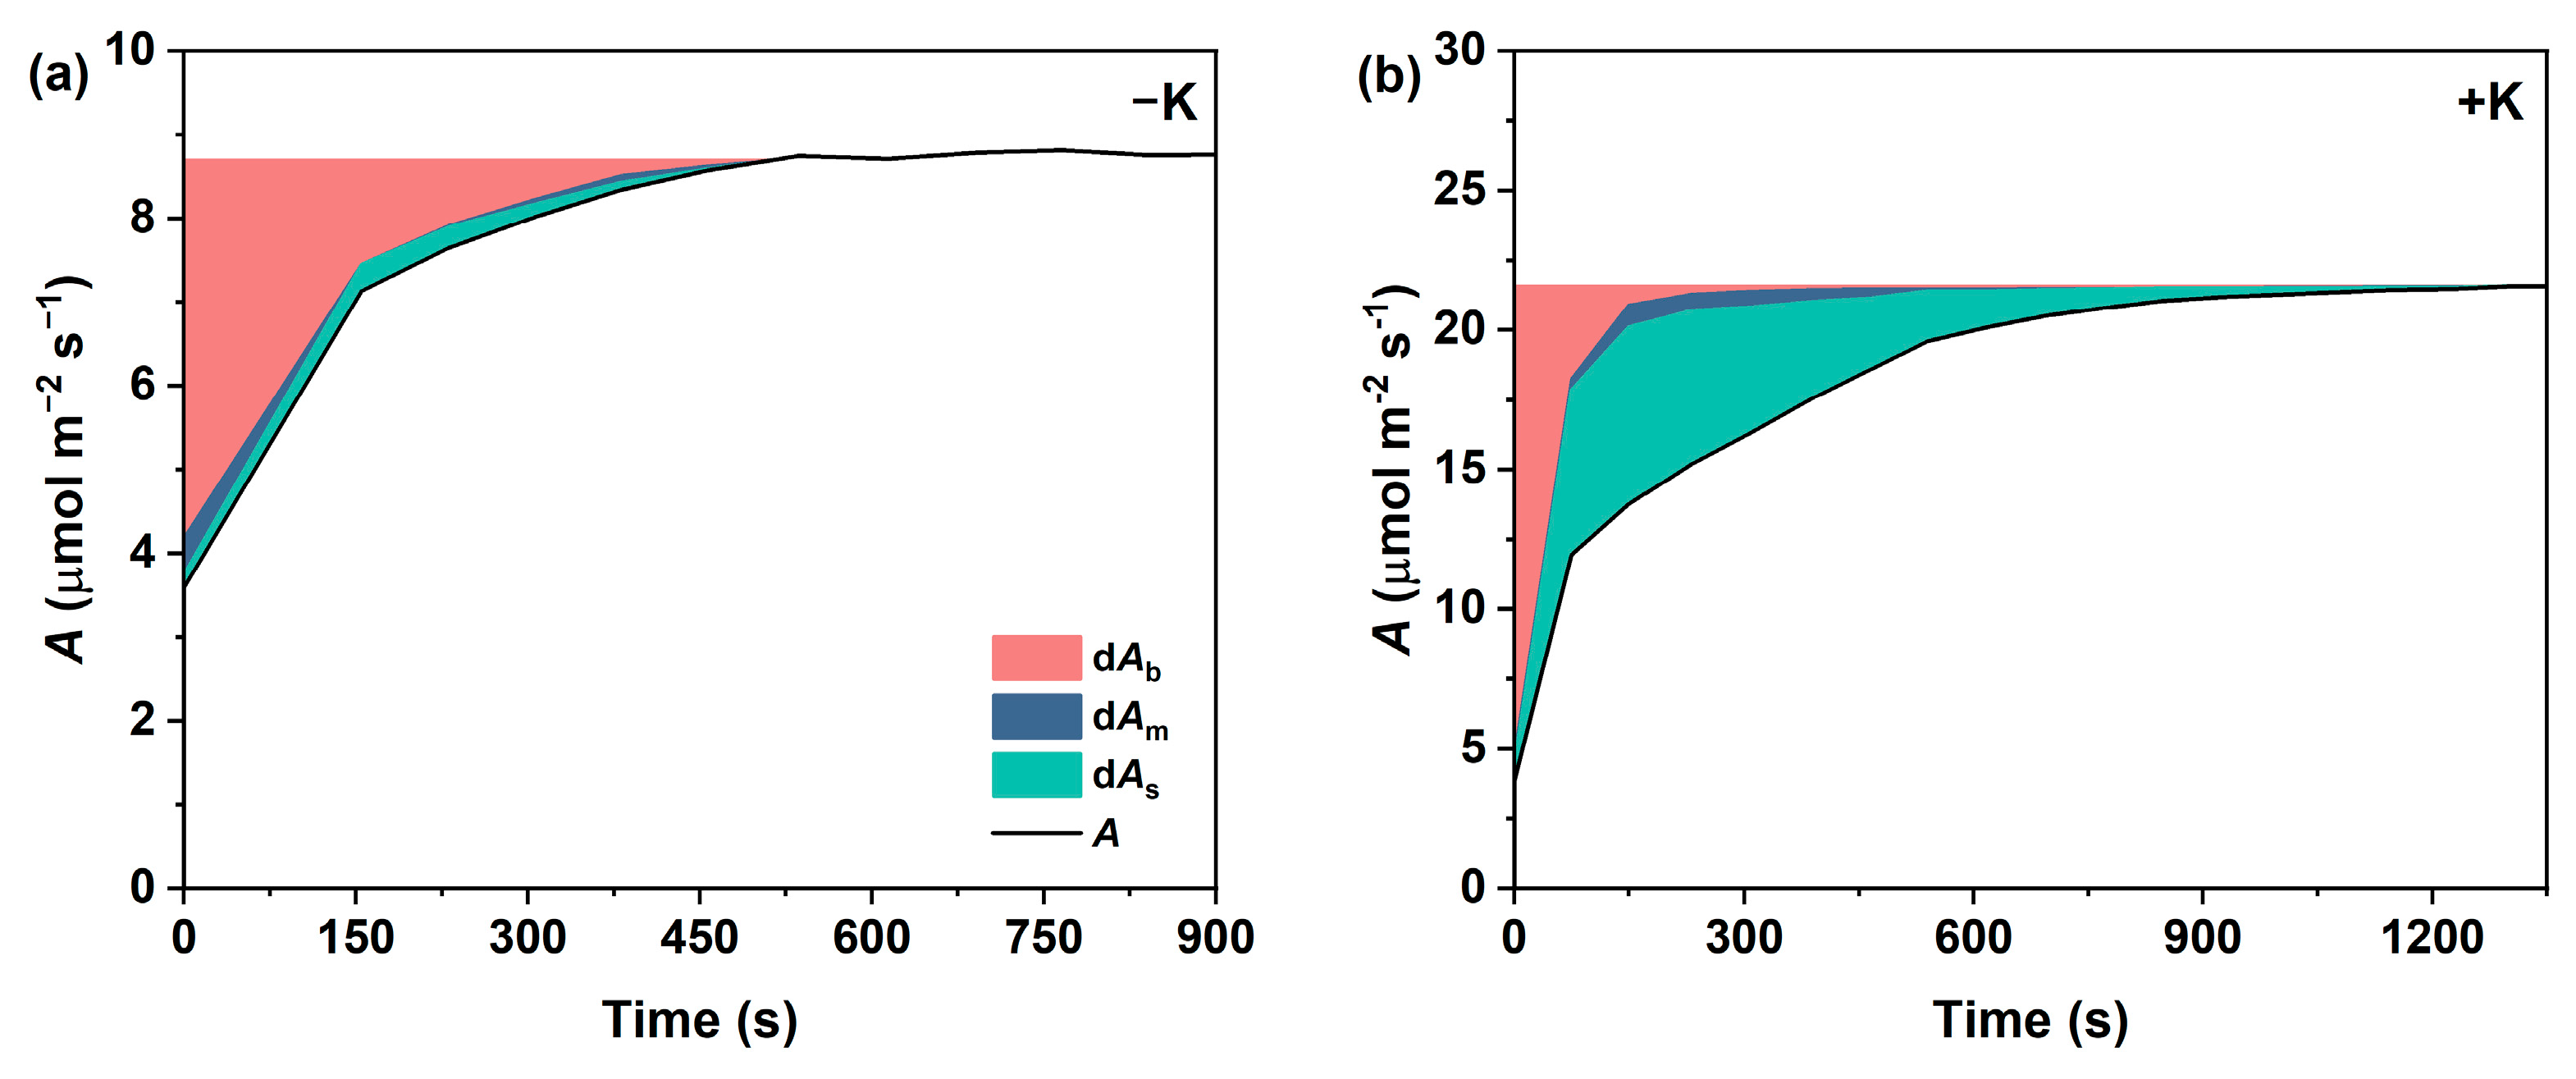
2.4. Temporal Responses of Photosynthetic Limitations During Photosynthetic Induction

To further examine the contributions of gsc, gm, and Vcmax to A during photosynthetic induction, the deviation in A (dA) at a given time point was quantitatively partitioned into components corresponding to stomatal (dAs), mesophyll (dAm), and biochemical (dAb) limitations. As shown in Figure 4, in the first 300 s of induction under the −K treatment, the dAb values accounted for the largest proportion of the total limitation, in comparison with dAs and dAm. However, in P. vulgaris L. treated with +K, the relative biochemical limitation was initially almost 100%, then it decreased rapidly after illumination, and it gradually decreased to 0% after 300 s. On the contrary, during the induction period, dAs increased gradually and became the main limiting factor of dA after 2 min. Moreover, the dAm values were the lowest throughout the entire induction period in both the −K and +K treatments, despite subtle differences being observed between the treatments; i.e., in the −K treatment, mesophyll limitation occurred in the initial stages of the induction, while, in the +K treatment, it occurred in the mid-to-late stages.
When integrating the relative limitations of photosynthesis over the entire induction period, it was observed that the K supply significantly affected the main photosynthetic limiting factor of P. vulgaris L., despite there being no statistical differences in σm between the −K and +K treatments (Figure 5). Under the −K conditions, the biochemical limitation (σb) was the strongest limiting factor of photosynthesis, accounting for 67.2% of the total photosynthetic limitation. Meanwhile, under the +K conditions, the stomatal limitation (σs) was found to account for 49.4% of the total limitation, followed by the biochemical limitation (40.2%) and mesophyll limitation (10.5%).

3. Discussion

Previous studies have demonstrated the general presence of weakened photosynthetic carbon assimilation under K-deficient or inadequate conditions [12,24,25]. In the present study, the steady-state A (Af as an indicator) of P. vulgaris L. in the −K treatment declined by 52.9% in comparison with A in normal K supply. In addition to the steady-state A under high light, the photosynthetic responses to changes in illumination significantly affect the carbon gain of plants [26,27]; the average A value under the −K conditions during the photosynthetic induction process was 10 μmol m−2 s−1, statistically lower than that under the +K conditions (average of 20.8 μmol m−2 s−1), with an average decline of 51.0%. It is worth noting that the time required for A to reach a steady state in −K was significantly shorter than that in +K, despite there being a decrease in the A value under the −K conditions. Similar trends were observed in the response curves for gsc, gm, and Vcmax during the induction.
According to Kaiser [20], the time to reach 90% A of the full induction (tA90) is defined as the photosynthetic response rate, which is mainly influenced by nutrition, plant species, and stress factors. For instance, tomatoes supplied with high nitrogen levels showed a much faster photosynthetic induction response than those supplied with moderate or low nitrogen levels [28]; however, in Panax notoginseng, a higher nitrogen content in leaves caused a slower photosynthetic induction rate [29]. Zhang et al. [30] found that tomato exposed to salt stress demonstrated a significantly reduced response rate, resulting in an increased tA90. These findings indicate that plants under nutrient or other stress conditions have a prolonged photosynthetic induction time, which results in an increased tA90. However, in our current results, the tA90 values decreased by approx. 27.2% in the K-deficient treatment compared to in the normal K treatment.
It is generally accepted that the actual tA90 is a comprehensive result influenced by tgs90, tgm90, and tVcmax90. As shown in Figure 3, the tgs90 and tgm90 of plants supplied with deficient K were significantly shorter than those of plants supplied with normal K nutrition. However, not all plant responses occurred within the same timescale; A and gm responded and reached 90% of steady state within 5–8 min, whereas changes in gs took more than 10 min (Figure 3), in accordance with previous studies [31,32,33]. Therefore, it was supposed that the lower tgsc90 under the −K conditions may be mainly responsible for the rapid tA90. As gsci was not higher in the −K treatment than in the +K treatment as expected, it is logical to believe that the K deficiency induced stomatal closure, thereby decreasing tgsc90 during the irradiation. Stomatal movement occurs with channel-mediated K+ uptake over time [32] due to the vital role of potassium in the osmotic mechanism of stomata aperture modulation. During the photosynthetic induction, the light-dependent influx and efflux of potassium of guard cells could have been affected by the K deficiency and, thus, regulated stomatal closure [34,35]. Similar results were obtained in studies on tea [36], Eucalyptus grandis [37], rice [38], and olive [39]. Further studies are needed to analyze the dynamic responses of stomatal movement mediated by K supplement during photosynthetic induction. Moreover, K is essential for increasing enzyme activity in higher plants [40,41]. According to a study on Brassica napus, a decrease in K decreased the rubisco content and activity by 37% and 58.4%, respectively, causing a decreased carboxylation rate [42]. In the present study, although there were no statistical differences regarding the initial Vcmax between treatments, the final state of Vcmax was significantly reduced in the −K treatment compared to in the +K treatment and was accompanied by a longer tVcmax90 (Figure 2 and Figure 3).
A sufficient understanding of photosynthetic limiting factors during light fluctuation is of relevance to solving the substantial decline in daily carbon accumulation in plants [21,43]. A recent study by Liu et al. [22] demonstrated the important role of gm in limiting A during photosynthetic induction. However, another study on Arabidopsis and tobacco found opposite results, showing a transition from a stomatal-dominating limitation to a biochemical limitation during induction [28]. In the present study, in P. vulgaris L. plants supplied with deficient K, photosynthetic limitations due to gs, gm, and biochemical factors changed slightly upon the transition from low to high light, in which condition A was mainly constrained by biochemical factors, while, under the normal K conditions, the predominating photosynthetic limiting factors gradually changed from biochemical limitation to stomatal limitation during the induction process. Meanwhile, gm consistently imposed the smallest limitation on A between the K treatments. As it turns out, the limiting factors of photosynthetic induction changed frequently, induced by external environmental conditions, plant species, or genotypes [22,44,45].
As evident in Figure 5, under both the −K and +K conditions, gm was identified as being the least limiting of the three photosynthetic components on a time-integrated scale, while the biochemical capacity (i.e., Vcmax) was the most significant limiting factor of photosynthetic induction for the plants supplied with deficient K. In contrast to our findings, Lu et al. [12] found that the gm limitation contributed to more than one-half of the A decline under K-deficient conditions. In this regard, this may reflect the adaptive strategies of plants to −K stress at different time scales, as several processes underlying photosynthesis activate or deactivate cooperatively [46]. However, although a reduced gsc was observed in the K-deficient conditions, it takes a certain amount of time for stomatal opening to occur in photosynthetic induction, whereas the activation of the rubisco enzyme usually occurs faster (several seconds to minutes) [47,48]. However, as K+ plays a critical role in the biosynthesis and activation of rubisco, the deficient K supply resulted in an increased tVcmax90 and, finally, constrained A, especially during the short period of photosynthetic induction.

4. Materials and Methods

4.1. Plant Material

A hydroponic culture experiment was conducted in a plant culture room with an illuminated light source maintained at approx. 800 μmol m−2 s−1 photosynthetic photon flux density (PPFD). The photoperiod was set to 16 h at 25 °C per day and 18 °C per night, and the relative humidity was 50–60%. P. vulgaris seeds were germinated in moist filter papers at 4 °C for 12 h, which were then fixed to a transit box for germination. After 7 d, uniform seedlings were transferred to 10 L plastic containers and supplied with one-quarter-strength nutrient solution (for the composition, see below). Five days later, the seedlings were supplied with one-half-strength nutrient solution. After another 5 d, the seedlings were supplied with full-strength nutrition with K-deficient (−K, 0.02 mM K2SO4) or normal K treatment (+K, 2 mM K2SO4). The composition of the full-strength nutrition solution was as follows: 5 mM N with mixed (NH4)2SO4 and Ca(NO3)2, 1mM NaH2PO4·2H2O, 2 mM K2SO4, 2.5 mM CaCl2, 1 mM MgSO4, 0.05 mM Fe-EDTA, 10 μM H3BO3, 10 μM MnCl2·4H2O, 0.3 μM CuSO4·5H2O, 0.8 μM ZnSO4·7H2O, and 0.01 μM Na2MoO4·2H2O. The pH of the nutrient solution was adjusted to 7.0 ± 0.1 every day and was completely changed every 3 d.

4.2. Measurement of Gas Exchange and Fluorescence

Two weeks after the treatments started, fully expanded leaves of each plant were selected for the measurement of gas-exchange parameters from 9:00 to 11:30, using a portable gas-exchange system (Li-6400XT, Li-Cor, Lincoln, NE, USA). The PPFD was set to 1000 μmol m−2 s−1 (red light–blue light, 90%:10%), the vapor pressure deficit (VPD) was between 1.4 and 1.6 Kpa, the air flow rate was 500 μmol s−1, the leaf temperature was 25 ± 0.3 °C, and the CO2 concentration was maintained at 400 ± 10 μmol mol−1. Once steady state was achieved, the steady-state fluorescence yield (Fs) and maximum fluorescence (Fm′) were recorded with a light-saturating pulse (0.8 s) of 8000 μmol m−2 s−1; in the meantime, the net photosynthetic rate (A), CO2 concentration in intercellular spaces (Ci), and leaf stomatal conductance (gs) were recorded. As gs is the stomatal conductance to water vapor, it is expressed in terms of stomatal conductance to CO2 (gsc) in subsequent calculations, which was calculated as gsc = gs/1.6.

4.3. Estimation of Mesophyll Conductance (gm)

The actual phytochemical efficiency of PSII (ΦPSII) was then calculated as follows:
ΦPSII = (Fm′ − Fs)/Fm
The liner electron transfer rate (J) was given as
J = ΦPSII × PPFD × α × β
where α is the leaf absorption and β is the proportion of quanta absorbed by PSII, assumed to be 0.85 and 0.5, respectively. Taken together, the variable J method was used to calculate gm [49], given as follows:
g m = A C i Γ * ( J + 8 ( A + R d ) ) J 4 ( A + R d )
C c = C i A g m
where Γ* is the CO2 compensation point in the absence of mitochondrial respiration and Rd is the mitochondrial respiration rate in the light. Γ* was assumed to be 40.0 μmol m−2 s−1, and Rd was assumed to be 1.0 μmol m−2 s−1. Using the above equation, gm could be calculated at each time point.

4.4. Calculations of the Maximum Carboxylation Rate of Rubisco (Vcmax)

According to Mott et al. [50], plants can maintain saturated RuBP under both low- and high-light irradiance conditions; therefore, rubisco activation was modulated to limit A for the transition from low to high irradiation. It was then assumed that the Rubisco limitation would adequately constrain A throughout photosynthetic induction. Vcmax was determined as follows:
V cmax = ( A + R d ) ( C i + K m ) ( C i Γ * )
where Rd is the rate of respiration in the light, and Km is the effective CO2 Michaelis–Menten constant for rubisco. Here, Km was set to 509.5 at 25 °C. Using the above equation, Vcmax could be calculated at each time point.

4.5. Determination of Photosynthetic Induction Parameters

For induction, leaves were initially acclimated to a steady state under low light (100 μmol m−2 s−1 PPFD) for 30 min, followed by exposure to high light (1000 μmol m−2 s−1 PPFD) until the photosynthetic parameters approached a steady state. Gas-exchange measurements were recorded every second for the first minute and every five seconds thereafter. Plants were randomly selected and measured from 9:00 to 11:30. Measurements were repeated 4 times on individual replicates for each treatment over a span of 2 days to reduce the time effects. For each treatment, 5 biological replicates were used, and all calculations were performed on single replicates.
Photosynthetic induction was calculated according to the following equations, where the subscripts “i” and “f” refer to the steady-state assimilation rate (A) values in the last minute of low light and high light, respectively:
IS = A A i A f A i
The induction of gsc, gm, and Vcmax over the same duration was also calculated by replacing A with gsc, gm, and Vcmax, respectively.
Moreover, tA90, tgsc90, tgm90, and tVcmax90 were defined as the time required to obtain 90% of the difference between the initial and maximum values of photosynthetic induction, stomatal opening, mesophyll conductance, and the maximum values of Vcmax, respectively.

4.6. Limitation Analysis

The relative changes in light-saturated assimilation can be expressed in terms of the relative changes in stomatal, mesophyll conductance, and biochemical capacity, Hence, the A variation can be modeled using
d A A = d A s + d A m + d A b
where dAstom, dAmes, and dAbiochem are the stomatal, mesophyll conductance, and biochemical limitations on A, which can be determined using
d A s = A g sc d g sc
d A m = A g m d g m
d A b = A V cmax d V cmax
where dgsc, dgm, and dVcmax are the variations between the final state and steady-state gsc, gm, and Vcmax, respectively.
Given that A = gsc (CaCi), solving the partial derivatives combined with Equation (1) gives
A g sc = A g sc 2 ( V cmax R d A ) ( V cmax R d ) ( 1 g sc ) + ( C a + K m ) 2 ( 1 g sc ) A
A g m = A g m 2 ( V cmax R d A ) ( V cmax R d ) ( 1 g sc ) + ( C a + K m ) 2 ( 1 g sc ) A
A V cmax = C a Γ * A ( 1 g sc ) ( V cmax R d ) ( 1 g sc ) + ( C a + K m ) 2 ( 1 g sc ) A

4.7. Statistical Analysis

All statistical analyses were carried out using SPSS 25.1. A one-way ANOVA was performed to evaluate the significant differences in the parameters between groups. Graphical depiction was conducted with Origin Pro 2020. Data are presented as mean ± standard error (SE).

5. Conclusions

In the current study, we examined the effects of K supplementation on photosynthetic induction after transfer from low to high light in P. vulgaris L., and the induction curves of A, gsc, gm, and Vcmax showed significant differences during the induction process. Regarding the time course of photosynthesis induction, tA90, tgm90, and tgsc90 were shorter under the −K conditions than under the +K conditions, while the induction time of Vcmax was significantly delayed, which further caused a lag in changes in tA90 under the K-deficient conditions. During the transition from low to high light, increasing the induction responses of Vcmax may have the potential to improve A in P. vulgaris plants, especially when they are grown under low-K conditions, whereas the photosynthetic induction of A was rarely limited by gm under both the −K and +K treatments. Taken together, the present study demonstrates the important role of biochemical capacities in limiting A during photosynthetic induction. Therefore, improving biochemical-related parameters, such as rubisco enzyme activity, is likely an effective strategy for improving dynamic photosynthetic performance in P. vulgaris under K-deficient conditions.

Supplementary Materials

The following supporting information can be downloaded at: https://www.mdpi.com/article/10.3390/plants14111623/s1, Figure S1: Actual phytochemical efficiency of PSII photosystem (ΦPSII) of Phaseolus vulgaris L. during photosynthetic induction at 1000 μmol m−2 s−1 photosynthetic photon flux density (PPFD) as affected by K nutrition.

Author Contributions

Conceptualization, Q.L. and L.L.; investigation, W.J.; data curation, W.J. and K.X.; writing—original draft preparation, Q.L. and K.X.; writing—review and editing, Y.W. and L.L.; project administration, Y.W.; funding acquisition, K.X. and Y.W. All authors have read and agreed to the published version of the manuscript.

Funding

This research was funded by the Projects of the Joint Fund of Henan Province’s Science and Technology Research and Development Program (225101610054) and the Department of Science and Technology Planning Project of Henan Province (222102110057 and 242102110299).

Data Availability Statement

Data are contained within the article.

Conflicts of Interest

The authors declare no conflicts of interest.

Abbreviations

Anet photosynthetic rate
gscstomatal conductance to CO2
gmmesophyll conductance to CO2
Vcmaxmaximum carboxylation rate
ΦPSIIactual phytochemical efficiency of PSII
Aisteady-state A during the last 1 min of low-light induction period
gsisteady-state gsc during the last 1 min of low-light induction period
gmisteady-state gm during the last 1 min of low-light induction period
Vcmaxisteady-state Vcmax during the last 1 min of low-light induction period
Afsteady-state A during the last 1 min of high-light induction period
gsfsteady-state gsc during the last 1 min of high-light induction period
gmfsteady-state gm during the last 1 min of high-light induction period
Vcmaxfsteady-state Vcmax during the last 1 min of high-light induction period
tA90time for A to reach 90% of photosynthetic induction
tgs90time for gsc to reach 90% of photosynthetic induction
tgm90time for gm to reach 90% of photosynthetic induction
tVcmax90time for Vcmax to reach 90% of photosynthetic induction
dAbtransient biochemical limitation during photosynthetic induction
dAmtransient mesophyll conductance limitation during photosynthetic induction
dAstransient stomatal conductance limitation during photosynthetic induction
σbtime-integrated biochemical limitation during photosynthetic induction
σmtime-integrated mesophyll conductance limitation during photosynthetic induction
σstime-integrated transient stomatal conductance limitation during photosynthetic induction

References

  1. Rawat, J.; Pandey, N.; Saxena, J. Role of potassium in plant photosynthesis, transport, growth and yield. In Role of Potassium in Abiotic Stress; Springer: Berlin/Heidelberg, Germany, 2022; pp. 1–14. [Google Scholar]
  2. Tränkner, M.; Tavakol, E.; Jákli, B. Functioning of potassium and magnesium in photosynthesis, photosynthate translocation and photoprotection. Physiol. Plant. 2018, 163, 414–431. [Google Scholar] [CrossRef] [PubMed]
  3. Pettigrew, W.T. Potassium influences on yield and quality production for maize, wheat, soybean and cotton. Physiol. Plant. 2008, 133, 670–681. [Google Scholar] [CrossRef]
  4. Hu, W.; Lu, Z.; Gu, H.; Ye, X.; Li, X.; Cong, R.; Ren, T.; Lu, J. Potassium availability influences the mesophyll structure to coordinate the conductance of CO2 and H2O during leaf expansion. Plant. Cell Environ. 2022, 45, 2987–3000. [Google Scholar] [CrossRef] [PubMed]
  5. Lu, Z.; Ren, T.; Pan, Y.; Li, X.; Cong, R.; Lu, J. Differences on photosynthetic limitations between leaf margins and leaf centers under potassium deficiency for Brassica napus L. Sci. Rep. 2016, 6, 21725. [Google Scholar] [CrossRef] [PubMed]
  6. Jin, S.H.; Huang, J.Q.; Li, X.Q.; Zheng, B.S.; Wu, J.S.; Wang, Z.J.; Liu, G.H.; Chen, M. Effects of potassium supply on limitations of photosynthesis by mesophyll diffusion conductance in Carya cathayensis. Tree Physiol. 2011, 31, 1142–1151. [Google Scholar] [CrossRef] [PubMed]
  7. Jákli, B.; Tavakol, E.; Tränkner, M.; Senbayram, M.; Dittert, K. Quantitative limitations to photosynthesis in K deficient sunflower and their implications on water-use efficiency. J. Plant Physiol. 2017, 209, 20–30. [Google Scholar] [CrossRef]
  8. Sawhney, B.; Zelitch, I. Direct determination of potassium ion accumulation in guard cells in relation to stomatal opening in light. Plant Physiol. 1969, 44, 1350. [Google Scholar] [CrossRef]
  9. Lu, Z.; Xie, K.; Pan, Y.; Ren, T.; Lu, J.; Wang, M.; Shen, Q.; Guo, S. Potassium mediates coordination of leaf photosynthesis and hydraulic conductance by modifications of leaf anatomy. Plant Cell Environ. 2019, 42, 2231–2244. [Google Scholar] [CrossRef]
  10. Pan, Y.; Cao, Y.; Chai, Y.; Meng, X.; Wang, M.; Wang, G.; Guo, S. Identification of photosynthetic parameters for superior yield of two super hybrid rice varieties: A cross-scale study from leaf to canopy. Front. Plant Sci. 2023, 14, 1110257. [Google Scholar] [CrossRef]
  11. Xiong, D.; Huang, J.; Peng, S.; Li, Y. A few enlarged chloroplasts are less efficient in photosynthesis than a large population of small chloroplasts in Arabidopsis thaliana. Sci. Rep. 2017, 7, 5782. [Google Scholar] [CrossRef]
  12. Lu, Z.; Lu, J.; Pan, Y.; Lu, P.; Li, X.; Cong, R.; Ren, T. Anatomical variation of mesophyll conductance under potassium deficiency has a vital role in determining leaf photosynthesis. Plant Cell Environ. 2016, 39, 2428–2439. [Google Scholar] [CrossRef] [PubMed]
  13. Yan, J.; Ye, X.; Song, Y.; Ren, T.; Wang, C.; Li, X.; Lu, J. Sufficient potassium improves inorganic phosphate-limited photosynthesis in Brassica napus by enhancing metabolic phosphorus fractions and Rubisco activity. Plant J. 2023, 113, 416–429. [Google Scholar] [CrossRef] [PubMed]
  14. Lu, Z.; Pan, Y.; Hu, W.; Cong, R.; Ren, T.; Guo, S.; Lu, J. The photosynthetic and structural differences between leaves and siliques of Brassica napus exposed to potassium deficiency. BMC Plant Biol. 2017, 17, 240. [Google Scholar] [CrossRef]
  15. Zhang, W.; He, X.; Chen, X.; Han, H.; Shen, B.; Diao, M.; Liu, H. Exogenous selenium promotes the growth of salt-stressed tomato seedlings by regulating ionic homeostasis, activation energy allocation and CO2 assimilation. Front. Plant Sci. 2023, 14, 1206246. [Google Scholar] [CrossRef]
  16. Wang, Y.; Zhang, Z.; Liang, Y.; Han, Y.; Han, Y.; Tan, J. High potassium application rate increased grain yield of shading-stressed winter wheat by improving photosynthesis and photosynthate translocation. Front. Plant Sci. 2020, 11, 134. [Google Scholar] [CrossRef] [PubMed]
  17. Hou, W.; Tränkner, M.; Lu, J.; Yan, J.; Huang, S.; Ren, T.; Cong, R.; Li, X. Interactive effects of nitrogen and potassium on photosynthesis and photosynthetic nitrogen allocation of rice leaves. BMC Plant Biol. 2019, 19, 302. [Google Scholar] [CrossRef]
  18. Qi, D.; Zhao, X.; Le, X.; Jiang, C.; Wang, X.; Yi, H.; Yu, H. Effects of potassium deficiency on photosynthesis, chloroplast ultrastructure, ROS, and antioxidant activities in maize (Zea mays L.). J. Integr. Agr. 2019, 18, 395–406. [Google Scholar]
  19. Qi, D.U.; Zhao, X.H.; Le, X.I.A.; Jiang, C.J.; Wang, X.G.; Yi, H.A.N.; Jing, W.A.N.G.; Yu, H.Q. A canopy conundrum: Can wind-induced movement help to increase crop productivity by relieving photosynthetic limitations? J. Exp. Bot. 2019, 70, 2371–2380. [Google Scholar]
  20. Kaiser, E.; Morales, A.; Harbinson, J.; Kromdijk, J.; Heuvelink, E.; Marcelis, L. Dynamic photosynthesis in different environmental conditions. J. Exp. Bot. 2015, 66, 2415–2426. [Google Scholar] [CrossRef]
  21. Sakoda, K.; Yamori, W.; Groszmann, M.; Evans, J. Stomatal, mesophyll conductance, and biochemical limitations to photosynthesis during induction. Plant Physiol. 2021, 185, 146–160. [Google Scholar] [CrossRef]
  22. Liu, T.; Barbour, M.; Yu, D.; Rao, S.; Song, X. Mesophyll conductance exerts a significant limitation on photosynthesis during light induction. N. Phytol. 2021, 233, 360–372. [Google Scholar] [CrossRef] [PubMed]
  23. Wang, X.; Zeng, Z.; Shi, Z.; Wang, J.; Huang, W. Variation in photosynthetic efficiency under fluctuating light between rose cultivars and its potential for improving dynamic photosynthesis. Plants 2023, 12, 1186. [Google Scholar] [CrossRef]
  24. Wang, X.G.; Zhao, X.H.; Jiang, C.J.; Li, C.H.; Cong, S.; Wu, D.; Chen, Y.Q.; Yu, H.Q.; Wang, C.Y. Effects of potassium deficiency on photosynthesis and photoprotection mechanisms in soybean (Glycine max (L.) Merr.). J. Integr. Agric. 2015, 14, 856–863. [Google Scholar] [CrossRef]
  25. Zhao, D.; Oosterhuis, D.; Bednarz, C. Influence of potassium deficiency on photosynthesis, chlorophyll content, and chloroplast ultrastructure of cotton plants. Photosynthetica 2001, 39, 103–109. [Google Scholar] [CrossRef]
  26. Sakoda, K.; Taniyoshi, K.; Yamori, W.; Tanaka, Y. Drought stress reduces crop carbon gain due to delayed photosynthetic induction under fluctuating light conditions. Physiol. Plant. 2022, 174, e13603. [Google Scholar] [CrossRef] [PubMed]
  27. Zotz, G.; Mikona, C. Photosynthetic Induction and leaf carbon gain in the Tropical understorey Epiphyte, Aspasia principissa. Ann. Bot. 2003, 91, 353–359. [Google Scholar] [CrossRef]
  28. Sun, H.; Zhang, Y.; Zhang, S.; Huang, W. Photosynthetic induction under fluctuating light is affected by leaf nitrogen content in tomato. Front. Plant Sci. 2022, 13, 835571. [Google Scholar] [CrossRef]
  29. Chen, J.W.; Kuang, S.; Long, G.; Meng, Z.; Li, L.; Chen, Z.; Zhang, G.; Yang, S. Steady-state and dynamic photosynthetic performance and nitrogen partitioning in the shade-demanding plant Panax notoginseng under different levels of growth irradiance. Acta Physiol. Plant. 2014, 36, 2409–2420. [Google Scholar] [CrossRef]
  30. Zhang, Y.; Kaiser, E.; Marcelis, L.; Yang, Q.; Li, T. Salt stress and fluctuating light have separate effects on photosynthetic acclimation, but interactively affect biomass. Plant Cell Environ. 2020, 43, 2192–2206. [Google Scholar] [CrossRef]
  31. Lawson, T.; Vialet-Chabrand, S. Speedy stomata, photosynthesis and plant water use efficiency. N. Phytol. 2019, 221, 93–98. [Google Scholar] [CrossRef]
  32. Lawson, T.; Blatt, M. Stomatal size, speed, and responsiveness impact on photosynthesis and water use efficiency. Plant Physiol. 2014, 164, 1556–1570. [Google Scholar] [CrossRef] [PubMed]
  33. Liu, Q.; Jin, W.; Huang, L.; Wang, D.; Xu, K.; Wei, Y. Photosynthetic Induction Characteristics in Saplings of Four Sun-Demanding Trees and Shrubs. Plants 2025, 14, 144. [Google Scholar] [CrossRef]
  34. Imtiaz, H.; Mir, A.; Corpas, F.; Hayat, S. Impact of potassium starvation on the uptake, transportation, photosynthesis, and abiotic stress tolerance. Plant Growth Regul. 2023, 99, 429–448. [Google Scholar] [CrossRef]
  35. Humble, G.; Hsiao, T. Light-dependent influx and efflux of potassium of guard cells during stomatal opening and closing. Plant Physiol. 1970, 46, 483–487. [Google Scholar] [CrossRef] [PubMed]
  36. Nagarajah, S. The effect of potassium deficiency on stomatal and cuticular resistance in tea (Camellia sinensis). Physiol. Plant. 1979, 47, 91–94. [Google Scholar] [CrossRef]
  37. Christina, M.; Le Maire, G.; Battie-Laclau, P.; Nouvellon, Y.; Bouillet, J.P.; Jourdan, C.; de Moraes Gonçalves, J.L.; Laclau, J.P. Measured and modeled interactive effects of potassium deficiency and water deficit on gross primary productivity and light-use efficiency in Eucalyptus grandis plantations. Global Chang. Biol. 2015, 21, 2022–2039. [Google Scholar] [CrossRef]
  38. Mao, X.; Zheng, Y.; Xiao, K.; Wei, Y.; Zhu, Y.; Cai, Q.; Chen, L.; Xie, H.; Zhang, J. OsPRX2 contributes to stomatal closure and improves potassium deficiency tolerance in rice. Biochem. Biophy. Res. Commun. 2018, 495, 461–467. [Google Scholar] [CrossRef]
  39. Arquero, O.; Barranco, D.; Benlloch, M. Potassium starvation increases stomatal conductance in olive trees. HortScience 2006, 41, 433–436. [Google Scholar] [CrossRef]
  40. Marschner, P. Marschner’s Mineral Nutrition of Higher Plants, 3rd ed.; Academic Press: Cambridge, MA, USA, 2012; pp. 181–188. [Google Scholar]
  41. Cui, J.; Tcherkez, G. Potassium dependency of enzymes in plant primary metabolism. Plant Physiol. Biochem. 2021, 166, 522–530. [Google Scholar] [CrossRef]
  42. Hu, W.; Ren, T.; Meng, F.; Cong, R.; Li, X.; White, P.; Lu, J. Leaf photosynthetic capacity is regulated by the interaction of nitrogen and potassium through coordination of CO2 diffusion and carboxylation. Physiol. Plant. 2019, 167, 418–432. [Google Scholar] [CrossRef]
  43. Deans, R.; Farquhar, G.; Busch, F. Estimating stomatal and biochemical limitations during photosynthetic induction. Plant Cell Environ. 2019, 42, 3227–3240. [Google Scholar] [CrossRef] [PubMed]
  44. Huang, G.; Zhang, Q.; Wei, X.; Peng, S.; Li, Y. Nitrogen can alleviate the inhibition of photosynthesis caused by high temperature stress under both steady-state and flecked irradiance. Front. Plant Sci. 2017, 8, 945. [Google Scholar] [CrossRef]
  45. Li, Y.T.; Li, Y.; Li, Y.N.; Liang, Y.; Sun, Q.; Li, G.; Liu, P.; Zhang, Z.S.; Gao, H.Y. Dynamic light caused less photosynthetic suppression, rather than more, under nitrogen deficit conditions than under sufficient nitrogen supply conditions in soybean. BMC Plant Biol. 2020, 20, 339. [Google Scholar] [CrossRef] [PubMed]
  46. Zhang, N.; Berman, S.; Berg, T.; Chen, Y.; Marcelis, L.; Kaiser, E. Biochemical versus stomatal acclimation of dynamic photosynthetic gas exchange to elevated CO2 in three horticultural species with contrasting stomatal morphology. Plant Cell Environ. 2024, 47, 4516–4529. [Google Scholar] [CrossRef] [PubMed]
  47. Bernacchi, C.; Portis, A.; Nakano, H.; Von Caemmerer, S.; Long, S. Temperature response of mesophyll conductance. Implications for the determination of Rubisco enzyme kinetics and for limitations to photosynthesis in vivo. Plant Physiol. 2002, 130, 1992–1998. [Google Scholar] [CrossRef]
  48. Perdomo, J.; Capó-Bauçà, S.; Carmo-Silva, E.; Galmés, J. Rubisco and rubisco activase play an important role in the biochemical limitations of photosynthesis in rice, wheat, and maize under high temperature and water deficit. Front. Plant Sci. 2017, 8, 490. [Google Scholar] [CrossRef]
  49. Harley, P.; Loreto, F.; Di Marco, G.; Sharke, T. Theoretical considerations when estimating the mesophyll conductance to CO2 flux by analysis of the response of photosynthesis to CO2. Plant Physiol. 1992, 98, 1429–1436. [Google Scholar] [CrossRef]
  50. Mott, K.; Woodrow, I. Modelling the role of Rubisco activase in limiting non-steady-state photosynthesis. J. Exp. Bot. 2000, 51, 399–406. [Google Scholar] [CrossRef]
Figure 1. Dynamic photosynthetic traits of Phaseolus vulgaris L. during photosynthetic induction at 1000 μmol m−2 s−1 photosynthetic photon flux density (PPFD) as affected by K nutrition. Leaves were initially acclimated to a steady state under low light (100 μmol m−2 s−1 PPFD), followed by exposure to high light (1000 μmol m−2 s−1 PPFD). A, net photosynthetic rate (a); gsc, stomatal conductance to CO2 (b); gm, mesophyll conductance to CO2 (c); Vcmax, the maximum carboxylation rate (d).
Plants 14 01623 g001
Figure 2. Steady-state photosynthetic parameters of Phaseolus vulgaris L. after light photosynthetic induction as affected by K nutrition. Ai (a), gsci (b), gmi (c), and Vcmaxi (d) are the steady-state A, gsc, gm, and Vcmax of the last 1 min of the low-light induction period (100 μmol m−2 s−1 PPFD). Af (a), gscf (b), gmf (c), and Vcmaxf (d) are the steady-state A, gsc, gm, and Vcmax of the last 1 min of the high-light induction period (1000 μmol m−2 s−1 PPFD). Different letters indicate significant differences between the treatments (p < 0.05). Data are presented as means ± SE (n = 5).
Plants 14 01623 g002
Figure 3. Dynamic photosynthetic parameters of Phaseolus vulgaris L. during photosynthetic induction as affected by K nutrition. tA90 (a), tgsc90 (b), tgm90 (c), and tvcmax90 (d) are the times to reach 90% photosynthetic induction, full stomatal opening, mesophyll opening, and biochemical activation. Different letters indicate significant differences between the treatments (p < 0.05). Data are presented as means ± SE (n = 5).
Plants 14 01623 g003
Figure 4. Dynamic variations in the biochemical limitation (dAb), mesophyll conductance limitation (dAm), and stomatal limitation (dAs) of Phaseolus vulgaris L. during photosynthetic induction under K-deficient condition (a) and normal K condition (b).
Plants 14 01623 g004
Figure 5. Impact of K nutrition on the relative time-integrated limitations involving stomatal limitation (σs), mesophyll conductance limitation (σm), and biochemical limitation (σb) in response to the photosynthetic induction of Phaseolus vulgaris L. Data are presented as means ± SE (n = 5). Asterisks indicate significant differences between the treatments (*, p < 0.05; ns, no significant difference).
Plants 14 01623 g005
Disclaimer/Publisher’s Note: The statements, opinions and data contained in all publications are solely those of the individual author(s) and contributor(s) and not of MDPI and/or the editor(s). MDPI and/or the editor(s) disclaim responsibility for any injury to people or property resulting from any ideas, methods, instructions or products referred to in the content.

