Article

Dual Regulatory Roles of SlGAMYB1 in Tomato Development: GA-Dependent and GA-Independent Mechanisms

1
Guangdong Provincial Key Laboratory for Plant Epigenetics, College of Life Sciences and Oceanography, Shenzhen University, Shenzhen 518060, China
2
The Orchid Conservation and Research Center of Shenzhen, Shenzhen 518060, China
*
Author to whom correspondence should be addressed.
Plants 2025, 14(11), 1613; https://doi.org/10.3390/plants14111613
Submission received: 19 February 2025 / Revised: 3 May 2025 / Accepted: 12 May 2025 / Published: 25 May 2025
(This article belongs to the Section Plant Development and Morphogenesis)

Abstract

:
The R2R3-MYB transcription factor GAMYB plays crucial roles in plant growth and development, but the biological functions of SlGAMYB1 in tomato remain poorly understood. Here, we investigated the roles of SlGAMYB1 by overexpressing a miR159-resistant version (35S:SlGAMYB1m) in tomato. Transgenic plants exhibited a dwarf phenotype with reduced internode elongation, which was associated with decreased bioactive gibberellin (GA) levels due to transcriptional repression of SlGA3ox1 and activation of SlGA2ox1/2/4/5. Additionally, 35S:SlGAMYB1m altered leaf morphology by inhibiting cell proliferation through downregulation of cell cycle genes, resulting in larger but fewer epidermal cells. Intriguingly, 35S:SlGAMYB1m plants displayed increased floral organ number, a process likely mediated by the upregulation of SlWUS rather than GA signaling. These findings demonstrate that SlGAMYB1 regulates diverse aspects of tomato development through both GA-dependent and independent pathways, providing new insights into the functional diversification of GAMYB genes and potential strategies for genetic improvement of tomato architecture and yield.

1. Introduction

Plant growth and development is a complex process that is finely regulated by multiple endogenous hormones and transcription factors. Among these regulators, gibberellin (GA) stands out as a crucial plant hormone that plays a key role in various stages of plant growth [1,2]. GA is indispensable in promoting cell elongation, cell division, and the transition from vegetative to reproductive growth. For instance, GA significantly influences plant height, leaf morphology, flowering time, and floral organ development [3,4,5]. The biosynthesis and signaling pathways of GA have been extensively studied in many plant species, and it is well established that GA regulates plant growth and development by modulating the expression of a series of downstream genes [3].
Transcription factors are pivotal in the modulation of target gene expression, thereby orchestrating plant growth and development. The MYB family is one of the largest transcription factor families in plants [6] and can be divided into four major subclades—1R-MYB, R2R3-MYB, 3R-MYB, and 4R-MYB [7]. Among these, the R2R3-MYB subfamily, with its numerous members, plays a pivotal role in a variety of developmental and physiological processes, including tissue differentiation, metabolic pathways, and stress tolerance [8,9,10]. The GAMYB transcription factors belong to the R2R3-MYB family, serving as a positive regulator in the GA signaling pathway [11]. They are characterized by highly conserved R2R3 DNA-binding domains in their N-terminal regions, as well as distinctive motifs known as Box 1, Box 2, and Box 3, which are crucial for their function [12,13].
GAMYB transcription factors exhibit remarkable functional plasticity across plant species, orchestrating diverse developmental programs through GA-dependent and independent pathways. As pivotal components of GA signaling, these regulators were first characterized in barley (Hordeum vulgare L.) aleurone cells, where they mediate α-amylase activation during seed germination [14]. Subsequent studies have established their essential role in reproductive development, particularly during male organ formation, where GAMYB-mediated regulation of tapetal programmed cell death is crucial, a process whose disruption causes male sterility in key crop species such as rice (Oryza sativa L.), wheat (Triticum aestivum L.), and cucumber (Cucumis sativus L.) [11,12,15]. Beyond gametogenesis, GAMYB proteins demonstrate broad developmental influence, coordinating seed maturation through storage protein activation (e.g., Hor2 and Amy6.4 in barley), modulating architectural traits (including internode elongation and tiller formation in rice), and mediating stress responses (particularly drought adaptation in barley spike development) [16,17,18]. The regulatory repertoire of GAMYB genes extends to flowering time control, though with intriguing species-specific variations. In tomato (Solanum lycopersicum L.), the GAMYB homolog SlMYB33 appears to regulate floral transition through putative interactions with flowering-associated genes [4], while heterologous expression studies in Arabidopsis reveal that different wheat TaGAMYB isoforms can exert diametrically opposed effects on flowering timing [19]. This functional divergence highlights the evolutionary adaptability of GAMYB proteins as developmental regulators. Their capacity to integrate hormonal signals with environmental cues while maintaining tissue-specific functions positions GAMYB transcription factors as central nodes in the regulatory networks governing plant architecture, reproductive success, and stress-adaptation characteristics that make them particularly valuable targets for precision breeding strategies in crop improvement programs.
GAMYB transcription factors are well-established targets of microRNA159 (miR159), with their interaction playing a pivotal role in plant organ development [12]. Multiple GAMYB family members, including MYB33, MYB65, MYB81, MYB97, MYB101, MYB104, and MYB120, contain conserved miR159 binding sites and regulate diverse biological processes [12,20]. Among these, MYB33 and MYB65 serve as primary miR159 targets in Arabidopsis, where their double knockout results in severe developmental defects, including shortened filaments, pollen abortion, and male sterility [12,21]. This regulatory module is conserved across species: in strawberry (Fragaria × ananassa), Fa-miR159a/b coordinates with gibberellins to promote flower receptacle development [22], while in maize (Zea mays L.), zma-miR159-mediated regulation of ZmMYB74 and ZmMYB138 controls endosperm cell proliferation, ultimately affecting grain size and weight [23]. Similarly, in tomato, both SlGAMYB1 and SlGAMYB2 are validated targets of Sly-miR159 [24,25]. While SlGAMYB2 has been extensively characterized as a regulator of fruit morphology through GA biosynthesis, flowering time, and pollen development, the functional significance of SlGAMYB1 remains largely unexplored despite its similar targeting by Sly-miR159 [4,24]. Notably, Sly-miR159 overexpression studies that simultaneously downregulate both SlGAMYB1 and SlGAMYB2 result in precocious fruit initiation and parthenocarpy, suggesting potential overlapping yet distinct roles for these paralogs in tomato development [25]. This knowledge gap regarding SlGAMYB1’s specific functions, particularly in comparison to its well-studied counterpart SlGAMYB2, highlights the need for focused investigation to fully understand the GAMYB regulatory network in tomato.
Given the crucial roles of GA and GAMYBs in plant growth, we hypothesized that SlGAMYB1 influences organ development via GA signaling. Using a miR159-resistant SlGAMYB1 (35S:SlGAMYB1m), we found that it regulates plant height by suppressing SlGA3ox1 and activating SlGA2ox1/2/4/5, reducing GA levels and causing dwarfism. It also alters leaf morphology by inhibiting cell proliferation and increases floral organ number independently of GA, likely via SlWUS upregulation. These findings reveal SlGAMYB1’s pleiotropic roles and potential breeding applications.

2. Results

2.1. Characterization and Expression Pattern of SlGAMYB1

Our previous study identified SlGAMYB1 (Solyc01g009070) and SlGAMYB2 (Solyc06g073640) as members of the R2R3MYB family, which are the major targets of miR159 [24,26]. Given the extensive documentation on the role of SlGAMYB2, our present investigation has delved into the relatively unexplored terrain of SlGAMYB1 to unravel the specific contributions of SlGAMYB1 to plant biology, complementing the existing body of knowledge with fresh insights into its distinct functions and regulatory mechanisms. The genomic fragment of SlGAMYB1 consists of three exons and two introns, which encompass an open reading frame (ORF) of 1614 bp, encoding 537 amino acid residues. The lengths of the exons are 351 bp, 987 bp, and 276 bp. The gene structure is represented with exons in black, introns in white, and the 3’ UTR in gray (Figure 1a).
Sequence alignment of SlGAMYB1 with other GAMYB proteins reveals high conservation within the R2R3 DNA-binding domains, Box 1, Box 2, and Box 3 motifs (Figure 1b). The R2R3 DNA-binding domain displays an extraordinary degree of sequence conservation, with over 80% homology to its analogous segments in HvGAMYB from barley, OsGAMYB from rice, AtGAMYB from Arabidopsis thaliana, and CsGAMYB from cucumber.
To elucidate the evolutionary relationships among GAMYB proteins across various species, an unrooted neighbor-joining (NJ) phylogenetic tree was constructed according to the full-length protein sequences of six distinct species (Appendix A Table A3). As shown in Figure 1c, the GAMYB proteins neatly segregate into two major clusters. The distinct branching of OsGAMYB from rice and HvGAMYB from barley implies a potential functional diversification of GAMYB genes within different species. Notably, the GAMYB proteins from Solanaceae family members, encompassing tomato and pepper (Capsicum annuum L.), coalesce into a singular group. This aggregation hints at a shared ancestral lineage and potentially overlapping biological functions. Among these sequences, the tomato GAMYBs (SlGAMYB1 and SlGAMYB2), pepper GAMYBs (CaGAMYB1 and CaGAMYB2), and the cucumber GAMYB (CsGAMYB1) are nestled within the same clade. This clade stands in stark contrast to the clade occupied by the Arabidopsis thaliana MYB33 and MYB65 proteins, underscoring significant evolutionary divergence.
To explore the potential role of SlGAMYB1 in tomato development, we conducted a comprehensive analysis of its expression across various vegetative and reproductive tissues using quantitative real-time reverse transcription polymerase chain reaction (qRT-PCR). Prior to target gene quantification, we rigorously evaluated four candidate reference genes for normalization accuracy, including ACTIN, Ubiquitin (UBI), Elongation factor-1 alpha (EF-1α), and Tubulin (TUB). Ct values from all tissues (Figure 1d and Figure A1b) were analyzed using RefFinder software [27], which integrates multiple algorithms to assess gene stability. The composite stability ranking (Figure A1a) identified ACTIN as the most stable reference (lowest score), followed by UBI, EF-1α, and TUB, establishing ACTIN as the optimal internal control for subsequent SlGAMYB1 expression profiling across diverse tissue types.
Our results yielded insights into the tissue-specific expression dynamics of SlGAMYB1, indicating a ubiquitous presence across all sampled tissues, albeit with a discernible heterogeneity in expression intensities. Notably, SlGAMYB1 transcripts were particularly pronounced in reproductive tissues, including flower buds, sepals, petals, stamens, and carpels, while it was less abundant in vegetative tissues such as young and mature leaves, cotyledons, and hypocotyls (Figure 1d). These findings suggest that SlGAMYB1 may serve as a regulatory hub in the complex interplay of developmental processes, with a potentially significant impact on the reproductive phase in tomato.

2.2. Overexpression of SlGAMYB1 Results in Plant Dwarfism via GA Deficiency in Tomato

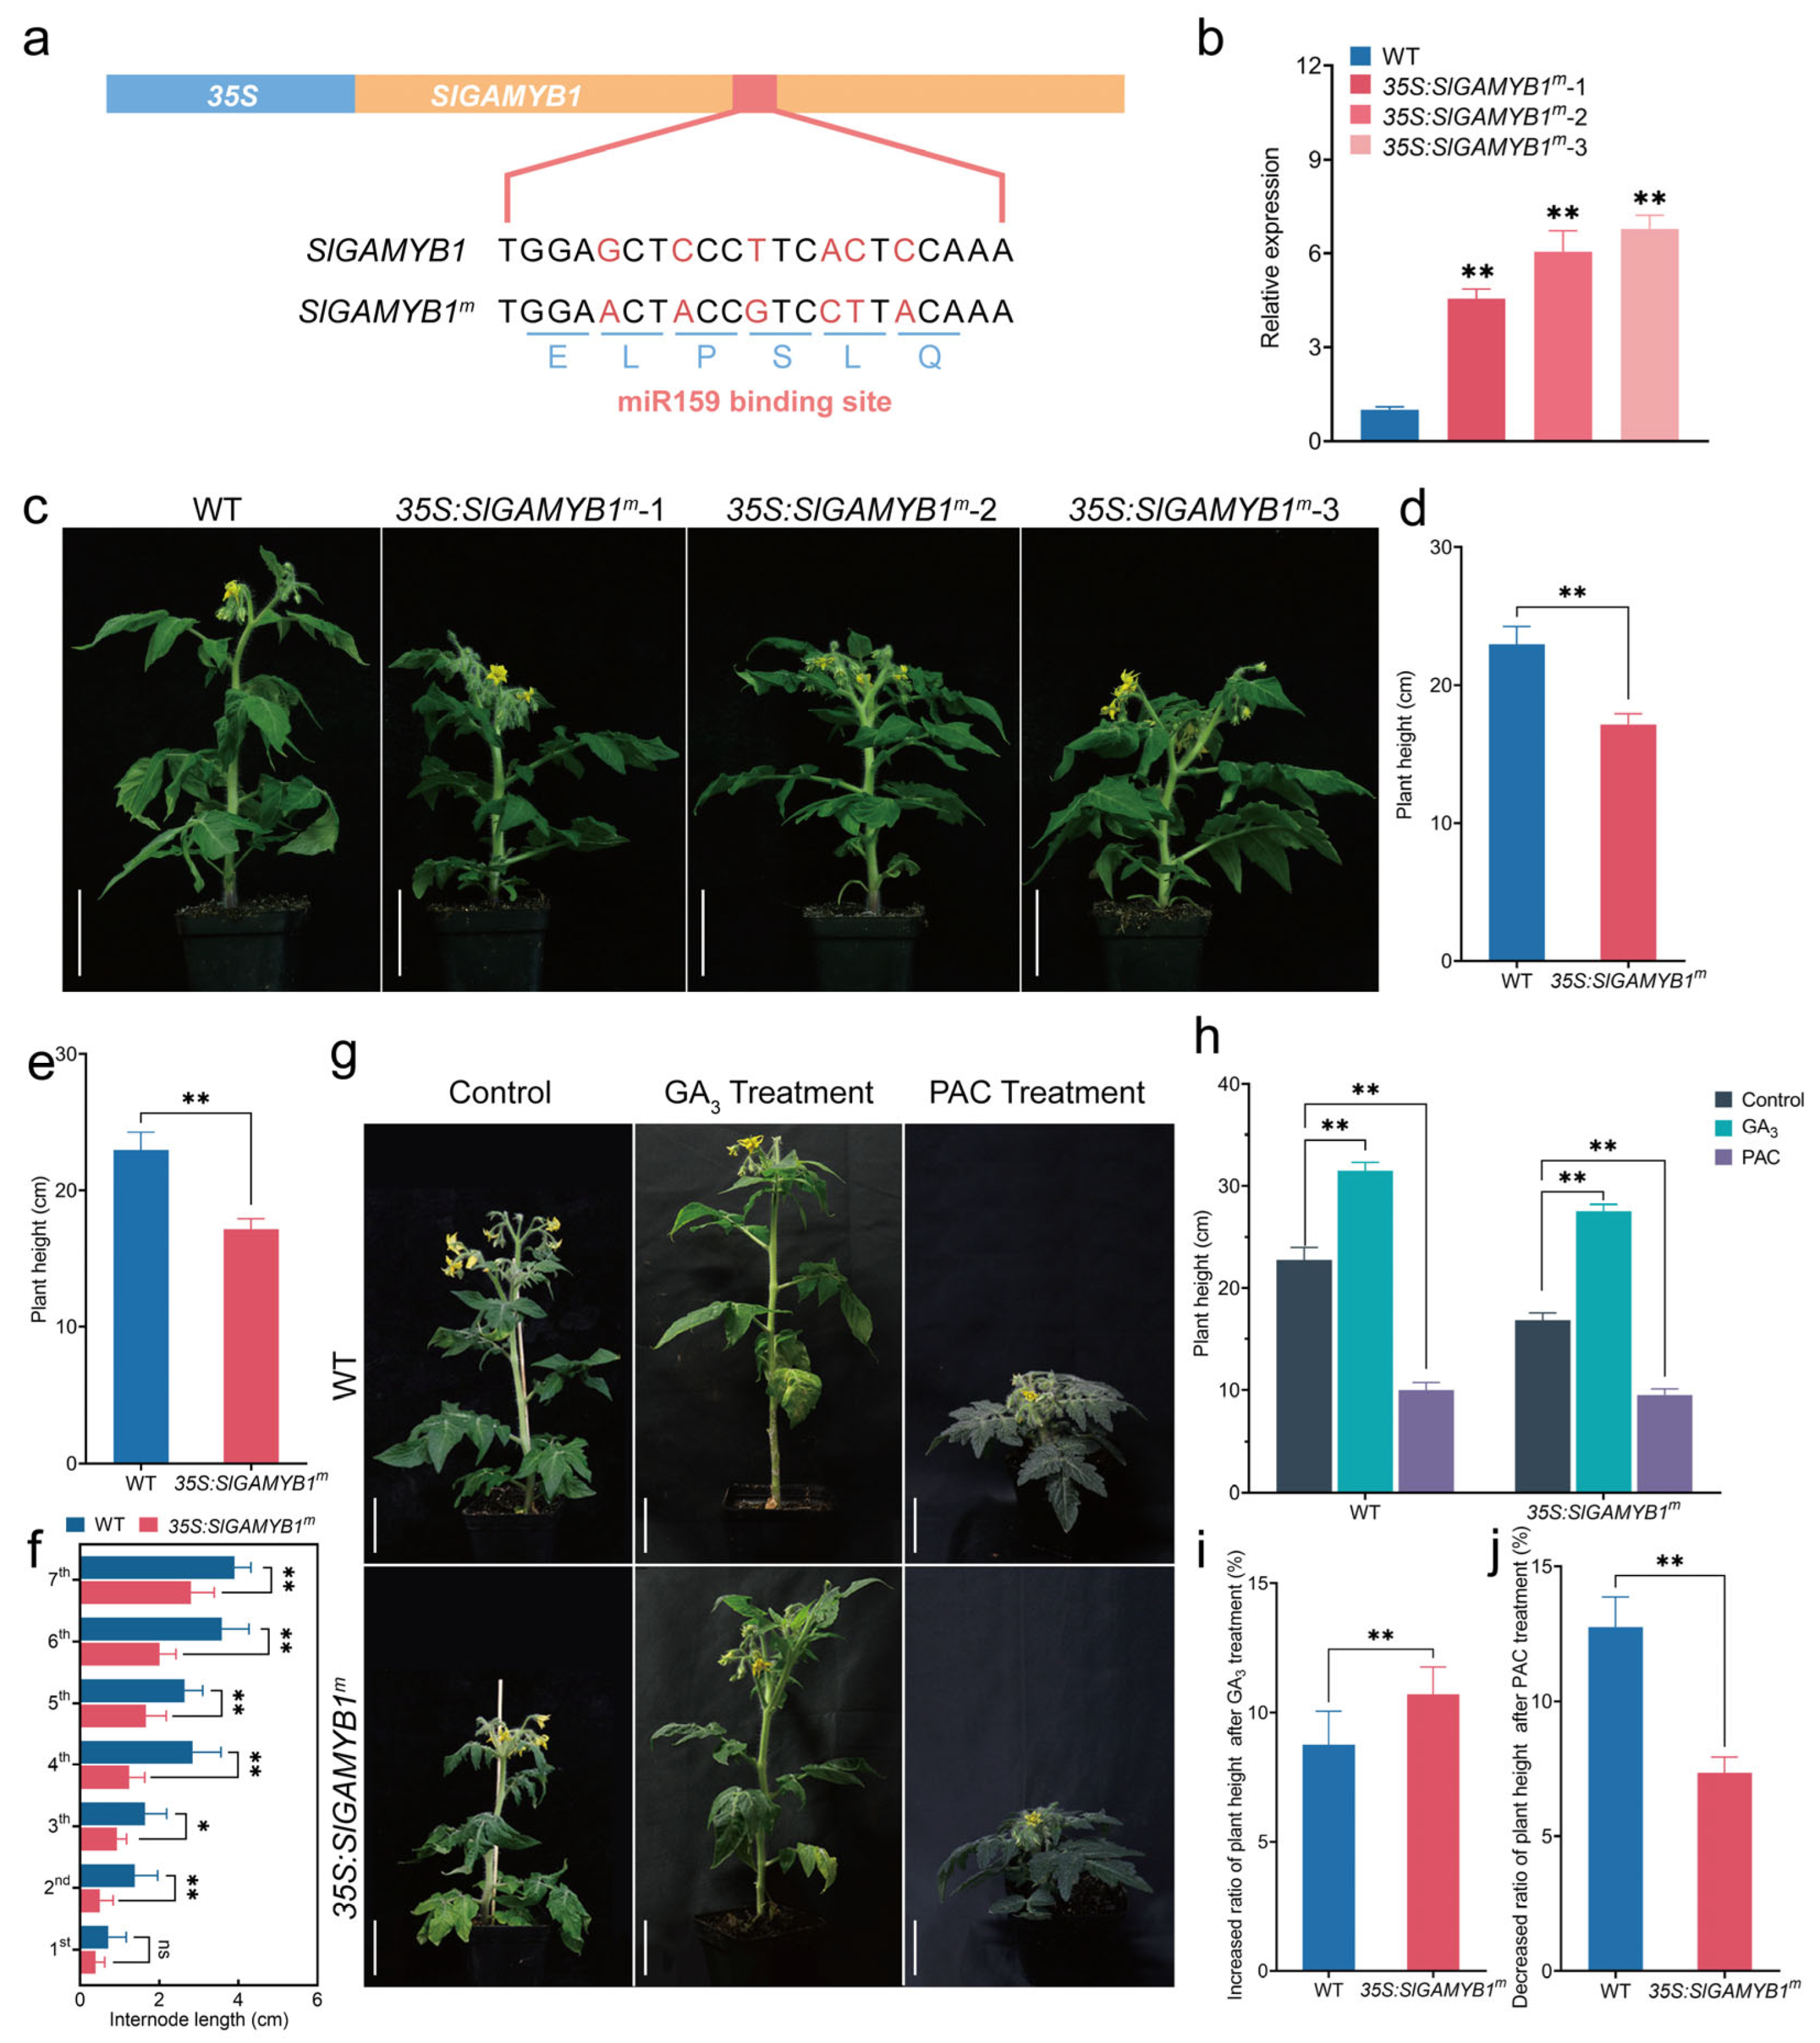
To further investigate the biological functions of SlGAMYB1 in tomato, we employed the constitutive cauliflower mosaic virus (CaMV) 35S promoter to overexpress a Sly-miR159-resistant form of SlGAMYB1 (SlGAMYB1m) in tomato, yielding three 35S:SlGAMYB1m transgenic lines (Figure 2a). qRT-PCR confirmed a significant upregulation of SlGAMYB1 transcript levels in these transgenic lines, with increases of 4.6-fold, 6.1-fold, and 6.8-fold relative to the wild type (Figure 2b), validating the successful overexpression of SlGAMYB1 in the transgenic plants. The line 35S:SlGAMYB1m-3, which exhibited a representative phenotype, was selected for further analysis.
Plant height is a critical agronomic trait influencing crop architecture and production strategies [28]. We measured the plant height and the internode length/number of the 35S:SlGAMYB1m line in 6-week-old plants, a period marking the onset of reproductive growth. The 35S:SlGAMYB1m plant displayed a pronounced dwarf phenotype compared to the wild type ‘Micro-Tom’ (Figure 2c). The wild type reached a height of 21.9 cm, while the height of the 35S:SlGAMYB1m line was approximately 20% shorter (Figure 2d). In tomato, plant height is primarily determined by the internode length/number [29]. We found no difference in the number of internodes (Figure 2e); however, the internode length of the 35S:SlGAMYB1m line was significantly shorter than that of the wild type (Figure 2f), suggesting that the dwarfism is primarily attributed to the inhibition of internode elongation.
Dwarfism in plants, often associated with defects in internode elongation, has been linked to gibberellin (GA) through extensive genetic and molecular studies [30]. Our previous study identified SlGAMYB2 as a regulator of GA biosynthesis in tomato [24]. Given the sequence similarity between SlGAMYB1 and SlGAMYB2, we hypothesized that SlGAMYB1 might affect internode elongation through GA biosynthesis. To validate this hypothesis, we examined the active GA levels in 35S:SlGAMYB1m plants using liquid chromatography–mass spectroscopy (LC–MS). Comparative analysis revealed a significant reduction of GA1, GA4, and GA3 in 35S:SlGAMYB1m lines relative to wild-type (Figure 3a–c). Moreover, we applied the effect of exogenous GA3 and paclobutrazol (PAC), a GA biosynthesis inhibitor, on wild-type and 35S:SlGAMYB1m lines. Treatment with 100 μM exogenous GA3 restored the height of SlGAMYB1-overexpressing plants to levels comparable to the wild type (Figure 2g,h). Conversely, treatment with 100 μM PAC resulted in equal height reduction for both 35S:SlGAMYB1m and wild-type plants (Figure 2g,h). The plant height in 35S:SlGAMYB1m plants was more responsive to GA3 but less sensitive to PAC than that in wild type, as the 35S:SlGAMYB1m plants showed a stronger increase and weaker decrease of plant height than wild type when treated with GA3 and PAC, respectively (Figure 2g–j).
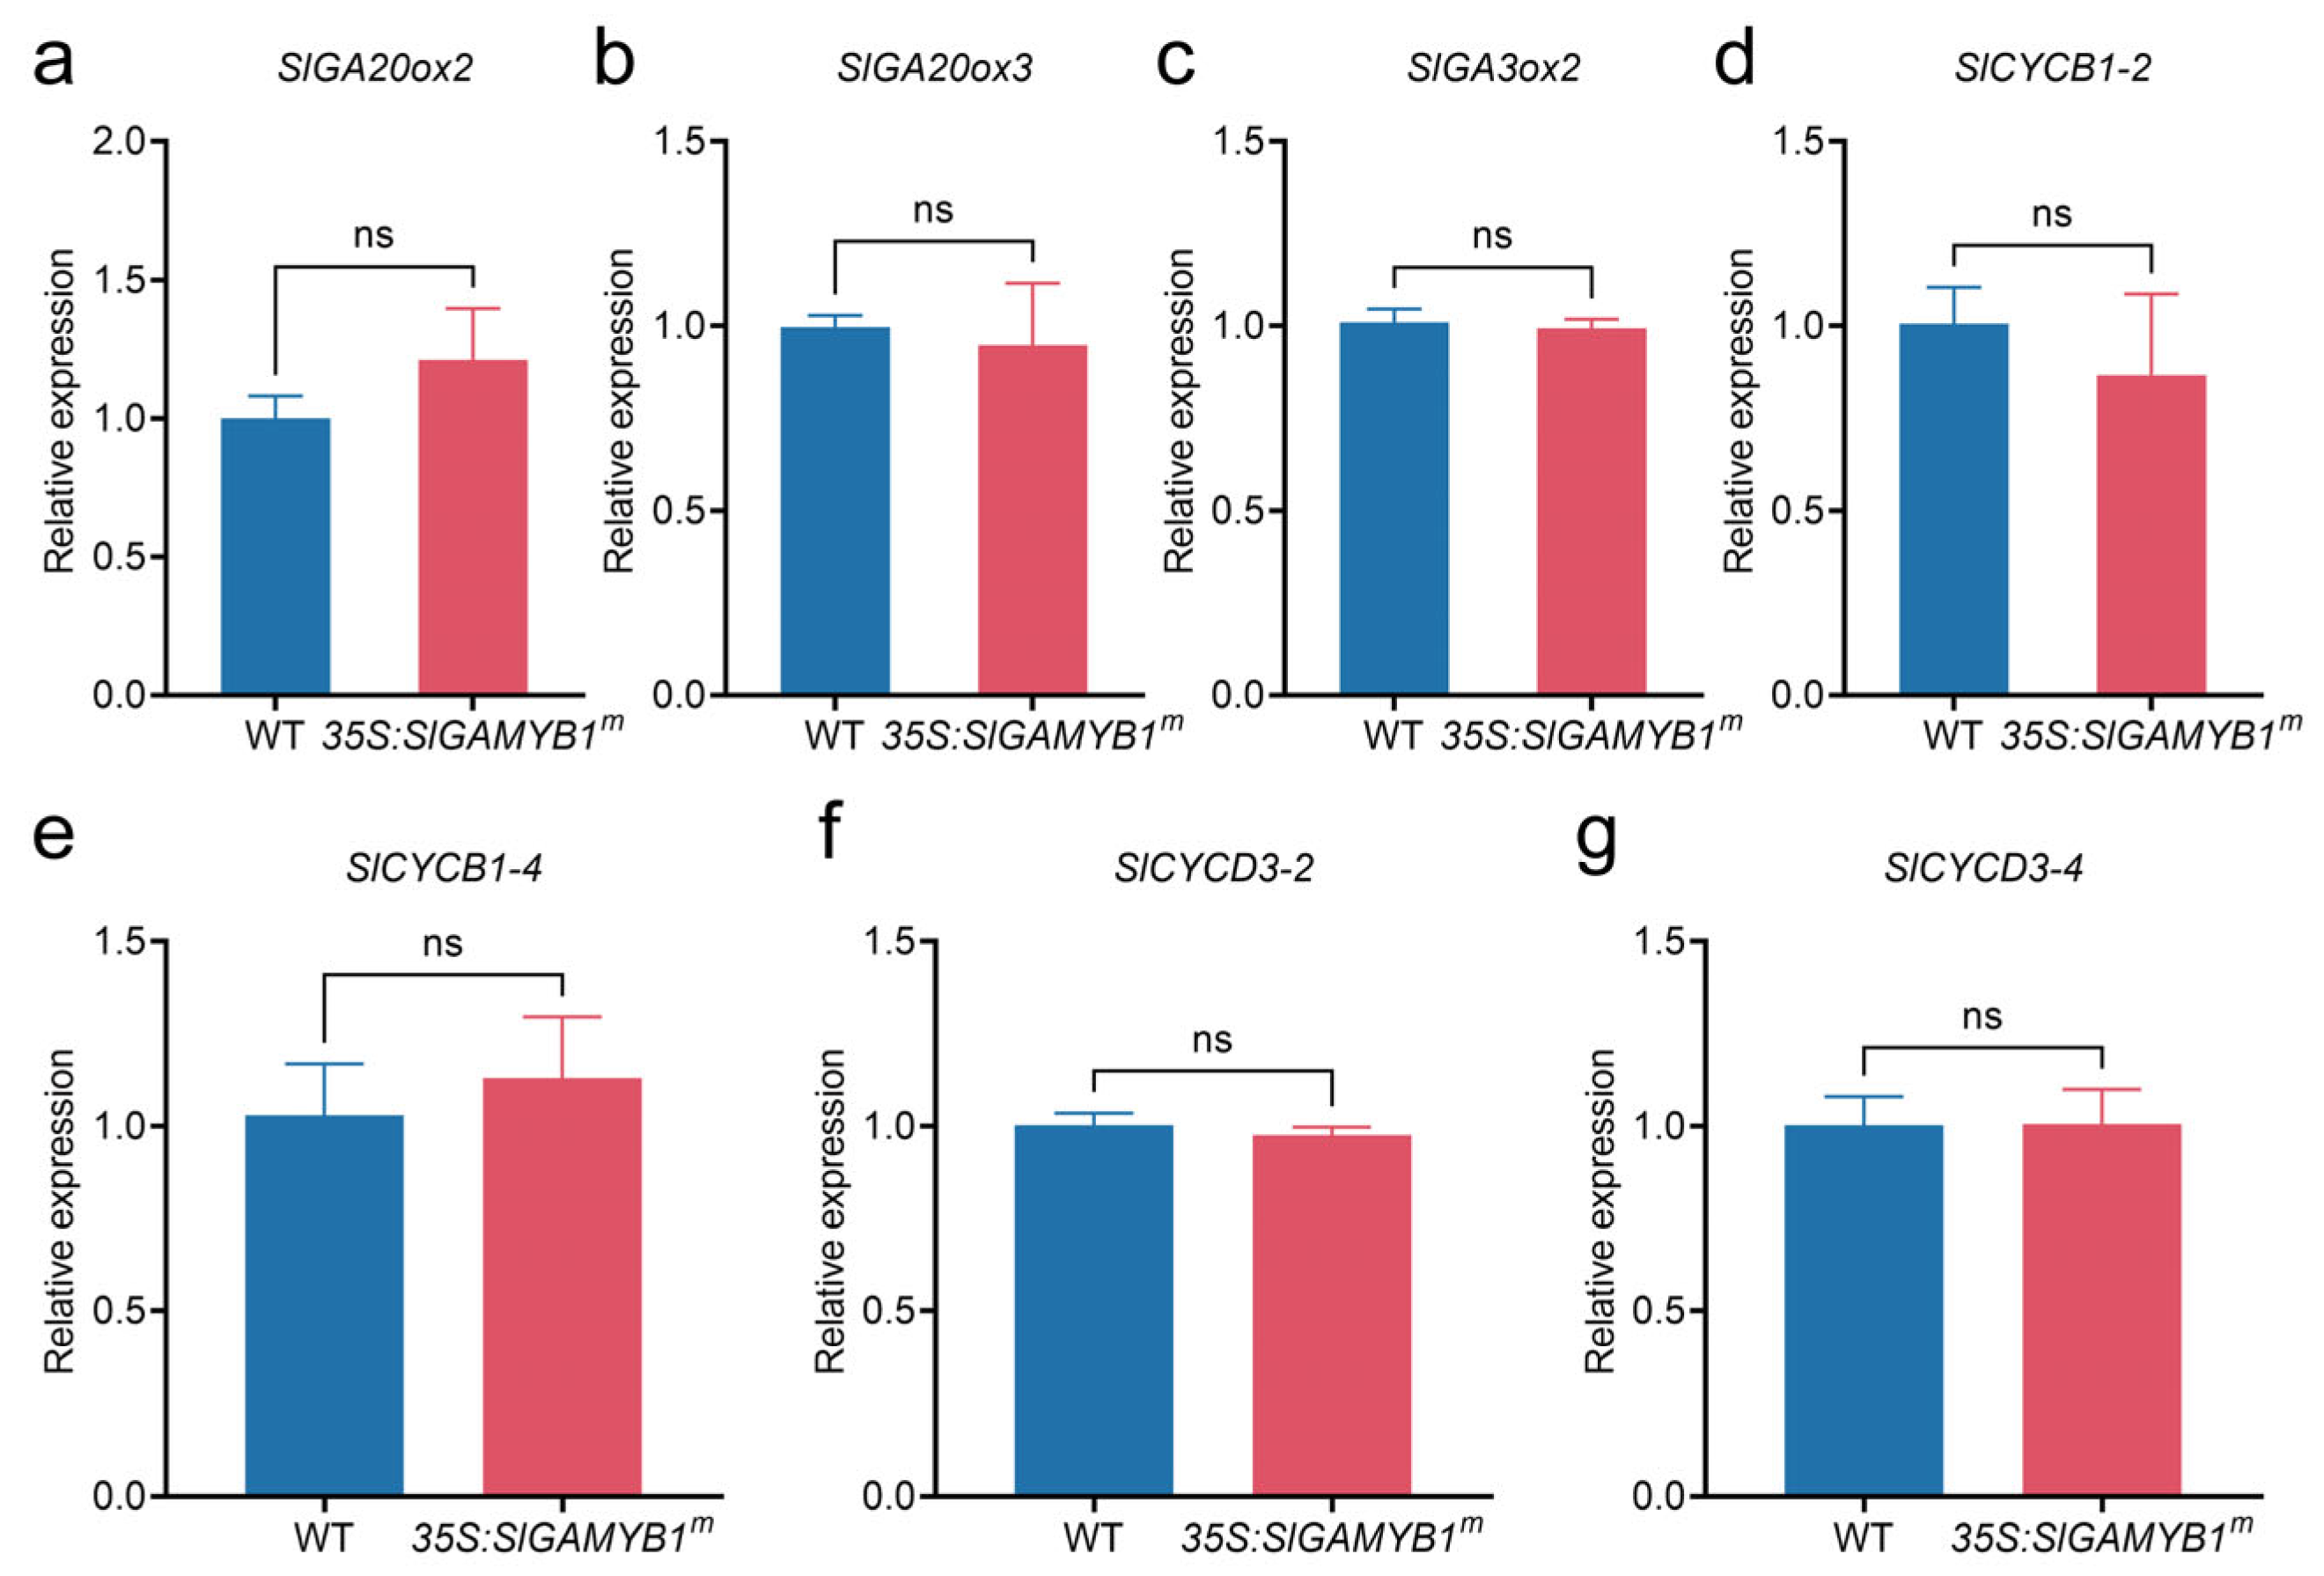
To identify the potential target genes of SlGAMYB1, we further examined the transcription level of representative genes involved in the GA biosynthesis pathway. The transcripts of SlGA3ox1 decreased significantly in 35S:SlGAMYB1m lines, while the transcripts of SlGA2ox1, SlGA2ox2, SlGA2ox4, and SlGA2ox5 increased significantly (Figure 3d–h). Neither of the two GA20 oxidase genes examined showed significant expression changes in the 35S:SlGAMYB1m lines (Figure A2a–c). These findings indicated that SlGAMYB1 affects internode elongation through GA biosynthesis rather than the GA signaling pathway.

2.3. SlGAMYB1 Plays a Crucial Role in Controlling Leaf Morphology and Cell Characteristics in Tomato

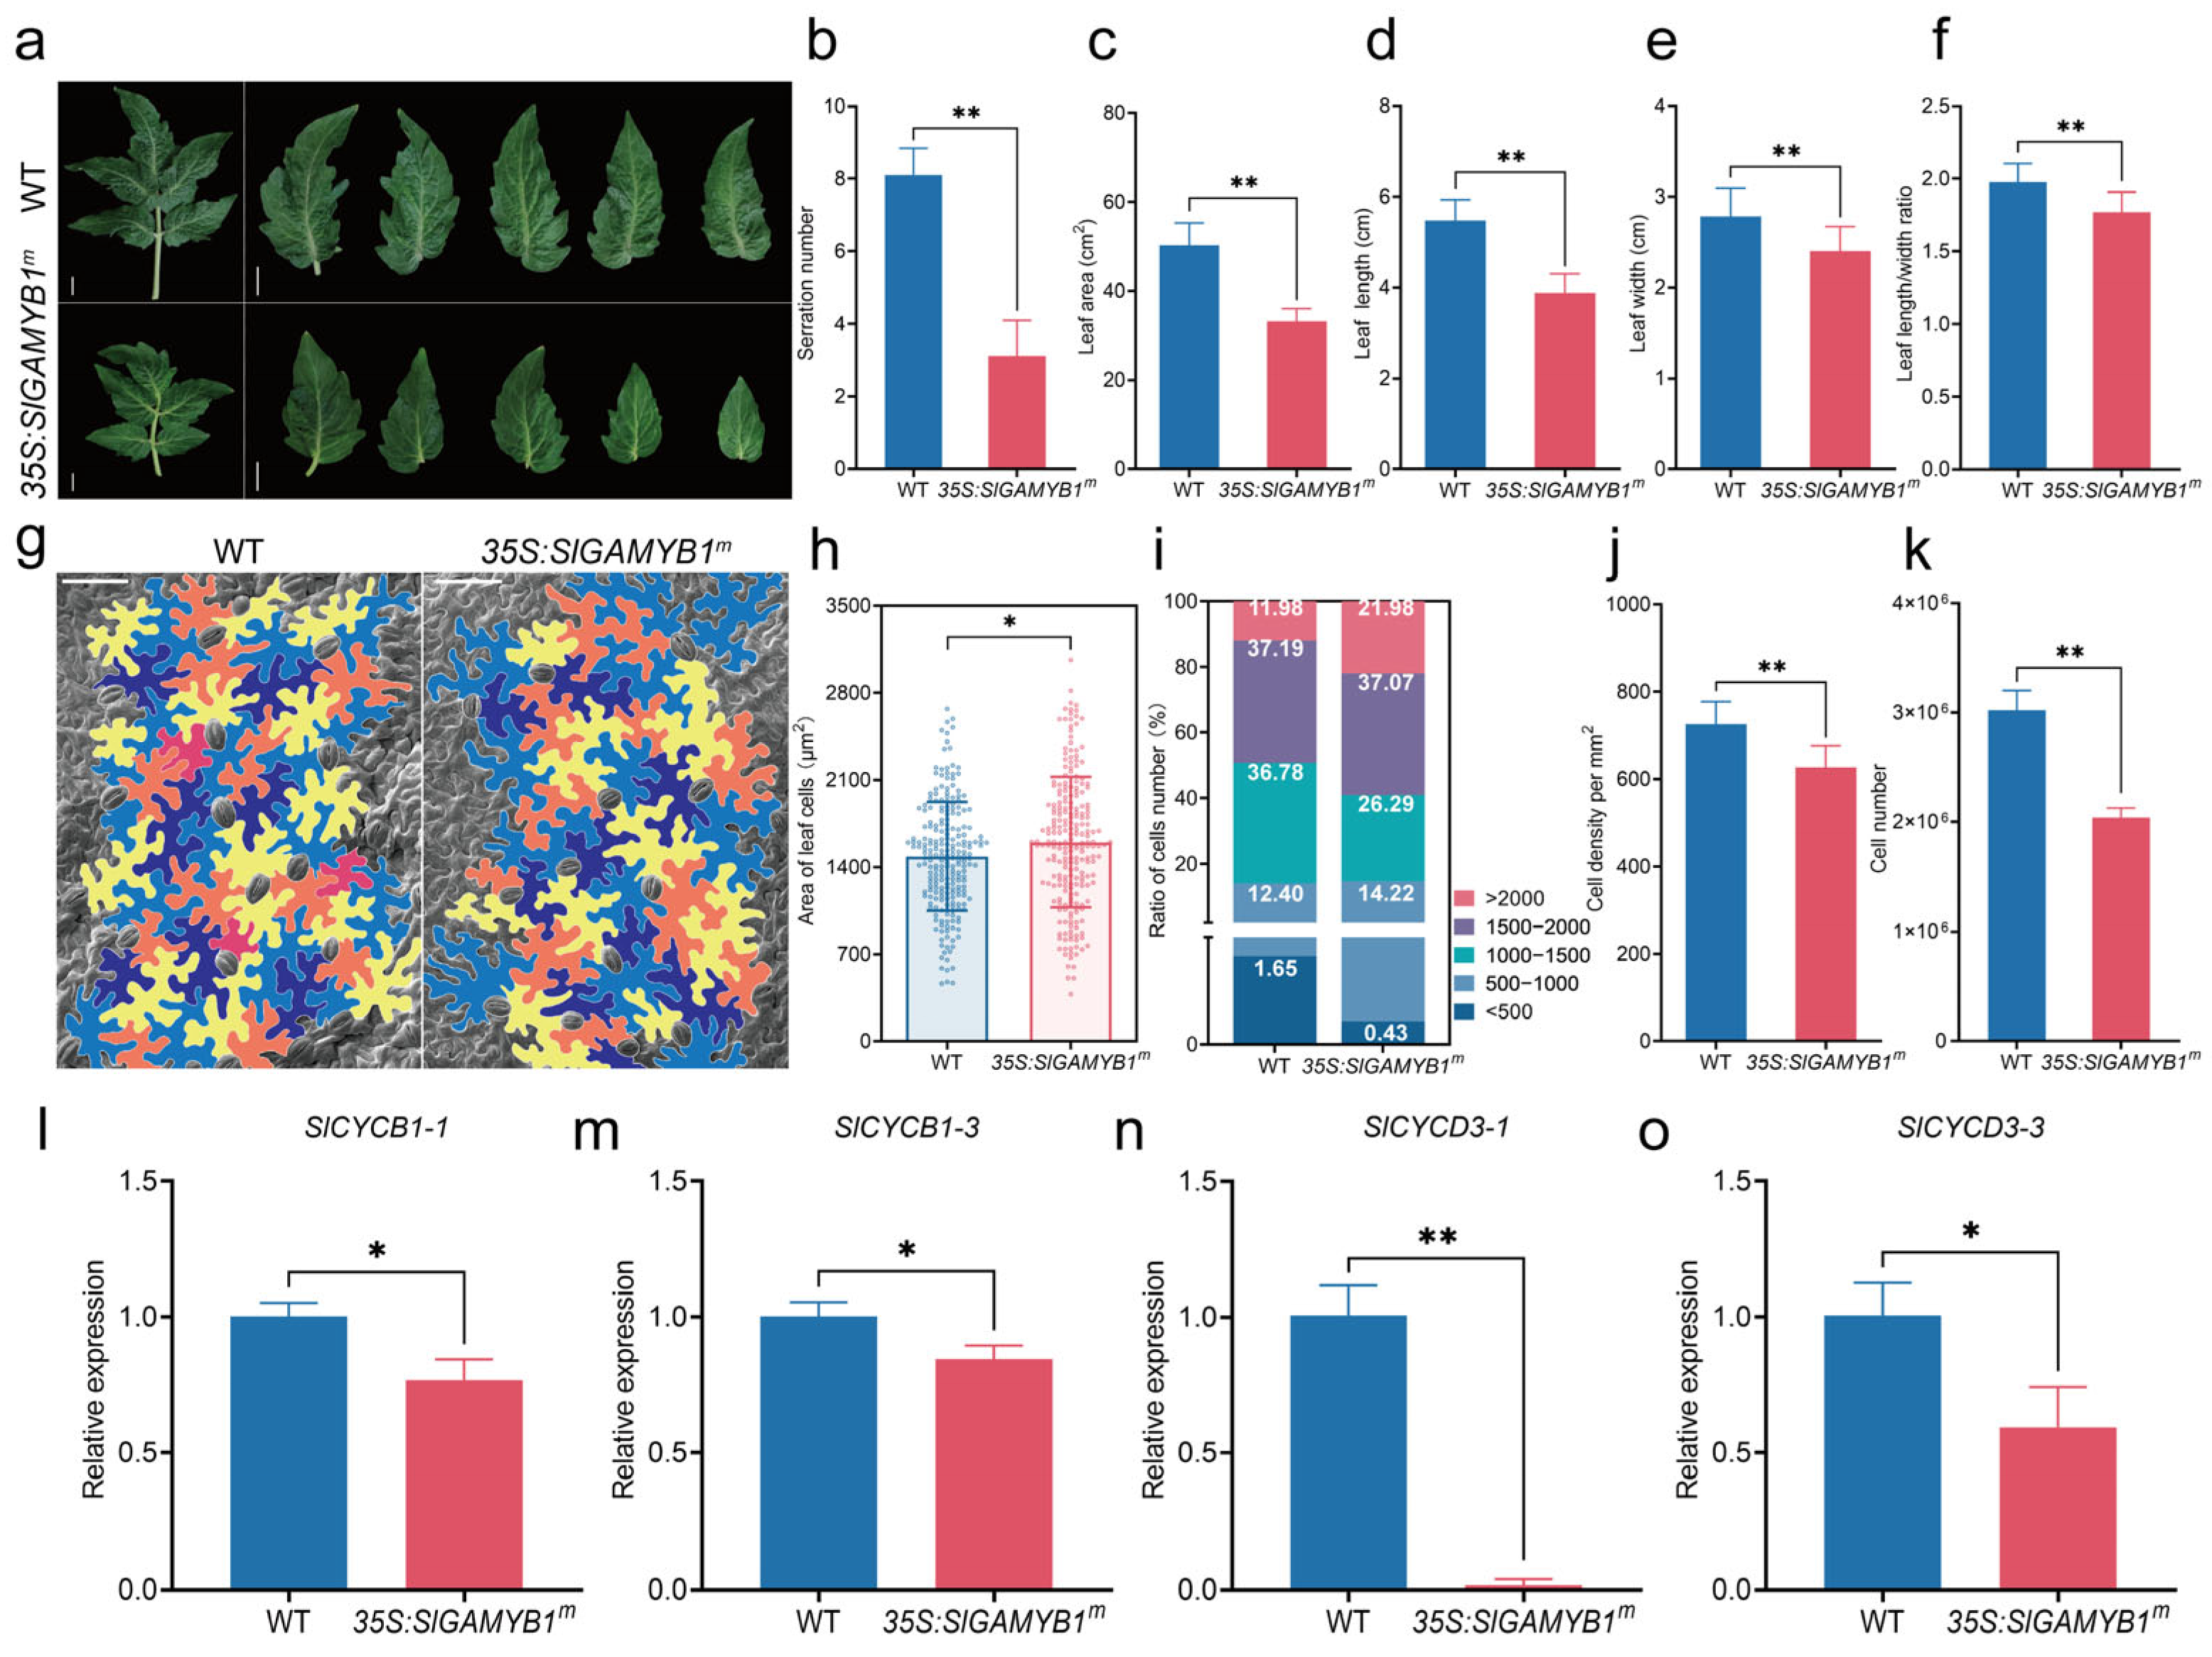
Tomato compound leaves comprise a terminal lobed leaflet with two pairs of lateral leaflets, separated by a rachis (Figure 4a). The 35S:SlGAMYB1m plants exhibited a visible pleiotropic phenotype in leaf morphology, including changes in the serration of leaf margins and overall leaf dimensions (Figure 4a). Notably, the number of serrations was significantly reduced in 35S:SlGAMYB1m lines compared to the wild type (Figure 4b). Quantitative analysis of the area, length, and width of mature leaves revealed that the leaf area of 35S:SlGAMYB1m was reduced compared to the wild type. The results showed that 35S:SlGAMYB1m had a decreased area relative to wild type (Figure 4c). Further detailed measurement revealed that both leaf length and width were considerably decreased in 35S:SlGAMYB1m (Figure 4d,e), suggesting that the reduction in leaf area was primarily attributed to the diminished leaf dimensions. Moreover, the leaf length-to-width ratio, a critical parameter influencing leaf photosynthetic capacity and overall plant architecture, was notably reduced in 35S:SlGAMYB1m plants, highlighting the role of SlGAMYB1 in leaf morphogenesis. (Figure 4f). This change in leaf morphology might be attributed to the role of SlGAMYB1 in regulating cell division, elongation, or differentiation processes during leaf ontogeny.
In the process of leaf morphogenesis, precise control of cell proliferation and growth is crucial for generating different leaf sizes and shapes [31]. Subsequently, we analyzed the cell number and size in mature leaves of the 35S:SlGAMYB1m and wild type lines using scanning electron microscopy (SEM) (Figure 4g). Our findings showed that the leaf epidermal cells of 35S:SlGAMYB1m were larger than those of the wild type (Figure 4h). A comprehensive assessment of cellular composition was achieved by comparing the total cell count with the distribution of leaf epidermal cells of varying sizes (Figure 4g). The proportion of large cells (with an area over 2000 μm2) was higher in 35S:SlGAMYB1m plants, while the number of small cells (with an area under 500 μm2) was significantly reduced (Figure 4i, Appendix A Table A1). However, both cellular density and total cell count were lower in 35S:SlGAMYB1m leaves, indicating a decrease in total cell numbers and suggesting that cell proliferation was inhibited while cell expansion was promoted (Figure 4j,k).
Leaf development is intricately regulated by the cell cycle machinery, with B-type and D-type cyclins playing crucial roles in controlling cell division and expansion, essential for plant growth and development [32,33]. Our molecular analysis uncovered significant alterations in their expression profiles in the developing leaves (Figure 4i–o and Figure A2d–g). Specifically, the expression levels of key cell cycle-related genes [34], including SlCYCB1-1, SlCYCB1-3, SlCYCD3-1, and SlCYCD3-3, were substantially downregulated in 35S:SlGAMYB1m plants compared to wild type (Figure 4i–o). Notably, SlCYCB1-1, SlCYCB1-3, and SlCYCD3-3 exhibited a decrease in expression that reached statistical significance (* p < 0.05), while SlCYCD3-1 displayed an even more pronounced decrease (** p < 0.01). The downregulation of cell cycle-related genes, highlighting the potential role of SlGAMYB1, interferes with normal cell cycle progression, potentially by promoting cell cycle arrest or senescence.

2.4. Overexpression of SlGAMYB1 in Tomato Promotes Flowering and Leads to an Increased Number of Floral Organs

Previous studies highlighted the potential effect of GAMYB on flowering [4]; therefore, the flowering time in the T1 generation of 35S:SlGAMYB1m lines was investigated. Our observations revealed that the first flower opened at 57–62 days after sowing in the progenies of 35S:SlGAMYB1m, preceding the 63–67 days observed in wild-type plants (Figure 5e). Moreover, we counted the number of leaves produced before the first flower appeared in 35S:SlGAMYB1m compared with wild-type plants and found that flowering initiated in 35S:SlGAMYB1m after the emergence of six leaves, whereas the wild type formed seven leaves at flowering (Figure 5f). These findings suggest that SlGAMYB1 can accelerate the transition to flowering in tomato.
In addition to the significant impact on vegetative growth, overexpression of SlGAMYB1 also exerts a profound influence on reproductive development, particularly in the formation of floral organs. To characterize the impact on flower development in 35S:SlGAMYB1m plants, we quantified the number of floral organs at the anthesis stage. The wild type flowers are composed of 5–6 green sepals, alternating with a similar number of yellow petals, about 5–6 yellow stamens forming a staminal cone around the pistil, and 2–3 fused carpels (Figure 5b–d). In contrast, the flowers of 35S:SlGAMYB1m had 7–9 sepals, 7–9 petals, 8–10 stamens, and 4–6 carpels (Figure 5b–d). The marked increase in the number of petals, stamens, and carpels in 35S:SlGAMYB1m compared to the wild type underscores the pivotal role of SlGAMYB1 in controlling organ number during flower development in tomato.
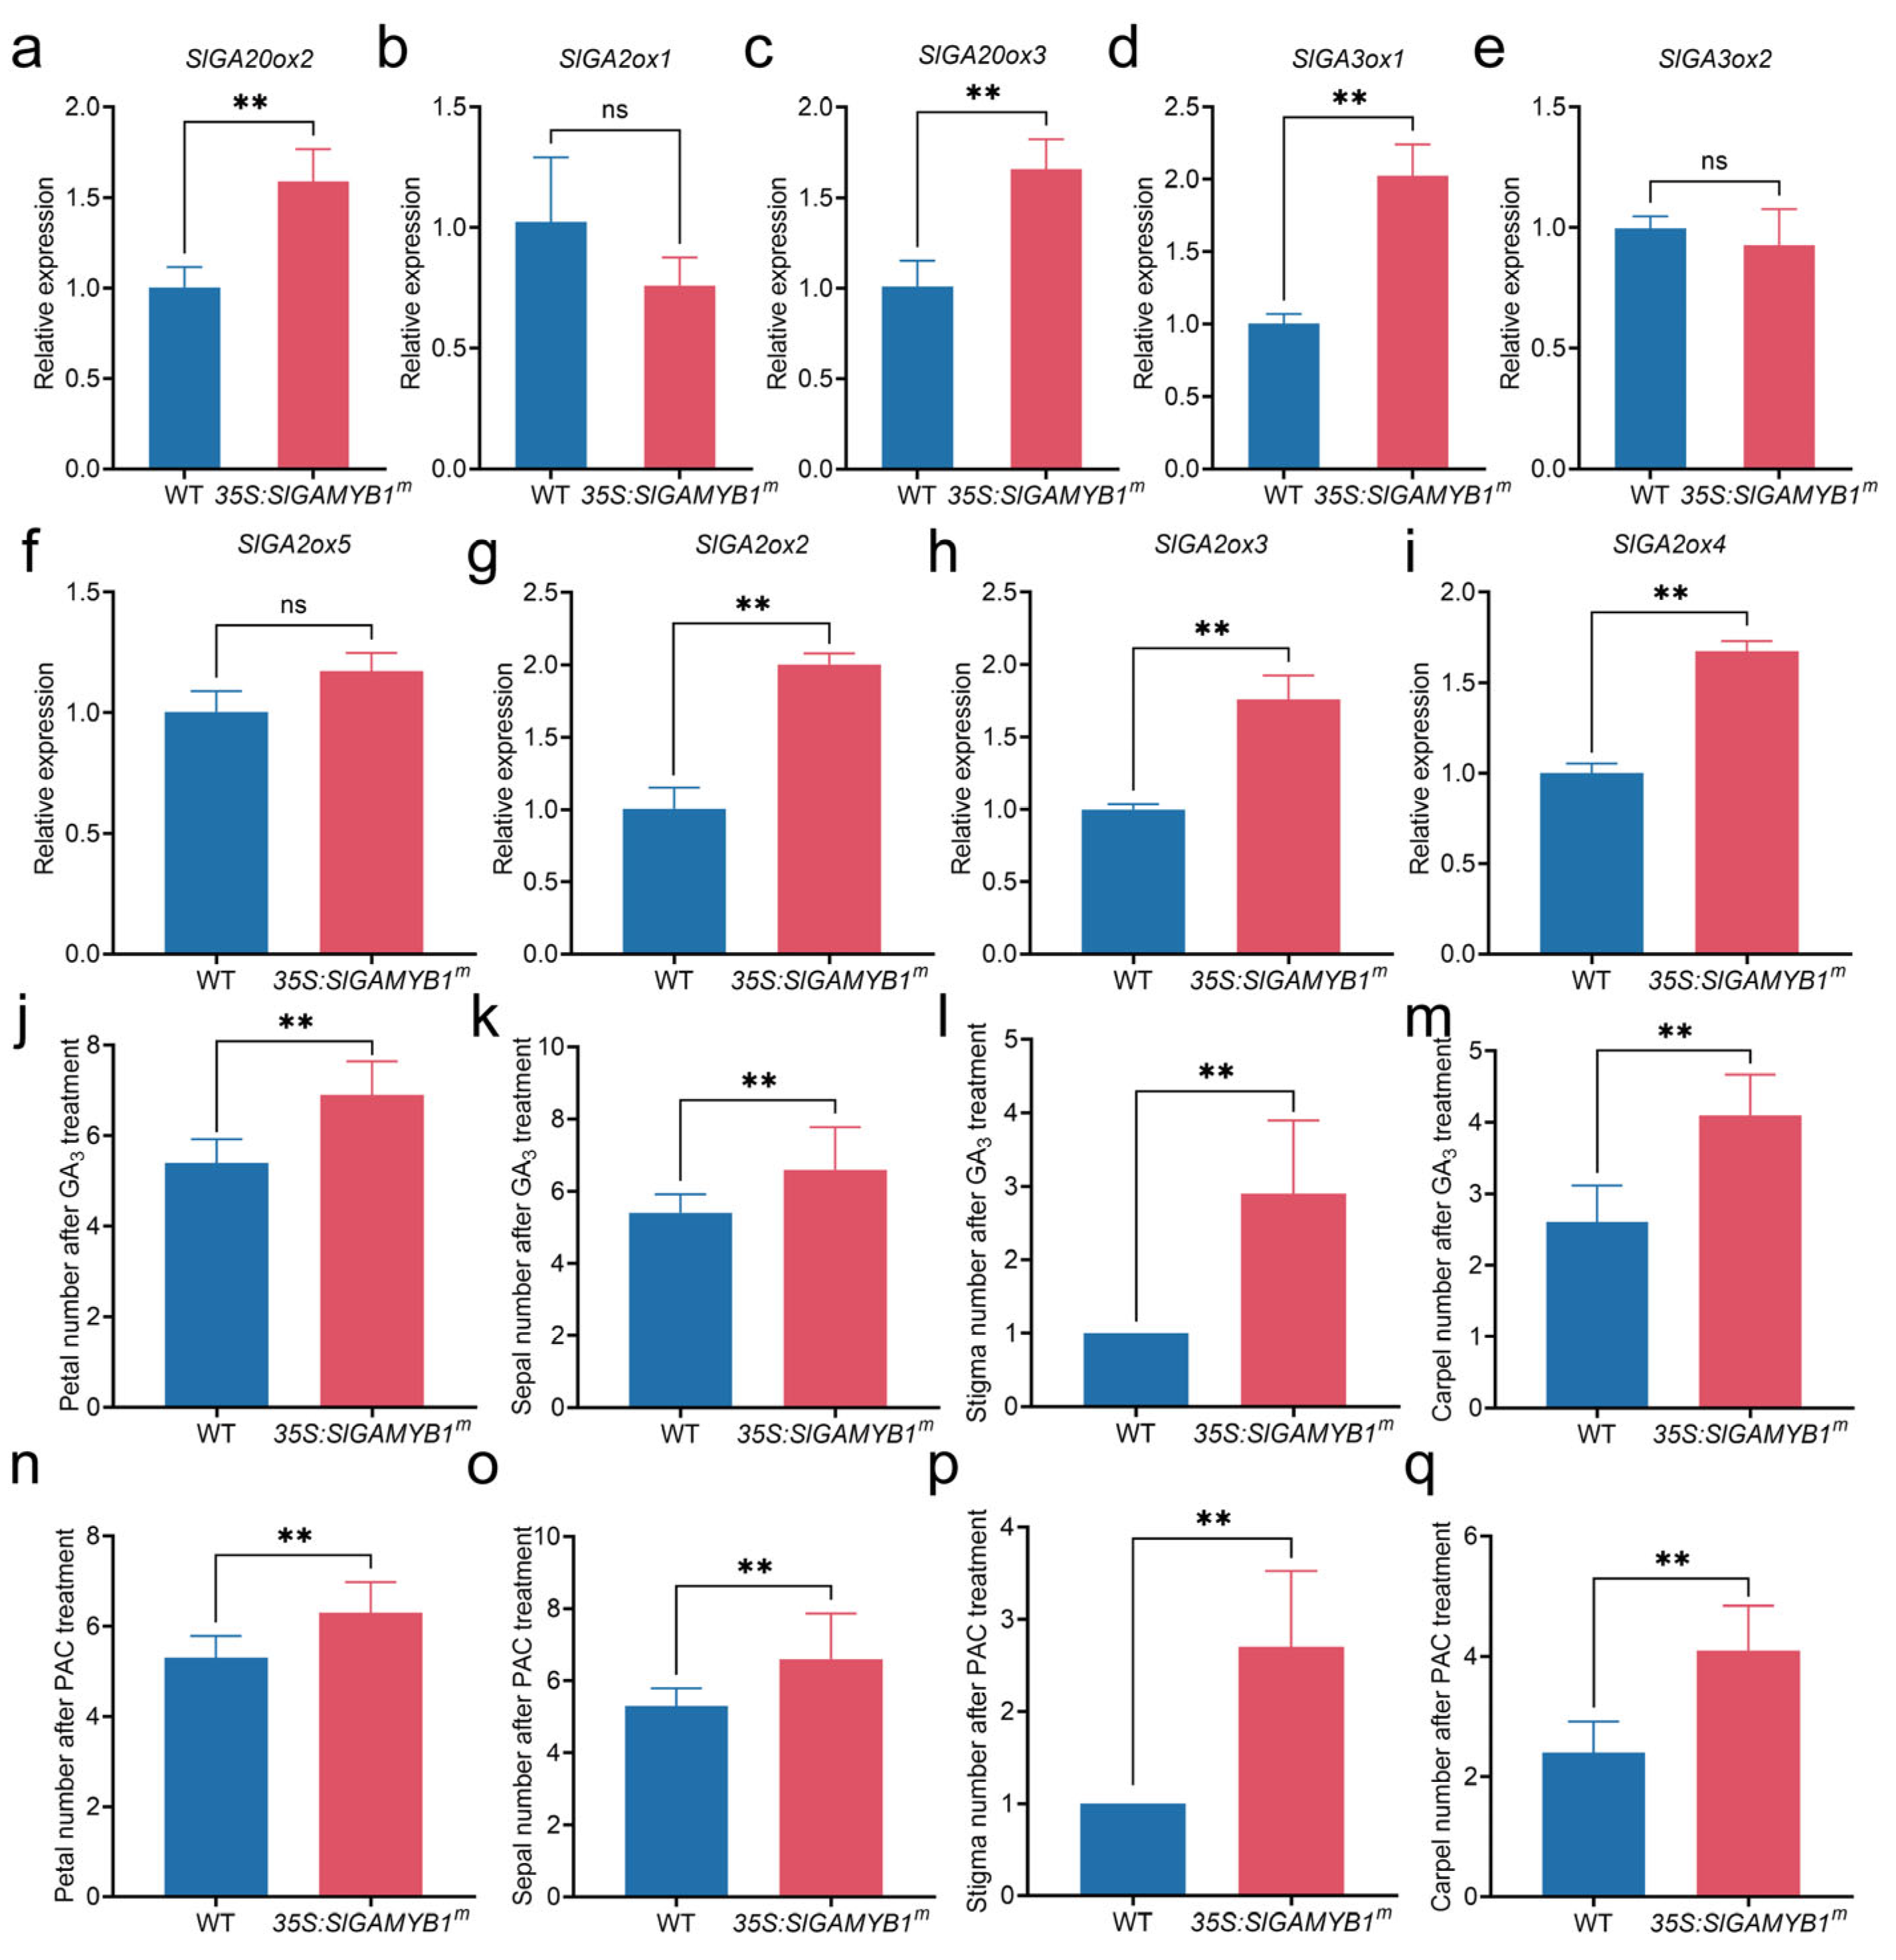
To determine whether the observed floral organ phenotype is mediated by changes in gibberellin (GA) levels, we treated 35S:SlGAMYB1m and wild-type plants with exogenous GA and PAC prior to floral primordium formation. Surprisingly, neither treatment induced significant changes in floral organ number in either genotype (Figure A3), suggesting that SlGAMYB1-mediated floral organ proliferation is largely GA-independent. However, qRT-PCR analysis revealed that 35S:SlGAMYB1m plants exhibit concurrent upregulation of both GA biosynthesis genes (GA20ox, GA3ox) and the GA catabolism gene (GA2ox) (Figure A3). This paradoxical transcriptional response implies that SlGAMYB1 may regulate GA homeostasis rather than simply promoting GA accumulation.
Previous studies have established that mutations affecting floral organ number and fruit locule formation (e.g., fas, lc, and eno) are consistently associated with an enlarged shoot apical meristem (SAM) [35,36]. This correlation strongly suggests that SAM development serves as a critical determinant of organ differentiation patterns in plants, a principle well-documented in Arabidopsis [37,38,39,40]. To investigate whether SlGAMYB1 overexpression influences SAM development in tomato, we analyzed the expression profiles of three key SAM regulatory genes—SlWUS (a promoter of stem cell maintenance), SlCLV3 (a negative regulator of SAM size), and SlTAG1 (a marker of floral meristem identity)—in 35S:SlGAMYB1m lines. Quantitative RT-PCR revealed a striking upregulation of SlWUS (three-fold increase) in 35S:SlGAMYB1m plants compared to wild-type plants (Figure 5k). In contrast, the expression levels of SlCLV3 and SlTAG1 remained statistically unchanged (Figure 5l,m), indicating that SlGAMYB1 specifically targets the SlWUS-mediated pathway. This transcriptional shift mirrors the molecular phenotypes observed in fas and lc mutants, where WUS overexpression leads to SAM expansion and subsequent ectopic organ formation [35,37].

3. Discussion

3.1. Evolutionary Conservation and Functional Diversification of SlGAMYB1 in Tomato

The high level of sequence similarity across the R2R3 DNA-binding domains of GAMYB proteins from various species (Figure 1b) highlights the essential nature of this domain in the structural and functional aspects of these proteins. This conservation reflects a deep evolutionary connection, suggesting a shared ancestry and potentially analogous regulatory roles in plant development and responses to environmental cues. This serves as a testament to the R2R3 domain’s critical importance in the transcriptional machinery of plants, where it likely mediates gene expression in response to various developmental and stress signals.
The distinct branching of GAMYB proteins in the phylogenetic analysis (Figure 1c) implies a potential functional diversification of GAMYB genes within different species. The aggregation of GAMYB proteins from Solanaceae family members into a singular group hints at a shared ancestral lineage and potentially overlapping biological functions. This distinct grouping reinforces their taxonomic relationships and provides insights into their potential roles in the evolutionary trajectory of plant development and adaptation.
The tissue-specific expression dynamics of SlGAMYB1 (Figure 1d), with pronounced expression in reproductive tissues, suggest its role as a regulatory hub in developmental processes, particularly during the reproductive phase in tomato. The significant upregulation of SlGAMYB1 expression during the reproductive phase mirrors the expression profile of SlGAMYB2, suggesting potential parallelism in their regulatory functions [4]. This concordance posits SlGAMYB1 as a significant player in the ontogenetic development of both vegetative and reproductive structures, with a specialized role in the intricate processes underlying floral development.
The coordinated expression of these GAMYB genes may be integral to the precise orchestration of developmental transitions, particularly those leading to the formation and maturation of floral organs. The implications of SlGAMYB1 in these processes are further underscored by its potential to modulate gene networks that are responsive to both endogenous and environmental cues, thereby fine-tuning the floral developmental program in tomato. This study provides a comprehensive analysis of SlGAMYB1, highlighting its potential as a key regulator in tomato development and laying the groundwork for future research into its functional significance in shaping plant development and adaptation.

3.2. SlGAMYB1 Orchestrates GA Homeostasis to Fine-Tune Plant Stature in Tomato

Our study provides evidence that SlGAMYB1 plays a crucial role in regulating plant height by modulating GA metabolism. The 35S:SlGAMYB1m plant presents a dwarf phenotype characterized by reduced plant height and internode length, which is primarily attributed to the inhibition of internode elongation (Figure 2c–f). This phenotype is associated with significant reductions in active GA levels, including GA1, GA4, and GA3 (Figure 3a–c), which are well-known for their roles in promoting internode elongation and plant height [41,42].
The molecular analysis of 35S:SlGAMYB1m lines reveals a coordinated transcriptional reprogramming of GA metabolic genes. Specifically, SlGAMYB1 suppresses the expression of SlGA3ox1, which catalyzes the final step in the synthesis of bioactive GAs, leading to reduced accumulation of GA1, GA4, and GA3 [43]. Concurrently, SlGAMYB1 activates the expression of GA catabolism genes (SlGA2ox1/2/4/5), enhancing the degradation of bioactive GAs. This dual regulatory mode ensures a robust reduction in bioactive GA levels, consistent with the severe dwarfism observed in 35S:SlGAMYB1m plants.
The findings that SlGAMYB1 directly modulates GA biosynthesis and catabolism genes highlight its role as a key transcriptional modulator of GA flux. This regulation ultimately restricts stem elongation, leading to the observed dwarf phenotype. Such bidirectional regulation—curtailing synthesis while accelerating turnover—ensures a robust reduction in bioactive GA levels, consistent with the severe dwarfism observed. Similar mechanisms have been reported in rice, where OsGAMYB suppresses GA3ox2 while inducing GA2ox3 [44], though the specific GA2ox isoforms targeted by SlGAMYB1 in tomato highlight species-specific regulatory divergence.
The downregulation of SlDELLA transcripts in 35S:SlGAMYB1m plants (Figure 3i), despite reduced GA levels, presents an intriguing paradox. This suggests that SlGAMYB1 may directly suppress SlDELLA expression or activate compensatory growth-restricting pathways. The persistence of dwarfism despite SlDELLA downregulation implies the possibility of residual DELLA protein activity, phosphorylation modification of DELLA protein, GA-independent growth limitation, or alternative repressors dominating the phenotype [45,46,47]. These findings reveal a non-canonical layer of GA-height regulation, where SlGAMYB1 orchestrates both GA metabolism and DELLA transcription to fine-tune plant stature.
Understanding the molecular mechanisms by which SlGAMYB1 regulates GA metabolism and plant growth could provide valuable insights for breeding efforts aimed at modulating plant architecture and improving crop yield. Future studies should focus on elucidating the direct interactions between SlGAMYB1 and its target genes, as well as the broader implications of its regulatory role in plant development and adaptation to environmental cues.

3.3. SlGAMYB1 Modulates Leaf Development Through Differential Regulation of Cyclin-Dependent Cell Cycle Progression

Our study provides evidence that SlGAMYB1 exerts a significant influence on leaf development by modulating the expression of critical cell cycle genes, particularly D-type cyclins (Figure 4). The more pronounced effect on cell number compared to cell size underscores the importance of D-type cyclins in controlling cell proliferation [32,33]. This finding is significant as it highlights the potential of SlGAMYB1 as a regulatory factor in determining leaf morphology and cell characteristics.
B-type cyclins, primarily responsible for managing cell division during the G1/S transitions, experienced a slight downregulation in 35S:SlGAMYB1m plants (Figure 4l,m), hinting at possible disruptions in cell division that could result in larger cell sizes due to prolonged cell expansion. This impact on cell size may also be indirect, as these cyclins regulate the timing of endoreduplication entry, further affecting cell dimensions [48,49]. In contrast, D-type cyclins, essential for promoting cell proliferation during the G1 phase by enabling the G1-to-S transition [50,51], showed significant downregulation of SlCYCD3-1 in 35S:SlGAMYB1m plants (Figure 4n), indicating a stronger influence on cell proliferation. The direct involvement of D-type cyclins in initiating DNA replication and cell proliferation makes them pivotal in controlling cell number, thus highlighting their critical role in determining leaf cell count. The more significant downregulation of D-type cyclins compared to B-type cyclins in 35S:SlGAMYB1m plants implies that SlGAMYB1 has a greater impact on cell number than on cell size. This could be due to the direct role of D-type cyclins in promoting cell proliferation, which is a more critical determinant of cell number than cell size. The downregulation of D-type cyclins by SlGAMYB1 could lead to a reduction in the number of cells entering the S phase, thereby affecting cell proliferation and contributing to the observed decrease in cell number per leaf.

3.4. SlGAMYB1 Promotes Floral Organogenesis Through WUS-Mediated Shoot Apical Meristem Regulation Independent of GA Signaling

The overexpression of SlGAMYB1 in tomato significantly promotes flowering and increases the number of floral organs (Figure 5a–j), suggesting a crucial role in reproductive development. The acceleration of flowering and the increase in floral organ number in 35S:SlGAMYB1m plants indicate that SlGAMYB1 may regulate floral organogenesis by influencing the shoot apical meristem (SAM) [35,36]. The upregulation of SlWUS (Figure 5k), a key regulator of stem cell maintenance, in 35S:SlGAMYB1m plants suggests that SlGAMYB1 may enhance stem cell proliferation, leading to an enlarged SAM and increased floral organ number [37,38,39,40].
The lack of significant changes in floral organ number upon GA and PAC treatment (Figure A3) implies that SlGAMYB1-mediated effects on floral organ proliferation are largely independent of GA signaling. This is further supported by the concurrent upregulation of both GA biosynthesis and catabolism genes in 35S:SlGAMYB1m plants, indicating that SlGAMYB1 may modulate GA homeostasis rather than simply promoting GA accumulation.
The selective upregulation of SlWUS in 35S:SlGAMYB1m lines provides mechanistic insight into how SlGAMYB1 may influence fruit morphology. As a central regulator of stem cell proliferation, WUS is known to establish a positive feedback loop with CLV3 to maintain SAM homeostasis [38,39]. Our finding that SlCLV3 expression remains unaltered despite SlWUS induction suggests two non-exclusive possibilities: SlGAMYB1 may bypass the canonical WUS-CLV3 feedback loop, potentially through direct transcriptional activation of SlWUS, or the temporal dynamics of CLV3 repression may be delayed relative to WUS activation, as reported in Arabidopsis inflorescence meristems [52].
The phenotypic parallels between 35S:SlGAMYB1m plants and fas/lc mutants further support the hypothesis that SlGAMYB1 acts upstream of SAM size determination. Notably, the lack of SlTAG1 expression changes implies that SlGAMYB1-mediated effects are distinct from pathways governing floral meristem identity, instead focusing on stem cell pool expansion. This specificity aligns with studies showing that WUS overexpression alone is sufficient to drive multilocular fruit formation without altering floral organ identity genes [36]. The uncoupling of SlWUS activation from SlCLV3 repression could confer developmental plasticity under environmental stresses where transient SAM expansion is advantageous. From a breeding perspective, targeted manipulation of SlGAMYB1 expression might offer a tunable strategy to modulate locule number—a key yield-associated trait—without pleiotropic effects on floral architecture. Future work should explore whether SlGAMYB1 physically interacts with the SlWUS promoter and how this pathway integrates with hormonal signals (e.g., auxin) known to regulate SAM activity.

4. Materials and Methods

4.1. Sequence Alignment and Phylogenetic Analysis

The amino acid sequences of related GAMYB proteins in various species were obtained from the Solanaceae Genomics Network (http://www.solgenomics.net) and National Center for Biotechnology Information (http://www.ncbi.nlm.nih.gov) database (Appendix A Table A3). Then, multiple-sequence alignment was carried out using MEGA11 software, and boxes highlighting conserved sequences were drawn using the online software ESPript 3.0 “https://espript.ibcp.fr/ESPript/cgi-bin/ESPript.cgi (accessed on 17 November 2024)”. The phylogenetic analysis was conducted via the neighbor-joining method with MEGA11, and bootstrapping was performed with 1000 replications.

4.2. Plant Materials and Growth Conditions

Tomato (Solanum lycopersicum cv Micro-Tom) was used in this study. The seeds were germinated on wet filter paper in a petri dish at 28 °C in the dark for 2 days. Then the resulting seedlings were grown in a greenhouse under a 16-h light, 8-h dark photoperiod with temperatures of 25 °C/18 °C in day/night. Water management and pest control were meticulously executed in accordance with established protocols.

4.3. Vector Construction and Plant Transformation

To generate 35S:SlGAMYB1m, the coding region sequence of a Sly-miR159-resistant form of SlGAMYB1 was amplified using primers containing BamH I and Sal I sites and then inserted into the PBI121 vector. Then the construct was introduced in tomato (Solanum lycopersicum cv Micro-Tom) using the Agrobacterium tumefaciens-mediated transformation [53]. The presence of the transgene in each transgenic line was verified in the first generation of transformation (T0) using PCR. Furthermore, the increased expression of SlGAMYB1 was confirmed in 35S:SlGAMYB1m transgenic lines using qRT-PCR. Primers for PCR and qRT-PCR analyses are listed in Appendix A Table A2.

4.4. RNA Extraction and Quantitative Real-Time PCR (qRT-PCR) Analysis

Total RNA was extracted from various tissues of wild type and different transgenic tomato plants (details in the results and figures) using Trizol reagent (Thermo Scientific, Waltham, MA, USA) according to the manufacturer’s protocol. The quantity and quality of RNA were estimated using a NanoDrop 2000 spectrophotometer (Thermo Scientific, Waltham, MA, USA). After removing genomic DNA with DNaseI, the first-strand cDNA was synthesized using a TAKARA first-strand cDNA synthesis kit (TaKaRa, Japan). Quantitative real-time PCR (qRT-PCR) was performed with SYBR Green detection on Bio-Rad CFX96 (Bio-Rad, Hercules, CA, USA). Relative gene expression was analyzed using the 2−ΔΔCt method [54] from three biological replicates. Tomato ACTIN (Solyc11g005330) was used as the internal control for quantitation of mRNA. Primers used for reverse transcription and qRT-PCR are listed in Appendix A Table A2.
For the evaluation of reference gene stability assay, four candidate reference genes (ACTIN, UBI, EF-1α, and TUB) were selected using the BestKeeper algorithm [27]. qRT-PCR was performed in triplicate on a Bio-Rad CFX96 system with SYBR Green Master Mix. The amplification efficiency (90–110%) and specificity of each primer pair (Appendix A Table A2) were validated via standard curves and melt curve analysis. BestKeeper calculates gene stability based on the standard deviation (SD) and coefficient of variation (CV) of cycle threshold (Ct) values across samples. Lower SD/CV values indicate higher stability. Among the tested genes, ACTIN exhibited the highest stability (BestKeeper index = 0.657), followed by UBI, EF-1α, and TUB. Consequently, ACTIN was selected as the internal control for subsequent qRT-PCR analyses.

4.5. Plant Height Analyses

To characterize the dwarf phenotype, plant height, internode number, and internode length were measured for 6-week-old seedlings of all the lines (35S:SlGAMYB1m and wild type). Each line was represented by nine plants to ensure statistical reliability. Plant height was determined by measuring the vertical distance from the soil surface to the shoot apex. The internode count was initiated by designating the first internode as the one situated between the cotyledons and the first true leaf of the main stem. The number of internodes was recorded from the cotyledon to the top of the main stem. Additionally, the length of each individual internode was meticulously recorded to provide a detailed analysis of the plant’s growth pattern. Plant height was measured using digital calipers (Mitutoyo, ±0.01 mm accuracy), with three technical replicates per measurement.

4.6. Gibberellin Quantification and GA3/Paclobutrazol (PAC) Treatment

About 1 g of stems from wild type and 35S:SlGAMYB1m were harvested before anthesis (30 days after seed germination) and sent to the facilities in Wuhan Metware Biotechnology Co., Ltd. (Wuhan, 430070, China) for GA quantification. GAs were extracted from three independent pools of ovaries and analyzed based on the published protocols using a mass spectrometer [55,56].
For the gibberellic acid (GA3) and paclobutrazol (PAC) treatments, a 10 mL solution of 0.1 mM GA3, 0.1 mM PAC (with a purity of ≥95.0%, sourced from Sigma-Aldrich, Darmstadt, Germany), or a control solution consisting of 0.095% ethanol, was applied directly to the roots of 15-day-old plants (n = 10 per treatment group, randomized block design). This treatment was administered every ten days, with regular watering maintained throughout the interim periods. Three independent biological replicates were performed (total N = 30 plants per treatment across replicates). Plant height was measured using digital calipers (Mitutoyo, ±0.01 mm accuracy), with three technical replicates per measurement. Floral organ counts were conducted at the anthesis stage (n = 10 flowers per treatment group, randomly selected).

4.7. Scanning Electron Microscopy (SEM)

The transition zones of mature leaves were prepared for SEM observation as described [57]. Briefly, the transition zones were hand-dissected and fixed in 2.5% (w/v) glutaraldehyde in 0.1-M cacodylate (pH 7.4) buffer and stored in 70% ethanol. Subsequently, tissue dehydration was carried out through a graded ethanol series, escalating from 70% to 100%, after which the samples were subjected to critical point drying using a Bal-Tec CPD030 apparatus (Leica Microsystems, Wetzlar, Germany). This process involved the substitution of water with liquid CO2, which was subsequently evaporated at the critical point for CO2, effectively removing all liquid without causing damage to the sample’s morphology. Following dehydration, the samples underwent gold coating in a Bal-Tec SCD005 Sputter Coater (BalTec, Pfäffikon, Switzerland) to enhance conductivity and resolution. The coated samples were then examined using a Hitachi S-3500N scanning electron microscope (Hitachi, Tokyo, Japan) operated at an acceleration voltage of 10 kV. For quantitative analysis, the dimensions and number of leaf cells were determined using the ImageJ (Version 1.46r) software (https://imagej.net/ij/). Cells were categorized by size, and their distribution was determined relative to total cell counts. Cell density was calculated by dividing the total number of cells by the measured leaf area. Statistical analysis was performed using a Student’s t test to assess significance, with data presented as mean ± standard error from three biological replicates.

5. Conclusions

This study elucidates the diverse regulatory roles of SlGAMYB1 in tomato development, demonstrating its dual impact on vegetative and reproductive processes. Through GA-mediated pathways, SlGAMYB1 controls plant architecture by reducing height and internode length while simultaneously regulating leaf morphology via cell cycle modulation. Significantly, SlGAMYB1 enhances floral organ number and accelerates flowering through WUS-mediated SAM expansion, independent of GA signaling. These findings establish SlGAMYB1 as a central coordinator of developmental transitions, offering novel genetic targets for improving tomato architecture and yield potential through molecular breeding strategies.

Author Contributions

F.Z., F.W., T.H. and P.Z. designed the study, conducted experiments, analyzed and interpreted data, and drafted the article. F.Z., F.W., Z.C. and P.Z. conducted experiments, analysis, and interpretation of data. F.Z., F.W., T.H. and P.Z. conducted bioinformatics analysis. F.Z., P.Z. and T.H. wrote the manuscript. All authors have read and agreed to the published version of the manuscript.

Funding

This project was supported by the Guangdong Basic and Applied Basic Research Foundation (2023A1515010498 and 2023A1515111186).

Data Availability Statement

The original contributions presented in this study are included in the article. Further inquiries can be directed to the corresponding author.

Acknowledgments

We thank the Instrumental Analysis Center of Shenzhen University (Lihu Campus) and Central Research Facilities of the College of Life Sciences and Oceanography for helping us with the experiments.

Conflicts of Interest

The authors declare that they have no known competing financial interests or personal relationships that could have appeared to influence the work reported in this paper.

Abbreviations

The following abbreviations are used in this manuscript:
GAGibberellin
PACPaclobutrazol
SEMScanning electron microscopy
qRT-PCRQuantitative real-time PCR
GA1/3/4Gibberellic acid (bioactive GA form)
LC-MSLiquid chromatography–mass spectrometry
ORFOpen reading frame
UTRUntranslated region
NJNeighbor-joining
SAMShoot apical meristem
SEMStandard error of the mean
ANOVAAnalysis of variance

Appendix A

Figure A1. Stability analysis of reference genes. (a) Stability assessment of candidate reference genes using BestKeeper. Lower values indicate higher stability, with genes ranked from most stable (ACTIN) to least stable (TUB). (b) Threshold cycle (Ct) values of candidate reference genes. Lower Ct values correlate with higher expression levels, ordered from highest (EF-1a) to lowest (ACTIN). Data represent mean values from technical replicates. The thick dashed line represents the median (50th percentile), indicating the central tendency of the data. The thin dashed lines denote the first (25th percentile) and third (75th percentile) quartiles, reflecting the variability and spread of the data.
Plants 14 01613 g0a1
Figure A2. Relative expression levels of SlGA20ox2, SlGA20ox3, SlGA3ox2, SlCYCB1-2, SlCYCB1-4, SlCYCD3-2 and SlCYCD3-4 in wild type (WT) and 35S:SlGAMYB1m plants. (ac) Relative expression levels of SlGA20ox2 (a), SlGA20ox3 (b), and SlGA3ox2 (c) in WT and 35S:SlGAMYB1m stems. (dg) Relative expression levels of SlCYCB1-2, SlCYCB1-4, SlCYCD3-2, and SlCYCD3-4 in WT and 35S:SlGAMYB1m leaves. Error bars represent SEM (n = 3 in (ag)). Asterisks indicate a significant difference from the WT control (ns p > 0.05; Student’s t test), where ns indicates no significant difference between the groups.
Plants 14 01613 g0a2
Figure A3. SlGAMYB1 regulates floral organ number independently of gibberellin (GA) signaling. (ai) Expression levels of GA biosynthesis pathway genes in WT and 35S:SlGAMYB1m meristem. The tomato ACTIN gene was used as the internal control. (jm) Effects of GA3 treatments on petal number (j), sepal number (k), stigma number (l), and carpel number (m) in WT and 35S:SlGAMYB1m plants. (nq) Effects of PAC treatments on petal number (n), sepal number (o), stigma number (p), and carpel number (q) in WT and 35S:SlGAMYB1m plants. Error bars represent SEM (n = 3 in (aq)). Asterisks indicate a significant difference from the WT control (ns p > 0.05 and ** p < 0.01; Student’s t test).
Plants 14 01613 g0a3
Table A1. The proportion of cells of different sizes.
Different Sizes of CellWT35S:SlGAMYB1m
<500 μm21.65%0.43%
500–1000 μm212.40%14.22%
Table A2. List of primers used in this study.
GenePrimer NameSequencePurpose
SlGAMYB1SlGAMYB1-qFGAGATTAAGCAAGAGATTGGCGqRT-PCR
SlGAMYB1SlGAMYB1-qRAACCAAAAGGATCTTTCGAAGCqRT-PCR
ActinActin-FTGTTGCTATTCAGGCTGTGCqRT-PCR
ActinActin-RCTGCTCCTGGCAGTTTCAATqRT-PCR
SlGAMYB1PBI-SlGAMYB1m-F1ATGAGCATCAAAAGTGAAACCOverexpression
SlGAMYB1PBI-SlGAMYB1m-R1TCATAATCTCATTCTTCCTGTTGOverexpression
SlGAMYB1PBI-SlGAMYB1m-F2CAGAGCCCACATGGGCAATGAAGCTGGAACTACCGTCCTTACAAAACCAGACAGAGAACOverexpression
SlGAMYB1PBI-SlGAMYB1m-R2TAAGGACGGTAGTTCCAGCTTCATTGCCCATGTGGGCTCTGAAGAGGAGTTGCCATTTAOverexpression
SlGAMYB1SlGAMYB1-qFGAGATTAAGCAAGAGATTGGCGqRT-PCR
TUBTUB-FTTGGTTTTGCACCACTGACTTCqRT-PCR
TUBTUB-RAAGCTCTGGCACTGTCAAAGCqRT-PCR
EF-1αEF-1α-FATTGGAAATGGATATGCTCCAqRT-PCR
EF-1αEF-1α-RTCCTTACCTGAACGCCTGTCAqRT-PCR
UBIUBI-FTCGTAAGGAGTGCCCTAATGCTGAqRT-PCR
UBIUBI-RCAATCGCCTCCAGCCTTGTTGTAAqRT-PCR
SlCycB1-1SlCycB1-1-FCTGGTTTCTCAGAGTCTCAAGTqRT-PCR
SlCycB1-1SlCycB1-1-RACCTTAAGCTTGTGATTTGCAGqRT-PCR
SlCycB1-2SlCycB1-2-FGGACAGTTGGAGTGGTACTTAAqRT-PCR
SlCycB1-2SlCycB1-2-RGCATAATTCATCAGCCCCAATTqRT-PCR
SlCycB1-3SlCycB1-3-FGGCTGATGAACTACACTACTGTqRT-PCR
SlCycB1-3SlCycB1-3-RAACTTCCTATAAACCGCCTTCAqRT-PCR
SlCycB1-4SlCycB1-4-FGCTGCGGATGTTGATAATCATTqRT-PCR
SlCycB1-4SlCycB1-4-RTGTAGTCATTCACTCGACCTTCqRT-PCR
SlCycD3-1SlCycD3-1-FCTGTTTTTGAGAATCGAGTCCGqRT-PCR
SlCycD3-1SlCycD3-1-RTCATCCTCTAACAAATCACCCCqRT-PCR
SlCycD3-2SlCycD3-2-FCTCTGCTCAAACTGCAATTCTTqRT-PCR
SlCycD3-2SlCycD3-2-RTGGGTCTCTTCAATTTTTGCAGqRT-PCR
SlCycD3-3SlCycD3-3-FGGAAGAAGAAGAACTTACCTCTCTqRT-PCR
SlCycD3-3SlCycD3-3-RACTGCAAGAAATCCAGTTTGAGqRT-PCR
SlCycD3-4SlCycD3-4-FTACTGCTACCACTGCTGTTTTAqRT-PCR
SlCycD3-4SlCycD3-4-RCTGACTCATCCAAGGCTTATCTqRT-PCR
SlCycD3-5SlCycD3-5-FATGTGACATGTTCTGGGAAGATqRT-PCR
SlCycD3-5SlCycD3-5-RCTAACACAGCAGTCAAAGCATTqRT-PCR
SlCycD3-6SlCycD3-6-FCCAAAGTATGTGTTTGAGGCAAqRT-PCR
SlCycD3-6SlCycD3-6-RGGTGTCACTGGATTCATTTTCCqRT-PCR
SlCycD3-7SlCycD3-7-FAGATGAGGGAGATTTGGGAGGAqRT-PCR
SlCycD3-7SlCycD3-7-RTCTTAACCCCAACAAAACCCCAqRT-PCR
SlGA20ox2RT-SlGA20ox2-FGTGATCCGATTGCAGCTAAGCGqRT-PCR
SlGA20ox2RT-SlGA20ox2-RACCGATGTGCAAGTGAGATAAGqRT-PCR
SlGA20ox3RT-SlGA20ox3-FCTAGTGTTACTAGAGAACTACAqRT-PCR
SlGA20ox3RT-SlGA20ox3-RTGTCAACCCATGGTTAACCACqRT-PCR
SlGA3ox1RT-SlGA3ox1-FGAATCCCATGCATGGAATCATqRT-PCR
SlGA3ox1RT-SlGA3ox1-RTGTTATCGAGGTCGATCACTGGqRT-PCR
SlGA3ox2RT-SlGA3ox2-FATTGGACGACGATGGATCGCGqRT-PCR
SlGA3ox2RT-SlGA3ox2-RGCATGCATGGCCAATTGTATCCqRT-PCR
SlGA2ox1RT-SlGA2ox1-FCATAGTGAAAGCCTCTGAAGqRT-PCR
SlGA2ox1RT-SlGA2ox1-RCAACTTCACCATTATCTCCAqRT-PCR
SlGA2ox2RT-SlGA2ox2-FCTCATCGTTAATGCCTGCGAAGqRT-PCR
SlGA2ox2RT-SlGA2ox2-RACTTGATGGCTTCGGATTCGAGqRT-PCR
SlGA2ox4RT-SlGA2ox4-FCTCATCGTTAATGCCTGCGAAGqRT-PCR
SlGA2ox4RT-SlGA2ox4-RGATCAGCAGGCCCTGCCTTTAGqRT-PCR
SlGA2ox5RT-SlGA2ox5-FGAACCTCATCGTTGAGGCCTGCqRT-PCR
SlGA2ox5RT-SlGA2ox5-RGATGGCTTCGGATTCGAGTTTACqRT-PCR
DELLART-DELLA-FCGATGGTTACAGGGTGGAAGAAqRT-PCR
DELLART-DELLA-RCAGGCGGAGGTAGCTATAAGTGqRT-PCR
Table A3. Amino acid sequences of related GAMYB proteins in various species used in this study.
ProteinSpeciesAmino Acid Sequences
SlGAMYB1Solanum lycopersicumMSIKSETEERMTSKVDMDSPDEASGGDLGESVPLKKGPWTSAEDVILVDYVMTHGEGNWNAVQRHSGLARCGKSCRLRWANHLRPDLKKGAFTPEEEQRIVELHAKMGNKWARMAVELPGRTDNEIKNYWNTRIKRRQRAGLPIYPADISFMASQNKQNEELGAFSSADAQNPDVLGINNFEIPAVEFKKLELTHLLYPPQLADIPARSLLNDPVSNFLSQGHRAPYSSTYFLSTTYPAKRIRGSESVFSGSNGDLLNSLQYQNDGSLLAQAQAQPLDFSSYNHNLTYDDQRAISNIVPGGHAYLNGNSSSEPTWAMKLELPSLQNQTENWGSPHSALPSLDSVDILIQSPPAGHSESGSLSPSNSGLLDAVLHESQTMKASNDNSYQGNETSGNAVNNSCPDLKGCDIYGHPVSPLSQFSASVFSDYAPINESSLHEFPSMATMPGGEIKQEIGDLSPLDDEDNTSNQTIFSSPKTQHANNHLASKDPFGSCFFDDCDWDCKQIHAVTTSSGQANGHNSCSWDAISAMEATGRMRL
SlGAMYB2Solanum lycopersicumMSMTSESDDRMTSQDGVDSPSAEEACGGGNTGGGLPLKKGPWTSAEDAILVEYVTKHGEGNWNAVQKHSGLARCGKSCRLRWANHLRPDLKKGAFTPEEERHIIELHAKMGNKWARMAAELPGRTDNEIKNYWNTRIKRRQRAGLPIYPSDICFQSITENKQNEELGTFSSADSQYPDFFPMNYEIPAVEFKRLEFNQHLCPPALLDIPTGGILDIPGRSLLAQGLNSAYYSRSFLSTTP
AtMYB33Arabidopsis thalianaPAKRIRGSESLFSGLNGDCSPSKNDVSFSTCHQHQDDGSLLAQSMGFSSSFNQNLTSDYHPSSLGVIPGSHALLNGHTSSSEPSWAKKLELPSLQSTIASWGLVTSPLPSLDSVDTLIQSPPTEHTESCNLSPRNSGLLDAVLHESQTMKASKSILHQENSGDVVDNSCPDLHMTEWGQHGDPISPLGHSAASVFSEYTPTSGSSSEEPQLVTMPACKVKQEKFDYGPYDGKDDASNLICPRPDFLLESNCFGHMQNTVRSIWY
AtMYB65Arabidopsis thalianaMSYTSTDSDHNESPAADDNGSDCRSRWDGHALKKGPWSSAEDDILIDYVNKHGEGNWNAVQKHTSLFRCGKSCRLRWANHLRPNLKKGAFSQEEEQLIVELHAKMGNRWARMAAHLPGRTDNEIKNYWNTRIKRRQRAGLPLYPPEMHVEALEWSQEYAKSRVMGEDRRHQDFLQLGSCESNVFFDTLNFTDMVPGTFDLADMTAYKNMGNCASSPRYENFMTPTIPSSKRLWESELLYPGCSSTIKQEFSSPEQFRNTSPQTISKTCSFSVPCDVEHPLYGNRHSPVMIPDSHTPTDGIVPYSKPLYGAVKLELPSFQYSETTFDQWKKSSSPPHSDLLDPFDTYIQSPPPPTGGEESDLYSNFDTGLLDMLLLEAKIRNNSTKNNLYRSCASTIPSADLGQVTVSQTKSEEFDNSLKSFLVHSEMSTQNADETPPRQREKKRKPLLDITRPDVLLASSWLDHGLGIVKETGSMSDALAVLLGDDIGNDYMNMSVGASSGVGSCSWSNMPPVCQMTELP
OsGAMYBOryza salivaMSYTTATADSDDGMHSSIHNESPAPDSISNGCRSRGKRSVLKKGPWTSTEDGILIDYVKKHGEGNWNAVQKHTSLARCGKSCRLRWANHLRPNLKKGAFSQEEEQLIVEMHAKMGNKWAQMAEHLPGRTDNEIKNYWNTRIKRRQRAGLPLYPPEIYVDDLHWSEEYTKSNIIRVDRRRRHQDFLQLGNSKDNVLFDDLNFAASLLPAASDLSDLVACNMLGTGASSSRYESYMPPILPSPKQIWESGSRFPMCSSNIKHEFQSPEHFQNTAVQKNPRSCSISPCDVDHHPYENQHSSHMMMVPDSHTVTYGMHPTSKPLFGAVKLELPSFQYSETSAFDQWKTTPSPPHSDLLDSVDAYIQSPPPSQVEESDCFSSCDTGLLDMLLHEAKIKTSAKHSLLMSSPQKSFSSTTCTTNVTQNVPRGSENLIKSGEYEDSQKYLGRSEITSPSQLSAGGFSSAFAGNVVKTEELDQVWEPKRVDITRPDVLLASSWLDQGCYGIVSDTSSMSDALALLGGDDIGNSYVTVGSSSGQAPRGVGSYGWTNMPPVWSL
CaGAMYB1Capsicum annuumMYRVKSSDCDMIHMDSVADDGSSGGSHRGGGKKGWTSADAIVDYVKKHGGNWNAVKNTGRCGKSCRRWANHRNKKGATARIIHSKMGNKWARMAAHGRTDNIKNYWNTRIKRCRAGIYTSVCNSSNDCSSDDCGNSNDNANGYDTCDNIANSAYAHSAVSISNGSASKSCSMDVNTGMKSDGVGSDTINGVISSVDSNDSKKAVGDYHANSTSKIIAGGANGSHANGNSASRTSGKMSDTSDNSWKYTVAATVDYSAATSVKSCASRNSGIHATRSGKNTSVISSSSSVGTCNTTVSDMCYWHGNDCASGNSTSTVSAASDISKVSASTSMGSGVMGKYGDTSHNRDASGNTADSVNNAIAMGNDSIDCRVGDGIMNSSSWSNMHACMSK
CaGAMYB2Capsicum annuumMSITSETDDMMTSKVDIDSPDEASGGESVPLKKGPWTTVEDAILVDYVMTNGEGNWNAVQRHSGLARCGKSCRLRWANHLRPDLKKGAFTPEEERRILELHAKMGNKWARMAAELPGRTDNEIKNYWNTRIKRRQRAGLPVYPPDISFLANQNKQNEELGAFSSVDAQNSNVLGINNFEIPAVEFKNLQLDHLLYPPPLGEIPAVSSFLAQGHRAPYGSTYLLSTMHPSKRIRGSESMFSGSNGDLLLSSSQYHNGGSLLAQPLGFSSYNHHLTYDDDRSFSSVVHGGHACLNGNSSSSEPTWAMKLELPSLQNQTANWGSPPSPLPSLESDDILIQSPPAGNSESGSLSPSNSGLLDAVLYESQTMKASNDNSHQGKETSGDAVNKGWESYGDPVSPLHHFSASVFGEYTPVNGSSLHEFPSVATMPGCKIKKEIGDLAPLDENDDSLNQTIFSSPKTQHAKNSLALKEVISSGFFDDCGWDCKQIRAVATSSGQACGRSSWDAMSAV
CsGAMYB1Cucumis sativusMSMTSESDDRMASQDGVDSPSVEEACGGGITGGGLPLKKGPWTSAEDAILMDYVTKHGEGNWNAVQKHSGLARCGKSCRLRWANHLRPDLKKGAFTPEEERRIIELHAKMGNKWARMAAELPGRTDNEIKNYWNTRIKRRQRAGLPIYPPDISFQAISENKQNEELGAFSSTDSQYPDFLPMNNFEIPAVEFKRLEFNKQLCPPALLDIPNGGILDIPGRSLLAQGLNSAYYSRSFLSTMPPAKRIRGAESLFSGLNGDCSPSKNEGSFPTCHQYQDDGSLLAQSMGFSSSFNQNLTSVHHPSSSGVIPGSHAPLNGKTSSSEPLWAEKLELPSFQSQMASWGLSSSPLPSLESVDTVIQSPPTEHTESCNLSPRNSGLLDAVLYESQTMRASKSILHQENSGDVVDNSCPDLHETGWETYGDPISPLGHSAASVFSEYTPTSGSSPEEPQLVTMPGCKVKQEKFDFGPYDGKEDASDLIFSRPDYLLESNCFGHMQKTARSIWH
HvGAMYBHordeum vulgareMRHPKNEIEDNLPSQDQTLSPLLDEDSGGNASGIILKKGPWTSAEDEILIEYVKKHGEGNWNAVQKHSGLSRCGKSCRLRWANHLRPNLKKGAFTAEEEHLIIELHAKMGNKWARMAGHLPGRTDNEIKNYWNTRIKRRQRAGLPLYPPEVCLRTWQALQQTQDSGGSTVVDTDHHDLLRSNSYDIPDVTFHSLKPQSALSYMPELPDISSCMLKRGLDTSQYCNLVQPTFHRQKRFRDSASLFPGPDGSVKTPFHQFEDNSYSQAAQSFGTPFAHESNPTTKNAMSFGSFEGSHSLTNGNSSASQHSKETEKLELPSLQYPETDLTSWDTTIQPAMFESVDPFIQSTPTFVLAPDRTSPCHSGLLESLVYSKTMGPKNHPSDKNSNSCSVTPGDVTDSYNMAASKTEIDDYTEVISPFGHSTSSLFSECTPISATGSSYEDPTLTEAFSGSHVKSEPFDHAWTPDREKAAKSRVNFARPDALLASDWHDRSSGIVEDTTNVTDAISLLLGDDLAADYEHFPNGISTTHSAWGLDSCSWNNMPAVCHMSDLP

References

  1. Shi, B.H.; Felipo-Benavent, A.; Cerutti, G.; Galvan-Ampudia, C.; Jilli, L.; Brunoud, G.; Mutterer, J.; Vallet, E.; Sakvarelidze-Achard, L.; Davière, J.M.; et al. A quantitative gibberellin signaling biosensor reveals a role for gibberellins in internode specification at the shoot apical meristem. Nat. Commun. 2024, 15, 3895. [Google Scholar] [CrossRef] [PubMed]
  2. Li, S.; Tian, Y.H.; Wu, K.; Ye, Y.F.; Yu, J.P.; Zhang, J.Q.; Liu, Q.; Hu, M.Y.; Li, H.; Tong, Y.P.; et al. Modulating plant growth-metabolism coordination for sustainable agriculture. Nature 2018, 560, 595–600. [Google Scholar] [CrossRef] [PubMed]
  3. Wang, M.; Li, A.M.; Pan, Y.Q.; Chen, Z.L.; Qin, C.X.; Su, Z.L.; Lakshmanan, P.; Song, J.M.; Liao, F.; Huang, D.L. Gibberellin biosynthesis gene ScGA20 oxidase enhances sugarcane growth by modulating genes associated with phytohormone and growth processes. Plant Physiol. Bioch. 2025, 221, 109652. [Google Scholar] [CrossRef] [PubMed]
  4. Zhang, Y.; Zhang, B.; Yang, T.; Zhang, J.; Liu, B.; Zhan, X.; Liang, Y. The GAMYB-like gene SlMYB33 mediates flowering and pollen development in tomato. Hortic. Res. 2020, 7, 133. [Google Scholar] [CrossRef]
  5. Chai, Z.; Fang, J.L.; Yao, W.; Zhao, Y.; Cheng, G.Y.; Akbar, S.; Khan, M.T.; Chen, B.S.; Zhang, M.Q. ScGAIL, a sugarcane N-terminal truncated DELLA-like protein, participates in gibberellin signaling in Arabidopsis. J. Exp. Bot. 2022, 73, 3462–3476. [Google Scholar] [CrossRef]
  6. Wu, X.Y.; Xia, M.; Su, P.; Zhang, Y.F.; Tu, L.C.; Zhao, H.; Gao, W.; Huang, L.Q.; Hu, Y.T. MYB transcription factors in plants: A comprehensive review of their discovery, structure, classification, functional diversity and regulatory mechanism. Int. J. Biol. Macromol. 2024, 282, 136652. [Google Scholar] [CrossRef]
  7. Dubos, C.; Stracke, R.; Grotewold, E.; Weisshaar, B.; Martin, C.; Lepiniec, L. MYB transcription factors in Arabidopsis. Trends Plant Sci. 2010, 15, 573–581. [Google Scholar] [CrossRef]
  8. Cao, Y.; Li, K.; Li, Y.; Zhao, X.; Wang, L. MYB Transcription Factors as Regulators of Secondary Metabolism in Plants. Biology 2020, 9, 61. [Google Scholar] [CrossRef]
  9. Tang, Y.H.; Lu, L.L.; Sheng, Z.P.; Zhao, D.Q.; Tao, J. An R2R3-MYB network modulates stem strength by regulating lignin biosynthesis and secondary cell wall thickening in herbaceous peony. Plant J. 2023, 113, 1237–1258. [Google Scholar] [CrossRef]
  10. Tang, F.; Jiao, B.; Zhang, M.; He, M.H.; Su, R.Y.; Luo, K.M.; Lan, T. PtoMYB031, the R2R3 MYB transcription factor involved in secondary cell wall biosynthesis in poplar. Front. Plant Sci. 2024, 14, 1341245. [Google Scholar] [CrossRef]
  11. Ko, S.S.; Li, M.J.; Ho, Y.C.; Yu, C.P.; Yang, T.T.; Lin, Y.J.; Hsing, H.C.; Chen, T.K.; Jhong, C.M.; Li, W.H.; et al. Rice transcription factor GAMYB modulates bHLH142 and is homeostatically regulated by TDR during anther tapetal and pollen development. J. Exp. Bot. 2021, 72, 4888–4903. [Google Scholar] [CrossRef] [PubMed]
  12. Millar, A.A.; Lohe, A.; Wong, G. Biology and Function of miR159 in Plants. Plants 2019, 8, 255. [Google Scholar] [CrossRef] [PubMed]
  13. Liu, X.Y.; Wu, Z.; Feng, J.X.; Yuan, G.Z.; He, L.; Zhang, D.H.; Teng, N.J. A Novel R2R3-MYB Gene LoMYB33 From Lily Is Specifically Expressed in Anthers and Plays a Role in Pollen Development. Front. Plant Sci. 2021, 12, 730007. [Google Scholar] [CrossRef]
  14. Gubler, F.; Kalla, R.; Roberts, J.K.; Jacobsen, J.V. Gibberellin-regulated expression of a myb gene in barley aleurone cells: Evidence for Myb transactivation of a high-pI alpha-amylase gene promoter. Plant Cell 1995, 7, 1879–1891. [Google Scholar] [CrossRef]
  15. Wang, Y.; Sun, F.L.; Cao, H.; Peng, H.R.; Ni, Z.F.; Sun, Q.X.; Yao, Y.Y. TamiR159 Directed Wheat TaGAMYB Cleavage and Its Involvement in Anther Development and Heat Response. PLoS ONE 2012, 7, e48445. [Google Scholar] [CrossRef]
  16. Abraham, Z.; Iglesias-Fernández, R.; Martínez, M.; Rubio-Somoza, I.; Díaz, I.; Carbonero, P.; Vicente-Carbajosa, J. A Developmental Switch of Gene Expression in the Barley Seed Mediated by HvVP1 (Viviparous-1) and HvGAMYB Interactions. Plant Physiol. 2016, 170, 2146–2158. [Google Scholar] [CrossRef] [PubMed]
  17. Ogrodowicz, P.; Kuczynska, A.; Krajewski, P.; Kempa, M. The effects of heading time on yield performance and HvGAMYB expression in spring barley subjected to drought. J. Appl. Genet. 2023, 64, 289–302. [Google Scholar] [CrossRef]
  18. Wang, R.N.; Yang, X.Y.; Guo, S.; Wang, Z.H.; Zhang, Z.H.; Fang, Z.M. MiR319-targeted OsTCP21 and OsGAmyb regulate tillering and grain yield in rice. J. Integr. Plant Biol. 2021, 63, 1260–1272. [Google Scholar] [CrossRef] [PubMed]
  19. Yang, X.T.; Wang, K.; Ge, L.M.; Chen, X.N.; Zhang, L.L.; Song, X.Y. Transcription factor TaGAMYB from wheat (Triticum aestivum L.) regulates flowering time and fertility in transgenic Arabidopsis thaliana. Planta 2023, 257, 16. [Google Scholar] [CrossRef]
  20. Allen, R.S.; Li, J.; Alonso-Peral, M.M.; White, R.G.; Gubler, F.; Millar, A.A. MicroR159 regulation of most conserved targets in Arabidopsis has negligible phenotypic effects. Silence 2010, 1, 18. [Google Scholar] [CrossRef]
  21. Imran, M.; Liu, T.F.; Wang, Z.; Wang, M.; Liu, S.L.; Gao, X.Y.; Wang, A.N.; Liu, S.F.; Tian, Z.X.; Zhang, M. Evolutionary conservation of nested MIR159 structural microRNA genes and their promoter characterization in Arabidopsis thaliana. Front. Plant Sci. 2022, 13, 948751. [Google Scholar] [CrossRef] [PubMed]
  22. Csukasi, F.; Donaire, L.; Casañal, A.; Martínez-Priego, L.; Botella, M.A.; Medina-Escobar, N.; Llave, C.; Valpuesta, V. Two strawberry miR159 family members display developmental-specific expression patterns in the fruit receptacle and cooperatively regulate Fa-GAMYB. New Phytol. 2012, 195, 47–57. [Google Scholar] [CrossRef]
  23. Wang, Q.Y.; Wan, J.; Dang, K.T.; Meng, S.J.; Hu, D.S.; Lin, Y.; Qiu, X.Q.; Guo, Z.Y.; Fu, Z.Y.; Ding, D.; et al. zma-miR159 targets ZmMYB74 and ZmMYB138 transcription factors to regulate grain size and weight in maize. Plant Physiol. 2023, 193, 2430–2441. [Google Scholar] [CrossRef]
  24. Zhao, P.; Wang, F.; Deng, Y.; Zhong, F.; Tian, P.; Lin, D.; Deng, J.; Zhang, Y.; Huang, T. Sly-miR159 regulates fruit morphology by modulating GA biosynthesis in tomato. Plant Biotechnol. J. 2022, 20, 833–845. [Google Scholar] [CrossRef]
  25. da Silva, E.M.; Silva, G.; Bidoia, D.B.; da Silva Azevedo, M.; de Jesus, F.A.; Pino, L.E.; Peres, L.E.P.; Carrera, E.; López-Díaz, I.; Nogueira, F.T.S. microRNA159-targeted SlGAMYB transcription factors are required for fruit set in tomato. Plant J. 2017, 92, 95–109. [Google Scholar] [CrossRef]
  26. Zhao, P.; Li, Q.; Li, J.; Wang, L.; Ren, Z. Genome-wide identification and characterization of R2R3MYB family in Solanum lycopersicum. Mol. Genet. Genom. 2014, 289, 1183–1207. [Google Scholar] [CrossRef] [PubMed]
  27. Xie, F.L.; Xiao, P.; Chen, D.L.; Xu, L.; Zhang, B.H. miRDeepFinder: A miRNA analysis tool for deep sequencing of plant small RNAs. Plant Mol. Biol. 2012, 80, 75–84. [Google Scholar] [CrossRef]
  28. Liu, X.; Yang, W.; Wang, J.; Yang, M.; Wei, K.; Liu, X.; Qiu, Z.; van Giang, T.; Wang, X.; Guo, Y.; et al. SlGID1a Is a Putative Candidate Gene for qtph1.1, a Major-Effect Quantitative Trait Locus Controlling Tomato Plant Height. Front. Genet. 2020, 11, 881. [Google Scholar] [CrossRef] [PubMed]
  29. Luo, J.; Tang, Y.; Chu, Z.; Peng, Y.; Chen, J.; Yu, H.; Shi, C.; Jafar, J.; Chen, R.; Tang, Y.; et al. SlZF3 regulates tomato plant height by directly repressing SlGA20ox4 in the gibberellic acid biosynthesis pathway. Hortic. Res. 2023, 10, uhad025. [Google Scholar] [CrossRef]
  30. Chu, L.L.; Liu, D.H.; Li, C.L.; Liu, J.H. Dwarfing of fruit trees: From old cognitions to new insights. Hortic. Adv. 2025, 3, 7. [Google Scholar] [CrossRef]
  31. Rodriguez, R.E.; Debernardi, J.M.; Palatnik, J.F. Morphogenesis of simple leaves: Regulation of leaf size and shape. Wiley. Interdiscip. Rev. Dev. Biol. 2014, 3, 41–57. [Google Scholar] [CrossRef] [PubMed]
  32. Ding, A.M.; Xu, C.T.; Xie, Q.; Zhang, M.J.; Yan, N.; Dai, C.B.; Lv, J.; Cui, M.M.; Wang, W.F.; Sun, Y.H. ERF4 interacts with and antagonizes TCP15 in regulating endoreduplication and cell growth in Arabidopsis. J. Integr. Plant Biol. 2022, 64, 1673–1689. [Google Scholar] [CrossRef] [PubMed]
  33. Li, X.M.; Jenke, H.; Strauss, S.; Bazakos, C.; Mosca, G.; Lymbouridou, R.; Kierzkowski, D.; Neumann, U.; Naik, P.; Huijser, P.; et al. Cell-cycle-linked growth reprogramming encodes developmental time into leaf morphogenesis. Curr. Biol. 2024, 34, 541–556. [Google Scholar] [CrossRef]
  34. Zhang, T.Y.; Wang, X.; Lu, Y.G.; Cai, X.F.; Ye, Z.B.; Zhang, J.H. Genome-Wide Analysis of the Cyclin Gene Family in Tomato. Int. J. Mol. Sci. 2014, 15, 120–140. [Google Scholar] [CrossRef]
  35. Chu, Y.H.; Jang, J.C.; Huang, Z.; van der Knaap, E. Tomato locule number and fruit size controlled by natural alleles of lc and fas. Plant Direct. 2019, 3, e00142. [Google Scholar] [CrossRef]
  36. Yuste-Lisbona, F.J.; Fernández-Lozano, A.; Pineda, B.; Bretones, S.; Ortíz-Atienza, A.; García-Sogo, B.; Müller, N.A.; Angosto, T.; Capel, J.; Moreno, V.; et al. ENO regulates tomato fruit size through the floral meristem development network. Proc. Natl. Acad. Sci. USA 2020, 117, 8187–8195. [Google Scholar] [CrossRef] [PubMed]
  37. Han, H.; Liu, X.; Zhou, Y. Transcriptional circuits in control of shoot stem cell homeostasis. Curr. Opin. Plant Biol. 2020, 53, 50–56. [Google Scholar] [CrossRef]
  38. Becker, A. A molecular update on the origin of the carpel. Curr. Opin. Plant Biol. 2020, 53, 15–22. [Google Scholar] [CrossRef] [PubMed]
  39. Zhu, Y.F.; Hu, C.; Cui, Y.W.; Zeng, L.; Li, S.J.N.; Zhu, M.S.; Meng, F.H.; Huang, S.T.; Long, L.; Yi, J.; et al. Conserved and differentiated functions of CIK receptor kinases in modulating stem cell signaling in Arabidopsis. Mol. Plant 2021, 14, 1119–1134. [Google Scholar] [CrossRef]
  40. Hong, L.; Fletcher, J.C. Stem Cells: Engines of Plant Growth and Development. Int. J. Mol. Sci. 2023, 24, 14889. [Google Scholar] [CrossRef]
  41. Shan, F.; Zhang, R.; Zhang, J.; Wang, C.; Lyu, X.; Xin, T.; Yan, C.; Dong, S.; Ma, C.; Gong, Z. Study on the Regulatory Effects of GA3 on Soybean Internode Elongation. Plants 2021, 10, 1737. [Google Scholar] [CrossRef] [PubMed]
  42. Wang, X.F.; Jiao, Z.H.; Zhang, Y.H.; Shi, Q.B.; Wang, Q.B.; Zhou, F.L.; Xu, D.; Wang, G.D.; Kong, F.Y.; Zhang, H.S.; et al. DBB2 regulates plant height and shade avoidance responses in maize. J. Integr. Plant Biol. 2025, 67, 1323–1338. [Google Scholar] [CrossRef] [PubMed]
  43. Shohat, H.; Eliaz, N.I.; Weiss, D. Gibberellin in tomato: Metabolism, signaling and role in drought responses. Mol. Hortic. 2021, 1, 15. [Google Scholar] [CrossRef] [PubMed]
  44. Cheng, J.Y.; Hill, C.B.; Shabala, S.; Li, C.D.; Zhou, M.X. Manipulating GA-Related Genes for Cereal Crop Improvement. Int. J. Mol. Sci. 2022, 23, 14046. [Google Scholar] [CrossRef]
  45. Xie, Y.; Tan, H.J.; Ma, Z.X.; Huang, J.R. DELLA Proteins Promote Anthocyanin Biosynthesis via Sequestering MYBL2 and JAZ Suppressors of the MYB/bHLH/WD40 Complex in Arabidopsis thaliana. Mol. Plant 2016, 9, 711–721. [Google Scholar] [CrossRef]
  46. Nohales, M.A.; Kay, S.A. GIGANTEA gates gibberellin signaling through stabilization of the DELLA proteins in Arabidopsis. Proc. Natl. Acad. Sci. USA 2019, 116, 21893–21899. [Google Scholar] [CrossRef]
  47. Li, T.; Wang, Y.Q.; Natran, A.; Zhang, Y.; Wang, H.; Du, K.X.; Qin, P.; Yuan, H.; Chen, W.L.; Tu, B.; et al. C-TERMINAL DOMAIN PHOSPHATASE-LIKE 3 contributes to GA-mediated growth and flowering by interaction with DELLA proteins. New Phytol. 2024, 242, 2555–2569. [Google Scholar] [CrossRef]
  48. Bertoni, G. Cell Cycle Regulation by Chlamydomonas Cyclin-Dependent Protein Kinases. Plant Cell 2018, 30, 271. [Google Scholar] [CrossRef]
  49. Heinzle, C.; Höfler, A.; Yu, J.; Heid, P.; Kremer, N.; Schunk, R.; Stengel, F.; Bange, T.; Boland, A.; Mayer, T.U. Positively charged specificity site in cyclin B1 is essential for mitotic fidelity. Nat. Commun. 2025, 16, 853. [Google Scholar] [CrossRef]
  50. Cerbantez-Bueno, V.E.; Serwatowska, J.; Rodríguez-Ramos, C.; Cruz-Valderrama, J.E.; de Folter, S. The role of D3-type cyclins is related to cytokinin and the bHLH transcription factor SPATULA in Arabidopsis gynoecium development. Planta 2024, 260, 48. [Google Scholar] [CrossRef]
  51. Zheng, T.C.; Dai, L.J.; Li, S.; Liu, Y.; Zhao, Z.N.; Yang, C.P.; Qu, G.Z. Populus D-type cyclin gene PsnCYCD1;1 accelerates cell division and participates in secondary growth of vascular bundles. J. Exp. Bot. 2023, 74, 4077–4092. [Google Scholar] [CrossRef] [PubMed]
  52. Luo, L.J.; Liu, L.; She, L.L.; Zhang, H.R.; Zhang, N.N.; Wang, Y.Q.; Ni, Y.T.; Chen, F.pG.; Wan, F.Y.; Dai, Y.Q.; et al. DRN facilitates WUS transcriptional regulatory activity by chromatin remodeling to regulate shoot stem cell homeostasis in Arabidopsis. PLoS Biol. 2024, 22, e3002878. [Google Scholar] [CrossRef] [PubMed]
  53. Chetty, V.J.; Ceballos, N.; Garcia, D.; Narváez-Vásquez, J.; Lopez, W.; Orozco-Cárdenas, M.L. Evaluation of four strains for the genetic transformation of tomato (Solanum lycopersicum L.) cultivar Micro-Tom. Plant Cell Rep. 2013, 32, 239–247. [Google Scholar] [CrossRef] [PubMed]
  54. Livak, K.J.; Schmittgen, T.D. Analysis of relative gene expression data using real-time quantitative PCR and the 2 method. Methods 2001, 25, 402–408. [Google Scholar] [CrossRef]
  55. Chen, W.; Gong, L.; Guo, Z.L.; Wang, W.S.; Zhang, H.Y.; Liu, X.Q.; Yu, S.B.; Xiong, L.Z.; Luo, J. A Novel Integrated Method for Large-Scale Detection, Identification, and Quantification of Widely Targeted Metabolites: Application in the Study of Rice Metabolomics. Mol. Plant 2013, 6, 1769–1780. [Google Scholar] [CrossRef]
  56. Li, D.M.; Guo, Z.P.; Liu, C.M.; Li, J.C.; Xu, W.Z.; Chen, Y. Quantification of near-attomole gibberellins in floral organs dissected from a single Arabidopsis thaliana flower. Plant J. 2017, 91, 547–557. [Google Scholar] [CrossRef]
  57. Galdon-Armero, J.; Arce-Rodriguez, L.; Downie, M.; Li, J.; Martin, C. A Scanning Electron Micrograph-based Resource for Identification of Loci Involved in Epidermal Development in Tomato: Elucidation of a New Function for the Mixta-like Transcription Factor in Leaves. Plant Cell 2020, 32, 1414–1433. [Google Scholar] [CrossRef]
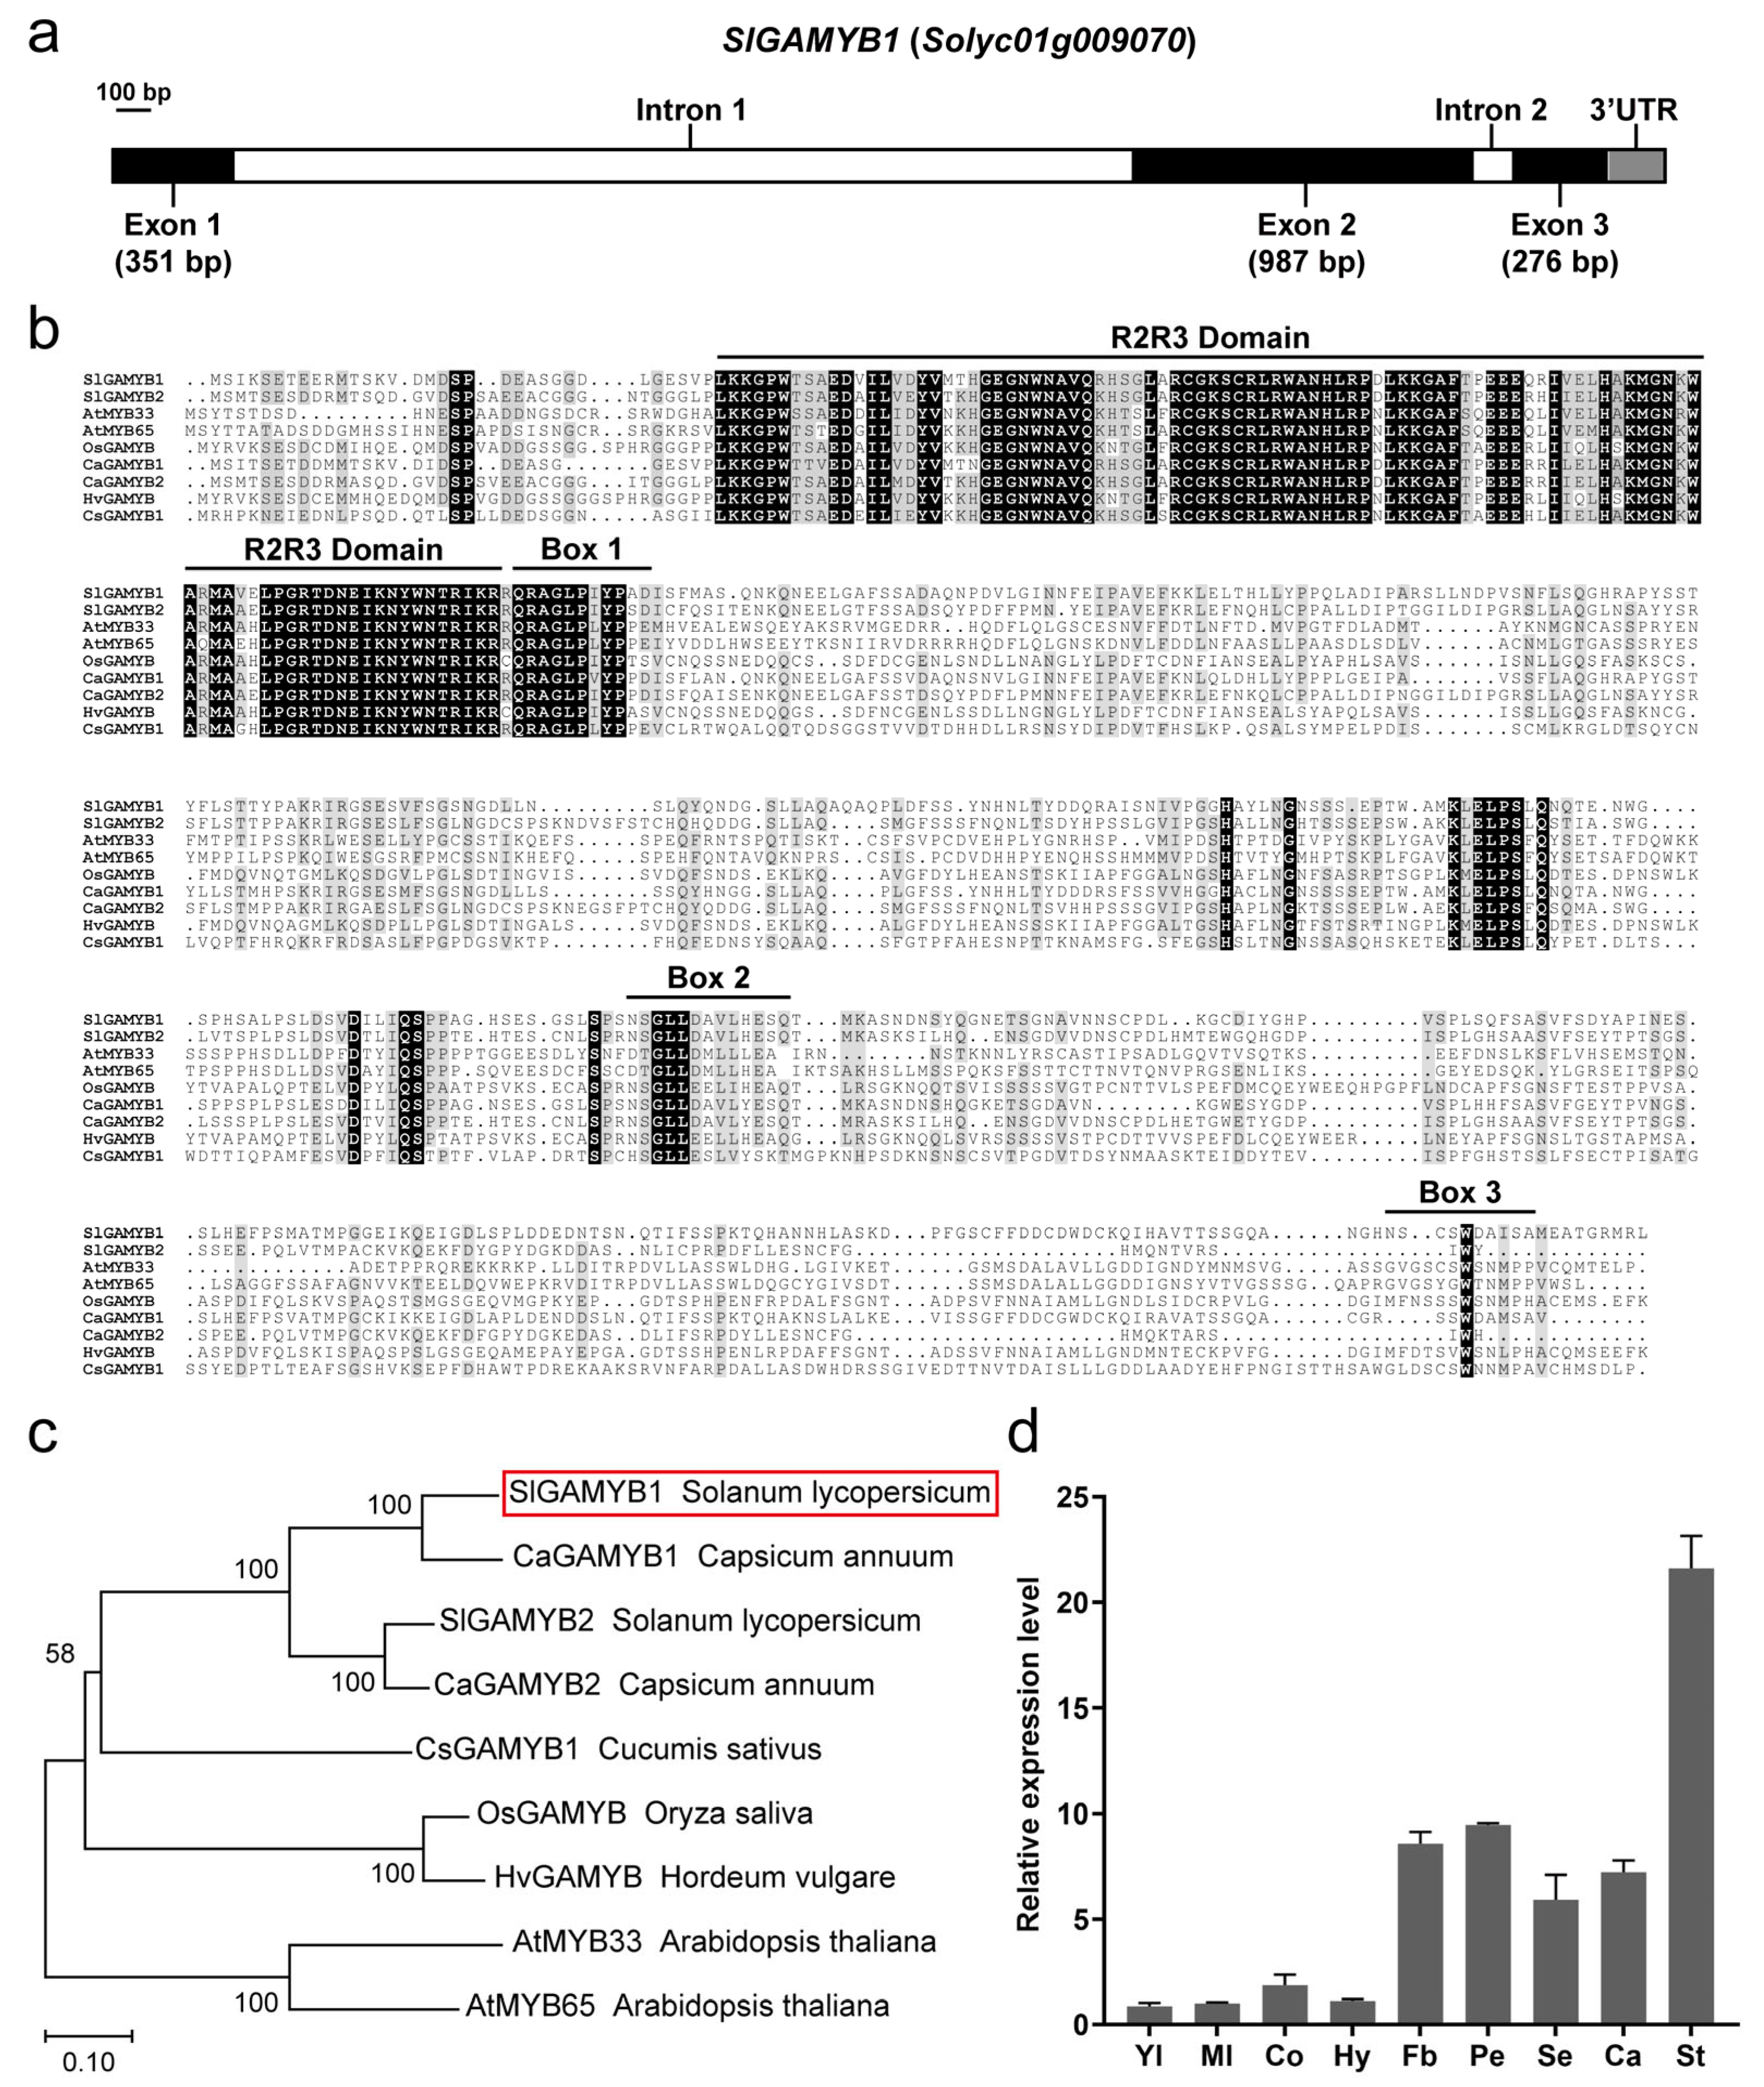
Figure 1. Structural, phylogenetic, and expression analyses of SlGAMYB1. (a) Gene structure of SlGAMYB1. The exons, 3’UTR, and introns are symbolized by dark boxes, a gray box, and white boxes, respectively. The scale bar represents 100 bp. (b) Multiple sequence alignment of GAMYB proteins. Alignment of SlGAMYB1 with other GAMYB proteins from tomato (SlGAMYB2), Arabidopsis (AtMYB33 and AtMYB65), rice (OsGAMYB), pepper (CaGAMYB1 and CaGAMYB2), barley (HvGAMYB), and cucumber (CsGAMYB1), highlighting the conserved R2R3 DNA-binding domains, Box 1, Box 2, and Box 3. The black background indicates identical amino acids among the aligned sequences. (c) Phylogenetic analysis of GAMYB homologs. Neighbor-joining tree showing the evolutionary relationships among GAMYB proteins from different species. SlGAMYB1 is highlighted by a red box, and the tree is scaled to a branch length of 0.1 substitutions per site. Bootstrap values (1000 replications) are indicated at the nodes. (d) Transcriptional patterns of the SlGAMYB1 in tomato. The relative expression levels were measured by quantitative real-time PCR (qRT-PCR) and normalized to the expression of ACTIN. Error bars represent SEM (n = 3 in (d)). Tissues include young leaf (Yl), mature leaf (Ml), cotyledon (Co), hypocotyl (Hy), flower bud (Fb), petal (Pe), sepal (Se), carpel (Ca), and stamen (St).
Plants 14 01613 g001
Figure 2. Overexpression of the Sly-miR159-resistant version of SlGAMYB1 (35S:SlGAMYB1m) resulted in strong plant dwarfism. (a) Schematic representation of the 35S:SlGAMYB1 and 35S:SlGAMYB1m transgenes. The red letters indicate the mutated nucleotides that alter the Sly-miR159 binding sequence in SlGAMYB1m. The encoded amino acids (ELPSLQ) are listed below the gene sequences, which show that the mutations in SlGAMYB1m do not change the protein sequence of SlGAMYB1. (b) Expression of SlGAMYB1 in the leaves of wild type (WT) and 35S:SlGAMYB1m at 30 days post-germination. (c) Phenotypes of WT and 35S:SlGAMYB1m plants at anthesis. The 35S:SlGAMYB1m plant exhibits a pronounced dwarfism phenotype compared to WT. (d) Plant height of WT and 35S:SlGAMYB1m plants at anthesis. (e) The number of stem internodes of WT and 35S:SlGAMYB1m plants at anthesis. (f) The length of internodes of WT and 35S:SlGAMYB1m plants at anthesis. (g) Phenotypes of WT and 35S:SlGAMYB1m plants treated with the control solution, GA3, and PAC. (h) Plant height of WT and 35S:SlGAMYB1m plants treated with the control solution, GA3, and PAC. (i) The GA3-induced increase of plant height from control in WT and 35S:SlGAMYB1m plants. (j) The PAC-induced decrease of plant height from the control in WT and 35S:SlGAMYB1m plants. Scale bars represent 5 cm in (c,g). Error bars represent SEM (n = 3 in (b); n = 10 in (df,hj)). Asterisks indicate a significant difference from the WT control (ns p > 0.05; * p < 0.05 and ** p < 0.01; Student’s t test in (b,df,i,j) and two-way ANOVA test in (h)).
Plants 14 01613 g002
Figure 3. GA biosynthesis is reduced in the stem development of 35S:SlGAMYB1m transgenes. (ac) GA1 (a), GA3 (b), and GA4 (c) contents in the wild type (WT) and 35S:SlGAMYB1m stems before anthesis. GA1, GA3, and GA4 levels are both reduced in 35S:SlGAMYB1m relative to WT. (di) Expression levels of GA biosynthesis pathway genes in WT and 35S:SlGAMYB1m stems before anthesis. The tomato ACTIN gene was used as the internal control. Error bars represent SEM (n = 3 in (ai). Asterisks indicate a significant difference from the WT control (* p < 0.05 and ** p < 0.01; Student’s t test).
Plants 14 01613 g003
Figure 4. Overexpression of SlGAMYB1 affected the leaf morphology and cell characteristics in tomato. (a) Phenotypic appearance of leaves from wild type (WT) and 35S:SlGAMYB1m transgenic lines. (b) Quantification of serration number on leaves, indicating a significant decrease in 35S:SlGAMYB1m compared to WT. (c) Measurement of leaf area, demonstrating a smaller leaf area in 35S:SlGAMYB1m compared to WT. (d) Comparison of leaf length, with 35S:SlGAMYB1m plants exhibiting shorter leaves than WT. (e) Comparison of leaf width, with 35S:SlGAMYB1m plants exhibiting shorter leaves than WT. (f) The leaf length-to-width ratio is reduced in 35S:SlGAMYB1m plants compared to WT, suggesting changes in leaf shape. (g) Scanning Electron Micrographs (SEM) of leaf epidermal cells from both WT and 35S:SlGAMYB1m plants, illustrating the differences in cell size and morphology. (h) Scatter plot of cell size distribution, indicating a significant increase in larger cell sizes in 35S:SlGAMYB1m plants compared to WT. (i) Bar chart representing the ratio of cell numbers across different size categories, showing a higher proportion of larger cells in 35S:SlGAMYB1m plants compared to WT. (j) Measurement of cell density per mm2, which is reduced in 35S:SlGAMYB1m plants compared to WT. (k) Quantification of total cell number, with 35S:SlGAMYB1m plants having a significantly lower cell count than WT. (lo) Relative expression levels of SlCYCB1-1 (l), SlCYCB1-3 (m), SlCYCD3-1 (n) and SlCYCD3-3 (o) in WT and 35S:SlGAMYB1m leaves. Both genes show a downregulation in the 35S:SlGAMYB1m line, with SlCYCD3-1 being more significantly reduced than SlCYCD3-3, highlighting the differential impact on cell cycle progression. Scale bars represent 1 cm in (a) and 50 μm in (g). Error bars represent SEM (n = 10 in (bf,hk); n = 3 in (lo)). Asterisks indicate a significant difference from the WT control (* p < 0.05 and ** p < 0.01; Student’s t test).
Plants 14 01613 g004
Figure 5. Overexpression of SlGAMYB1 promotes early flowering and enhances floral organogenesis. (a) Comparative flowering phenotypes between wild type (WT) and 35S:SlGAMYB1m plants, showcasing the advanced flowering in 35S:SlGAMYB1m lines. (b,c) Detailed floral phenotypes of WT and 35S:SlGAMYB1m plants, highlighting the morphological differences in flower structure. (d) Ovary phenotypes of WT and 35S:SlGAMYB1m plants, with a focus on the size and shape of the ovaries. (e) Quantitative analysis of flowering time, demonstrating a significant reduction in the days to flowering in 35S:SlGAMYB1m compared to WT. (fj) Analysis of floral organ number and size, including petal number (f), sepal number (g), ovary size (h), stigma number (i), and carpel number (j), demonstrating an increase in both the quantity and dimensions of floral organs in 35S:SlGAMYB1m compared to WT. (km) Relative expression levels of SlWUS (tomato WUSCHEL homolog) (k), SlCLV3 (CLAVATA3 homolog) (l), and SlTAG1 (TOMATO AGAMOUS-LIKE 1) (m) in WT and 35S:SlGAMYB1m shoot apical meristem (SAM). Scale bars represent 5 cm in (a), 1 cm in (b,c), and 1 mm in (d). Error bars represent SEM (n = 10 in (ej); n = 3 in (km)). Numerals (1–9) denoting petal/sepal numbers per flower. Asterisks indicate a significant difference from the WT control (ns p > 0.05 and ** p < 0.01; Student’s t test).
Plants 14 01613 g005
Disclaimer/Publisher’s Note: The statements, opinions and data contained in all publications are solely those of the individual author(s) and contributor(s) and not of MDPI and/or the editor(s). MDPI and/or the editor(s) disclaim responsibility for any injury to people or property resulting from any ideas, methods, instructions or products referred to in the content.