Article

Evaluation and Source Analysis of Plant Heavy Metal Pollution in Kalamaili Mountain Nature Reserve

1
College of Geography and Remote Sensing Sciences, Xinjiang University, Urumqi 830046, China
2
Xinjiang Key Laboratory of Oasis Ecology, Xinjiang University, Urumqi 830046, China
3
Xinjiang Field Scientific Observation and Research Station for the Oasisization Process in the Hinterland of the Taklamakan Desert, Yutian 848400, China
*
Author to whom correspondence should be addressed.
Plants 2025, 14(10), 1521; https://doi.org/10.3390/plants14101521
Submission received: 7 April 2025 / Revised: 1 May 2025 / Accepted: 9 May 2025 / Published: 19 May 2025
(This article belongs to the Topic Effect of Heavy Metals on Plants, 2nd Volume)

Abstract

:
Plants serve as vital components of ecosystems, with their contamination status acting as sensitive indicators of environmental pollution. Therefore, the precise assessment of plant heavy metal contamination and source identification are crucial for regional ecological conservation and sustainable development. This study investigated heavy metal pollution in four characteristic plant species (Anabasis aphylla L., Alhagi camelorum Fisch., Reaumuria songonica (PalL)Maxim., and Haloxylon ammodendron (C. A. Mey.) Bunge.) within the Kalamaili Mountain Nature Reserve, employing comprehensive methodologies including pollution indices, bioconcentration factors (BCFs), absolute principal component score–multiple linear regression (APCS-MLR), and the random forest model (RF). The key findings revealed the following: The soil exhibited severe Cd and Hg contamination. The plant Cr concentrations exceeded standard limits by 31.89 to 147 fold. The Pb, Hg, and As content in plants showed significant differences. The plants displayed differential metal enrichment capacities, ranked as Cr (BCF = 3.28) > Hg (1.22) > Cd (0.92) > Cu (0.25) > Zn (0.15) > Pb (0.125) > As (0.125), highlighting Cr, Hg, and Cd as priority ecological hazards. Complex interactions were observed, with Reaumuria songonica (PalL)Maxim. showing strong Cd soil–plant correlation (r = 0.78), whereas Alhagi camelorum Fisch. demonstrated negative associations (Cd: r = −0.21). APCS-MLR identified mining/smelting as primary contributors to Cd (63.49%), Zn (55.66%), and Cr (45.51%), while transportation dominated Pb emissions (72.92%). Mercury pollution originated from mixed sources (56.18%), likely involving atmospheric deposition, and RF modeling corroborated these patterns, confirming industrial and transportation synergies for Cd, Zn, Cr, Cu, Hg, and As, with Pb predominantly linked to vehicular emissions. This multidisciplinary approach provides scientific evidence for establishing heavy metal monitoring systems and formulating targeted remediation strategies in arid ecologically fragile regions.

1. Introduction

As the main component of the ecosystem, plants provide nutrients for the biosphere, and their growth and development directly affect the entire ecosystem [1]. With the advancement of industrialization, the scale of production activities, such as mineral extraction, is rapidly expanding, resulting in large amounts of heavy metals entering the soil and vegetation of the surrounding areas along with atmospheric deposition, precipitation, and surface water [2,3], leading to increasing heavy metal pollution in the surrounding areas [4]. Heavy metals enter into the roots, stems, leaves, and seeds of plants as they grow and develop, hindering plant productivity and transferring enrichment through the food chain, posing a threat to animal and human health [5]. Soil and sediments act as sinks for heavy metal pollutants [6], while water, soil, and air act as transport media for heavy metals [7], influencing the transportation and accumulation of heavy metals. Currently, more studies have been carried out on soil- and water-related heavy metal pollution, evaluation, and source resolution [8], while plants act as receptors of heavy metal pollution [9], and most of the current research on plant heavy metals focuses on how to alleviate the stress of heavy metal pollution on plants [10,11,12], with relatively few studies focusing on the evaluation of plant heavy metal pollution and source resolution. In addition, as the soil–plant system is an important heavy metal transport and accumulation system, there are fewer studies on the migration and transport behaviors of heavy metals within the system [13]; therefore, it is necessary to carry out scientific pollution evaluations and source analyses of plant heavy metals and to carry out research on the accumulation and transport of heavy metals in the soil–plant system.
Indicators used for heavy metal pollution evaluation in current relevant studies include the geo-accumulation index (Igeo) [14], potential ecological risk index (RI) [15], pollution load index (PLI) [16], Nemerow pollution index (NPI) [17], etc. The above indicators are commonly used to evaluate the degree of pollution of soil and water and to measure the ecological hazards of heavy metals in plants, which can be combined with their enrichment capacity for a comprehensive analysis. In addition, accurately grasping the source of heavy metal pollution in the region is crucial for regional environmental management, and many scholars at home and abroad have carried out work related to the analysis of heavy metal sources in plants, with the results showing that mining activities [18], sewage discharge [19], transportation activities [20] and other human activities, as well as natural factors such as the geological background [21], can lead to heavy metal pollution in plants. Heavy metal pollution source allocation methods can be divided into two categories: source identification and source quantification [22]. The identification of pollution sources mainly relies on methods such as GIS and principal component analysis [23,24,25], while source quantification uses receptor models for quantitative analysis [26,27]. Sun et al. [28]. explored the sources of heavy metals in a wetland using a PMF model, showing that pesticides, fertilizers, livestock manure, sewage irrigation, agricultural sources, and soil matrix can all lead to heavy metal pollution and affect plants. Skorbiłowicz et al. [29] used a cluster analysis and other human methods to analyze the heavy metal contamination of the Narew watershed and aquatic plants, which mainly originated from sewage treatment plants, transportation activities, and radioactive waste repositories. Zacharie et al. [30] used a principal component analysis and a hierarchical cluster analysis to investigate the heavy metal contamination of the Lekie River watershed, which mainly originated from the mining of ores and the discharge of industrial wastewater. Adnan et al. [31] analyzed the heavy metals in the area around a smelter based on the PMF and PCA methods and concluded that the heavy metals in the area around the smelter mainly originated from industrial activities, atmospheric deposition, and soil matrices. Most of the previous studies used receptor modeling for source quantification, but heavy metal pollution often presents a complex superimposed effect of natural geologic background and anthropogenic activity inputs, and it is difficult to accurately quantify the pollution contribution using traditional single assessment methods [32]. The random forest model, as a robust nonparametric method, can effectively process complex data, discover hidden nonlinear relationships, and develop predictive models [33] and has been widely used in recent years in the fields of identification, prediction, and monitoring of pollutants in environmental media [34,35]. In the current study, the random forest model and the APCS-MLR receptor model will be used for source resolution, and as machine learning is not easily affected by the data-processing process [36], the efficient and convenient features of the APCS-MLR model [37] will be utilized to explore the sources of plant heavy metal pollution.
As the only hoofed wildlife activity area in the northwest of China, the ecological environment of the Kalamaili Mountain Nature Reserve is closely linked to various types of wildlife in the reserve. However, due to the combined constraints of climate, geographic location, and other factors, the reserve is characterized by sparse vegetation and the fragile ecological environment [38]. As a typical arid desert area, the Kalamaili Mountain Nature Reserve is an ecologically fragile area, has a low environmental carrying capacity, and is difficult to repair after damage, thus making it a serious ecological protection situation. In addition, the southern foot of the reserve is an industrial-intensive area with various types of industrial industries, and industrial activities, such as mining activities, can cause heavy metal pollution in the area 100 km away from the mining area [39]. In this context, the environment of the protected area is affected by the neighboring industrial activities, which affects the ecological balance of soil and plants and limits the green development of the protected area’s ecology. In this study, we will take the Kalamaili Mountain Nature Reserve as the study area, select representative plants in the reserve as the study objects, and utilize the NPI and RI to evaluate the risk of heavy metal pollution status of soils and plants in the study area, as well as utilize enrichment coefficients and correlation coefficients to parse out the linkages between soil–vegetation systems. In addition, the APCS-MLR model and RF model were used to analyze the sources of heavy metal pollution in plants. The results of this study will clarify the ecological risk of vegetation under the disturbance of industrial and mining activities and provide theoretical support for optimizing the ecological maintenance and control strategy of the protected area.

2. Results

2.1. Descriptive Statistics of Soil–Plant Heavy Metal Contents

As can be seen from Table 1, the average contents of heavy metals Cr, Cu, Zn, Cd, Pb, Hg, and As in the soil were 44.38, 20.89, 55.95, 0.13, 17.5, 0.0093, and 6.64 mg·kg−1, respectively, and in terms of the average contents of heavy metals, the content of Cd exceeded the background value of Xinjiang soil by 1.08 times. The mean values of Cr, Cu, Zn, Cd, Pb, Hg, and As did not exceed the screening values when compared with the risk screening values of the national standard (GB/15618-2018). The coefficients of variation of each heavy metal in the soil were 35.10%, 47.85%, 22.53%, 45.34%, 11.03%, 41.64%, and 59.13%, which were all of medium variation. From the coefficients of variation, it can be seen that As and Cu have higher degrees of variation and are more affected by external influences. Table A1 shows the significant comparative differences between the soil contents of each heavy metal and the background values in Xinjiang. Among them, the p-values of Zn, Pb, Hg, and As were all 1, while the p-values of Cr, Cu, and Cd were 0.9183, 0.9934, and 0.1994, respectively, which indicated that there was no significant difference between the seven heavy metal elements in the study area and the background values of Xinjiang, whereas the element Cd had a relatively significant difference from the background values.
As can be seen from Table 2, the average content of seven heavy metals Cr, Cu, Zn, Cd, Pb, Hg, and As in Anabasis aphylla L. were categorized as 294.24, 6.51, 11.63, 0.17, 1.91, 0.01, and 1.53 mg·kg−1, of which Cr was 147 times the standard limit value, and Hg, Cu, Zn, Cd, Pb, and As did not exceed the standard limit value; The average content of seven heavy metals—Cr, Cu, Zn, Cd, Pb, Hg, and As—in Alhagi camelorum Fisch. was 70.10, 3.78, 4.89, 0.06, 0.65, 0.01, and 0.46 mg·kg−1, of which Cr was 35 times the standard limit value; the average content of seven heavy metals—Cr, Cu, Zn, Cd, Pb, Hg, and As—in Reaumuria songonica (PalL)Maxim. was 115.46, 5.86, 8.31, 0.12, 3.65, 0.01, and 0.92 mg·kg−1, of which Cr and Pb were 57.73 and 1.22 times the standard limit values, respectively; and the average contents of seven heavy metals—Cu, Zn, Cd, Pb, Hg, and As—in Haloxylon ammodendron (C. A. Mey.) Bunge. were 63.79, 3.85, 7.48, 0.08, 0.39, 0.01, and 0.26, of which Cr was 31.89 times the standard limit. From the above, it can be seen that Cr exceeds the standard in the above four plants, which has a greater ecological risk. The coefficients of variation of the heavy metal contents in each plant were large, indicating that the factors affecting the heavy metal contents in plants are complicated.
As shown in Table A2, the Cr, Cu, Zn, Pb, and As contents were significantly higher than the standard limit (p = 0.00001), except for Hg (p = 0.3699). Table A3 shows that the concentrations of Cr, Cu, Zn, and Cd did not differ significantly among the four plants (p > 0.05), while the concentrations of Pb, Hg, and As differed significantly (p < 0.05). Further two-by-two comparisons (in Table A4) showed that, with regard to the element Pb: Anabasis aphylla L.—Haloxylon ammodendron (C. A. Mey.) Bunge. differed significantly (p = 0.0079), as did Reaumuria songonica (PalL)Maxim.—Haloxylon ammodendron (C. A. Mey.) Bunge. (p = 0.0063). For the element Hg, Reaumuria songonica (PalL)Maxim.—Haloxylon ammodendron (C. A. Mey.) Bunge. differed significantly (p = 0.0098). With regard to the element As, Anabasis aphylla L.—Haloxylon ammodendron (C. A. Mey.) Bunge. (p = 0.0145) and Reaumuria songonica (PalL)Maxim.—Haloxylon ammodendron (C. A. Mey.) Bunge. (p = 0.0096) were the main sources of difference. In summary, the plant heavy metal accumulation characteristics were regulated by species specificity. The interspecific differences in Pb and As were mainly driven by the comparison of Anabasis aphylla L., Reaumuria songonica (PalL)Maxim. and Haloxylon ammodendron (C. A. Mey.) Bunge., while the differences in Hg were concentrated in Reaumuria songonica (PalL)Maxim. and Haloxylon ammodendron (C. A. Mey.) Bunge.
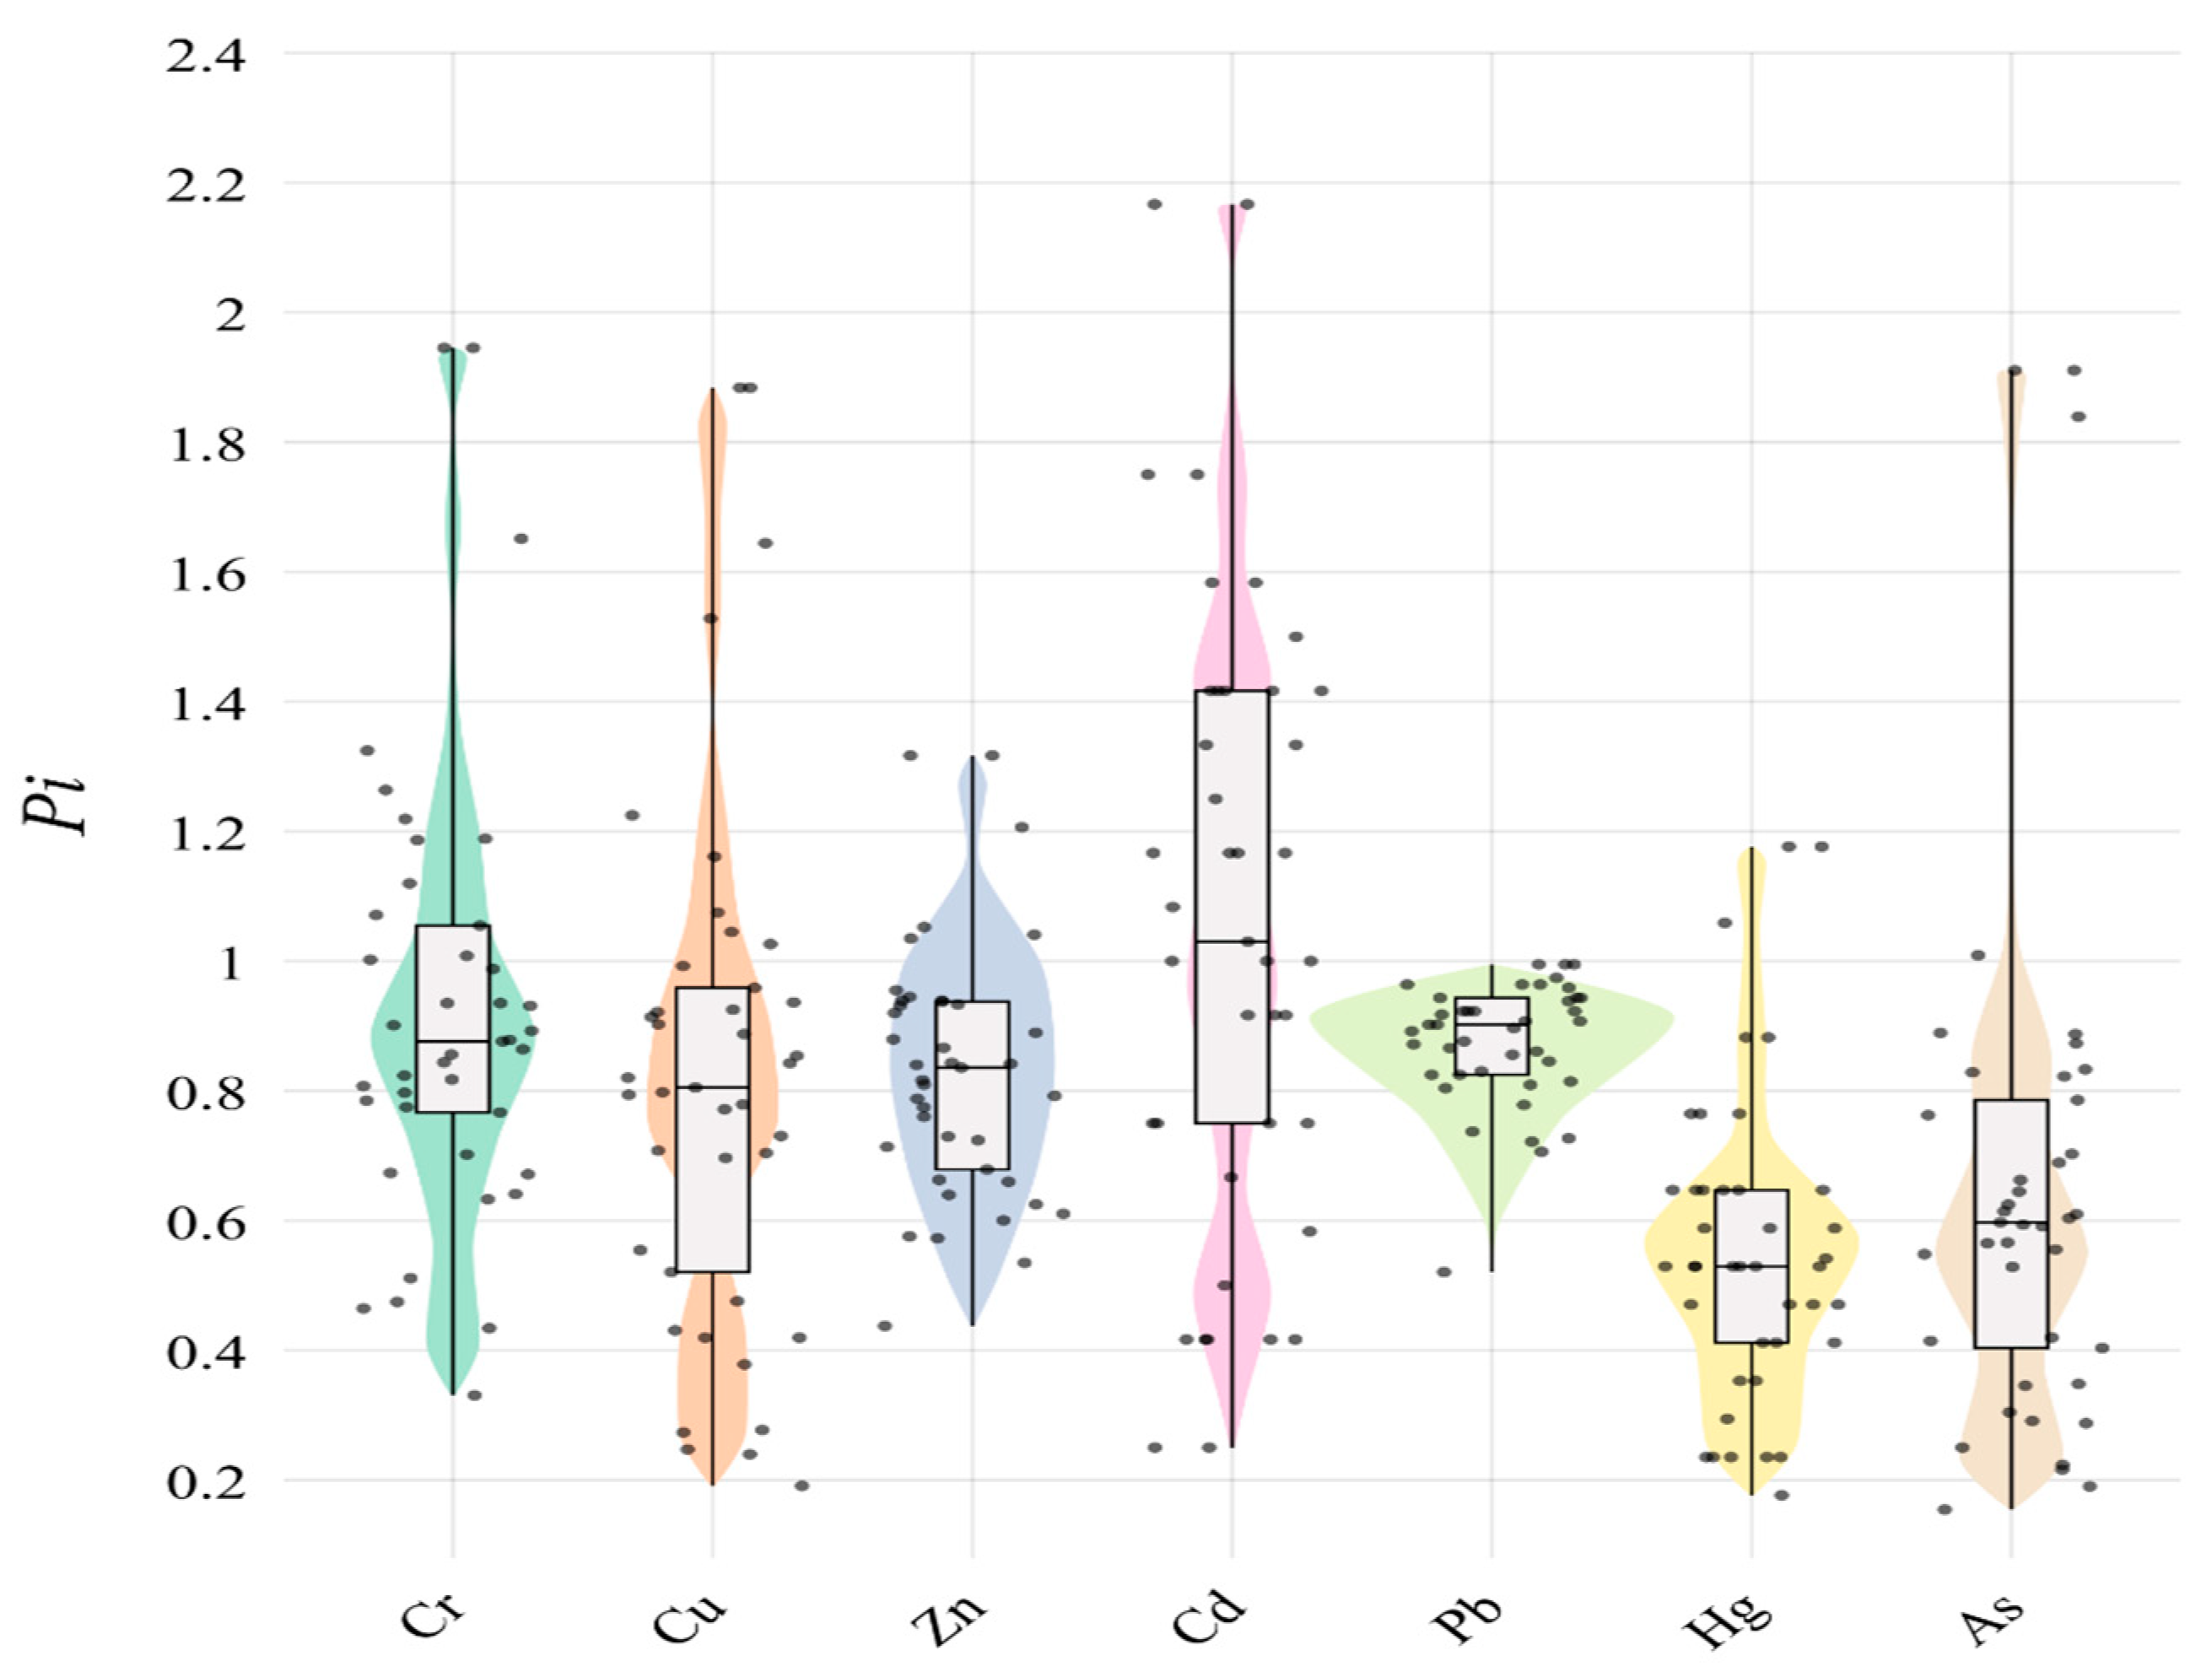
The Nemerow pollution index (Table 3 and Figure 1) shows that Cr, Cu, Zn, Cd, and As are in a moderate state of pollution, while Pb and Hg are in a warning limit.
From the composite potential ecological risk index (Table 4), it can be seen that Cr and Zn in the soil are at the slight ecological hazard level; Cu, Pb, and As are at the medium ecological hazard level; and Cd and Hg are at the very strong ecological hazard level. Combining the NIPI with the RI shows that Cr, Cu, Cd, Hg, and Pb are more seriously polluted.

2.2. Plant–Soil Heavy Metal Correlation Analysis

In order to express the interrelationship between plant heavy metals and soil heavy metals more accurately, the interconnection between plants and soil at the same sampling site will be analyzed. Analyzing the interconnections between soil and plants can help provide a basis for subsequent heavy metal pollution management. The BCF can intuitively respond to the uptake and migration capacity of plants for soil heavy metals, and the uptake capacity of the same plant for different heavy metal elements and the uptake capacity of different plants for the same element are also somewhat different [50]. As can be seen from Figure 2, the BCF for Cr were greater than 1 for Anabasis aphylla L. (7.303), Alhagi camelorum Fisch. (1.78), Reaumuria songonica (PalL)Maxim. (2.60), and Haloxylon ammodendron (C. A. Mey.) Bunge. (1.45), which indicated that Cr could be easily absorbed by these four types of plants (( B C F   ¯ C r ) = 3.28). Regarding the BCF of Hg, the BCF of Anabasis aphylla L. (1.35), Alhagi camelorum Fisch. (1.46), and Reaumuria songonica (PalL)Maxim. (1.26) were all greater than 1, and only Haloxylon ammodendron (C. A. Mey.) Bunge. (0.82 < 1) indicated that Hg was also easily absorbed by the plants and was enriched in the body of the plants (( B C F   ¯ H g ) =1.22). The BCF of Cd in Anabasis aphylla L. (1.424 > 1), Alhagi camelorum Fisch. (0.71), Reaumuria songonica (PalL)Maxim. (0.71), and Haloxylon ammodendron (C. A. Mey.) Bunge. (0.84) indicated that the effect of Cd on plants should not be neglected (( B C F   ¯ C r ) =0.92), not being easily enriched in plants and having less effects on plants. The differences in the heavy metal enrichment ability of different plants in the same soil environment indicate that the external environment was not a decisive factor for heavy metal accumulation. Studies have shown that the coexistence of multiple heavy metals in the soil environment of the same region is different from the effect of a single heavy metal in the soil on plants, and the enrichment phenomenon of plants can be antagonistic or synergistic due to the presence of multiple heavy metals [51,52,53].
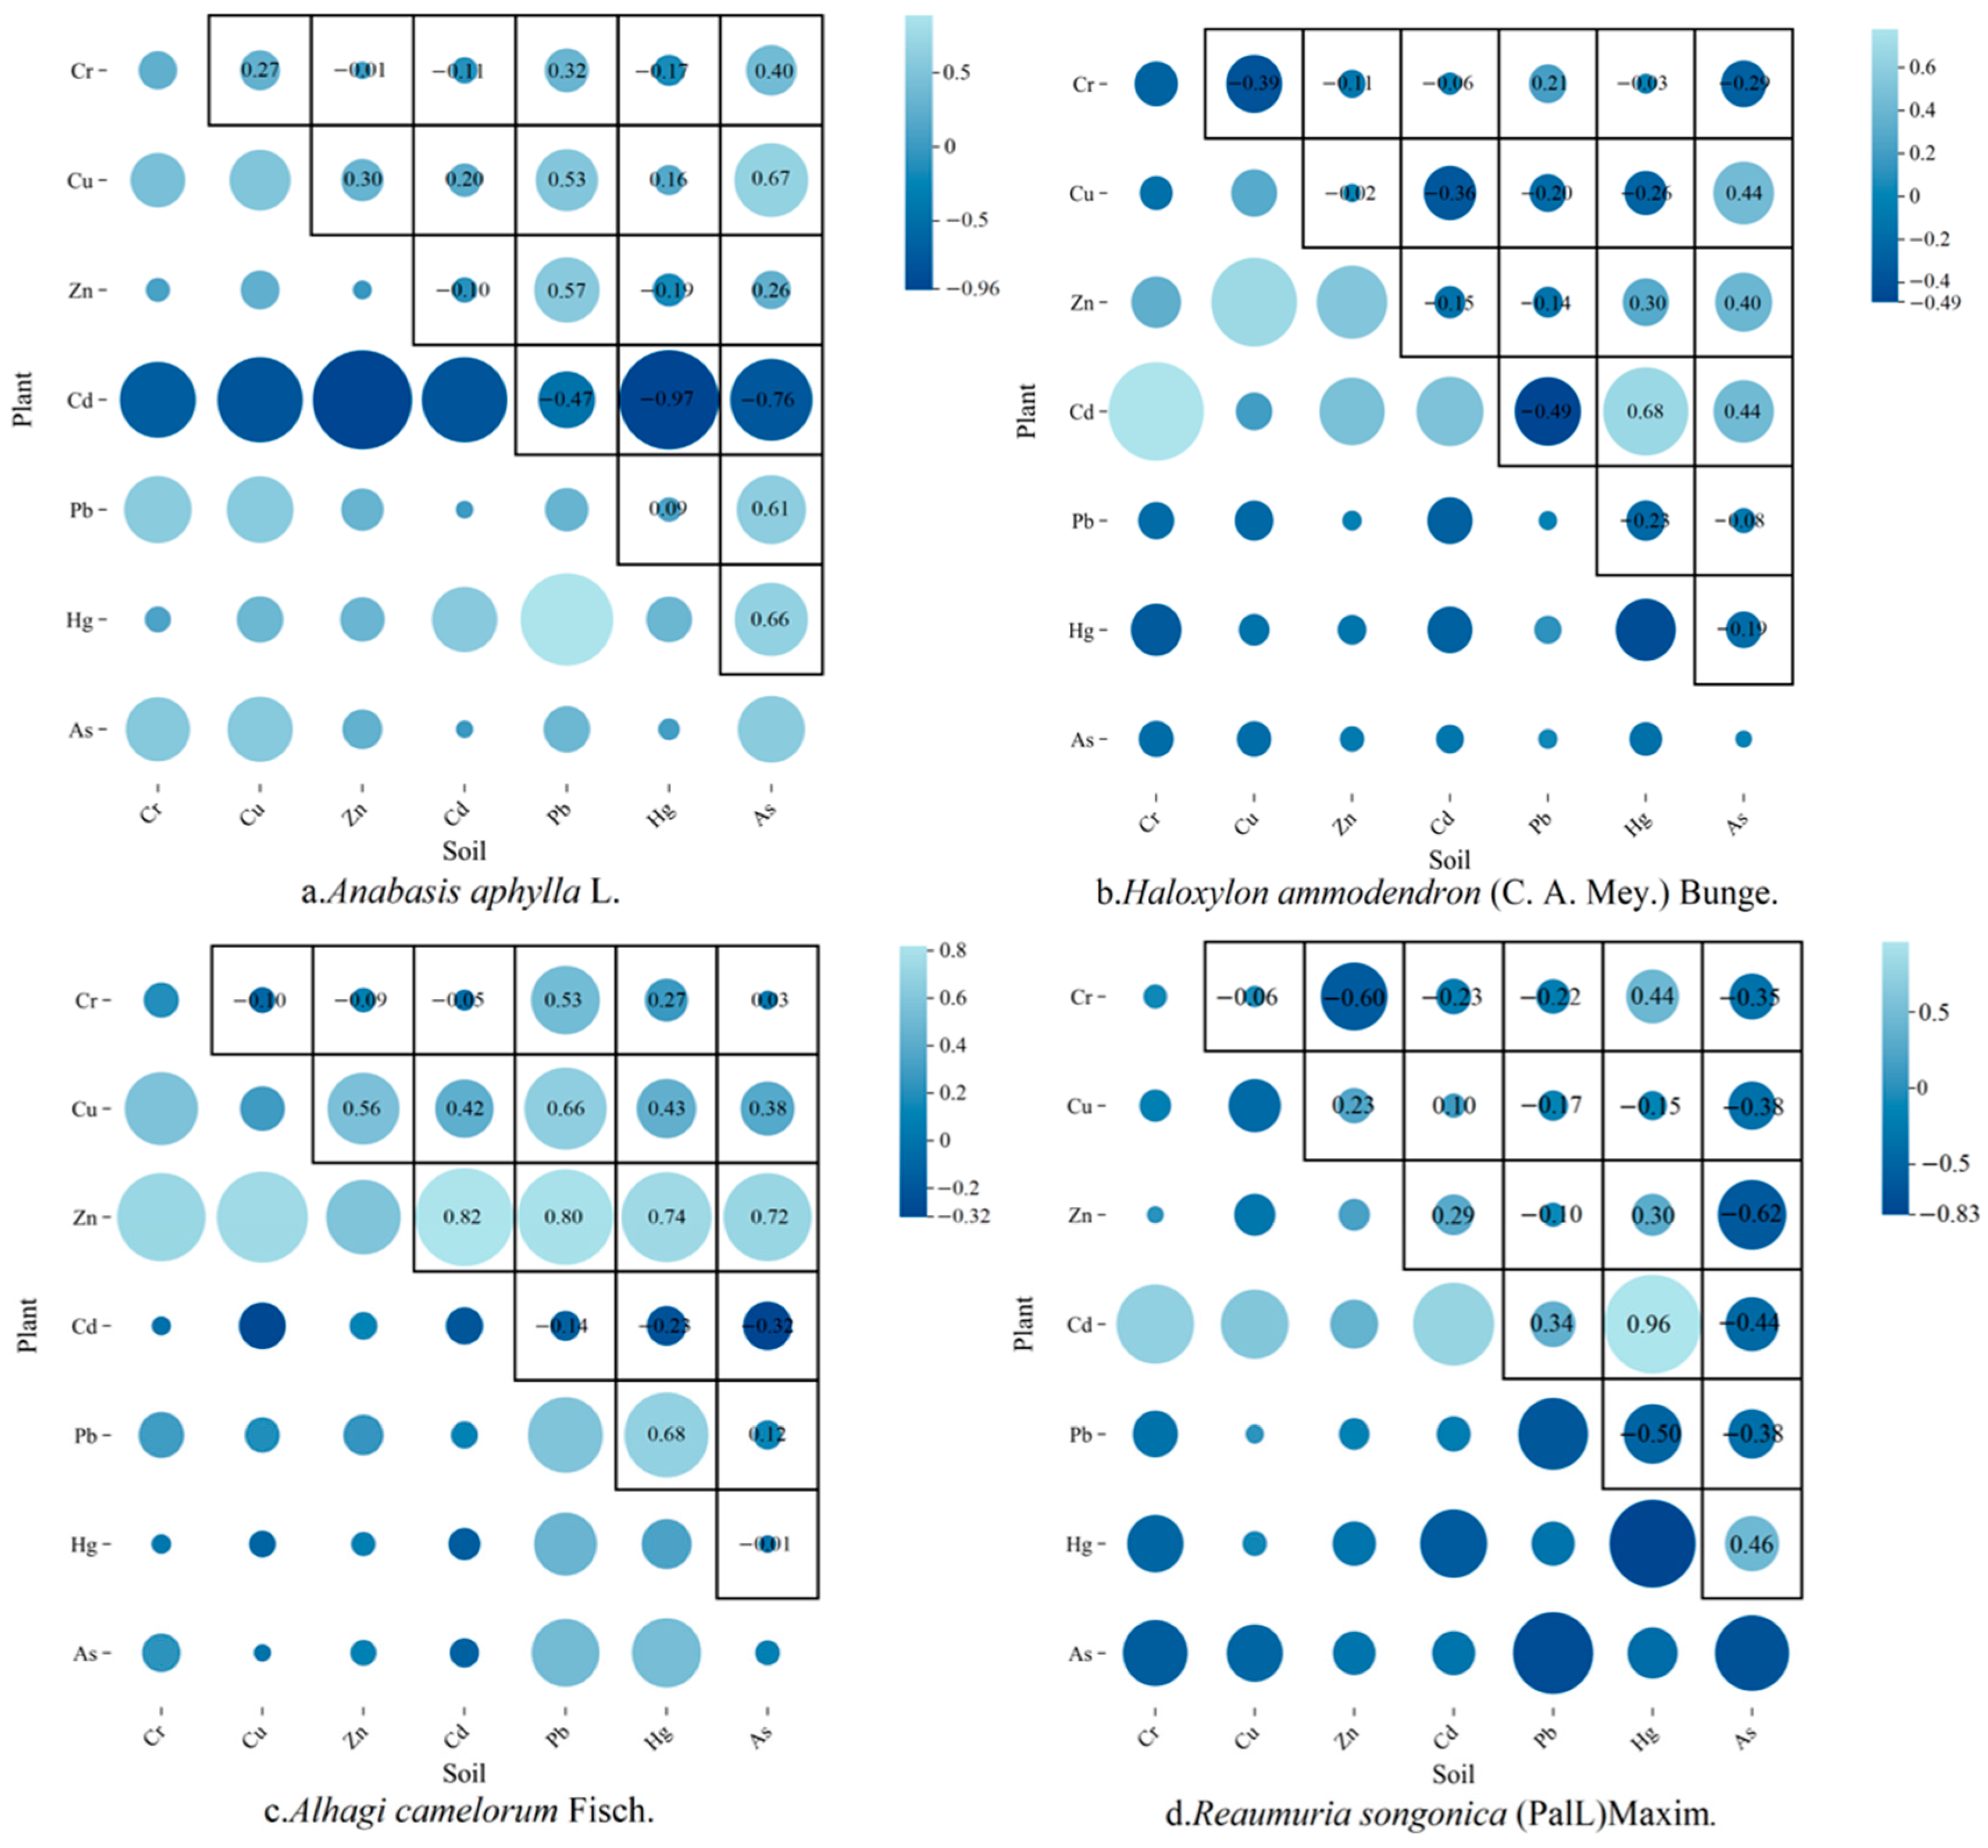
The correlation coefficients can effectively reflect the correlation between soil heavy metals and plant heavy metals, visualize the transfer efficiency of pollutants between environmental media, and explain the main sources of heavy metals in plants. In Figure 3, the correlations between seven heavy metals in four plant species and in soil are demonstrated. In Anabasis aphylla L., Cd-plant showed a very strong negative correlation (r = −0.967) with Hg-soil, suggesting that soil Hg contamination may inhibit the phytosorption of Cd or that the two are competitive; Cu-plant showed a significant positive correlation (r = 0.67) with As-soil, reflecting the fact that As can modulate and promote the translocation of Cu, whereas the correlation between Pb-plant and Pb-soil was only weakly correlated (r = 0.313), indicating that its accumulation was dominated by other factors. For Alhagi camelorum Fisch., Zn-plant showed strong positive correlations with Cd-soil (r = 0.82), Pb-soil (r = 0.795), and Hg-soil (r = 0.739), implying that Zn promotes multi-metal co-transport [54,55], and Cd-plant showed no significant correlation with Cd-soil (r = −0.208), indicating that its accumulation is dominated by other factors and thus indicating that its uptake is regulated by non-soil factors (e.g., atmospheric deposition). In Reaumuria songonica (PalL)Maxim., Cd-plant showed a strong positive correlation (r = 0.96) with Hg-soil, indicating that soil Hg contamination could promote Cd uptake in Reaumuria songonica (PalL)Maxim., which was diametrically opposed to Anabasis aphylla L., and demonstrated that the uptake of the same heavy metal varied among different plants, whereas As-plant showed a strong negative correlation (r = −0.761) with Pb-soil, which may be due to Pb As-plant being strongly negatively correlated with Pb-soil (r = −0.761), probably due to the inhibition of As enrichment by Pb; Cr-plant was negatively correlated with Zn-soil (r = −0.602), indicating that excess Zn would lead to the blockage of Cr uptake. In Haloxylon ammodendron (C. A. Mey.) Bunge., Cd-plant was positively correlated with Cr-soil (r = 0.778), indicating that Cr contamination in the soil may promote Cd accumulation in the plant, while Pb-plant was weakly correlated with soil Hg-soil (r = −0.226), suggesting that the two uptake pathways do not interfere with each other.
Heavy metal accumulation in plants was driven not only by soil concentrations but also by synergistic or antagonistic interactions between elements, such as the “bridging effect” of Zn in Alhagi camelorum Fisch. and the strong antagonism of Cd-Hg in Anabasis aphylla L. The low correlation of some elements (e.g., Cd in Alhagi camelorum Fisch.) with soil concentrations suggests that stomatal uptake, microbial activity, or genetic regulation may dominate the accumulation process [56].
The correlation coefficients and BCFs between soil heavy metals and plant heavy metals are key indicators for revealing the migration and transformation of pollutants in the soil–plant system, which is of great significance for ecological risk assessment and pollution control. Combining the BCFs and correlation coefficient, it can be found that the Cd in Haloxylon ammodendron (C. A. Mey.) Bunge. and Reaumuria songonica (PalL)Maxim. is positively correlated with the Cd content in the soil, with the BCF close to 1, suggesting that Cd is easily enriched and that Cd can have harmful effects on plants; in addition, the Zn in Haloxylon ammodendron (C. A. Mey.) Bunge., the Cu and As in Anabasis aphylla L., as well as the Zn and Pb in the Anabasis aphylla L. are positively correlated with the corresponding elements in the soil, but the enrichment of the above four types of elements in those plants are smaller, indicating that although the appeal of the three species of plants is sensitive to the content of Zn, Cu, As, and Pb in the soil, the accumulation ability is weak. These four species of plants are easily enriched by Cr elements, but the Cr in plants and the Cr in soil show a non-significant correlation, indicating that the four species of plants show extremely strong enrichment of Cr, which is not related to the soil content, which can thus be used for subsequent remediation of contamination [57].

2.3. Source Identification by APCS-MLR

The APCS-MLR model was used to analyze the sources of heavy metals in the above plants. Using a principal component analysis, the two main factor scores were converted to absolute principal factor scores, and multiple linear regression analyses were carried out, with the content of heavy metal elements in the measured vegetation as the dependent variable and the absolute factor scores as the independent variables, and the results are shown in Table A5. R2 is used to measure the correlation between the model and the actual observations, and the closer the value of R2 is to 1, the better the linear fit and the better the simulation results [58]. In this study, the R2 of the regression model for each element was greater than 0.5, and only the R2 of Pb was slightly lower, at 0.53. The results showed that the model had a better simulation effect.
The APCS-MLR model identified the main factors that had a greater effect on plant heavy metals based on a principal component analysis. The principal component analysis generated a four-dimensional model based on eigenvalues greater than 1, explaining 71.6% of the variance in the dataset. Among them, APCS1 explained 55.24% of the variance and consisted of Cr, Cu, Zn, Cd, and As, with a loading factor ≥ 0.64 (Table 5), which is a strong loading [59]. All of the above elements were positively correlated, and the significant correlation between heavy metal concentrations indicates that these elements have a common source [60]. From Figure 4, it can be seen that factor 1 has a large contribution to the elements Cd, Zn, and Cr with 63.49%, 55.66%, and 45.51%, respectively, as well as a large effect on Cu and As. Some studies have shown that As enters the environment with metal mining and smelting activities [61,62], and in China, As is mainly associated with Cu, Cu, and Sn deposits [63], and mining activities and smelting likewise cause rapid changes in the element Cd [64,65]. Therefore, factor 1 was initially determined to be mineral mining and smelting activities.
APCS2 explained 16.35% of the variance, including Cu, Pb, Hg, and As, of which the Hg and Pb loading coefficients reached 0.77 versus 0.74, and combined with Figure 4, it was concluded that factor 2 was closely related to the source of the element Pb, with a contribution of 72.92%. This study shows that gasoline combustion leads to an increase in Pb content [66], which determines that factor 2 is a transportation source.
When the APCS-MLR model was utilized to resolve the pollution sources, a class of unknown sources was resolved. Combined with Figure 4, it was concluded that unknown source 3 had a relatively high degree of association with elemental Hg, with a contribution rate of 56.18%. The enrichment of elemental Hg is usually considered to be dominated by mining pollution sources [67], and the Hg in the roots of woody trees and shrubs is mainly absorbed from the soil, while that in the aboveground part is mainly absorbed from the atmosphere [68,69], from which it can be deduced that unknown source 3 is a mixed source of complex origins.

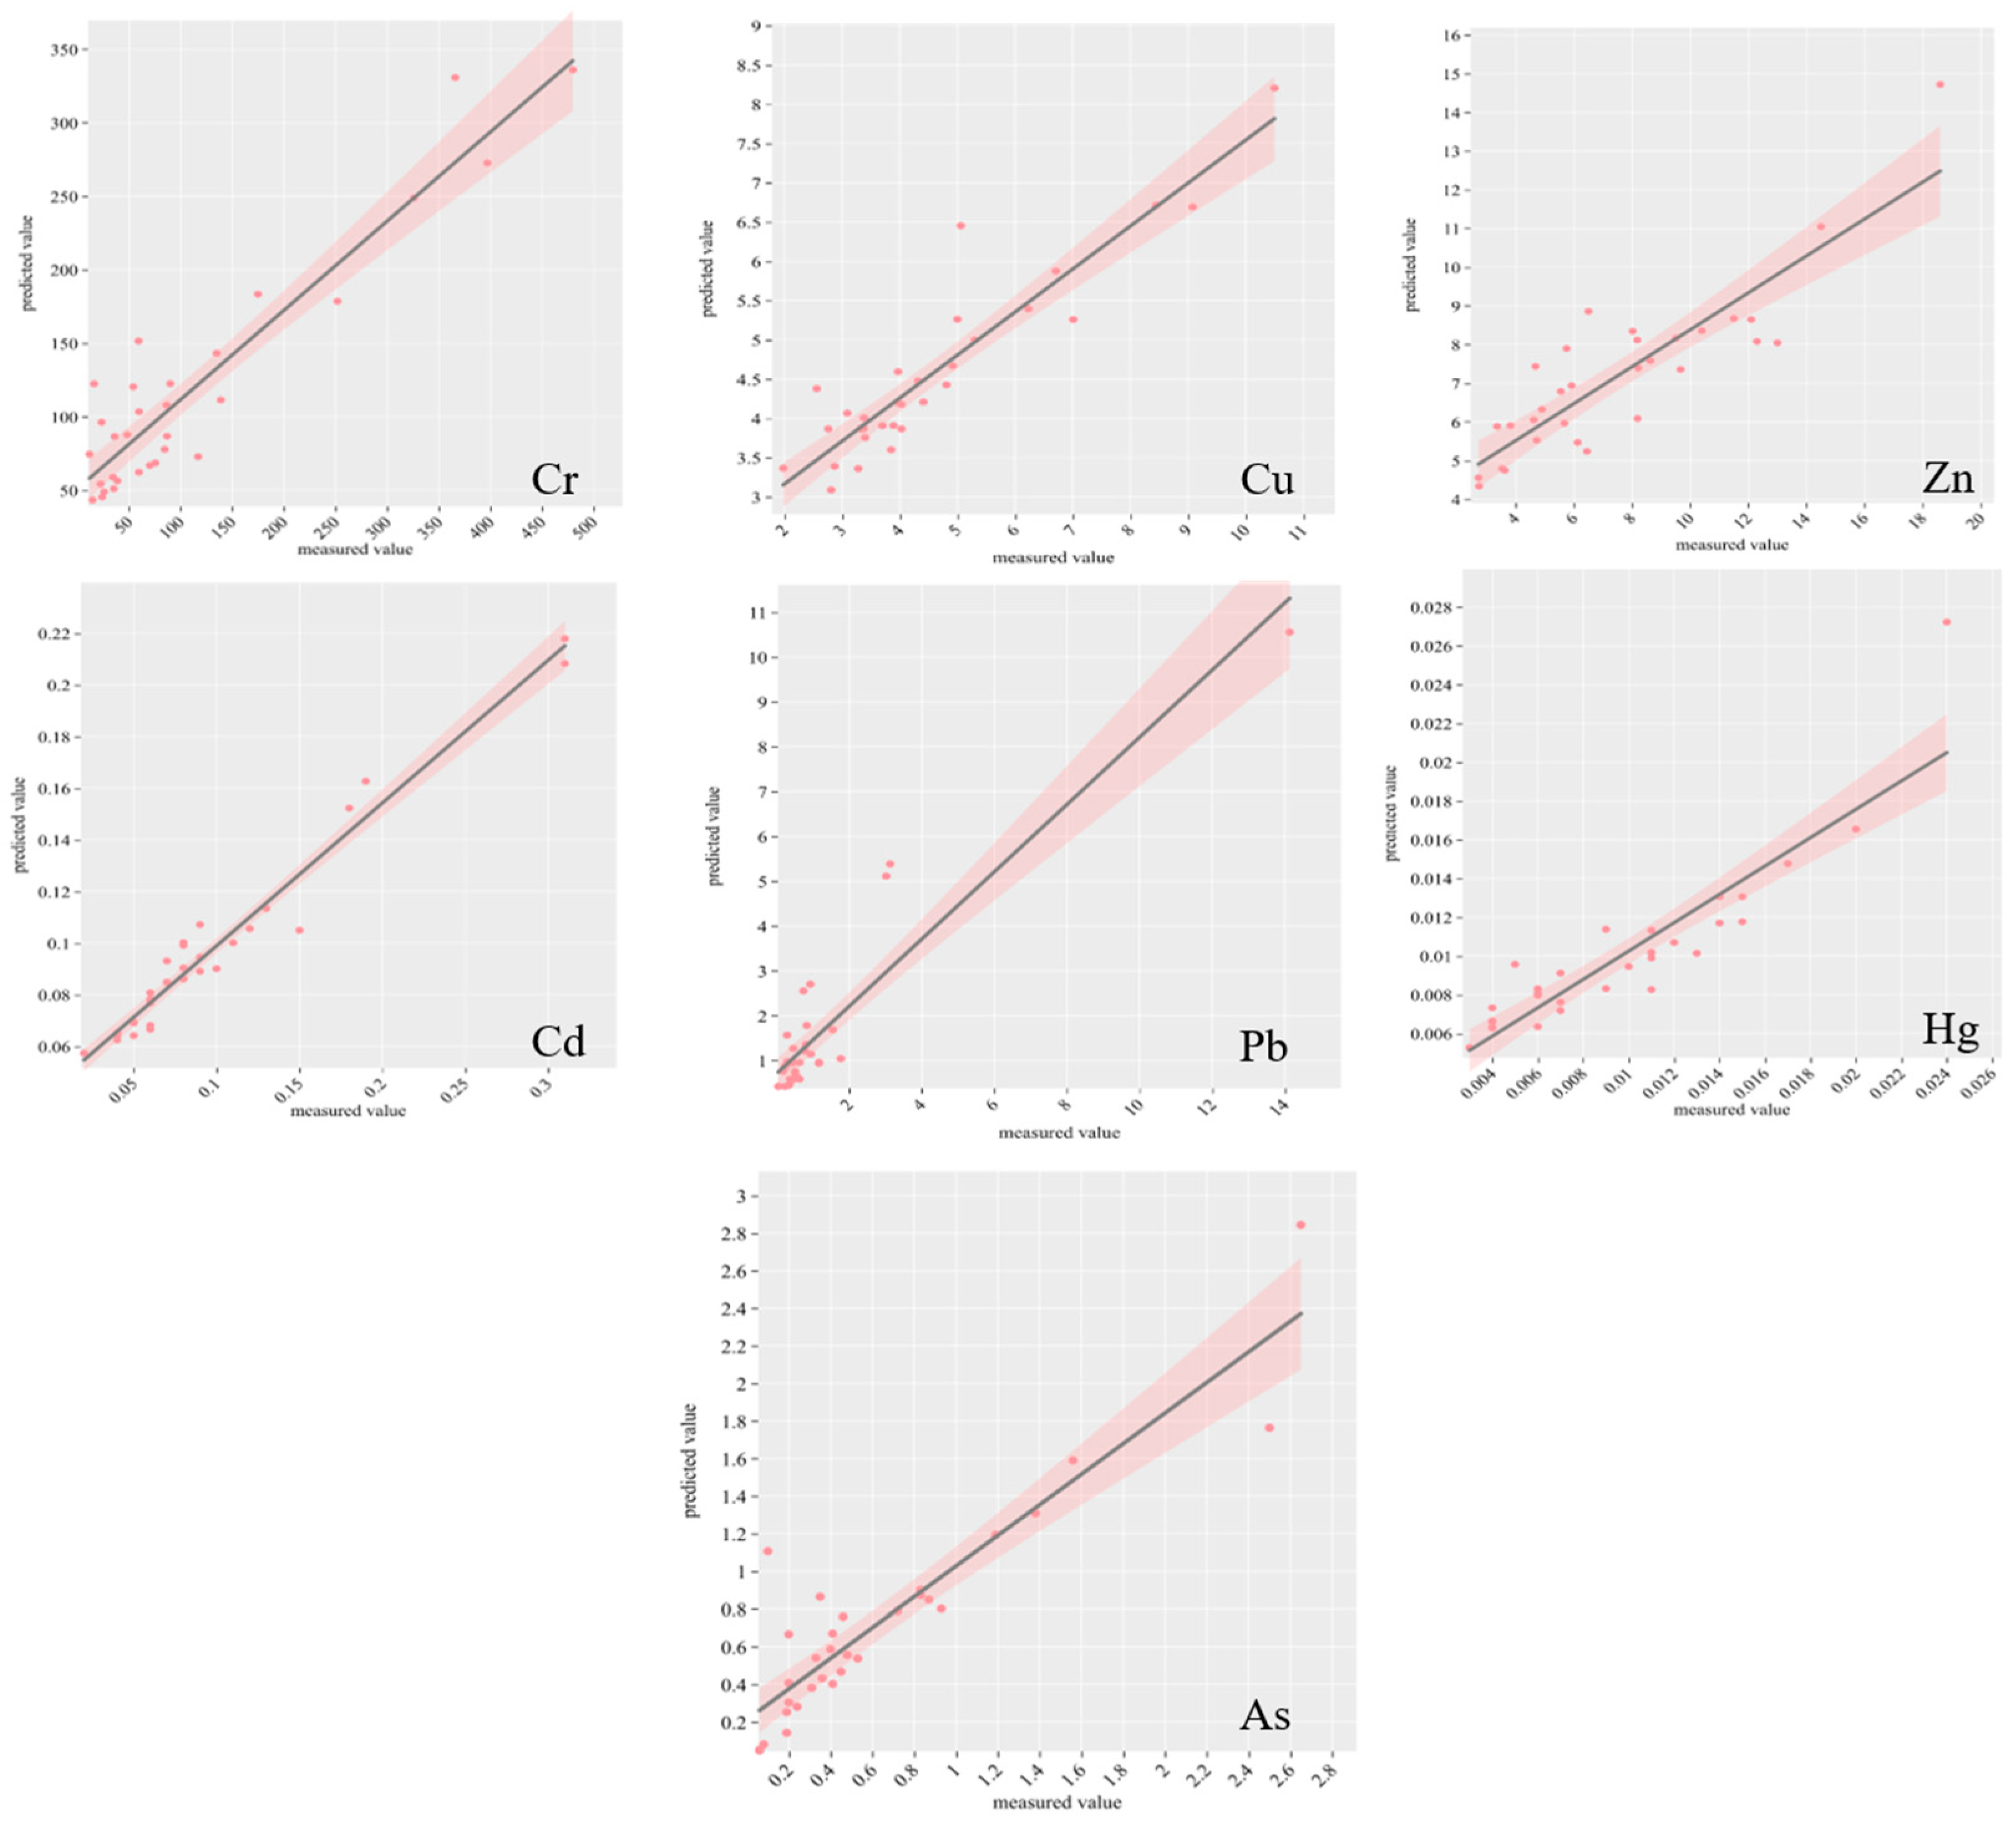
2.4. Random Forest Modeling to Predict Pollution Sources

The RF model prediction performance will be evaluated by R2, RMSE, MAE, and RPD, with R2 > 0.5 meaning that the model simulation performance is good [70]; the model fit is shown in Figure A1. According to Table 6, which assesses the predictive effectiveness of the RF model, the model showed good statistical significance for most of the heavy metal elements. In terms of goodness of fit (R2), the R2 values of the training set range from 0.72 (Zn) to 0.85 (Pb), indicating the model’s ability to explain data variability. In the test set, the R2 values of Cd (0.86), Cu (0.82), and As (0.81) are higher than or close to those of the training set. This demonstrates the model’s excellent generalization ability. However, the R2 value for Zn in the test set drops significantly to 0.54. This suggests that the model’s predictive ability may be limited by feature selection or differences in the data distribution. Regarding error analysis, the RMSE and MAE of the test set are generally lower than those of the training set (e.g., the RMSE of Cu decreases from 0.94 to 0.45, and the MAE of Pb decreases from 0.46 to 0.16). This indicates that the model has high prediction accuracy and stability for most elements. However, the RMSE of the Cr test set (58.88) is slightly lower than that of the training set, and the absolute error remains high. This may reflect data noise or a large concentration span. Regarding model consistency (RPD), the high RPD values of Cd (2.66), Cu (2.35), and As (2.27) suggest robust and reliable predictions, while the low RPD values of Zn (1.48) and Cr (1.78) imply unstable predictions. Taken together, the model’s predictions for elements such as Cd, Cu, Pb, and As are statistically significant (R2 ≥ 0.75 for the test set) and suitable for practical scenarios, such as pollution a source analysis or risk assessment. However, Zn predictions need further optimization; introducing relevant environmental factors or adjusting the model structure may be necessary. Overall, the model is valuable in environmental science but needs improvement.
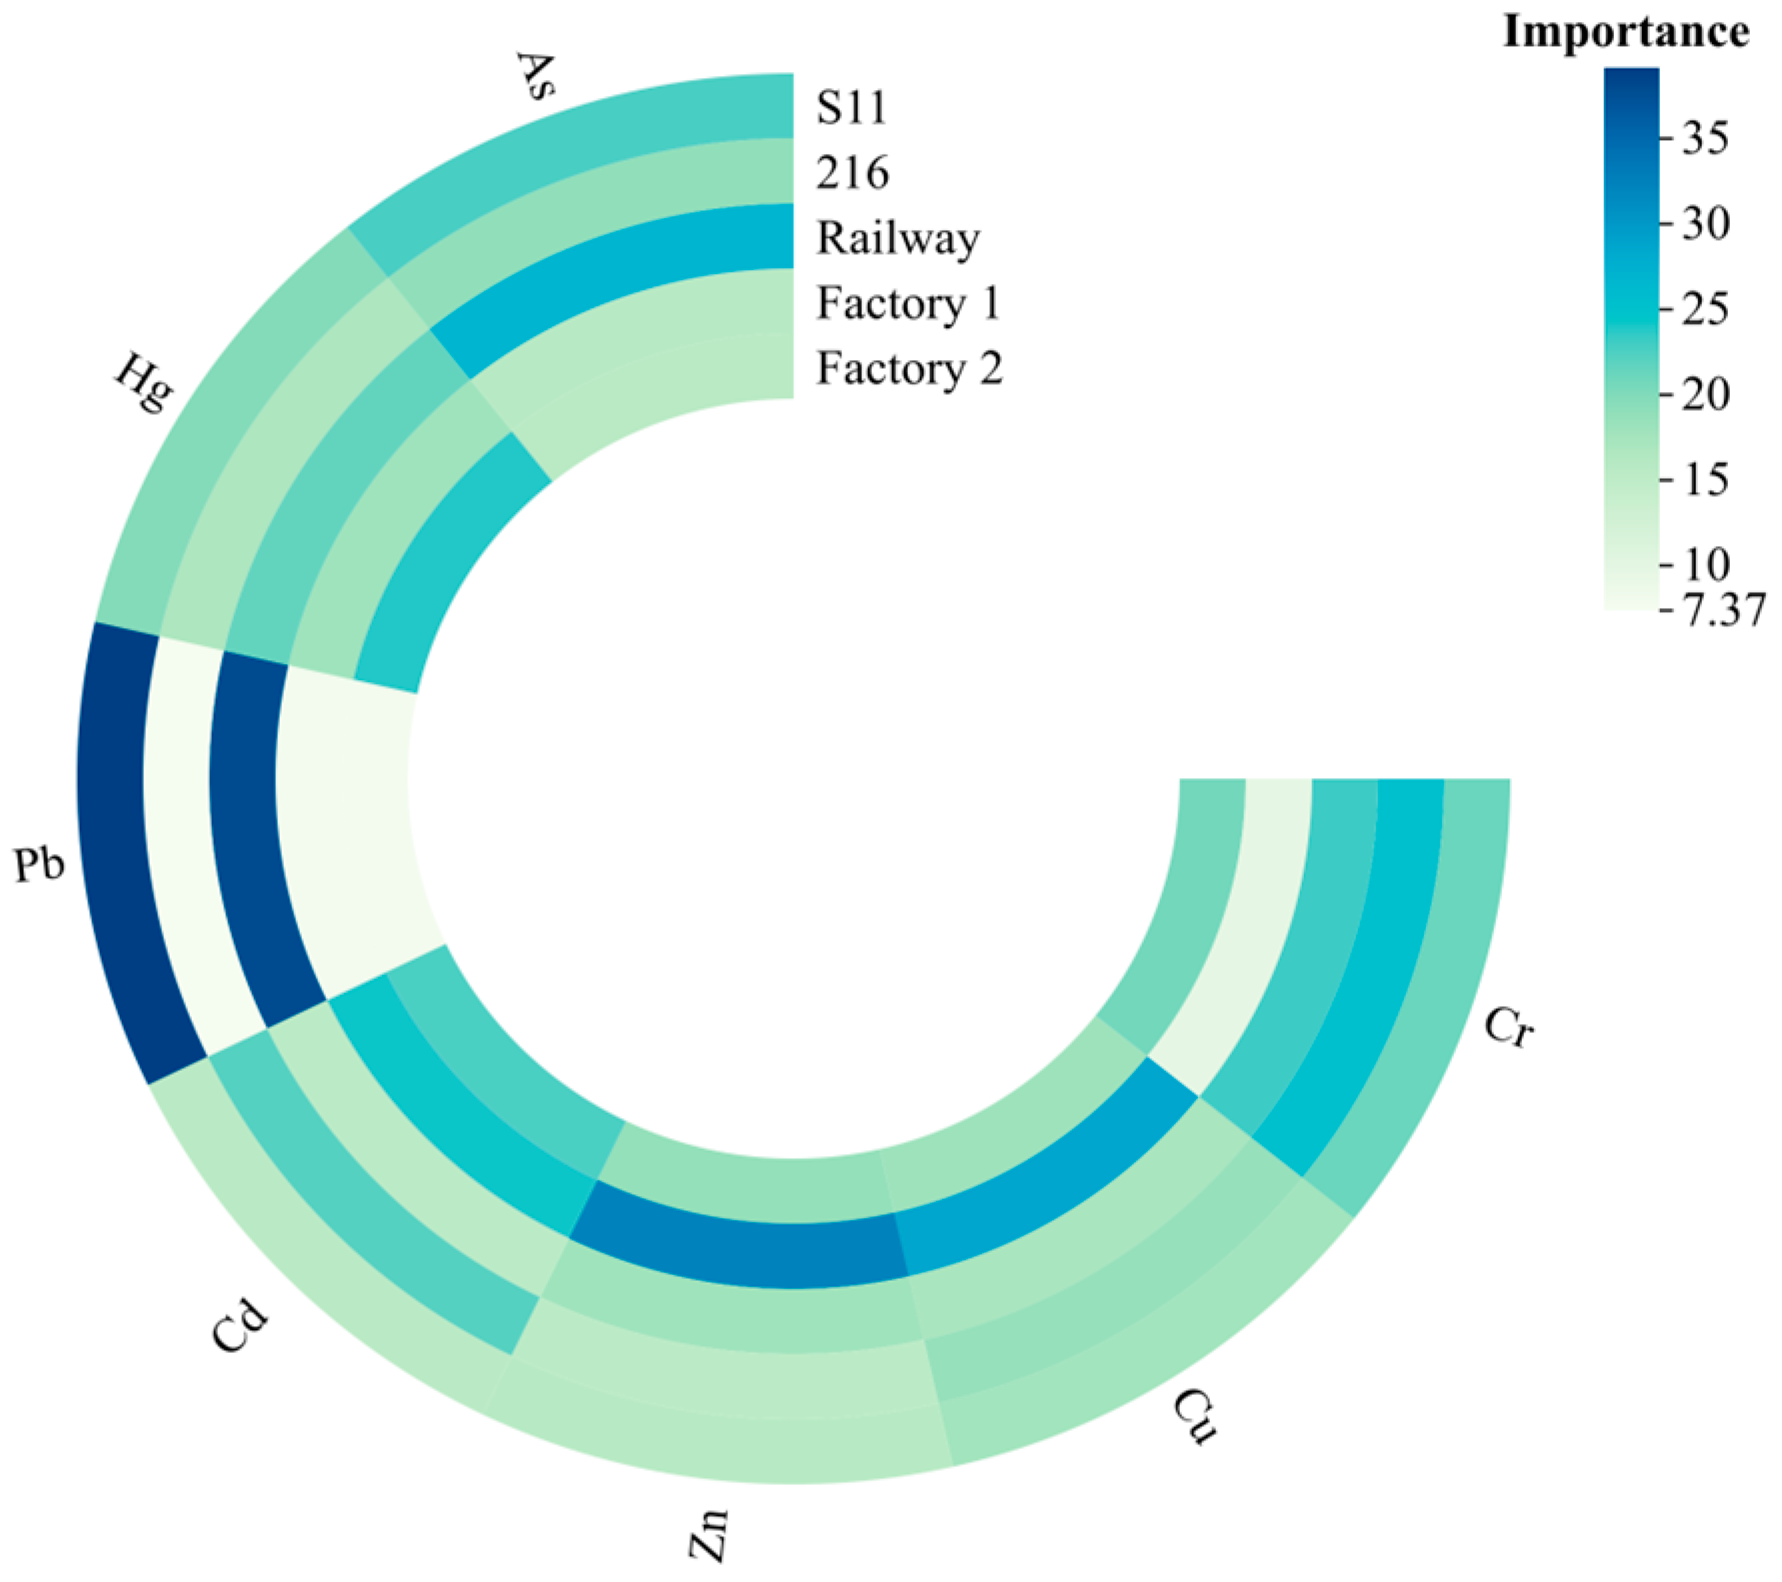
The results of the RF model pollution source analysis are shown in Figure 5. As a whole, the two roads, railroad and S11, contributed the largest percentage. For Cr elemental pollution sources, 216 provincial road contributes, the most with 25.32%; factory 1 contributes the least, with 9.55%; and the remaining three sources account for 20.78 to 23.14. For Cu, factory 1 contributes the most, with 28.70%, and the other four sources account for 17.13 to 18.53. For Zn, factory 1 contributes the most, with 32.28%, and the other four sources account for the range of 17.13 to 18.53. For Zn, the largest contribution is from factory 1, with 32.28%, and the other 4 sources range from 15.36 to 18.76. The sources of Cd are more complex, with 24.24%, 22.68%, and 22.16% from factory 1, factory 2, and Provincial Highway 216, respectively, and 15.40% and 15.52% from railroads and S11, respectively, for the rest. For Pb, the greater contribution is made by railroads and S11, with 37.99% and 39.15%, both of which account for the majority of the pollution sources. The greater contribution of elemental Hg is made by plant 2 and railroads, with 23.91% and 21.54%, respectively, while the remaining three sources range from 16.81 to 19.82. For As, the greatest contribution is made by Railroad and S11, with 26.82% and 22.77%, and the remaining 3 sources range from 15.79 to 18.97.
Overall, the synergistic increase in the contributions of Cr, Zn, and Cd in the factory 1 and factory 2 areas indicates that all three elements are influenced by industrial activities, whereas the close association of the elements Pb and As with S11 suggests that the transportation activities have a greater impact on them. The remaining elements, Hg and Cu, are influenced by a combination of industrial production and transportation.

3. Discussion

3.1. Characterization of Soil–Plant Heavy Metal Pollution and Ecological Risks

The most serious levels of Cd and Hg contamination were found in the soils of the Kalamaili Mountains Nature Reserve, with potential ecological risk indices of 1205 and 844.71, respectively, which belonged to the serious risk classes. This conclusion is consistent with the ecological risk assessment system proposed by Hakanson, in which highly toxic elements can cause significant ecological hazards even at low concentrations [71]. Cr in plants poses a high ecological risk, exceeding the standard limits by 31.89 to 147 times. Khalili et al. [72] investigating the feasibility of cereals and quinoa as bioindicators of heavy metal pollution in soil using factorial pot experiments, concluded that wheat was highly susceptible to the accumulation of Pb, Cr, and Zn; that all four plant species in the study area were susceptible to the accumulation of Cr and Hg; and Cd easily accumulated in Anabasis aphylla L., indicating that different plants have different accumulation capacities for different heavy metals. Chen et al. [73] analyzed the heavy metal content in vegetables in Baotou, Inner Mongolia, and showed that the uptake and translocation of heavy metals were affected by environmental factors, resulting in different concentrations in different vegetable species. The results of Anwar et al. [74] showed that plants produce a chelating agent (a class of enzymatically synthesized cysteine-rich polypeptides that form complexes with a variety of metals), which limits the entry of metal ions into root cells through chelate sequestration. Furthermore, Panda et al. [75] showed that the accumulation of heavy metals in plants is influenced by the exchangeable state of the soil, as well as by a variety of transporter proteins and adaptive mechanisms in the plant. The results of Millaleo and Proshad et al. [76,77] also showed that the uptake of heavy metals by plants depends on the elemental content of the sediment and the physiological environment of the plant. The results of the present study also showed that the uptake and translocation of the same heavy metals varied among plants. In addition, the present study found a strong correlation between plant heavy metal content and soil heavy metal content, which is consistent with the findings of Lu et al. [78]. The low correlation between heavy metal contents between some plants and soil indicated that their uptake was dominated by non-soil factors [79]. The heavy metal contents of the four plants in the study area are subject to variation, attributable to the combined influence of intrinsic plant factors and external factors. A targeted approach to treatment, informed by the unique characteristics of each plant, can be employed to mitigate subsequent pollution. For instance, the planting of Reaumuria songonica (PalL)Maxim. and Haloxylon ammodendron (C. A. Mey.) Bunge in the area with severe Cd pollution can be reduced to mitigate harm to organisms. Additionally, the utilization of heavy metal elements with high correlation to the soil–plant system (e.g., Zn, As, etc.) can serve as indicator markers of the entire soil–plant system, thereby revealing the current status of the ecological environment.

3.2. Analysis of Soil–Plant Heavy Metal Pollution Sources

The joint application of APCS-MLR and RF provided complementary perspectives for the quantification of pollution sources. The APCS-MLR analysis showed that the contribution of industrial activity sources to Cd, Zn, and Cr was more consistent with the regional industrial layout, while the dominant role of transportation sources for Pb was consistent with the findings of Huang et al. on the emission of Pb from transportation activities [80]. The RF model further verified the composite effect of industrial activities and transportation sources, but its predictive performance for Zn was low, probably due to the dispersed importance of the model features due to the diversity of Zn sources. Yuan et al. [81] suggested in their study that animal manure also causes Zn pollution, and combined with the biological characteristics of the study area, it can be concluded that Zn is most likely to be affected by a combination of factors such as industry and animal manure. Shaikh et al. [82] pointed out in their study that the heavy metal contamination of plants may originate from sediments, industrial activities, and other human activities. Du et al. [83] pointed out that Cr contamination can be influenced by both electroplating and diagenesis. In this study, combining the conclusions of the APCS-MLR model with the analysis of the contribution of RF to the potential sources of contamination, we concluded that Cr contamination is mainly influenced by industrial activities. For the source of Hg contamination, Wu and Talukder et al. [84,85] all showed that industrial activities, sewage irrigation, domestic waste, and coal combustion for heating can lead to Hg contamination, and this study advocated that Hg comes from a mixed source of contamination based on the special geographical location of the study area, where both industrial activities and coal combustion have a strong influence. Regarding the source of Cd, Fu et al. [86] showed that industrial pollution, soil erosion, atmospheric deposition, and agricultural activities all contribute to Cd pollution. Since agricultural activities cannot be carried out in the study area and the surrounding area is characterized by intensive industrial activities, the possibility of Cd contamination due to industrial activities is higher. Tong et al. [87] showed that industrial activities such as mining and smelting can lead to the cumulative contamination of Cu and As in the area, and in the light of the actual situation of the study area, the Cu and As contamination of the study area also originated from industrial activities such as mining and smelting. In summary, the soil–plant in the study area is mainly affected by industrial activities and their subsidiary activities. Heavy metal pollutants, generated by industrial activities, migrate into the soil and plants in the study area via transportation, atmosphere, and other pathways. Additionally, plants’ own transit enrichment of heavy metals further leads to the emergence of heavy metal pollution in plants, which ultimately develops into the systematic pollution of soil–plants. In order to prevent the exacerbation of ecological security by heavy metal pollution, it is essential to exercise caution when discharging industrial waste and to strictly demarcate the study area according to its pollution levels. Furthermore, different treatment measures should be taken according to the degree of pollution.
Meanwhile, the differences between the two models were demonstrated in this study. APCS-MLR relies on the linear assumption of principal components, which may underestimate the nonlinear pollution process, while RF can integrate data from multiple sources, but its “black-box” characteristic limits the direct correlation of chemical characteristics of the pollution sources. Future studies may try the hybrid modeling framework to balance the interpretability and prediction accuracy.

3.3. Limitations

The present study exclusively examined representative plants in the designated study area. The plant species are limited; therefore, a subsequent study can include additional species for comparison and analysis of their differences. Furthermore, the model’s accuracy can be enhanced by incorporating additional influencing variables and subdividing the influencing factors of heavy metal pollution in the soil–plant system.

4. Materials and Methods

4.1. Study Area

The Kalamaili Mountain Nature Reserve, located in the eastern part of Junggar Basin in Xinjiang Uygur Autonomous Region of China, is a very important hoofed reserve in China, with a total area of 14,856.48 km2, and its geographic coordinates are 44°36′–46°00′ N, 88°30′–90°00′ E. It has a typical temperate continental arid climate, with hot summers and bitterly cold winters. The administrative area of the reserve covers Fuyun County, Qinghe County, and Fuhai County in the Altay Region and Fukang City, Jimusar County, and Qitai County in Changji Hui Autonomous Prefecture. The plants growing in the reserve mainly include Anabasis aphylla L., Alhagi camelorum Fisch., Reaumuria songonica (PalL) Maxim., Haloxylon ammodendron (C. A. Mey.) Bunge., etc., which provide food for a variety of rare wildlife such as Equus ferus, Equus hemionus, Gazella subgutturosa, etc., which live in the protected area.

4.2. Sampling and Analysis

4.2.1. Layout of Sample Locations and Design of Sample Collection

In the present study, samples were collected in July 2024 during field surveys in the study area. A total of 36 plants, including 9 Anabasis aphylla L., 7 Alhagi camelorum Fisch., 6 Reaumuria songonica (PalL)Maxim., and 12 Haloxylon ammodendron (C. A. Mey.) Bunge., were randomly sampled in 5 m × 5 m sample plots with good coverage and representative of the different plants in the study area, and surface soil samples were collected from 0 to 20 cm at the same locations. The coordinates of each center sample were recorded as a sampling point location using GPS, and the samples were collected (Figure 6), marked and numbered, brought back to the laboratory, dried, pulverized, and finally determined for heavy metal content.

4.2.2. Analysis of Collected Sample

Cd, Pb, Cr, As, Zn, and Cu in the plant samples were determined by inductively coupled plasma mass spectrometry (Agilent 7900) after pretreatment, and Hg in the plant samples was determined by atomic fluorescence spectrometry (Beijing Pudan PF52). The soil samples were pretreated, and then, inductively coupled plasma mass spectrometry (ICP-MS) was used for the determination of Cd, Pb, Cr, Zn, and Cu in the soil samples and atomic fluorescence spectrometry (AFS) was used for the determination of As and Hg in the soil samples. The following sample preparations are required for the determination of heavy metals in plants using both ICP-MS and AFS: weigh about 0.5 g of sample, and add 5 mL of HNO3 and 4 mL of H2O2 microwave digestion and then volume to 50 mL. Before using ICP-MS to determine the heavy metal content of the corresponding element in the soil, it is necessary to weigh about 0.1 g of sample and add 10 mL of mixed acid (HNO3: HFO4: H2O: HF volume ratio of 5:1:4:10) to dissolve the sample. After the perchloric acid fumes are exhausted, add 3 mL of HCL (1:1) to extract it, and then, cool it down to 50 mL, using AFS to determine the heavy metal content of the corresponding elements in the soil before adding 0.5 g of the soil sample to a 25 mL colorimetric tube; adding a little water to wet the sample; adding 5 mL of aqua regia; stoppering it; shaking it well in a boiling water bath for 2 h; then, diluting it with water to scale; shaking it well again; and placing the sample for determination. To ensure the quality of the samples, the repeat sampling rate was kept at 10–15%, and the recovery rate met the analytical quality control requirements.

4.2.3. Data Preprocessing

The data were preprocessed using Excel 2019 (Microsoft, Redmond, WA, USA) software. A principal component analysis and a multifactor regression analysis were performed using SPSS 22.0. (IBM, Armonk, NY, USA). Principal components with eigenvalues of >1 were retained (Kaiser criterion). Arc CIS 10.8 (ESRI, NY Str., Redlands, CA, USA.) was used for the spatial analysis as well as to produce plots, and Python 3.7 was used for modeling and analysis of the random forest model.

4.3. Research Methods

In this paper, the potential ecological risk index (RI) and the Nemerow pollution index (NIPI) were used to evaluate the heavy metal pollution of soil samples. In addition, enrichment coefficient and Pearson’s correlation coefficient analyses were used to study the correlation between soil heavy metal content and plant heavy metal content, and APCS-MLR as well as the random forest model were used to analyze the source of plant heavy metal pollution.

4.3.1. Nemerow Pollution Index (NIPI)

The NPI takes into account each of the individual assessment factors, while also emphasizing the importance of the most polluted components [88]. The formula is as follows:
N I P I = P a v e 2 + P m a x 2 2
P i = C i B i
where Pave represents the average pollution index of a single element, with the pollution factor used in this study, and Pmax is the maximum value of the element. pi is the pollution index of a single factor, Ci is the measured value of heavy metals, and Bi is the background value of soil in Xinjiang [89]. The specific classification criteria are shown in Table A6.

4.3.2. Potential Ecological Risk Index (RI)

The RI was proposed by Swedish researcher Lars Hakanson in 1980 and can be used in the assessment of sediments over large areas to synthesize the potential impacts of heavy metals on ecosystems [90]. The index is calculated as follows:
R I = i = 1 n E r i
E r i = T r i × P i
where RI is the integrated potential ecological risk index, Eri is the individual potential ecological risk index of heavy metal i, Tri is the toxicity coefficient of heavy metal i, and Pi is the single-factor pollution index. According to the literature, the toxicity response coefficients of Cd, Pb, Cr, As, Zn, Cu, and Hg are 2, 5, 1, 30, 5, 40, and 10, respectively [91]. The criteria for categorizing the potential ecological risk index of soil heavy metal pollution are shown in Table A7.

4.3.3. Bioconcentration Factors (BCFs)

BCF is the ratio of the elemental content of a part of the plant to the corresponding elemental content of the soil, which to some extent, reflects the ease of elemental transport in the sediment–plant system and indicates the enrichment of heavy metals in the plant [92]. This indicator is calculated as follows:
B C F = C p C s
where Cp is the heavy metal content in the aboveground part of the plant and Cs is the heavy metal content in the sediment.

4.3.4. Pearson Correlation Coefficient

The Pearson correlation coefficient was used to assess the correlation between soil heavy metals and plant heavy metals. Pearson’s correlation coefficient is mostly used in factor analysis to calculate the degree of correlation between factors [93]. It is calculated as follows:
r = X i X ¯ Y i Y ¯ X i X ¯ 2 Y i Y ¯ 2
where Xi and Yi are i observations of the two variables, respectively, and   X   ¯ and   Y   ¯ are the mean values of the two variables.

4.3.5. Absolute Principal Component Score–Multiple Linear Regression (APCS-MLR)

The APCS-MLR model was first proposed by Thurston et al. [94]. The principal components of plant indicators were first extracted to provide a basis for the discrimination and quantification of pollution sources. It is calculated as follows:
A Z k = j = 1 P W j × Z k
Z k = C k C ¯ / σ
where (AZ)k is the score value of PCA of plant heavy metal elements; Wj is the factor coefficient of j PCA, where j is the serial number of the principal component obtained in the process of PCA; Zk is the standardized value of plant heavy metal concentration in the bottom k points; Ck is the concentration of plant heavy metal elements in the kth points, which is the arithmetic mean of the pollutant concentration; and σ is the measured concentration of plant heavy metal elements’ standard deviation (all units: mg·L−1).
The (AZ)k values must first return the standardized factor scores back to non-standardized absolute principal component scores (APCSs) before they can be used in the analysis of PCs’ contribution to pollution indicators. Their APCS is calculated as follows:
A P C S j k = A Z j k A 0 j
A 0 j = i = 1 q S i j × Z 0 i
Z 0 i = 0 C i ¯ / σ i
where APCSjk is the APCS value of the j principal component; (AZ)jk is the score value of the j PCs; (A0)j is the score value of the PCs under the value of 0; Sij is the factor score coefficient, where i is the serial number of the water chemistry factor; (Z0)i is the standardized value of the pollutant concentration of the observation point when the pollutant concentration is set to 0; C is the arithmetic mean value of the concentration of the i phytoalexin; σi is the standard deviation of the concentration of the i phytoalexin arithmetic mean; and σi is the standard deviation of the heavy metal element concentration of the i plant. In the formula, APCSjk is the APCS value of the j principal component; (AZ)jk is the score value of the j PCs; (A0)j is the score value of the PCs under the value of 0; Sij is the factor score coefficient, in which i is the serial number of the water chemistry factor; (Z0)i is the standardized value of the pollutant concentration of the observation point when it is set to 0; C is the arithmetic mean value of the concentration of the i plant heavy metal; and σi is the standard deviation of the heavy metal element concentration of the i plant (all units: mg·L−1).

4.3.6. Random Forest Model (RF)

The random forest model combines integrated learning with decision tree modeling [95]. Each decision tree in the RF model is constructed by randomly selecting a subset of variables from the original dataset using bootstrap and bagging techniques to avoid overfitting and ensure relatively robust results [96]. However, not all samples were used in the tree generation process. Unused samples omitted from the original dataset are known as out of bag (OOB) samples [97]. The unused out of bag samples will be used to evaluate the performance of the RF model generated by the test.
The data used in the current study include the data-processed heavy metal content of different plants as well as data on five potential sources of contamination, and the infrastructure under consideration includes factory 1, factory 2, railroads, National Highway 216 (henceforth referred to as 216), and the S11 highway (henceforth referred to as S11). The random forest model will build multiple decision models to construct a decision tree by randomly selecting samples from the sample. The above process will be repeated several times to make the final prediction.

5. Conclusions

The soils of the Kalamaili Mountain Nature Reserve are seriously polluted by Cd and Hg and have great ecological risks, and the Cr and Hg in the four plants exceed the standard limits and are easily enriched in the plants, causing ecological hazards. The significant differences in Pb, Hg, and As contents in the four species were mainly due to significant differences in Anabasis aphylla L., Reaumuria songonica (PalL)Maxim., and Haloxylon ammodendron (C. A. Mey.) Bunge. Different plants have different enrichment abilities for different heavy metals, and all four plants are easily affected by an enrichment of Cr, Hg, and Cd, among which, Anabasis aphylla L. has a stronger response to Cd enrichment. The remaining elements—Cu, Zn, Pb, and As—were not easily enriched in plants. Generally speaking, plants and soil are closely connected, but due to the complex mechanism, the heavy metal content in plants is easily affected by external environmental factors and their own joint influence. The heavy metal pollution of plants in the protected area shows the compound driving characteristic of “industry–traffic”, which affects the ecological environment of the protected area. It is recommended to prioritize the control of industrial emissions and transportation sources and to carry out long-term monitoring to assess the effectiveness of remediation measures, so as to promote improvements in the ecological environment of the protected area.

Author Contributions

Conceptualization, J.L., B.N. and A.A.; methodology, J.L. and B.N.; software, J.L., B.N. and D.G.; validation, J.L. and A.A.; investigation, J.L., B.N., D.G., X.L. and A.A.; data curation, J.L. and B.N.; writing—original draft preparation, J.L. and A.A.; writing—review and editing, J.L. and A.A; visualization, J.L.; supervision, A.A.; project administration, A.A.; funding acquisition, A.A. All authors have read and agreed to the published version of the manuscript.

Funding

This research was funded by the National Natural Science Foundation of China (grants number 42167058).

Data Availability Statement

The data presented in this study are available from the corresponding author on request. The data are not publicly available due to the ongoing nature of the research.

Acknowledgments

This work was supported by funds from the National Natural Sciences Foundation of China (No. 42167058) provided to the corresponding author, which is gratefully acknowledged. In addition, we express our sincere thanks to the anonymous reviewers for their important comments and helpful suggestions, which have played a positive role in improving this paper. We will continue to endeavor to improve the quality of our research in return for your support.

Conflicts of Interest

The authors declare no conflicts of interest.

Abbreviations

The following abbreviations are used in this manuscript:
CrChromium
CuCopper
ZnZinc
CdCadmium
PbLead
HgMercury
AsArsenic
MaxMaximum value
MinMinimum value
MedianMedian value
MeanMean value
CVCoefficient of variation
SDStandard deviation
NIPINemerow pollution index
Pi Individual pollution index
RIComprehensive ecological risk index
PC1Principal component 1
PC2Principal component 2
Factor 1The first impact factor
Factor 2The second impact factor
Factor 3The third impact factor
R2Coefficient of determination
RMSERoot mean square error
MAEMean absolute error
RPDRelative percent difference
S11S11 highway
216National Highway 216

Appendix A

Appendix A.1

Table A1. Significance of soil heavy metal content in comparison with background values in Xinjiang.
CrCuZnCdPbHgAs
p-value0.91830.993410.1994111
Table A2. Significance of plants’ heavy metal content in comparison with the standard.
CrCuZnCdPbHgAs
p-value0.00010.00010.000010.000010.000010.36990.00001
Table A3. Significance test for heavy metal content among plants.
CrCuZnCdPbHgAs
p-value0.12100.06990.32200.06930.0010.00540.0019
Table A4. Significance test for heavy metal (Pb, Hg, and As) content among plants.
Alhagi camelorum Fisch.Anabasis aphylla L.Reaumuria songonica (PalL)Maxim.Haloxylon ammodendron (C. A. Mey.) Bunge
PbAlhagi camelorum Fisch.10.51190.45070.5330
Anabasis aphylla L.0.5119110.0079
Reaumuria songonica (PalL)Maxim.0.4507110.0063
Haloxylon ammodendron (C. A. Mey.) Bunge0.53300.00790.00631
HgAlhagi camelorum Fisch.110.68160.4297
Anabasis aphylla L.1110.0777
Reaumuria songonica (PalL)Maxim.0.6816110.0098
Haloxylon ammodendron (C. A. Mey.) Bunge0.42970.07770.00981
AsAlhagi camelorum Fisch.110.92830.2660
Anabasis aphylla L.1110.0145
Reaumuria songonica (PalL)Maxim.0.9283110.0096
Haloxylon ammodendron (C. A. Mey.) Bunge0.26600.01450.00961
Table A5. Coefficients of the linear regression model.
Element Non-Standardized Coefficient Standardized CoefficienttSignificanceR2
BStandard ErrorBeta
CrConstant−85.54321.803 −3.9230.0010.776
S193.00410.6550.7558.7290.000
S258.00110.6550.4715.4440.000
CuConstant1.4870.323 4.6030.0000.810
S11.2080.1580.6097.6480.000
S21.330.1580.6718.4260.000
ZnConstant1.9340.815 2.3740.0250.674
S12.9910.3980.7837.510.000
S21.0910.3980.2862.7410.011
CdConstant0.0260.015 1.6640.1070.642
S10.0550.0080.7917.2410.000
S2−0.0140.008−0.2−1.8290.078
PbConstant−0.3870.642 −0.6020.5520.527
S1−0.0820.314−0.033−0.2610.796
S21.8640.3140.7465.9410.000
HgConstant0.0050.001 3.9140.0010.607
S10.0010.0010.1561.3640.184
S20.0040.0010.7816.8230.000
AsConstant−0.430.07 −6.1470.0000.916
S10.4050.0340.62811.8380.000
S20.4680.0340.72613.6760.000
Note: The B value is the regression coefficient and intercept (constant term); S1 and S2 denote the regression coefficients of source 1 and source 2 on the factors of each heavy metal element, respectively; t denotes the value of the t-test process, which is the result of the division of B with the standard error; and R2 denotes the decidability factor.
Table A6. The NIPI classification criteria.
LevelValue
Clean (Grade I)NPI < 0.7
Alert (Grade II)0.7 ≤ NIPI < 1
Light Pollution (Grade III)1 ≤ NIPI < 2
Moderate Pollution (Grade IV)2 ≤ NIPI < 3
Severe Pollution (Grade V)3 ≤ NIPI
Table A7. Criteria for evaluating potential ecological risk indices.
E r i RILevel
E r i < 40RI < 150Low Risk
40 ≤ E r i < 80150 ≤ RI < 300Moderate Risk
80 ≤ E r i < 160300 ≤ RI < 600High Risk
160 ≤ E r i < 320600 ≤ RI < 1200Very High Risk
E r i ≥ 320 Extremely High Risk
Figure A1. Scatter plot of the RF model’s measured and predicted values.
Plants 14 01521 g0a1

References

  1. Islam, R.; Islam, S.M.; Zaman, U.S.; Roy, S.; Moniruzzaman, M.; Salam, A. Assessment of Heavy Metal Accumulation in Urban Plants and Soils: Evaluation of Impacts of Air Pollution in Dhaka, Bangladesh. Water Air Soil Pollut. 2025, 236, 157. [Google Scholar] [CrossRef]
  2. Zhang, X.W.; Yang, L.S.; Li, Y.H.; Li, H.R.; Wang, W.Y.; Ye, B.X. Impacts of lead/zinc mining and smelting on the environment and human health in China. Environ. Monit. Assess. 2012, 184, 2261–2273. [Google Scholar] [CrossRef] [PubMed]
  3. Liang, J.; Feng, C.T.; Zeng, G.M.; Gao, X.; Zhong, M.Z.; Li, X.D. Spatial distribution and source identification of heavy metals in surface soils in a typical coal mine city, Lianyuan, China. Environ. Pollut. 2017, 225, 681–690. [Google Scholar] [CrossRef] [PubMed]
  4. Yang, Q.Q.; Li, Z.Y.; Lu, X.N.; Duan, Q.N.; Huang, L.; Bi, J. A review of soil heavy metal pollution from industrial and agricultural regions in China: Pollution and risk assessment. Sci. Total Environ. 2018, 642, 690–700. [Google Scholar] [CrossRef]
  5. AbdElgawad, H.; Zinta, G.; Hamed, A.B.; Selim, S.; Beemster, G.; Hozzein, N.W.; Wadaan, M.A.M.; Asard, H.; Abuelsoud, W. Maize roots and shoots show distinct profiles of oxidative stress and antioxidant defense under heavy metal toxicity. Environ. Pollut. 2020, 258, 113705. [Google Scholar] [CrossRef]
  6. Muohi, A.W.; Onyari, J.M.; Omondi, J.G.; Mavuti, K.M. Heavy metals in sediments from Makupa and Port—Reitz Creek systems: Kenyan coast. Environ. Int. 2003, 28, 639–647. [Google Scholar] [CrossRef]
  7. Panda, P.B.; Parida, P.S.; Pradhan, A. Identifying ecological risk zones using spatial prioritization of heavy metal pollution and bioaccumulation in birds. Environ. Sci. Pollut. Res. 2025, 32, 11727–11748. [Google Scholar] [CrossRef]
  8. Zhao, F.; Ma, Y.; Zhu, Y.; Tang, Z. Soil Contamination in China: Current Status and Mitigation Strategies. Environ. Sci. Technol. 2014, 49, 750–759. [Google Scholar] [CrossRef]
  9. Elgarahy, A.M.; Akhdhar, A.; Elwakeel, K.Z. Microplastics prevalence, interactions, and remediation in the aquatic environment: A critical review. J. Environ. Chem Eng. 2021, 9, 106224. [Google Scholar] [CrossRef]
  10. Feng, D.; Wang, R.; Sun, X.; Liu, L.; Liu, P. Heavy metal stress in plants: Ways to alleviate with exogenous substances. Sci. Total Environ. 2023, 897, 165397. [Google Scholar] [CrossRef]
  11. Shafeeq, R.U.; Li, Y.; Sajjad, H.; Babar, H. Role of phytohormones in heavy metal tolerance in plants: A review. Ecol. Indic. 2023, 146, 109844. [Google Scholar]
  12. Abdullah, S.; Uzair, U.; Izhar, M. The TAZ domain-containing proteins play important role in the heavy metals stress biology in plants. Environ. Res. 2021, 197, 111030. [Google Scholar]
  13. Gong, Y.; Ren, W.; Li, F.; Jiang, Y. The role of soil elemental forms in the soil-plant migration system: An example of heavy metals in Epimedium production areas. Environ. Technol. Innov. 2024, 36, 103800. [Google Scholar] [CrossRef]
  14. He, X.; Asfandyar, S.; Feng, Y.; Jian, W.; Yue, L.; Ming, D. Source-specific ecological risk assessment and quantitative source apportionment of heavy metals in surface sediments of Pearl River Estuary, China. Mar. Pollut. Bull. 2022, 179, 113726. [Google Scholar]
  15. Liu, T.; Zhang, Y.; Liu, Y.; Chen, B. Multi-indicator assessment of heavy metal pollution in Qinzhou Harbour sediments: Unraveling ecological and human health risks. Mar. Pollut. Bull. 2025, 211, 117442. [Google Scholar] [CrossRef] [PubMed]
  16. Obada, C.C.M.; Oliveira, Z.F.E.M.; Elguera, M.Y.N.; Pulcha, S.E.S. Assessment of heavy metal contamination in surface sediments: Seasonal influence in the Majes-Camaná basin of the Arequipa region, Peru. Res. Eng. 2025, 25, 103673. [Google Scholar]
  17. Kumi, M.; Anku, W.W.; Antwi, B.Y.; Penny, P.G. Evaluation of the suitability of integrated bone char- and biochar-treated groundwater for drinking using single-factor, Nemerow, and heavy metal pollution indexes. Environ. Monit. Assess. 2023, 195, 647. [Google Scholar]
  18. Zhuang, Z.; Wang, Q.; Huang, S.; NiñoSavala, A.G.; Wan, Y.; Li, H.; Schweiger, A.H. Source-specific risk assessment for cadmium in wheat and maize: Towards an enrichment model for China. Environ. Sci. China 2023, 125, 723–734. [Google Scholar] [CrossRef]
  19. Swetha, N.T.; Rajasekar, B.; Hudge, V.B. Phytoremediation of Heavy Metal Contaminated Soils Using Various Flower and Ornamental. Int. J. Plant Soil Sci. 2023, 35, 747–752. [Google Scholar] [CrossRef]
  20. Alsbou, E.M.E.; Al-Khashman, O.A. Heavy metal concentrations in roadside soil and street dust from Petra region, Jordan. Environ. Monit. Assess. 2018, 190, 48. [Google Scholar] [CrossRef]
  21. Cai, L.; Xu, Z.; Bao, P.; He, M.; Dou, L.; Chen, L.; Zhou, Y. Multivariate and geostatistical analyses of the spatial distribution and source of arsenic and heavy metals in the agricultural soils in Shunde, Southeast China. Geochem. Explor. 2015, 148, 189–195. [Google Scholar] [CrossRef]
  22. Huang, Y.; Deng, M.H.; Wu, S.; Japenga, J.; Li, T.Q.; Yang, X.E.; He, Z.L. A modified receptor model for source apportionment of heavy metal pollution in soil. Hazard. Mater. 2018, 354, 161–169. [Google Scholar] [CrossRef]
  23. Huang, Y.; Li, T.Q.; Wu, C.X.; He, Z.L.; Japenga, J.; Deng, M.H.; Yang, X.E. An integrated approach to assess heavy metal source apportionment in peri-urban agricultural soils. Hazard. Mater. 2015, 299, 540–549. [Google Scholar] [CrossRef]
  24. Luo, X.S.; Yu, S.; Li, X.D. Distribution, availability, and sources of trace metals indifferent particle size fractions of urban soils in Hong Kong: Implications for assessing the risk to human health. Environ. Pollut. 2011, 159, 1317–1326. [Google Scholar] [CrossRef]
  25. Li, X.; Feng, L. Spatial distribution of hazardous elements in urban topsoils surrounding Xi’an industrial areas, (NW, China): Controlling factors and contamination assessment. Hazard. Mater. 2010, 174, 662–669. [Google Scholar] [CrossRef]
  26. Guo, H.; Wang, T.; Louie, P.K.K. Source apportionment of ambient non-methane hydrocarbons in Hong Kong: Application of a principal component analysis/absolute principal component scores (PCA/APCS) receptor model. Environ. Pollut. 2004, 129, 489–498. [Google Scholar] [CrossRef] [PubMed]
  27. Belis, C.A.; Karagulian, F.; Larsen, B.R.; Hopke, P.K. Critical review and meta-analysis of ambient particulate matter source apportionment using receptor models in Europe. Atmos. Environ. 2013, 69, 94–108. [Google Scholar] [CrossRef]
  28. Sun, H.Q.; Zhang, Z.Y.; Chen, S.Q.; Cao, J.J. Source apportionment of heavy metals and their effects on the species diversity of plant communities in the Caizi Lake wetland, China. Environ. Sci. Pollut. Res. 2023, 30, 60854–60867. [Google Scholar] [CrossRef] [PubMed]
  29. Skorbiłowicz, M.; Sidoruk, M. Assessment of Heavy Metal Content and Identification of Their Sources in Bottom Sediments and Various Macrophyte Species of the Narew River (Poland). Minerals 2024, 15, 8. [Google Scholar] [CrossRef]
  30. Zacharie, A.B.E.; Marie, K.G.; Paternie, E.D.E. Assessment of heavy metals and radionuclides (U and Th) contamination, and source identification of the Lékié Watershed sediments, Cameroon. Geosyst. Geoenviron. 2024, 3, 100249. [Google Scholar]
  31. Adnan, M.; Zhao, P.; Xiao, B. Heavy metal pollution and source analysis of soils around abandoned Pb/Zn smelting sites: Environmental risks and fractionation analysis. Environ. Technol. Innov. 2025, 38, 104084. [Google Scholar] [CrossRef]
  32. Liu, T.; Wang, M.; Wang, M.; Xiong, Q.; Jia, L. Identification of the primary pollution sources and dominant influencing factors of soil heavy metals using a random forest model optimized by genetic algorithm coupled with geodetector. Ecotoxicol. Environ. Saf. 2025, 290, 117731. [Google Scholar] [CrossRef] [PubMed]
  33. Miyato, T.; Maeda, S.I.; Koyama, M.; Ishii, S. Virtual adversarial training: A regularization method for supervised and semi-supervised learning. IEEE Trans. Pattern Anal. Mach. Intell. 2019, 41, 1979–1993. [Google Scholar] [CrossRef] [PubMed]
  34. Palansooriya, K.N.; Li, J.; Dissanayake, P.D.; Suvarna, M.; Li, L.Y.; Yuan, X.Z. Prediction of soil heavy metal immobilization by biochar using machine learning. Environ. Sci. Technol. 2022, 56, 4187–4198. [Google Scholar] [CrossRef]
  35. Zhu, J.J.; Yang, M.Q.; Ren, Z.J. Machine learning in environmental research: Common pitfalls and best practices. Environ. Sci. Technol. 2023, 57, 17671–17689. [Google Scholar] [CrossRef]
  36. Wang, J.X.; Yuan, J.X.; Hou, Q.Y.; Yang, Z.F.; You, Y.H.; Yu, T.; Ji, J.F.; Dou, L.; Ha, X.R.; Sheng, W.K.; et al. Distribution of potentially toxic elements in soils and sediments in Pearl River Delta, China: Natural versus anthropogenic source discrimination. Sci. Total Environ. 2023, 903, 166573. [Google Scholar] [CrossRef] [PubMed]
  37. Bu, Q.; Li, Q.; Zhang, H.; Cao, H.; Gong, W.; Zhang, X. Concentrations, spatial distributions, and sources of heavy metals in surface soils of the coal mining city Wuhai, China. J. Chem. 2020, 2020, 4705954. [Google Scholar] [CrossRef]
  38. Shi, Y.; Zhu, H.B.; Liu, D.; Mamut, J.; Shao, C.L.; Huang, D.H. Spring dynamics of plant-pollinator interaction network in gravel desert of Kalamaili Mountain Nature Reserve, Xinjing. Acta Ecol Sin. 2025, 45, 923–938. [Google Scholar]
  39. Curi, N.H.D.A.; Brait, C.H.H.; Talamoni, S.A. Heavy metals in hair of wild canids from the Brazilian Cerrado. Biol. Trace Elem. Res. 2012, 147, 97–102. [Google Scholar] [CrossRef]
  40. National Environmental Protection Bureau, China Environmental Monitoring Station. Background Value of Soil Elements in China; China Environmental Science Press: Beijing, China, 1990; pp. 334–379.
  41. GB 15618-2018; Soil Environmental Quality Risk Control Standards for Soil Pollution of Agricultural Land (Trial). China Environmental Science Press: Beijing, China, 2018.
  42. WHO. Guidelines for Assessing Quality of Herbal Medicines with Reference to Contaminants and Residues; World Health Organization: Geneva, Switzerland, 2007. [Google Scholar]
  43. Adamu, H.M.; Mshelia, E.H.; Maigari, A.U.; Umar, H.Y.; Balogun, O.L. Determination of some trace elements and macro minerals in Grewia mollis plant parts. Int. J. Pure Appl. Sci. Res. 2016, 11, 1–16. [Google Scholar]
  44. Kabata-Pendias, A. Soil–plant transfer of trace elements—An environmental issue. Geoderma 2004, 122, 143–149. [Google Scholar] [CrossRef]
  45. Li, Y.; Tao, H.; Cao, H.; Wan, X.M.; Liao, X.Y. Achieving synergistic benefits through integrated governance of cultivated cadmium contamination via multistakeholder collaboration. Nat. Commun. 2024, 15, 9817. [Google Scholar] [CrossRef] [PubMed]
  46. Cunningham, S.D.; Berti, W.R.; Huang, J.W. Phytoremediation of contaminated soils. Trends Biotechnol. 1995, 13, 393–397. [Google Scholar] [CrossRef]
  47. Pergent-Martini, C. Posidonia oceanica: A biological indicator of past and present mercury contamination in the mediterranean sea. Mar. Environ. Res. 1998, 45, 101–111. [Google Scholar] [CrossRef]
  48. Schwesig, D.; Krebs, O. The role of ground vegetation in the uptake of mercury and methyl mercury in a forest ecosystem. Plant Soil. 2003, 253, 445–455. [Google Scholar] [CrossRef]
  49. British Herbal Medicine Association. British Herbal Pharmacopoeia; British Herbal Medicine Association: Bournemouth, British, 1996; p. 212. [Google Scholar]
  50. Zhou, X.S.; Lou, S.; Radnaeva, L.D. Advances in heavy metal accumulation characteristics of plants in soil. Asian J. Ecotoxicol. 2022, 17, 400–410. [Google Scholar]
  51. Mathur, J.; Panwar, R. Synergistic effect of pyrene and heavy metals (Zn, Pb, and Cd) on phytoremediation potential of Medicago sativa L. (alfalfa) in multi-contaminated soil. Environ. Sci. Pollut. Res. 2024, 31, 21012–21027. [Google Scholar] [CrossRef]
  52. Yadav, A.; Hasan, M.; Kour, S.; Chandra, R.; Singh, V. Heavy Metal Contamination in Plants: Sources, Monitoring, and Data-Driven Insights. Macromol. Symp. 2025, 414, 2400239. [Google Scholar] [CrossRef]
  53. Srivastava, K.A.; Kumari, S.; Singh, P.R. Harnessing the interplay of protein posttranslational modifications: Enhancing plant resilience to heavy metal toxicity. Microbiol. Res. 2025, 295, 128112. [Google Scholar] [CrossRef]
  54. Zheng, J.; Yue, Y.; Zhu, Y.; Wang, Y.; Zheng, W.; Hu, L. Zinc Enhances Cadmium Accumulation in Shoots of Hyperaccumulator Solanum nigrum by Improving ATP-Dependent Transport and Alleviating Toxicity. Plants 2024, 13, 2528. [Google Scholar] [CrossRef]
  55. Elazab, D.; Lambardi, M.; Capuana, M. In Vitro Culture Studies for the Mitigation of Heavy Metal Stress in Plants. Plants 2023, 12, 3387. [Google Scholar] [CrossRef] [PubMed]
  56. Khan, K.; Younas, M.; Yaseen, M.; Sher, H.; Maryam, A. Heavy metals pollution in riverine sediments: Distribution, source, and environmental implications. Environ. Monit. Assess. 2025, 197, 225. [Google Scholar] [CrossRef]
  57. Chen, Y.; Wu, P.; Li, B. Remediation of antimony-arsenic co-contaminated soils in mining areas: Synergistic interaction of amendments and plants affects soil Sb and As bioavailability, nutrient and enzyme activity. Environ. Technol. Innov. 2025, 38, 104185. [Google Scholar] [CrossRef]
  58. Yuan, H.; Zhong, H.M.; Zhao, L.; Ma, C.H. Analysis of Heavy Metal Pollution Sources of Typical Farmland Soils in Chongzhou City Based on PCA/APCS Receptor Model. Sichuan Environ. 2019, 38, 35–43. [Google Scholar]
  59. Ma, J.; Shen, Z.; Zhang, P.; Liu, P.; Liu, J.; Sun, J. Pollution characteristics and source apportionment of heavy metals in farmland soils around the gangue heap of coal mine based on APCS—MLR and PMF receptor model. Environ. Sci. 2023, 44, 2192–2203. [Google Scholar]
  60. Jing, X.; Wang, X.; Zhou, J. Spatiotemporal variations and influencing factors of heavy metals of topsoil in Pearl River Basin, China. Environ. Res. 2025, 275, 121357. [Google Scholar] [CrossRef]
  61. Borba, R.P.; Figueiredo, B.R.; Rawlins, B.; Matschullat, J. Geochemical distribution of arsenic in waters, sediments and weathered gold mineralized rocks from Iron Quadrangle, Brazil. Environ. Geol. 2003, 44, 39–52. [Google Scholar] [CrossRef]
  62. Garelick, H.; Jones, H.; Dybowska, A.; Valsami-Jones, E. Arsenic Pollution Sources, Reviews of Environmental Contamination and Toxicology; Springer: New York, NY, USA, 2009. [Google Scholar]
  63. Han, R.; Zhang, Y.; Qiu, W.; Ding, T.; Wang, M.; Wang, F. Geology and geochemistry of Zn-Pb(-Ge-Ag) deposits in the Sichuan-Yunnan-Guizhou Triangle area, China: A review and a new type. Front. Earth Sci. 2023, 11, 2296–6463. [Google Scholar]
  64. Wang, L.; Zhang, Y.; Han, R.; Li, X. LA-ICP-MS analyses of trace elements in zoned sphalerite: A study from the Maoping carbonate-hosted Pb-Zn(-Ge) deposit, southwest China. Ore Geol. Rev. 2023, 157, 105468. [Google Scholar] [CrossRef]
  65. Ye, P.Q.; Abdugheni, A.; Sun, X.L.; Halidan, A. Source analysis and pollution assessment of soil heavy metals in the economic belt on the northern slope of Tianshan Mountains. China Environ. Sci. 2022, 42, 4704–4712. [Google Scholar]
  66. Denier Van der Gon, H.A.C.; Hulskotte, J.H.J.; Visschedijk, A.J.H.; Schaap, M. A revised estimate of copper emissions from road transport in UNECE-Europe and its impact on predicted copper concentrations. Atmos Environ. 2007, 41, 8697–8710. [Google Scholar] [CrossRef]
  67. Ma, J.; Qing, Q.Y.; Wang, S.L.; Li, M.S.; Feng, X. Source Apportionment and Influence Factors Analysis of Heavy Metals in Soils Around a Coal Gangue Heap Using the APCS-MLR Model and GeoDetector. Environ. Sci. 2024, 45, 7157–7165. [Google Scholar]
  68. Niu, Z.C.; Zhang, X.S.; Wang, Z.W.; Ci, Z.J. Field controlled experiments of mercury accumulation in crops from air and soil. Environ. Pollut. 2011, 159, 2684–2689. [Google Scholar] [CrossRef]
  69. Niu, Z.C.; Zhang, X.S.; Wang, S.; Ci, Z.J.; Kong, X.R.; Wang, Z.W. The linear accumulation of atmospheric mercury by vegetable and grass leaves: Potential biomonitors for atmospheric mercury pollution. Environ. Sci. Pollut. Res. 2013, 20, 6337–6343. [Google Scholar] [CrossRef] [PubMed]
  70. Chen, C.; Chen, X.; Liu, Q. Estimation and analysis of CO2 column concentrations (XCO2) in the Yangtze River Delta of China based on multi-source data and machine learning. Atmos. Pollut. Res. 2025, 16, 102528. [Google Scholar] [CrossRef]
  71. Wang, J.; Wang, B.; Zhao, Q.; Cao, J.; Xiao, X. Sources analysis and risk assessment of heavy metals in soil in a polymetallic mining area in southeastern Hubei based on Monte Carlo simulation. Ecotoxicol. Environ. Saf. 2024, 290, 117607. [Google Scholar] [CrossRef]
  72. Khalili, P.; Hoodaji, M.; Nadoushan, M.A.; Chamani, A. Assessing some cereals and Quinoa as Bioindicators and Phytoextractors of Heavy metals in Soils contaminated with Drill cutting Waste. J. Soil Sci. Plant Nutr. 2024, 24, 3631–3648. [Google Scholar] [CrossRef]
  73. Chen, X.; Ren, Y.; Li, C. Study on Factors Influencing the Migration of Heavy Metals from Soil to Vegetables in a Heavy Industry City. Sustainability 2024, 16, 11084. [Google Scholar] [CrossRef]
  74. Anwar, M.H.; Pukclai, P.; Teixeira, A.J.S.; Fujita, M. Molecular Mechanism of Heavy Metal Toxicity and Tolerance in Plants: Central Role of Glutathione in Detoxification of Reactive Oxygen Species and Methylglyoxal and in Heavy Metal Chelation. J. Bot. 2012, 2012, 872875. [Google Scholar]
  75. Panda, A.; Fatnani, D.; Parida, K.A. Uptake, impact, adaptive mechanisms, and phytoremediation of heavy metals by plants: Role of transporters in heavy metal sequestration. Plant Physiol. Biochem. 2025, 221, 109578. [Google Scholar] [CrossRef]
  76. Millaleo, R.; Reyes-Díaz, M.; Ivanov, A.G.; Mora, M.L.; Alberdi, M. Manganese as essential and toxic element for plants: Transport, accumulation and resistance mechanisms. J. Soil Sci. Plant Nutr. 2010, 10, 476–494. [Google Scholar] [CrossRef]
  77. Proshad, R.; Kormoker, T.; Islam, M.S.; Chandra, K. Potential health risk of heavy metals via consumption of rice and vegetables grown in the industrial areas of Bangladesh. Hum. Ecol. Risk Assess. 2019, 26, 921–923. [Google Scholar] [CrossRef]
  78. Lu, J.; Gao, L.; Wang, H. Contamination characteristics of heavy metals and enrichment capacity of native plants in soils around typical coal mining areas in Gansu, China. Sci. Rep. 2024, 14, 29983. [Google Scholar] [CrossRef] [PubMed]
  79. Angon, B.P.; Islam, S.M.; KC, S.; Das, A.; Anjum, N. Sources, effects and present perspectives of heavy metals contamination: Soil, plants and human food chain. Heliyon 2024, 10, 28357. [Google Scholar] [CrossRef] [PubMed]
  80. Huang, W.; Wang, S.; Wang, L.; Song, Y.; Zhu, Y.; Yang, H. Source apportionment of soil heavy metal(Loid)s in farmland using diverse models: A comparative assessment in the yellow river delta. J. Mar. Sci. Eng. 2023, 11, 1069. [Google Scholar] [CrossRef]
  81. Yuan, Z.; Luo, T.; Liu, X.; Hua, H.; Zhuang, Y.; Zhang, X. Tracing anthropogenic cadmium emissions: From sources to pollution. Sci. Total Environ. 2019, 676, 87–96. [Google Scholar] [CrossRef]
  82. Shaikh, A.; Jamla, M.; Sharma, L. Multifaceted Roles of Biogenic Nanoparticles for Conferring Heavy Metal Tolerance in Plants. J. Crop Health. 2025, 77, 82. [Google Scholar] [CrossRef]
  83. Du, P.; Xue, N.; Liu, L.; Li, F. Distribution of Cd, Pb, Zn and Cu and their chemical speciations in soils from a peri-smelter area in northeast China. Environ. Geol. 2008, 55, 205–213. [Google Scholar] [CrossRef]
  84. Wu, C.; Zhang, L. Heavy metal concentrations and their possible sources in paddy soils of a modern agricultural zone, southeastern China. Environ. Earth Sci. 2010, 60, 45–56. [Google Scholar] [CrossRef]
  85. Talukder, R.; Rabbi, M.H.; Baharim, N.B.; Carnicelli, S. Source identification and ecological risk assessment of heavy metal pollution in sediments of Setiu wetland, Malaysia. Environ. Forensics 2021, 23, 241–254. [Google Scholar] [CrossRef]
  86. Fu, D.; Gong, Y.; Liu, H.; Xiang, W.; Du, C. Characteristics, water quality, health risks and sources of heavy metals of Qu River Basin. J. Geochem. Explor. 2025, 271, 107676. [Google Scholar] [CrossRef]
  87. Tong, D.; Yu, Z.; Lin, G.; Li, L.; Wei, C.Y. Determination of heavy metals geochemical baseline and their pollution assessment in soils of a nonferrous metal mining area in Guangxi. Environ. Pollut. Control. 2021, 43, 1041–1045. [Google Scholar]
  88. Sultana, R.; Hossain, R.M.; Meraz, M.M. Spatial distribution and risk assessment of potentially toxic elements in coastal mangrove floodplain Top-Soils of Bangladesh. Environ. Nanotechnol. Monit. Manag. 2025, 23, 101044. [Google Scholar] [CrossRef]
  89. Abliz, A.; Shi, Q. Ecological risk assessment of toxic metal pollution in the industrial zone on the northern slope of the East Tianshan Mountains in Xinjiang, NW China. Open Geosci. 2021, 13, 582–593. [Google Scholar] [CrossRef]
  90. Hakanson, L. An ecological risk index for aquatic pollution control, a sedimentological approach. Water Res. 1980, 14, 975–1001. [Google Scholar] [CrossRef]
  91. Li, J.; Yang, Z.F.; Xia, X.Q.; Hou, Q.Y.; Fu, Y.S. Environmental geochemical characteristics of the sediments in the yangtze river and its ecological risk assessment. Geoscience 2012, 26, 939–946. [Google Scholar]
  92. Lafabrie, C.; Major, K.M.; Major, C.S.; Cebrián, J. Trace metal contamination of the aquatic plant Hydrilla verticillata and associated sediment in a coastal Alabama creek (Gulf of Mexico- USA). Mar. Pollut. Bull. 2013, 68, 147–151. [Google Scholar] [CrossRef]
  93. Schober, P.; Boer, C.; Schwarte, L.A. Correlation coefficients: Appropriate use and interpretation. Anesth Analg. 2018, 126, 1763–1768. [Google Scholar] [CrossRef]
  94. Thurston, G.D.; Spengler, J.D. A quantitative assessment of source contributions to inhalable particulate matter pollution in metropolitan Boston. Atmos. Environ. 1987, 19, 9–25. [Google Scholar] [CrossRef]
  95. Gnisia, G.; Weik, J.; Ruser, R.; Essich, L.; Lewandowski, I.; Stein, A. Machine learning-based prediction of nitrous oxide emissions from arable farming: Exploring management practices as predictor variables. Ecol. Indic. 2025, 172, 113233. [Google Scholar] [CrossRef]
  96. Kalantari, E.; Gholami, H.; Malakooti, H.; Kaskaoutis, D.G.; Saneei, P. An integrated feature selection and machine learning framework for PM10 concentration prediction. Atmos. Pollut. Res. 2025, 16, 102456. [Google Scholar] [CrossRef]
  97. James, G.; Witten, D.; Hastie, T.; Tibshirani, R. An Introduction to Statistical Learning; Springer: New York, NY, USA, 2013; pp. 316–321. [Google Scholar]
Figure 1. The Pi of soil heavy metal.
Plants 14 01521 g001
Figure 2. BCF for different plants. Note: a, b no practical significance, only to show more clearly the different enrichment capacities of the four plants.
Plants 14 01521 g002
Figure 3. Correlation coefficients between different plants and soil.
Plants 14 01521 g003
Figure 4. Contribution of plant heavy metal pollution source factors by the APCS-MLR model. Note: Factor 1 refers to the first potential impact factor; factor 2 refers to the second potential impact factor; and factor 3 refers to the third potential impact factor.
Plants 14 01521 g004
Figure 5. Proportion of importance of different pollution sources in the RF model.
Plants 14 01521 g005
Figure 6. Diagram of the study area. (Map approval number: GS (2023)2767).
Plants 14 01521 g006
Table 1. Descriptive statistics of heavy metal contents in soil (mg·kg−1).
ElementCrCuZnCdPbHgAs
Max95.9050.3090.600.2619.30.0221.40
Min16.305.1030.100.0310.10.0031.730
Median42.4021.4056.600.1317.50.0096.64
Mean44.3820.8955.950.1316.930.00936.95
CV(%)35.1047.8522.5345.3411.0341.6459.13
Kurtosis2.430.980.45−0.543.350.785.30
Skewness1.050.700.700.15−1.510.691.93
SD15.5910.1412.650.0561.870.003834.14
Background in XinJiang [40]49.3026.7068.800.1219.400.0211.20
National Standard [41]250.00100.00300.000.600170.003.40025.00
Table 2. Descriptive statistics of heavy metal contents in plants (mg·kg−1).
ElementCrCuZnCdPbHgAs
Anabasis aphylla L.Max48010.518.60.313.130.022.65
Min16.22.563.820.060.440.0070.1
Median3267.01130.151.770.0111.56
Mean294.246.5111.630.171.910.011.53
CV(%)60.1249.5949.3054.9461.2342.9371.17
Alhagi camelorum Fisch.Max1355.066.450.11.170.0240.93
Min11.71.982.740.020.180.0040.2
Median59.63.964.720.060.630.010.41
Mean70.103.784.890.060.650.010.46
CV(%)52.4428.1424.0143.9641.5256.0643.62
Reaumuria songonica (PalL)Maxim.Max175.009.0812.300.3114.130.021.38
Min86.503.894.900.050.810.010.48
Median90.005.308.180.080.930.010.83
Mean115.465.868.310.123.650.010.92
CV(%)34.6635.8534.4087.02160.7213.5639.42
Haloxylon ammodendron (C. A. Mey.) BungeMax366.006.2312.100.180.940.010.87
Min14.702.762.720.040.050.000.06
Median34.903.558.110.070.360.010.20
Mean63.793.857.480.080.390.010.26
CV(%)152.1425.2542.7747.9056.7352.0184.09
Standard2.00 [42,43]45.80 [44]100.00 [44]0.2 [45]3.00 [46]0.01 [47,48]5.00 [49]
Table 3. Characterization of NIPI.
CrCuZnCdPbHgAs
NIPI1.5161.4451.0951.6960.9350.9161.421
levelLight PollutionLight PollutionLight PollutionLight PollutionAlertAlertLight Pollution
Table 4. Characterization of a comprehensive ecological risk index for soil heavy metals.
CrCuZnCdPbHgAs
RI70.28154.8131.841205.00170.00844.71243.62
LevelLow RiskModerate RiskLow RiskVery High RiskModerate RiskVery High RiskLow Risk
Table 5. Principal component analysis of APCS-MLR.
PC1PC2
Cr0.760.44
Cu0.640.64
Zn0.790.26
Cd0.78−0.23
Pb0.010.74
Hg0.130.77
As0.660.70
Note: PC1 refers to the first principal component, which explains the direction of the largest variance in the data, usually representing the most dominant pollution source or influencing factor; PC2 refers to the second principal component, which explains the second largest direction in the remaining variance, usually representing the secondary pollution source or influencing factor.
Table 6. Evaluation of the effectiveness of RF model prediction.
ElementTraining TestTesting SetRPD
R2RMSEMAER2RMSEMAE
Cr0.7666.8141.570.6958.8842.911.78
Cu0.810.940.690.820.450.422.35
Zn0.722.081.810.541.941.671.48
Cd0.810.030.020.860.020.022.66
Pb0.851.070.460.750.190.162.01
Hg0.810.0020.0020.710.0020.0021.86
As0.810.310.230.810.160.142.27
Disclaimer/Publisher’s Note: The statements, opinions and data contained in all publications are solely those of the individual author(s) and contributor(s) and not of MDPI and/or the editor(s). MDPI and/or the editor(s) disclaim responsibility for any injury to people or property resulting from any ideas, methods, instructions or products referred to in the content.

