Article

Response of Tree Seedlings to a Combined Treatment of Particulate Matter, Ground-Level Ozone, and Carbon Dioxide: Primary Effects

by
Valentinas Černiauskas
,
Iveta Varnagirytė-Kabašinskienė
*,
Ieva Čėsnienė
,
Emilis Armoška
and
Valda Araminienė
Institute of Forestry, Lithuanian Research Centre for Agriculture and Forestry, Liepų 1, Girionys, LT-53101 Kaunas, Lithuania
*
Author to whom correspondence should be addressed.
Submission received: 9 December 2024 / Revised: 20 December 2024 / Accepted: 21 December 2024 / Published: 24 December 2024

Abstract

:
Trees growing in urban areas face increasing stress from atmospheric pollutants, with limited attention given to the early responses of young seedlings. This study aimed to address the knowledge gap regarding the effects of simulated pollutant exposure, specifically particulate matter (PM), elevated ozone (O3), and carbon dioxide (CO2) concentrations, on young seedlings of five tree species: Scots pine (Pinus sylvestris L.); Norway spruce (Picea abies (L.) H.Karst.); silver birch (Betula pendula Roth); small-leaved lime (Tilia cordata Mill.); and Norway maple (Acer platanoides L.). The main objectives of this paper were to evaluate the seedling stem growth response and the biochemical response of seedling foliage to pollutant exposure. Four treatments were performed on two- to three-year-old seedlings of the selected tree species: with PM (0.4 g per seedling) under combined O3 = 180 ppb + CO2 = 650 ppm; without PM under combined O3 = 180 ppb + CO2 = 650 ppm; with PM (0.4 g per seedling) under combined O3 < 40–45 ppb + CO2 < 400 ppm; and without PM under combined O3 < 40–45 ppb + CO2 < 400 ppm. Scots pine and Norway maple showed no changes in growth (stem height and diameter) and biochemical parameters (photosynthetic pigments, total polyphenol content (TPC), total flavonoids content (TFC), and total soluble sugars (TSS)), indicating a neutral response to the combined PM, O3, and CO2 treatment. The chlorophyll response to PM alone and in combination with elevated O3 and CO2 exposure varied, with silver birch increasing, Norway maple—neutral to increasing, Scots pine—neutral to decreasing, and Norway spruce and small-leaved lime—decreasing. The TPC indicated stress responses in Scots pine, small-leaved lime, and Norway maple under increased combined O3 and CO2 and in Norway spruce under single PM treatment. Hence, Scots pine and Norway maple seedlings showed greater resistance to increased PM under combined O3 and CO2 with minimal change in growth, while silver birch seedlings showed adaptation potential with increasing chlorophyll under simulated pollutant stress.

1. Introduction

Rapid urbanization increases the amount of air pollutants in the urban environment, harming human health and the ecosystem [1,2,3,4,5]. Despite substantial declines in air pollution across Europe in recent decades, the challenges persist in urban areas. Pollutants such as nitrogen dioxide (NO2), ground-level ozone (O3), polycyclic aromatic hydrocarbons (PAHs), and particulate matter (PM) frequently exceed the thresholds [6]. The PM (coarse PM with a diameter of 2.5–10 μm and fine PM with a diameter of <2.5 μm) is a prevalent air pollutant released from vehicle exhaust, rubber tire particles, organic chemicals, metals, and dust from the fossil fuel industry. This pollutant significantly threatens human health, especially in urban areas [7]. In particular, PM2.5, smaller than 2.5 μm, is recognized as a significant global health issue and is responsible for 0.8 million premature deaths worldwide [8,9].
As an integral part of urban ecosystems, trees are crucial in reducing air pollution by acting as natural filters. Urban areas are frequently distinguished by altered PM, CO2, and O3 concentrations, primarily mitigated by vegetation alongside other air pollutants [10,11]. Otherwise, O3 and PM still stand out as the foremost air pollutants affecting plants, as highlighted by numerous studies [6,12,13,14,15]. Understanding how trees respond to common urban pollutants is critical to preserving and improving the ecosystem services they provide [5]. Although trees growing in urban areas assimilate CO2 [16,17], elevated O3 concentrations induce biochemical and physiological changes in plants with inhibition of carbon assimilation by photosynthesis when it penetrates the intercellular spaces through stomata [18,19]. Trees can filter air pollutants [20,21]. Several studies have investigated that trees effectively remove PM, which adheres to the surface of plants, effectively extracting them from the air [22,23,24,25,26,27,28,29]. Plants with large leaf surfaces could reduce urban air pollution [20,30]. Other studies noted that coniferous species can more effectively capture PM than broadleaved species [26].
Over recent decades, increasing attention has been paid to the services trees provide in urban areas for mitigating air pollution in a changing climate [16,31,32,33,34]. Previous studies have examined the role of urban forests in reducing CO2, a dominant greenhouse gas [31]. Knowing that CO2 enters plants through stomata, previous studies have found species-specific differences, with plant species having higher stomatal densities absorbing PM and gaseous pollutants more effectively [16,35]. The PM deposition on the leaves interrupted stomatal leaf exchanges by lowering the CO2 assimilation rate (photosynthesis) and the exchange of water (transpiration) [36,37]. While warmer ambient air accelerates tree growth and enhances carbon sequestration, the impact of urban air pollution, containing specific compounds such as PM10, exerts a more significant influence on growth than the climate itself [34]. The response of trees to induced stress is highly dependent on the accumulation of specific biochemical compounds within the plant [38]. Biologically active compounds, including photosynthetic pigments and secondary metabolites, play an essential role in the plant’s health, such as the resistance of trees to unfavorable environmental conditions. These compounds are one of the key determinants in the ability of trees to tolerate and adapt to stressors such as pollution [39].
A complex of atmospheric pollutants acting synergistically is likely to increase the stress of trees growing in urban areas at a young age, and an early response could be detected. Although more attention is usually given to mature trees growing for several years in an open urban environment [40], more scientific documentation of the initial effects on young seedlings is needed. This knowledge gap raises concerns about the increased vulnerability of young seedlings and potential implications for subsequent tree development and resilience in urban environments.
Due to limited information on the reactions of young trees, this study focuses on seedlings, assuming that damage occurring at a young age may impact tree development, growth, and health in later years. Additionally, experiments with young trees allow for quicker identification of specific responses to environmental disturbances, such as pollutants. This paper aimed to investigate the early growth (height and diameter) and biochemical effects of simulated air pollutant exposure, focusing on the elevated combined O3 and CO2 concentrations on young tree seedlings (Pinus sylvestris L., Picea abies (L.) H.Karst., Betula pendula Roth, Tilia cordata Mill., and Acer platanoides L.) treated with and without PM. We hypothesized that seedlings of different tree species would show species-specific growth and biochemical responses to simulated exposure to PM alone and the combined effects of elevated O3 and CO2, with potentially stronger responses to the impact of all three factors.

2. Results

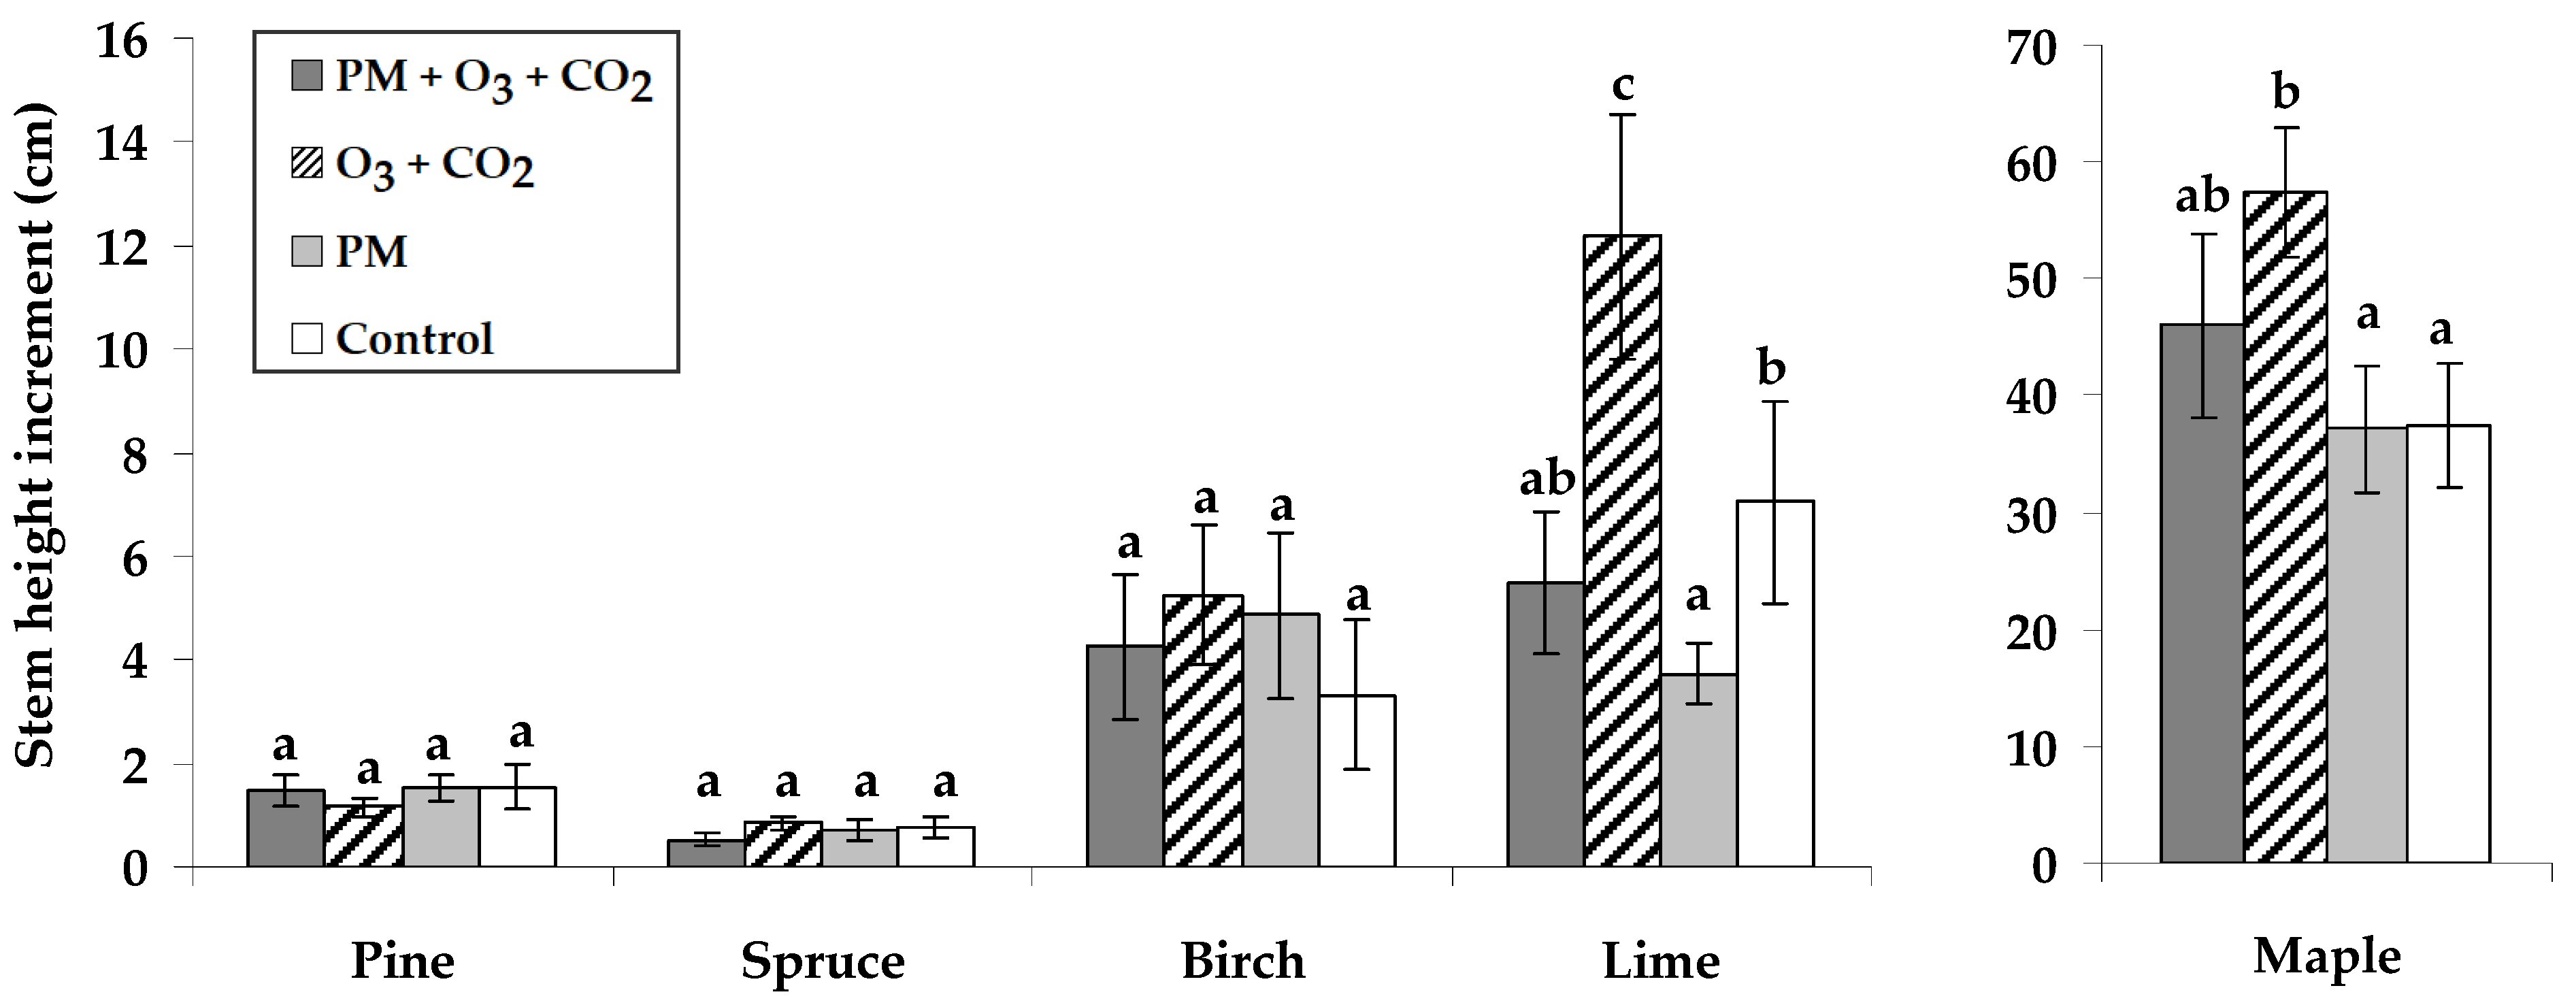
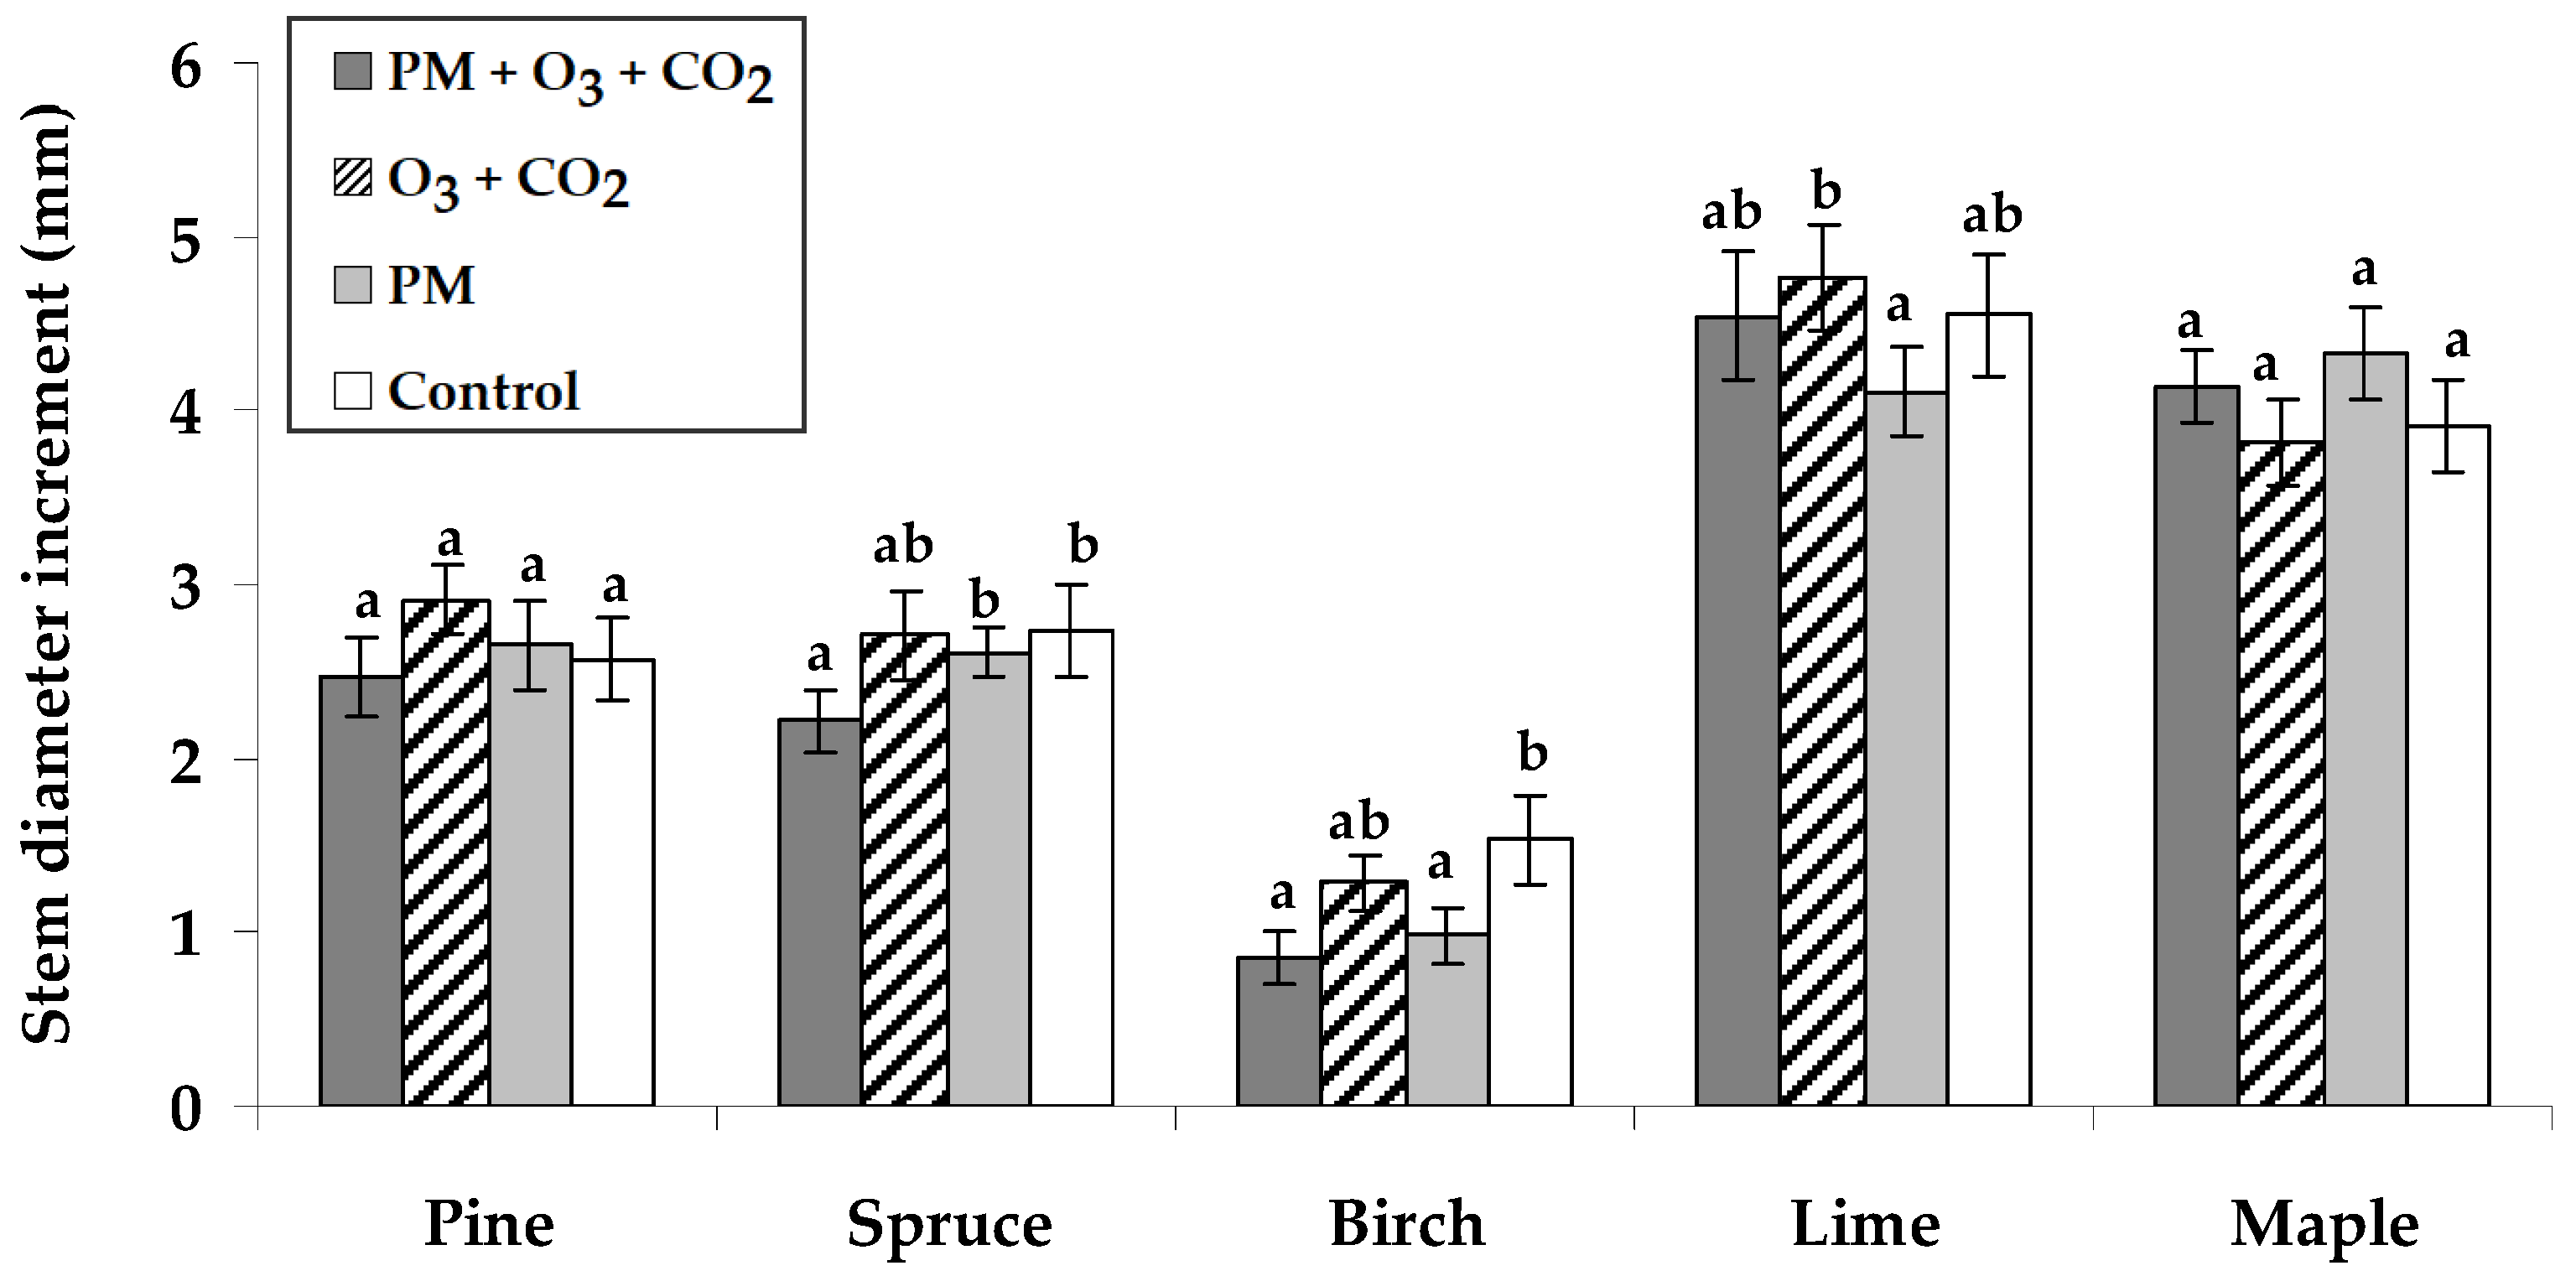
2.1. Stem Growth Response to Pollutant Exposure

The growth response included evaluating the changes in increment of Scots pine, Norway spruce, silver birch, small-leaved lime, and Norway maple seedling height and stem diameter at root base under various simulated environmental conditions, including PM, and elevated combined O3 and CO2 levels. The height increment of each tree species over the experimental period showed that elevated combined O3 and CO2 generally caused higher height increments across all species, exclusively for small-leaved lime and Norway maple (Figure 1). The stem height of small-leaved lime seedlings decreased due to exposure to PM without elevated O3 and CO2.
Considering various simulated environmental conditions, the stem diameter increments of seedlings over one vegetation season showed insights into the species-specific responses to these conditions (Figure 2). Compared to the untreated controls, the slightly higher stem diameter increments of Scots pine and small-leaved lime seedlings occurred under elevated combined O3 and CO2 conditions without PM. The PM exposure with elevated combined O3 and CO2 resulted in 1.2 times reduced diameter growth for Norway spruce and 1.8 times for silver birch seedlings compared to the untreated controls. The PM without elevated O3 and CO2 reduced the stem increment of silver birch.

2.2. Biochemical Response to Pollutant Exposure

2.2.1. Pigment Content: Chlorophyll a and b, Carotenoids

The combined treatment with particulate matter (PM) and exposure to the elevated O3 and CO2 concentrations (PM + O3 + CO2) decreased or did not change the contents of chlorophyll a (chl a), chlorophyll b (chl b), and carotenoid in needles of Scots pine and Norway spruce seedlings and in leaves of small-leaved lime and Norway maple seedlings (Table 1). However, the content of chl a and chl b in silver birch leaves increased after the combined treatment. Significantly lower contents of chl a and chl b were found for Norway spruce and small-leaved lime, and the lower carotenoid content was found for Norway spruce compared to untreated samples. The carotenoid content in Scots pine, silver birch, small-leaved lime, and Norway maple seedlings did not respond to the combined PM + O3 + CO2 treatment.
Exposure to elevated combined O3 and CO2 concentrations without PM caused lower contents of chl a and chl b in Scots pine, Norway spruce, small-leaved lime, and Norway maple seedlings (Table 1). The largest decrease in chl a content was found in Norway spruce, small-leaved lime, and Norway maple. For the contents of chl b, the largest 21–30% decrease was found for small-leaved lime and Norway maple. The carotenoid content in small-leaved lime leaves increased by 8% (Table 1). In contrast, significantly lower carotenoid contents were observed in Scots pine, silver birch, and Norway maple leaves, with no change detected in Norway spruce compared to the control seedlings. When seedlings were treated with PM, the contents of both chl a and chl b decreased in Norway spruce and small-leaved lime, while only chl b decreased in Scots pine. In contrast, silver birch and Norway maple showed 1.2 to 1.3 times higher contents of chl a and chl b. Carotenoids did not respond to PM treatment.

2.2.2. Total Polyphenol Content

The highest total polyphenol contents (TPC) in the control seedlings were found in Norway spruce needles (3.0 mg GA g−1), silver birch (3.1 mg GA g−1), and Norway maple (2.8 mg GA g−1) leaves (Figure 3). Seedling treatment with PM and elevated combined O3 and CO2 did not change the TPC in the needles of Scots pine and Norway spruce, as well as in the leaves of small-leaved lime and Norway maple. The elevated combined O3 and CO2 concentrations without PM treatment caused higher TPC in the needles of Scots pine (an increase of 45% was found) and in the leaves of small-leaved lime (33%) and Norway maple (11%). However, TPC decreased by 30% in silver birch leaves. The PM treatment responded with diverse effects on the TPC: from an 8% increase in Norway spruce needles, no change in the leaves of small-leaved lime and Norway maple, to a 28% decrease in Scots pine needles.

2.2.3. Total Flavonoid Content

Among the seedlings of different tree species, the highest total flavonoid contents (TFC) ranging between 0.78 and 1.14 mg QA g−1 of fresh weight were determined in silver birch leaves (Figure 4). Seedling treatment with PM and elevated combined O3 and CO2 resulted in a significant decrease in TFC in Norway spruce, silver birch, and small-leaved lime, respectively, by 13%, 31%, and 27%. The results showed a significant reduction in TFC after the elevated combined O3 and CO2 concentrations without PM treatment for Norway spruce and silver birch and after the PM treatment—for silver birch. There were no effects on TFC in the remaining species.

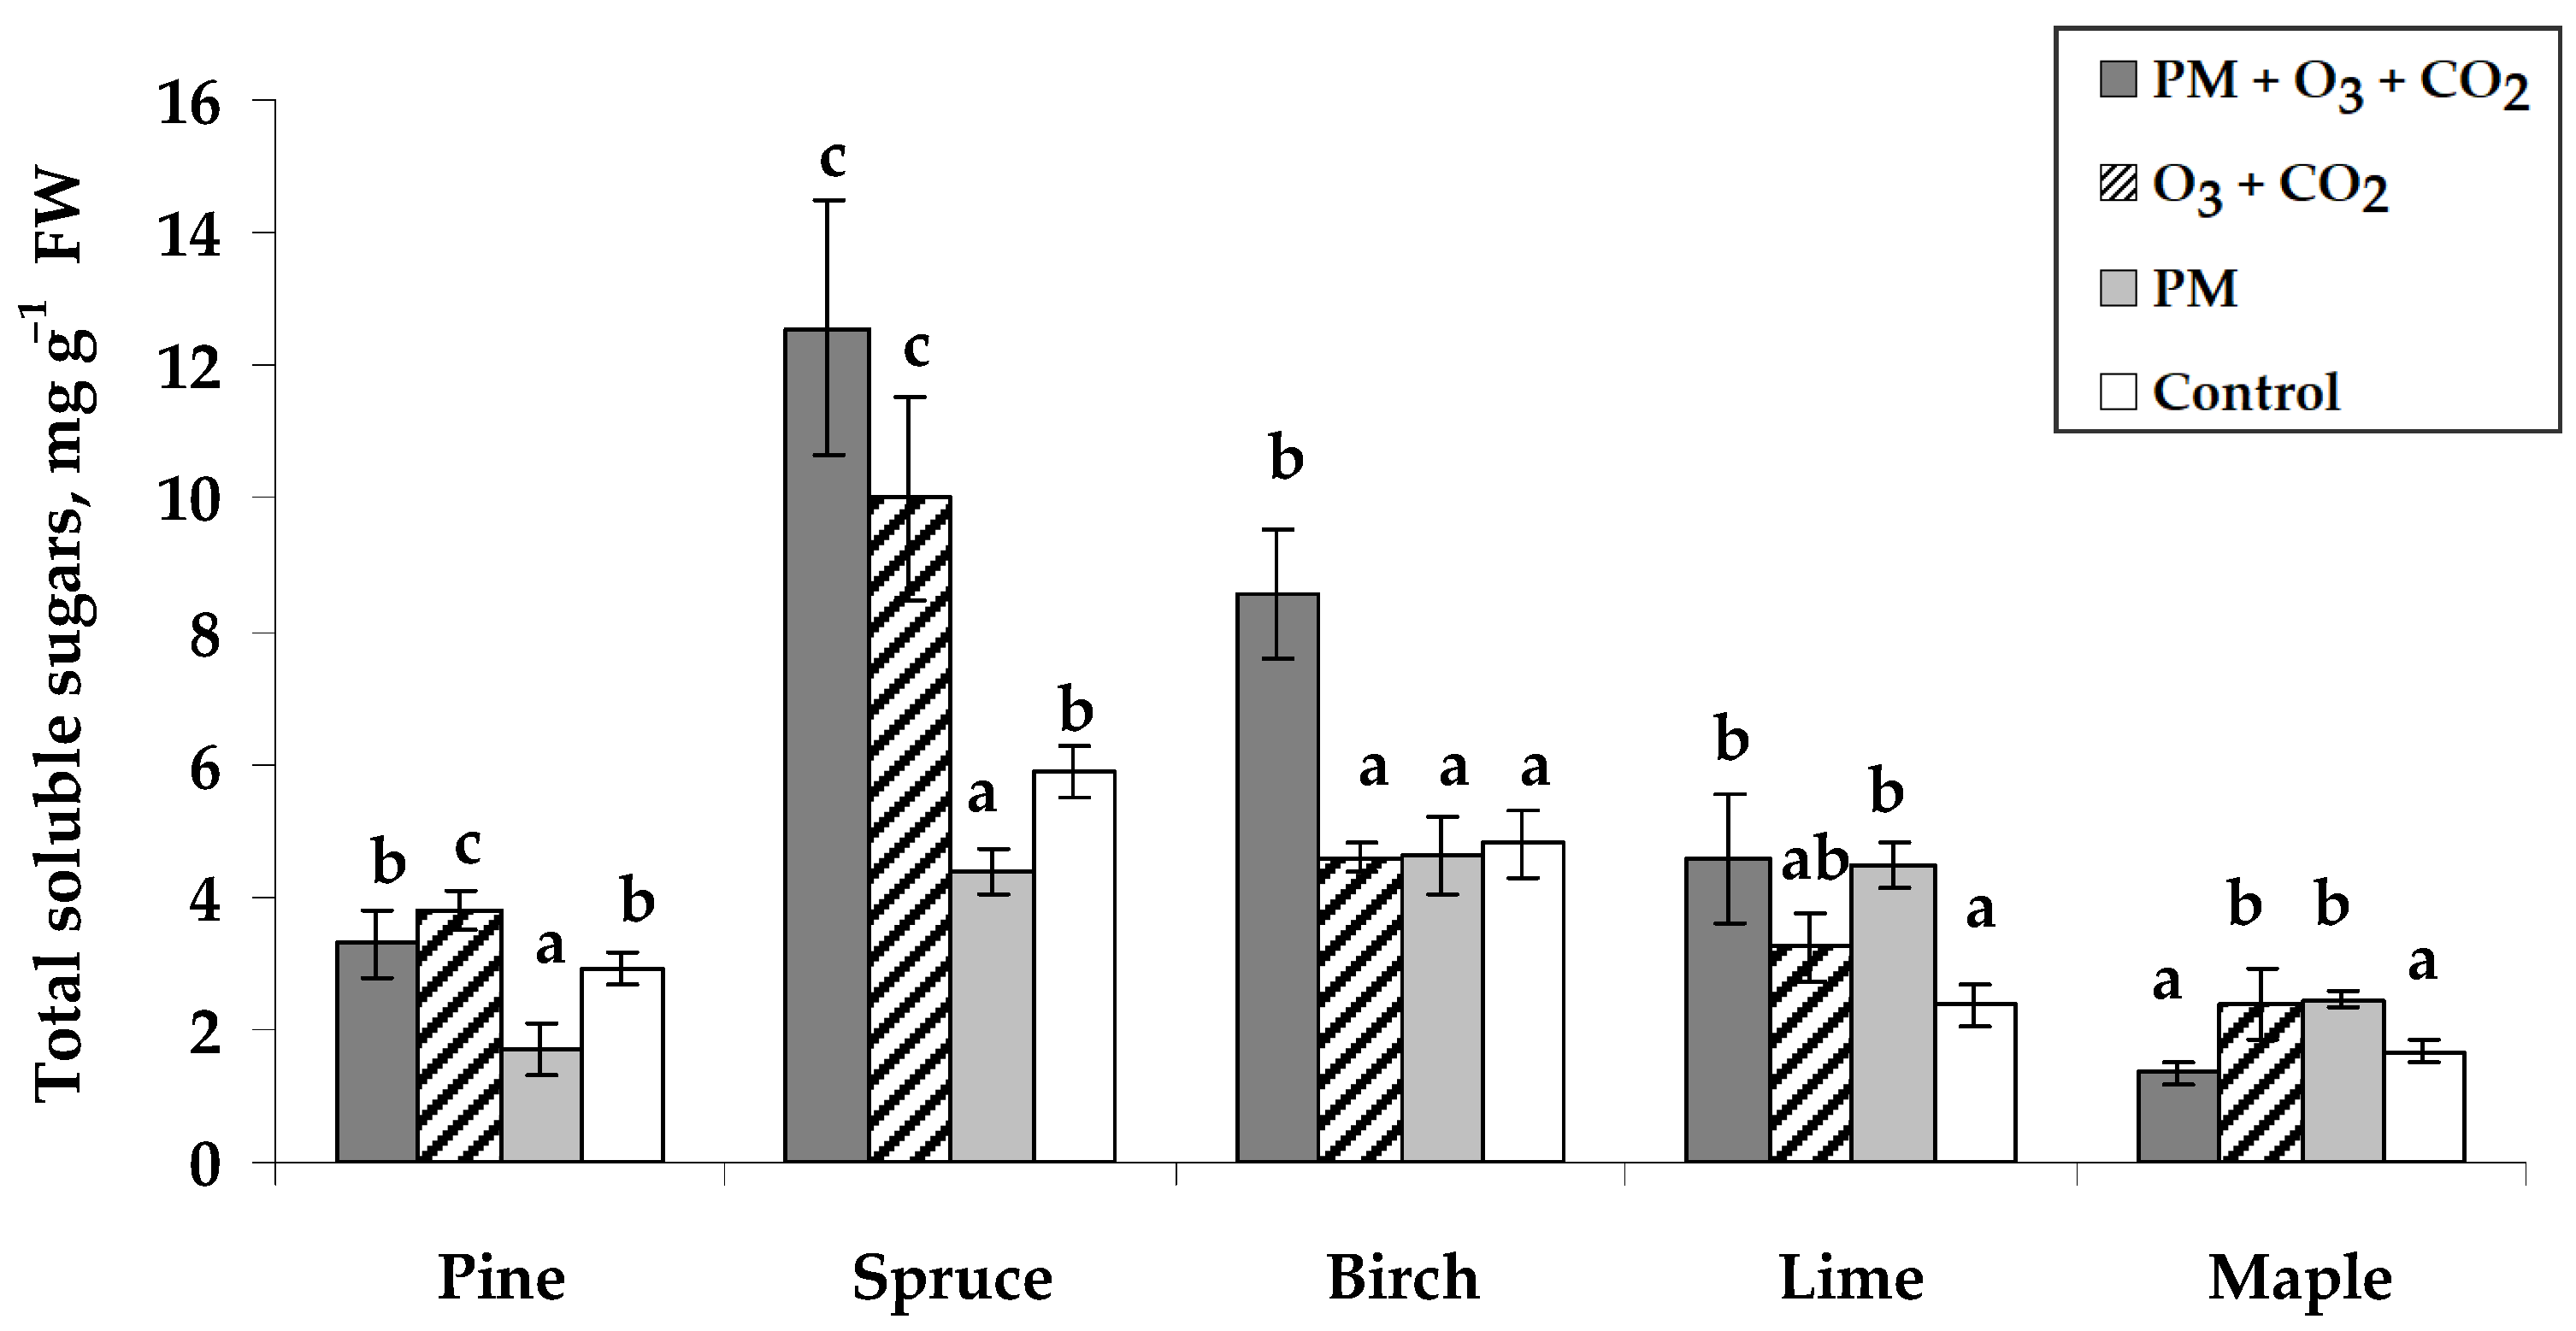
2.2.4. Total Soluble Sugar Content
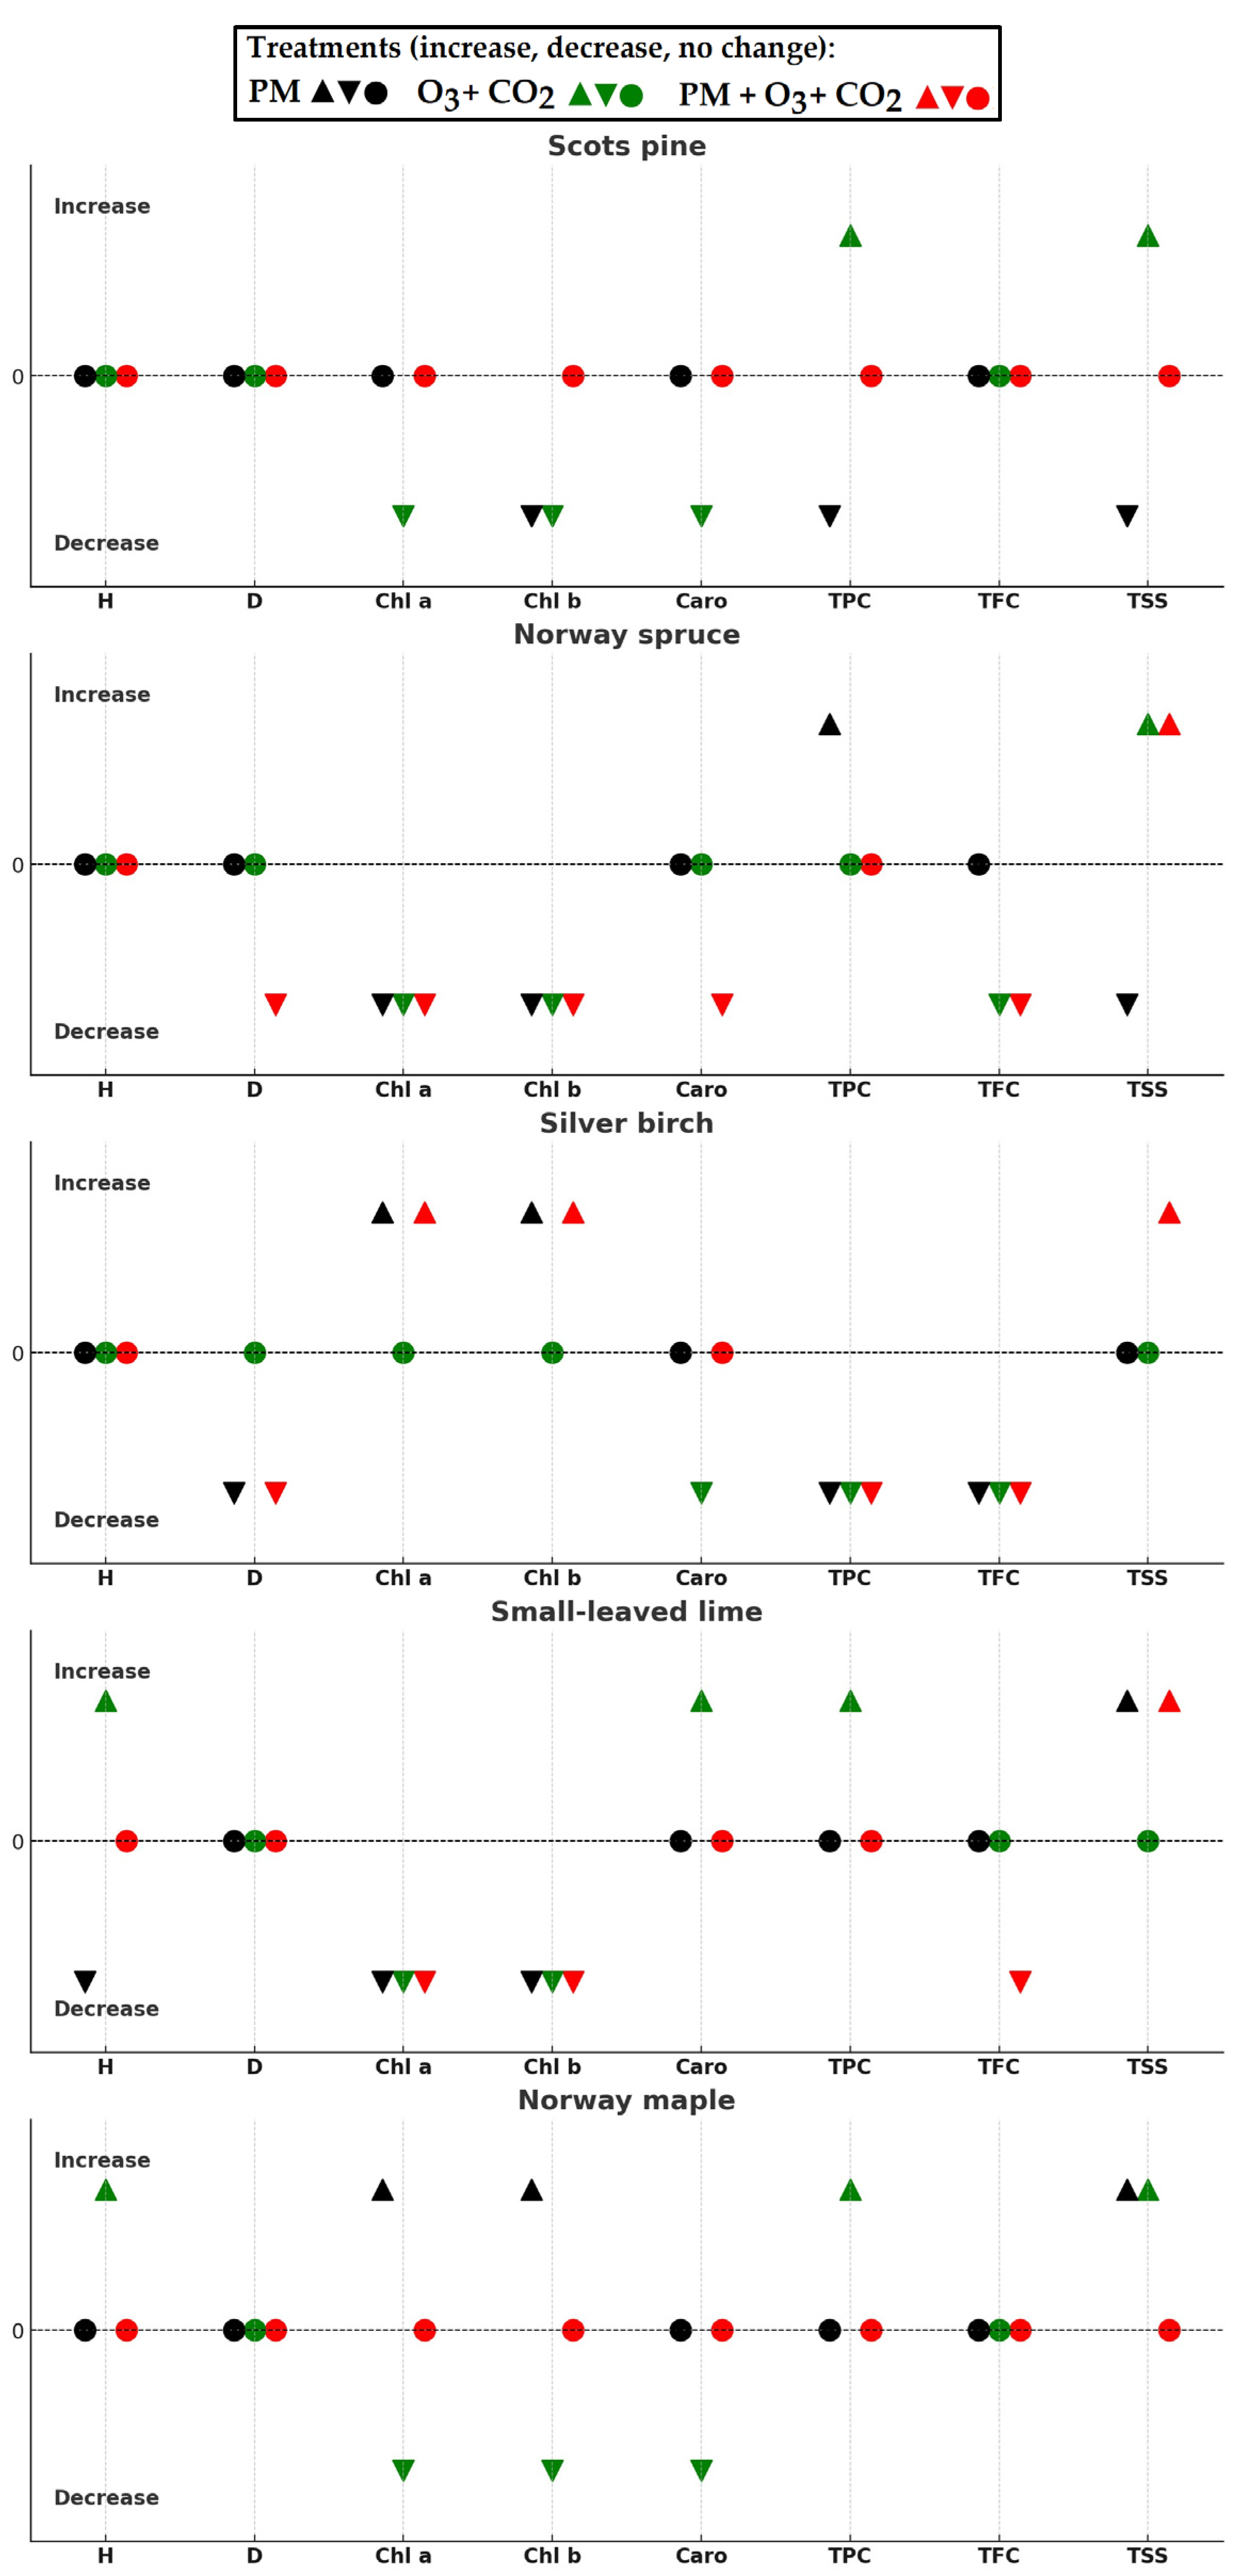
The highest total soluble sugar (TSS) content in the control seedlings was found in Norway spruce needles (5.9 mg g−1) and silver birch leaves (4.8 mg g−1) (Figure 5). Other tree species contained similar TSS content of 1.7–2.9 mg g−1. The content of TSS in seedlings of different tree species responded differently to the treatments. The treatment with PM applied together with elevated combined O3 and CO2 concentrations increased TSS in Norway spruce (113%), silver birch (78%), and small-leaved lime (93%). The seedling exposure to elevated combined O3 and CO2 concentrations without PM treatment significantly increased TSS in Scots pine, Norway spruce, and Norway maple seedlings (Figure 5). Following the PM treatment, TSS content decreased in Norway spruce by 26% and in Scots pine by 42%, while it increased by 89% in small-leaved lime and 47% in Norway maple.
The effects of simulated pollution treatments on various growth and biochemical parameters obtained in the seedlings of different tree species were overviewed in Figure 6. In most cases, seedling growth parameters did not show significant differences after the seedlings had been exposed to varying conditions in the short term. The increased height was found for small-leaved lime and Norway maple after treatment with elevated combined O3 and CO2 without PM. The treatment with PM at elevated combined O3 and CO2 concentrations decreased the diameter of Norway spruce and silver birch, while the single PM treatment decreased the diameter of silver birch seedlings.
All treatments negatively influenced the concentrations of chl a and b in Norway spruce and small-leaved lime (Figure 6). However, positive effects were found for silver birch after treatment with PM at elevated combined O3 and CO2 and for silver birch and Norway maple after the single PM treatment. At elevated combined O3 and CO2 treatment, the PM was neutral to Scots pine and Norway maple seedlings, including all tested parameters—photosynthetic pigments (chl a and b, carotenoids), TPC, TFC, and TSS. Increased TPC was found in Scots pine, small-leaved lime, and Norway maple seedlings after exposure to the elevated combined O3 and CO2 concentrations without PM treatment. The TFC decreased in silver birch after all treatments, Norway spruce after exposure to elevated combined O3 and CO2 with and without PM, and small-leaved lime after exposure to elevated O3 and CO2 with PM. The treatment with PM at elevated combined O3 and CO2 caused an increase in TSS in Norway spruce, silver birch, and small-leaved lime, while elevated O3 and CO2 increased TSS in Scots pine, Norway spruce, and Norway maple. The single PM treatment decreased TSS in Scots pine and Norway spruce.

3. Discussion

3.1. Growth Response

Previous studies focused on the effect of trees and forests on air quality, most often causing the reducing air pollution and greenhouse gases in the environment [22,30,41,42]. Several studies have shown that trees growing in urban areas reduce air pollutants by intercepting and adsorbing PM through their foliage and removing gases via leaf stomata or plant surfaces [16,26,43,44,45,46]. However, PM accumulation in the leaves depends on various characteristics of leaves, such as surface roughness, epicuticular wax layer, and leaf shape and size [47]. Despite all these specific mechanisms, different species could be sensitive to environmental conditions, which could cause higher tree mortality or suggest selection preferences to urban planners [48].
The results of the present study indicated that elevated combined O3 and CO2 levels induced larger height increments in small-leaved lime and Norway maple seedlings (Figure 1). It is known that elevated CO2 concentrations cause more intensive plant growth followed by potentially higher biomass [49]. In contrast, O3 causes phytotoxic effects on vegetation [50]. More specifically, elevated CO2 enhances plant growth by improving photosynthetic carbon assimilation, though prolonged exposure may lead to photosynthetic down-regulation, especially under nutrient-limiting conditions. As noted by previous studies, O3 and CO2, acting together, generally negatively affect plant growth [51,52,53]. Elevated O3 concentrations diminish net CO2 assimilation, potentially causing significant losses in the carbon sink capacities of trees. The findings of this study did not reveal a negative impact from the combined influence of elevated O3 and CO2 levels. This could be attributed to either the short-term exposure duration or the evaluation of young tree seedlings, which could cause higher adaptability to varying environmental conditions.
We found that PM exposure without elevated combined O3 and CO2 had variable effects on different tree species. For example, PM treatment caused lower stem height growth in small-leaved lime seedlings (Figure 1). Species-specific responses were observed in stem diameter increments, i.e., all treatments resulted in a neutral effect or a decrease in diameter compared to the control (Figure 2). Norway spruce and silver birch seedlings experienced reduced diameter growth after the PM treatment at elevated combined O3 and CO2. The literature showed that atmospheric pollutants, including gas and PM, can have significant adverse impacts [54,55]. Recently, the impact of trees growing in urban areas on mitigating the adverse effects of PM in urban areas to remove air pollutants and improve air quality has been widely studied [56,57,58].

3.2. Biochemical Response

Assessing biochemical synthesis alterations in trees in response to air pollution stress provides insights into trees’ adaptive and physiological responses to environmental stressors. Our study demonstrates that the synthesis of biochemical compounds, including photosynthetic pigments, sugars, and secondary metabolites (TPC and TFC), is significantly impacted by pollution-induced stress. These findings highlight the sensitivity of biochemical compounds in trees to environmental pollutants. This study found that chl a and b concentrations decreased in Norway spruce and small-leaved lime after all treatments (Figure 6). In contrast, chl a and b concentrations increased in silver birch under the PM treatment at elevated combined O3 and CO2 and normal, unchanged conditions. TPC increased in Scots pine, small-leaved lime, and Norway maple at elevated combined O3 and CO2 concentrations. In contrast, under different treatments, TFC decreased in Norway spruce, silver birch, and small-leaved lime. TSS varied, increasing in several species with combined treatments and decreasing in Scots pine and Norway spruce with the single PM treatment. Previous studies found that the PM accumulation in foliage triggered chemical transformations, leading to alterations in the pH of leaf extracts. This shift in pH, whether an increase or decrease, depends on the specific compounds present in the PM. Elevated pH levels, commonly influenced by calcium or magnesium compounds, facilitate the entry of pollutants into leaf tissues, subsequently causing plasmolysis. Conversely, heightened acidity encourages the generation of radicals, which interact with cellular water, impacting the chlorophyll content in leaves [59]. Kováts et al. (2021) [60] have studied the effects of particulate pollution on several roadside plant species in Europe, taking chl a and b, carotenoids, and biomass as essential factors. In general, stress induced by air pollution triggers biochemical changes in plants, including a reduction in total chlorophyll content and an increase in ascorbic acid concentration [61]. When leaves absorb CO2 and PM, there is a potential for a decrease in the concentration of photosynthetic pigments such as chlorophylls and carotenoids. The study conducted with mung bean (Vigna radiata (L.) R. Wilczek) showed that plant leaves exposed to PM responded in a lower chl a/b ratio because of the shading effect from PM on leaves [62]. Consequently, this reduction can diminish photosynthesis and impact plant productivity [61,63].
Tree species are effective phytoremediators because they can remove pollutants, including gaseous contaminants such as O3 and CO2 [64]. This study concluded that silver birch, sycamore maple (Acer pseudoplatanus L.), and small-leaved lime were the most effective in this process. Łukowski et al. (2020) [65] discovered that silver birch was particularly effective in improving the quality of environments contaminated with PM. However, urban forest management should consider factors such as accelerated leaf fall, reduced productivity, and wood quality associated with this species.
Based on the evaluated stem growth and biochemical parameters in seedling foliage, specific general trends can be considered for trees growing in urban environments with enhanced PM and O3 levels and changing climates with higher CO2. Small-leaved lime and Norway maple seedlings showed height increments under elevated O3 and CO2 conditions.
A short-term study examining the early responses of young tree seedlings to PM, O3, and CO2 exposure in controlled conditions revealed species-specific response: Scots pine and Norway maple showed greater resilience to increased levels of these pollutants (no change in stem height, diameter, and TFC). Silver birch seedlings responded to higher chlorophyll content when exposed to single PM or PM combined with O2 and CO2, unlike other species. Silver birch is characterized as a species with high plasticity and stress protection mechanisms, which could have good acclimation capacity in a changing environment. High CO2 can potentially strengthen the oxidative stress tolerance of silver birch trees [66]. Increased CO2 levels stimulate photosynthesis and increase chlorophyll content, potentially mitigating the negative effects of PM and O3 in silver birch. This stress compensation may explain the increased chlorophyll levels observed in silver birch foliage under combined pollutant exposure [66,67]. Hence, our primary hypothesis that exposure to PM alone and the combined effects of elevated O3 and CO2 would result in species-specific growth and biochemical responses was largely confirmed. A greater impact of the PM at elevated O3 and CO2 was found for Norway spruce, silver birch, and small-leaved lime.

4. Materials and Methods

4.1. Experiment Design: Planting Material, Growing Conditions, and Treatments

The seedlings of five tree species—Scots pine (Pinus sylvestris L.), Norway spruce (Picea abies (L.) H.Karst.), silver birch (Betula pendula Roth), small-leaved lime (Tilia cordata Mill.), and Norway maple (Acer platanoides L.)—were selected for this study. These tree species are native to Lithuanian forests and are prioritized as the primary choices for planting in urban areas across the Baltic region, including Lithuania [68].
The planting material—high-quality seedlings—was purchased from Nemenčinė, Dubrava, Strošiūnai, and Kuršėnai tree nurseries, managed by the State Forest Enterprise (Vilnius, Lithuania) and Kołaki–Wietrzychowo tree nursery, managed by the Regional Directorate of State Forests (Białystok, Poland). According to available information, Scots pine seeds originated from Eastern Lithuania (Nemenčinė nursery), Norway spruce and silver birch seeds from Central Lithuania (Dubrava and Strošiūnai nurseries), and small-leaved lime seeds from Northern Lithuania (Kuršėnai nursery). Due to the unavailability of Norway maple seedlings in Lithuania, a tree nursery in Northeastern Poland (Kołaki–Wietrzychowo nursery), approximately 120 km from the Lithuanian border, was chosen, with seeds originating from that region. All seedlings grown in nurseries are mainly derived from forest reproductive material from seed orchards. The seedlings from tree nurseries are usually used for reforestation and afforestation, as well as for planting in urban areas in the region. The one-year-old tree seedlings of Scots pine and Norway spruce and two-year-old seedlings of silver birch, small-leaved lime, and Norway maple were replanted into individual 5 L plastic base-perforated pots containing substrate of neutralized peat (SuliFlor SF2 peat substrate, producer: Sulinkiai, Lithuania) in April 2022. The substrate contained a pH of 5.5–6.5 and optimum nutrition (total soluble N 210 mg L−1, P2O5 240 mg L−1, and K2O 270 mg L−1). The seedlings were watered when necessary throughout this experiment. After one year of seedling growth, chlorine-free NPK liquid fertilizers (N 7.8%, NO4-N < 0.1%, NO3-N 2.0%, NO2-N 5.8%, P2O5 2.3%, K2O 7.9%) with microelements Cu (0.002%) and Zn (0.005%) were applied to all tree seedlings before this experiment. The fertilizer solution was prepared and watered according to the dosage specified in the instructions (Baltic Agro, Lithuania). The potted seedlings were grown in an open field for one year before the simulation experiment began, making them two to three years old at the start of this experiment. We assumed that the young age of the seedlings—one year for coniferous species and two years for deciduous species at the time of purchase and two or three years, respectively, at the start of this experiment—would not represent a significant difference in seedling age.
A total of 84 seedlings from each tree species (Scots pine, Norway spruce, silver birch, small-leaved lime, and Norway maple) were divided into four groups of 21 seedlings, with each group assigned to one of the four treatments:
  • Seedlings treated with particulate matter (PM) and exposed to O3 levels of 180 ppb in combination with CO2 levels of 650 ppm from 9 a.m. to 9 p.m. (PM + O3 + CO2);
  • Seedlings without PM and exposed to an O3 level of 180 ppb in combination with a CO2 level of 650 ppm from 9 a.m. to 9 p.m. (O3 + CO2);
  • Seedlings with PM and exposed to O3 levels below 40–45 ppb in combination with CO2 levels below 400 ppm (representing unchanged air conditions) (PM);
  • Seedlings without PM were exposed to O3 levels below 40–45 ppb in combination with CO2 levels below 400 ppm, serving as the control group (Control).
For this experiment, the potted seedlings, with and without PM treatment, were placed in closed walk-in greenhouse chambers with regulated environmental conditions for twelve weeks, from mid-June to mid-September 2023. In the chambers, the seedlings were grown under natural light conditions; the air conditioning system maintained a temperature of 22 ± 2°C at day and 18 ± 2°C at night throughout this experiment. The air humidity was 60–75%. Temperature and air humidity were automatically adjusted.
For the PM pollution simulation, we used dry solid and dusty material obtained from a special multicyclone in the heating boiler located in Girionys, Kaunas district. This boiler is a part of the district heat production and supply company operating in the Kaunas region (Lithuania). This company primarily uses forest biomass for heating energy. We assumed that this pollution source, along with others, contributes to PM emissions in urban air, causing a significant environmental risk. To test this, we conducted experiments using a material with a known chemical composition (Table 2). The size of the PM particles was <10 µm (ISO 13322-1:2014; inverted microscope Nikon Eclipse Ts2, Japan with camera Lumenera Infinity 2 (Canada) 100× magnification). Tree seedlings received a single PM treatment before this experiment. Each seedling was exposed to 0.4 g of PM, which was manually applied as evenly as possible across the upper surfaces of the seedlings. All seedlings were treated with the same amount of PM under controlled indoor conditions, ensuring consistent environmental factors and minimal airflow disturbance. To evaluate early and sensitive changes, this study focused on evaluating biochemical responses in seedling foliage, which was directly affected by PM application and exposed under the selected environmental factors.
The O3 concentration of 180 ppb selected was four times higher than the ambient level typically recorded in rural and suburban regions of Lithuania [68]. Ozone from the air was generated using the ozone generator RMU16-6K (AZCO Industries Ltd., Canada). To control the O3 concentration, ozone transmitter E2638-03 (Evikon, Estonia) was used. A CO2 concentration of 650 ppm was selected following the RCP4.5 climate change scenario [69]. The CO2 was supplied to the air of the greenhouse chamber from compressed gas cylinders (Gaschema, Lithuania). The O3 and CO2 concentrations were controlled by the PC-based Environmental Control System (Computer software IGSS 9-13175). The combined treatments of PM + O3 + CO2 and O3 + CO2 were selected to represent urban environmental conditions. Due to limited technical capabilities during this experiment, (i) separate treatments for O3 and CO2 were not included, which limited the ability to evaluate their individual effects on tree seedlings; (ii) other environmental factors common in urban environments, such as fluctuating temperature, humidity, and other pollutants, were not evaluated, which limited the ecological applicability of the findings; and (iii) this study focused on specific tree species, limiting the generalizability of the findings to other species.

4.2. Measurements

4.2.1. Seedling Stem Measurements

The height (cm) and diameter (mm) of seedlings were measured for all seedlings per treatment twice: at the beginning of this experiment (mid-June) and twelve weeks after the Scots pine, Norway spruce, silver birch, small-leaved lime, and Norway maple seedlings were grown in the chambers with simulated conditions (mid-September). The seedling growth data were analyzed by calculating the difference in growth indicators (shown as stem height and stem diameter increments in Figure 1 and Figure 2, respectively), using the values from mid-September minus those from mid-June.

4.2.2. Biochemical Analyses

Needle samples of the Scots pine and Norway spruce seedlings and leaf samples of the silver birch, small-leaved lime, and Norway maple seedlings were collected from nine randomly selected seedlings per tree species from four treatments at the end of the 2023 vegetation season. Each sample was taken from the middle crown by pooling 10–20 needles and 4–6 leaves. All the samples of fully formed leaves and needles with no visible damage were collected on the same day. Only the leaves and needles from the current year were taken for analysis, meaning that they all grew for one growing season. Fresh needle/leaf samples were stored at −20 °C [70,71] for a short period, up to 1 month, until biochemical analyses were performed.
Quantification of amounts of photosynthetic pigments (chl a and b, carotenoids), total polyphenol content (TPC), total flavonoid content (TFC), and total soluble sugars (TSS) was performed spectrophotometrically using a SpectroStar Nano microplate reader (BMG Labtech, Offenburg, Germany) and 96-well microplates. A 0.1 g needle or leaf biomass was homogenized in a pestle and mortar and poured with 2 mL of 80% (v/v in water) ethanol, following the methodology by Čėsnienė et al. [71]. The samples were centrifuged for 30 min, 21,910× g, +4 °C, using a Hettich Universal 32R centrifuge (Andreas Hettich GmbH & Co. KG, Tuttlingen, Germany). The supernatant was then removed and used further.
For chl a, b, and carotenoids, analyses were performed with fresh extract in the dark to minimize component degradation by light. The absorption of the extract was measured at the wavelengths of 470 nm, 648 nm, and 664 nm. The concentration of chl a, b, and total carotenoids was calculated using the formulas produced by Lichtenthaler and Buschmann [72]:
C(chl a) = (13.36 × A664) − (5.19 × A648)
C(chl b) = (27.43 × A648) − (8.12 × A664)
C(carotenoids) = (1000 × A471 − 2.13 × C(chl a) − 97.64 × C(chl b))/(209)
where A is the extract’s absorption at the respective wavelength; C(chl a), C(chl b), and C(carotenoids) are the concentrations of alpha and beta chlorophyll and total carotenoids in the extract (µg mL−1).
The photosynthetic pigment concentration in a gram of fresh leaf/needle mass was calculated according to the following formula:
Cx = ((C × V × W))/(M)
where CX is the concentration of pigments in fresh leaf/needle mass (µg g−1); C is the concentration of pigments in the extract (µg mL−1); V is the volume of crude extract (mL); W is the dilution of crude extract (units); M is the weight of extracted biomass (g).
Total polyphenol content (TPC) was determined using the Folin–Ciocalteu reagent using a modified methodology [73]. After one hour of incubation in the dark, sample absorption at a wavelength of 725 nm was measured. Gallic acid (>98%, Carl Roth GmbH + Co. KG, Karlsruhe, Germany) was used for the calibration curve. TPC was expressed as micrograms of gallic acid equivalent to one gram of fresh mass (mg g−1):
TPC (mg/g) = ((C × V))/(m)
where C is the concentration obtained from the calibration curve (mg m L−1); V is the extract volume (mL); m is the weight of fresh biomass extracted (g).
Total flavonoid content (TFC) was estimated by forming a flavonoid–Al(III) complex [74]. Sample absorption at a wavelength of 415 nm was measured. Quercetin (>98%, Cayman Chemical Company, Ann Arbor, MI, USA) was used for the calibration curve. TFC was expressed as micrograms of the quercetin equivalent in one gram of fresh biomass (mg g−1) (Formula (5)).
Total soluble sugars (TSS) were determined using the methodology by Leyva et al. [75]. The supernatant was mixed with 0.1% anthrone reagent (CarlRoth, Karlsruhe, Germany) and heated at 90 °C for one hour (Agro-LAB Termostating TFC 200, Venice, Italy). The absorbance of the cooled samples was measured at a wavelength of 620 nm. Glucose was used to create the calibration curve, and the amount of soluble sugars was expressed as glucose equivalents (mg) per gram of raw tissue based on dilution and sample weight. The calibration curve. TSS was expressed as micrograms of the quercetin equivalent in one gram of fresh biomass (mg g−1) (Formula (5)).

4.3. Statistical Analysis

Lilliefors and Kolmogorov–Smirnov tests checked the normality of the variables. A non-parametric ANOVA Kruskal–Wallis analysis was used to ascertain the significant differences in growth and biochemical parameters between the treatments. This test was used instead of a standard one-way ANOVA as the data were non-normally distributed. To identify the significantly different means, the post hoc analyses were performed using the Dunn–Bonferroni procedure. Throughout this study, the means are presented with the standard error of the mean (±SE). Statistical analyses were conducted using Statistica 12.0 (StatSoft. Inc. 2007, Tulsa, OK, USA) software, and a level of significance of p ≤ 0.05 was chosen in all cases.

5. Conclusions

The growth and biochemical parameters of Scots pine (Pinus sylvestris L.), Norway spruce (Picea abies (L.) H.Karst.), silver birch (Betula pendula Roth), small-leaved lime (Tilia cordata Mill.), and Norway maple (Acer platanoides L.) showed an early response to particulate matter (PM) when exposed to elevated levels of combined O3 and CO2. Considering the technical limitations of this experiment, it was only possible to evaluate the combined effects of CO2 and O3 simultaneously rather than their individual effects. This study found that Scots pine and Norway maple were the most neutral species under the combined PM, O3, and CO2 treatments, showing no parameter changes. The treatment with a single PM gave a relatively diverse response by these species. The reaction of the chlorophyll parameter to PM exposure with or without elevated combined O3 and CO2 concentrations showed the following order of species: silver birch (increase in chl a and b)—Norway maple (neutral to increase)—Scots pine (neutral to decrease)—Norway spruce and small-leaved lime (decrease in chl a and b). Regarding the total polyphenol content (TPC), an active stress response was found in Scots pine, small-leaved lime, and Norway maple under increased combined O3 and CO2 and Norway spruce under PM treatments. While short-term exposure limits definitive conclusions, this study’s findings demonstrated that Scots pine and Norway maple showed higher resistance to increased PM and combined CO2 and O3 levels, as growth parameters did not change significantly. Silver birch seedlings showed an adaptive response by increasing chlorophyll content under pollutant exposure, indicating a higher capacity to adapt to urban pollutant stress. Even with these study conclusions, different variations in tree responses are likely to occur over a longer period as this experiment continues.

Author Contributions

Conceptualization, V.Č. and I.V.-K.; formal analysis, V.Č., I.V.-K. and V.A.; investigation, V.Č., I.V.-K., I.Č. and E.A.; methodology, V.Č., I.V.-K., I.Č. and V.A.; software, V.Č. and I.V.-K.; supervision, I.V.-K.; validation, I.V.-K.; visualization, V.Č. and I.V.-K.; writing—original draft, V.Č. and I.V.-K.; writing—review and editing, I.Č., E.A. and V.A. All authors have read and agreed to the published version of the manuscript.

Funding

This research received no external funding.

Data Availability Statement

The original contributions presented in this study are included in this article; further inquiries can be directed to the corresponding author.

Acknowledgments

This study was conducted as a part of the Valentinas Černiauskas PhD project and partially within the Long-Term Research Program ‘Sustainable Forestry and Global Changes’ at the Lithuanian Agricultural and Forestry Research Center (LAMMC). We thank the three anonymous reviewers and the section editors for efficiently managing this paper through all evaluation stages.

Conflicts of Interest

The authors declare no conflicts of interest.

References

  1. Bell, J.N.B.; Power, S.A.; Jarraud, N.; Agrawal, M.; Davies, C. The effects of air pollution on urban ecosystems and agriculture. Int. J. Sustain. Dev. World Ecol. 2011, 18, 226–235. [Google Scholar] [CrossRef]
  2. Bereitschaft, B.; Debbage, K. Urban form, air pollution, and CO2 emissions in large US metropolitan areas. Prof. Geogr. 2013, 65, 612–635. [Google Scholar] [CrossRef]
  3. United Nations. World Urbanization Prospects. 2017. Available online: https://www.unfpa.org/urbanization (accessed on 25 August 2024).
  4. Apte, J.S.; Brauer, M.; Cohen, A.J.; Ezzati, M.; Pope, C.A. Ambient PM2.5 reduces global and regional life expectancy. Environ. Sci. Technol. Lett. 2018, 5, 546–551. [Google Scholar] [CrossRef]
  5. Pataki, D.E.; Alberti, M.; Cadenasso, M.L.; Felson, A.J.; McDonnell, M.J.; Pincetl, S.; Pouyat, R.V.; Setälä, H.; Whitlow, T.H. The benefits and limits of urban tree planting for environmental and human health. Front. Ecol. Evol. 2021, 9, 603757. [Google Scholar] [CrossRef]
  6. Air Quality in Europe—2019 Report. EEA Report No 10/2019; Publications Office of the European Union: Luxembourg, 2019; Available online: https://www.miteco.gob.es/content/dam/miteco/es/calidad-y-evaluacion-ambiental/temas/atmosfera-y-calidad-del-aire/air-quality-in-europe_2019_tcm30-187944.pdf (accessed on 13 September 2024).
  7. Pope, C.A., III; Dockery, D.W. Health effects of fine particulate air pollution: Lines that connect. J. Air Waste Manag. Assoc. 2006, 56, 709–742. [Google Scholar] [CrossRef]
  8. Cohen, A.J.; Anderson, H.R.; Ostro, B.; Pandey, K.D.; Krzyzanowski, M.; Künzli, N.; Gutschmidt, K.; Pope, A.; Romieu, I.; Samet, J.M.; et al. The global burden of disease due to outdoor air pollution. J. Toxicol. Environ. Health. Part A 2005, 68, 1301–1307. [Google Scholar] [CrossRef]
  9. Burnett, R.; Chen, H.; Szyszkowicz, M.; Fann, N.; Hubbell, B.; Pope, C.A., III; Apte, J.S.; Brauer, M.; Cohen, A.; Weichenthal, S.; et al. Global estimates of mortality associated with long-term exposure to outdoor fine particulate matter. Proc. Natl. Acad. Sci. USA 2018, 115, 9592–9597. [Google Scholar] [CrossRef]
  10. Altimir, N.; Tuovinen, J.P.; Vesala, T.; Kulmala, M.; Hari, P. Measurements of ozone removal by Scots pine shoots: Calibration of a stomatal uptake model including the non-stomatal component. Atmos. Environ. 2004, 38, 2387–2398. [Google Scholar] [CrossRef]
  11. O’Driscoll, R.; Stettler, M.E.; Molden, N.; Oxley, T.; ApSimon, H.M. Real world CO2 and NOx emissions from 149 Euro 5 and 6 diesel, gasoline and hybrid passenger cars. Sci. Total Environ. 2018, 621, 282–290. [Google Scholar] [CrossRef]
  12. Yeung, L.Y.; Murray, L.T.; Martinerie, P.; Witrant, E.; Hu, H.; Banerjee, A.; Orsi, A.; Chappellaz, J. Isotopic constraint on the twentieth-century increase in tropospheric ozone. Nature 2019, 570, 224–227. [Google Scholar] [CrossRef] [PubMed]
  13. Shahid, M.; Natasha; Dumat, C.; Niazi, N.K.; Xiong, T.T.; Farooq, A.B.U.; Khalid, S. Ecotoxicology of heavy metal (loid)-enriched particulate matter: Foliar accumulation by plants and health impacts. Rev. Environ. Contam. Toxicol. 2021, 253, 65–113. [Google Scholar] [CrossRef] [PubMed]
  14. Zhao, S.; Yin, D.; Yu, Y.; Kang, S.; Qin, D.; Dong, L. PM2.5 and O3 pollution during 2015–2019 over 367 Chinese cities: Spatiotemporal variations, meteorological and topographical impacts. Environ. Pollut. 2020, 264, 114694. [Google Scholar] [CrossRef] [PubMed]
  15. Oksanen, E.; Kontunen-Soppela, S. Plants have different strategies to defend against air pollutants. Curr. Opin. Environ. Sci. Health 2021, 19, 100222. [Google Scholar] [CrossRef]
  16. Nowak, D.J.; Greenfield, E.J.; Hoehn, R.E.; Lapoint, E. Carbon storage and sequestration by trees in urban and community areas of the United States. Environ. Pollut. 2013, 178, 229–236. [Google Scholar] [CrossRef] [PubMed]
  17. Fares, S.; Conte, A.; Alivernini, A.; Chianucci, F.; Grotti, M.; Zappitelli, I.; Petrella, F.; Corona, P. Testing removal of carbon dioxide, ozone, and atmospheric particles by urban parks in Italy. Environ. Sci. Technol. 2020, 54, 14910–14922. [Google Scholar] [CrossRef] [PubMed]
  18. Fares, S.; Matteucci, G.; Mugnozza, G.S.; Morani, A.; Calfapietra, C.; Salvatori, E.; Fusaro, L.; Manes, F.; Loreto, F. Testing of models of stomatal ozone fluxes with field measurements in a mixed Mediterranean forest. Atmos. Environ. 2013, 67, 242–251. [Google Scholar] [CrossRef]
  19. Lombardozzi, D.; Levis, S.; Bonan, G.; Hess, P.G.; Sparks, J.P. The influence of chronic ozone exposure on global carbon and water cycles. J. Clim. 2015, 28, 292–305. [Google Scholar] [CrossRef]
  20. Manes, F.; Incerti, G.; Salvatori, E.; Vitale, M.; Ricotta, C.; Costanza, R. Urban ecosystem services: Tree diversity and stability of tropospheric ozone removal. Ecol. Appl. 2012, 22, 349–360. [Google Scholar] [CrossRef]
  21. Sicard, P.; Agathokleous, E.; Araminiene, V.; Carrari, E.; Hoshika, Y.; De Marco, A.; Paoletti, E. Should we see urban trees as effective solutions to reduce increasing ozone levels in cities? Environ. Pollut. 2018, 243, 163–176. [Google Scholar] [CrossRef]
  22. Nowak, D.J.; Crane, D.E.; Stevens, J.C. Air pollution removal by urban trees and shrubs in the United States. Urban For. Urban Green. 2006, 4, 115–123. [Google Scholar] [CrossRef]
  23. Nowak, D.J.; Hirabayashi, S.; Doyle, M.; McGovern, M.; Pasher, J. Air pollution removal by urban forests in Canada and its effect on air quality and human health. Urban For. Urban Green. 2018, 29, 40–48. [Google Scholar] [CrossRef]
  24. Nowak, D.J.; Greenfield, E.J.; Ash, R.M. Annual biomass loss and potential value of urban tree waste in the United States. Urban For. Urban Green. 2019, 46, 126469. [Google Scholar] [CrossRef]
  25. Currie, B.A.; Bass, B. Estimates of air pollution mitigation with green plants and green roofs using the UFORE model. Urban Ecosyst. 2008, 11, 409–422. [Google Scholar] [CrossRef]
  26. Sæbø, A.; Popek, R.; Nawrot, B.; Hanslin, H.M.; Gawronska, H.; Gawronski, S.W. Plant species differences in particulate matter accumulation on leaf surfaces. Sci. Total Environ. 2012, 427, 347–354. [Google Scholar] [CrossRef]
  27. Song, Y.; Maher, B.A.; Li, F.; Wang, X.; Sun, X.; Zhang, H. Particulate matter deposited on leaf of five evergreen species in Beijing, China: Source identification and size distribution. Atmos. Environ. 2015, 105, 53–60. [Google Scholar] [CrossRef]
  28. He, C.; Qiu, K.; Alahmad, A.; Pott, R. Particulate matter capturing capacity of roadside evergreen vegetation during the winter season. Urban For. Urban Green. 2020, 48, 126510. [Google Scholar] [CrossRef]
  29. Mondal, S.; Singh, G. Air pollution tolerance, anticipated performance, and metal accumulation capacity of common plant species for green belt development. Environ. Sci. Pollut. Res. 2022, 29, 25507–25518. [Google Scholar] [CrossRef]
  30. Jim, C.Y.; Chen, W.Y. Assessing the ecosystem service of air pollutant removal by urban trees in Guangzhou (China). J. Environ. Manag. 2008, 88, 665–676. [Google Scholar] [CrossRef] [PubMed]
  31. Nowak, D.J.; Crane, D.E. Carbon storage and sequestration by urban trees in the USA. Environ. Pollut. 2002, 116, 381–389. [Google Scholar] [CrossRef] [PubMed]
  32. McPherson, E.G.; Simpson, J.R.; Peper, P.F.; Maco, S.E.; Xiao, Q. Municipal forest benefits and costs in five U.S. cities. J. For. 2005, 104, 411–416. [Google Scholar] [CrossRef]
  33. Ordóñez, C.; Duinker, P.N. Assessing the vulnerability of urban forests to climate change. Environ. Rev. 2014, 22, 311–321. [Google Scholar] [CrossRef]
  34. Locosselli, G.M.; de Camargo, E.P.; Moreira, T.C.L.; Todesco, E.; de Fátima Andrade, M.; de André, C.D.S.; de André, P.A.; Singer, J.M.; Ferreira, L.S.; Saldiva, P.H.N.; et al. The role of air pollution and climate on the growth of urban trees. Sci. Total Environ. 2019, 666, 652–661. [Google Scholar] [CrossRef]
  35. Baraldi, R.; Neri, L.; Costa, F.; Facini, O.; Rapparini, F.; Carriero, G. Ecophysiological and micromorphological characterization of green roof vegetation for urban mitigation. Urban For. Urban Green. 2019, 37, 24–32. [Google Scholar] [CrossRef]
  36. Singh, H.; Yadav, M.; Kumar, N.; Kumar, A.; Kumar, M. Assessing adaptation and mitigation potential of roadside trees under the influence of vehicular emissions: A case study of Grevillea robusta and Mangifera indica planted in an urban city of India. PLoS ONE 2020, 15, e0227380. [Google Scholar] [CrossRef]
  37. Singh, H. An integrated approach considering physiological- and biophysical-based indicators for assessing tolerance of roadside plantations of Alstonia scholaris towards urban roadside air pollution: An assessment of adaptation of plantations for mitigating roadside air pollution. Trees 2023, 37, 69–83. [Google Scholar] [CrossRef]
  38. Mulenga, C.; Clarke, C.; Meincken, M. Physiological and growth responses to pollutant-induced biochemical changes in plants: A review. Pollution 2020, 6, 827–848. [Google Scholar] [CrossRef]
  39. Šamec, D.; Karalija, E.; Šola, I.; Vujčić Bok, V.; Salopek-Sondi, B. The role of polyphenols in abiotic stress response: The influence of molecular structure. Plants 2021, 10, 118. [Google Scholar] [CrossRef]
  40. Dadkhah-Aghdash, H.; Rasouli, M.; Rasouli, K.; Salimi, A. Detection of urban trees sensitivity to air pollution using physiological and biochemical leaf traits in Tehran, Iran. Sci. Rep. 2022, 12, 15398. [Google Scholar] [CrossRef] [PubMed]
  41. Nowak, D.J.; Civerolo, K.L.; Rao, S.T.; Sistla, G.; Luley, C.J.; Crane, D.E. A modeling study of the impact of urban trees on ozone. Atmos. Environ. 2000, 34, 1601–1613. [Google Scholar] [CrossRef]
  42. Escobedo, F.J.; Nowak, D.J. Spatial heterogeneity and air pollution removal by an urban forest. Landsc. Urban Plan. 2009, 90, 102–110. [Google Scholar] [CrossRef]
  43. Beckett, K.P.; Freer-Smith, P.H.; Taylor, G. Urban woodlands: Their role in reducing the effects of particulate pollution. Environ. Pollut. 1998, 99, 347–360. [Google Scholar] [CrossRef] [PubMed]
  44. Freer-Smith, P.H.; Beckett, K.P.; Taylor, G. Deposition velocities to Sorbus aria, Acer campestre, Populus deltoides trichocarpa ‘Beaupre’, Pinus nigra and Cupressocyparis leylandii for coarse, fine and ultra-fine particles in the urban environment. Environ. Pollut. 2005, 133, 157–167. [Google Scholar] [CrossRef] [PubMed]
  45. Manes, F.; Marando, F.; Capotorti, G.; Blasi, C.; Salvatori, E.; Fusaro, L.; Ciancarella, L.; Mircea, M.; Marchetti, M.; Chirici, G.; et al. Regulating ecosystem services of forests in ten Italian metropolitan cities: Air quality improvement by PM10 and O3 removal. Ecol. Indic. 2016, 67, 425–440. [Google Scholar] [CrossRef]
  46. Popek, R.; Łukowski, A.; Bates, C.; Oleksyn, J. Accumulation of particulate matter, heavy metals, and polycyclic aromatic hydrocarbons on the leaves of Tilia cordata Mill. in five Polish cities with different levels of air pollution. Int. J. Phytoremediat. 2017, 19, 1134–1141. [Google Scholar] [CrossRef] [PubMed]
  47. Dzierżanowski, K.; Popek, R.; Gawrońska, H.; Sæbø, A.; Gawroński, S.W. Deposition of particulate matter of different size fractions on leaf surfaces and in waxes of urban forest species. Int. J. Phytoremediat. 2011, 13, 1037–1046. [Google Scholar] [CrossRef] [PubMed]
  48. Holmes, K.R.; Nelson, T.A.; Coops, N.C.; Wulder, M.A. Biodiversity indicators show climate change will alter vegetation in parks and protected areas. Diversity 2013, 5, 352–373. [Google Scholar] [CrossRef]
  49. Ainsworth, E.A.; Long, S.P. What have we learned from 15 years of free air CO2 enrichment (FACE)? A meta-analytic review of the responses of photosynthesis, canopy properties and plant production to rising CO2. New Phytol. 2005, 165, 351–371. [Google Scholar] [CrossRef] [PubMed]
  50. Agathokleous, E.; Kitao, M.; Kinose, Y. A review study on ozone phytotoxicity metrics for setting critical levels in Asia. Asian J. Atmos. Environ. (AJAE) 2018, 12, 1–16. [Google Scholar] [CrossRef]
  51. Ashmore, M.R. Assessing the future global impacts of ozone on vegetation. Plant Cell Environ. 2005, 28, 949–964. [Google Scholar] [CrossRef]
  52. Karnosky, D.F.; Pregitzer, K.S.; Zak, D.R.; Kubiske, M.E.; Hendrey, G.R.; Weinstein, D.; Nosal, M.; Percy, K.E. Scaling ozone responses of forest trees to the ecosystem level in a changing climate. Plant Cell Environ. 2005, 28, 965–981. [Google Scholar] [CrossRef]
  53. Wittig, V.E.; Ainsworth, E.A.; Naidu, S.L.; Karnosky, D.F.; Long, S.P. Quantifying the impact of current and future tropospheric ozone on tree biomass, growth, physiology and biochemistry: A quantitative meta-analysis. Glob. Change Biol. 2009, 15, 396–424. [Google Scholar] [CrossRef]
  54. Lelieveld, J.; Evans, J.S.; Fnais, M.; Giannadaki, D.; Pozzer, A. The contribution of outdoor air pollution sources to premature mortality on a global scale. Nature 2015, 525, 367–384. [Google Scholar] [CrossRef] [PubMed]
  55. Ma, T.; Duan, F.K.; He, K.B.; Qin, Y.; Tong, D.; Geng, G.N.; Liu, X.Y.; Li, H.; Yang, S.; Ye, S.Q.; et al. Air pollution characteristics and their relationship with emissions and meteorology in the Yangtze River Delta region during 2014–2016. J. Environ. Sci. 2019, 83, 8–20. [Google Scholar] [CrossRef] [PubMed]
  56. Riondato, E.; Pilla, F.; Basu, A.S.; Basu, B. Investigating the effect of trees on urban quality in Dublin by combining air monitoring with i-Tree Eco model. Sustain. Cities Soc. 2020, 61, 102356. [Google Scholar] [CrossRef]
  57. Salmond, J.A.; Williams, D.E.; Laing, G.; Kingham, S.; Dirks, K.; Longley, I.; Henshaw, G.S. The influence of vegetation on the horizontal and vertical distribution of pollutants in a street canyon. Sci. Total Environ. 2013, 443, 287–298. [Google Scholar] [CrossRef]
  58. Abhijith, K.V.; Kumar, P.; Gallagher, J.; McNabola, A.; Baldauf, R.; Pilla, F.; Broderick, B.; Di Sabatino, S.; Pulvirenti, B. Air pollution abatement performances of green infrastructure in open road and built-up street canyon environments—A review. Atmos. Environ. 2017, 162, 71–86. [Google Scholar] [CrossRef]
  59. Rai, P.K. Impacts of particulate matter pollution on plants: Implications for environmental biomonitoring. Ecotoxicol. Environ. Saf. 2016, 129, 120–136. [Google Scholar] [CrossRef] [PubMed]
  60. Kováts, N.; Hubai, K.; Diósi, D.; Sainnokhoi, T.A.; Hoffer, A.; Tóth, Á.; Teke, G. Sensitivity of typical European roadside plants to atmospheric particulate matter. Ecol. Indic. 2021, 124, 107428. [Google Scholar] [CrossRef]
  61. Meravi, N.; Prajapati, S.K. Temporal variation in chlorophyll fluorescence of different tree species. Biol. Rhythm Res. 2020, 51, 331–337. [Google Scholar] [CrossRef]
  62. Shabnam, N.; Oh, J.; Park, S.; Kim, H. Impact of particulate matter on primary leaves of Vigna radiata (L.) R. Wilczek. Ecotoxicol. Environ. Saf. 2021, 212, 111965. [Google Scholar] [CrossRef]
  63. Joshi, P.C.; Swami, A. Air pollution induced changes in the photosynthetic pigments of selected plant species. J. Environ. Biol. 2009, 30, 295–298. [Google Scholar] [CrossRef] [PubMed]
  64. Kończak, B.; Cempa, M.; Deska, M. Assessment of the ability of roadside vegetation to remove particulate matter from the urban air. Environ. Pollut. 2021, 268, 115465. [Google Scholar] [CrossRef] [PubMed]
  65. Łukowski, A.; Popek, R.; Karolewski, P. Particulate matter on foliage of Betula pendula, Quercus robur, and Tilia cordata: Deposition and ecophysiology. Environ. Sci. Pollut. Res. 2020, 27, 10296–10307. [Google Scholar] [CrossRef]
  66. Oksanen, E. Birch as a model species for the acclimation and adaptation of northern forest ecosystem to changing environment. Front. For. Glob. Change 2021, 4, 682512. [Google Scholar] [CrossRef]
  67. Vapaavuori, E.; Holopainen, J.K.; Holopainen, T.; Julkunen-Tiitto, R.; Kaakinen, S.; Kasurinen, A.; Kontunen-Soppela, S.; Kostiainen, K.; Oksanen, E.; Peltonen, P.; et al. Rising atmospheric CO2 concentration partially masks the negative effects of elevated O3 in silver birch (Betula pendula Roth). AMBIO J. Hum. Environ. 2009, 38, 418–424. [Google Scholar] [CrossRef] [PubMed]
  68. Araminienė, V.; Sicard, P.; Anav, A.; Agathokleous, E.; Stakėnas, V.; De Marco, A.; Varnagirytė-Kabašinskienė, I.; Paoletti, E.; Girgždienė, R. Trends and interrelationships of ground-level ozone metrics and forest health in Lithuania. Sci. Total Environ. 2019, 658, 1265–1277. [Google Scholar] [CrossRef]
  69. Jarraud, M.; Steiner, A. Summary for policymakers. In Managing the Risks of Extreme Events and Disasters to Advance Climate Change Adaptation: Special Report of the Intergovernmental Panel on Climate Change; Cambridge University Press: Cambridge, UK, 2012. [Google Scholar] [CrossRef]
  70. Malagoli, M.; Sut, S.; Kumar, G.; Dall’Acqua, S. Variations of elements, pigments, amino acids and secondary metabolites in Vitis vinifera (L.) cv Garganega after 501 biodynamic treatment. Chem. Biol. Technol. Agric. 2022, 9, 36. [Google Scholar] [CrossRef]
  71. Čėsnienė, I.; Miškelytė, D.; Novickij, V.; Mildažienė, V.; Sirgedaitė-Šėžienė, V. Seed treatment with electromagnetic field induces different effects on emergence, growth and profiles of biochemical compounds in seven half-sib families of silver birch. Plants 2023, 12, 3048. [Google Scholar] [CrossRef]
  72. Lichtenthaler, H.K.; Buschmann, C. Chlorophylls and Carotenoids: Measurement and Characterization by UV-VIS Spectroscopy. Curr. Protoc. Food Anal. Chem. 2001, 1, F4.3.1–F4.3.8. [Google Scholar] [CrossRef]
  73. Lowry, O.; Rosebrough, N.; Farr, A.L.; Randall, R. Protein measurement with the Folin phenol reagent. J. Biol. Chem. 1951, 193, 265–275. [Google Scholar] [CrossRef]
  74. Chang, C.C.; Yang, M.H.; Wen, H.M.; Chern, J.C. Estimation of total flavonoid content in propolis by two complementary colometric methods. J. Food Drug Anal. 2002, 10, 3. [Google Scholar] [CrossRef]
  75. Leyva, A.; Quintana, A.; Sánchez, M.; Rodríguez, E.N.; Cremata, J.; Sánchez, J.C. Rapid and sensitive anthrone–sulfuric acid assay in microplate format to quantify carbohydrate in biopharmaceutical products: Method development and validation. Biologicals 2008, 36, 134–141. [Google Scholar] [CrossRef] [PubMed]
Figure 1. Stem height increments (±SE) of Scots pine, Norway spruce, silver birch, small-leaved lime, and Norway maple seedlings. Experimental treatments: PM + O3 + CO2 is a treatment with particulate matter (PM) at elevated O3 and CO2; O3 + CO2 is the treatment without PM at elevated O3 and CO2; PM is the treatment with PM at no elevated O3 and CO2; Control has no PM, no elevated O3, and CO2 (n = 21). Data significance was calculated using the Kruskal–Wallis test followed by Dunn–Bonferroni post hoc test for pairs (p ≤ 0.05). Different letters indicate statistically significant differences between treatments within each species.
Plants 14 00006 g001
Figure 2. Stem diameter increment (±SE) of Scots pine, Norway spruce, silver birch, small-leaved lime, and Norway maple seedlings. Experimental treatments: PM + O3 + CO2 is a treatment with particulate matter (PM) at elevated O3 and CO2; O3 + CO2 is the treatment without PM at elevated O3 and CO2; PM is the treatment with PM at no elevated O3 and CO2; Control has no PM, no elevated O3, and CO2 (n = 21). Data significance was calculated using the Kruskal–Wallis test followed by Dunn–Bonferroni post hoc test for pairs (p ≤ 0.05). Different letters indicate statistically significant differences between treatments within each species.
Plants 14 00006 g002
Figure 3. Total polyphenol content (±SE) in needles of Scots pine and Norway spruce seedlings and leaves of silver birch, small-leaved lime, and Norway maple seedlings. Experimental treatments: PM + O3 + CO2 is a treatment with particulate matter (PM) at elevated O3 and CO2; O3 + CO2—treatment without PM at elevated O3 and CO2; PM—treatment with PM at no elevated O3 and CO2; Control—no PM and no elevated O3 and CO2 (n = 9). Data significance was calculated using the Kruskal–Wallis test followed by Dunn–Bonferroni post hoc test for pairs (p ≤ 0.05). Different letters indicate statistically significant differences between treatments within each species.
Plants 14 00006 g003
Figure 4. Total flavonoid content (±SE) in needles of Scots pine and Norway spruce seedlings and leaves of silver birch, small-leaved lime, and Norway maple seedlings. Experimental treatments: PM + O3 + CO2 is a treatment with particulate matter (PM) at elevated O3 and CO2; O3 + CO2—treatment without PM at elevated O3 and CO2; PM—treatment with PM at no elevated O3 and CO2; Control—no PM and no elevated O3 and CO2 (n = 9). Data significance was calculated using the Kruskal–Wallis test followed by Dunn–Bonferroni post hoc test for pairs (p ≤ 0.05). Different letters indicate statistically significant differences between treatments within each species.
Plants 14 00006 g004
Figure 5. Total soluble sugar content (±SE) in needles of Scots pine and Norway spruce seedlings and leaves of silver birch, small-leaved lime, and Norway maple seedlings. Experimental treatments: PM + O3 + CO2 is a treatment with particulate matter (PM) at elevated O3 and CO2; O3 + CO2—treatment without PM at elevated O3 and CO2; PM—treatment with PM at no elevated O3 and CO2; Control—no PM and no elevated O3 and CO2 (n = 9). Data significance was calculated using the Kruskal–Wallis test followed by Dunn–Bonferroni post hoc test for pairs (p ≤ 0.05). Different letters indicate statistically significant differences between treatments within each species.
Plants 14 00006 g005
Figure 6. Overview of the effects observed in Scots pine, Norway spruce, silver birch, small-leaved lime, and Norway maple seedlings. Compared to the control (zero line), a significant increase in values is marked by upward-pointing (▲) black, green, and red triangles, a significant decrease—by downward-pointing (▼) black, green, and red triangles and black, green, and red circles (○) on the zero line indicates no change, where black is PM (particulate matter), green is O3 + CO2 (elevated O3 and CO2), and red is PM + O3 + CO2 (PM at elevated O3 and CO2). Note: On the x-axis, H represents the increment in stem height during the treatment period (twelve weeks), and D represents the increment in stem diameter at the root base per vegetation season. Biochemical compounds: Chl a is chlorophyll a; Chl b is chlorophyll b; Caro is the content of carotenoids; TPC is total polyphenol content; TFC is total flavonoid content; and TSS is total soluble sugars.
Plants 14 00006 g006
Table 1. Mean chlorophyll a (chl a), chlorophyll b (chl b), and carotenoid content in needles of Scots pine and Norway spruce seedlings, as well as in leaves of silver birch, small-leaved lime, and Norway maple seedlings (n = 9). Data significance was calculated using the Kruskal–Wallis test followed by Dunn–Bonferroni post hoc test for pairs (p ≤ 0.05). Different letters in columns indicate statistically significant differences between treatments within each species.
Treatment *Photosynthetic Pigment Content (µg g−1) ± SE
Chl aChl bCarotenoid
Scots pine seedlings
PM + O3 + CO2343.8 ± 10.6 ab290.1 ± 7.8 b14.6 ± 0.2 b
O3 + CO2325.1 ± 5.5 a262.2 ± 3.9 a13.9 ± 0.3 a
PM344.0 ± 23.8 ab268.1 ± 16.4 a14.4 ± 0.5 ab
Control366.3 ± 10.8 b283.6 ± 1.3 b14.8 ± 0.1 b
Norway spruce seedlings
PM + O3 + CO2428.9 ± 5.5 a339.8 ± 7.1 a15.4 ± 0.6 a
O3 + CO2459.6 ± 13.9 b349.2 ± 4.1 a17.3 ± 0.6 b
PM532.7 ± 5.4 c393.9 ± 4.1 b17.1 ± 0.2 b
Control615.9 ± 18.3 d427.8 ± 12.6 c17.3 ± 0.3 b
Silver birch seedlings
PM + O3 + CO2385.4 ± 27.8 b271.7 ± 17.3 b20.0 ± 0.5 ab
O3 + CO2308.0 ± 8.8 a226.8 ± 4.4 a19.6 ± 0.7 a
PM413.5 ± 36.4 b292.4 ± 25.3 b21.0 ± 0.6 ab
Control306.3 ± 14.8 a228.2 ± 7.3 a21.0 ± 0.2 b
Small-leaved lime seedlings
PM + O3 + CO2411.9 ± 9.7 a296.7 ± 4.9 a28.6 ± 1.6 ab
O3 + CO2595.5 ± 33.5 b398.2 ± 20.3 b29.7 ± 0.8 b
PM748.6 ± 36.0 c459.2 ± 20.0 c28.3 ± 0.7 ab
Control848.7 ± 24.8 d503.3 ± 10.6 d27.5 ± 1.1 a
Norway maple seedlings
PM + O3 + CO2567.5 ± 26.5 b394.8 ± 27.0 b25.2 ± 1.9 ab
O3 + CO2445.7 ± 26.4 a295.8 ± 17.9 a22.9 ± 1.0 a
PM815.3 ± 19.3 c520.2 ± 11.3 c24.2 ± 0.7 ab
Control619.6 ± 32.7 b421.6 ± 19.4 b25.1 ± 0.3 b
* Note: PM + O3 + CO2 is the treatment with particulate matter (PM) at elevated O3 and CO2; O3 + CO2 is the treatment without PM at elevated O3 and CO2; PM is the treatment with PM at no elevated O3 and CO2; Control indicates no PM, no elevated O3, and CO2.
Table 2. The characteristics of the dry material used as an alternative to particulate matter (PM).
ParameterValueAnalysis Method
pH12ISO 10390:2021
Organic carbon (C, %)3.03LST EN 15936:2022
Phosphorus (P, mg kg−1)14,352LST EN 13657:2003, LST EN ISO 6878:2004
Potassium (K, mg kg−1)15,000LST EN 13657:2003, ISO 9964-3:1993
Calcium (Ca, mg kg−1)237,250LST EN 13657:2003, LST EN ISO 7980:2000
Magnesium (Mg, mg kg−1)30,083
Cadmium (Cd, mg kg−1)13.5LST EN 13657:2003, LST EN ISO 11885:2009
Arsenic (As, mg kg−1)3.00
Nickel (Ni, mg kg−1)19.2
Lead (Pb, mg kg−1)98.0
Boron (B, mg kg−1)457
Vanadium (V, mg kg−1)9.3
Chromium (Cr, mg kg−1)58.8
Copper (Cu, mg kg−1)135
Zink (Zn, mg kg−1)2947
Mercury (Hg)0.143LST EN 13657:2003, LST EN ISO 12846:2012
Benzo(a)pyrene<0.5LST EN 17503:2022
Disclaimer/Publisher’s Note: The statements, opinions and data contained in all publications are solely those of the individual author(s) and contributor(s) and not of MDPI and/or the editor(s). MDPI and/or the editor(s) disclaim responsibility for any injury to people or property resulting from any ideas, methods, instructions or products referred to in the content.

