
Nanoparticle Effects on Ice Plant Mineral Accumulation under Different Lighting Conditions and Assessment of Hazard Quotients for Human Health


Abstract
1. Introduction
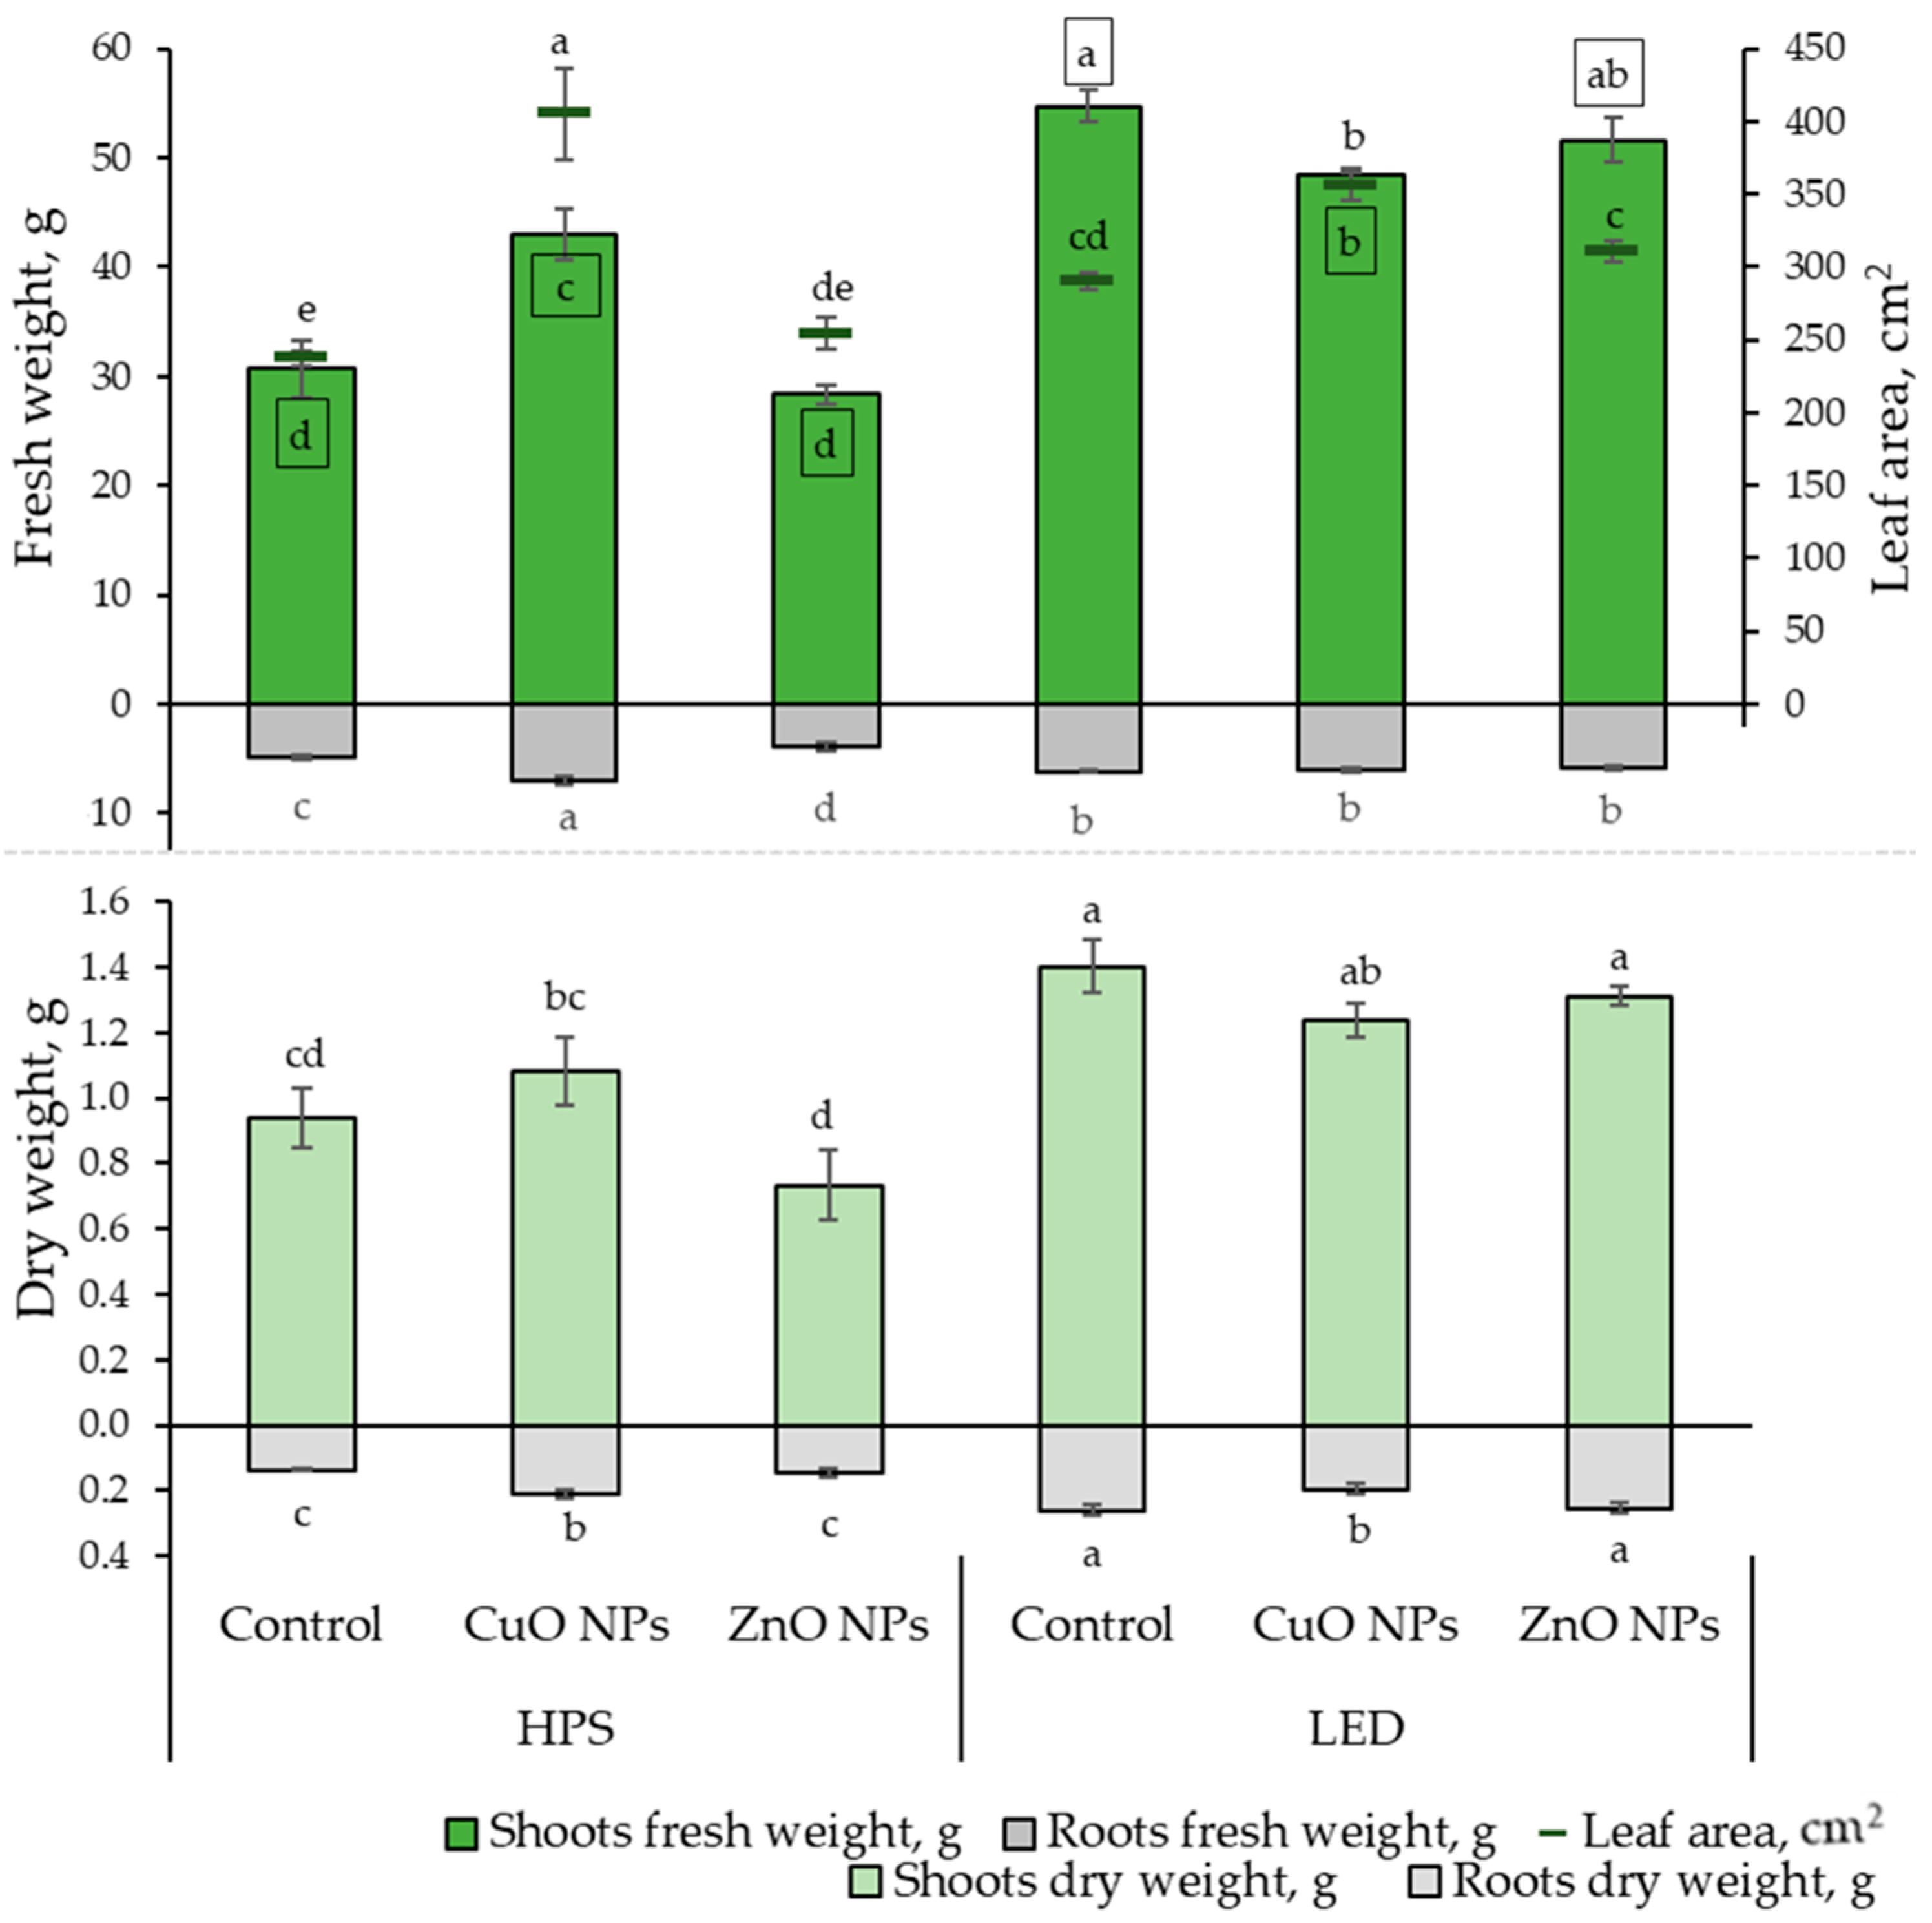
2. Results
3. Discussion
3.1. Combined ZnO, CuO NPs, and Lighting Impact on Cu and Zn Accumulation in Plants
3.2. ZnO and CuO NPs Impact on Other Micro- and Macroelements in Plants
3.3. ZnO and CuO NPs’ Impact on Calculation-Based Risk Assessment to Human Health
4. Materials and Methods
4.1. Nanoparticles Preparation and Characteristics
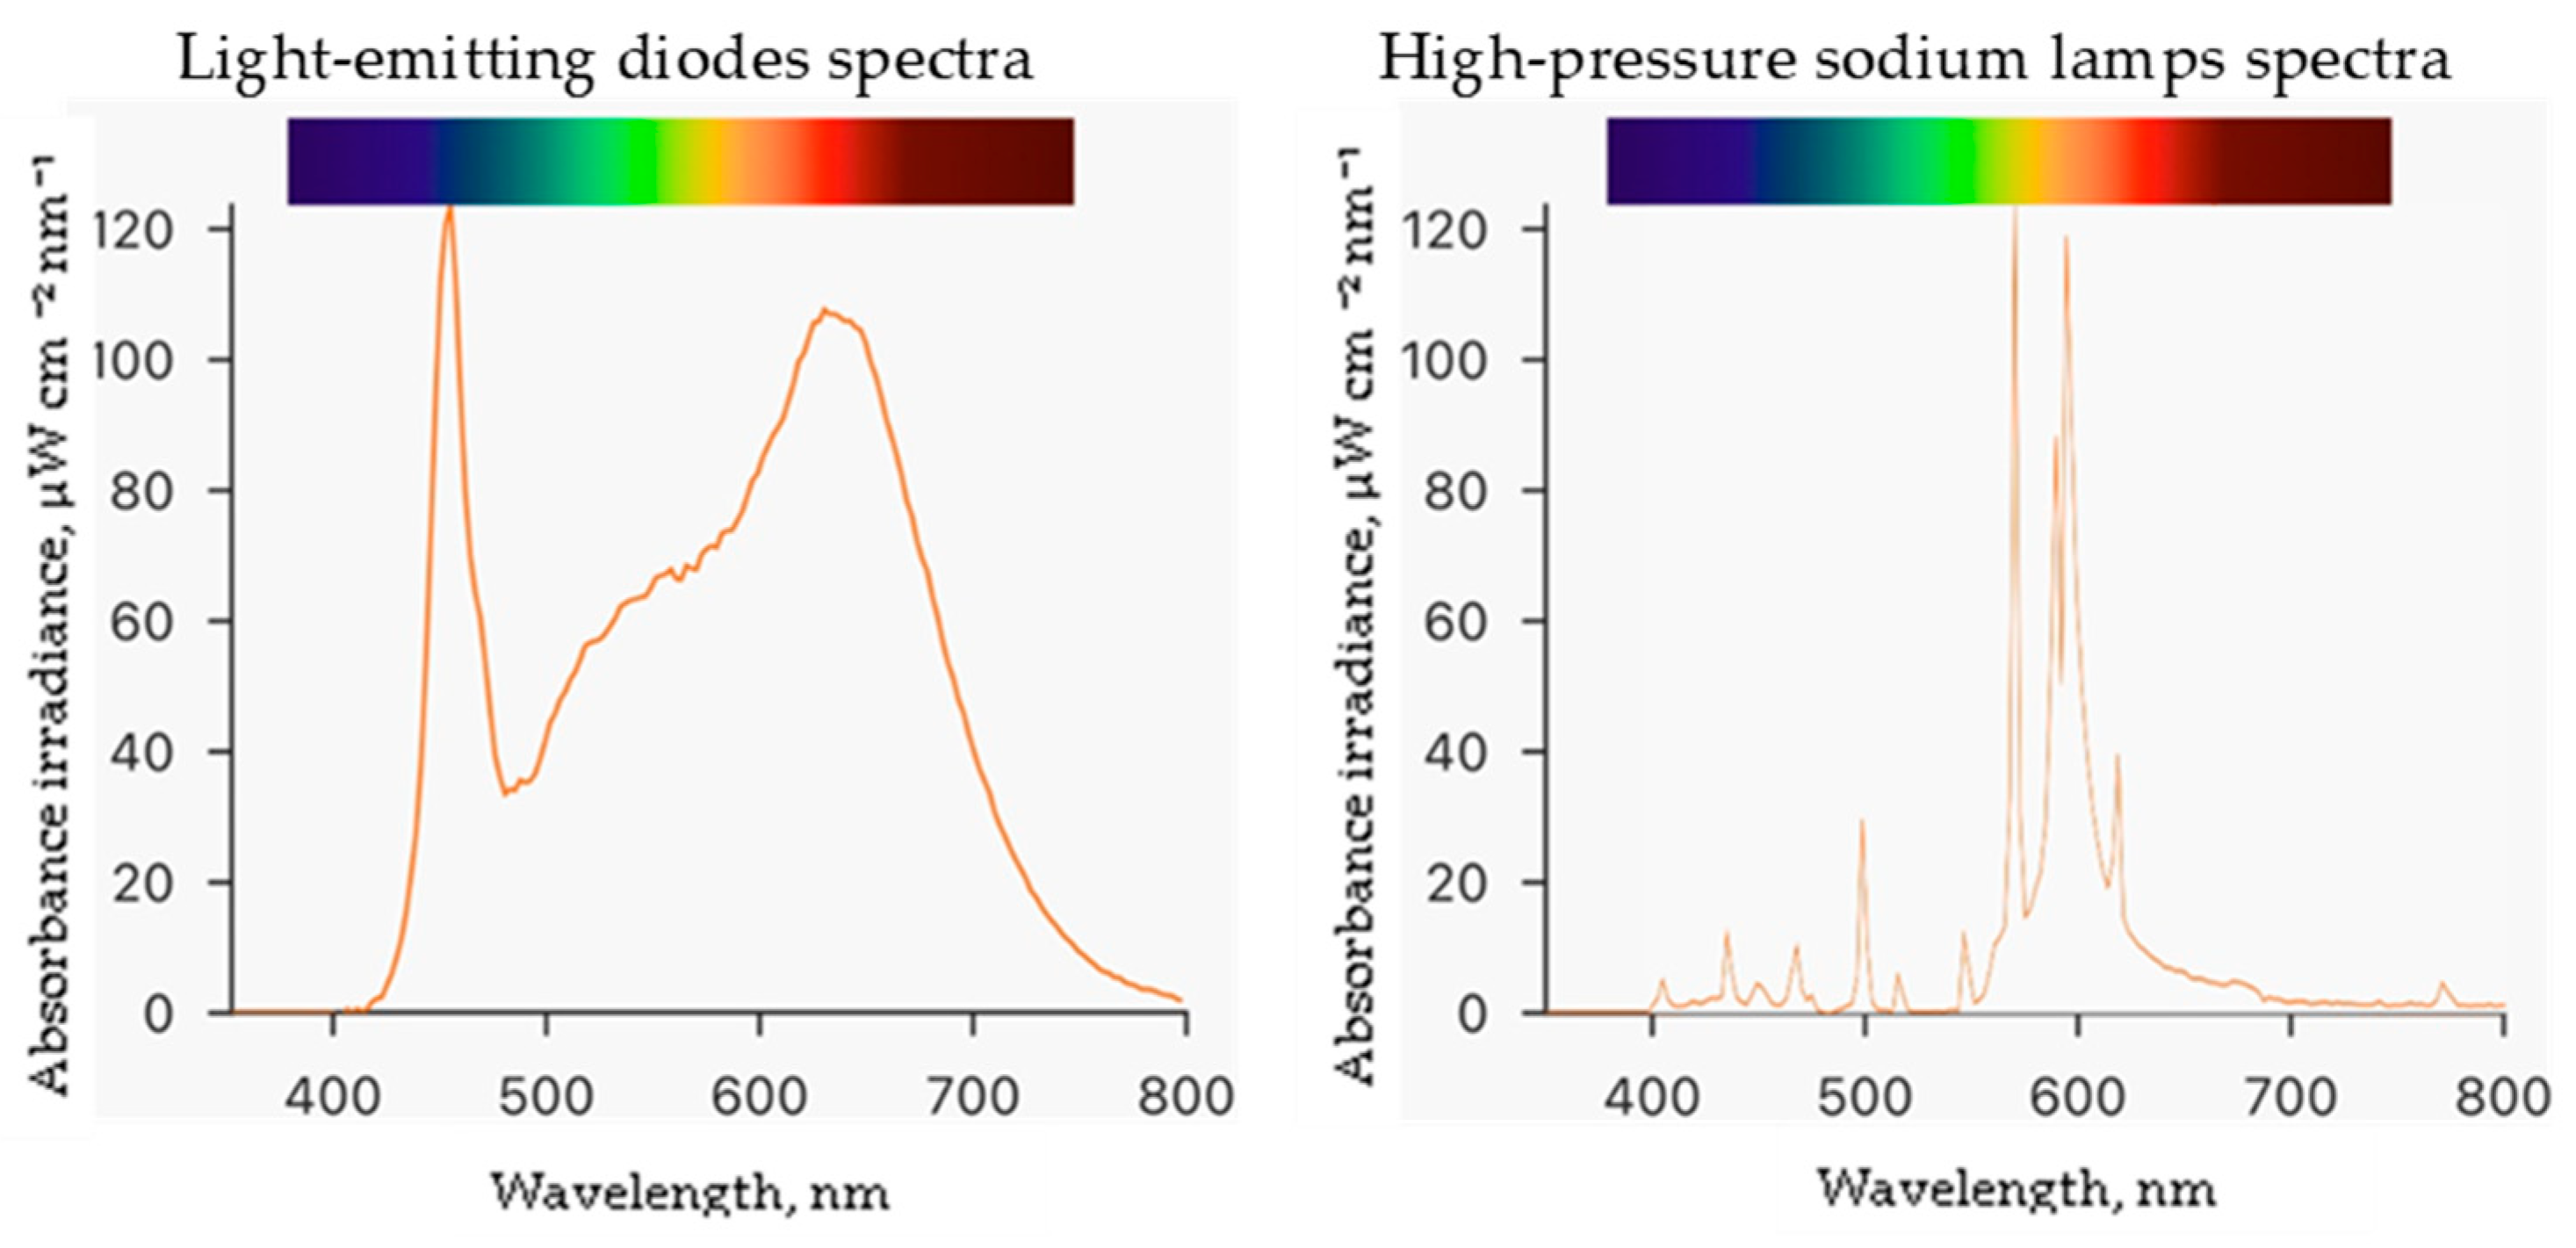
4.2. Plant Growth Conditions, Lighting, and Nanoparticle Treatments
4.3. Growth Characteristics
4.4. Elemental Composition of Ice Plant
4.5. Bio-Concentration Factor and Intake Risk Assessment
4.6. Statistical Analysis
5. Conclusions
Author Contributions
Funding
Data Availability Statement
Conflicts of Interest
References
- Gupta, N.; Ram, H.; Kumar, B. Mechanism of Zinc Absorption in Plants: Uptake, Transport, Translocation and Accumulation. Rev. Environ. Sci. Biotechnol. 2016, 15, 89–109. [Google Scholar] [CrossRef]
- Alloway, B.J. Soil Factors Associated with Zinc Deficiency in Crops and Humans. Environ. Geochem. Health 2009, 31, 537–548. [Google Scholar] [CrossRef] [PubMed]
- Kumar, V.; Pandita, S.; Singh Sidhu, G.P.; Sharma, A.; Khanna, K.; Kaur, P.; Bali, A.S.; Setia, R. Copper Bioavailability, Uptake, Toxicity and Tolerance in Plants: A Comprehensive Review. Chemosphere 2021, 262, 127810. [Google Scholar] [CrossRef] [PubMed]
- Gupta, U.C.; Gupta, S.C. Sources and Deficiency Diseases of Mineral Nutrients in Human Health and Nutrition: A Review. Pedosphere 2014, 24, 13–38. [Google Scholar] [CrossRef]
- Younas, N.; Fatima, I.; Ahmad, I.A.; Ayyaz, M.K. Alleviation of Zinc Deficiency in Plants and Humans through an Effective Technique; Biofortification: A Detailed Review. Acta Ecol. Sin. 2023, 43, 419–425. [Google Scholar] [CrossRef]
- Mahawar, H.; Prasanna, R. Prospecting the Interactions of Nanoparticles with Beneficial Microorganisms for Developing Green Technologies for Agriculture. Environ. Nanotechnol. Monit. Manag. 2018, 10, 477–485. [Google Scholar] [CrossRef]
- Kah, M.; Tufenkji, N.; White, J.C. Nano-Enabled Strategies to Enhance Crop Nutrition and Protection. Nat. Nanotechnol. 2019, 14, 532–540. [Google Scholar] [CrossRef]
- Baker, S.; Volova, T.; Prudnikova, S.V.; Satish, S.; Prasad, M.N. Nanoagroparticles Emerging Trends and Future Prospect in Modern Agriculture System. Environ. Toxicol. Pharmacol. 2017, 53, 10–17. [Google Scholar] [CrossRef]
- Achari, G.A.; Kowshik, M. Recent Developments on Nanotechnology in Agriculture: Plant Mineral Nutrition, Health, and Interactions with Soil Microflora. J. Agric. Food Chem. 2018, 66, 8647–8661. [Google Scholar] [CrossRef]
- Servin, A.; Elmer, W.; Mukherjee, A.; De La Torre-Roche, R.; Hamdi, H.; White, J.C.; Bindraban, P.; Dimkpa, C. A Review of the Use of Engineered Nanomaterials to Suppress Plant Disease and Enhance Crop Yield. J. Nanopart Res. 2015, 17, 92. [Google Scholar] [CrossRef]
- Singh, A.; Rajput, V.D.; Pandey, D.; Sharma, R.; Ghazaryan, K.; Minkina, T. Nano Zinc-Enabled Strategies in Crops for Combatting Zinc Malnutrition in Human Health. Front. Biosci. (Landmark Ed) 2023, 28, 158. [Google Scholar] [CrossRef]
- Goyal, V.; Rani, D.; Ritika; Mehrotra, S.; Deng, C.; Wang, Y. Unlocking the Potential of Nano-Enabled Precision Agriculture for Efficient and Sustainable Farming. Plants 2023, 12, 3744. [Google Scholar] [CrossRef]
- Kisan, B.; Shruthi, H.; Sharanagouda, H.; Revanappa, S.B.; Pramod, N.K. Effect of Nano-Zinc Oxide on the Leaf Physical and Nutritional Quality of Spinach. Agrotechnology 2015, 5, 135. [Google Scholar] [CrossRef]
- García-Gómez, C.; Obrador, A.; González, D.; Babín, M.; Fernández, M.D. Comparative Study of the Phytotoxicity of ZnO Nanoparticles and Zn Accumulation in Nine Crops Grown in a Calcareous Soil and an Acidic Soil. Sci. Total Environ. 2018, 644, 770–780. [Google Scholar] [CrossRef] [PubMed]
- Zhao, L.; Sun, Y.; Hernandez-Viezcas, J.A.; Servin, A.D.; Hong, J.; Niu, G.; Peralta-Videa, J.R.; Duarte-Gardea, M.; Gardea-Torresdey, J.L. Influence of CeO2 and ZnO Nanoparticles on Cucumber Physiological Markers and Bioaccumulation of Ce and Zn: A Life Cycle Study. J. Agric. Food Chem. 2013, 61, 11945–11951. [Google Scholar] [CrossRef]
- Dimkpa, C.O.; White, J.C.; Elmer, W.H.; Gardea-Torresdey, J. Nanoparticle and Ionic Zn Promote Nutrient Loading of Sorghum Grain under Low NPK Fertilization. J. Agric. Food Chem. 2017, 65, 8552–8559. [Google Scholar] [CrossRef] [PubMed]
- Sharifan, H.; Moore, J.; Ma, X. Zinc Oxide (ZnO) Nanoparticles Elevated Iron and Copper Contents and Mitigated the Bioavailability of Lead and Cadmium in Different Leafy Greens. Ecotoxicol. Environ. Saf. 2020, 191, 110177. [Google Scholar] [CrossRef] [PubMed]
- Ji, H.; Guo, Z.; Wang, G.; Wang, X.; Liu, H. Effect of ZnO and CuO Nanoparticles on the Growth, Nutrient Absorption, and Potential Health Risk of the Seasonal Vegetable Medicago polymorpha L. PeerJ 2022, 10, e14038. [Google Scholar] [CrossRef] [PubMed]
- Pelegrino, M.T.; Kohatsu, M.Y.; Seabra, A.B.; Monteiro, L.R.; Gomes, D.G.; Oliveira, H.C.; Rolim, W.R.; De Jesus, T.A.; Batista, B.L.; Lange, C.N. Effects of Copper Oxide Nanoparticles on Growth of Lettuce (Lactuca sativa L.) Seedlings and Possible Implications of Nitric Oxide in Their Antioxidative Defense. Environ. Monit. Assess. 2020, 192, 232. [Google Scholar] [CrossRef]
- Wang, Y.; Lin, Y.; Xu, Y.; Yin, Y.; Guo, H.; Du, W. Divergence in Response of Lettuce (Var. Ramosa Hort.) to Copper Oxide Nanoparticles/Microparticles as Potential Agricultural Fertilizer. Environ. Pollut. Bioavailab. 2019, 31, 80–84. [Google Scholar] [CrossRef]
- Zafar, H.; Ali, A.; Zia, M. CuO Nanoparticles Inhibited Root Growth from Brassica Nigra Seedlings but Induced Root from Stem and Leaf Explants. Appl. Biochem. Biotechnol. 2017, 181, 365–378. [Google Scholar] [CrossRef]
- Xiong, T.; Dumat, C.; Dappe, V.; Vezin, H.; Schreck, E.; Shahid, M.; Pierart, A.; Sobanska, S. Copper Oxide Nanoparticle Foliar Uptake, Phytotoxicity, and Consequences for Sustainable Urban Agriculture. Environ. Sci. Technol. 2017, 51, 5242–5251. [Google Scholar] [CrossRef]
- Bohnert, H.J.; Cushman, J.C. The Ice Plant Cometh: Lessons in Abiotic Stress Tolerance. J. Plant Growth Regul. 2000, 19, 334–346. [Google Scholar] [CrossRef]
- Mndi, O.; Sogoni, A.; Jimoh, M.O.; Wilmot, C.M.; Rautenbach, F.; Laubscher, C.P. Interactive Effects of Salinity Stress and Irrigation Intervals on Plant Growth, Nutritional Value, and Phytochemical Content in Mesembryanthemum crystallinum L. Agriculture 2023, 13, 1026. [Google Scholar] [CrossRef]
- Kim, Y.J.; Kim, H.M.; Kim, H.M.; Lee, H.R.; Jeong, B.R.; Lee, H.-J.; Kim, H.-J.; Hwang, S.J. Growth and Phytochemicals of Ice Plant (Mesembryanthemum crystallinum L.) as Affected by Various Combined Ratios of Red and Blue LEDs in a Closed-Type Plant Production System. J. Appl. Res. Med. Aromat. Plants 2021, 20, 100267. [Google Scholar] [CrossRef]
- Abd El-Gawad, A.M.; Shehata, H.S. Ecology and Development of Mesembryanthemum crystallinum L. in the Deltaic Mediterranean Coast of Egypt. Egypt. J. Basic. Appl. Sci. 2014, 1, 29–37. [Google Scholar] [CrossRef]
- Brazaitytė, A.; Miliauskienė, J.; Vaštakaitė-Kairienė, V.; Sutulienė, R.; Laužikė, K.; Duchovskis, P.; Małek, S. Effect of Different Ratios of Blue and Red LED Light on Brassicaceae Microgreens under a Controlled Environment. Plants 2021, 10, 801. [Google Scholar] [CrossRef] [PubMed]
- Kopsell, D.A.; Sams, C.E.; Morrow, R.C. Blue Wavelengths from LED Lighting Increase Nutritionally Important Metabolites in Specialty Crops. HortScience 2015, 50, 1285–1288. [Google Scholar] [CrossRef]
- Kinoshita, T.; Doi, M.; Suetsugu, N.; Kagawa, T.; Wada, M.; Shimazaki, K. Phot1 and Phot2 Mediate Blue Light Regulation of Stomatal Opening. Nature 2001, 414, 656–660. [Google Scholar] [CrossRef] [PubMed]
- Babourina, O.; Newman, I.; Shabala, S. Blue Light-Induced Kinetics of H+ and Ca2+ Fluxes in Etiolated Wild-Type and Phototropin-Mutant Arabidopsis Seedlings. Proc. Natl. Acad. Sci. USA 2002, 99, 2433–2438. [Google Scholar] [CrossRef] [PubMed]
- Xu, J.; Guo, Z.; Jiang, X.; Ahammed, G.J.; Zhou, Y. Light Regulation of Horticultural Crop Nutrient Uptake and Utilization. Hortic. Plant J. 2021, 7, 367–379. [Google Scholar] [CrossRef]
- Kopsell, D.A.; Sams, C.E. Increases in Shoot Tissue Pigments, Glucosinolates, and Mineral Elements in Sprouting Broccoli after Exposure to Short-Duration Blue Light from Light Emitting Diodes. J. Am. Soc. Hort. Sci. 2013, 138, 31–37. [Google Scholar] [CrossRef]
- Brazaitytė, A.; Vaštakaitė, V.; Jankauskienė, J.; Viršilė, A.; Samuolienė, G.; Sakalauskienė, S.; Novičkovas, A.; Miliauskienė, J.; Duchovskis, P. Comparison of LED and HPS Illumination Effects on Cultivation of Red Pak Choi Microgreens under Indoors and Greenhouse Conditions. Acta Hortic. 2020, 1287, 395–402. [Google Scholar] [CrossRef]
- Choi, M.-K.; Chang, M.-S.; Eom, S.-H.; Min, K.-S.; Kang, M.-H. Physicochemical Composition of Buckwheat Microgreens Grown under Different Light Conditions. J. Korean Soc. Food Sci. Nutr. 2015, 44, 709–715. [Google Scholar] [CrossRef]
- Lowry, G.V.; Gregory, K.B.; Apte, S.C.; Lead, J.R. Transformations of Nanomaterials in the Environment. Environ. Sci. Technol. 2012, 46, 6893–6899. [Google Scholar] [CrossRef] [PubMed]
- Seregin, I.V.; Kozhevnikova, A.D. Phytochelatins: Sulfur-Containing Metal(Loid)-Chelating Ligands in Plants. IJMS 2023, 24, 2430. [Google Scholar] [CrossRef]
- Cai, Z.; Li, F.; Rong, M.; Lin, L.; Yao, Q.; Huang, Y.; Chen, X.; Wang, X. Introduction. In Novel Nanomaterials for Biomedical, Environmental and Energy Applications; Elsevier: Amsterdam, The Netherlands, 2019; pp. 1–36. ISBN 9780128144978. [Google Scholar]
- Avramescu, M.-L.; Chénier, M.; Beauchemin, S.; Rasmussen, P. Dissolution Behaviour of Metal-Oxide Nanomaterials in Various Biological Media. Nanomaterials 2022, 13, 26. [Google Scholar] [CrossRef]
- Masoero, G.; Cugnetto, A. The Raw pH in Plants: A Multifaceted Parameter. JAR 2018, 1, 18–34. [Google Scholar] [CrossRef]
- Tsai, H.H.; Schmidt, W. The Enigma of Environmental pH Sensing in Plants. Nat. Plants 2021, 7, 106–115. [Google Scholar] [CrossRef]
- Son, J.; Vavra, J.; Forbes, V.E. Effects of Water Quality Parameters on Agglomeration and Dissolution of Copper Oxide Nanoparticles (CuO-NPs) Using a Central Composite Circumscribed Design. Sci. Total Environ. 2015, 521–522, 183–190. [Google Scholar] [CrossRef]
- Qiu, Y.; Mu, Z.; Wang, N.; Wang, X.; Xu, M.; Li, H. The Aggregation and Sedimentation of Two Different Sized Copper Oxide Nanoparticles in Soil Solutions: Dependence on pH and Dissolved Organic Matter. Sci. Total Environ. 2020, 731, 139215. [Google Scholar] [CrossRef] [PubMed]
- Avramescu, M.-L.; Rasmussen, P.E.; Chénier, M.; Gardner, H.D. Influence of pH, Particle Size and Crystal Form on Dissolution Behaviour of Engineered Nanomaterials. Environ. Sci. Pollut. Res. 2017, 24, 1553–1564. [Google Scholar] [CrossRef] [PubMed]
- Adams, P.; Nelson, D.E.; Yamada, S.; Chmara, W.; Jensen, R.G.; Bohnert, H.J.; Griffiths, H. Growth and Development of Mesembryanthemum Crystallinum (Aizoaceae). New Phytol. 1998, 138, 171–190. [Google Scholar] [CrossRef] [PubMed]
- Araújo, G.C.L.; Gonzalez, M.H.; Ferreira, A.G.; Nogueira, A.R.A.; Nóbrega, J.A. Effect of Acid Concentration on Closed-Vessel Microwave-Assisted Digestion of Plant Materials. Spectrochim. Acta Part B At. Spectrosc. 2002, 57, 2121–2132. [Google Scholar] [CrossRef]
- Barbosa, J.T.P.; Santos, C.M.M.; Peralva, V.N.; Flores, E.M.M.; Korn, M.; Nóbrega, J.A.; Korn, M.G.A. Microwave-Assisted Diluted Acid Digestion for Trace Elements Analysis of Edible Soybean Products. Food Chem. 2015, 175, 212–217. [Google Scholar] [CrossRef]
- Zacchini, M.; Pietrini, F.; Scarascia Mugnozza, G.; Iori, V.; Pietrosanti, L.; Massacci, A. Metal Tolerance, Accumulation and Translocation in Poplar and Willow Clones Treated with Cadmium in Hydroponics. Water Air Soil. Pollut. 2009, 197, 23–34. [Google Scholar] [CrossRef]
- Natasha; Shahid, M.; Farooq, A.B.U.; Rabbani, F.; Khalid, S.; Dumat, C. Risk Assessment and Biophysiochemical Responses of Spinach to Foliar Application of Lead Oxide Nanoparticles: A Multivariate Analysis. Chemosphere 2020, 245, 125605. [Google Scholar] [CrossRef] [PubMed]
- United States Environmental Protection Agency (US EPA), Integrated Risk Information System. Available online: https://www.epa.gov/iris (accessed on 6 February 2024).
- Taylor, A.A.; Tsuji, J.S.; McArdle, M.E.; Adams, W.J.; Goodfellow, W.L. Recommended Reference Values for Risk Assessment of Oral Exposure to Copper. Risk Anal. 2023, 43, 211–218. [Google Scholar] [CrossRef] [PubMed]


 | |||||||||||||||||||||
|---|---|---|---|---|---|---|---|---|---|---|---|---|---|---|---|---|---|---|---|---|---|
| Shoots FW | Shoots DW | Roots FW | Roots DW | Leaf Area | BCF CuO | HQ CuO | BCF ZnO | HQ ZnO | P | B | Ca | Cu | Fe | K | Mg | Mn | Na | Zn | Mo | ||
| Shoot FW | - | *** | *** | *** | ** | * | ** | *** | *** | *** | |||||||||||
| Shoot DW | - | *** | *** | * | ** | *** | *** | *** | |||||||||||||
| Roots FW | - | *** | *** | ||||||||||||||||||
| Roots DW | - | * | *** | * | |||||||||||||||||
| Leaf area | - | ** | ** | ** | ** | ||||||||||||||||
| BCF CuO | - | *** | ** | *** | ** | ||||||||||||||||
| HQ CuO | - | ** | *** | ** | |||||||||||||||||
| BCF ZnO | - | *** | *** | *** | *** | ||||||||||||||||
| HQ ZnO | - | *** | *** | *** | |||||||||||||||||
| P | - | *** | * | *** | |||||||||||||||||
| B | - | *** | * | ||||||||||||||||||
| Ca | - | ** | *** | ** | *** | ** | |||||||||||||||
| Cu | - | ** | |||||||||||||||||||
| Fe | - | *** | *** | ** | *** | ||||||||||||||||
| K | - | *** | ** | *** | |||||||||||||||||
| Mg | - | *** | ** | *** | |||||||||||||||||
| Mn | - | ** | |||||||||||||||||||
| Na | - | ** | |||||||||||||||||||
| Zn | - | ||||||||||||||||||||
| Mo | 1 | ||||||||||||||||||||
| Lighting | NPs | P | Ca | K | Mg | Na |
|---|---|---|---|---|---|---|
| HPS | 0 | 0.492 a | 6.181 ab | 52.912 ab | 3.344 b | 5.348 ab |
| CuO | 0.478 a | 8.365 a | 51.140 b | 3.045 b | 5.543 a | |
| ZnO | 0.557 a | 7.048 ab | 54.941 ab | 3.149 b | 5.514 ab | |
| LEDs | 0 | 0.512 a | 5.769 b | 59.610 a | 4.550 a | 5.333 ab |
| CuO | 0.532 a | 5.997 b | 59.328 a | 4.500 a | 5.130 b | |
| ZnO | 0.576 a | 6.693 ab | 56.539 ab | 4.743 a | 5.323 ab |
| Lighting | NPs | Zn | Cu | Fe | Mn | B | Mo |
|---|---|---|---|---|---|---|---|
| HPS | 0 | 82.015 c | 10.645 c | 40.654 b | 49.410 ab | 11.923 a | 12.600 c |
| CuO | 80.663 c | 22.355 a | 40.820 b | 43.861 ab | 4.811 b | 11.426 c | |
| ZnO | 147.593 b | 11.145 c | 48.972 ab | 38.802 b | 11.038 a | 11.077 c | |
| LEDs | 0 | 53.981 c | 0.532 d | 73.900 ab | 50.285 ab | 6.044 ab | 16.314 ab |
| CuO | 66.544 c | 16.897 b | 149.419 a | 50.862 ab | 3.120 b | 17.568 a | |
| ZnO | 245.847 a | 1.384 d | 99.997 ab | 57.738 a | 11.752 a | 13.847 bc |
| Lighting | HPS | LED | 0 NPs | CuO NPs | ZnO NPs | HPS × 0 NPs | HPS × CuO NPs | HPS × ZnO NPs | LED × 0 NPs | LED × CuO NPs | LED × ZnO NPs |
|---|---|---|---|---|---|---|---|---|---|---|---|
| Leaf area | b | a | b | a | b | e | a | ed | cd | b | c |
| Shoots FW | b | a | b | a | b | d | c | d | a | b | ab |
| Shoots DW | b | a | a | a | b | cd | bc | d | a | ab | a |
| Roots FW | b | a | b | a | c | c | a | d | b | b | b |
| Roots DW | b | a | - | - | - | c | b | c | a | b | a |
| P | - | - | b | b | a | - | - | - | - | - | - |
| Ca | a | b | - | - | - | ab | a | ab | b | b | ab |
| K | b | a | - | - | - | ab | b | ab | a | a | ab |
| Mg | b | a | - | - | - | b | b | b | a | a | a |
| Na | b | a | - | - | - | ab | a | ab | ab | b | ab |
| Zn | b | a | b | b | a | c | c | b | c | c | a |
| Cu | a | b | b | a | b | c | a | c | d | b | d |
| Fe | b | a | - | - | - | b | b | ab | ab | a | ab |
| Mn | b | a | - | - | - | ab | ab | b | ab | ab | a |
| B | - | - | a | b | a | a | b | a | ab | b | a |
| Mo | b | a | a | a | b | c | c | c | ab | a | bc |
| Lighting | NPs | ADICu | HQCu | BCFCu | ADIZn | HQZn | BCFZn |
|---|---|---|---|---|---|---|---|
| HPS | 0 | 0.001 c | 0.032 c | 0.13 c | 0.010 c | 0.025 c | 0.10 c |
| CuO | 0.003 a | 0.068 a | 0.28 a | 0.010 c | 0.025 c | 0.10 c | |
| ZnO | 0.001 c | 0.034 c | 0.14 c | 0.018 b | 0.045 b | 0.18 b | |
| LEDs | 0 | 0.001 d | 0.002 d | 0.01 d | 0.007 c | 0.016 c | 0.07 c |
| CuO | 0.002 b | 0.051 b | 0.21 b | 0.008 c | 0.020 c | 0.08 c | |
| ZnO | 0.001 d | 0.004 d | 0.02 d | 0.030 a | 0.075 a | 0.31 a |
| ZnO, 35–45 nm, 800 ppm | CuO, 40 nm, 30 ppm | |
|---|---|---|
| PDI | 0.293 ± 0.061 | 0.267 ± 0.029 |
| ZP (mV) | 32.61 ± 1.002 | 10.48 ± 1.916 |
| Particle size in suspension up to 100 nm; % | 58.5 | 68.2 |
Disclaimer/Publisher’s Note: The statements, opinions and data contained in all publications are solely those of the individual author(s) and contributor(s) and not of MDPI and/or the editor(s). MDPI and/or the editor(s) disclaim responsibility for any injury to people or property resulting from any ideas, methods, instructions or products referred to in the content. |
© 2024 by the authors. Licensee MDPI, Basel, Switzerland. This article is an open access article distributed under the terms and conditions of the Creative Commons Attribution (CC BY) license (https://creativecommons.org/licenses/by/4.0/).
Share and Cite
Sutulienė, R.; Brazaitytė, A.; Urbutis, M.; Tučkutė, S.; Duchovskis, P. Nanoparticle Effects on Ice Plant Mineral Accumulation under Different Lighting Conditions and Assessment of Hazard Quotients for Human Health. Plants 2024, 13, 681. https://doi.org/10.3390/plants13050681
Sutulienė R, Brazaitytė A, Urbutis M, Tučkutė S, Duchovskis P. Nanoparticle Effects on Ice Plant Mineral Accumulation under Different Lighting Conditions and Assessment of Hazard Quotients for Human Health. Plants. 2024; 13(5):681. https://doi.org/10.3390/plants13050681
Chicago/Turabian StyleSutulienė, Rūta, Aušra Brazaitytė, Martynas Urbutis, Simona Tučkutė, and Pavelas Duchovskis. 2024. "Nanoparticle Effects on Ice Plant Mineral Accumulation under Different Lighting Conditions and Assessment of Hazard Quotients for Human Health" Plants 13, no. 5: 681. https://doi.org/10.3390/plants13050681
APA StyleSutulienė, R., Brazaitytė, A., Urbutis, M., Tučkutė, S., & Duchovskis, P. (2024). Nanoparticle Effects on Ice Plant Mineral Accumulation under Different Lighting Conditions and Assessment of Hazard Quotients for Human Health. Plants, 13(5), 681. https://doi.org/10.3390/plants13050681