Abstract
Plant water use efficiency (WUE) is a comprehensive physiological indicator of plant growth and ability to adapt to drought. However, research on the mechanisms controlling WUE during plant growth and development remains weak. Here, we studied Pinus koraiensis as a typical evergreen conifer species in Northeast China. After collecting 80 tree samples with varying diameters at breast height (DBH), we measured δ13C and δ18O as an indicator of WUE, leaf morphology (volume, dry weight, and total epidermal area), ecological stoichiometry (carbon, nitrogen, and phosphorus content), and abiotic factors (light environment, soil pH, soil water content, and soil nutrient content). Correlational analysis of these variables revealed distinct differences between smaller/younger and larger/older plants: (1) In plants with DBH less than 52 cm, δ13C was positively related to DBH, and δ18O was negatively related to DBH. Plants with DBH greater than 52 cm showed no relationship between δ13C and DBH, and δ18O was positively related to DBH. (2) In plants with DBH less than 52 cm, there was a negative correlation between δ13C and δ18O and between δ13C and leaf phosphorus content (LP), but a positive correlation between δ13C and DBH, leaf mass per area (LMA), and leaf density (LD). The slopes of DBH-δ13C, δ18O-δ13C, leaf nitrogen content (LN)-δ13C, and LMA-δ13C correlations were greater in smaller plants than large plants. (3) Structural equation modelling showed that in smaller plants, DBH had a direct positive effect on δ13C content and a direct negative effect on δ18O, and there was a direct positive effect of light environment on δ18O. In larger plants, there was a direct negative effect of light environment on δ13C and a direct positive effect of DBH on light environment, as well as a negative effect of soil nitrogen content on leaf nitrogen. In smaller plants, DBH was the most important factor influencing δ13C, followed by δ18O and soil moisture, with light and soil pH showing minimal influence. In larger plants, light environment influenced δ13C the most, followed by soil nitrogen content and soil moisture content, with leaf nitrogen and DBH contributing little. The results suggest that water use efficiency strategies of P. koraiensis vary according to growth stage, and the effects of abiotic factors and functional traits vary at different growth stages.
1. Introduction
Water is critical for plant life and plays an important role in plant growth, development, and distribution. A plant’s water use efficiency (WUE) score represents the ratio of carbon fixation per unit mass to water consumption through transpiration [1]. Since water is needed to form organic matter, WUE is an important physiological indicator of plant growth and ability to adapt to drought [2]. The WUE score illustrates the tradeoff between photosynthetic carbon fixation and water loss through transpiration and is a key physiological parameter linking carbon and water cycles [3].
The leaf is the primary site for energy conversion in plants, where light is intercepted and carbon is produced through photosynthesis [4,5]. Leaf traits vary according to resources such as light and water and therefore link plants to their environment [6,7]. Leaf economic spectrum is an interrelated and synergistic combination of leaf functional traits, and it also quantitatively represents a series of regular and continuously changing plant resource tradeoff strategies [8,9]. Importantly, leaf photosynthetic and transpiration traits regulate and control water use efficiency (WUE) [10,11].
Plants inevitably lose water through stomatal transpiration while photosynthetically fixing carbon [12]. The carbon isotope δ13C can be used to measure WUE in leaves [13,14]; however, leaf δ13C alone is not a good reflection of long-term environmental conditions. Since leaf δ13C is driven by the Ci/Ca ratio (intracellular versus atmospheric CO2), the presence of δ18O must be considered [15]. Prieto et al. [16] took 15 tree species in the Mediterranean as research objects to evaluate the relationship between δ13C and δ18O and leaf photosynthetic carbon sequestration and found that leaf carbon and oxygen isotopes were coupled to leaf morphology and nutrients, suggesting that δ13C and δ18O could be used as part of the leaf economic spectrum. In cases where leaf δ13C is primarily affected by transpiration and water consumption, the δ13C and δ18O content of leaves are positively correlated. By contrast, when leaf δ13C and δ18O are unrelated or negatively correlated, this indicates that leaf δ13C is primarily affected by photosynthetic carbon sequestration [1]. Thus, the combination of δ13C and δ18O can effectively describe the effects of photosynthetic carbon fixation, transpiration, and water consumption on WUE [15].
Currently, most studies on plant water use efficiency focus on environmental impact. Through meta-analysis, Mathias et al. (2021) found that the intrinsic WUE of trees is enhanced by a global increase in atmospheric CO2 levels, and concluded that WUE is regulated by climate as well as plant type [17]. Wang et al. (2021) used structural equation models to study the effects of soil properties, biodiversity, and leaf traits on δ13C and δ18O [18,19,20]. Some researchers have explored the relationship between plant WUE and the internal organizational structure of plant leaves at the anatomical level. For example, Trueba et al. (2021) found that leaf structure was the determining factor of WUE in conifers [21]. It is also widely reported that plant size is one of the main factors affecting intraspecific plant trait variation [22,23]. Changes in the ability of plants to absorb nutrients and adapt to environmental conditions during ontogenetic development may lead to changes in the structure and function of trees [24], thus affecting the WUE of plants. However, there are insufficient studies on the relationship between WUE and plant size and the underlying causes.
Pinus koraiensis is a constructive species in the broad-leaved and Korean pine forests of the mountainous area in Northeast China, with high economic and ecological value [25,26]. However, due to human interference, such as excessive cutting and beating for pine nuts, the number of existing plants has declined sharply. Therefore, it is of great significance to study the mechanisms controlling WUE in P. koraiensis during its growth in order to maintain the stability of the forest ecosystem. In this study, 80 P. koraiensis trees of different sizes were randomly selected from a typical P. koraiensis forest in the Lesser Khingan Mountains, and the quantity of δ13C and δ18O in the needles of P. koraiensis was determined. To evaluate factors influencing WUE among different plant sizes, we measured leaf morphological traits such as leaf volume, dry weight, and total epidermis area, as well as ecological stoichiometric characteristics such as carbon, nitrogen, and phosphorus content, and abiotic factors including light environment, soil pH, soil moisture, and soil nutrient content. The results provide a scientific understanding of water use regulation during the growth of P. koraiensis.
2. Results
2.1. Trends in Leaf δ13C and δ18O as a Function of Plant Size
Overall, δ13C content fluctuated in the range of −32.192‰ to −27.533‰, with a mean value of −29.223‰ (Figure 1A). Values for δ18O fluctuated between 18.403‰ and 23.470‰, with a mean value of 20.283‰ (Figure 1B). At a DBH of 52 cm, δ13C and δ18O show an inflection point (Figure 1). When the DBH was less than 52 cm, there was a positive relationship between δ13C and DBH, whereas a negative relationship was observed for δ18O. When the DBH was greater than 52 cm, δ13C did not change with DBH, whereas δ18O was positively related to DBH (Figure 1B).
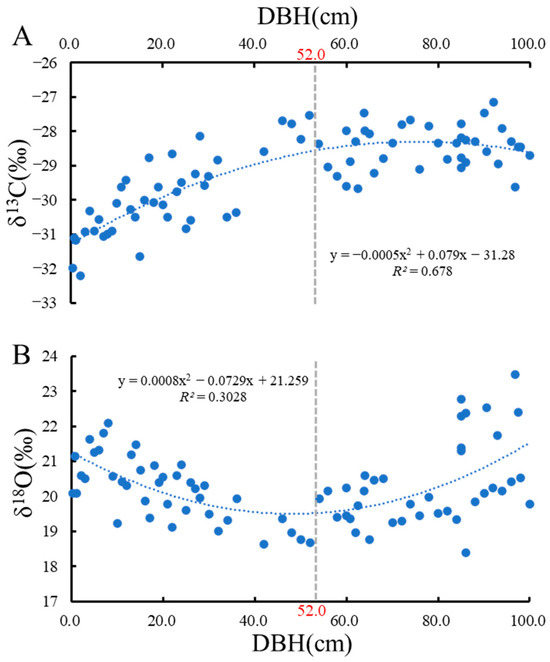
Figure 1.
Trend of carbon and oxygen isotopes with DBH. (A), Trend of δ13C with DBH; (B), Trend of δ18O with DBH.
2.2. Relationship between δ13C in P. koraiensis Leaves and Related Leaf Functional Traits and Abiotic Factors
Based on the relationships identified between δ13C and δ18O and DBH, the data set was divided into two groups (DBH above or below 52 cm) and correlations between carbon and oxygen isotopes and plant traits were determined. For samples with DBH less than or equal to 52 cm (Table 1), δ13C and δ18O were negatively correlated with one another (p < 0.01). Correlational analysis between δ13C and various plant traits revealed a negative relationship between δ13C and leaf phosphorus content (LP) (p < 0.05) but a positive relationship between δ13C and DBH, (p < 0.01), leaf mass per area (LMA) (p < 0.01), and leaf density (LD) (p < 0.05). For δ18O, there was a negative correlation with DBH and LMA (p < 0.01) and a positive correlation with LP (p < 0.01). There was no relationship between δ13C or δ18O and any of the abiotic factors analyzed (Table 2).

Table 1.
Correlation analysis between carbon or oxygen isotopes and plant traits (DBH 0–52 cm) LN, leaf nitrogen content; LP, leaf phosphorus content; LC, leaf carbon content; LD, leaf density; LMA, leaf mass per area. * p < 0.05, ** p < 0.01, *** p < 0.001.
Table 2.
Correlation analysis between carbon or oxygen isotopes and abiotic factors (DBH 0–52 cm). Soil pH, soil pH; Water, soil water content; Soil C, soil carbon content; Soil P, soil phosphorus content; Soil N, soil nitrogen content; Light, light environment. * p < 0.05, *** p < 0.001.
For samples with DBH above 52 cm, δ13C and δ18O were not correlated with one another (Table 3). While δ13C was not correlated to any leaf traits, δ18O was negatively correlated with DBH (p < 0.01) and positively correlated with LC and LP (p < 0.05). In terms of abiotic factors (Table 4), δ18O was positively correlated with soil pH (p < 0.01), and negatively correlated with soil moisture content and soil carbon content (p < 0.01).
Table 3.
Correlation analysis between carbon or oxygen isotopes and plant traits (DBH 52–100 cm). LN, leaf nitrogen content; LP, leaf phosphorus content; LC, leaf carbon content; LD, leaf density; LMA, leaf mass per area. * p < 0.05, ** p < 0.01, *** p < 0.001.
Table 4.
Correlation analysis between carbon or oxygen isotopes and abiotic factors (DBH 52–100 cm). Soil pH, soil pH; Water, soil water content; Soil C, soil carbon content; Soil P, soil phosphorus content; Soil N, soil nitrogen content; Light, light environment. * p < 0.05, ** p < 0.01, *** p < 0.001.
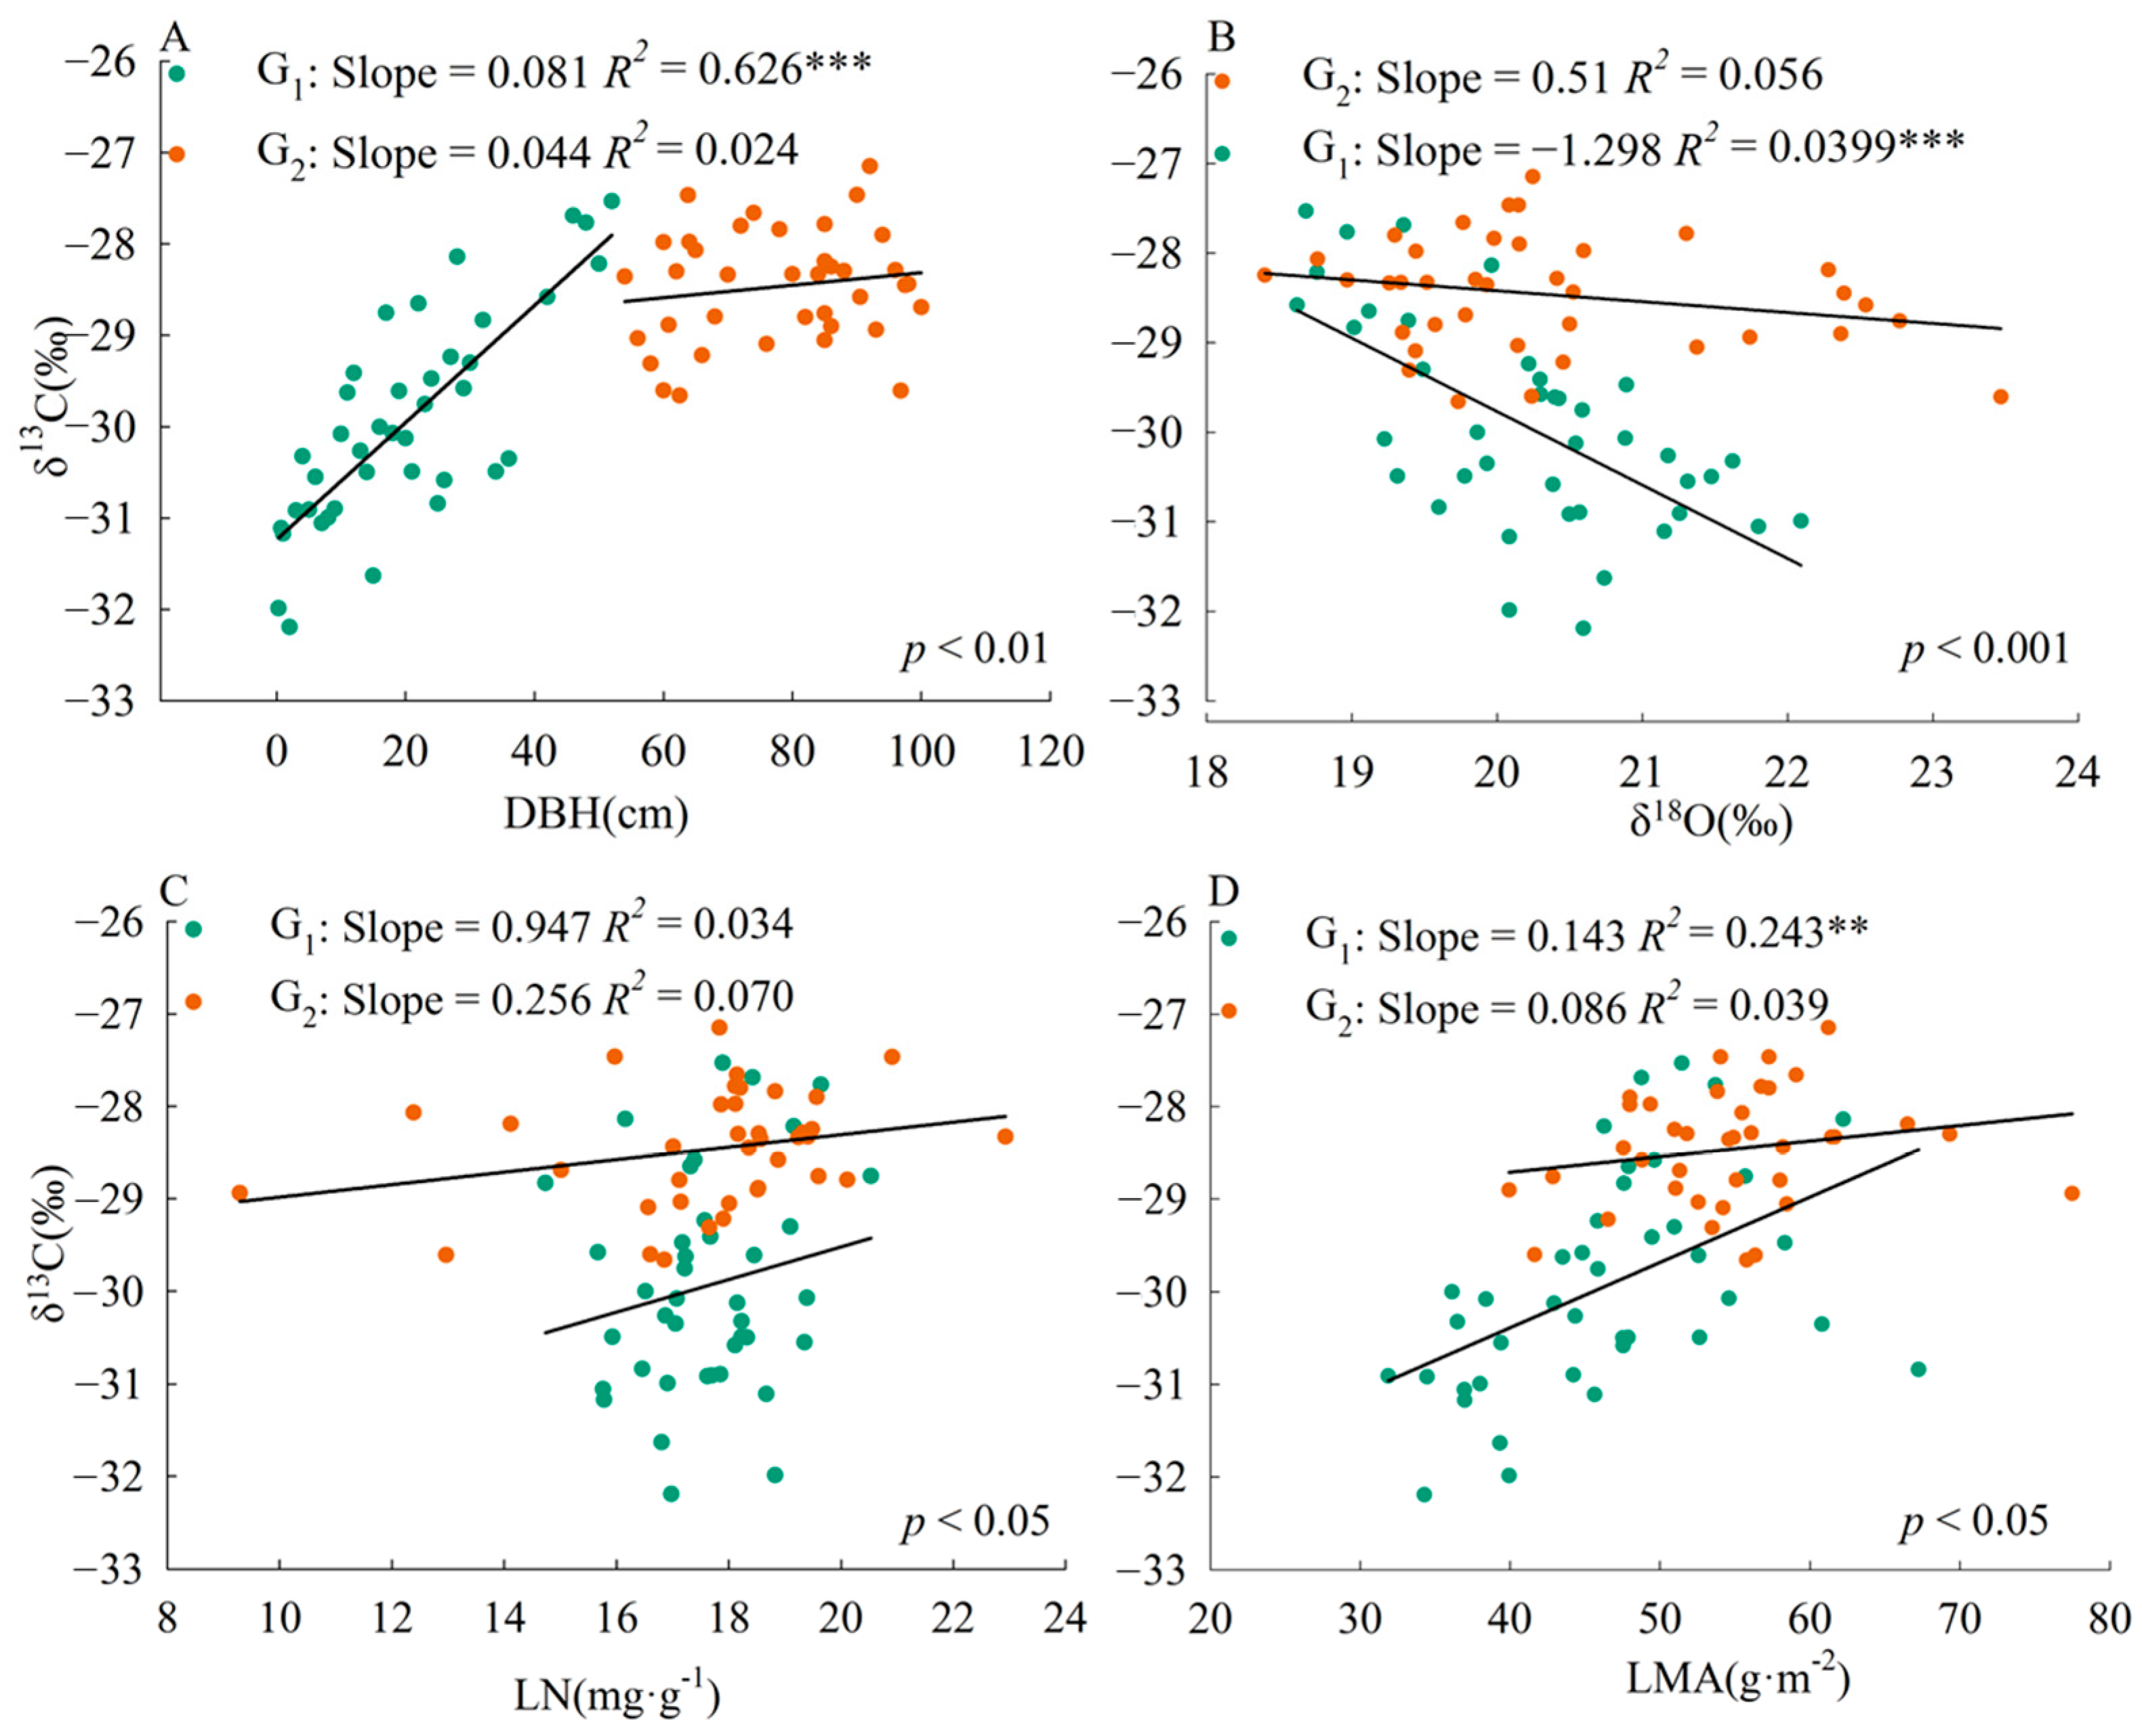
The slope of the correlation between plant traits and leaf δ13C was significantly different (p < 0.01) between the two size groups (Figure 2). The correlation slopes of DBH-δ13C, δ18O-δ13C, LN-δ13C, and LMA-δ13C were higher in plants with DBH less than or equal to 52 cm than in plants with DBH greater than 52 cm.
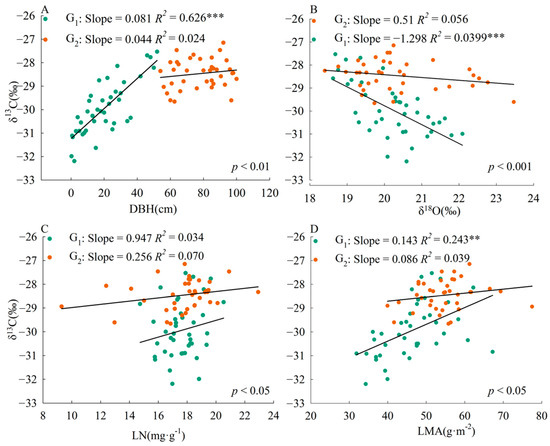
Figure 2.
Relationship between leaf δ13C and various plant traits in Pinus koraiensis. G1, DBH is from 0 to 52 cm; G2, DBH is from 52 to 100 cm. LN, leaf nitrogen content; LMA, leaf mass per area. The p-value indicates the significance of the difference between slopes; p < 0.05, significant difference, no common slope; p > 0.05, no difference, common slope. **, p < 0.01, ***, p < 0.001. (A), DBH-δ13C; (B), δ18O-δ13C; (C), LN-δ13C; (D), LMA-δ13C.
2.3. Influencing Factors of δ13C in P. koraiensis Leaves
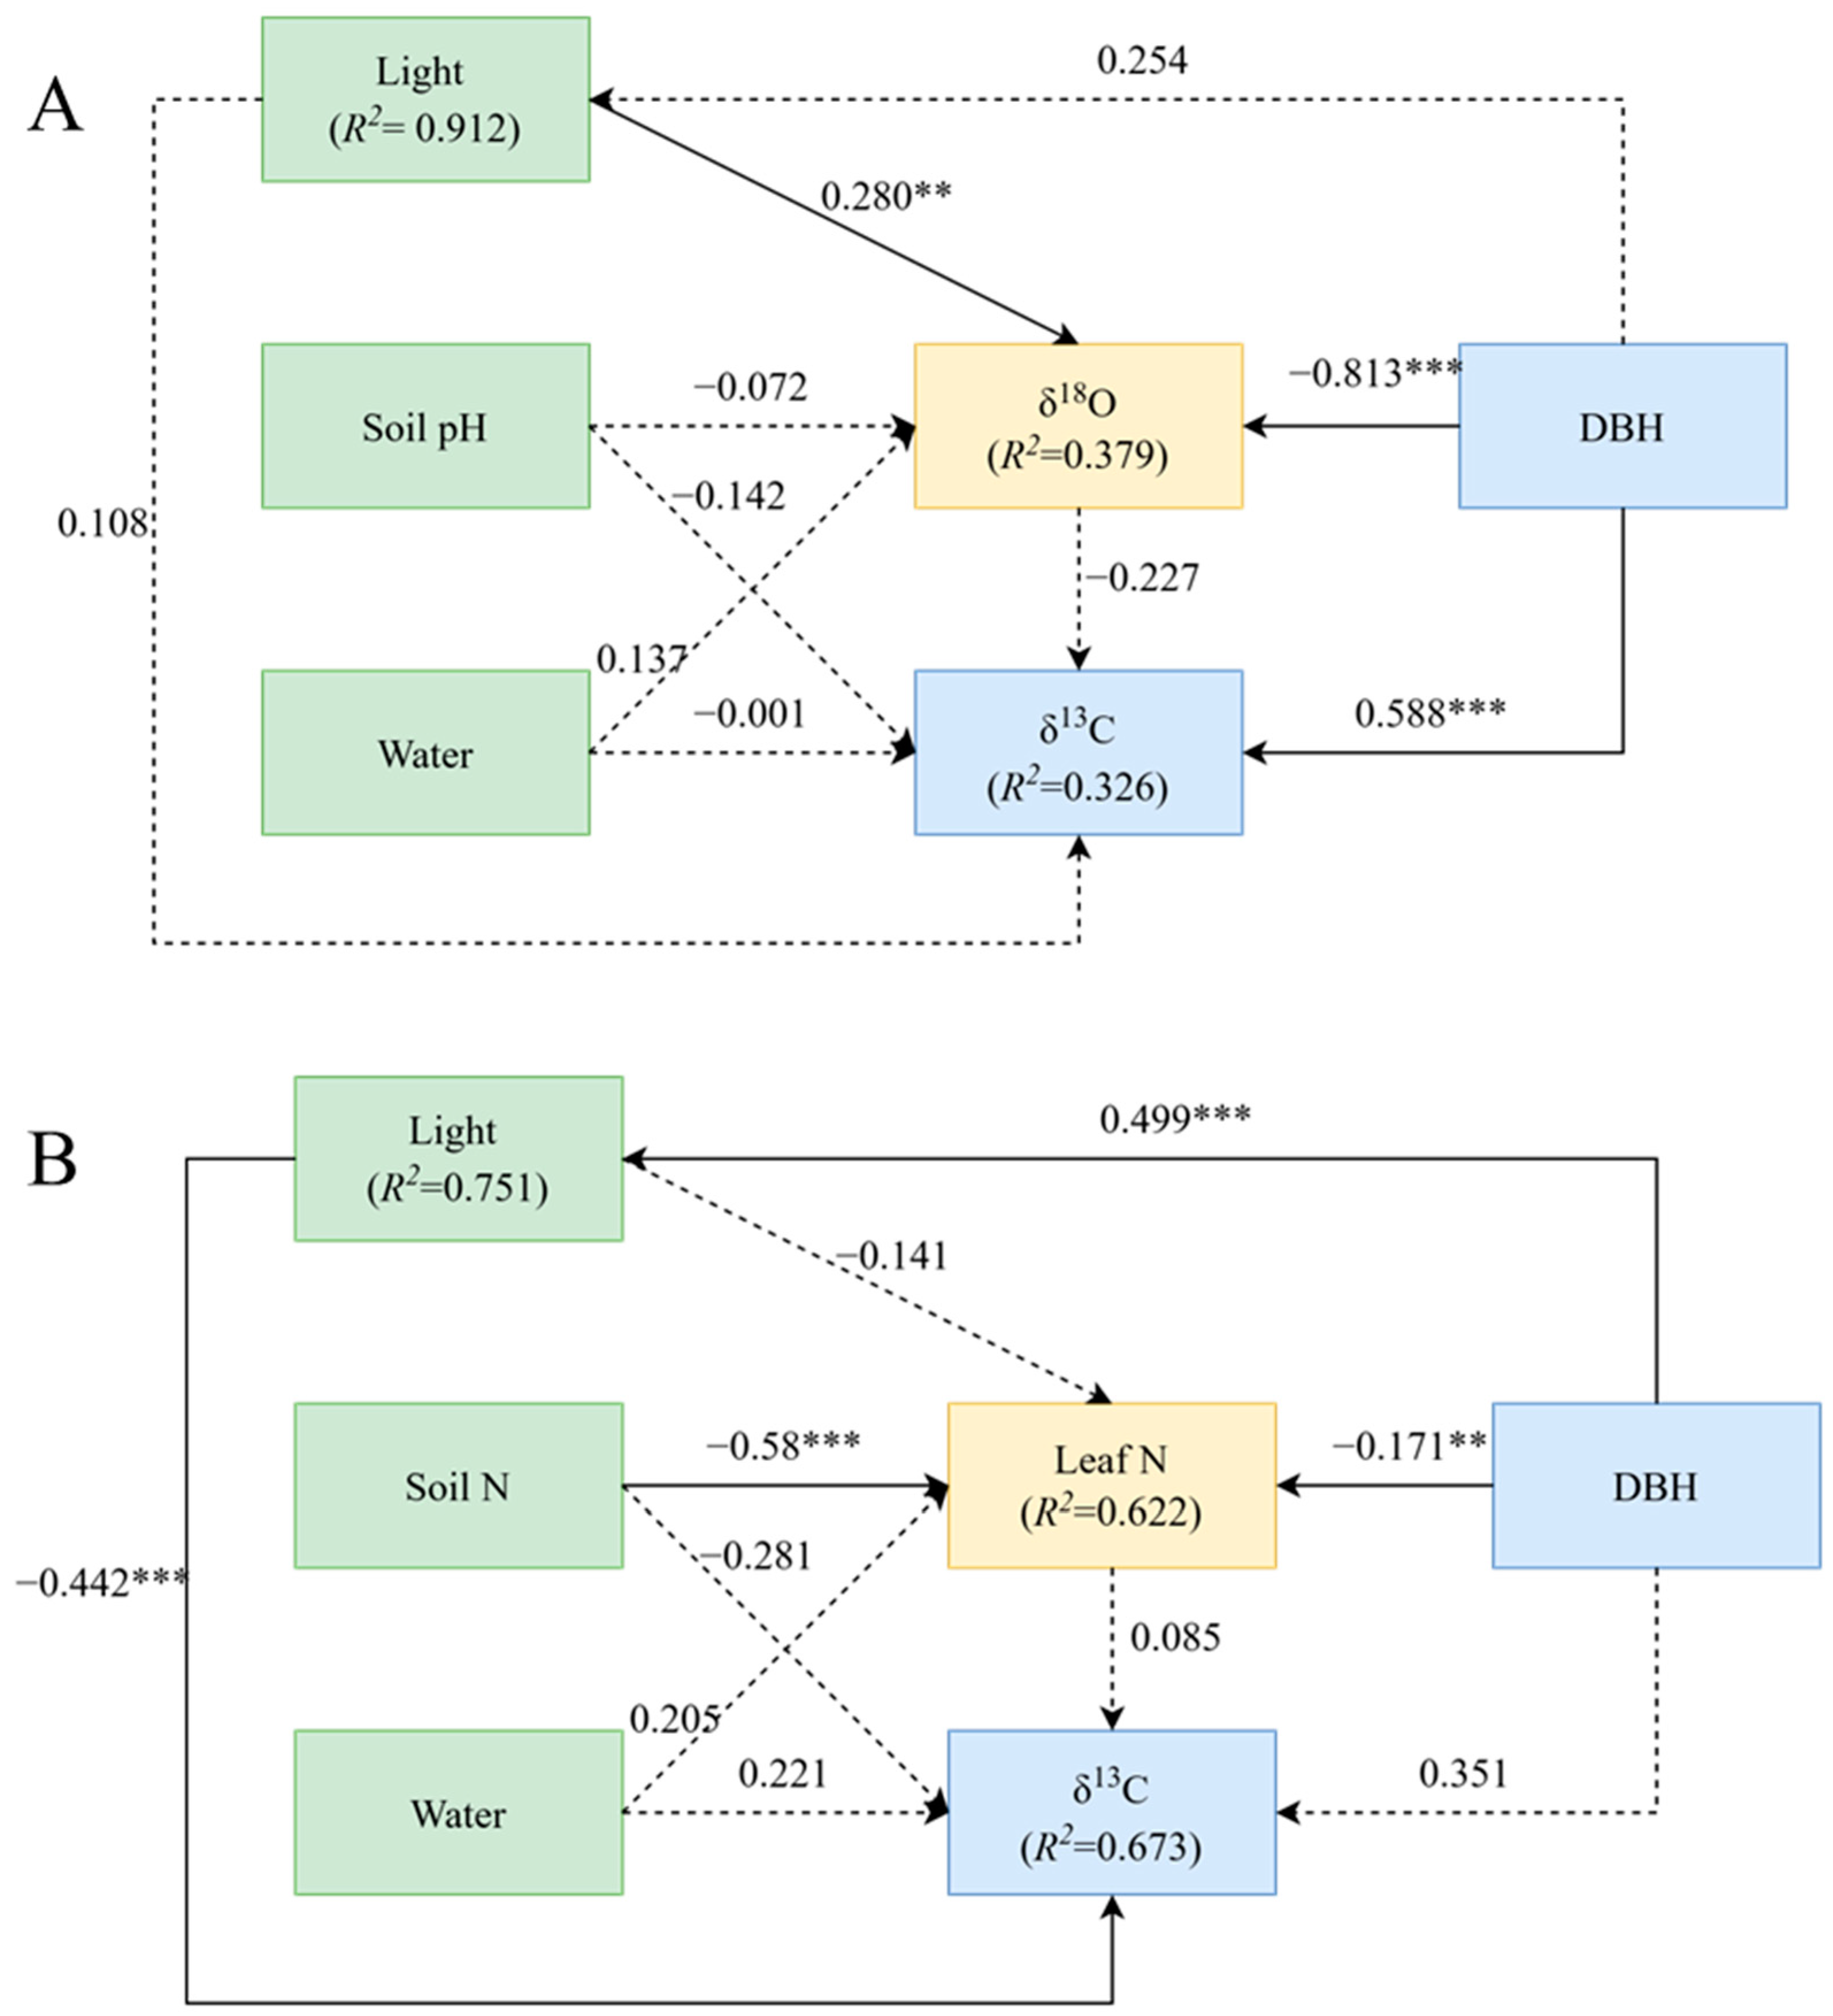
The results of structural equation modelling showed that the best factor predicting δ13C was different between the two groups. For trees with DBH below 52 cm, the best predictors of leaf δ13C were δ18O and soil pH, while the best predictors of leaf δ13C for trees with DBH above 52 cm were leaf nitrogen content and soil nitrogen content (Figure 3).
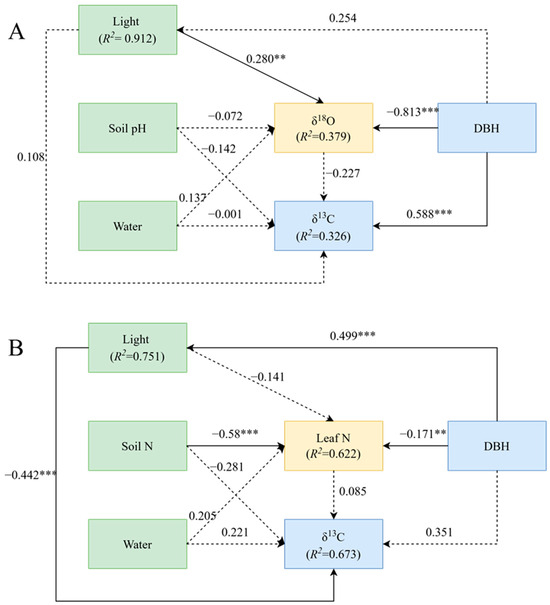
Figure 3.
Structural equation model (SEM) between leaf carbon isotopes and their influencing factors. (A), The DBH is from 0 to 52 cm with δ13C. (B), The DBH is from 52 to 100 cm with δ13C. ** p < 0.01; *** p < 0.001.
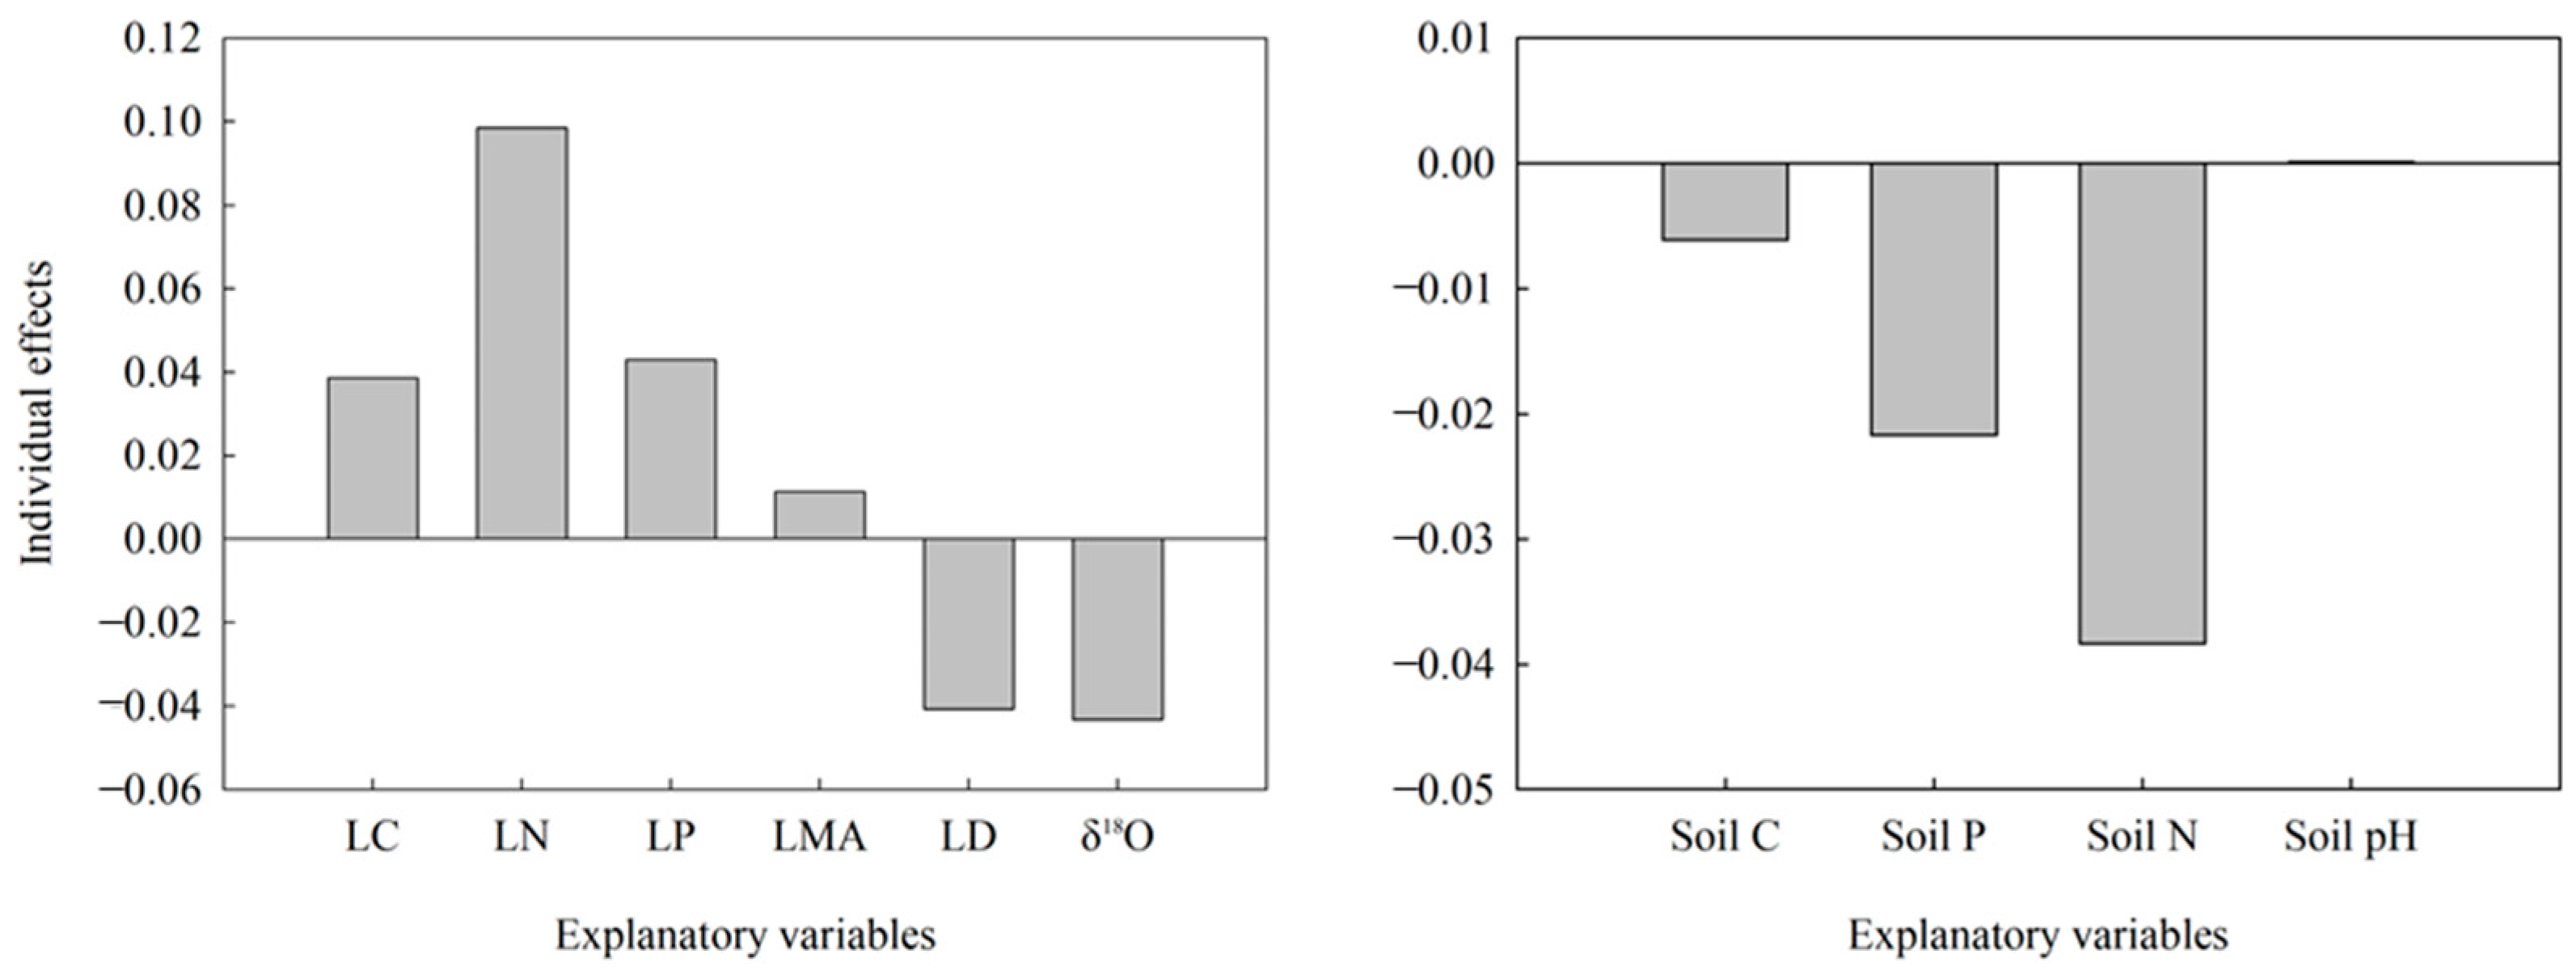
A generalized linear mixed-effects model was used to determine the relative importance of each variable on δ13C variation in P. koraiensis leaves. For trees with DBH below 52 cm (Figure 3A), there was a direct positive effect of DBH on δ13C and a direct negative effect of DBH on δ18O (p < 0.01). In this group, DBH contributed the most to δ13C, followed by δ18O and soil moisture, while light and soil pH had little influence on δ13C (Figure 4A). For plants with DBH above 52 cm (Figure 3B), there was a highly negative effect of light environment on δ13C (p < 0.01), a direct positive effect of DBH on light environment (p < 0.01), and a significantly negative effect of soil nitrogen content on leaf nitrogen (p < 0.01). In this group, light environment contributed the most to δ13C, followed by soil N content and soil water content, while leaf N and DBH contributed minimally to δ13C (Figure 4B).
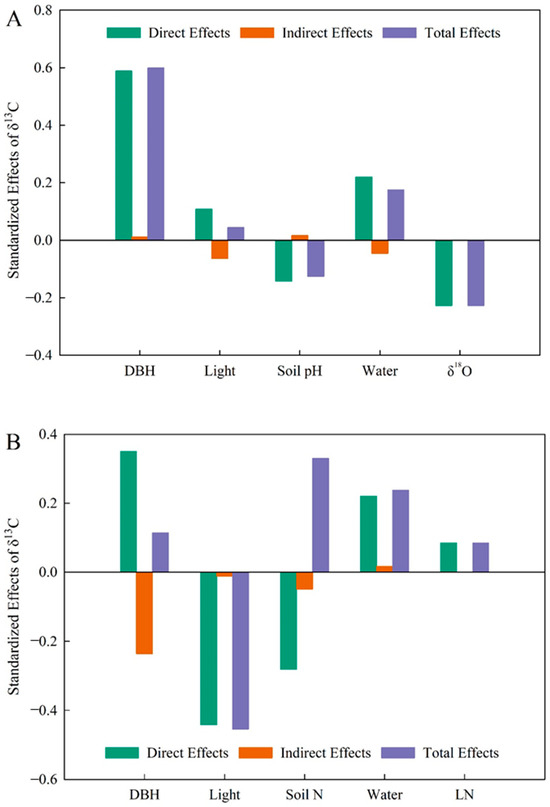
Figure 4.
The effect values of various influencing factors on leaf δ13C. (A), The DBH is from 0 to 52 cm with δ13C in Pinus koraiensis. (B), The DBH is from 52 to 100 cm with δ13C in Pinus koraiensis. Light, light environment; Water, soil water content.
3. Discussion
3.1. Variation in the Water Use Efficiency of P. koraiensis According to Plant Size
For P. koraiensis plants with a DBH under 52 cm, leaf δ13C content was higher with increasing DBH, indicating greater water use efficiency (WUE). Plants with a DBH greater than 52 cm, which are considered mature [27,28,29], showed no obvious changes in WUE with increasing DBH. This suggests that WUE increases during the growth and development of P. koraiensis then stabilizes upon maturation. This may be explained by height-dependent changes in WUE that arise during plant growth, which also influence leaf functional traits [30,31]. According to the hydraulic limitation hypothesis of tree growth, the height of a plant changes minimally once mature. The δ13C content of P. koraiensis needles in our study (−32.19‰ to −27.53‰) fell within the global dataset (−37.83‰ to −19.85‰) [20]. However, the δ13C of P. needles (−29.86 ± 2.32‰) was poorer than that of the global dataset (−28.68 ± 2.68‰) [20] on the whole, which might suggest that P. koraiensis favors a water-consuming strategy. Since leaf δ13C was gradually enriched during the entire growth process of P. koraiensis, theoretically, the water utilization strategy of P. koraiensis should change from a water consumption strategy to water-saving strategy with increasing DBH.
In plants with DBH under 52 cm, leaf δ18O was gradually reduced with increasing DBH, while the opposite was true for plants with above 52 cm DBH. Since leaf δ18O can provide integrated information on the long-term stomatal behavior of leaves [1,32], these trends suggest that the transpiration effect of P. koraiensis varies with growth, i.e., transpiration water consumption decreases during the growth period and increases during the maturity period.
3.2. Strategies for Water Use Efficiency at Different Stages of P. koraiensis Growth
Others have shown that a positive correlation between leaf δ13C and δ18O indicates that leaf δ13C content is primarily affected by transpiration and water consumption [1]. By contrast, when leaf δ13C and δ18O are not correlated or are negatively correlated, this suggested that leaf δ13C is primarily affected by photosynthetic carbon sequestration [1]. Our experimental results showed a negative correlation between δ13C and δ18O in the lower DBH group and no correlation in the higher DBH group, suggesting that the WUE of P. koraiensis is primarily affected by photosynthetic carbon sequestration across all growth and development stages.
Plants achieve functional diversity through the combinatorial relationships of multiple trait assemblages [12]. Since both photosynthetic carbon fixation and transpiration water consumption are affected by leaf traits, the relationship between leaf photosynthetic carbon fixation and transpiration water consumption traits assemblages can influence long-term WUE [10,11]. Leaf δ13C and leaf mass per area (LMA) were positively correlated in younger plants with low DBH, suggesting that LMA plays a positive role in regulating plant WUE. Others have found that LMA is the main influencing factor of δ13C variation and that leaf structure (thickness, tissue density, and LMA) affects the ability of mesophyll conductance to control photosynthetic CO2 supply [33,34]. At the same time, LMA affects the distribution of N and P in leaves and has a regulatory effect on the photosynthetic capacity of plants [7,35].
The relationship between leaf δ13C and phosphorus may be positively correlated [36], negatively correlated [37], or unrelated [38]. The present study showed that P content in leaves is negatively correlated with δ13C at the low DBH stage but not at the high DBH stage, which indicates that the uptake of soil P by plant roots in the growth and development stage may be related to transpiration, while the long-term WUE of plants at the mature stage may be regulated by water consumption for transpiration rather than photosynthetic carbon sequestration. This seems to contradict the previous statement; however, we showed that leaf phosphorus content (LP) has a negative relationship to DBH in the growth and development stage (DBH < 52 cm) and has no correlation with DBH in the maturity stage (DBH > 52 cm). In general, shorter trees tend to allocate more P to the leaves to improve carbon capture efficiency, while taller trees may need to allocate more P to the roots [39]. Therefore, during the growth and development of P. koraiensis, the distribution of phosphorus may gradually shift from the leaves to the roots, and when the trees mature, the P content in the leaves may stabilize, just like for δ13C. The correlation between LP and δ13C was not significant, which therefore cannot indicate that long-term WUE is regulated by transpiration water consumption in the mature stage of P. koraiensis.
3.3. Factors Influencing δ13C in P. koraiensis Leaves
Our results showed that the WUE of P. koraiensis is regulated by multiple factors and varies according to tree size. For trees with DBH less than 52 cm, DBH had a direct positive effect on leaf δ13C but had no direct effect on trees with DBH greater than 52 cm. For trees with DBH under 52 cm, light had no direct effect on δ13C but had a negative effect on trees with DBH above 52 cm. In addition, with tree growth, the most influential leaf traits predicting leaf δ13C shifted from δ18O to leaf N, and the most influential soil chemical properties shifted from soil pH to soil N, indicating that the regulatory mechanisms controlling WUE varies with the size of P. koraiensis.
In the smaller DBH group of P. koraiensis, DBH contributed the most to δ13C leaf content, followed by δ18O and soil moisture. This indicates that plant size is an important driving force for changes in WUE during the growth and development of P. koraiensis. As the plant grows, they adopt water-saving strategies such as reducing transpiration water consumption to maintain a high WUE. Unsurprisingly, light had a significant effect on δ18O, because light is directly related to transpiration and water consumption characteristics such as leaf transpiration rate and stomatal conductance [40,41].
In older plants with DBH greater than 52 cm, DBH had a direct positive effect on light environment, while light environment had a direct negative effect on δ13C. Light environment usually only contributes positively to the growth of young trees [42,43,44]. When photosynthetically active radiation reaches a certain intensity, the light saturation point of P. koraiensis is reached. At this point, photosynthesis cannot increase with the increase in light environment [45,46], and WUE decreases with increases in photosynthetically active radiation. Due to the strong light received by the upper leaves of large trees, the frequency of stomatal closure increases with strong transpiration, and water stress increases [47]. There exists, therefore, a negative relationship between WUE and light environment. We also showed that soil N content had a negative effect on leaf N, which may be because at the mature stage, soil N content was no longer a limiting factor for plant growth [48] and plant N use efficiency decreased. At the same time, due to the opposite stoichiometric characteristics of large trees above the forest and plants below the forest, soil nutrients are preferentially absorbed by plants under the forest [49]; so, this result may be caused by the fact that most of the N decomposed by coniferous litter in the soil is absorbed by herbs and shrubs.
Our data revealed that DBH-δ13C, δ18O-δ13C, LN-δ13C, and LMA-δ13C correlations showed allometric growth relationships, which confirms that plant size may affect some models of leaf trait–trait relationships [50]. Compared with the mature stage of plant growth and development, the relationship between WUE and photosynthetic traits (LN and LMA) and transpiration traits (δ18O) was more coupled in growth plants.
4. Materials and Methods
4.1. Site Profile
The field investigation was conducted in the Liangshui National Nature Reserve of Heilongjiang Province (47°10′50″ N, 128°53′20″ E), which is located on the southern slope of the Lesser Khingan Mountains. The climax vegetation is the broad-leaved P. koraiensis, and the total forest stock is (1.88 × 10⁶) m3 with an altitude of 280–707 m. The average slope is between 10 and 15°, representing a low-mountain and hilly landform. The climate type is continental monsoon, with little precipitation and high wind in spring. Summer is short and humid with high temperatures; in autumn, the temperature drops sharply, and early frost often occurs. Winter is long and dry, cold, and snowy. The average annual temperature is −0.3 °C, the average annual precipitation is 676 mm, and the average annual evaporation is 805 mm. The average annual precipitation days are 120–150 d, the annual snow accumulation period is 130–150 d, and the average annual relative humidity is 78%. The main wind direction throughout the year is southwest, with a more southwest wind in spring and summer, and a more northwest wind in autumn and winter.
4.2. Sample Collection
Eighty well-grown P. koraiensis trees with a diameter of breast height (DBH) of 0.3–100 cm were randomly selected as experimental samples within the broad-leaved and Korean pine climax forest. It was ensured that trees were under similar slope conditions, were in the same slope direction, and were far apart (>10 m). For each sample tree, 3–5 shoots of the same year were randomly selected in the south direction of the upper crown. Soil samples were collected at three points in an equilateral triangle near the sample tree (<1 m) with a sampling shovel. The collection depth was 0–10 cm [51,52]. The soil samples were put into a sealed bag, mixed evenly, and stored in a refrigerated incubator.
4.3. Determination of Leaf Traits
In the laboratory, current-year leaves were collected, and the morphological traits including fresh leaf weight, dry leaf weight, leaf volume and needle length were measured. The number of needles (n) in the current year was counted, and the fresh weight of leaves was measured by a 10,000-bit electronic balance (accurate to 0.0001 g). The volume of sample leaves (V, cm3) was determined by the drainage method. Needle length (l, cm) was determined using a straightedge with an accuracy of 0.1 cm. Since the cross section of the leaves of P. koraiensis is an equilateral triangle and the needles can be seen as triangular prisms, the calculation formula (A, cm2) for the total epidermis area of P. koraiensis leaves [27] is as follows:
The samples were dried in the oven at 65 °C to constant weight, and the dry weight of the leaves was determined (accurate to 0.0001 g). Leaf density (LD) was obtained by the ratio of dry leaf weight to leaf volume, and leaf mass per area (LMA) was obtained by the ratio of leaf dry weight to the total area of leaf epidermis.
The sample leaves were selected and dried in the oven. Leaves were then ground into a fine powder with a grinder, and the ecological stoichiometric characteristics were determined. Leaf carbon content (LC) was determined using a carbon and nitrogen analyzer (multi N/C 3000, Analytik Jena AG, Jena, Germany), and leaf nitrogen content (LN) and leaf phosphorus content (LP) were determined using an automatic discontinuous chemical analyzer (AQ400, SEAL Analytical, Mequon, WI, USA).
A portion of the crushed samples was filtered through mesh (200 mesh) and assayed using the Ecosystem C/N/H/O stable isotope mass spectrometry system (Thermo Fisher Scientific, Bremen, Germany). Leaf δ13C (‰) was determined by rapid combustion with the Mat253 + EA-isolink instrument, and δ18O (‰) was determined by the high-temperature pyrolysis method with 253 Plus + Flash 2000 HT.
4.4. Determination of Abiotic Factors
Under cloudy conditions, hemisphere photography (Nikon Coolpix 4500 digital camera with a 180° fisheye lens, Nikon, Tokyo, Japan) was used to capture hemisphere images [53]. A Gap Light Analyzer (GLA ver. 2.0) [54] was used to calculate the total transmitted incident radiation (including direct and scattered, mol m−2 d−1) within the zenith angle range of 0–60° for each hemisphere image, and this value was used to characterize the light environment (it is defined as “Light” in all figures and tables).
After soil samples were collected, the fresh weight and dry weight were determined, and the soil water content (SWC) was measured. After drying, the soil was ground into powder with a grinder and filtered through a 100-mesh sieve. Then, 25 g of soil was used to measure the pH using the potentiometric method with a pH meter (pH211, HANNA, Villafranca Padovana, Italy). Soil organic carbon (Soil C) was determined by a carbon and oxygen analyzer (Analytic Jena AG, Jena, Germany), and total nitrogen (N) and total phosphorus (P) were determined by a discontinuous analyzer (AQ400, SEAL Analytical, Mequon, WI, USA).
4.5. Data Analysis
Pearson correlation analysis was used to analyze the relationship between δ13C, δ18O, leaf functional traits, and abiotic factors. Standardized major axis (SMA) analysis was used to determine the correlation between δ13C and leaf traits of each DBH group. If the slope was significantly different from 1, an allometric relationship was indicated. The dataset was divided into two groups based on the DBH of the sample tree, and structural equation modeling (SEM) was constructed for each group [28]. Due to the large number of soil physicochemical factors and leaf functional properties, a generalized linear mixed-effects model (GLME) was used to determine the relative importance of each variable on the δ13C variation in P. koraiensis leaves (Figure A1, Figure A2). Soil physicochemical factors and leaf functional traits with highest relative importance were selected as the variables for optimal SEM model construction, and the direct, indirect, and total effect values of each influencing factor on leaf δ13C were calculated.
All data were statistically analyzed by Excel, R 4.1.2, and Origin 2021 and plotted by Sigmaplot 12.0 software. The trend chart was obtained in Excel, the correlation analysis was performed with Origin 2021, and R 4.1.2 was used to generate the standardized major axis analysis (using the “smatr” package), generalized linear mixed-effects model (using the “glmm.hp” package), and the structural equation model (using the “lavaan” package).
5. Conclusions
With the growth and development of P. koraiensis, plant water use efficiency (WUE) as indicated by δ13C increased gradually then leveled off at maturity. The WUE of P. koraiensis was primarily affected by photosynthetic carbon sequestration during the entire growth period, and the water use strategy of P. koraiensis appeared to be water-saving. The WUE of P. koraiensis was regulated by a variety of factors, and the main influencing factors depended on tree size. In the early stages of plant growth (DBH from 0 to 52 cm), DBH contributed the most to δ13C, followed by δ18O and soil moisture, while light and soil pH showed minimal effect. At plant maturity (DBH from 52 to 100 cm), light environment contributed the most to δ13C, followed by soil nitrogen content and soil water content, and leaf nitrogen and DBH contributed little. The present study on the factors influencing WUE during the growth of P. koraiensis is helpful in understanding the hydraulic regulation mechanism of plants and the life history strategy of P. koraiensis.
Author Contributions
Z.L. planned and designed the research. T.F. performed experiments, analyzed the data, and wrote the manuscript with substantial contributions from Z.L. and G.J. Z.L. provided helpful comments in the draft. All authors have read and agreed to the published version of the manuscript.
Funding
This research was funded by the National Key R&D Program of China, grant number 2022YFD2201100; the National Natural Science Foundation of China, grant number 32071533; and the Fundamental Research Funds for the Central Universities, grant number 2572022DS13.
Data Availability Statement
The raw data supporting the conclusions of this article will be made available by the authors, without undue reservation.
Acknowledgments
We thank Taiping Gao and Haitao Zhong for their assistance with sample determination. Lab mates’ assistance in the content collection and manuscript preparation is gratefully acknowledged by the authors. We also thank the responsible editor and two reviewers for their constructive and helpful comments that helped to improve the manuscript.
Conflicts of Interest
The authors declare that this research was conducted in the absence of any commercial or financial relationships that could be construed as a potential conflict of interest.
Appendix A
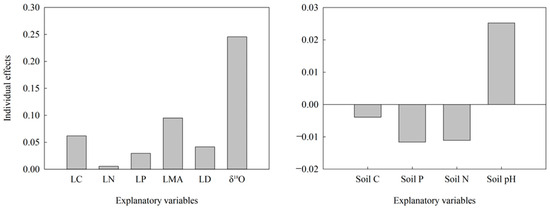
Figure A1.
Relative importance of explanatory variables in the small DBH group to δ13C variation in leaves. LC, leaf carbon content; LN, leaf nitrogen content; LP, leaf phosphorus content; LMA, leaf mass per area; LD, leaf density; Soil C, soil carbon content; Soil P, soil phosphorus content; Soil N, soil nitrogen content.
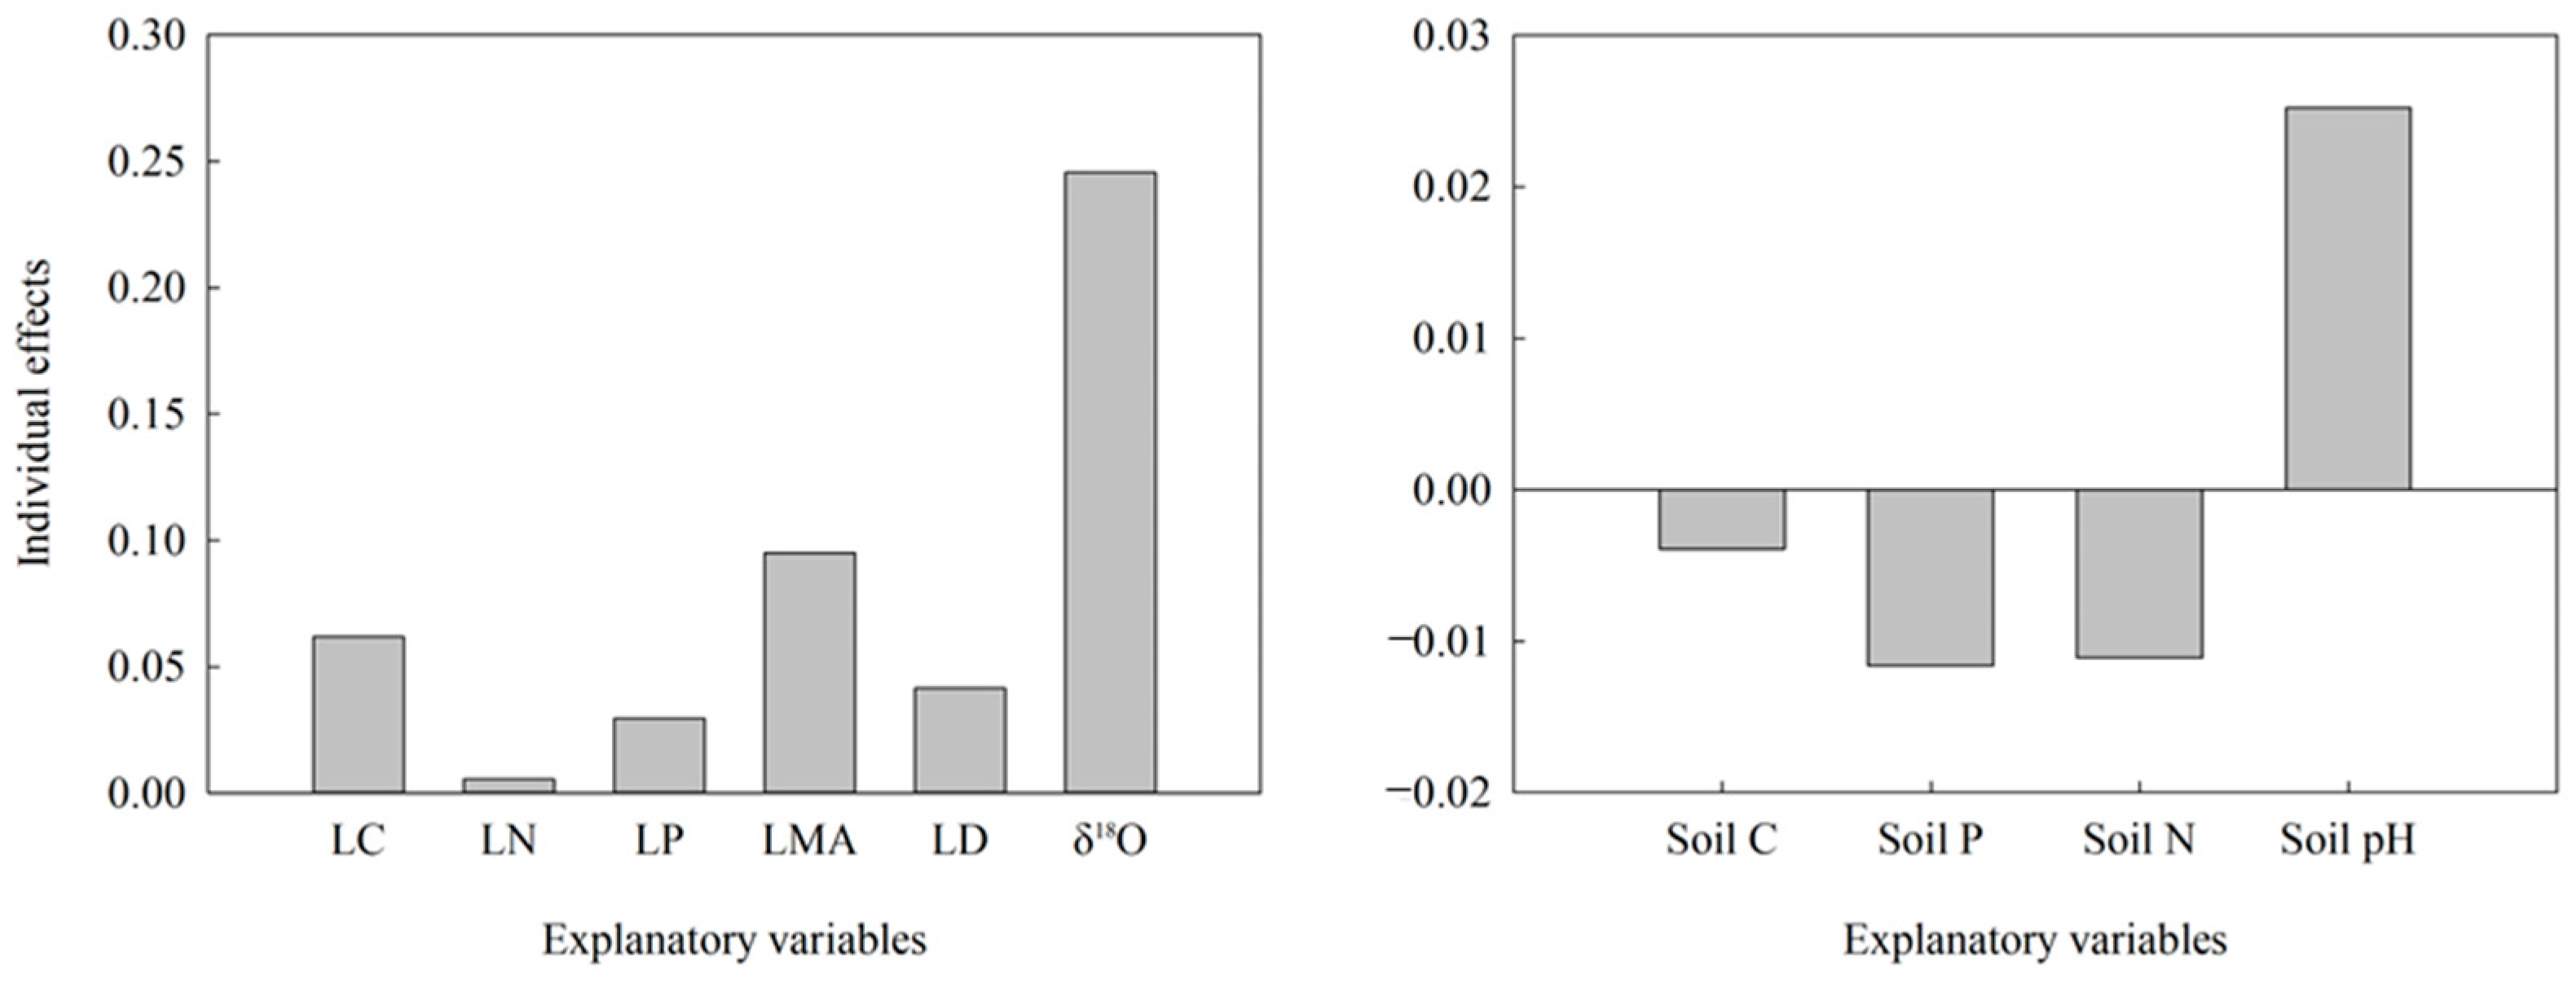
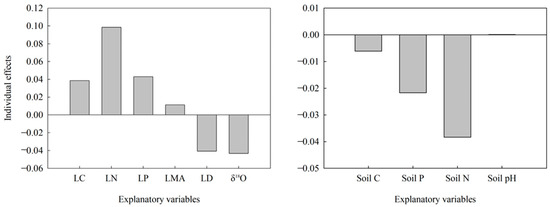
Figure A2.
Relative importance of explanatory variables in the big DBH group to δ13C variation in leaves. LC, leaf carbon content; LN, leaf nitrogen content; LP, leaf phosphorus content; LMA, leaf mass per area; LD, leaf density; Soil C, soil carbon content; Soil P, soil phosphorus content; Soil N, soil nitrogen content.
References
- Flanagan, L.B.; Farquhar, G.D. Variation in the carbon and oxygen isotope composition of plant biomass and its relationship to water-use efficiency at the leaf- and ecosystem-scales in a northern Great Plains grassland. Plant Cell Environ. 2014, 37, 425–438. [Google Scholar] [CrossRef] [PubMed]
- Bohn, B.A.; Kershner, J.L. Establishing aquatic restoration priorities using a watershed approach. J. Environ. Manag. 2002, 64, 355–363. [Google Scholar] [CrossRef] [PubMed]
- Guerrieri, R.; Lepine, L.; Asbjornsen, H.; Xiao, J.F.; Ollinger, S.V. Evapotranspiration and water use efficiency in relation to climate and canopy nitrogen in US forests. J. Geophys. Res. Biogeosciences 2016, 121, 2610–2629. [Google Scholar] [CrossRef]
- Blonder, B.; Violle, C.; Bentley, L.P.; Enquist, B.J. Venation networks and the origin of the leaf economics spectrum. Ecol. Lett. 2011, 14, 91–100. [Google Scholar] [CrossRef] [PubMed]
- Baird, A.S.; Taylor, S.H.; Pasquet-Kok, J.; Vuong, C.; Zhang, Y.; Watcharamongkol, T.; Scoffoni, C.; Edwards, E.J.; Christin, P.A.; Osborne, C.P.; et al. Developmental and biophysical determinants of grass leaf size worldwide. Nature 2021, 592, 242–247. [Google Scholar] [CrossRef] [PubMed]
- Gspaltl, M.; Bauerle, W.; Binkley, D.; Sterba, H. Leaf area and light use efficiency patterns of Norway spruce under different thinning regimes and age classes. For. Ecol. Manag. 2013, 288, 49–59. [Google Scholar] [CrossRef] [PubMed]
- Osnas, J.L.D.; Katabuchi, M.; Kitajima, K.; Wright, S.J.; Reich, P.B.; Van Bael, S.A.; Kraft, N.J.B.; Samaniego, M.J.; Pacala, S.W.; Lichstein, J.W. Divergent drivers of leaf trait variation within species, among species, and among functional groups. Proc. Natl. Acad. Sci. USA 2018, 115, 5480–5485. [Google Scholar] [CrossRef]
- Wright, I.J.; Reich, P.B.; Westoby, M.; Ackerly, D.D.; Baruch, Z.; Bongers, F.; Cavender-Bares, J.; Chapin, T.; Cornelissen, J.H.C.; Diemer, M.; et al. The worldwide leaf economics spectrum. Nature 2004, 428, 821–827. [Google Scholar] [CrossRef] [PubMed]
- Chen, Y.; Xu, Z. Review on research of leaf economics spectrum. Chin. J. Plant Ecol. 2014, 38, 1135–1153. [Google Scholar]
- Blackman, C.J.; Aspinwall, M.J.; Resco de Dios, V.; Smith, R.A.; Tissue, D.T.; Whitehead, D. Leaf photosynthetic, economics and hydraulic traits are decoupled among genotypes of a widespread species of eucalypt grown under ambient and elevated CO2. Funct. Ecol. 2016, 30, 1491–1500. [Google Scholar] [CrossRef]
- Li, L.; McCormack, M.L.; Ma, C.G.; Kong, D.L.; Zhang, Q.; Chen, X.Y.; Zeng, H.; Niinemets, Ü.; Guo, D.L. Leaf economics and hydraulic traits are decoupled in five species-rich tropical-subtropical forests. Ecol. Lett. 2015, 18, 899–906. [Google Scholar] [CrossRef] [PubMed]
- Conti, G.; Kowaljow, E.; Baptist, F.; Rumpel, C.; Cuchietti, A.; Harguindeguy, N.P.; Díaz, S. Altered soil carbon dynamics under different land-use regimes in subtropical seasonally-dry forests of central Argentina. Plant Soil. 2016, 403, 375–387. [Google Scholar] [CrossRef]
- Farquhar, G.D.; Ehleringer, J.R.; Hubick, K.T. Carbon isotope discrimination and photosynthesis. Annu. Rev. Plant Biol. 1989, 40, 503–537. [Google Scholar] [CrossRef]
- Dawson, T.E.; Mambelli, S.; Plamboeck, A.H.; Templer, P.H.; Tu, K.P. Stable isotopes in plant ecology. Annu. Rev. Ecol. Syst. 2002, 33, 507–559. [Google Scholar] [CrossRef]
- Keitel, C.; Matzarakis, A.; Rennenberg, H.; Gessler, A. Carbon isotopic composition and oxygen isotopic enrichment in phloem and total leaf organic matter of European beech (Fagus sylvatica L.) along a climate gradient. Plant Cell Environ. 2006, 29, 1492–1507. [Google Scholar] [CrossRef] [PubMed]
- Prieto, I.; Querejeta, J.I.; Segrestin, J.; Volaire, F.; Roumet, C. Leaf carbon and oxygen isotopes are coordinated with the leaf economics spectrum in Mediterranean rangeland species. Funct. Ecol. 2018, 32, 612–625. [Google Scholar] [CrossRef]
- Mathias, J.M.; Thomas, R.B. Global tree intrinsic water use efficiency is enhanced by increased atmospheric CO2 and modulated by climate and plant functional types. Proc. Natl. Acad. Sci. USA 2021, 118, e2014286118. [Google Scholar] [CrossRef] [PubMed]
- Wang, J.; Wen, X.; Lyu, S.; Zhang, X.; Li, S.; Guo, Q. Vegetation recovery alters soil N status in subtropical karst plateau area: Evidence from natural abundance δ15N and δ18O. Plant Soil. 2021, 460, 609–623. [Google Scholar] [CrossRef]
- Wang, J.; Wen, X.F.; Lyu, S.; Guo, Q.J. Soil properties mediate ecosystem intrinsic water use efficiency and stomatal conductance via taxonomic diversity and leaf economic spectrum. Sci. Total Environ. 2021, 783, 146968. [Google Scholar] [CrossRef]
- Wang, J.; Wen, X.F.; Lyu, S.D.; Guo, Q.J. Transition in multi-dimensional leaf traits and their controls on water use strategies of co-occurring species along a soil limiting-resource gradient. Ecol. Indic. 2021, 128, 107838. [Google Scholar] [CrossRef]
- Trueba, S.; Théroux-Rancourt, G.; Earles, J.M.; Buckley, T.N.; Love, D.; Johnson, D.M.; Brodersen, C. The three-dimensional construction of leaves is coordinated with water use efficiency in conifers. New Phytol. 2021, 233, 851–861. [Google Scholar] [CrossRef] [PubMed]
- Yu, Q.; Jin, G.; Liu, Z. Plant size, branch age and environment factors co-drive variations of branch traits of Pinus koraiensis. Chin. J. Plant Ecol. 2020, 44, 939–950. [Google Scholar] [CrossRef]
- Kuusk, V.; Niinemets, Ü.; Valladares, F. A major trade-off between structural and photosynthetic investments operative across plant and needle ages in three Mediterranean pines. Tree Physiol. 2018, 38, 543–557. [Google Scholar] [CrossRef] [PubMed]
- Thomas, S.C. Photosynthetic capacity peaks at intermediate size in temperate deciduous trees. Tree Physiol. 2010, 30, 555–573. [Google Scholar] [CrossRef] [PubMed]
- Dong, Y.C.; Liu, Y.H. Response of Korean pine’s functional traits to geography and climate. PLoS ONE 2017, 12, 15. [Google Scholar] [CrossRef] [PubMed]
- Li, J. The pattern and dynamics of Pinus koraiensis population. J. Northeast. Forestry Univ. 1986, 14, 33–38. [Google Scholar]
- Liu, Z.L.; Chen, J.M.; Jin, G.Z.; Qi, Y.J. Estimating seasonal variations of leaf area index using litterfall collection and optical methods in four mixed evergreen-deciduous forests. Agric. Forest Meteorol. 2015, 209, 36–48. [Google Scholar] [CrossRef]
- Liu, Z.L.; Hikosaka, K.; Li, F.R.; Zhu, L.J.; Jin, G.Z. Plant size, Environment factors and functional traits jointly shape the stem radius growth rate in an evergreen coniferous species across ontogenetic stages. J. Plant Ecol. 2021, 14, 257–269. [Google Scholar] [CrossRef]
- Ji, M.; Jin, G.; Liu, Z. Effects of ontogenetic stage and leaf age on leaf functional traits and the relationships between traits in Pinus koraiensis. J. For. Res. 2021, 32, 2459–2471. [Google Scholar] [CrossRef]
- Mencuccini, M.; Martínez-Vilalta, J.; Hamid, H.A.; Korakaki, E.; Vanderklein, D. Evidence for age- and size-mediated controls of tree growth from grafting studies. Tree Physiol. 2007, 27, 463–473. [Google Scholar] [CrossRef]
- Ambrose, A.R.; Sillett, S.C.; Dawson, T.E. Effects of tree height on branch hydraulics, leaf structure and gas exchange in California redwoods. Plant Cell Environ. 2009, 32, 743–757. [Google Scholar] [CrossRef] [PubMed]
- Maxwell, T.M.; Silva, L.C.R.; Horwath, W.R. Integrating effects of species composition and soil properties to predict shifts in montane forest carbon-water relations. Proc. Natl. Acad. Sci. USA 2018, 115, E4219–E4226. [Google Scholar] [CrossRef] [PubMed]
- Tomás, M.; Flexas, J.; Copolovici, L.; Galmés, J.; Hallik, L.; Medrano, H.; Ribas-Carbó, M.; Tosens, T.; Vislap, V.; Niinemets, Ü. Importance of leaf anatomy in determining mesophyll diffusion conductance to CO2 across species: Quantitative limitations and scaling up by models. J. Exp. Bot. 2013, 64, 2269–2281. [Google Scholar] [CrossRef] [PubMed]
- Veromann-Jürgenson, L.L.; Tosens, T.; Laanisto, L.; Niinemets, Ü. Extremely thick cell walls and low mesophyll conductance: Welcome to the world of ancient living! J. Exp. Bot. 2017, 68, 1639–1653. [Google Scholar] [CrossRef] [PubMed]
- Terashima, I.; Hanba, Y.T.; Tholen, D.; Niinemets, Ü. Leaf functional anatomy in relation to photosynthesis. Plant Physiol. 2011, 155, 108–116. [Google Scholar] [CrossRef] [PubMed]
- Ma, J.Y.; Sun, W.; Sun, H.L.; Wang, S.M. Stable carbon isotope characteristics of desert plants in the Junggar Basin, China. Ecol. Res. 2012, 27, 115–124. [Google Scholar] [CrossRef]
- Zhou, Y.C.; Fan, J.W.; Harris, W.; Zhong, H.P.; Zhang, W.Y.; Cheng, X.L. Relationships between C3 Plant foliar carbon isotope composition and element contents of grassland species at high altitudes on the Qinghai-Tibet Plateau, China. PLoS ONE 2013, 8, e60794. [Google Scholar] [CrossRef] [PubMed]
- Zhu, T.B.; Zeng, S.M.; Qin, H.L.; Zhou, K.X.; Yang, H.; Lan, F.N.; Huang, F.; Cao, J.H.; Müller, C. Low nitrate retention capacity in calcareous soil under woodland in the karst region of southwestern China. Soil. Biol. Biochem. 2016, 97, 99–101. [Google Scholar] [CrossRef]
- Niinemets, Ü.; Lukjanova, A. Needle longevity, shoot growth and branching frequency in relation to site fertility and within-canopy light conditions in Pinus sylvestris. Ann. For. Sci. 2003, 60, 195–208. [Google Scholar] [CrossRef]
- Terashima, I.; Hanba, Y.T.; Tazoe, Y.; Vyas, P.; Yano, S. Irradiance and phenotype: Comparative eco-development of sun and shade leaves in relation to photosynthetic CO2 diffusion. J. Exp. Bot. 2006, 57, 343–354. [Google Scholar] [CrossRef]
- Cavaleri, M.A.; Oberbauer, S.F.; Clark, D.B.; Clark, D.A.; Ryan, M.G. Height is more important than light in determining leaf morphology in a tropical forest. Ecology 2010, 91, 1730–1739. [Google Scholar] [CrossRef] [PubMed]
- Lusk, C.H.; Warton, D.I. Global meta-analysis shows that relationships of leaf mass per area with species shade tolerance depend on leaf habit and ontogeny. New Phytol. 2007, 176, 764–774. [Google Scholar] [CrossRef] [PubMed]
- Yang, J.; Song, X.Y.; Cao, M.; Deng, X.B.; Zhang, W.F.; Yang, X.F.; Swenson, N.G. On the modelling of tropical tree growth: The importance of intra-specific trait variation, non-linear functions and phenotypic integration. Ann. Bot. 2021, 127, 533–542. [Google Scholar] [CrossRef] [PubMed]
- Lusk, C.H. Leaf area and growth of juvenile temperate evergreens in low light: Species of contrasting shade tolerance change rank during ontogeny. Funct. Ecol. 2004, 18, 820–828. [Google Scholar] [CrossRef]
- Hu, Q.P.; Guo, Z.H.; Li, C.Y.; Ma, L.Y. Leaf morphology and photosynthetic characteristics of seedlings of a deciduous and an evergreen broad-leaved species under different light regimes in subtropical forests. Sheng Tai Xue Bao 2008, 28, 3262–3270. [Google Scholar]
- Farquhar, G.D.; Sharkey, T.D. Stomatal conductance and photosynthesis. Annu. Rev. Plant Physiol. 1982, 33, 317–345. [Google Scholar] [CrossRef]
- Niinemets, Ü.; Al Afas, N.; Cescatti, A.; Pellis, A.; Ceulemans, R. Petiole length and biomass investment in support modify light-interception efficiency in dense poplar plantations. Tree Physiol. 2004, 24, 141–154. [Google Scholar] [CrossRef] [PubMed]
- Santiago, L.S.; Wright, S.J.; Harms, K.E.; Yavitt, J.B.; Korine, C.; Garcia, M.N.; Turner, B.L. Tropical tree seedling growth responses to nitrogen, phosphorus and potassium addition. J. Ecol. 2012, 100, 309–316. [Google Scholar] [CrossRef]
- Zhang, W.; Liu, W.C.; Xu, M.P.; Deng, J.; Han, X.H.; Yang, G.H.; Feng, Y.Z.; Ren, G.X. Response of forest growth to C:N:P stoichiometry in plants and soils during Robinia pseudoacacia afforestation on the Loess Plateau, China. Geoderma 2019, 337, 280–289. [Google Scholar] [CrossRef]
- Liu, F.D.; Yang, W.J.; Wang, Z.S.; Xu, Z.; Liu, H.; Zhang, M.; Liu, Y.H.; An, S.Q.; Sun, S.C. Plant size effects on the relationships among specific leaf area, leaf nutrient content, and photosynthetic capacity in tropical woody species. Acta Oecol. 2010, 36, 149–159. [Google Scholar] [CrossRef]
- Yang, D.X.; Song, L.; Jin, G.Z. The soil C:N:P stoichiometry is more sensitive than the leaf C:N:P stoichiometry to nitrogen addition: A four-year nitrogen addition experiment in a Pinus koraiensis plantation. Plant Soil 2019, 442, 183–198. [Google Scholar] [CrossRef]
- Yang, L.; Li, W. Fine root distribution and turnover in a broad-leaved and Korean pine climax forest of the Changbai Mountain in China. For. Stud. China 2005, 27, 1–5. [Google Scholar]
- Chen, J.M.; Govind, A.; Sonnentag, O.; Zhang, Y.Q.; Barr, A.; Amiro, B. Leaf area index measurements at Fluxnet-Canada forest sites. Agric. Forest Meteorol. 2006, 140, 257–268. [Google Scholar] [CrossRef]
- Frazer, G.W.; Canham, C.D.; Lertzman, K.P. Gap light analyzer (GLA), Version 2.0: Image-processing software to analyze true-color, hemispherical canopy photographs. Bull. Ecol. Soc. Am. 2000, 81, 191–197. [Google Scholar]


Disclaimer/Publisher’s Note: The statements, opinions and data contained in all publications are solely those of the individual author(s) and contributor(s) and not of MDPI and/or the editor(s). MDPI and/or the editor(s) disclaim responsibility for any injury to people or property resulting from any ideas, methods, instructions or products referred to in the content. |
© 2024 by the authors. Licensee MDPI, Basel, Switzerland. This article is an open access article distributed under the terms and conditions of the Creative Commons Attribution (CC BY) license (https://creativecommons.org/licenses/by/4.0/).