1. Introduction
With the continuing increase in CO
2 concentrations in the atmosphere [
1], there has been considerable research examining the impacts of changes in CO
2 concentration on plant functions and growth [
2,
3,
4,
5]. As a substrate for photosynthesis, CO
2 is still currently a growth-limiting resource for plants that have C
3 metabolism. Experiments imposing different CO
2 concentrations on growing plants generally use CO
2 sensors to dynamically regulate the supply of CO
2 to the experimental system, while any removal of CO
2 required during daylight is usually accomplished by plant photosynthesis and/or wind. Concerns over the impacts of short-term variations in CO
2 concentration on plant function resulted primarily from the recognition of large-magnitude CO
2 fluctuations in free-air-carbon dioxide-enrichment facilities. Free-air-CO
2-enrichment (FACE) facilities were developed to provide elevated CO
2 treatments to plant ecosystems outdoors with a minimal disturbance from other environmental factors, such as wind, light, air temperature and humidity, and soil conditions [
6]. However, in most FACE systems, CO
2 release is at the perimeter of the plot, while the CO
2 concentration sampled to control the CO
2 release is near the center of the plot, often many meters from the release points. Because air movement is needed to distribute CO
2 across the plot, there is a variable time lag between CO
2 release and the detection of the achieved concentration as well as the disturbance by air turbulence. A few papers documented large fluctuations in CO
2 concentrations over time within a given plot with FACE systems, using sampling systems that averaged CO
2 concentrations over about 5 s periods [
7,
8]. Surprisingly, despite the existence of rapid-response open-path CO
2 analyzers for about the last 25 years, rapid (seconds) CO
2 concentration measurements in FACE plots have only recently been published [
9,
10]. Based on measurements in a FACE system of the Brookhaven National Laboratory design, Allen et al. [
10] concluded that “due to the difficulty of controlling elevated CO
2 concentrations in turbulent air, the range of fluctuations of CO
2 in FACE experiments are more than 10-fold greater than plants experience in natural conditions”. After reviewing experiments comparing plant responses to elevated CO
2 with different degrees of fluctuation, it was concluded that plant growth was suppressed by the larger CO
2 fluctuations in FACE systems, probably by reducing photosynthesis [
10].
Because of the difficulty of reproducing fluctuations observed in FACE plots in controlled experiments, most experiments to assess the impacts of fluctuating CO
2 have used either regular cycles of CO
2 or brief pulses of high CO
2 [
11,
12,
13,
14,
15]. Hendrey et al. [
11] measured chlorophyll fluorescence responses to the short-term cyclic variation in CO
2 concentration of several frequencies. Holtum and Winter [
12] measured responses of CO
2 uptake to the short-term cyclic variation in CO
2 concentration but did not measure stomatal conductance, and found that variations in CO
2 reduced photosynthesis in two tree species. Bunce [
13] provided long-term cyclic CO
2 treatments compared with constant elevated CO
2 treatments at the same mean elevated CO
2 in open top chambers, and found that the cyclic CO
2 treatments reduced photosynthesis, stomatal conductance and plant growth in wheat and cotton. Short-term series of pulses of elevated CO
2 mimicking those observed in FACE plots reduced photosynthesis and stomatal conductance in wheat and rice leaves [
14]. In indoor chambers, a larger magnitude of continuously applied fluctuations of CO
2 reduced photosynthesis, stomatal conductance and the growth of four herbaceous species compared with a smaller amplitude of CO
2 variation [
15]. Although reduced stomatal conductance often occurs in response to CO
2 fluctuations, it is not the sole cause of reductions in photosynthesis, even if the stomatal closure is entirely “patchy” in nature [
15,
16].
This work examined whether a reduced photochemical efficiency of photosystem II occurred in response to CO2 fluctuations and might cause some of the suspected reductions in photosynthesis in field-grown plants in FACE systems, in addition to reductions in stomatal conductance.
2. Results
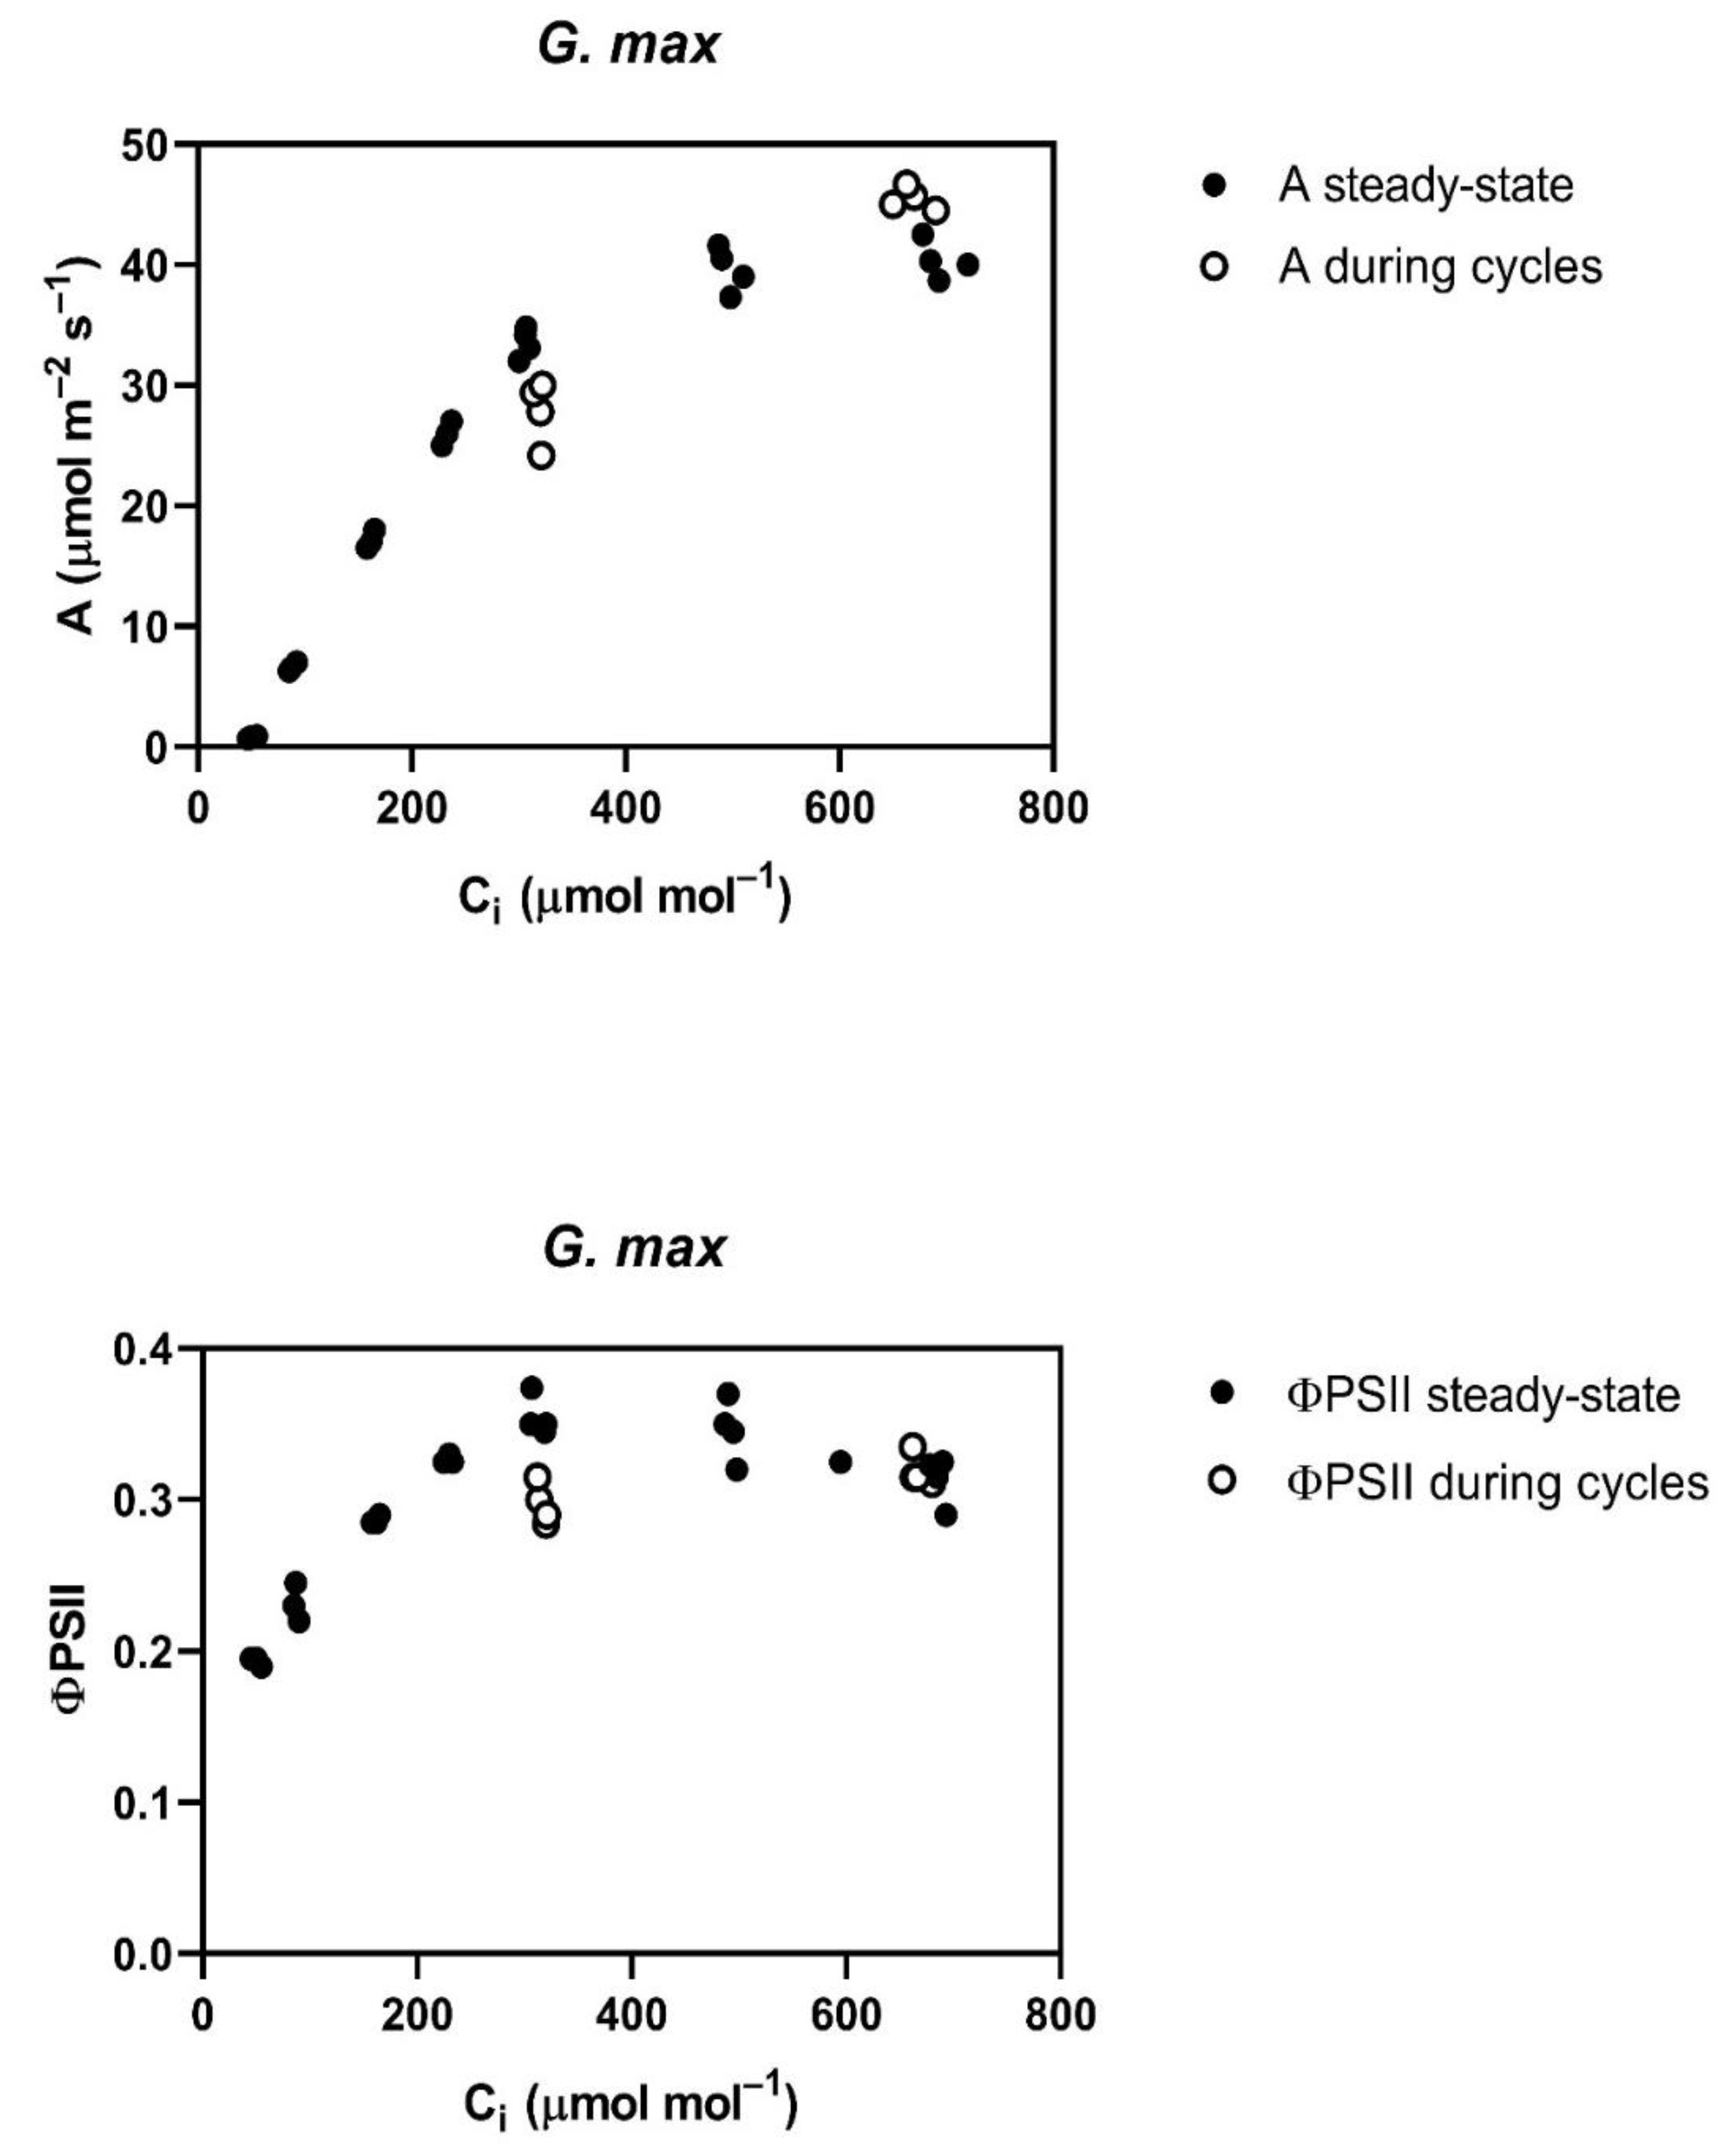
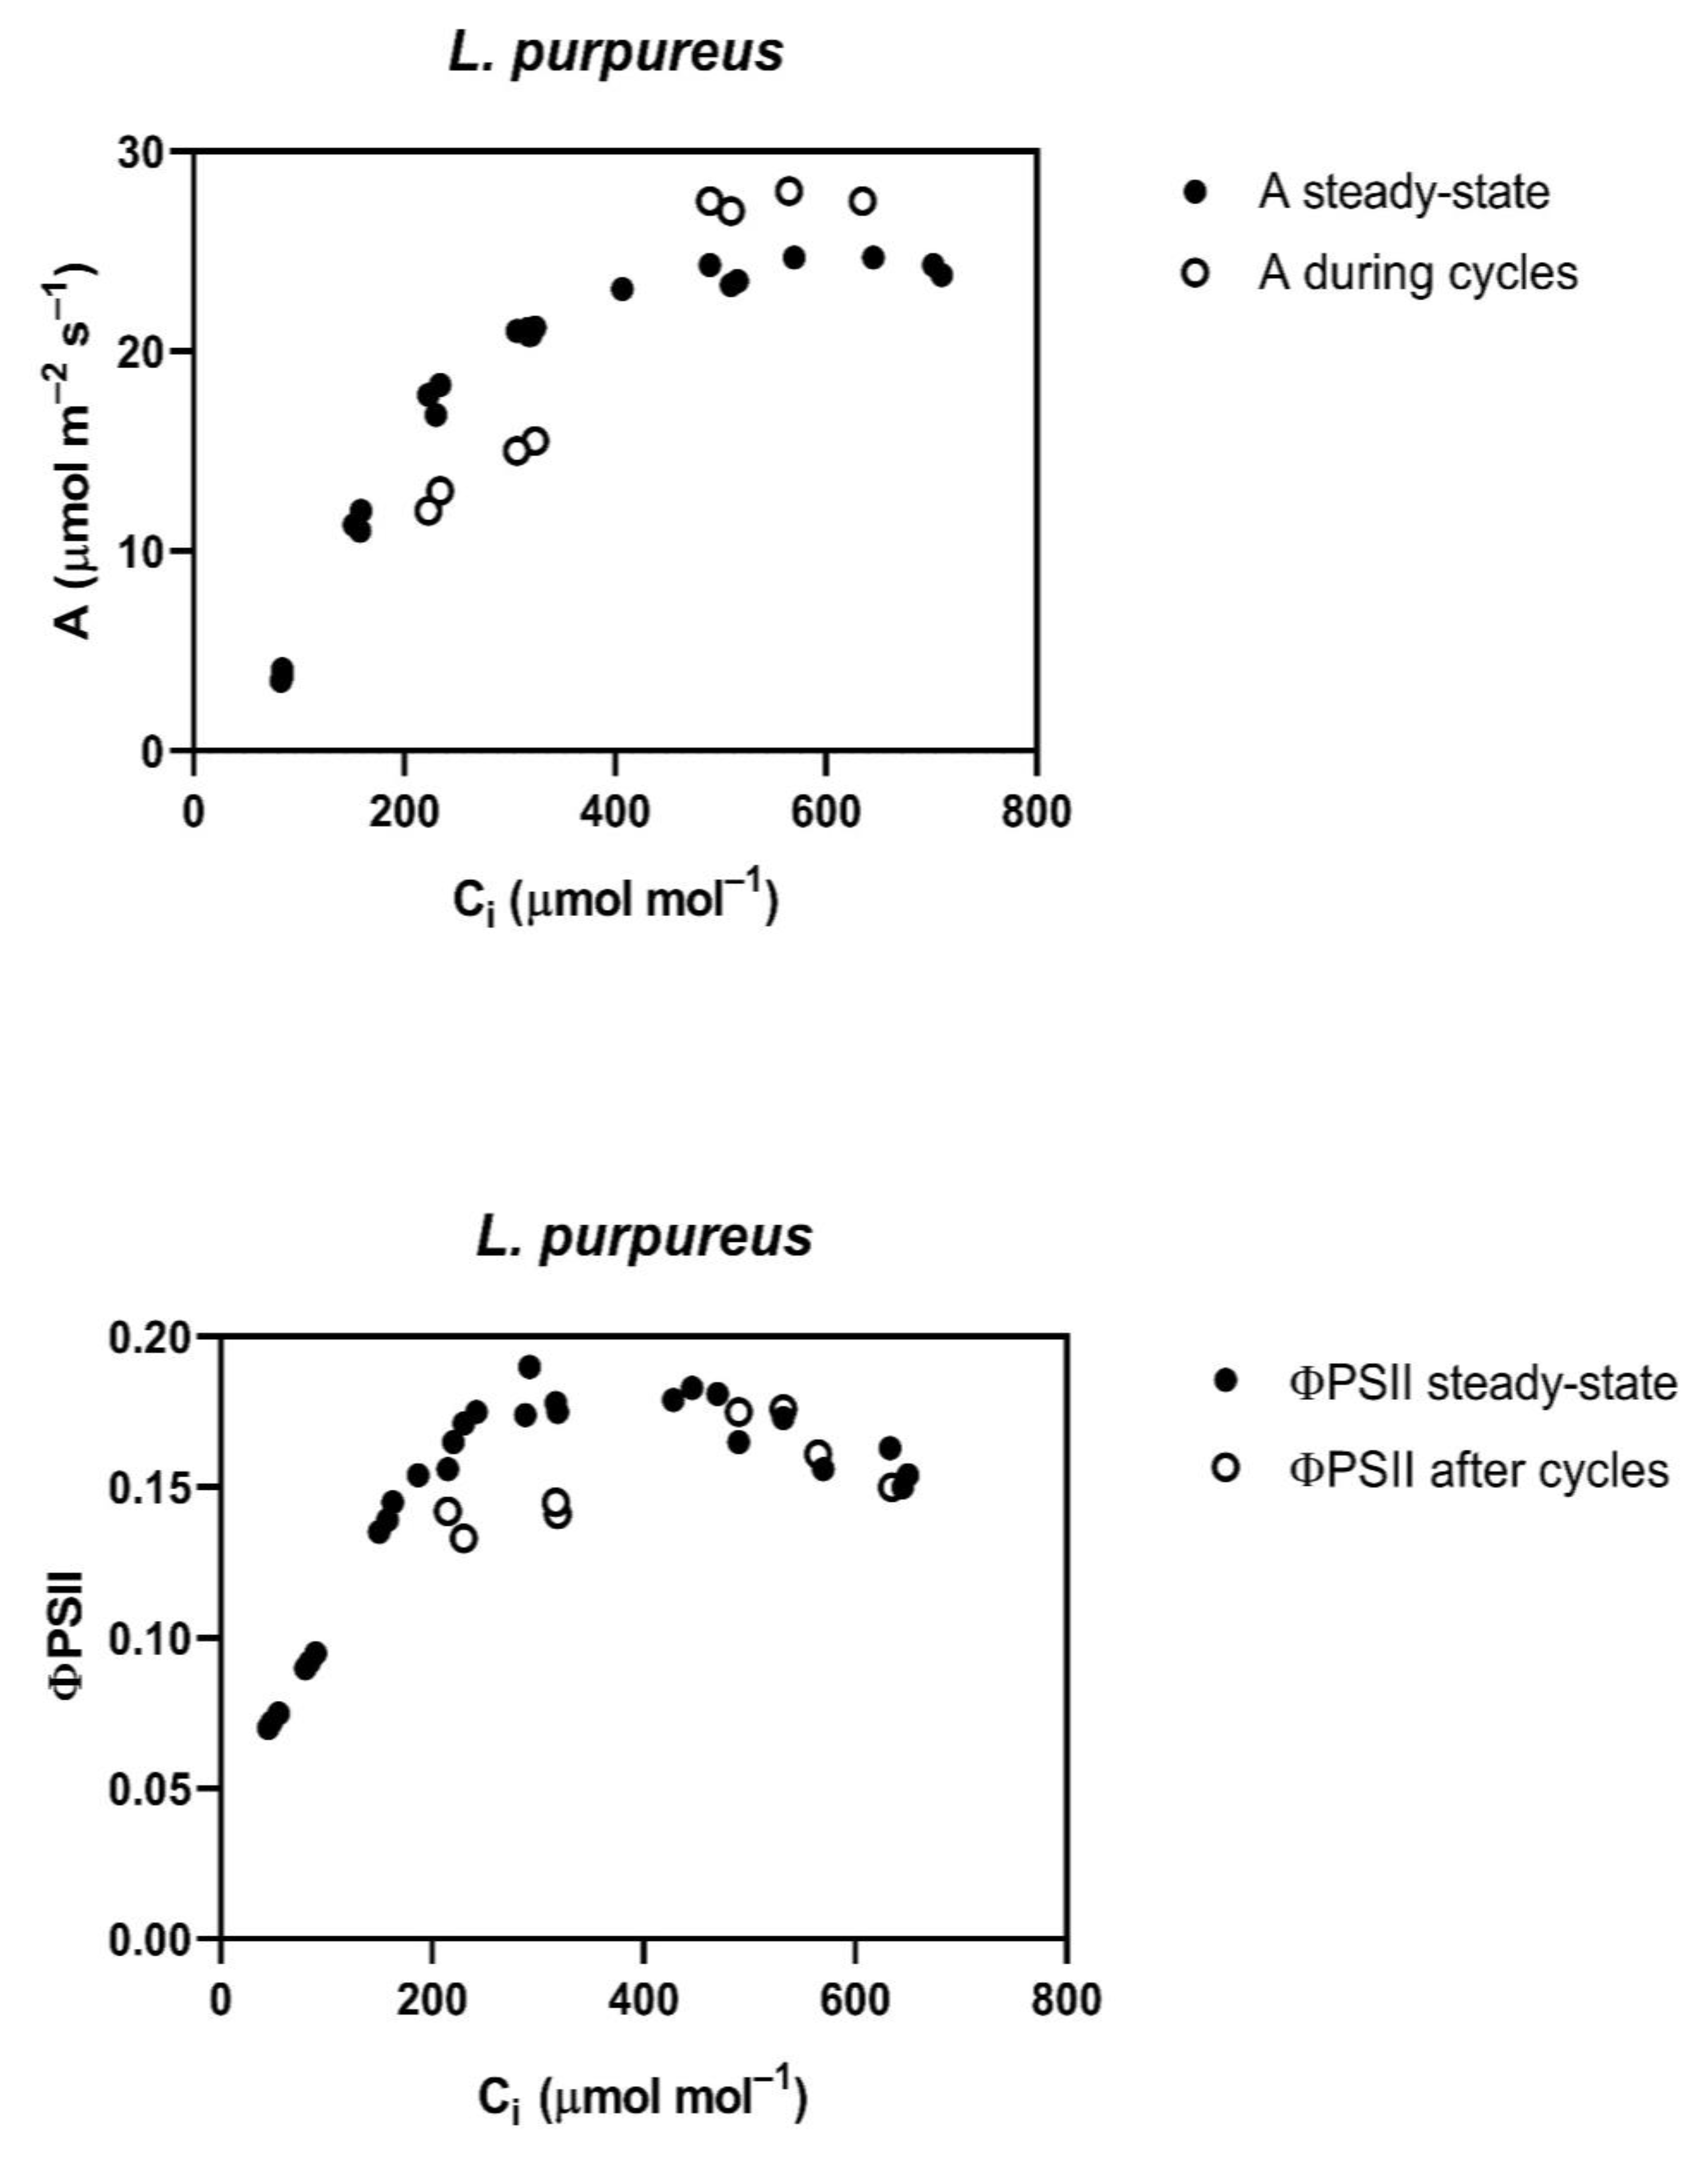
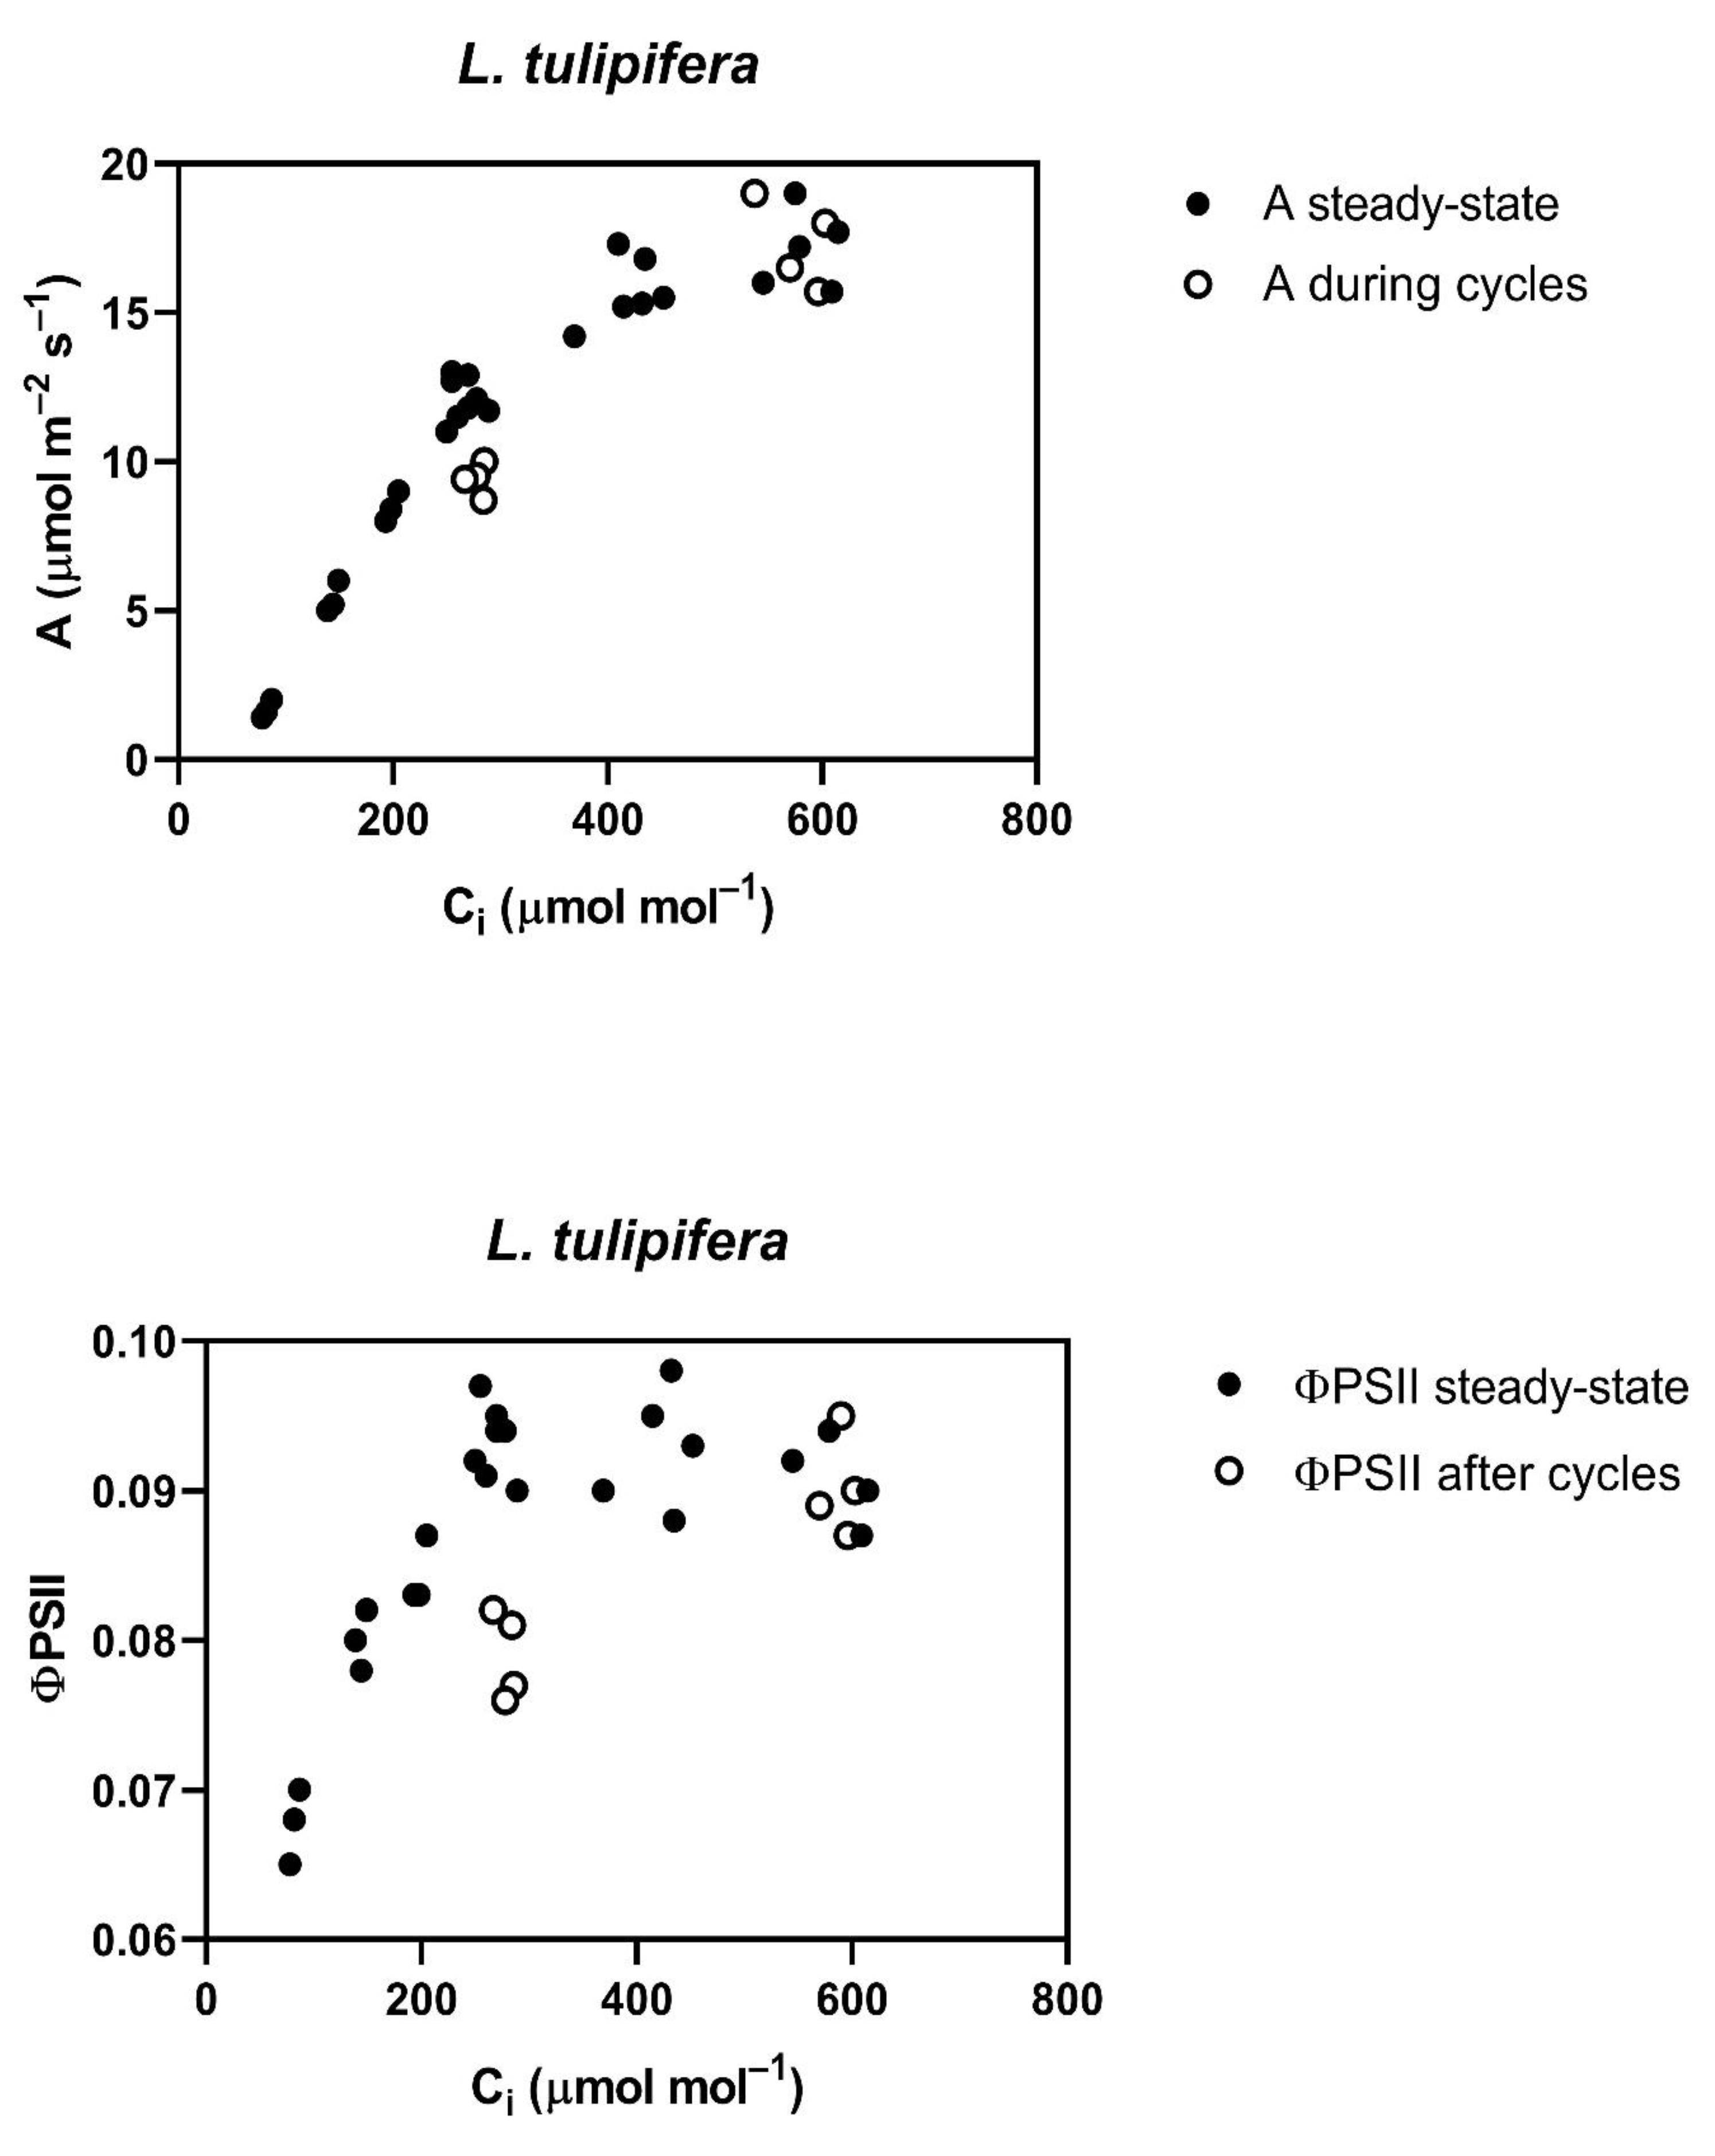
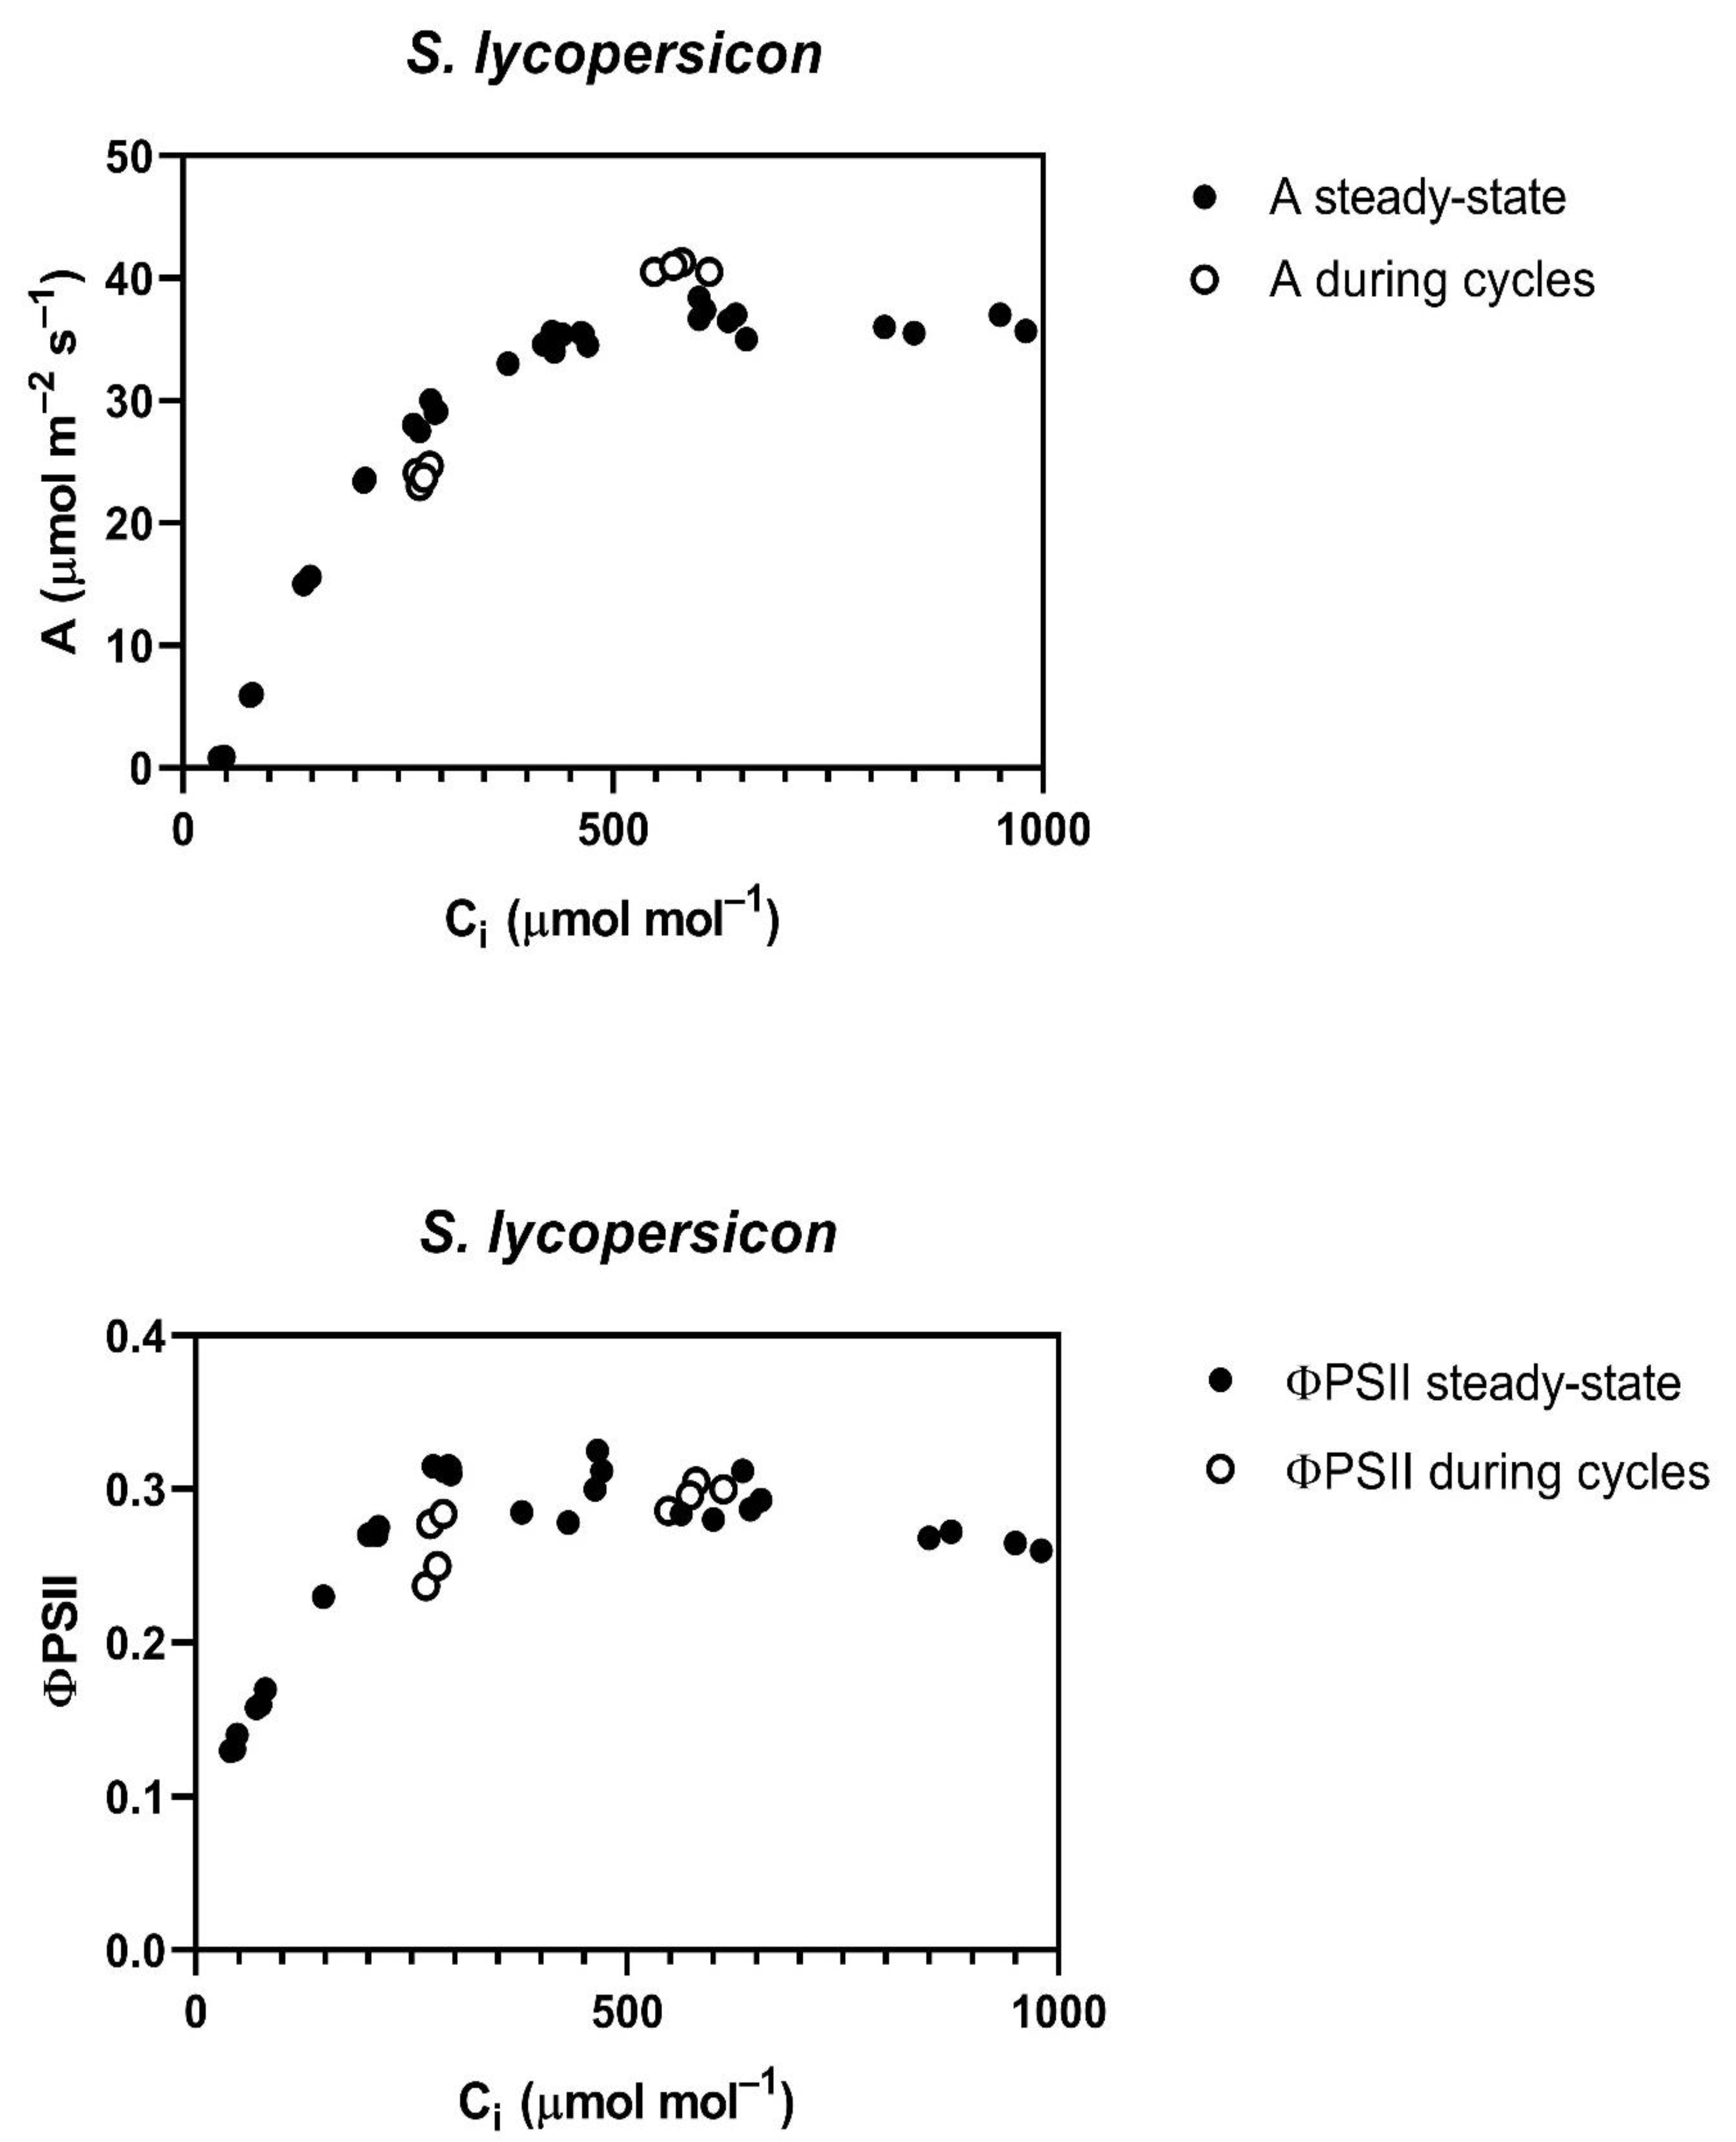
Throughout the cycling of CO
2, four of the five species studied,
G. max,
L. purpureus, L. tulipifera and
S. lycopersicum, had a reduced assimilation rate (A) and PSII efficiency (ΦPSII) at rate-limiting sub-stomatal CO
2 (C
i) values of about 250 to 300 μmol mol
−1 occurring at 400 μmol mol
−1 external CO
2 (
Figure 1). At a higher C
i, occurring at 800 μmol mol
−1 external CO
2, A was actually slightly increased in all of these species, except
L. tulipifera, and the ΦPSII was the same as before the cycling of CO
2 in all four of these species (
Figure 1). The reduction in ΦPSII and A to below steady-state values was evident at the end of the first 400 μmol mol
−1 half-cycle and continued throughout the cycling of CO
2 in all of these four species. In
G. max, the stomatal conductance decrease caused by cycling was nearly complete in the first half-cycle, while the other species had slower decreases in stomatal conductance, but stomatal conductance had stabilized before the end of the 10 min of cycling. All species were the same as
G. max in terms of the speed of the ΦPSII decrease, i.e., it decreased by the end of the first half-cycle. The decrease in ΦPSII during CO
2 cycling, observed at the lower C
i, was accompanied by increased non-photochemical quenching. Ten minutes after the end of CO
2 cycling, a lower stomatal conductance remained at each CO
2 level in all four of these species (
Table 1). Additionally, at ten minutes after the end of CO
2 cycling, ΦPSII and photosynthesis measured at 400 μmol mol
−1 both remained lower than before the CO
2 cycling. However, the values of A and ΦPSII measured at 600 μmol mol
−1 did not differ significantly from control values when measured at 600 μmol mol
−1 (
Table 2) in any species, despite a lower stomatal conductance in all species except
P. crispum.
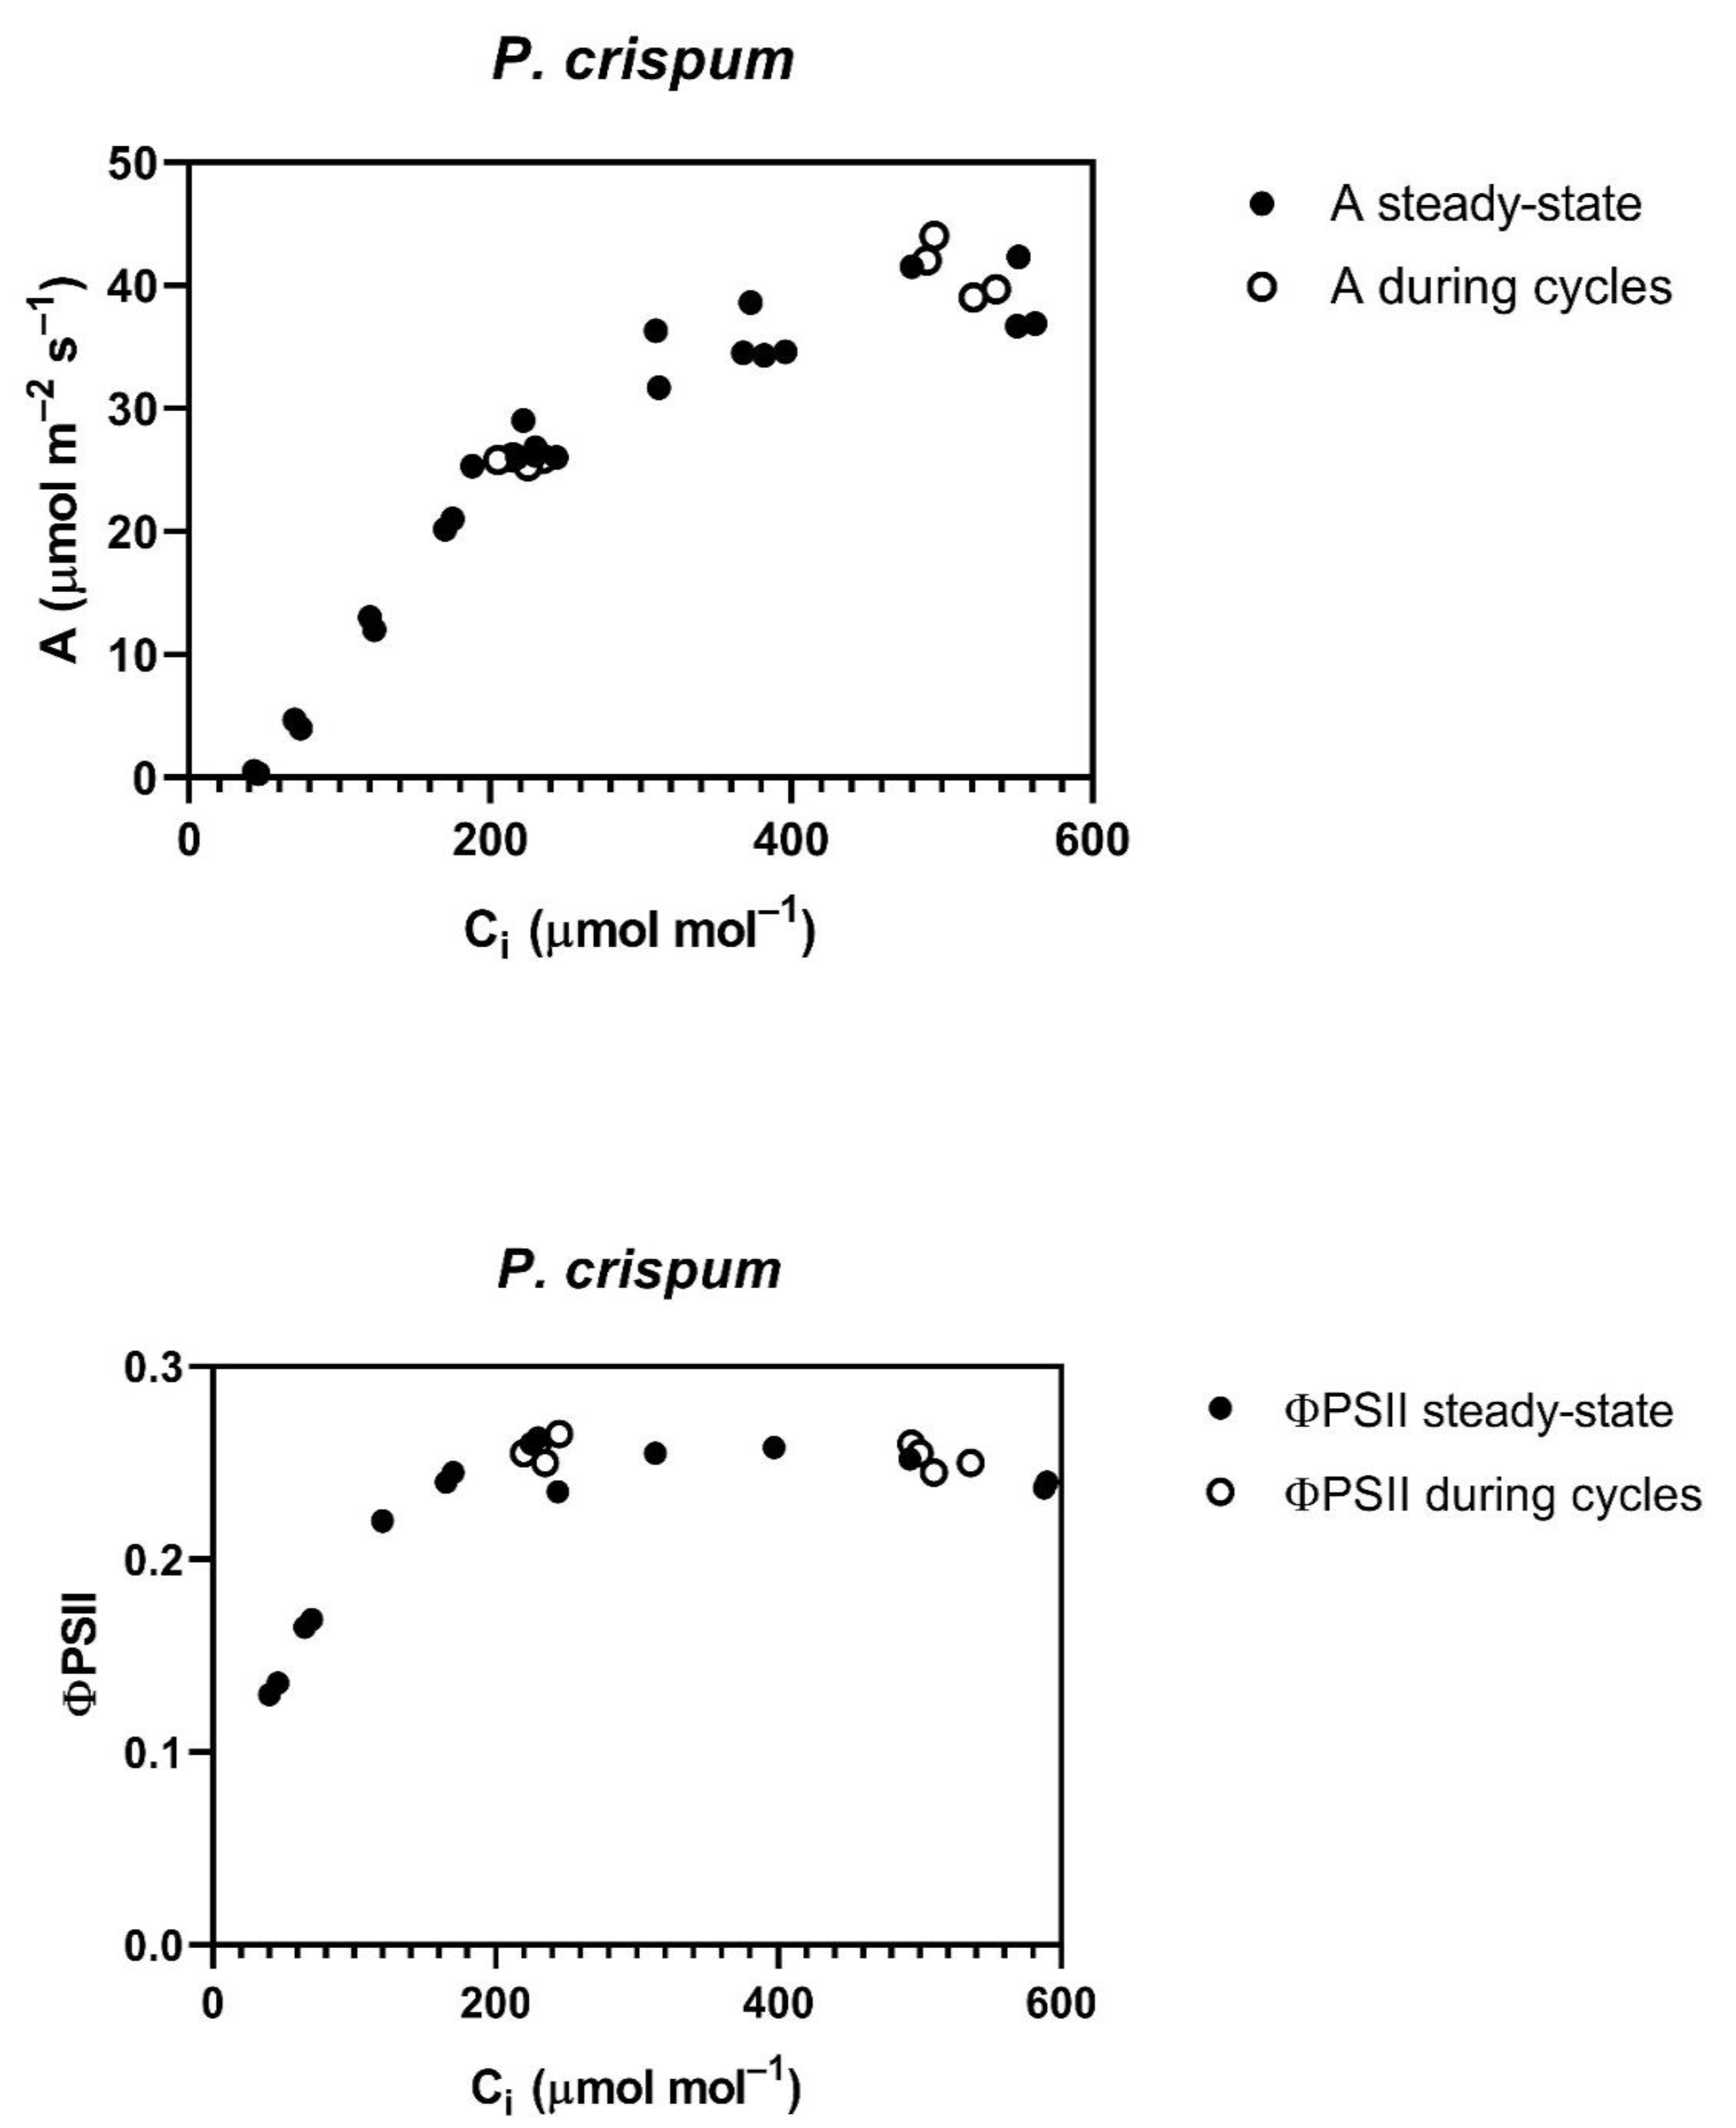
The
P. crispum, in contrast to the other four species, had no reduction in the A vs. C
i curve, or in ΦPSII after the cycling of CO
2 (
Figure 2), and also showed no change in stomatal conductance with CO
2 (
Table 1).
Stomatal conductance before the cycling of CO
2 was lower at 800 than at 400 μmol mol
−1 CO
2 in all species except
P. crispum (
Table 1). Stomatal conductance during CO
2 cycling was reduced in all species, except
P. crispum (
Table 1). Ten minutes after cycling ended, the stomatal conductance remained lower than before cycling in all species, except
P. crispum, in which the stomatal conductance was unchanged by all treatments (
Table 1).
3. Discussion
All of these species had fairly typical A vs. C
i curves for C
3 species, with no decreases in A at the highest C
i values, which would be clear evidence of a limitation by triose phosphate utilization (TPU) [
17]. However, all species had some decrease in ΦPSII at the highest C
i values, which McClain et al. [
18] suggest is indicative of TPU limitation. A premature leveling off of A vs. C
i curves is more difficult to discern than reductions in ΦPSII as an indication of TPU limitation, except possibly by the fitting of a photosynthesis model that includes a TPU limitation to the observed data.
The reductions in the photochemical efficiency of PSII (ΦPSII) at 400 μmol mol
−1 external CO
2 levels caused by the cycling of CO
2 concentration, which occurred in four of the five species examined, provide a new explanation of reduced photosynthesis rates for a given sub-stomatal CO
2 concentration, which has frequently been reported in CO
2 fluctuation experiments [
12,
13,
14,
15]. Prior suggestions that reduced photosynthesis might be the result of “patchy” stomatal closure [
13,
15] admittedly could not account for the lack of reduction in photosynthesis at elevated measurement CO
2 [
15]. In the current experiments, the reduction in ΦPSII that occurred at the lower measurement CO
2 did not occur at the higher measurement CO
2. At the higher measurement CO
2, photosynthesis was also not inhibited by the cycling of CO
2 in these experiments, despite the continued lower stomatal conductance. The lack of decrease in A despite a lower stomatal conductance is to be expected at nearly saturating values of CO
2. Similar to the results presented here, in long-term cyclic CO
2 exposures in open top chambers, the relative reductions in photosynthesis in cotton were much larger for measurements made at the lower (near-ambient CO
2) than at the higher external CO
2 of the cycles [
13].
McClain et al. [
18] also reported reductions in ΦPSII in response to a large step increase in CO
2, which they proposed was related to a triose-phosphate limitation of photosynthesis at high CO
2. They provided no information on the stomatal conductance response to their treatments. However, in the fluctuating CO
2 experiments reported here, reduced ΦPSII only occurred at limiting CO
2 concentrations, not at elevated CO
2. This difference in plant response might be related to the much shorter duration of exposure to high CO
2 and lower elevated CO
2 concentrations in the present experiment (800 μmol mol
−1) compared with those of McClain et al. (1500 μmol mol
−1). In these experiments, leaves were actually at 800 μmol mol
−1 during the cycling of CO
2 for less than five minutes.
I speculate that
P. crispum had a qualitatively different photosynthetic response to the cyclic CO
2 treatment than the other four species studied here, because it had no response at all of stomatal conductance to CO
2 in the range of 400 to 800 μmol mol
−1, in contrast to all of the other species. Similar results for more species with stomates unresponsive to changes in CO
2 would be required to confirm this correlation.
L. tulipifera was chosen for these experiments, based on the generally smaller response of stomatal conductance to CO
2 in tree species [
19,
20]. It did have a smaller relative response than the other three herbaceous species, but not a zero response, as occurred in
P. crispum. It remains unclear how the presence or absence of changes in stomatal conductance during fluctuations in CO
2 could influence photochemical limitations on photosynthesis at low CO
2. However, the decrease in photosynthesis and ΦPSII observed in this tree species at the lower measurement CO
2 is consistent with the decreases in photosynthesis found by Holtum and Winter in two tropical tree species [
12]. This suggests that FACE experiments may also not give the most accurate indication of tree responses to climate change.
Allen et al. [
10] reviewed yield data in FACE and open top chambers (OTC) for several major C
3 crop species, and they concluded that the yield stimulation caused by the same elevated CO
2 treatments was, in FACE, on average, only about 0.66× of that occurring in OTC. A smaller yield stimulation by elevated CO
2 in FACE than in OTC was documented for wheat and soybeans in the only side-by-side simultaneous FACE and OTC comparisons of crop yield [
21] that exist to date. Allen et al. [
10] tentatively attributed this smaller yield stimulation to a reduced stimulation of photosynthesis by elevated CO
2 in FACE than in OTC. The smaller stimulation of photosynthesis was thought to be caused by the much larger fluctuations in CO
2 in elevated CO
2 treatments in FACE than in OTC. Allen et al. [
10] carefully documented larger CO
2 fluctuations in FACE with all of the available rapid CO
2 measurement data, and I am not aware of any more recent published data on CO
2 fluctuations in FACE. However, at the time that paper was written [
10], reasons why rapid fluctuations in CO
2 would cause reduced photosynthesis were unclear, despite some documented cases of high-CO
2 pulses or the cycling of CO
2 reducing photosynthesis [
12,
13,
14]. Deceases in photosynthesis caused by the pulses of elevated CO
2 or by the cycling of CO
2 have now been documented in many of the most important C
3 crop species, wheat [
14], rice [
14], soybean ([
15] and this paper), and cotton [
14], in two minor crop species, tomato and lablab [this paper], and also in three tree species ([
12] and this paper). Up until the current work, the only clue about the reasons why fluctuations in CO
2 would inhibit photosynthesis were observations of a reduced stomatal conductance to water vapor [
13,
14,
15].
The results presented here provide a new mechanism by which fluctuations in CO
2 around leaves can inhibit photosynthesis, a decrease in the photochemical efficiency of photosystem II. Of course, these results beg the question of why ΦPSII was decreased by the cycling of CO
2. Furthermore, the extent to which this decrease in ΦPSII at low CO
2 occurs in experiments exposing plants to a long-term elevation of CO
2, for example in FACE experiments, has not been determined. It is interesting to consider that reduced photosynthesis in FACE systems may primarily occur during those periods in which CO
2 fluctuations bring CO
2 levels down to near-ambient CO
2 levels, based on the results presented here. Most measurements of photosynthesis in FACE systems have been conducted at the targeted elevated CO
2 concentration, not at lower CO
2 concentrations. The only experiment to date that directly compared photosynthesis in plants grown simultaneously at elevated CO
2 in open top chambers and in FACE systems only measured leaf gas exchange at the elevated CO
2 [
21], in the plants grown at elevated CO
2, and thus would have missed photosynthetic responses resembling those presented here.
4. Materials and Methods
Leaf gas exchange and chlorophyll fluorescence measurements were conducted on four species of herbaceous plants and one tree species grown outdoors at ambient CO2. The species studied were Glycine max L. Merr. cv. Clark, Lablab purpureus L. Sweet, Petroselinum crispum Mill. Fuss var. neopolitanum, Solanum lycopersicum L. cv. Better Boy, and Lireodendron tulipifera L. The four herbaceous species were grown in Annapolis, Maryland in an unshaded plot with a sandy loam soil. Plants were grown from seed and planted in late April 2020. The plot was fertilized with a complete fertilizer containing 12% N, 4% P, and 8% K at 200 g of fertilizer per m2, and it did not experience soil water stress. The L. tulipifera trees sampled were saplings, about 6 years old, growing at a south-facing forest edge in Annapolis, on a sandy loam soil. Leaf gas exchange and chlorophyll fluorescence measurements were conducted from mid-June through to the end of June 2020. The mean temperature in Annapolis in May 2020 was 16.0 °C, slightly below the long-term mean of 17.7 °C, and in June 2020 it was 23.3 °C, which equals the long-term mean temperature.
All leaf gas exchange and chlorophyll fluorescence measurements were conducted at 27 °C leaf temperature, 1500 μmol m−2 s−1 PPFD, with a leaf-to-air water vapor pressure difference of 1 to 1.5 kPa, using a Ciras-3 portable photosynthesis system with a PLC3 leaf chamber/fluorometer, with an air flow rate of 400 cm3 min−1. The “stored differential balance” function of the instrument was used to correct measurements for changes in calibration with background CO2. The values of sub-stomatal CO2 (Ci) were calculated from photosynthesis, stomatal and boundary layer conductances, and external CO2 by the system software. During the mornings of sunny days, a fully expanded upper-canopy leaf was selected for measurement. Steady-state responses of stomatal conductance, photosynthesis, and PS II chlorophyll fluorescence at CO2 concentrations of 400, 600, and 800 μmol mol−1 were determined on a leaf, allowing sufficient time for the stomatal conductance to adjust to each CO2 level, as observed on the graphical display of incoming data. Steady-state values were used to ensure that Ci values were accurate. The efficiency of PSII was assessed using multipulse fluorescence measurements at each CO2 level. The CO2 concentration was then returned to 400 μmol mol−1, and cycles of CO2 from 400 to 800 μmol mol−1 with a total cycle length of 2 min were then applied for 10 min, that is, one minute at 400 μmol mol−1, one minute at 800 μmol mol−1, one minute at 400 μmol mol−1, etc., for a total of 10 min. Photosynthesis, stomatal conductance, and PSII efficiency were recorded at the end of each half-cycle. At the end of the cyclic CO2 treatment, CO2 was returned to 400 μmol mol−1, and beginning ten minutes after the end of the CO2 cycling, photosynthesis, stomatal conductance, and PSII efficiency were measured at 400, 600, and 800 μmol mol−1 CO2. These measurements were made on at least four different plants of each species. On a few different leaves of each species, the responses of stomatal conductance, photosynthesis, and PS II chlorophyll fluorescence to CO2 concentrations from 100 to 1200 μmol mol−1 were determined. There were nine steps of CO2 (400, 300, 200, 100, 400, 600, 800, 1000, 1200 μmol mol−1). Leaves were kept at each step of CO2 for three to four minutes, waiting for the leaf gas exchange to stabilize, before measuring the photochemical efficiency of PSII using a multipulse measurement at each step in CO2. The leaf-to-air water vapor pressure difference changed by less than 10% of its initial value of 1 to 1.5 kPa during the cycling of CO2, which would have a minimal impact on the stomatal conductance.


