Article

A Phylogenetic and Morphological Evolution Study of Ribes L. in China Using RAD-Seq

1
College of Life Science, Northeast Forestry University, Harbin 150040, China
2
Key Laboratory of Sustainable Forest Management and Environmental Microorganism Engineering of Heilongjiang Province, Northeast Forestry University, Harbin 150040, China
3
Northeast Asia Biodiversity Research Center, Harbin 150040, China
*
Authors to whom correspondence should be addressed.
Plants 2023, 12(4), 829; https://doi.org/10.3390/plants12040829
Submission received: 20 January 2023 / Revised: 6 February 2023 / Accepted: 10 February 2023 / Published: 13 February 2023
(This article belongs to the Special Issue Plant Morphology and Phylogenetic Evolution)

Abstract

:
Ribes L. belongs to the Grossulariaceae family and has important edible, medicinal, ornamental, and landscaping values. Taxonomic classification within this genus is difficult due to its large variety of species, wide distribution, large morphological variations, and presence of two complex taxonomic groups with bisexual or unisexual flowers. Our study aims to clarify the phylogenetic relationships of Ribes L. taxa in China, and further, to provide a reference for a revised global classification of it. The phylogenetic analysis of 52 Ribes L. samples from 30 species was constructed based on restriction site-associated DNA sequencing and single nucleotide polymorphisms. Afterward, two important taxonomic characters were selected for ancestral state reconstruction over the molecular phylogeny. The results showed that the 52 samples could be divided into six branches, i.e., six subgenera, which caused some controversy regarding the morphological classification of Ribes L. in China. The molecular phylogeny supported the separation of subg. Coreosma from subg. Ribesia and subg. Hemibotrya from subg. Berisia and validated the rationale for recognizing subg. Grossularia as an independent subgenus, the rationality of which was further verified by the reconstruction of ancestor traits. Gene flow among Ribes L. was identified and further confirmed our results.

1. Introduction

There are approximately 200 species of Ribes L. in the world, and they are primarily distributed in East Asia, North America, and the Andes of South America [1]. China is a distribution centre of Ribes L., with approximately 59 species and 30 varieties [2], including the main taxa in phylogenetic development. The economic value of this genus is high enough, as its fruits can be eaten raw or used to produce fruit wine, beverages, candies, and jams since they are rich in various vitamins, sugars, and organic acids [3,4].
Meanwhile, the roots and seeds of some species can also be used for medicinal purposes, while some species have high ornamental value due to their bright flowers and attractive fruits [5]. Therefore, clarifying the phylogenetic relationship within Ribes L. would be beneficial for the protection and rational use of the plant resources in this genus.
Linnaeus initially established the genus Ribes L. into eight species in 1753. Throughout the years, the classification of taxa within this genus remains a hot topic of debate [6,7,8,9,10]. Janczewski [6] classified Ribes L. gathered across the world into six subgenera: Grossularioides, Parilla, Berisia, Coreosma, Ribesia, and Grossularia, according to the characteristics of the flower, including sexuality, the texture of the bud scales as well as the presence or absence of a pedicel, pedicel joints, and thorns on the branches. Rehder [11] categorized this genus into four subgenera and 15 sections; in his classification, subg. Coreosma and subg. Parilla were placed in subg. Ribesia and subg. Berisia, respectively, which were different from the classifications by Janczewski. Berger [8] divided Ribes L. into eight subgenera: Grossularioides, Parilla, Berisia, Coreosma, Ribesia, Calobotrya, Heritiera, and Symphocalyx and Grossularia into four subgenera: Grossularia, Hesperia, Lobbia, and Robsonia. Weigend [7] classified Ribes L. into seven subgenera: Ribes, Coreosma, Calobotrya, Symphocalyx, Grossularioides, Grossularia, and Parilla. Lu [2] accepted the four subgenera classified by Rehder through an analysis of the morphological characteristics and the distribution of Ribes L. in China, although disagreed with the taxonomic ranks assigned by Rehder.
The taxa in Ribes L. are difficult to classify with morphological methods due to the high similarity in morphological characteristics among the species of this genus, large morphological variation, and the presence of two complex taxonomic groups with bisexual or unisexual flowers [12]. To date, some molecular markers have been developed to study the phylogenetic relationship of Ribes L. using technologies such as random amplified polymorphic DNA (RAPD) [13,14], 5S rDNA non-transcribed spacer (NTS) [15], internal transcribed spacer (ITS) [1], and chloroplast DNA loci [16]. In recent years, an increasing number of studies on the molecular systematics of Ribes L. in China were excavated that deeply promote its detailed classification [17,18]. However, the deep understanding of the inference of phylogenetic relationships or the taxonomic classification of Ribes L. is still obscure, for a lack of experimental materials and the limited number of polymorphic loci generated by the existing molecular markers. Therefore, it is necessary to develop more genomic data resources, including high-throughput genomic markers, to promote molecular systematic studies of Ribes L. at the genomic level.
In recent years, second-generation sequencing technology has promoted genome-wide biological research, in which high-throughput sequencing technology has been continuously applied in animal and plant genomics research [19], such as restriction site-associated DNA sequencing (RAD-seq), which is used in our study [20]. Briefly, RAD-seq is a technology used to construct the RAD sequencing library using a certain size of DNA fragments obtained through the digestion of the genome by restriction enzymes, then, the RAD markers produced after digestion are subjected to high-throughput sequencing [21]. Compared with others, the experimental process of RAD-seq is relatively simple and can be widely sampled throughout the genome without relying on the information of the reference genome [22]. Moreover, RAD-seq can obtain thousands of single nucleotide polymorphism (SNP) loci, making it an economical and effective method to identify large-scale SNPs and reduce genomic complexity and subtype genes [23]. Therefore, the simplified genome sequencing technology of RAD-seq has been reported to solve a series of genomics problems in a variety of organisms and is widely used in the study of genetic evolution, and phylogeny, alongside the species definition of wild populations and non-traditional research species [24,25,26].
Herein, we used RAD-seq to identify a large number of SNP loci from 52 samples of Ribes L., then, constructed phylogenetic relationships and analyzed the gene flow and genetic diversity among Ribes L. species. Furthermore, the evolution of key morphological characters was also traced to verify our classification of Ribes L. This study will provide important information on the classification of different species in this genus, enabling us to develop and utilize its germplasm resources rationally.

2. Results

2.1. RAD-Tag Sequencing and SNP Discovering

In this study, the raw data from 52 Ribes L. samples of 26 species and 4 varieties were filtered, with a total of 86.98 G of clean data obtained. We acquired 590.36 million clean reads by using Illumina HiSeq4000, after removing the low-quality reads (Q score < 20), and ambiguous reads with incorrect barcodes (Table 1). The sequencing quality scores of 20 (Q20), which represent an error rate of 1 in 100, with a corresponding call accuracy of 99%, with all samples at more than 97.72%, indicating that the sequencing quality was good. Of these high-quality reads, the highest reads (22.03 million reads) were detected in Ribes nigrum (D5), and the lowest reads (0.7 million reads) were found in R. pseudofasciculatum (B5), with an average read number of 11.35 million per accession.
A total of 2,451,454 high-quality SNPs were obtained, among them, 2,335,324 and 116,130 SNPs were homozygous and heterozygous, respectively (Table 1). The average number of detected SNPs was 47,713 per accession. The highest number of SNPs (168,263) was detected in Ribes stenocarpum (C5), while the lowest number of SNPs (5048) was detected in R. pseudofasciculatum (B5).

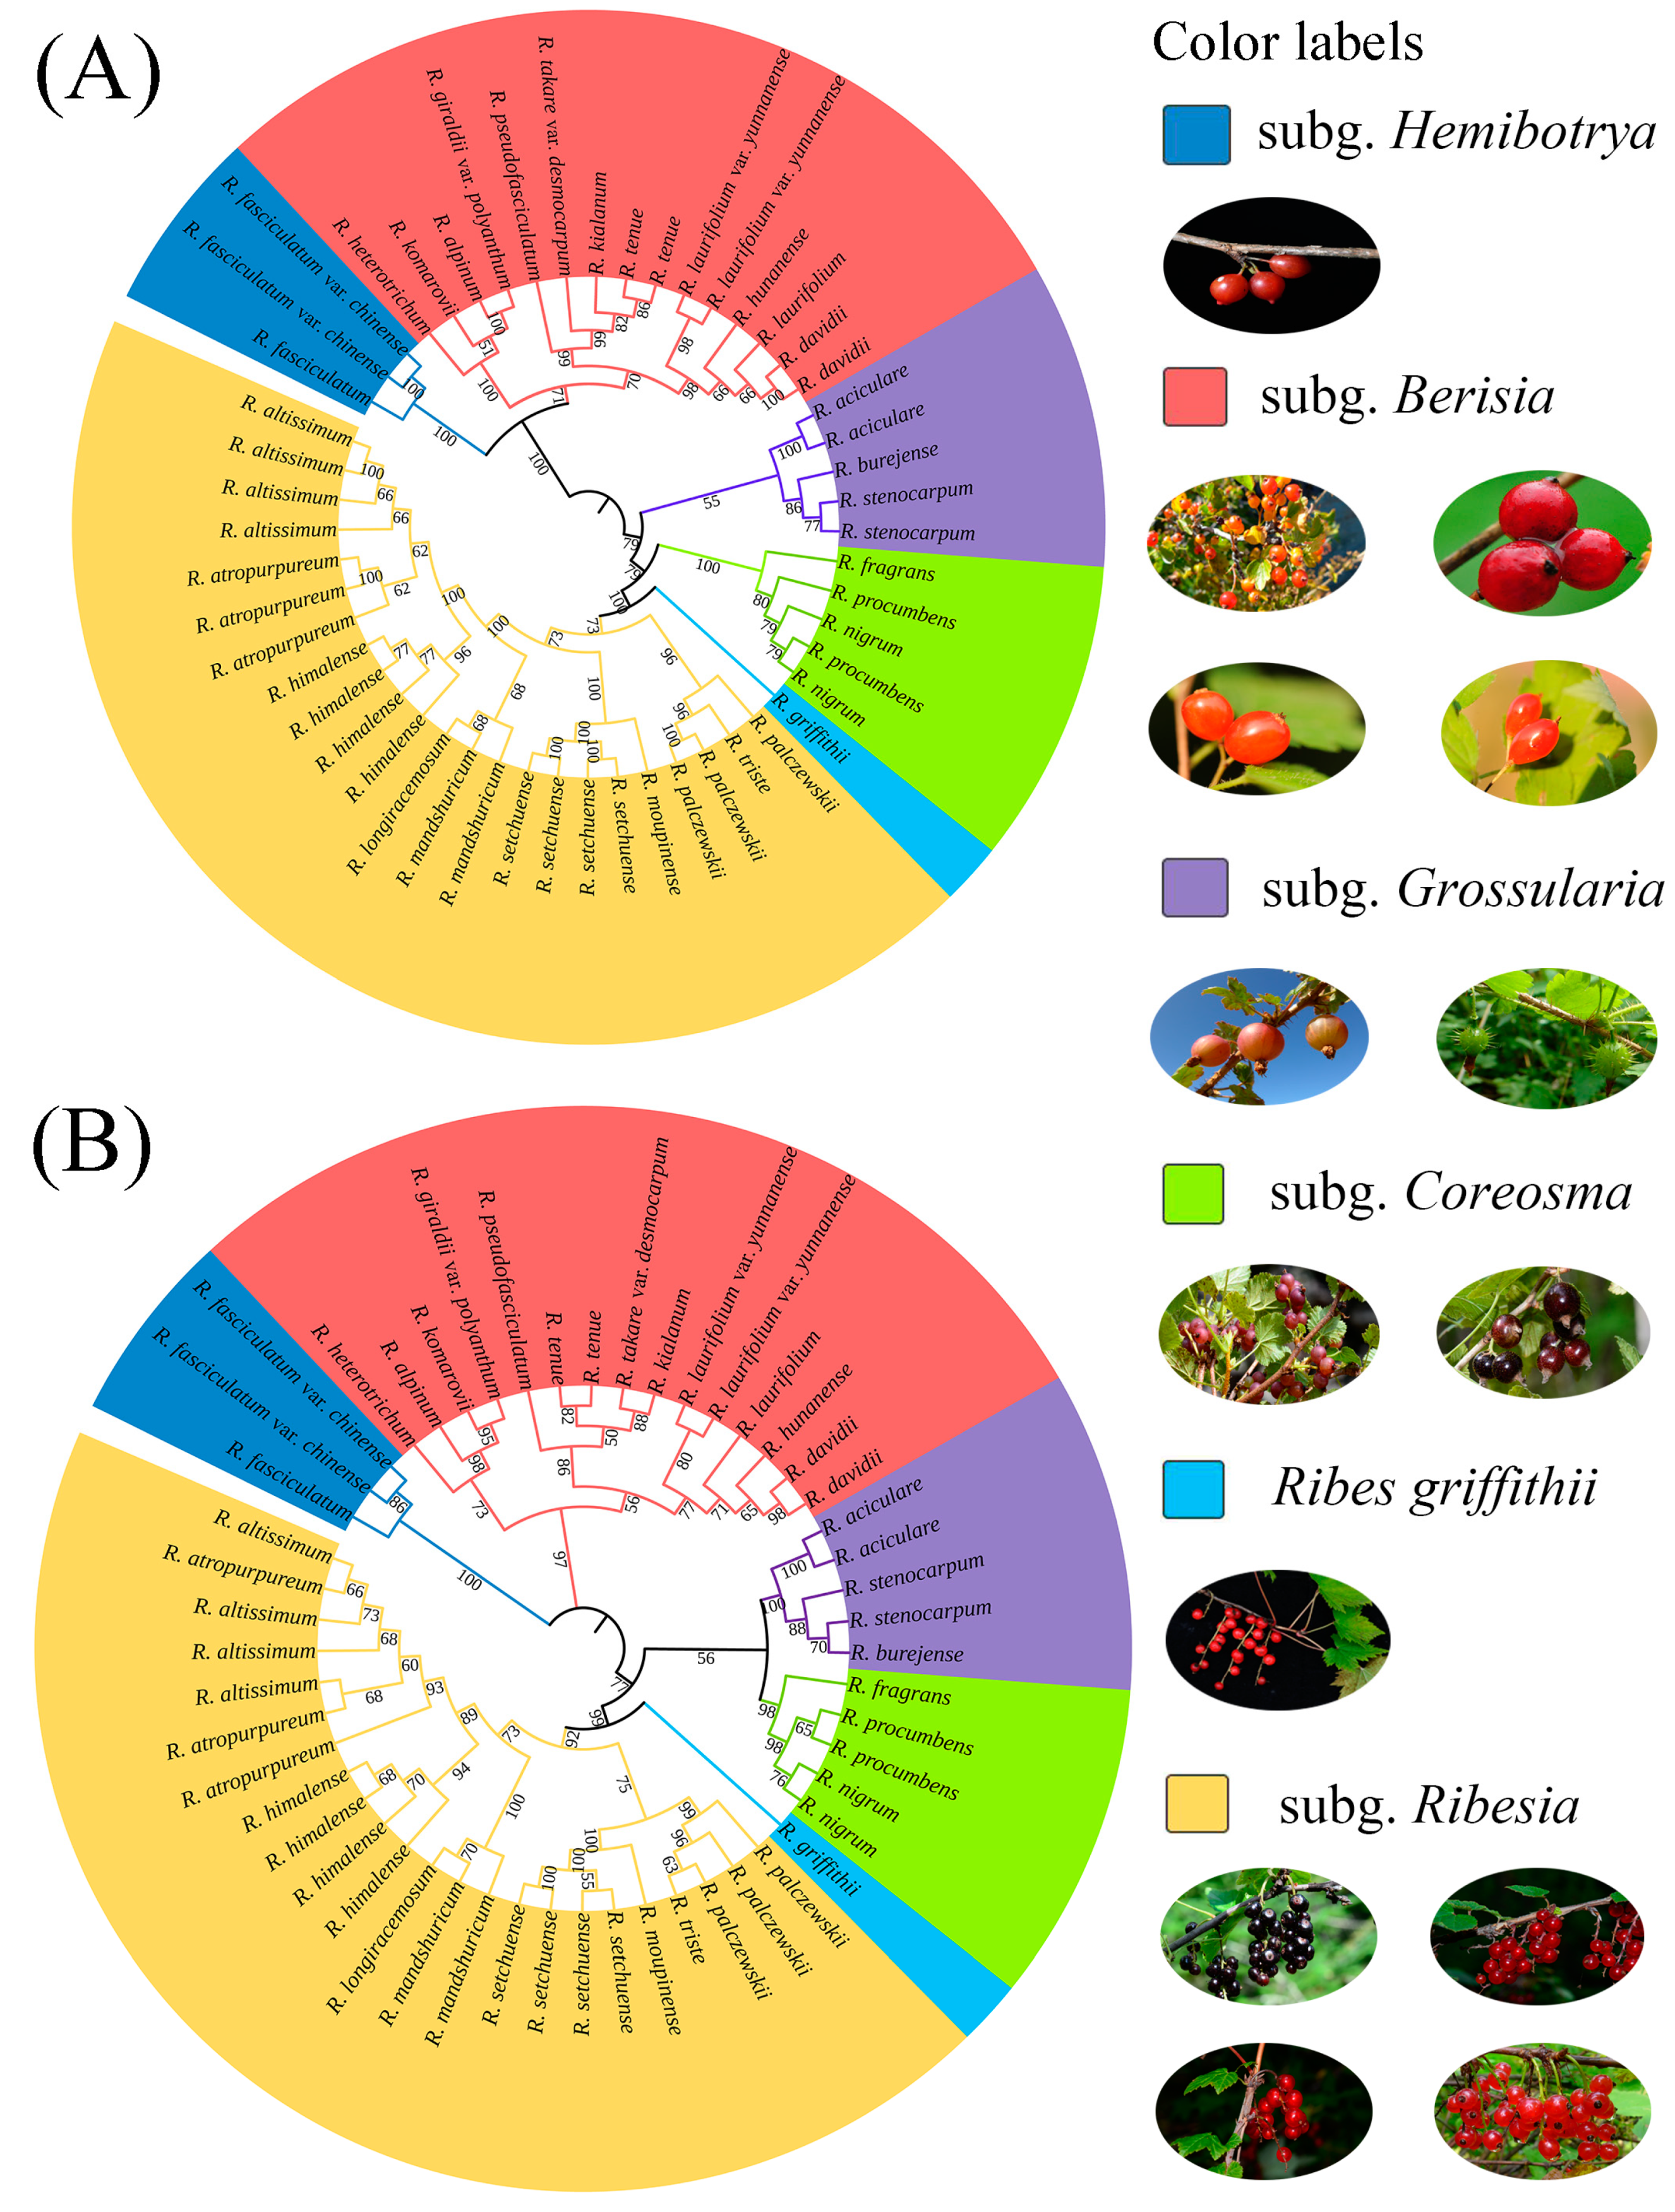
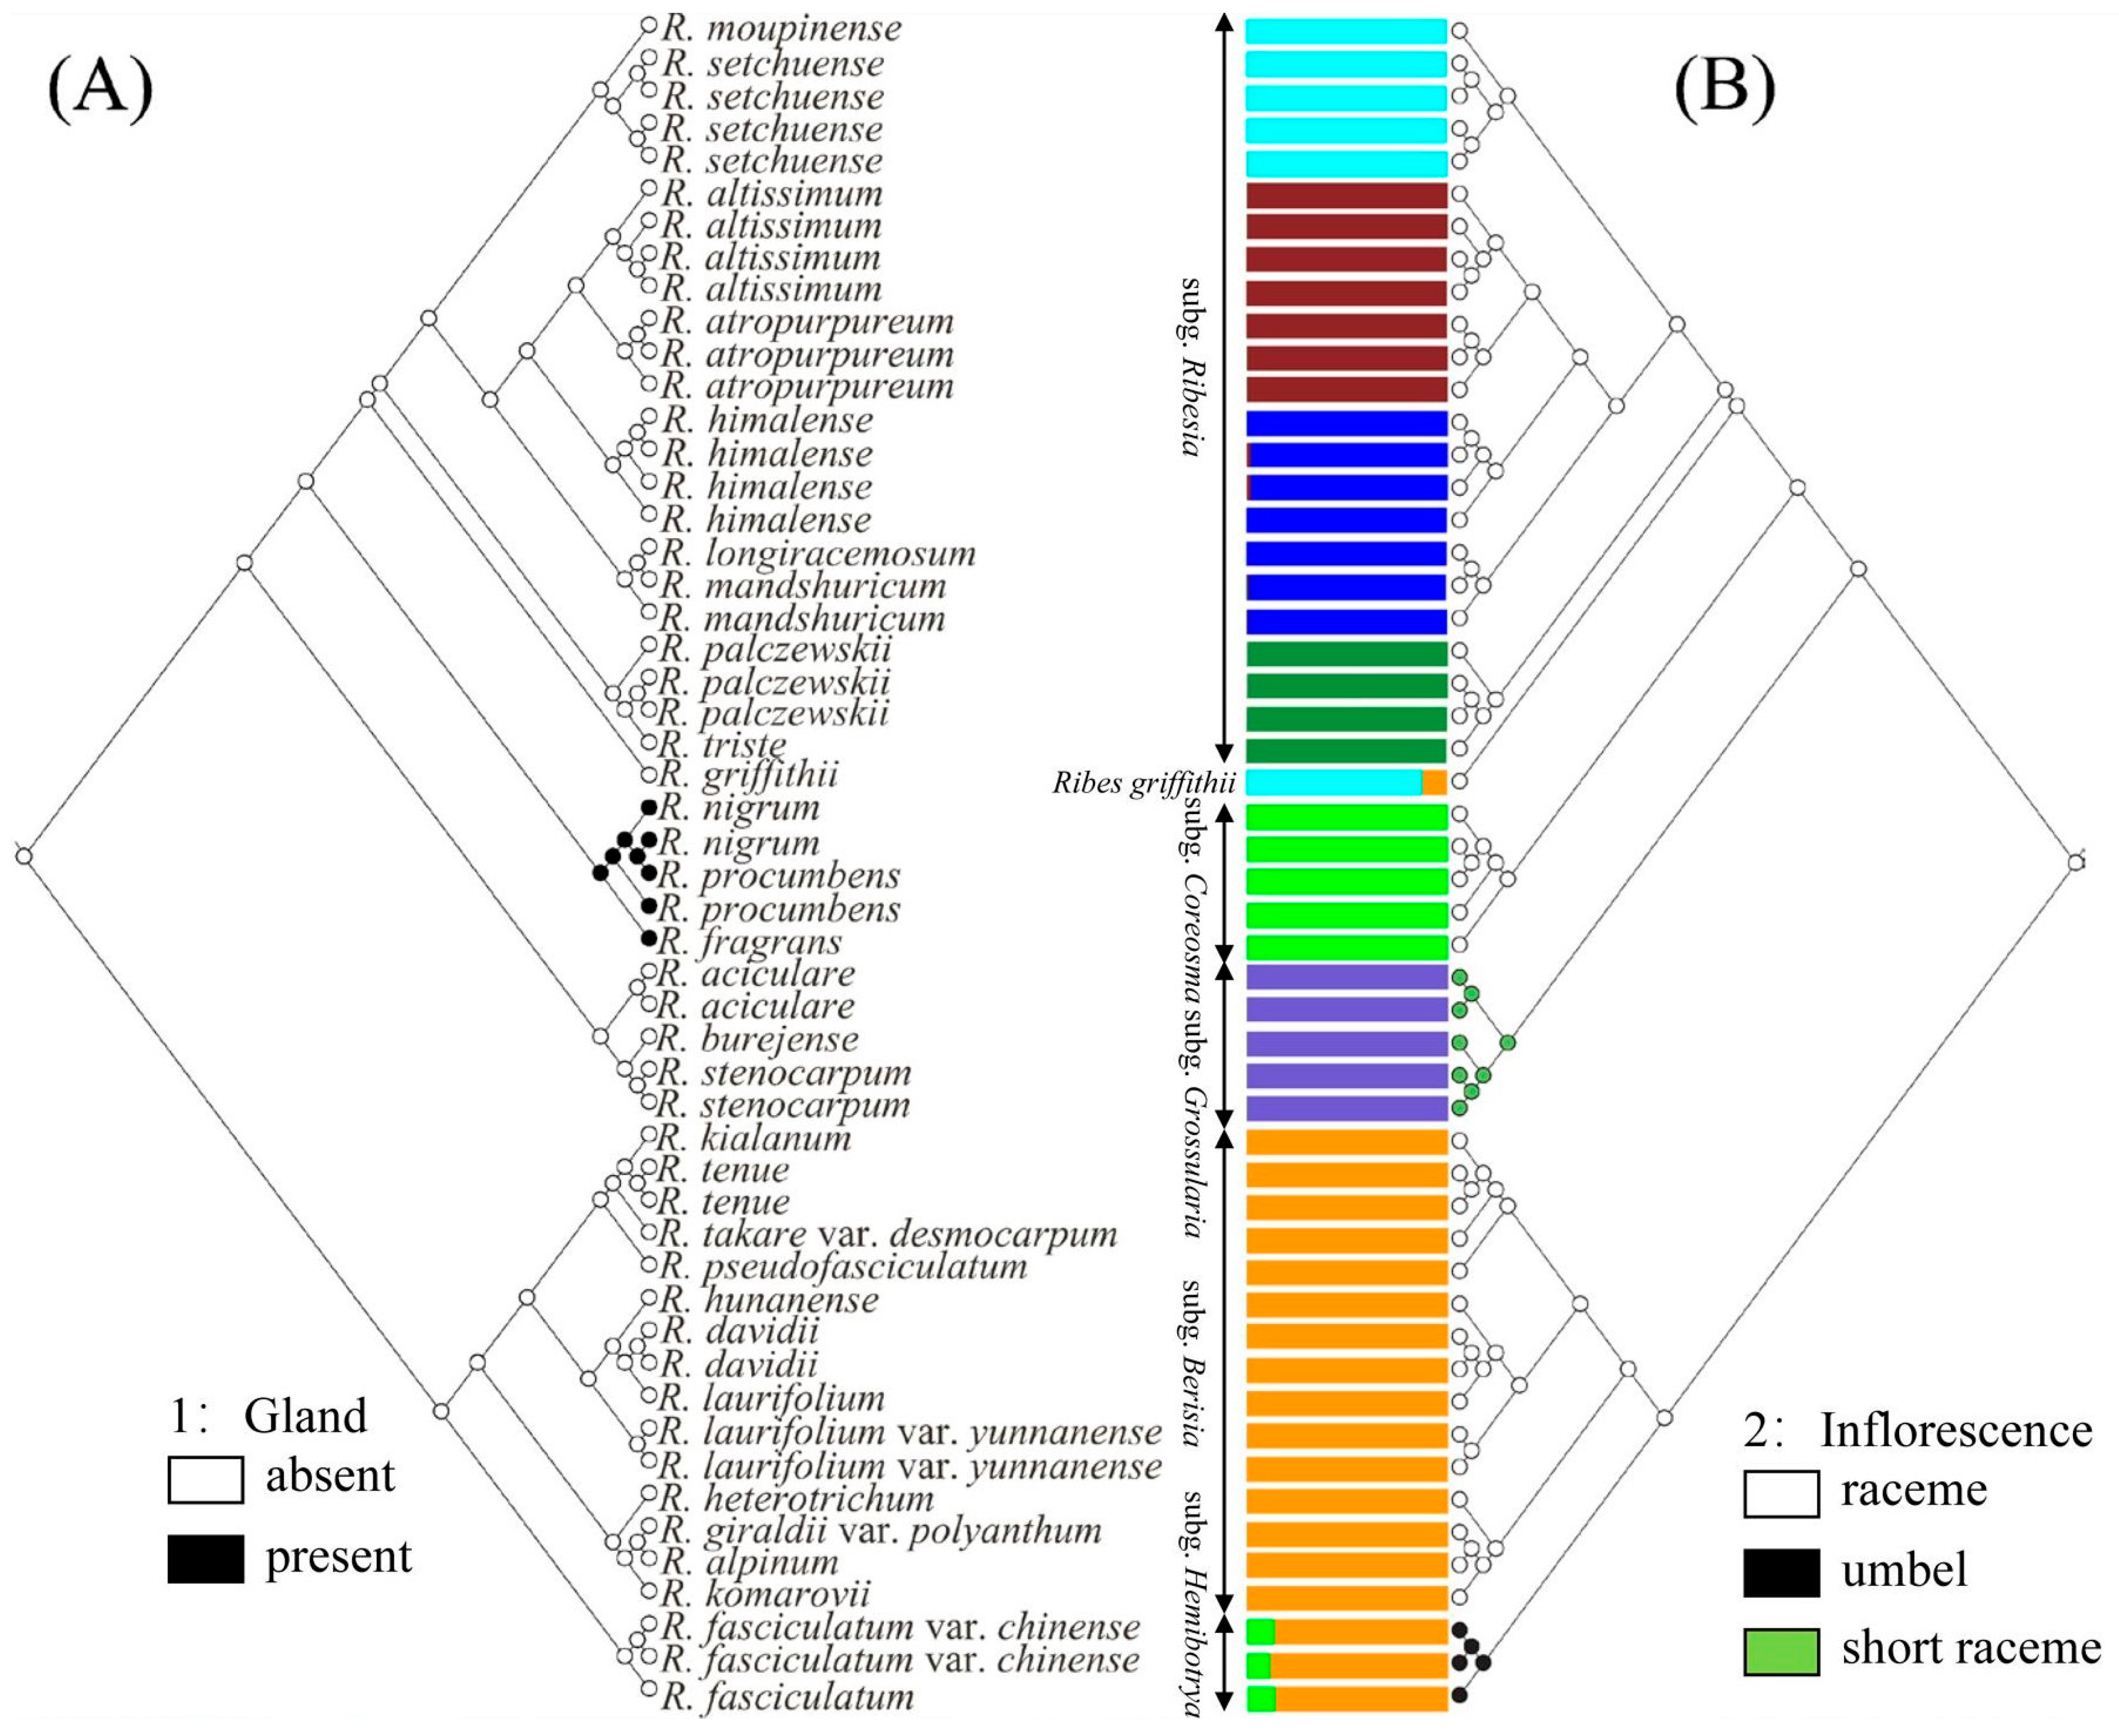
2.2. Phylogenetic Trees and Morphological Characteristics

Two phylogenetic trees of Ribes L. were constructed based on neighbor-joining and maximum likelihood analyses, while almost the same results were obtained. It showed that the 52 samples were clearly divided into two major branches and six subgenera, which correlated with the morphological characteristics (Figure 1). The first branch contained subg. Ribesia, Ribes griffithii Hook. f. et Thoms., subg. Coreosma, and subg. Grossularia, and the second branch contained subg. Berisia, and subg. Hemibotrya. A total of 23 samples representing nine species were clustered into subg. Ribesia, including R. moupinense, R. setchuense, R. altissimum, R. himalense, R. longiracemosum, R. mandshuricum, R. palczewskii, R. triste, and R. atropurpureum. The common morphological characteristics of subg. Ribesia species were having a bisexual flower and a raceme. Previous studies have also classified R. griffithii into subg. Ribesia [2,7]; however, our phylogeny showed that R. griffithii formed a monophyletic clade.
The subg. Coreosma included Ribes nigrum, R. procumbens, and R. fragrans, representing a total of three species (five samples), with common morphological characteristics, such as having bisexual flowers, racemes, glands on the abaxial leaf epidermis, and purple or black fruits. The subg. Grossularia contained R. aciculare, R. burejense, and R. stenocarpum, representing a total of three species (five samples), with common morphological characteristics, such as having thorny branches and inverted sepals.
A total of 15 samples representing 12 species were clustered into subg. Berisia, including Ribes kialanum, R. tenue, R. takare var. desmocarpum, R. pseudofasciculatum, R. hunanense, R. davidii, R. laurifolium, R. laurifolium var. yunnanense, R. heterotrichum, R. giraldii var. polyanthum, R. alpinum, and R. komarovii, with common morphological characteristics such as unisexual flowers and racemes. Among them, the samples of sect. Davidia were clustered on the same subbranch, with common morphological characteristics, such as being evergreen, having unisexual flowers, and having drooping inflorescences. This result was consistent with the clustering of sect. Davidia species into a section of subg. Berisia by Lu [2]. The other branch contained two species of the subg. Hemibotrya, namely R. fasciculatum and R. fasciculatum var. chinense, with common morphological characteristics such as unisexual flowers and umbels.

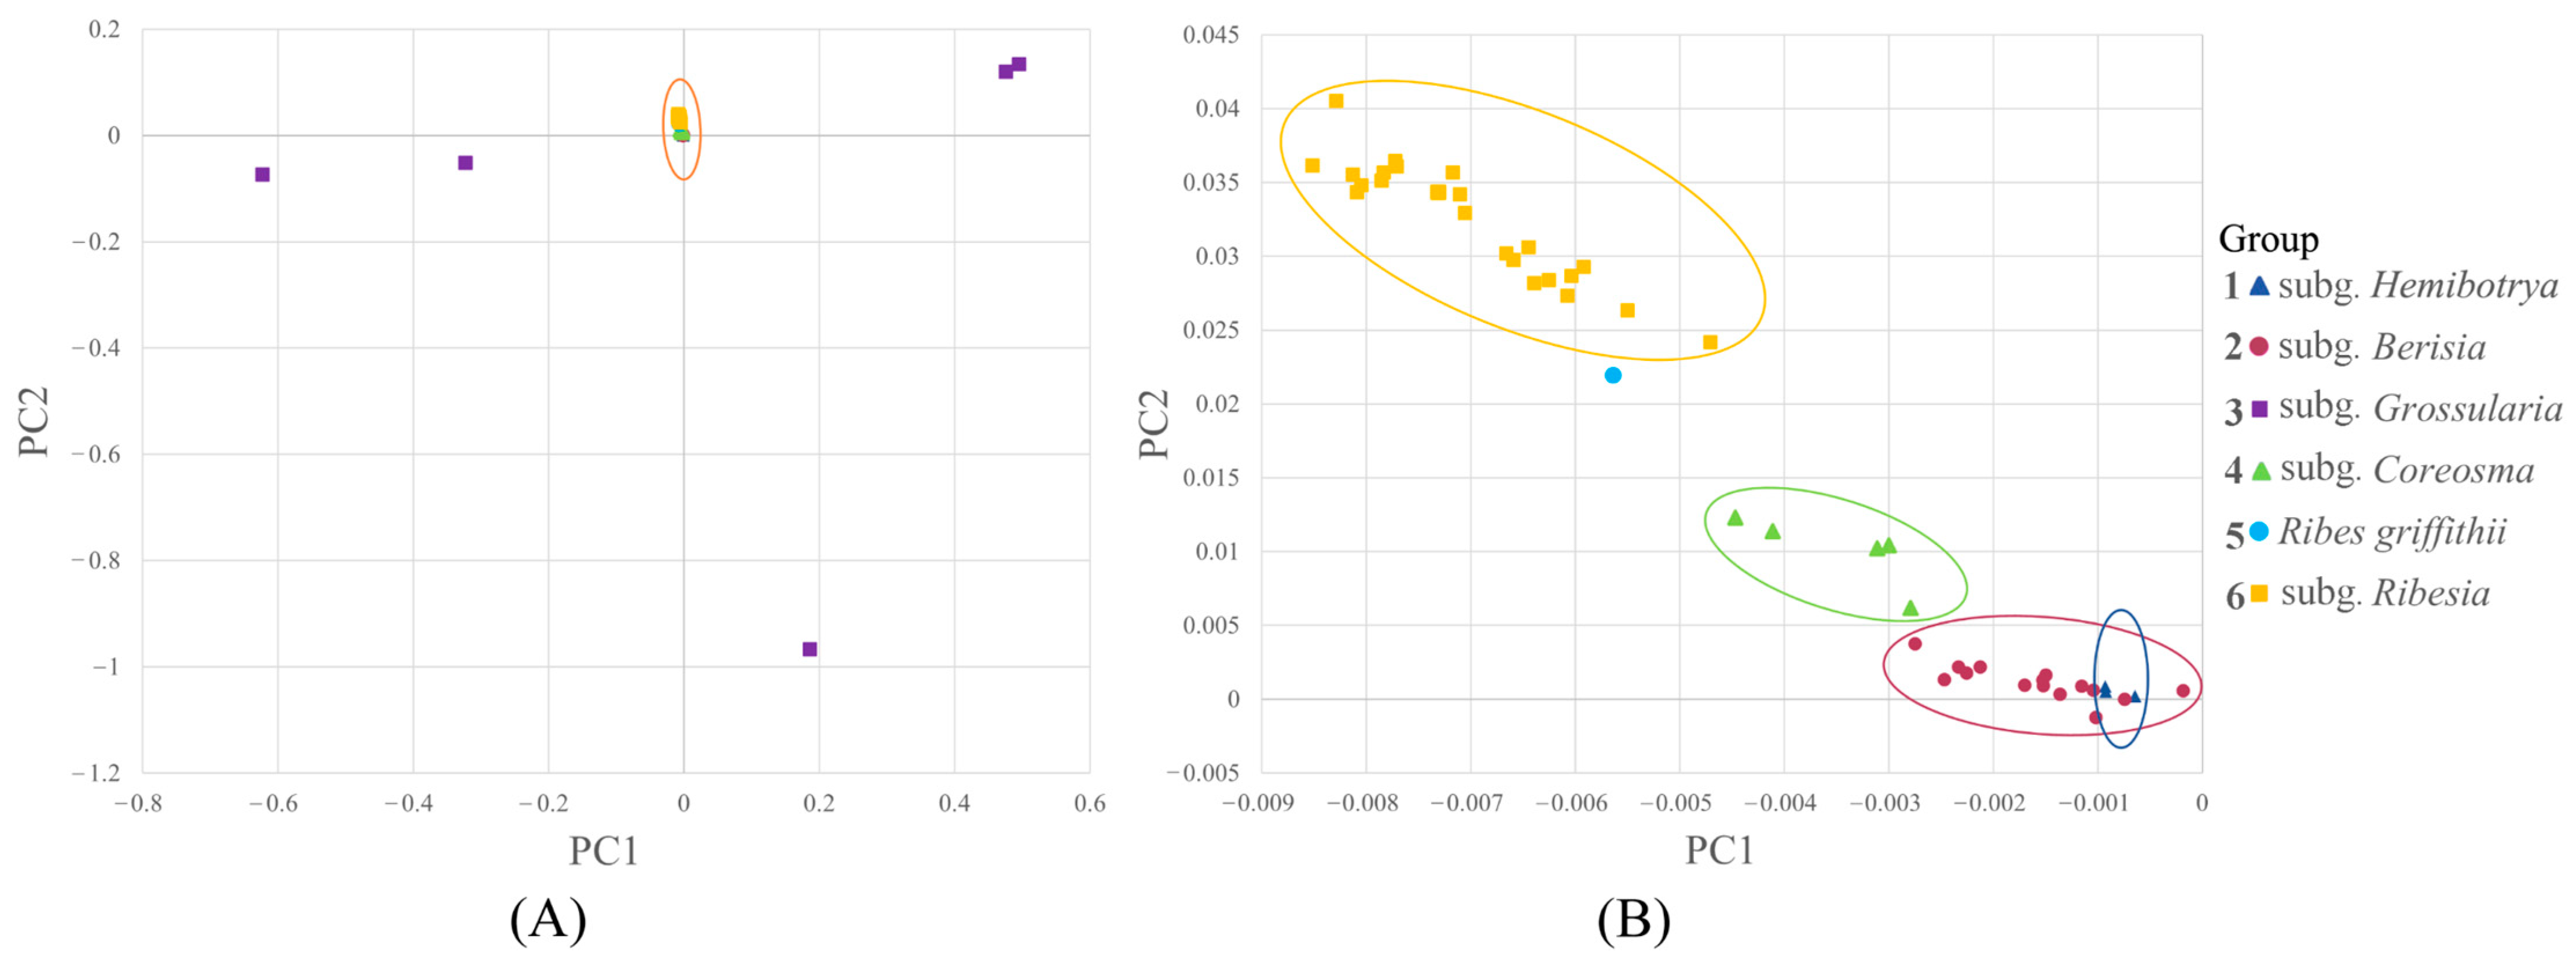
2.3. Principal Component Analysis of Ribes L.

PCA, using the first and second eigenvectors, identified six groups, i.e., subg. Hemibotrya, subg. Berisia, subg. Grossularia, subg. Coreosma, Ribes griffithii and subg. Ribesia, which were consistent with the phylogenetic clades (Figure 2A). Each group was represented by a different color. The 52 Ribes L. samples were clearly divided into two major categories. The PCA plot illustrated that the subg. Grossularia were more disperse than the other groups (Figure 2A).
Each point in the figure represents an individual species. The individual species in each group are well clustered together, showing high consistency. Group 1 consisted of two species of the subg. Hemibotrya, i.e., Ribes fasciculatum var. chinense and R. fasciculatum. Group 2 consisted of 12 species of the subg. Berisia. Group 3 was made up of three species of the subg. Grossularia, namely R. aciculare, R. stenocarpum, and R. burejense. Group 4 consisted of three species of subg. Coreosma, with a total of five samples. Group 5 contained R. griffithii. Group 6 was made up of 10 species of the subg. Ribesia. The subg. Hemibotrya and subg. Berisia clustered closely together (Figure 2B). The PCA analysis indicated that the genetic relationship between subg. Hemibotrya and subg. Berisia was relatively close. R. griffithii, subg. Coreosma, and subg. Ribesia formed three separate groups. The results showed that R. griffithii and subg. Ribesia were relatively separate.

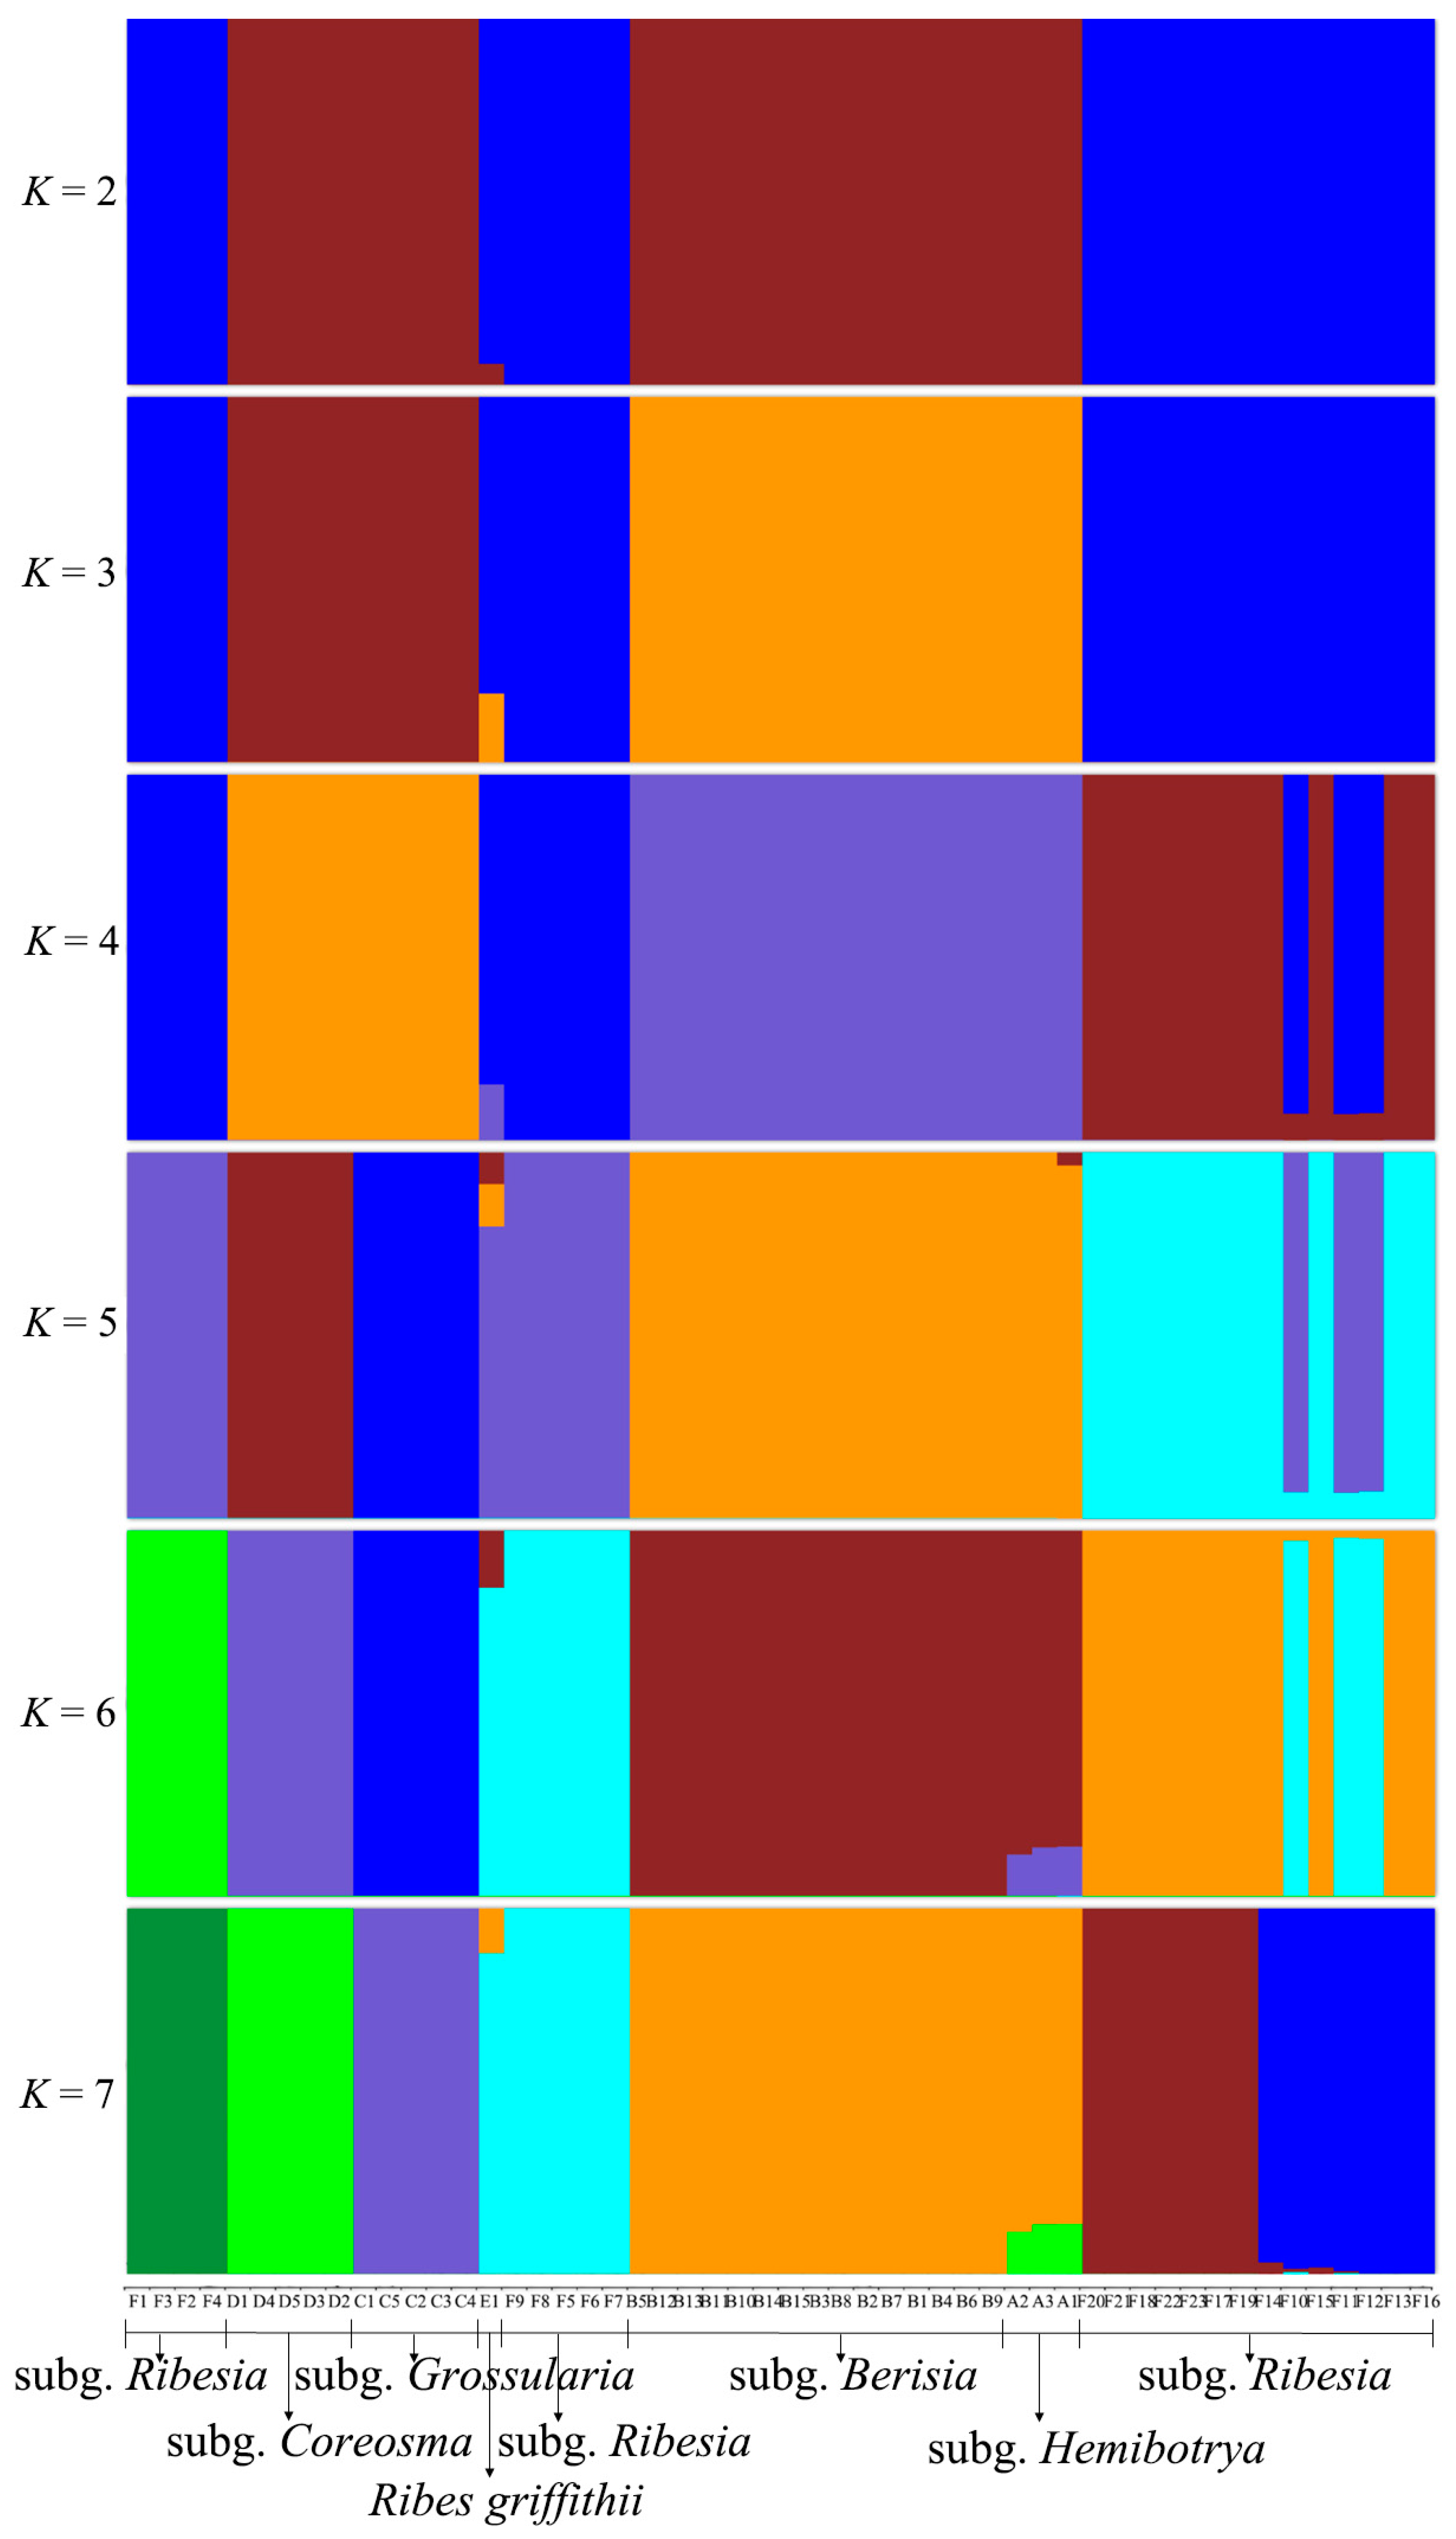
2.4. Population Genetic Structure of Ribes L.

Each group is represented by a different color. The 52 Ribes L. samples were clearly divided into two major categories. The PCA plot illuminated that subg. Grossularia was more dispersed than the other groups (Figure 2A). Through population structure analysis, we could clarify how the Ribes L. species were clustered and, thus, we could understand the individual ancestries of the different species (Figure 3). For K = 2, the 52 Ribes L. samples in the figure were clustered into two categories, and the taxa with a blue background included all the samples from subg. Ribesia. Specifically, Ribes griffithii displayed an admixture of subg. Berisia, while subg. Hemibotrya. R. griffithii had a 5% brown background hybridization, supporting the classification of R. griffithii as a monophyletic clade. The taxa with brown backgrounds were subg. Coreosma, subg. Grossularia, subg. Berisia, and subg. Hemibotrya.
When K = 3, subg. Berisia and subg. Hemibotrya showed different genetic backgrounds from subg. Coreosma and subg. Grossularia, and all the samples were clearly clustered into four groups. At K = 4, hybridization occurred in some samples. For K = 5, Ribes moupinense and R. setchuense showed different pedigree compositions from those of other species in subg. Ribesia. When the K value increased, subg. Coreosma and subg. Berisia were separated, showing an independent genetic background. The optimal value of the population genetic structure analysis was at K = 7, and the ancestral compositions of R. himalense, R. mandshuricum, and R. longiracemosum differed from those of R. altissimum and R. atropurpureum, indicating that the former three species had closer genetic relationships. The results showed that subg. Ribesia has more interspecific hybridization. For K = 7, subg. Hemibotrya was separated from subg. Berisia with the hybridization in contrast to the observations at K = 4. At different K values, subg. Berisia contained a single color, confirming its independent genetic background.

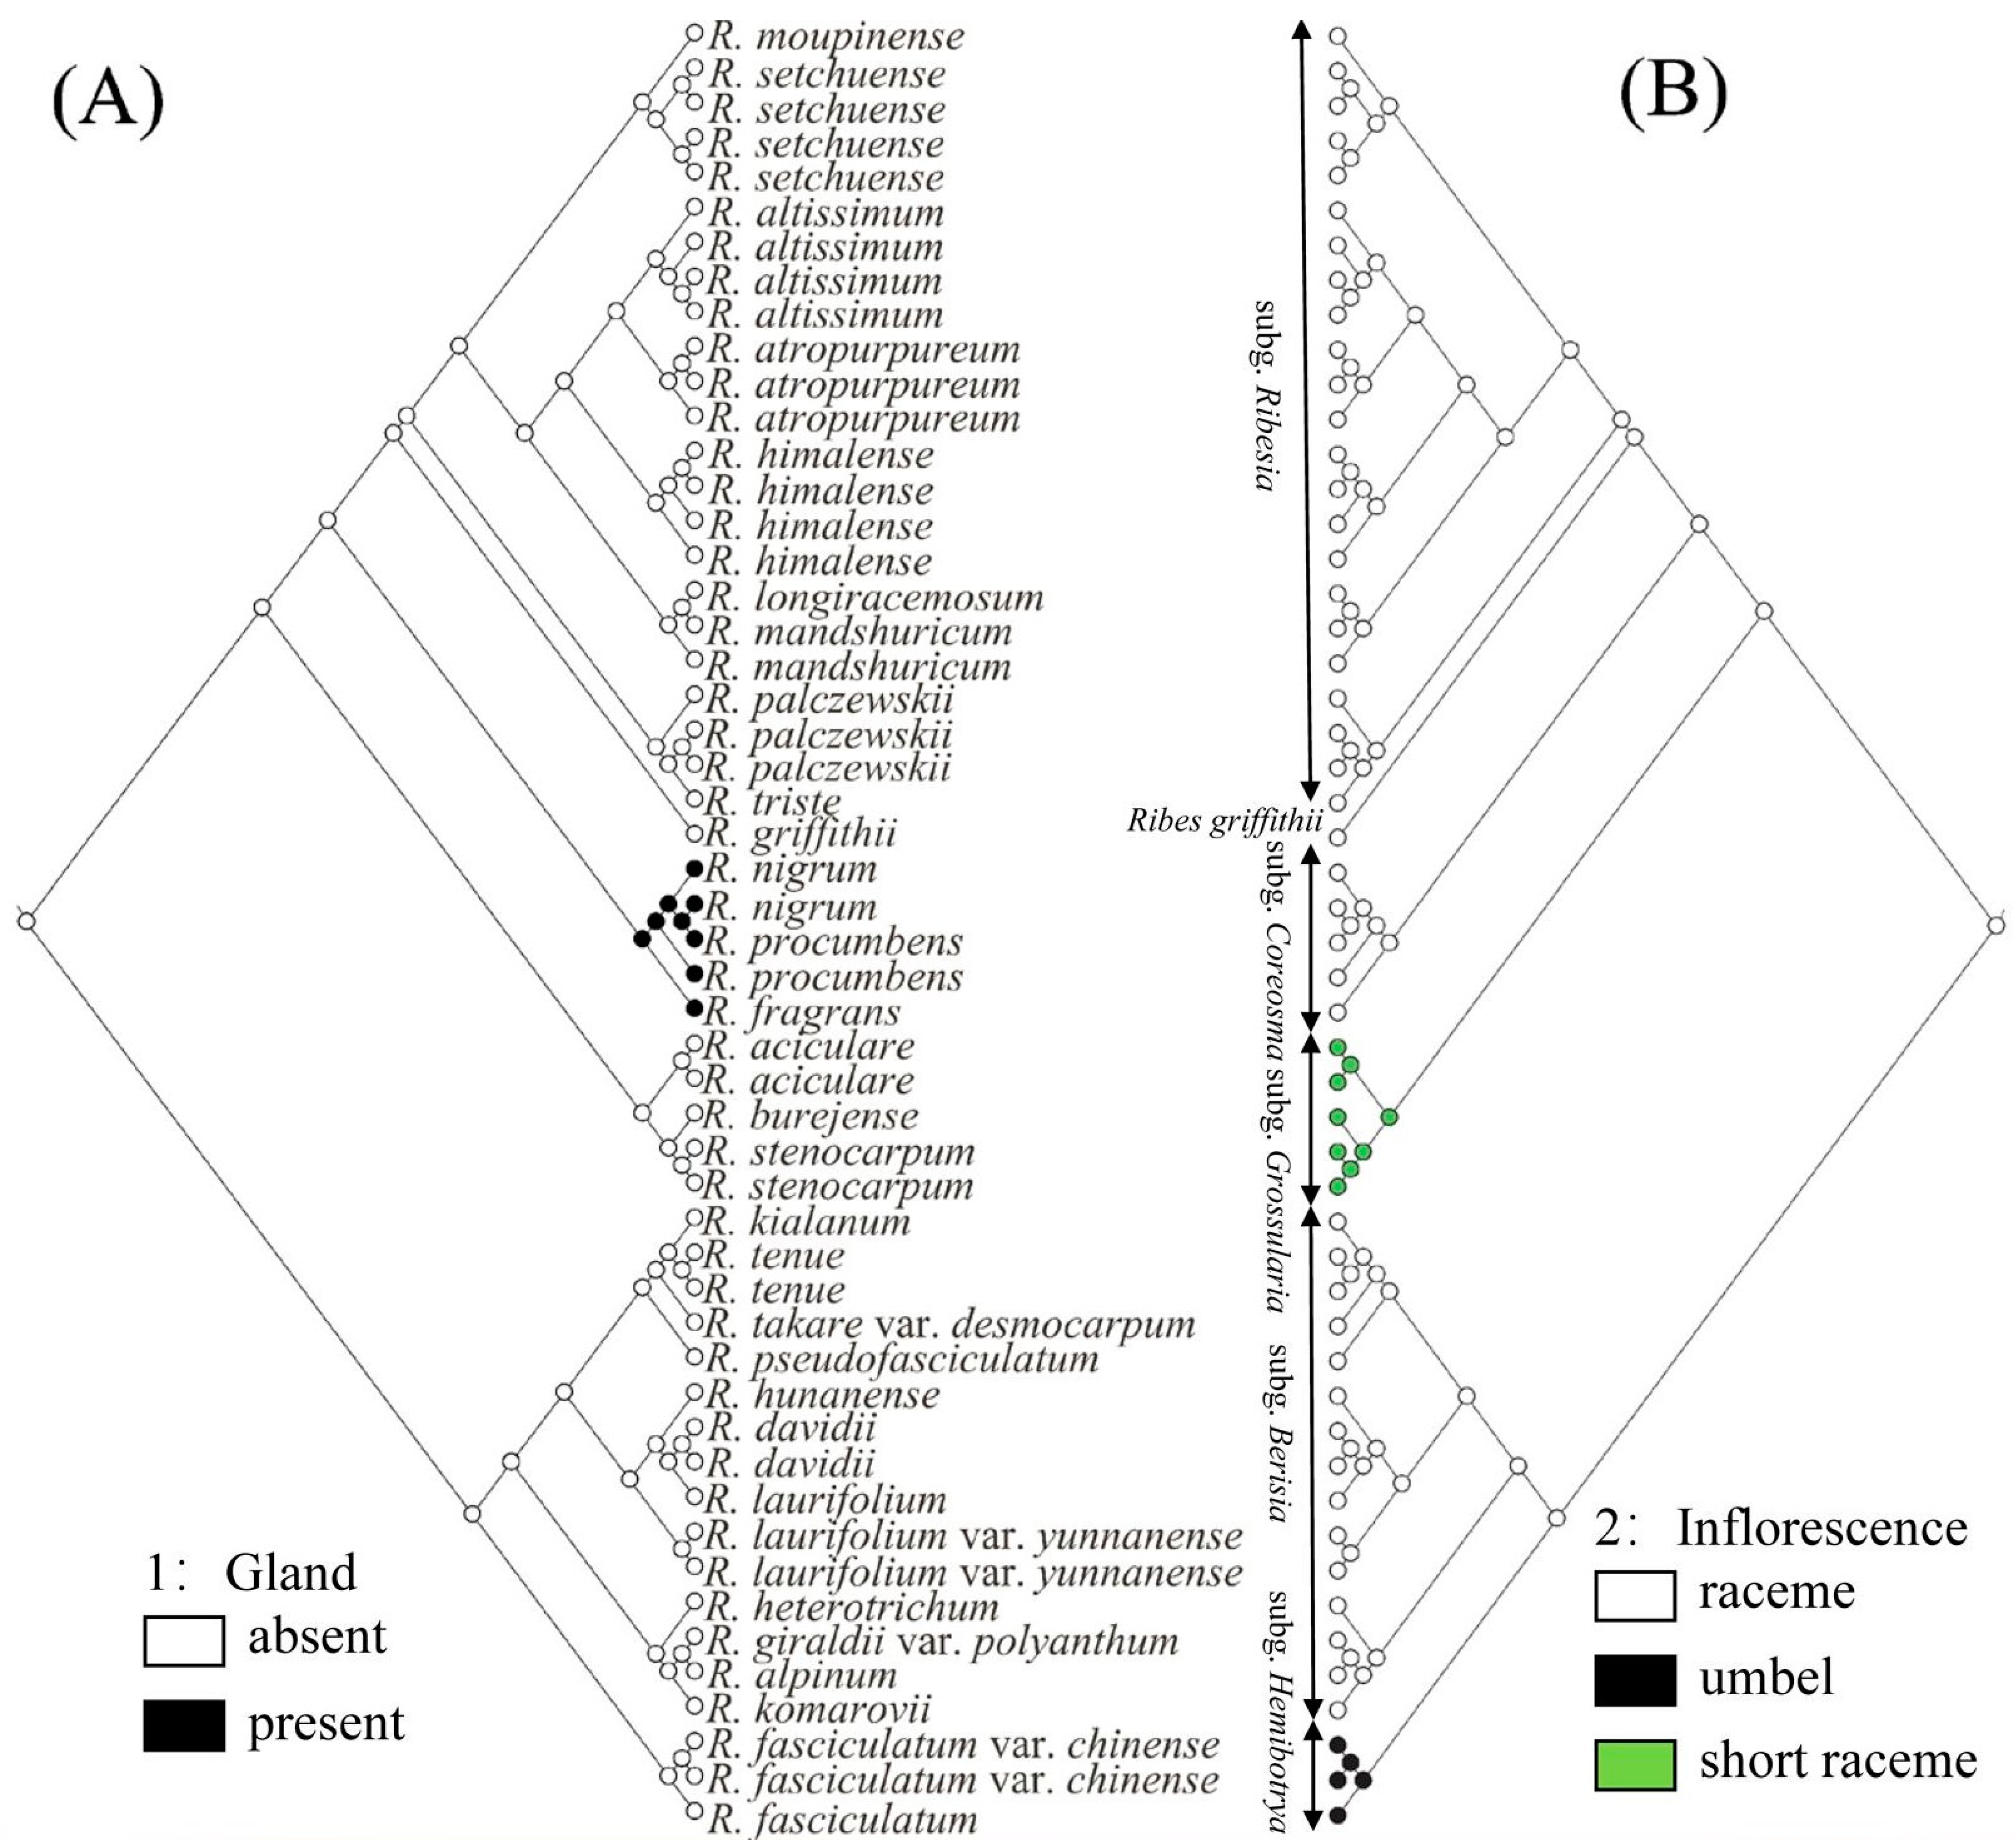
2.5. Ancestral Character Reconstruction

Two key morphological characters of Ribes L. were selected to reconstruct their ancestral characters. As for the glands, we found that the lower leaf surface, calyx, ovary, and fruit of the three species of subg. Coreosma were densely covered with yellow glands, while other subgenus had no glands on the surface of plant bodies. The ancestral state reconstructions (Figure 4A) identified glandless as the most probable ancestral state for each subgenus of Ribes L. (subg. Ribesia: p = 0.99; Ribes griffithii: p = 0.99; subg. Grossularia: p = 0.99; subg. Berisia: p = 0.99; subg. Hemibotrya: p = 0.99). However, the gland state was reconstructed as the present state in the clade of subg. Coreosma (p = 0.99), which was clearly distinguished from the other subgenera. Specifically, glandular morphology of subg. Coreosma transitioned from glandless to gland, while there was no reversion to a glandless state.
The morphological characteristics of subg. Hemibotrya were significantly different from those of subg. Berisia. In terms of inflorescence type (Figure 4B), raceme was reconstructed as the ancestral state of Ribes L. (p = 0.99). Specifically, the inflorescences of three plants in the clade of subg. Grossularia changed from raceme (ancestral state) to short raceme independently (p = 0.98). However, the inflorescences of two plants of subg. Hemibotrya changed from raceme to umbel differently (p = 0.99). Neither subg. Hemibotrya nor subg. Grossularia reverted into the raceme. This indicates that each genus has had a high degree of independence in their own evolutionary history.

3. Discussion

3.1. Phylogenetic Relationships and Taxonomy of Ribes L.

The subgenus classification of Ribes L. has been controversial. Janczewski [6] classified Ribes L. into six subgenera based on the comprehensive analysis of some global morphological traits of Ribes L. Indeed, Berger [8] classified Grossulariaceae into two genera, namely, Ribes L. and Grossularia, and further divided Ribes L. into eight subgenera and Grossularia into four subgenera. Rehder [11] merged subg. Coreosma into subg. Ribesia and subg. Hemibotrya into subg. Berisia, thereby dividing Ribes L. into four subgenera. Weigend [7] classified Ribes L. into seven subgenera based on the morphological and micromorphological characteristics of this genus. Lu [2] clustered Ribes L. in China into four subgenera according to plant morphological characteristics. Huang [27] also divided Ribes L. into four subgenera based on an analysis of the pollen traits for 21 taxa of the genus. In contrast to previous studies, we divided 30 representative Ribes L. species in China into six branches based on phylogenetic trees by RAD-seq (Figure 1). In summary, for the relationships between these species, all three analyses, shown above, demonstrate similar patterns (Figure 2, Figure 3, and Figure 5). Ribes L. was seen to have two large complex taxonomic groups with unisexual or bisexual flowers. In Figure 1, the species with unisexual flowers are clustered into two branches, i.e., subg. Hemibotrya and subg. Berisia, which differ from the conclusions of Lu [2] and Huang [27] since these are based on morphology or micromorphology. We support the viewpoints of Berger [8] and Soltis [1]. We found that three samples of subg. Hemibotrya showed a hybrid genetic background from subg. Berisia and subg. Coreosma, although subg. Hemibotrya was not clustered with subg. Berisia on the phylogenetic trees or in the PCA diagram (Figure 2 and Figure 5). Ribes fasciculatum var. chinense and R. fasciculatum exhibited a different genetic background from other species of subg. Berisia. When K = 5, species of subg. Hemibotrya began to show hybridization. Therefore, we support the classification of subg. Hemibotrya as independent subgenus separate from subg. Berisia.
Huang [27] and Lu [2] allocated the Ser. Nigra species, namely, Ribes procumbens, R. nigrum, and R. fragrans in subg. Ribesia, thereby clustering Ribes L. into four subgenera. Berger [8] and Messinger [13] support placing these three species in subg. Coreosma, an independent subgenus. In addition, we found these three species of Ribes L. were not clustered in the same branch as other subg. Ribesia species (Figure 1 and Figure 2). The genetic structure analysis showed that with the increase in the K value, these three Ribes L. species showed an independent genetic background distinguished from that of other subg. Ribesia species. Based on the results of the phylogenetic analysis, we support placing these three Ribes L. species in subg. Coreosma instead of subg. Ribesia. Lu [2] classified R. griffithii as subg. Ribesia. We found it differed to subg. Ribesia in terms of some important morphological characteristics, including large changes in bract morphology, an oval, or lingual line to lanceolate, bracteoles, nectaries in flowers. Furthermore, we found that R. griffithii was formed by the hybridization of two ancestral populations (Figure 3), which was significantly different from subg. Ribesia. The taxonomic status of R. griffithii in Ribes L. needs to be further studied by expanding the sampling range.
Previous studies have classified gooseberries into the genus Grossularia or subg. Grossularia due to their unique morphological characteristics [7,8]. Our phylogenetic trees showed that Ribes burejense, R. stenocarpum, and R. aciculare in subg. Grossularia have relatively close phylogenetic relationships with subg. Ribesia, R. griffithii, and subg. Coreosma. In the PCA diagram, the five gooseberry samples (C1–C5) exhibited a scattered distribution, with distances far from the samples of other subgenera. The analysis of the population genetic structure showed that the genetic backgrounds of the five samples became independent when K = 5. This result confirmed a very close phylogenetic position and the relationship between them and each subgenus. Based on the above considerations, we are in favor of placing gooseberry plants into subg. Grossularia rather than considering them as an independent genus of Grossularia.

3.2. Gene Exchange Analysis of Ribes L.

China is a primary distribution center of Ribes L. in East Asia, with approximately 59 species and 30 varieties [2]. Its species abundance, with its many endemic species and large-scale overlap of the distribution areas of some species, has led to interspecific gene exchange in plants of the same genus [28]. We found that hybridization in subg. Ribesia is more complex (Figure 3 and Figure 5). When the K value increases, Ribes altissimum and R. atropurpureum had genetic backgrounds that differed from that of other subg Ribesia species and were not hybridized. For K = 5, R. triste and R. palczewskii exhibited a closer phylogenetic relationship, indicating the same ancestral origin. R. mandshuricum occupied three colors: blue, brown, and cyan, indicating a complex pedigree and more gene exchange with other species of Ribes L.
Regarding the Ribesia species, in the previous classification results, Ribes griffithii was placed in subg. Ribesia [2,7]. In Figure 1, R. griffithii and other subg. Ribesia plants were divided into two branches. Population genetic structure showed that hybridization consistently occurred in R. griffithii (Figure 3 and Figure 5). When K = 7, R. griffithii exhibited a histogram composed of two colors, cyan and yellow, and the genetic background of both subg. Berisia (20%) and subg. Ribesia (80%). Therefore, the sample size must be expanded for further analysis of the taxonomic position of R. griffithii.
The histograms corresponding to Ribes fasciculatum and R. fasciculatum var. chinense in subg. Hemibotrya were composed of two colors, green and yellow, indicating that they likely resulted from the hybridization of the two ancestors, subg. Berisia (80%) and subg. Coreosma (20%). This finding also indicated that subg. Hemibotrya should not be merged into subg. Ribesia, confirming the result of the phylogenetic tree (Figure 1). Overall, the pedigrees of subg. Grossularia, subg. Coreosma, and subg. Berisia were relatively pure. The subg. Hemibotrya might be formed by the hybridization of subg. Berisia and subg. Coreosma. The subg. Ribesia presented complex genetic backgrounds and frequent interspecific hybridizations. The three parallel analyses (phylogenetic, principal component, and genetic structure) provided comprehensive molecular evidence regarding the six groups (subg. Ribesia, R. griffithii, subg. Coreosma, subg. Grossularia, subg. Berisia, and subg. Hemibotrya).

3.3. Revision of subg. Hemibotrya

The views on the classification of Ribes fasciculatum and R. fasciculatum var. chinense seemed to differ widely among researchers [2,11]. Initially, they were divided into subg. Berisia, yet were also clearly distinguished from the other species of subg. Berisia because of their morphological characteristics of umbels. Moreover, some researchers had suggested that these two Ribes should be subg. Parilla, separately [6,29]. However, in our study we found that R. fasciculatum and R. fasciculatum var. chinense did not cluster with other species of subg. Berisia (Figure 1 and Figure 2). The genetic structure analysis also showed the interspecific hybridization between these two species, which was different from other species of subg. Berisia (Figure 3 and Figure 5). Furthermore, Figure 4 also shows that the inflorescence type of these two plants had changed from racemes to umbels (p = 0.99).
In addition, Weigend thought that dividing Ribes fasciculatum distributed in East Asia into the subg. Parilla would cause a mixture of species in this subgenus; therefore, suggested that R. fasciculatum should be separated from subg. Parilla [15]. Soltis analyzed the ITS sequences of 66 species of plants in 12 subgenera of Ribes L. and found that R. fasciculatum did not cluster with other species of subg. Berisia [1], which was consistent with our results. Therefore, Soltis supported the independence of R. fasciculatum as a sister species to the other species of subg. Berisia. Combined with the results of this study, we are in favor of the classification of R. fasciculatum and R. fasciculatum var. chinense as a separate subgenus, rather than classifying them into subg. Berisia or subg. Parilla.

4. Materials and Methods

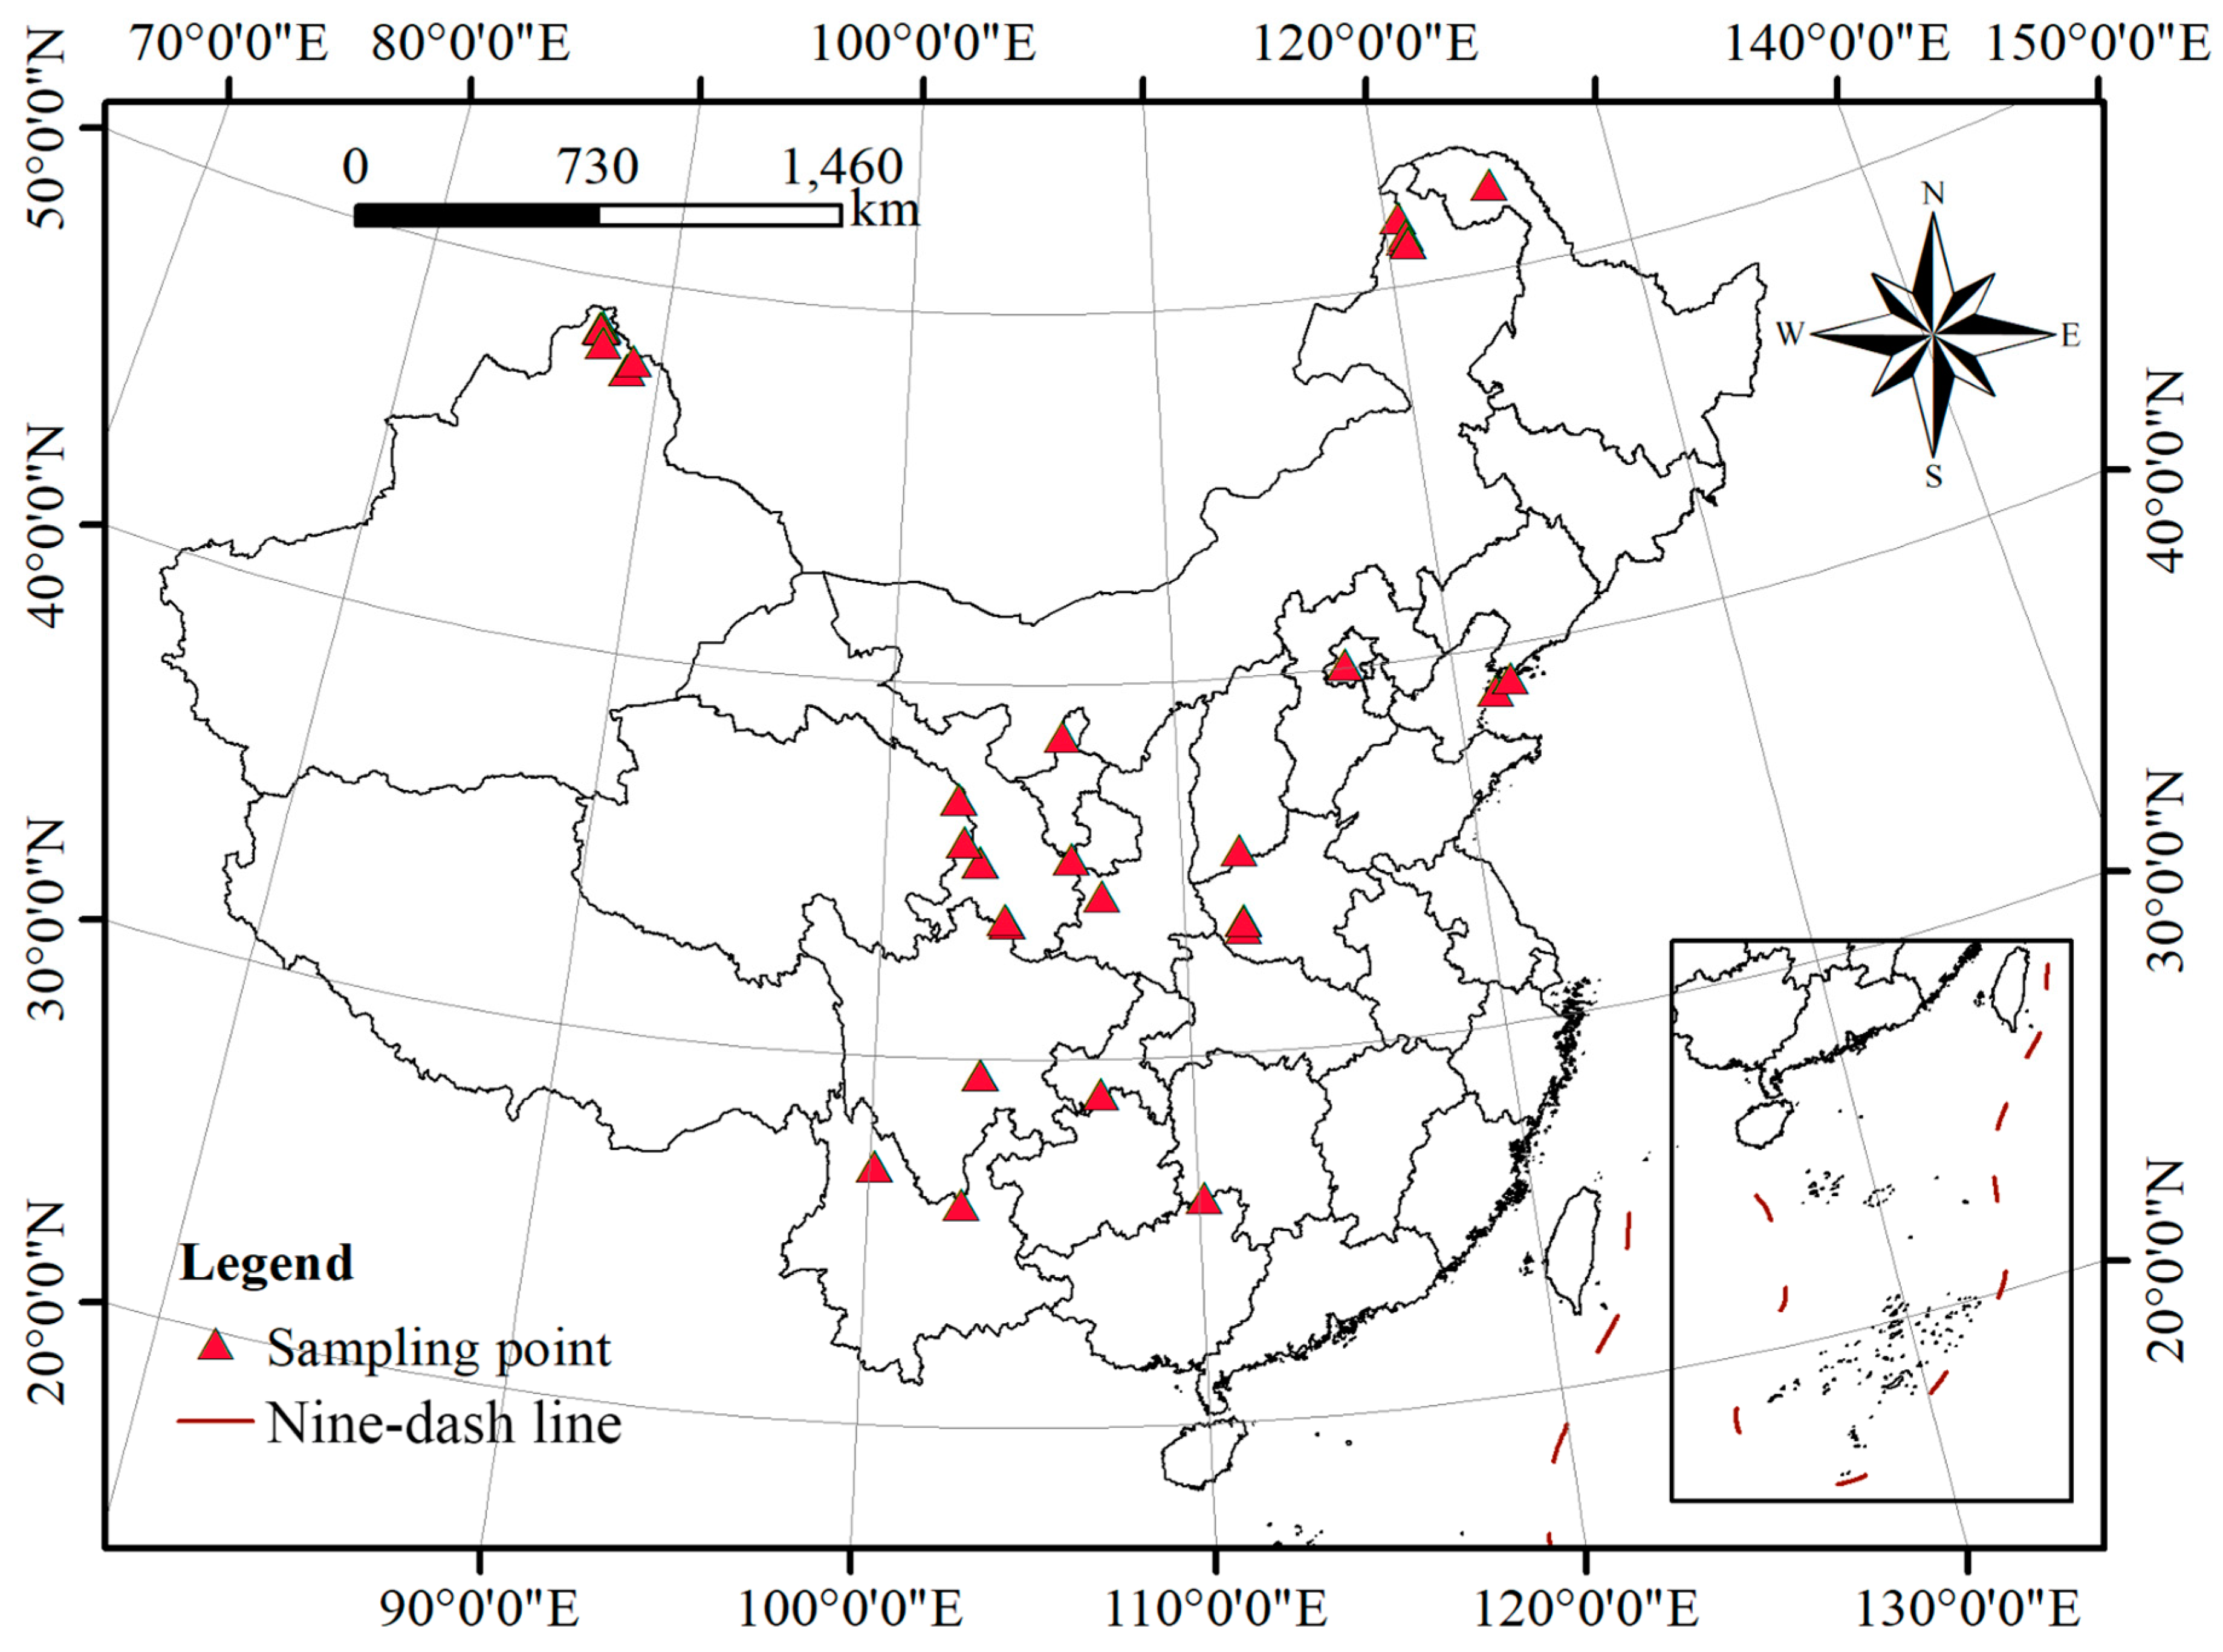
4.1. Plant Materials and DNA Isolation

For this study, we collected 52 representative samples of 30 Ribes L. species from 15 provinces in China (Figure 6 and Table 2). It is worth mentioning that although some species are remote and difficult to collect, the 30 species we collected and analyzed depict nearly all the representative species of each branch in China. The plant names in this study follow the nomenclature of Flora of China [30]. Genomic DNA was extracted using the cetyltrimethylammonium bromide (CTAB) method [31]. Following quality assessment, the DNA concentration was adjusted to 100 ng/μL for RAD-seq library preparation.

4.2. RAD Library Preparation and Sequencing

A reduced representation restriction-associated DNA (RAD) sequencing method was used for library construction following the protocol previously outlined in Zhang et al. [32]. In brief, genomic DNA (1 μg) was digested by EcoRI (New England Biolabs, Ipswich, MA, USA), which recognizes the 5′-GAATTC-3′ sequence. An Illumina P1 adapter containing specific nucleotide barcodes 4–8 bp long was ligated onto the digested DNA. Then, the products from different samples were pooled and randomly fragmented by Covaris E210 (Covaris, Woburn, MA, USA) and selected on an agarose gel of 300–500 bp. The products were purified using a QIAquick PCR Purification Kit. The fragments were end-repaired with an End Repair mix, and then, purified. The repaired DNA was combined with an A-Tailing Mix, then, the Illumina P2 adapters were ligated to the adenylate 3′ ends DNA and followed by purification of the products. Several rounds of PCR amplification with a PCR Primer Cocktail and PCR Master Mix were performed to enrich the adapter-ligated DNA fragments. The PCR products were selected by agarose gel electrophoresis with target fragments and, afterward, purified. The library was qualified using the Agilent Technologies 2100 bioanalyzer and ABI StepOnePlus RealTime PCR System. The qualified libraries were pair-end sequenced on the HiSeq 4000 System (Illumina).

4.3. Quality Filtering and SNP Discovery

Raw sequence reads were segregated by barcodes assigned to individuals and low-quality reads, and those that lacked a correct barcode were removed [33]. The reads were first assigned to each individual by the unambiguous barcodes, and the reads without the unique barcodes were discarded. Reads were quality-filtered by removing the adapter sequences and the reads containing greater than 40% low-quality bases (quality value < 20) [34]. All reads were pooled and used for a de novo assembly and SNP calling in ustacks (STACKS v2.55 software pipeline) [35]. We set a minimum stack size of five reads (−m) and a maximum distance between stacks (−M) within a locus as two.

4.4. Phylogenetic Analysis

To construct the phylogenetic trees, the genetic distances between the different accessions were calculated based on the high-confidence SNPs extracted from the RAD data. The p-distance, defined as Dij, between two accessions (i and j), was calculated using the following equation [36]:
D i j = i = 1 L d i j ( l ) / L
where L is the length of regions where high-quality SNPs were identified, and dij was defined as d i j ( l ) = 0 if the genotypes at position l for the two accessions were AA and AA, d i j ( l ) = 0.5 if the genotypes at position l were AC and AC (or AA and AC), and d i j ( l ) = 1 if the genotypes at position l were AA and CC. Neighbor-joining and maximum likelihood phylogenetic trees were constructed by Treebest software, and bootstrap replicates were set to 1000 [28].
The maximum likelihood (ML) tree was constructed using MEGA 5.0 [37] with ultra-fast bootstrap analysis of 1000 replicates. After comparing all the models, JC model was selected as the best-fit substitution model by model selection implemented in MEGA [38].

4.5. Principle Component Analysis

Principle component analysis (PCA) was performed using EIGENSOFT based on the SNP dataset [39]. The decomposition of the eigenvectors from the covariance matrix was performed with the R function Eigen, and the significances of the eigenvectors were further investigated with Tracy–Widom tests, using the twstats program in the Eigensoft package.

4.6. Genetic Structure Analysis

We identified the population genetic structures using ADMIXTURE 1.3 [40]. We first assumed that the value of ancestral origin is K [41]. The difference in the K value indicated whether different individuals have the same genetic background and whether the ancestral components are consistent between them. In the analysis of the population genetic structure, each individual was a column of histograms in the figure, and color differences were used to indicate the ancestral composition of different individuals. Individuals with the same color evolved from the same genetic background, and different color ratios of two individuals indicated that the pedigree compositions of the two individuals were different. If a sample always comprised a single color, then, it indicated that there was no hybridization in the sample. Conversely, if a sample comprised multiple colors, then this individual was likely to be a hybrid of several ancestral subpopulations [42]. The individual ancestry proportion was calculated 10,000 times from a given number of inferred populations (K) based on the maximum likelihood algorithm. The K values were set from two to seven.
ADMIXTURE 1.3 is a calculation method based on the Bayesian model [43]. Cross-validation error will be generated for each K value simulation result. The minimum value of cross-validation error corresponds to the optimal K value, and the fitting result at this time is closest to the real situation of the population [44].

4.7. Ancestral State Reconstruction of Morphological Characters

In this study, we selected two important taxonomic characters of interest, reported in previous studies [2,29], for ancestral state reconstruction over molecular phylogeny. We traced the evolution of two important characters of Ribes L.: 1. Gland: (0) absent (1) present; 2. Inflorescence: (0) raceme (1) umbel; (2) short raceme. The character states were optimized onto the tree generated from the RAD-seq dataset in Mesquite v. 2.73 [45] using the maximum likelihood criterion with the Markov k-state one-parameter (Mk1) model [46].

5. Conclusions

Our study revealed the genetic relationships of Ribes L. species in China by RAD-seq, with a total of 2,451,454 SNPs obtained from 30 species of Ribes L. Thus, these 30 species were divided into six branches, i.e., six subgenera, which were not fully consistent with the traditional phenetic sectional division of the genus. Our study was in favor of the separation of subg. Coreosma from subg. Ribesia and subg. Hemibotrya from subg. Berisia. Moreover, the results supported subg. Grossularia as an independent subgenus. Likewise, the subg. Grossularia, subg. Hemibotrya, subg. Coreosma, and subg. Berisia were verified as monophyletic groups by analyzing the genetic relationships and backgrounds of each subgenus. The subg. Ribesia had a more complex genetic background, with frequent interspecific hybridizations. Ribes griffithii, which originally belonged to subg. Ribesia, had a hybrid genetic background. However, the sample size must be expanded for further validation of the rationale to upgrade R. griffithii to an independent subgenus.

Author Contributions

Conceptualization, B.Z. (Baoshan Zhang); Methodology, B.Z. (Baojiang Zheng) and Z.X.; Resources, B.Z. (Baojiang Zheng); Data curation, Z.Y.; Writing—original draft, B.Z. (Baoshan Zhang); Writing—review & editing, B.Z. (Baoshan Zhang) and B.Z. (Baojiang Zheng); Visualization, B.Z. (Baoshan Zhang) and B.Z. (Baojiang Zheng); Supervision, B.Z. (Baojiang Zheng). All authors have read and agreed to the published version of the manuscript.

Funding

This study was supported by the Fundamental Research Funds for the Central Universities (2572017EA06).

Institutional Review Board Statement

The study did not require ethical approval.

Informed Consent Statement

Not applicable.

Data Availability Statement

Not applicable.

Acknowledgments

We acknowledge all the researchers who helped with the sampling.

Conflicts of Interest

The authors declare no conflict of interest.

References

  1. Soltis, S.D.E. Phylogenetic Relationships in Ribes (Grossulariaceae) Inferred from ITS Sequence Data. Taxon 2003, 52, 51–66. [Google Scholar] [CrossRef]
  2. Lu, L.T. A Study on The Genus Ribes L. in China. Acta Phytotaxon. Sin. 1995, 33, 58–75. [Google Scholar]
  3. Hummer, K.E.; Dale, A. Horticulture of Ribes. For. Pathol. 2010, 40, 251–263. [Google Scholar] [CrossRef]
  4. Lyashenko, S.; Gonzalez-Fernandez, M.J.; Gomez-Mercado, F.; Yunusova, S.; Denisenko, O.; Guil-Guerrero, J.L. Ribes taxa: A promising source of gamma-linolenic acid-rich functional oils. Food Chem. 2019, 301, 125309. [Google Scholar] [CrossRef] [PubMed]
  5. Masierowska, M. Early Floral Resources for Urban Bees From Ornamental Shrubs Ribes Aureum, Ribes Sanguineum and Staphylea Pinnata. J. Apic. Sci. 2020, 64, 309–320. [Google Scholar] [CrossRef]
  6. de Janczewski, E. Monographie des groseilliers, Ribes L. Mémoires Société Phys. d’Hist. Nat. Genève 1907, 35, 199–517. [Google Scholar]
  7. Weigend, M. Grossulariaceae. In Flowering Plants. Eudicots; Springer: Berlin/Heidelberg, Germany, 2007; pp. 168–176. [Google Scholar]
  8. Berger, A. A taxonomic review of currants and gooseberries. Agric. Exp. Stn. 1924, 1, 35–38. [Google Scholar]
  9. Sinnott, Q.P. A revision of Ribes L. subg. Grossularia (Mill.) Pers. Sect. Grossularia (Mill.) Nutt. (Grossulariaceae) in North America. Rhodora 1985, 87, 189–286. [Google Scholar]
  10. Rehder, A. Manual of Cultivated Trees and Shrubs; MacMillan: New York, NY, USA, 1951. [Google Scholar]
  11. Rehder, A. Manual of Cultivated Trees And Shrubs. Taxon 1927, 27, 424. [Google Scholar] [CrossRef]
  12. Zheng, B.J.; Li, G.X. Morphological observation of vessel elements in secondary xylem of Ribes. J. Beijing For. Univ. 2015, 37, 11. [Google Scholar] [CrossRef]
  13. Messinger, W.; Hummer, K.; Liston, A. Ribes (Grossulariaceae) phylogeny as indicated by restriction-site polymorphisms of PCR-amplified chloroplast DNA. Plant Syst. Evol. 1999, 217, 185–195. [Google Scholar] [CrossRef]
  14. Pikunova, A.V.; Martirosian, E.V.; Kniazev, S.D.; Ryzhova, N.N. Application of the RAPD-analysis for the study of genetic polymorphism and phylogenetic relationships in the Ribes L. genus. Russ. J. Genet. Appl. Res. 2012, 2, 141–151. [Google Scholar] [CrossRef]
  15. Weigend, M.; Mohr, O.; Motley, T.J. Phylogeny and classification of the genus Ribes (Grossulariaceae) based on 5S-NTS sequences and morphological and anatomical data. Bot. Jahrbücher 2002, 124, 163–182. [Google Scholar] [CrossRef]
  16. Schultheis, L.M.; Donoghue, M.J. Molecular phylogeny and biogeography of Ribes (Grossulariaceae), with an emphasis on gooseberries (subg. Grossularia). Syst. Bot. 2004, 29, 77–96. [Google Scholar] [CrossRef]
  17. Pan, L.; Zheng, B.J. Extraction of Genomic DNA from Ribes and Establishment of ITS-PCR Reaction Systems. J. Northeast For. Univ. 2012, 40, 41–43. [Google Scholar] [CrossRef]
  18. Liu, H.; Xue, Q.; Huang, W.; Tan, R. Comparative Analysis and Classification of Genus Ribes Based on the Secondary Structure of ITS2 Sequences. J. South-Cent. Univ. Natl. (Nat. Sci. Ed.) 2018, 37, 46–51. [Google Scholar]
  19. Huang, Y.; Liu, H.Y.; Xing, Y.Z. Next-Generation Sequencing Promoted the Release of Reference Genomes and Discovered Genome Evolution in Cereal Crops. Curr. Issues Mol. Biol. 2017, 27, 37–50. [Google Scholar] [CrossRef]
  20. Davey, J.W.; Blaxter, M.L. RADSeq: Next-generation population genetics. Brief. Funct. Genom. 2010, 9, 416–423. [Google Scholar] [CrossRef]
  21. Cruaud, A.; Gautier, M.; Galan, M.; Foucaud, J.; Sauné, L.; Genson, G.; Dubois, E.; Nidelet, S.; Deuve, T.; Rasplus, J.Y. Empirical assessment of RAD sequencing for interspecific phylogeny. Mol. Biol. Evol. 2014, 31, 1272–1274. [Google Scholar] [CrossRef]
  22. Zhu, J.Y. RAD-seq and its application in entomological research. Acta Entomol. Sin. 2016, 59, 767–774. [Google Scholar] [CrossRef]
  23. Miller, M.R.; Dunham, J.P.; Amores, A.; Cresko, W.A.; Johnson, E.A. Rapid and cost-effective polymorphism identification and genotyping using restriction site associated DNA (RAD) markers. Genome Res. 2007, 17, 240–248. [Google Scholar] [CrossRef]
  24. Wang, X.Q.; Ye, X.Y.; Zhao, L.; Li, D.Z.; Guo, Z.H.; Zhuang, H.F. Genome-wide RAD sequencing data provide unprecedented resolution of the phylogeny of temperate bamboos (Poaceae: Bambusoideae). Sci. Rep. 2017, 7, 11546. [Google Scholar] [CrossRef] [PubMed]
  25. Nagano, Y.; Mimura, T.; Kotoda, N.; Matsumoto, R.; Nagano, A.J.; Honjo, M.N.; Kudoh, H.; Yamamoto, M. Phylogenetic relationships of Aurantioideae (Rutaceae) based on RAD-Seq. Tree Genet. Genom. 2018, 14, 6. [Google Scholar] [CrossRef]
  26. Léveillé-Bourret, É.; Chen, B.H.; Garon-Labrecque, M.; Ford, B.A.; Starr, J.R. RAD sequencing resolves the phylogeny, taxonomy and biogeography of Trichophoreae despite a recent rapid radiation (Cyperaceae). Mol. Phylogent. Evol. 2020, 145, 106727. [Google Scholar] [CrossRef] [PubMed]
  27. Huang, P.H. Pollen Morphology of Ribes L. and its Taxonomic Significance. Acta Phytotaxon. Sin. 1989, 27, 378–385. [Google Scholar]
  28. Yang, H.; Wei, C.L.; Liu, H.W.; Wu, J.L.; Li, Z.G.; Zhang, L.; Jian, J.B.; Li, Y.Y.; Tai, Y.L.; Zhang, J. Genetic divergence between Camellia sinensis and its wild relatives revealed via genome-wide SNPs from RAD sequencing. PLoS ONE 2016, 11, e0151424. [Google Scholar] [CrossRef] [Green Version]
  29. Wang, M.J.; Zhao, Q.L.; Li, X.Y.; Zheng, B.J. Leaf Epidermal Morphology and Taxonomic Significance of 12 Ribes L. Species. Bull. Bot. Res. 2018, 38, 490–496. [Google Scholar] [CrossRef]
  30. Wu, Z.Y.; Raven, P. Flora of China; Science Press: Beijing, China, 1994. [Google Scholar]
  31. Doyle, J. DNA protocols for plants. In Molecular Techniques in Taxonomy; Springer: Berlin/Heidelberg, Germany, 1991; pp. 283–293. [Google Scholar]
  32. Zhang, Q.; Li, L.T.; VanBuren, R.; Liu, Y.L.; Yang, M.; Xu, L.M.; Bowers, J.E.; Zhong, C.H.; Han, Y.P.; Li, S.H. Optimization of linkage mapping strategy and construction of a high-density American lotus linkage map. BMC Genom. 2014, 15, 372. [Google Scholar] [CrossRef] [PubMed]
  33. Liu, N.; Guo, J.B.; Zhou, X.J.; Wu, B.; Huang, L.; Luo, H.Y.; Chen, Y.N.; Chen, W.G.; Lei, Y.; Huang, Y. High-resolution mapping of a major and consensus quantitative trait locus for oil content to a ~0.8-Mb region on chromosome A08 in peanut (Arachis hypogaea L.). Theor. Appl. Genet. 2020, 133, 37–49. [Google Scholar] [CrossRef] [PubMed]
  34. Guo, Y.; Yang, G.Q.; Chen, Y.M.; Li, D.Z.; Guo, Z.H. A comparison of different methods for preserving plant molecular materials and the effect of degraded DNA on ddRAD sequencing. Plant Divers. 2018, 40, 106–116. [Google Scholar] [CrossRef]
  35. Rochette, N.C.; Rivera-Colón, A.G.; Catchen, J.M. Stacks 2: Analytical methods for paired-end sequencing improve RADseq-based population genomics. Mol. Ecol. 2019, 28, 4737–4754. [Google Scholar] [CrossRef] [PubMed]
  36. Saitou, N.; Nei, M. The neighbor-joining method: A new method for reconstructing phylogenetic trees. Mol. Biol. Evol. 1987, 4, 406–425. [Google Scholar] [CrossRef] [PubMed]
  37. Hall, B.G. Building Phylogenetic Trees from Molecular Data with MEGA. Mol. Biol. Evol. 2013, 30, 1229–1235. [Google Scholar] [CrossRef] [PubMed]
  38. Tamura, K.; Peterson, D.; Peterson, N.; Stecher, G.; Nei, M.; Kumar, S. MEGA5: Molecular Evolutionary Genetics Analysis Using Maximum Likelihood, Evolutionary Distance, and Maximum Parsimony Methods. Mol. Biol. Evol. 2011, 28, 2731–2739. [Google Scholar] [CrossRef]
  39. Patterson, N.; Price, A.L.; Reich, D. Population structure and eigenanalysis. PLoS Genet. 2006, 2, 2074–2093. [Google Scholar] [CrossRef]
  40. Blackburn, H.; Krehbiel, B.; Ericsson, S.; Wilson, C.; Caetano, A.; Paiva, S. A fine structure genetic analysis evaluating ecoregional adaptability of a Bos taurus breed (Hereford). PLoS ONE 2017, 12, e0176474. [Google Scholar] [CrossRef] [Green Version]
  41. Evanno, G.; Regnaut, S.; Goudet, J. Detecting the number of clusters of individuals using the software STRUCTURE: A simulation study. Mol. Ecol. 2005, 14, 2611–2620. [Google Scholar] [CrossRef]
  42. Xia, Q.Y.; Guo, Y.R.; Zhang, Z.; Li, D.; Xuan, Z.L.; Li, Z.; Dai, F.Y.; Li, Y.R.; Cheng, D.J.; Li, R.Q.; et al. Complete Resequencing of 40 Genomes Reveals Domestication Events and Genes in Silkworm (Bombyx). Science 2009, 326, 433–436. [Google Scholar] [CrossRef]
  43. Derazmahalleh, S.M.; Mardi, M.; Zeinalabedini, M.; Kazemi, M.; Marashi, S.; Malekzadeh, S.; Khayam Nekoui, S.; Roodbar Shojaie, T.; Kolahi Zenoozi, S. The survey of genetic diversity and population structure analysis of iranian sweet pomegranate (Punica granatum L.) germplasm using SSR markers. Acta Hortic. 2013, 976, 271–276. [Google Scholar] [CrossRef]
  44. Sanchez-Quinto, F.; Botigue, L.R.; Civit, S.; Arenas, C.; Avila-Arcos, M.C.; Bustamante, C.D.; Comas, D.; Lalueza-Fox, C. North African Populations Carry the Signature of Admixture with Neandertals. PLoS ONE 2012, 7, e47765. [Google Scholar] [CrossRef]
  45. Maddison, W.P. Mesquite: A modular system for evolutionary analysis. Evolution 2008, 62, 1103–1118. [Google Scholar] [CrossRef]
  46. Lewis, P.O. A likelihood approach to inferring phylogeny from discrete morphological characters. Syst. Biol. 2001, 50, 913–925. [Google Scholar] [CrossRef] [PubMed] [Green Version]
Figure 1. Neighbor-joining phylogenetic tree (A) and maximum likelihood phylogenetic tree (B) were reconstructed with bootstrap values calculated through 1000 iterations based on 2,451,454 identified SNPs. The numbers on the branches are the related bootstrap supports. Dark blue—subg. Hemibotrya, red—subg. Berisia, purple—subg. Grossularia, green—subg. Coreosma, light blue—Ribes griffithii, yellow—subg. Ribesia.
Plants 12 00829 g001
Figure 2. (A) Principal component analysis of 30 Ribes L. species. (B) Principal component analysis of 27 Ribes L. species.
Plants 12 00829 g002
Figure 3. The genetic structure of 52 Ribes L. samples. Different ancestral populations are distinguished by different colors. Each individual is a column of histograms in the figure, and the difference in color is used to indicate the ancestral composition of different individuals.
Plants 12 00829 g003
Figure 4. Ancestral state reconstructions for (A) gland and (B) inflorescence based on the Mk1 model of the neighbor-joining tree. The corresponding color keys identify extant possible ancestral character states. Pie diagrams at internal nodes indicate the relative probabilities for each alternative state.
Plants 12 00829 g004
Figure 5. Combination figure of genetic structure, phylogenetic tree, and ancestral morphological reconstruction of 52 samples based on RAD-seq. Reconstruction of ancestral states for (A) gland and (B) inflorescence using Mesquite. The corresponding colour identify extant possible ancestral character states, which is consistent with Figure 3. Each individual is a column of histograms in the figure, and the difference in colour is used to indicate the ancestral composition of different individuals.
Plants 12 00829 g005
Figure 6. Ribes L. sampling sites in China.
Plants 12 00829 g006
Table 1. The clean reads number, Q20, homo SNPs, hete SNPs, and total SNPs for Ribes L. samples were measured by RAD-seq and their corresponding code, scientific name.
CodeScientific NameClean Reads Number (M)Q20 (%)Homo SNPsHete SNPsTotal SNPs
A1Ribes fasciculatum7.6898.0618,16926418,433
A2Ribes fasciculatum var. chinense10.5698.0823,18932223,511
A3Ribes fasciculatum var. chinense14.2698.0125,60957726,186
B1Ribes heterotrichum6.229830,02855430,582
B2Ribes komarovii17.297.8933,55879734,355
B3Ribes alpinum8.3897.9626,14383226,975
B4Ribes giraldii var. polyanthum4.3298.0325,38449625,880
B5Ribes pseudofasciculatum0.797.9849826650,48
B6Ribes takare var. desmocarpum14.9797.8633,61366234,275
B7Ribes kialanum6.9598.1829,73062730,357
B8Ribes tenue9.3497.8225,16452325,687
B9Ribes tenue12.4798.133,33284334,175
B10Ribes laurifolium var. yunnanense9.6297.8921,56131321,874
B11Ribes laurifolium var. yunnanense10.6598.0223,17536823,543
B12Ribes hunanense10.4198.1725,95943126,390
B13Ribes laurifolium6.9698.0218,36724318,610
B14Ribes davidii7.6698.0118,56030118,861
B15Ribes davidii9.7697.9723,03460523,639
C1Ribes aciculare10.8397.84127,63314,111141,744
C2Ribes aciculare9.9797.94126,95512,425139,380
C3Ribes burejense15.7997.84142,70613,211155,917
C4Ribes stenocarpum2.0798.01141,70910,065151,774
C5Ribes stenocarpum18.3697.89144,65623,607168,263
D1Ribes fragrans11.898.1245,922157847,500
D2Ribes procumbens19.0798.0738,844255441,398
D3Ribes nigrum8.5898.1436,776100937,785
D4Ribes procumbens12.3998.1442,188139443,582
D5Ribes nigrum22.0397.9847,442160149,043
E1Ribes griffithii8.5298.1840,36784941,216
F1Ribes palczewskii9.3398.0542,553103643,589
F2Ribes tenue11.7298.1443,108139944,507
F3Ribes palczewskii9.5298.0641,924111443,038
F4Ribes palczewskii21.2997.9445,801159047,391
F5Ribes moupinense7.5798.1640,29180541,096
F6Ribes setchuense12.0497.8742,788112043,908
F7Ribes setchuense15.7597.8943,072110044,172
F8Ribes setchuense14.197.9444,005136545,370
F9Ribes setchuense6.4997.7236,22274136,963
F10Ribes mandshuricum14.3597.8544,773107845,851
F11Ribes mandshuricum15.0198.1645,07498846,062
F12Ribes longiracemosum9.8598.0736,47963137,110
F13Ribes himalense11.2197.8535,86980136,670
F14Ribes himalense6.0298.0339,63383440,467
F15Ribes himalense15.9298.0745,382118546,567
F16Ribes himalense15.0398.0637,40494738,351
F17Ribes atropurpureum12.429843,556124444,800
F18Ribes atropurpureum13.998.0644,863124046,103
F19Ribes atropurpureum10.9398.0242,549125443,803
F20Ribes altissimum6.9698.1434,22072134,941
F21Ribes altissimum14.7897.7342,454123243,686
F22Ribes altissimum14.1798.0644,704127645,980
F23Ribes altissimum14.4898.0743,845120145,046
Average 11.3598.0045,314239947,713
Total 590.36 2,335,324116,1302,451,454
Table 2. Code, scientific name, geographic location, altitude, latitude, and longitude for Ribes L. samples collected in China.
CodeScientific NameGeographic LocationAltitude (Meters)LatitudeLongitude
A1Ribes fasciculatumNanzhao, Henan61333°33′27″111°58′04″
A2Ribes fasciculatum var. chinenseBeijing8840°04′32″116°13′58″
A3Ribes fasciculatum var. chinenseDalian, Liaoning35238°50′21″121°26′58″
B1Ribes heterotrichumFuhai, Xinjiang91647°34′59″88°44′36″
B2Ribes komaroviiLishan, Shanxi235835°24′58″111°59′12″
B3Ribes alpinumBeijing8840°04′32″116°13′58″
B4Ribes giraldii var. polyanthumDalian, Liaoning10539°06′05″122°00′03″
B5Ribes pseudofasciculatumXining, Qinghai233236°56′37″102°27′49″
B6Ribes takare var. desmocarpumZhouqu, Gansu257833°43′50″104°06′12″
B7Ribes kialanumLijiang, Yunnan381227°01′34″100°10′43″
B8Ribes tenueHezheng, Gansu268435°15′14″103°14′27″
B9Ribes tenueXining, Qinghai251835°47′37″102°40′37″
B10Ribes laurifolium var. yunnanenseLeshan, Sichuan309929°34′26″103°21′23″
B11Ribes laurifolium var. yunnanenseLeshan, Sichuan309929°34′26″103°21′23″
B12Ribes hunanenseChengbu, Hunan166926°09′39″110°11′34″
B13Ribes laurifoliumLeshan, Sichuan309929°34′26″103°21′23″
B14Ribes davidiiNanchuan, Chongqing72629°03′19″107°08′04″
B15Ribes davidiiNanchuan, Chongqing72629°03′19″107°08′04″
C1Ribes aciculareBurqin, Xinjiang124048°12′29″87°37′10″
C2Ribes aciculareFuhai, Xinjiang91647°34′59″88°44′36″
C3Ribes burejenseNanzhao, Henan134933°32′04″111°57′28″
C4Ribes stenocarpumXining, Qinghai233236°56′37″102°27′49″
C5Ribes stenocarpumGuyuan, Ningxia292835°21′51″106°19′54″
D1Ribes fragransMoerdaoga, Inner Mongolia125651°22′43″120°49′48″
D2Ribes procumbensDaxing’anling, Heilongjiang100152°20′28″124°42′12″
D3Ribes nigrumHemu, Xinjiang138948°34′27″87°21′32″
D4Ribes procumbensXiniuerhe, Inner Mongolia70751°15′51″120°47′29″
D5Ribes nigrumErgun, Inner Mongolia140451°09′19″120°54′37″
E1Ribes griffithiiLijiang, Yunnan381227°01′34″100°10′43″
F1Ribes palczewskiiHemu, Xinjiang109948°34′13″87°25′43″
F2Ribes tenueMoerdaoga, Inner Mongolia86951°09′19″120°54′37″
F3Ribes palczewskiiXiniuerhe, Inner Mongolia53351°52′41″120°37′56″
F4Ribes palczewskiiErgun, Inner Mongolia140451°09′19″120°54′37″
F5Ribes moupinenseKunming, Yunnan341926°04′46″102°50′05″
F6Ribes setchuenseZhouqu, Gansu270533°39′45″104°09′41″
F7Ribes setchuenseZhouqu, Gansu270533°39′45″104°09′41″
F8Ribes setchuenseHezheng, Gansu268435°15′14″103°14′27″
F9Ribes setchuenseHezheng, Gansu268435°15′14″103°14′27″
F10Ribes mandshuricumNanzhao, Henan137233°21′11″111°57′17″
F11Ribes mandshuricumGuyuan, Ningxia292835°21′51″106°19′54″
F12Ribes longiracemosumBaoji, Shaanxi56834°21′22″107°18′21″
F13Ribes himalenseHezheng, Gansu268435°15′14″103°14′27″
F14Ribes himalenseXining, Qinghai233236°56′37″102°27′49″
F15Ribes himalenseXining, Qinghai222935°48′10″102°40′53″
F16Ribes himalenseYinchuan, Ningxia355638°37′54″106°03′35″
F17Ribes atropurpureumBurqin, Xinjiang124548°37′05″87°30′03″
F18Ribes atropurpureumBurqin, Xinjiang124548°37′05″87°30′03″
F19Ribes atropurpureumFuhai, Xinjiang148947°52′05″88°56′56″
F20Ribes altissimumHemu, Xinjiang144648°33′07″87°28′24″
F21Ribes altissimumHemu, Xinjiang144648°33′07″87°28′24″
F22Ribes altissimumHemu, Xinjiang109948°34′13″87°25′43″
F23Ribes altissimumHemu, Xinjiang109948°34′13″87°25′43″
Disclaimer/Publisher’s Note: The statements, opinions and data contained in all publications are solely those of the individual author(s) and contributor(s) and not of MDPI and/or the editor(s). MDPI and/or the editor(s) disclaim responsibility for any injury to people or property resulting from any ideas, methods, instructions or products referred to in the content.

